the Creative Commons Attribution 4.0 License.
the Creative Commons Attribution 4.0 License.
 | 11 Mar 2025
Modelling urban stormwater drainage overflows for assessing flood hazards: application to the urban area of Dakar (Senegal)
Laurent Pascal Malang Diémé
Christophe Bouvier
Ansoumana Bodian
Alpha Sidibé
With the recurrence of flooding in African cities, there is growing interest in developing sufficiently informative tools to help characterize and predict overflow risks. One of the challenges is to develop methods that strike a compromise between the accuracy of simulations, the availability of basic data, and the shortening of calculation times to be compatible with real-time applications. The present study, carried out on the urban outskirts of Dakar, aims to propose a method capable of modelling flows at fine resolution (25 m2) over the entire area and provide a rapid diagnosis of how the drainage network is operating for rainfall intensities of different return periods, while taking urban conditions into account. Three methodological steps are combined to achieve this objective: (i) determination of drainage directions, including modifications induced by buildings, artificial drainage, and storage basins; (ii) application of a hydrological model to calculate flows at the outlets of elementary catchment; and (iii) implementation of a hydraulic model to propagate these flows through the drainage network and implementation of a storage model for retention basins. The modelling chain was built within the ATHYS platform. The network overflow points are detected if the difference between the calculated flows exceeds the network capacity to evacuate them. Examples are given by carrying out simulations using 10- and 100-year design rainfall. The model also provides boundary conditions to apply more complex hydraulic models to determine the local impact of drainage network overflows on limited areas. However, the capacity of the method still needs to be validated in further research by comparing it with accurate data from observed flood events.
- Article
(10846 KB) - Full-text XML
- BibTeX
- EndNote


African cities are frequently subject to flooding (Yengoh et al., 2017; Tazen et al., 2018; Sy et al., 2020; Barau and Wada, 2021), which results in significant socioeconomic, health, and environmental damage (Miller et al., 2022a; Sakijege and Dakyaga, 2023). The current trend toward more intense rainfall (Taylor et al., 2017; Bichet and Diedhiou, 2018; Nkrumah et al., 2019; Klutse et al., 2021), attributed to climate change (Panthou et al., 2018; Chagnaud et al., 2022) and the very rapid dynamics of urbanization (Sène, 2018; Williams et al., 2019; Yuan et al., 2023), is expected to increase the occurrence of urban flooding (Gaisie and Cobbinah, 2023). This is a major source of concern for political decision-makers and city dwellers (Moulds et al., 2021) in these African conurbations, where the gap between adaptation needs and existing tools is wide (Nkwunonwo et al., 2020; Miller et al., 2022b).
In response to growing adaptation needs (Kreibich et al., 2017; Mashi et al., 2020), interest is being shown in flood characterization (Coulibaly et al., 2020) and forecasting (Chen et al., 2015). The scientific literature has reported on several methods implemented in urban environments to provide flood assessment and mapping (Henonin et al., 2013; Agonafir et al., 2023). The simplest methods, without introducing simulations of runoff formation, rely on the topographical characteristics of the territory to give a first local estimate of flood risk by the accumulation of water at low points (Pons et al., 2010; Dehotin et al., 2015; Zheng et al., 2018). The 1D hydrological and hydraulic modelling approach, well established in the literature (Zhu et al., 2016; Rabori and Ghazavi, 2018; Sidek et al., 2021; Chahinian et al., 2023), has also been applied to simulate stormwater drainage network performance (Meng et al., 2019; Pla et al., 2019). Modelling platforms such as SWMM (Rabori and Ghazavi, 2018) or InfoWorks ICM are 1D simulation tools applied to urban environments (Rubinato et al., 2013; Sidek et al., 2021). However, this type of modelling, which is essentially one-dimensional, does not provide spatial propagation of overflow water (Mark et al., 2004). This aspect is taken into account by 2D models such as Mike Urban (DHI, 2021). The accuracy of the simulations they can provide on the spatial propagation of surface flows is limited by both their numerical complexity and the required data (fine topographic mesh and physical and urban characteristics) for their parameterization (Costabile et al., 2020; Zanchetta and Coulibaly, 2020). These 2D or coupled 1D–2D models (Martínez et al., 2018; Bulti and Abebe, 2020; Li et al., 2022) require substantial computing resources and long calculation times and are difficult to apply over large areas or for real-time flood forecasting studies (Rosenzweig et al., 2021). Today, the emergence of increasingly popular AI (artificial intelligence)/ML (machine learning) techniques (Mosavi et al., 2018; Darabi et al., 2019) offers the possibility of providing flood mapping through model training (Mosavi et al., 2018; Darabi et al., 2019; Parvin et al., 2022; Taromideh et al., 2022). Their application can be challenging, as they generally require a large amount of data (meteorological, hydrological, topographical) to be integrated for training, to improve accuracy, and to achieve good model performance (Bentivoglio et al., 2022).
In urban environments, one of the main factors influencing the choice of an appropriate modelling approach is data availability (Henonin et al., 2013). In the African context, where detailed data is scarce, the challenge is to implement alternative solutions by finding a compromise between the availability of basic data, the reduction in calculation times, and the accuracy of flood simulations (Chahinian et al., 2023). This study aims to propose fine-resolution (25 m2) modelling of flows and overflows from drainage and storage networks over a large area (∼ 400 km2) in the Dakar urban periphery, with short calculation times (5 min) compatible with real-time applications. The proposed methodological approach follows three main stages: (i) reconstruction of urban drainage directions, taking into account the modifications caused by the various urban developments (buildings, artificial channels, and retention basins), using algorithms developed for this purpose; (ii) calculation of flows from small elementary catchments, using a parsimonious hydrological model (SCS-LR; the Soil Conservation Service model coupled to the lag and route model) adapted to the local context, which in particular integrates the density of urbanization; and (iii) a 1D hydraulic model to propagate these flows through the drainage network and a storage model for retention basins. The overflow points are identified by the difference between the maximum flows produced and the network capacity to evacuate them. This work is structured in four parts. First, the study area and the datasets used are described, and then the detailed structure of the method is presented, followed by the model parameterization strategy. Finally, two examples of a simulation using a 10- and 100-year design storm are given and discussed, highlighting possible improvements, before concluding.
2.1 Study area
The study area is located in the peri-urban zone of Dakar (Fig. 1a), the capital of Senegal. This part of the city is characterized by a relatively flat relief (Fig. 1b), consisting of a series of small coastal dunes interspersed with wet depressions – called Niayes – that dried up during the drought of the 1970s in the Sahelian zone (Nicholson et al., 2000). In the study area, the natural drainage network is temporary and has largely fossilized (Bassel, 1996). A major part of the soil is sandy in the dunes. Hydromorphic soils dominate the area around the depressions (Fig. 1c), given the proximity of the water table in some places (Cissé Faye et al., 2004).
Dakar experiences extreme variations in monthly rainfall throughout the year. The rainy season lasts for 4 months, from June to September. August and September receive the highest amounts of rain. Over the period from 1988 to 2018, annual rainfall varied between 161 and 660 mm, with an average of 402 mm, which is characteristic of a tropical semiarid zone. The urbanization of this peri-urban area took place rapidly over just a few decades. It was largely fuelled by the rural exodus (Lericollais and Roquet, 1999) following the drought of the 1970s (Nicholson et al., 2000). This resulted in rapid population growth and dense occupation of the space, helped by the establishment of a network of roads to facilitate urban mobility (Ndiaye, 2015). Moreover, settlement is sometimes achieved through (i) the infilling of formerly drained wetland depressions (Sène et al., 2018) or (ii) self-occupation practices, without considering the topography of the land, the hydrology, or the installation of rainwater drainage structures (Ndiaye, 2015).
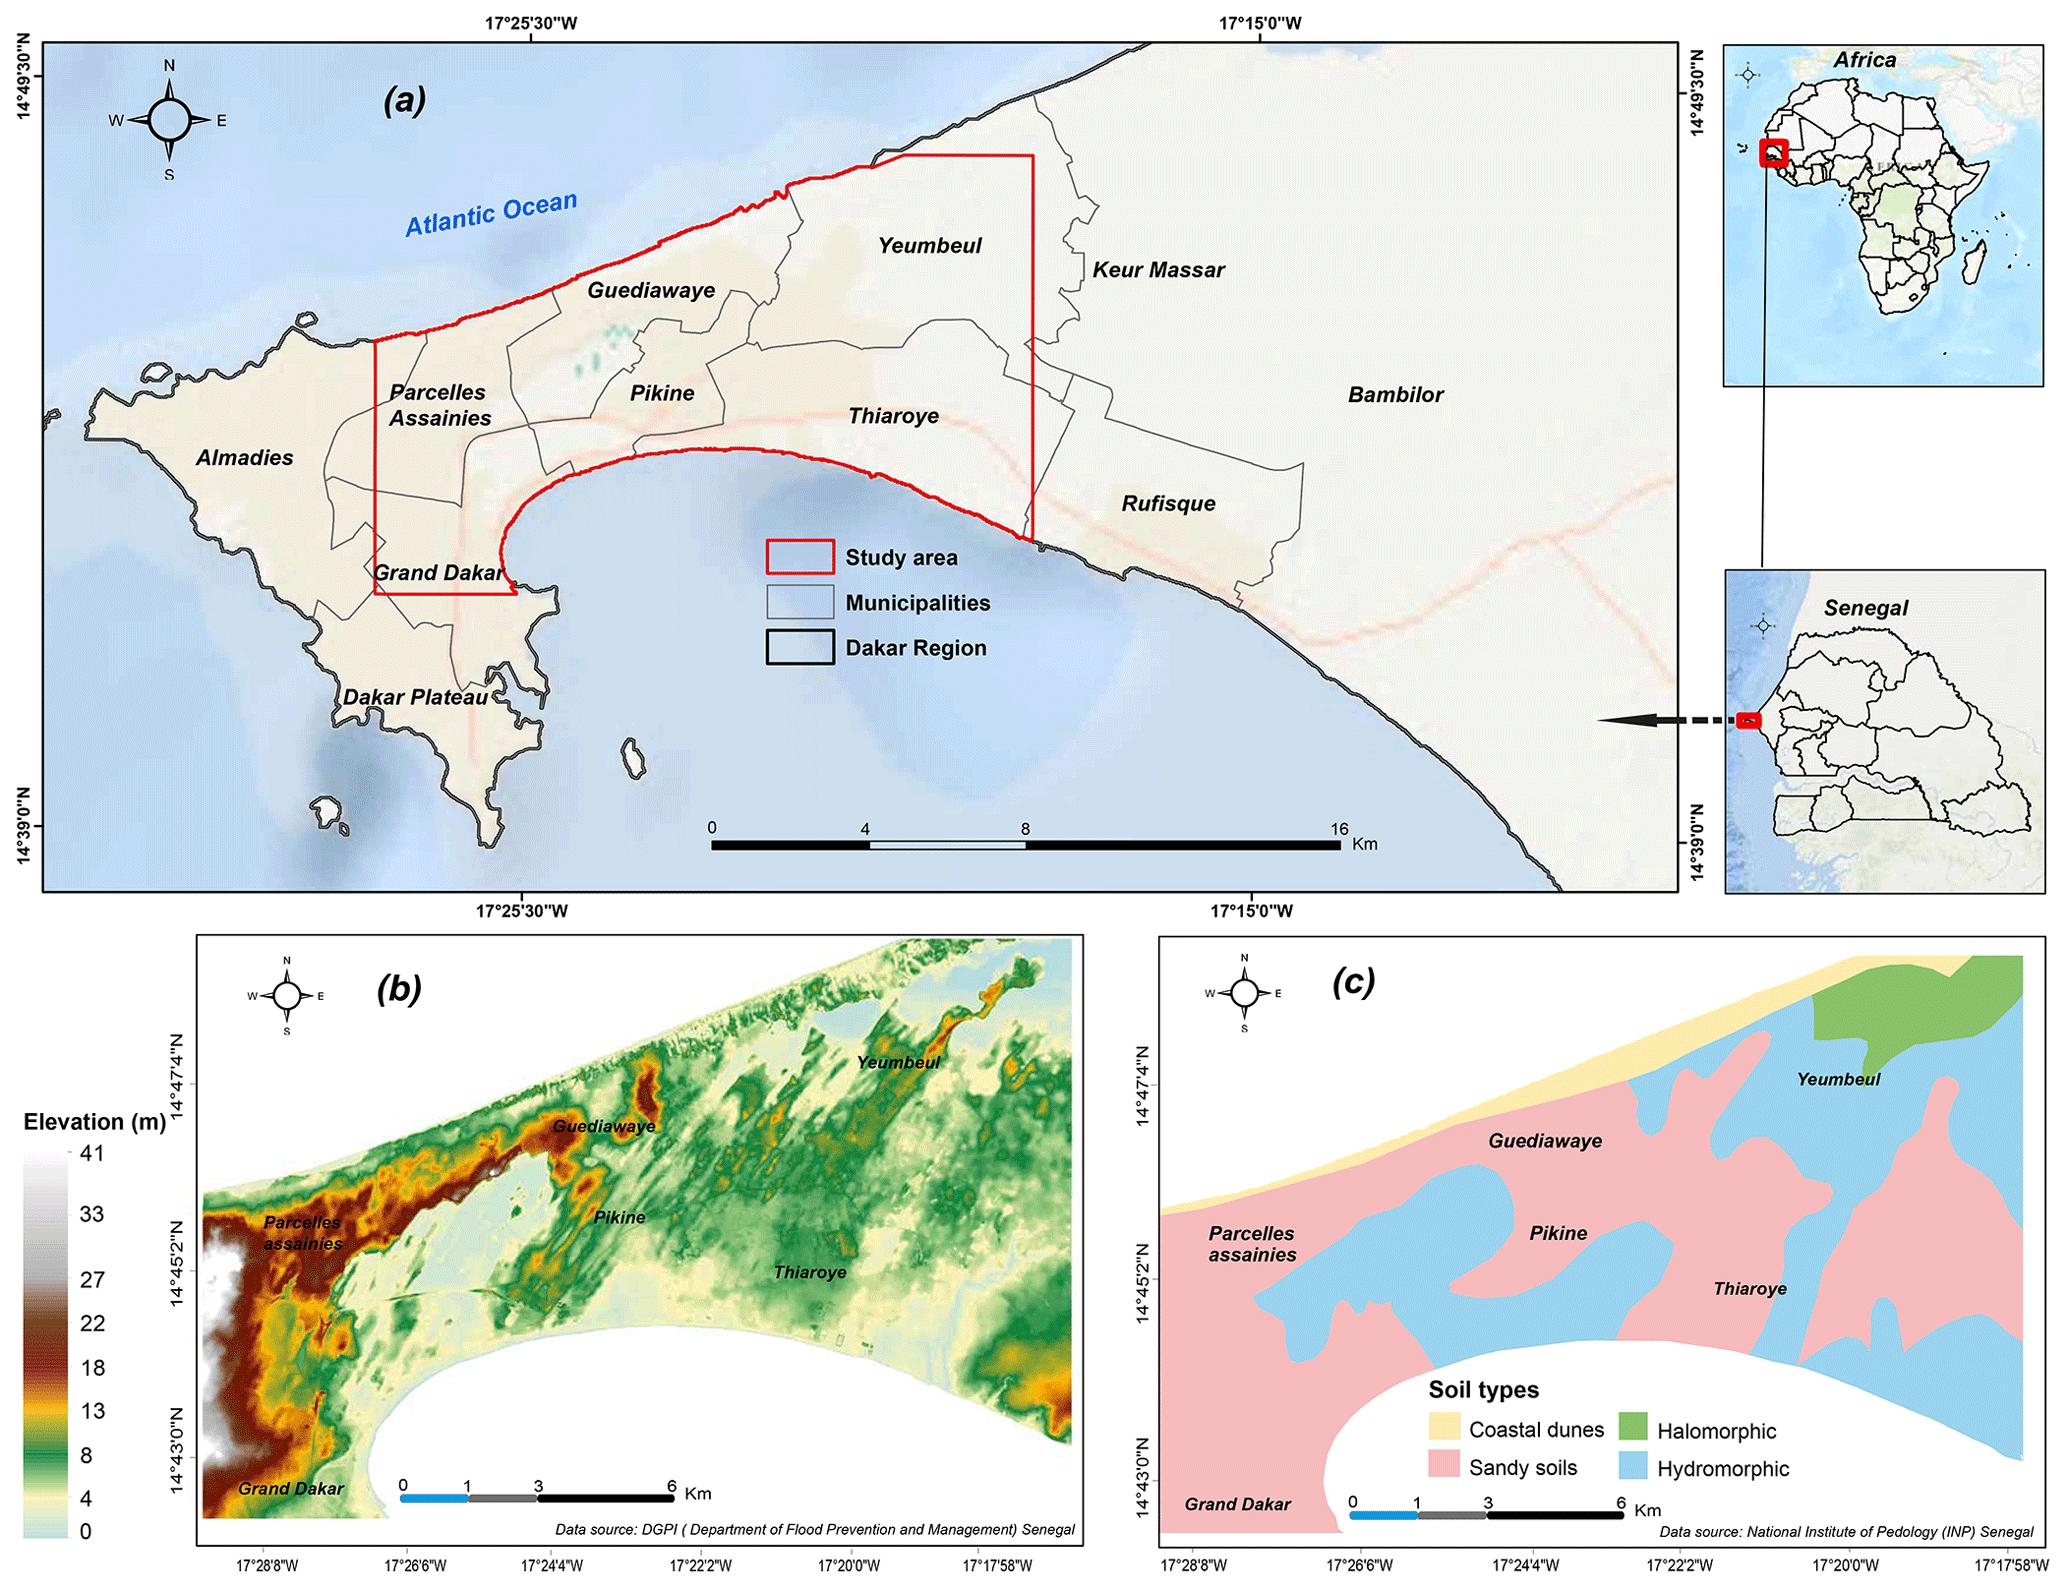
Figure 1(a) Location of the study area. (b) Digital terrain model (DTM). (c) Soil type distribution.
From the 2000s onwards, rainfall returned (Sene and Ozer, 2002; Bodian, 2014; Nouaceur, 2020) after a period of drought, causing a series of floods in Dakar (Bottazzi et al., 2018; Hungerford et al., 2019). The most significant episodes have generally been noted during the critical rainy periods in August and September: August 2005, September 2009, August 2012, August 2015, September 2020, August 2021, and recently August 2022. On 26 August 2012, for example, 161 mm of rain fell in less than 2 h, including 144 mm in 51 min (Descroix et al., 2013), which had a serious impact on the population, resulting in 26 deaths (Sané et al., 2016) and causing epidemics of cholera and malaria (Sambe-Ba et al., 2013). One of the government's responses was to set up a vast programme, including the Stormwater Management and Climate Change Adaptation Project (PROGEP), which since 2012 has aimed to build drainage networks linked to storage basins to minimize the risks (Diop, 2019).
One of the current challenges for urban management, in the context of increasing intense rainfall, dense urbanization, and infrastructure development, is to develop effective and robust tools to support flood assessment and decision-making.
2.2 Datasets
2.2.1 Geographic datasets
The geographical datasets required to reconstruct the modified urban drainage directions (Diémé et al., 2022) are compiled in an urban database for Dakar by the Senegal Flood Prevention and Management Department (DPGI) and the Geography and Cartography Department (DTGC). These include the DTM (digital terrain model) and the locations of buildings, rainwater channels, and retention basins. The 10 m resolution DTM, which we resampled to 5 m, is specifically produced for the city of Dakar by the National Institute for Geographic and Forestry Information (IGN) of France, using the photogrammetric restitution technique. The building layer was created by manually digitizing high-resolution (50 cm) satellite images. The location and characteristics of the channels (width, depth) and retention basins (storage volume, leakage rate) are provided in the various technical reports supplied by the PROGEP project. The majority of the channels are surface drains and are rectangular. All the known characteristics of the channels and the dimensions of the retention basins have been referenced for use in calibrating the hydraulic models.
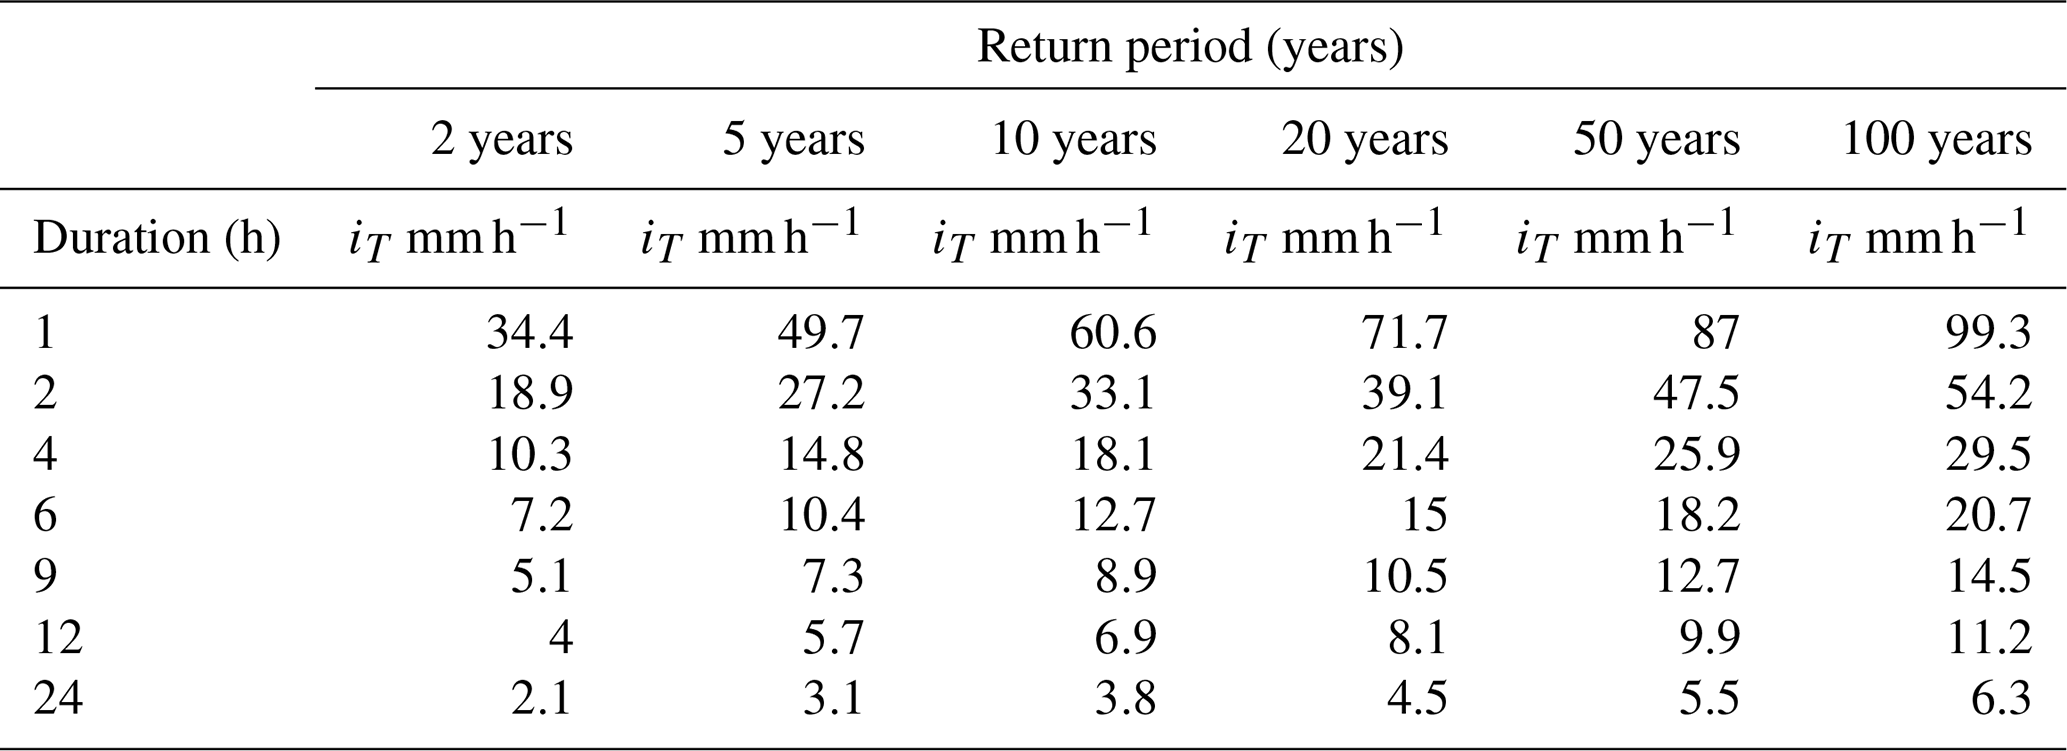
2.2.2 Intensity–duration–frequency (IDF) curves
The available IDF curves used in this study were derived from the generalized extreme value (GEV) law parameters calculated by Sane et al. (2018) for each region of Senegal using long-term historical rainfall data from 23 tipping bucket rain gauges (Bodian et al., 2016). These historical data range from 1955 to 2005. To obtain a reliable estimate of the GEV distribution parameters μ, σ, and ε for each rainfall station, all the rainfalls of different durations d were merged, assuming that the rainfalls of any duration d are identically distributed, with a scaling factor η. This approach made it possible to estimate the GEV parameters (Eqs. 1, 2, and 3) of the distribution of the rainfalls of any duration d using
with μ=28.9 mm, σ=12.5 mm, ε=0.08, and η set to .
Application of Eq. (4) allows the determination of a value x when its return period T is known.
For different return periods (years), the rainfalls of duration d between 1 and 24 h were then given in Table 1.
Table 1Summary of Dakar IDF curves calculated from the GEV parameters defined by Sane et al. (2018).
The detailed methodological approach is structured in seven successive steps (Fig. 2). The first step is (i) the construction of the natural drainage topology modified by urban objects, (ii) on which the division of the urban area into small elementary catchment areas and the extraction of the associated hydrographic network are based. Then (iii) a rainfall–runoff model is applied to calculate the hydrographs at the outlets of the elementary catchment. These hydrographs are (iv) propagated in the stormwater drainage network by a 1D hydraulic model, and (v) their storage in the retention basins is managed by a linear reservoir model. Finally, (vi) design storms are derived from local IDF curves and are used as input data to the model, which is then (vii) implemented to detect, over the entire study area, the overflow points of the drainage and storage network according to different levels of severity and urban density.
The modelling chain was built in the ATHYS platform, developed by Hydrosciences Montpellier. ATHYS enables a range of hydrological and hydraulic GIS-based models (MERCEDES unit), as well as geographical (VICAIR unit) and hydrometeorological (VISHYR unit) data processors. ATHYS is free software, available from https://www.athys-soft.org (last access: 13 October 2023). The entire processing chain and the associated data are presented in detail in the following sections.
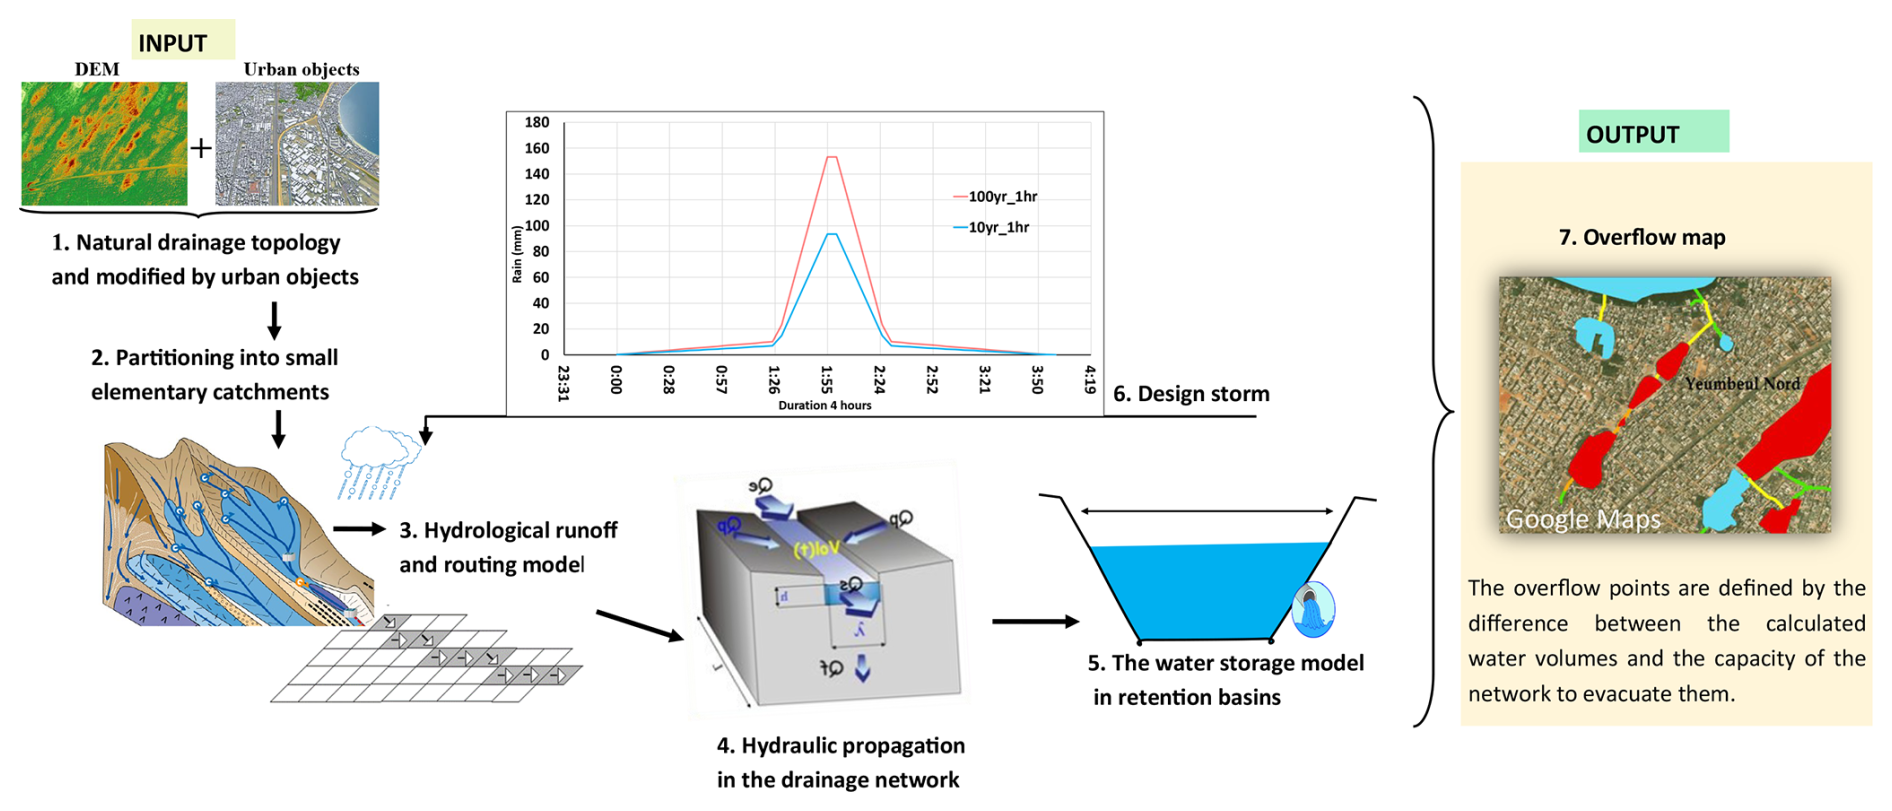
Figure 2Flow chart of the methodology. Background maps © Google Maps 2023.
3.1 Construction of the drainage topology
The construction of the drainage topology, which aims to reconstruct the modified drainage directions of runoff water, is a prerequisite for the implementation of the overflow point detection model. The natural path flows can be easily derived from the 5 m DTM, but in urban areas, the natural flows must be modified by artificial objects such as buildings, channels, and retention basins. This topology construction methodology was previously applied to the study area (Diémé et al., 2022) and can be summarized in three steps.
- a.
We modified the elevation of the urban blocks (e.g. 25 m) and extracted the flow paths from the modified 5 m DTM (Jenson and Domingue, 1988).
- b.
We modified the flow paths according to the artificial channel network. The VICAIR algorithm uses a raster map of the channels, detects all the nodes of the channel network, and modifies the flow paths of each channel from the upstream node to the downstream node. The upstream and downstream nodes are recognized by their elevations in the DTM.
- c.
We modified the flow paths in the retention basins. The VICAIR algorithm uses a raster map of the basins and assigns the outlet of the basin to the channel that drains out the basin and modifies all the flow paths of the basin towards the outlet.
3.2 Partitioning the study area into elementary catchments and networks
The modified drainage model was first used to reconstitute elementary catchments and channel networks. Building elementary catchments and channel networks is necessary to save time on computation as well as connect both hydrological and hydraulic models. The elementary catchments were defined as catchments with the same urbanized area. A threshold of 10 ha was adopted for this urbanized area. Thus, catchments can be small (10 ha if totally urbanized) or larger (if the catchment is mostly natural). This allows a reduction in the number of elementary catchments in the natural areas without a loss of accuracy regarding the channel network behaviour in the urban areas.
The criteria for delineating these catchments are taken from Jenson and Domingue (1988). They consist of marking the mesh as the outlet of a basin if
-
its urbanized drained area is greater than N (here 10 ha) and
-
the difference in urbanized drained area between this mesh and the downstream mesh is greater than N.
Thus, 890 small urban catchments were delineated (Fig. 3a). The hydrographic network linking these small catchments was defined as all the meshes draining an area equal to at least 1 ha (Fig. 3b). For this network, we differentiated between meshes with known geometric characteristics (widths and depths of the main channels, i.e. 297 sections) and those with unknown characteristics (natural sections or sections with unknown dimensions). The retention basins can be inserted into the channel network. Each retention basin is reduced to a single mesh, representing its outlet. To this mesh is assigned a height–volume–drainage law to describe the operation of the reservoir (see Sect. 4.3).
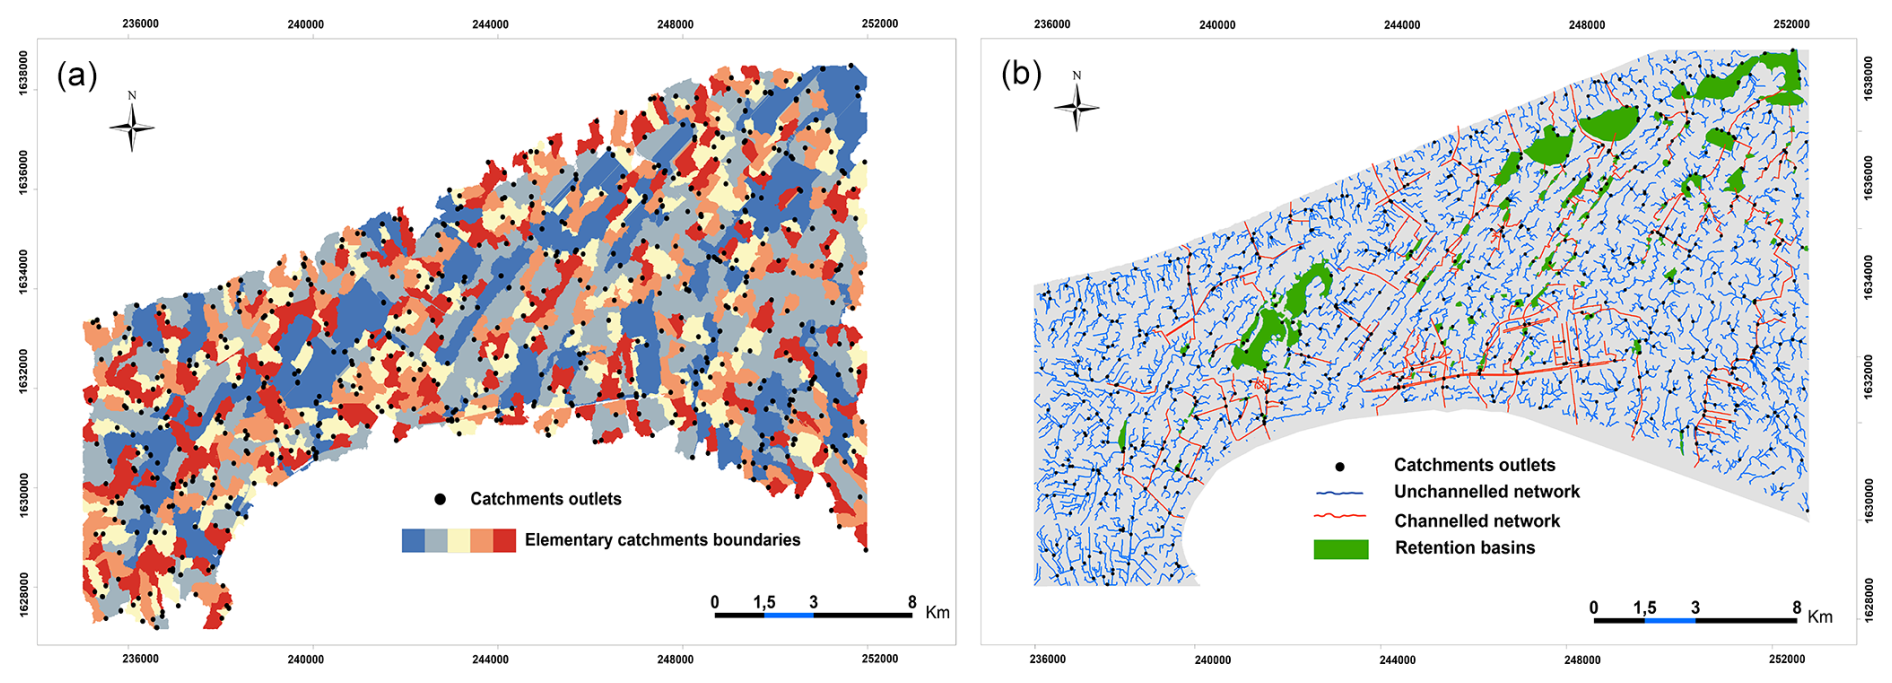
Figure 3(a) Partitioning of the area into small urban catchments. (b) Definition of runoff transfer and storage classes.
3.3 Application of hydrological runoff and routing model
3.3.1 The SCS (Soil Conservation Service) runoff model
The SCS hydrological model (Ponce and Hawkins, 1996), which is often applied to small urban catchments (Bouvier et al., 2018; Meng et al., 2019), was used to estimate the runoff from each mesh (Maref and Seddini, 2018; Bouadila et al., 2023). This model enables an increase in the runoff coefficient as a function of the cumulated rainfall, with the main parameter determined as a function of soil type and land use, land use density, and initial moisture conditions (Steenhuis et al., 1995; Huang et al., 2007).
The model parameters are Ia and S (or their curve number (CN) equivalents). The parameter Ia represents the initial losses before the onset of runoff (mm), and S is the maximum water retention capacity of the soil at the start of the event (mm). The model is generally applied assuming that and is expressed by Eq. (5):
where P is the total rainfall during the event (mm), and Q is the runoff during the event (mm).
The dynamic formulation of this model (i.e. the temporal evolution of the flow during the event) is given by Eq. (6), derived from Eq. (5) with respect to time:
where Pe(t) represents the runoff produced at time t (mm h−1), Pb(t) is the intensity of the rain at time t (mm h−1), and P(t) is the cumulative rainfall at time t since the start of the storm (mm). S is the only model adjustment parameter. The model is applied to each mesh in the area with a time step of 5 min. S is likely to vary spatially depending on the urban conditions.
3.3.2 The routing model
From each mesh, the runoff provided by the SCS model is transferred to the outlet of an elementary catchment by the lag and route (LR) model (Fig. 4). Each cell provides a hydrograph at the outlet of the elementary catchment, and the complete hydrograph at the outlet of the elementary catchment is obtained by summing the cell hydrographs (Tramblay et al., 2011).

The cell hydrograph depends on two variables.
-
The transfer time Tm (Eq. 7) from the mesh to the basin outlet is equal to
where Lm is the distance from the mesh to the outlet, and Vo is the average velocity of the flow between the mesh and the outlet.
-
The time Km (Eq. 8) associated with the diffusion of the flood wave during the transfer time Tm is equal to
where Ko is the proportionality coefficient between diffusion (lag) and translation (route).
Vo and Ko are the two parameters of the LR model.
The equation of the elementary hydrograph (Eq. 9) produced by the effective rainfall Pe(to) obtained from each mesh at each time is given by
where A is the mesh size (here 25 m2). The LR model has the advantage of being numerically stable with respect to both the cell size and the computation time step, allowing fast calculation times, as used here, with a cell size of 25 m2 and a time step of 5 min.
3.4 The propagation model in the drainage network
The hydraulic propagation of flow in the un-channelled network and the channelled network (297 collectors) is computed by the 1D kinematic wave (KW) model (Constantindes, 1981). The KW model combines a conservation equation (Eq. 10),
where Q is the flow rate (m3 s−1), A is the area of the wetted cross-section (in m2), x is the horizontal distance (m), and t is the time (s), with a dynamic equation, in this case the Manning–Strickler formula (Eq. 11):
where V(t) represents the flow velocity (m s−1); Kr the Manning–Strickler roughness coefficient (m s1); Rh (m) the hydraulic radius calculated from the channel's geometric characteristics (width λ and depth Pc); and Sf (m m−1) the friction slope,
where S0 is the channel/ground slope (m m−1).
To apply Eq. (11) to water flow in channels or to surface runoff, it is assumed that the friction slope is equal to the bed slope (Eq. 12). The numerical stability of the KW model needs to respect Courant's condition, which leads to computation with very short times (some seconds) when using elements of small size, typically 25 m2. It thus requires longer computation times to calculate the mesh-to-mesh flows in the channelled and un-channelled networks. The time saving is obtained by limiting the calculations to the network meshes, which means a small number of meshes.
As the channels are mostly rectangular in shape, the parameters of the KW model for each channelled or un-channelled cell of the drainage network are Kr, the Manning–Strickler coefficient; λ, the width of the rectangular cross-section; and Pc, the depth of the rectangular cross-section. The slopes of the cells can be derived from the DTM; see Sect. 4.2.1.
3.5 The water storage model in retention basins
Modelling the water storage in the retention basins is based on the principle that the retention basin is reduced to only one cell, which contains the basin outlet. This cell must have specific characteristics that must emulate the behaviour of the basin (Table 2). These characteristics are the storage (in millions of cubic metres) in the basin and the outflow rate (in cubic metres per second) at different tabulated water levels (in m), where the first line is associated with the minimal storage in the basin and the last line is associated with the maximal storage in the basin. When the maximal storage is reached, the inflow rate is added to the outflow rate. We suppose that the volumes and outflows vary linearly between the two consecutive tabulated lines.
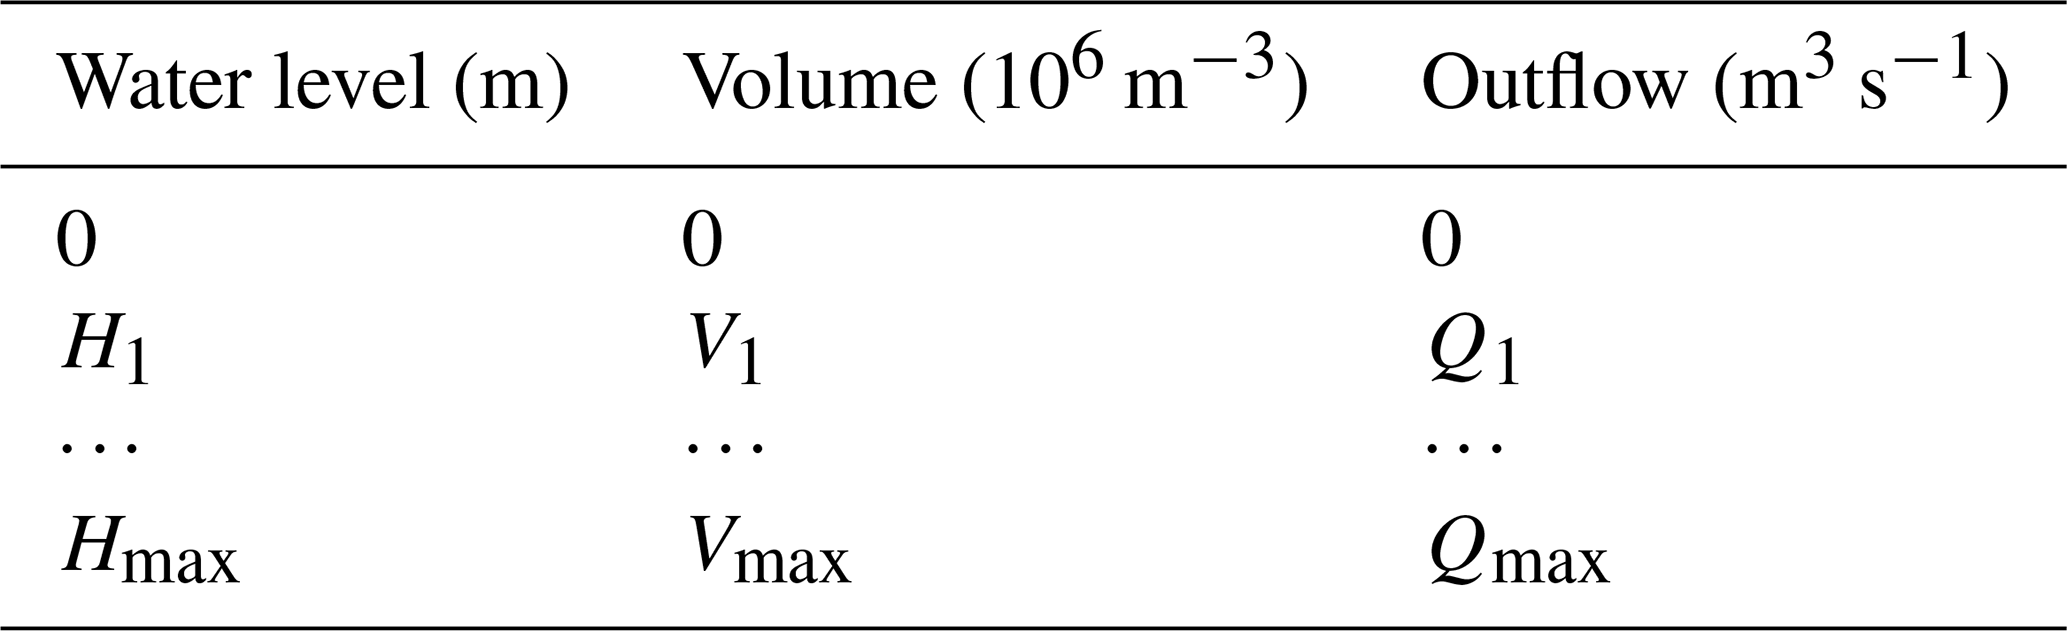
A specific case with only two lines (one for the minimal storage and one for the maximal storage) emulates a linear reservoir model for all the water levels in the basin; see Sect. 4.3.
Implementing the model for the whole study area requires calibration of the following parameters: (i) S for the SCS model; (ii) Vo and Ko for the LR model; (iii) Kr, λ, and Pc for the 1D kinematic wave model; and (iv) the storage capacity and discharge rate at the outlet of each reservoir for the storage model.
4.1 Calibration of the rainfall–runoff model
4.1.1 Calibration of the SCS runoff model
To calibrate the hydrological model, we first estimated the infiltration rates of the very sandy soils often found in Dakar using inverse modelling of soil moisture measurements in relation to rainfall (Le Bourgeois et al., 2016). Tests carried out using Hydrus 1D software (Šimůnek et al., 2016) showed that these soils were highly permeable and capable of being fully infiltrated by rainfall (Diémé, 2023).
We then used the hydrological data available for the city of Dakar (Fig. 5b) that was measured in the Fann–Mermoz experimental catchment by Bassel et al. (1994) and Bassel and Pépin (1995). Observed rainfall and runoff data make it possible to evaluate the runoff coefficients for different rainfall events (Fig. 5b) in this experimental catchment, where the built-up coefficient was approximately 20 % (Fig. 5a).
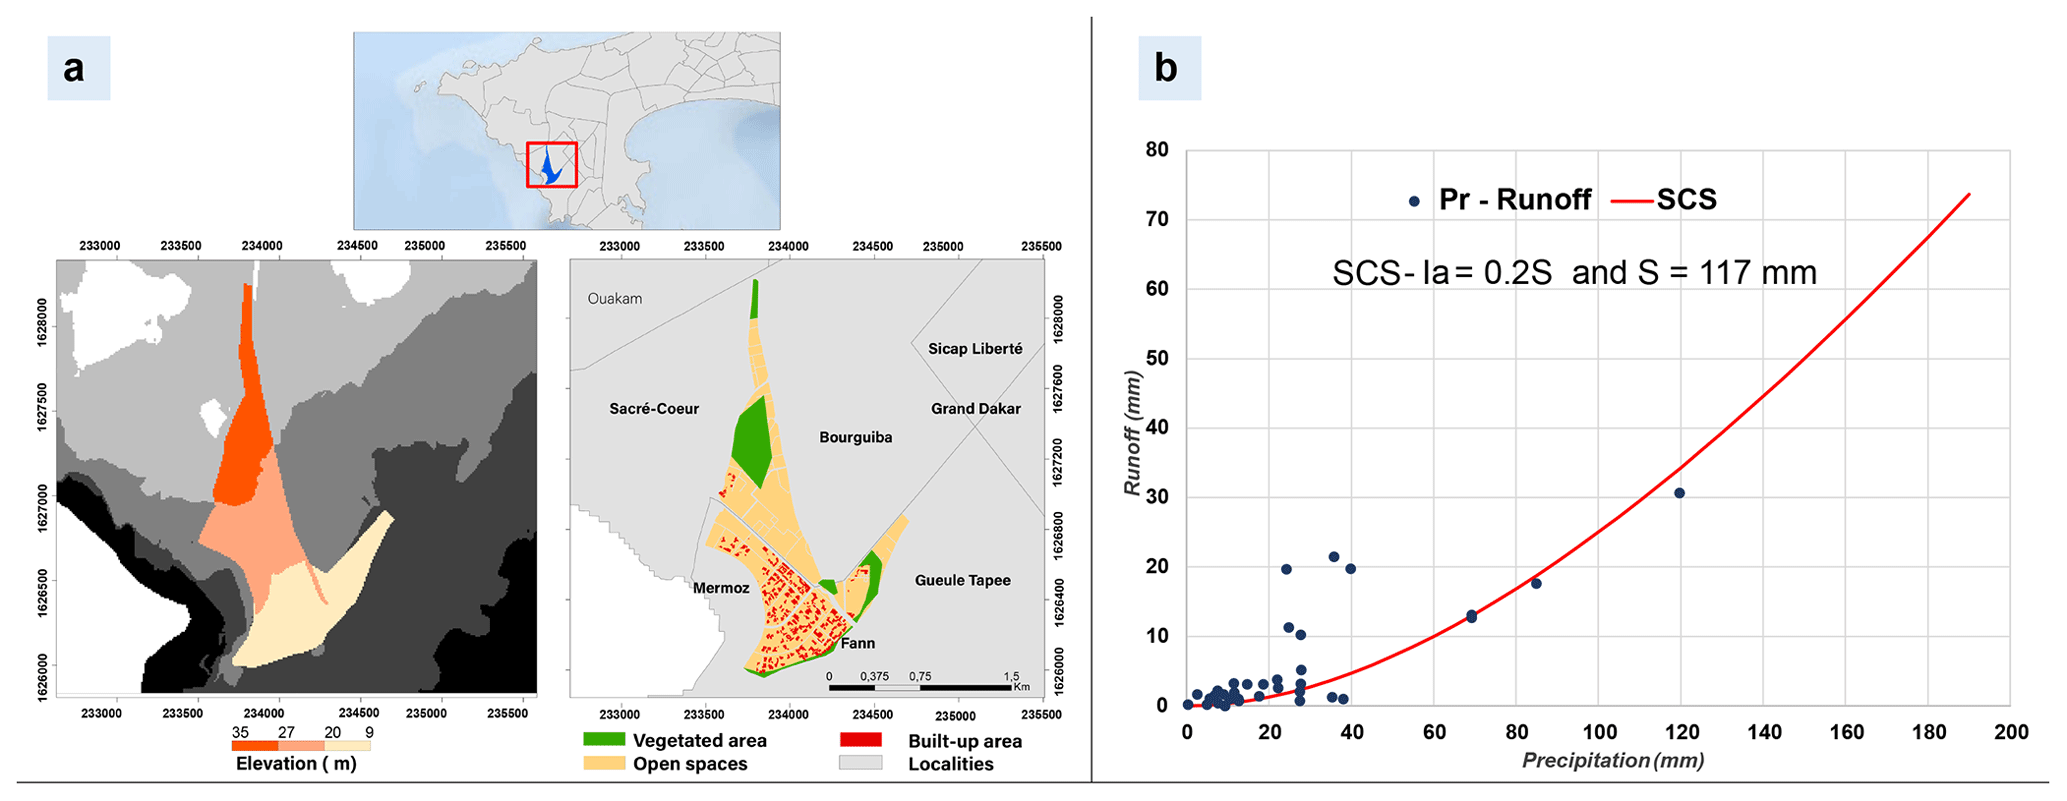
Figure 5(a) Characteristics of the Fann–Mermoz experimental basin. (b) The relationship between rainfall and runoff (data taken from Bassel, 1996).
The estimated runoff coefficients are on the order of 10 % for a rainfall of 40 mm, 20 % for a rainfall of 78 mm, and 30 % for a rainfall of 150 mm. In other words, the built-up coefficient of the catchment is close to the runoff coefficient associated with a rainfall of 78 mm, i.e. a rainfall with a 10-year return period in Dakar (Sane et al., 2018). This is consistent with the filtering nature of the soil as we have characterized it, which indicates that unpaved soils produce negligible runoff for most rainfall events. To obtain a runoff coefficient of 20 % with a rainfall of 78 mm, the value of the S parameter of the SCS model must be set to 117 mm.
Finally, we generalized the assumption that the building coefficient is equal to the runoff coefficient associated with a 10-year rainfall for the entire Dakar site. The built-up coefficients were calculated for each urban block as the ratio of the surface area of the buildings to the surface area of the block (Fig. 6). All the meshes within the same urban block were then assigned the value calculated for the block.
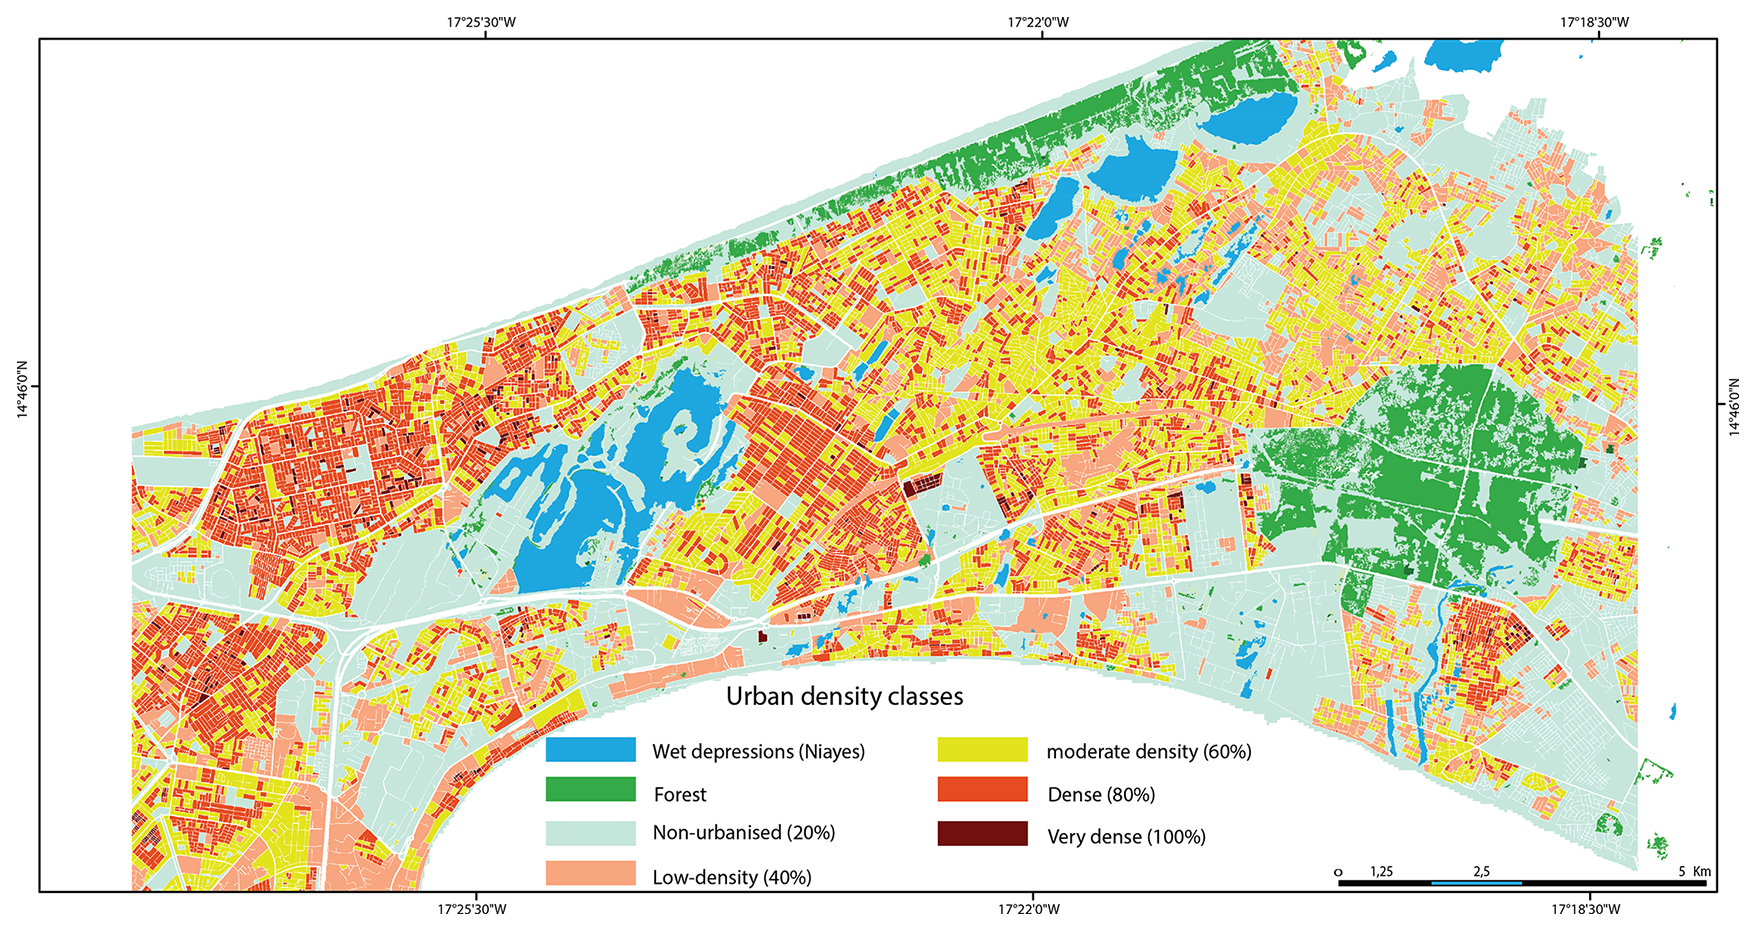
Figure 6Determination of urban density classes by urban block.
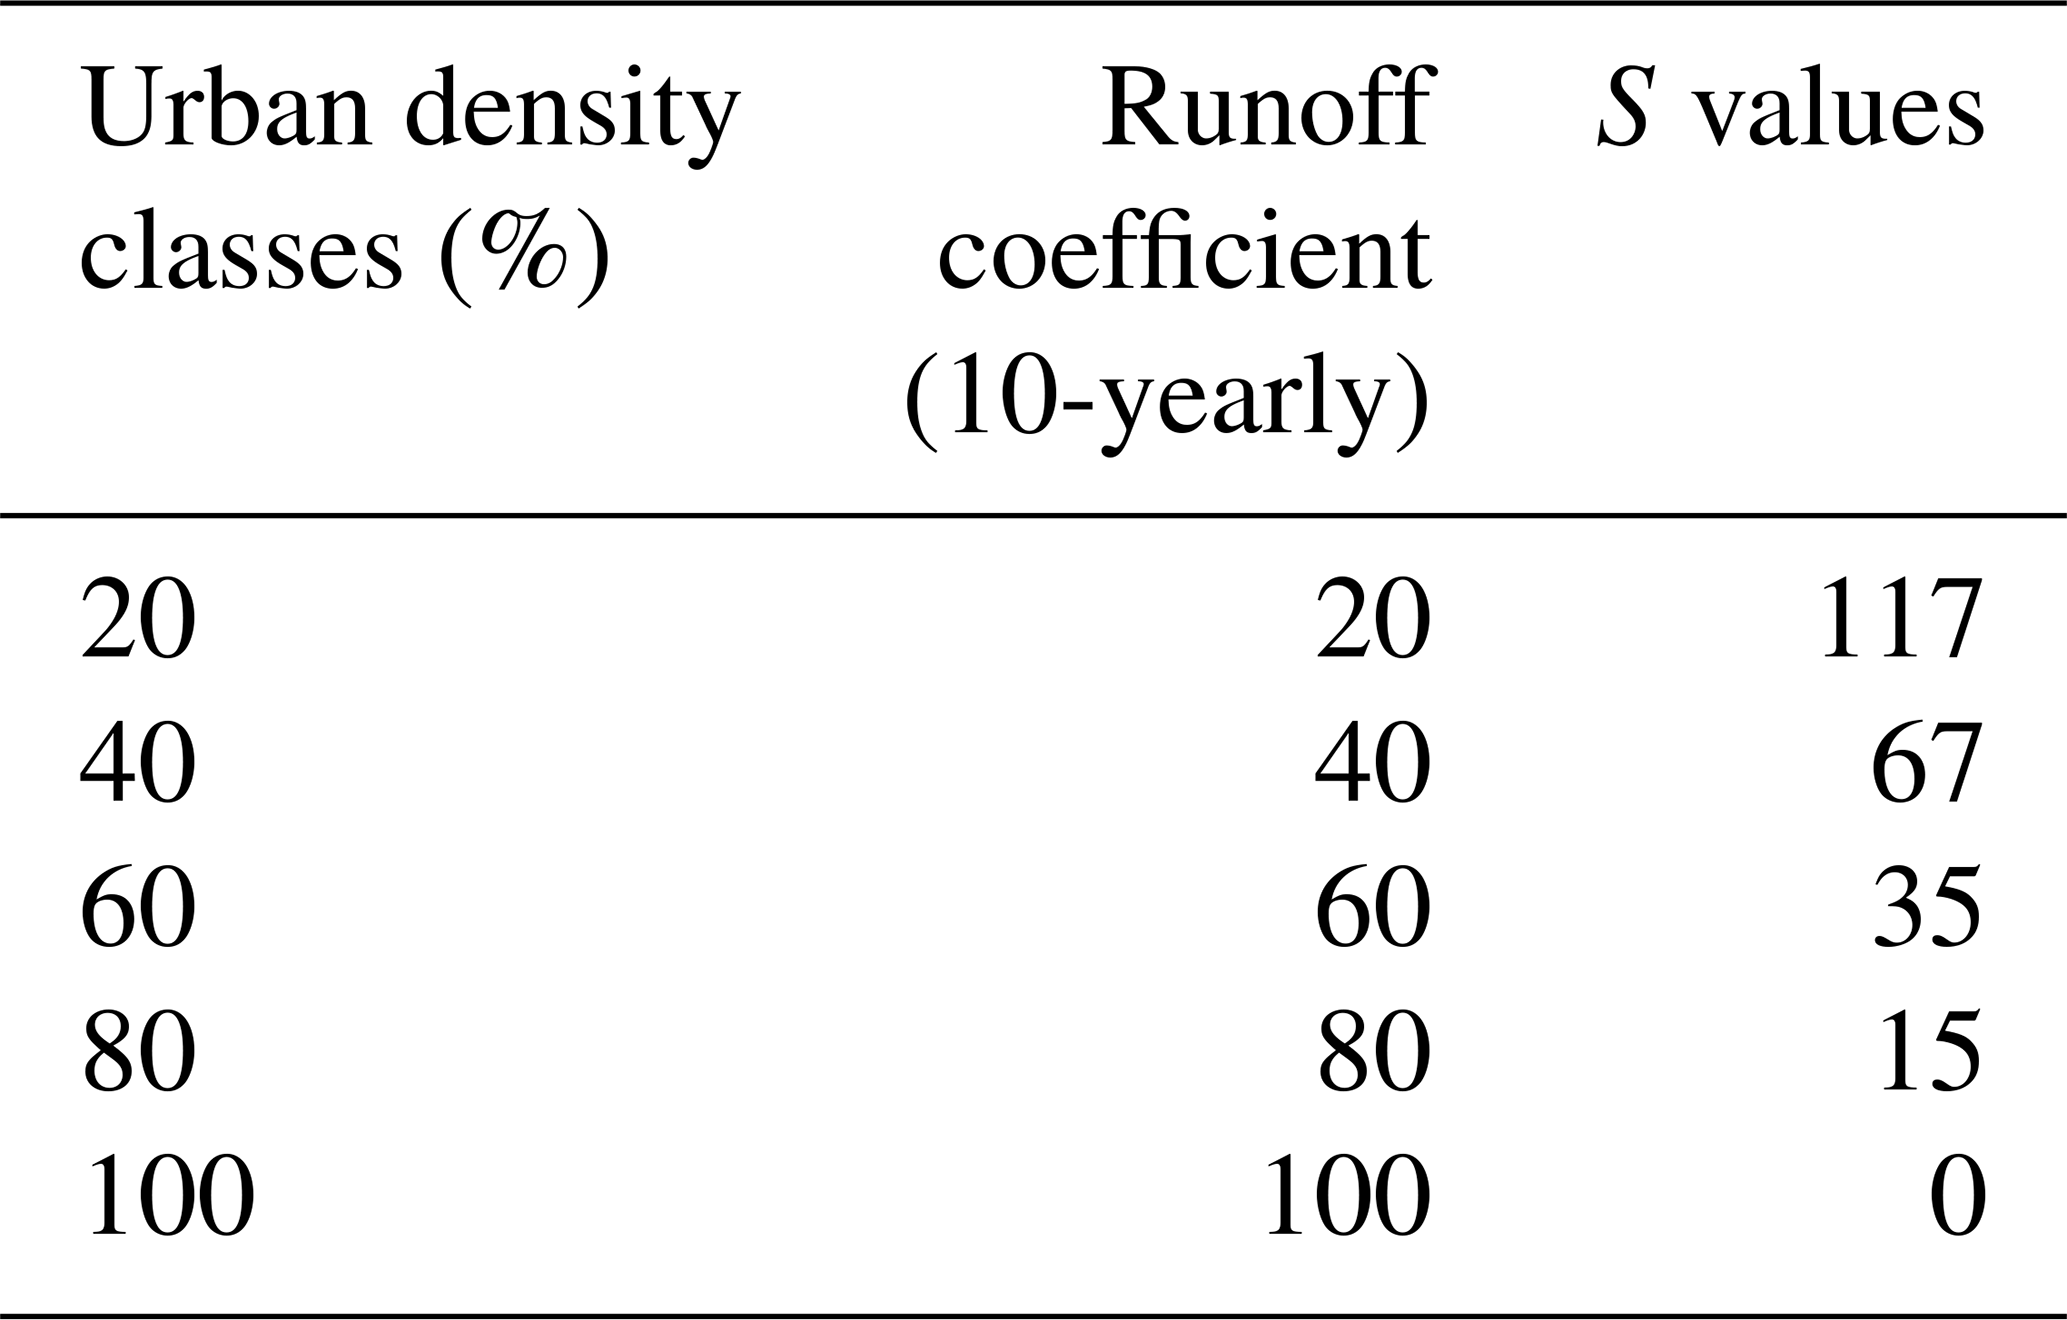
Finally, we calculated the values of S for different classes of building coefficient, following Eq. (13):
where P is the height of the 10-year rainfall in 4 h, i.e. 78 mm. The values obtained after adjusting the S parameter are shown in Table 3.
Table 3Summary of the values obtained for the S parameter from the SCS model.
4.1.2 Calibration of the routing model
The Ko parameter was set to 0.7, the empirical value usually used (Bouvier et al., 2017). The Vo parameter was determined using historical data from the Fann–Mermoz experimental catchment (Bassel, 1996).
Based on the observational data from this study, the lag-time Tr (between the centre of gravity of the runoff and the centre of gravity of the rainfall) was estimated as 30 min. We specified that this lag-time should be the same as the one provided by the LR model and be applied to the mesh occupying the centre of gravity of the catchment active zone (urbanized area). This mesh is located approximately 1.2 km from the basin outlet. The theoretical response time provided by the model is given by Eq. (14):
with m being the mesh of the centre of gravity of the catchment. This leads to Eq. (15),
and therefore Vo is obtained using Eq. (16),
Applying Eq. (16) with Tr =30 min and Lm =1.2 km leads to Vo =1.1 m s−1.
This estimation based on data from the experimental catchment was then extrapolated to the whole study area, assuming that the velocity Vo was uniform and equal to that obtained for the Fann–Mermoz catchment for all rainfall events. This approximation is justified by the fact that slopes vary little in Dakar and are on average fairly close to those of the Fann–Mermoz catchment.
4.2 1D hydraulic model calibration
4.2.1 Propagation in the un-channelled network
The un-channelled network meshes here have been linked to both (i) the right-of-way of streets and roads that, in urbanized areas, become the transfer pathways for surface runoff (Zhang et al., 2018; Skrede et al., 2020) due to the presence of buildings, walls, and other urban objects (Fig. 7) that divert flows (Diémé et al., 2022) and (ii) the shallow natural reaches arising from non-urbanized surfaces.
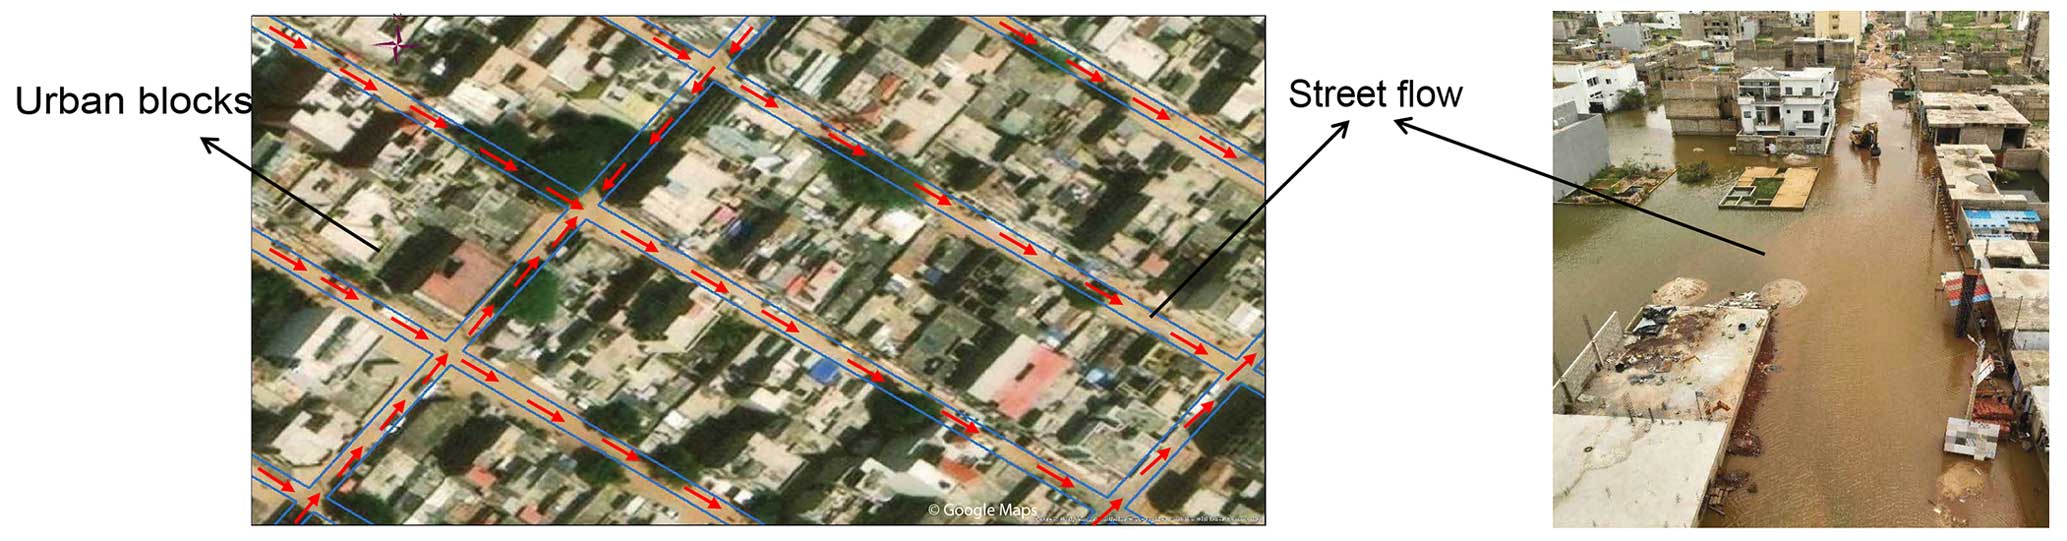
Figure 7Surface water drainage paths at the urban street level. Background images © Google Maps 2023.
The network meshes derived from streets and roads were classified into types (residential streets, primary–secondary roads, national roads, and highways) and assigned a specific width according to their spatial footprint. This was done interactively, on-screen, by superimposing the city's road and street layer onto a satellite imagery background (Google Earth). The widths (λ) corresponding to each category of road were estimated on a case-by-case basis, taking the alignment of the carriageway and its verges into consideration. Figure 8 shows the values found (in m) and defined using Google Earth's distance measurement tools. As there are no constraints (walls, partitions, etc.) in the propagation of natural reaches, they have been represented in the model as having infinite width.
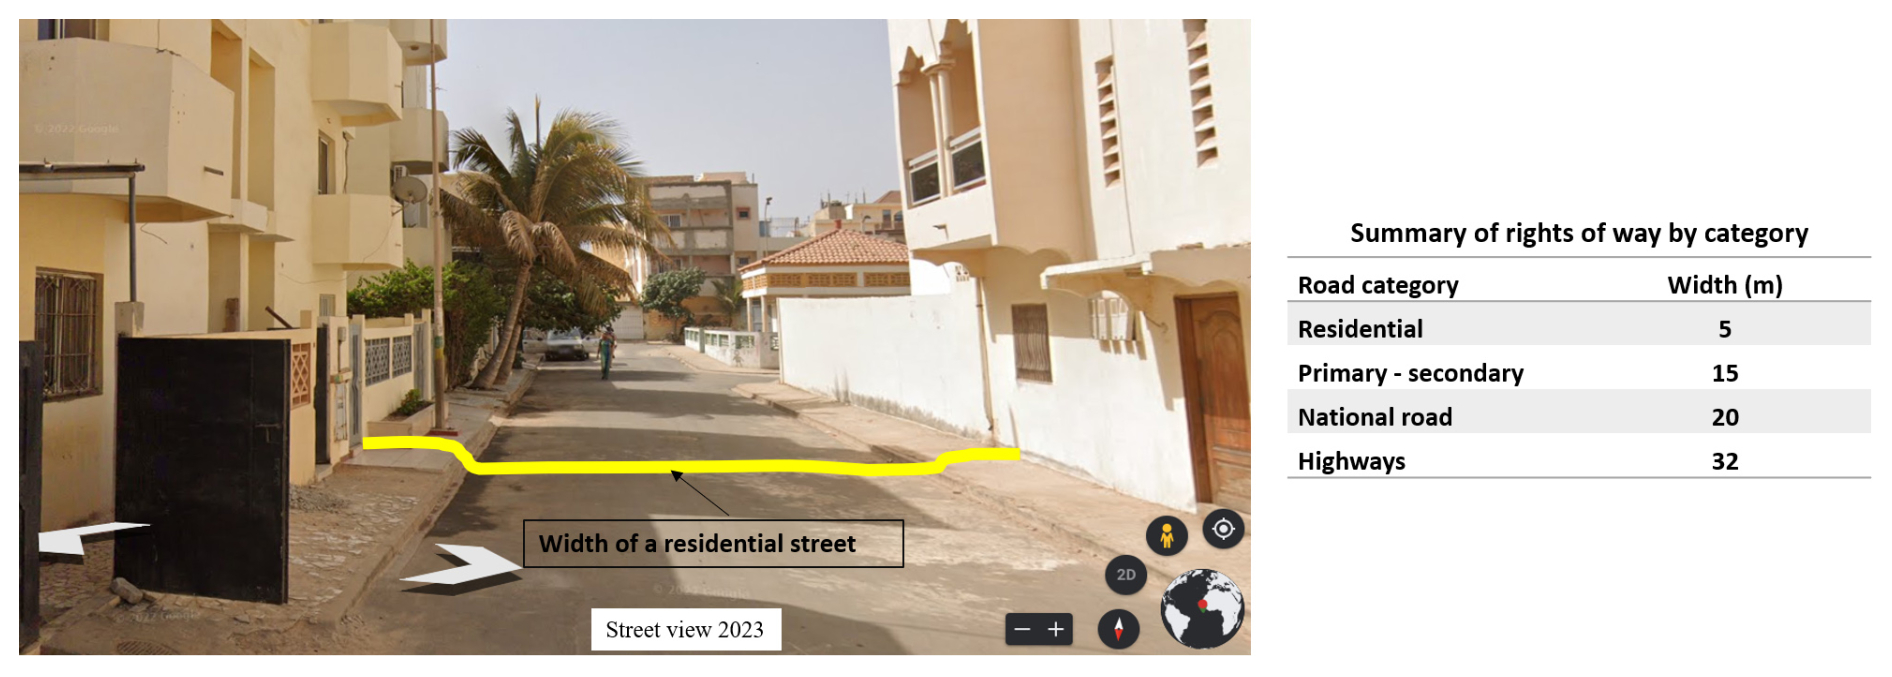
Figure 8Determining the widths of un-channelled transfer classes. Background image © Google Earth 2023.
About the depth of the minor bed (Pc) associated with street and road meshes: an infinite depth has been set so that the flow remains channelled by the width of the road or street (in this case by the walls bordering the street). It was considered null for the meshes of the natural reaches, which are not easy to differentiate in Dakar. Manning–Strickler roughness coefficients were estimated at 50 m s−1 for all street and road meshes with more-or-less smooth surfaces and at 20 m s−1 for natural meshes with rough surfaces.
Slope values were calculated from the DTM, using the differences in elevation at the nodes of each mesh in the mesh's drainage direction and then smoothed to limit the sensitivity of the 1D kinematic wave model to slope variability (sometimes linked to DTM accuracy shortcomings). Smoothing was based on the difference between the altitudes of the mesh and the Nth mesh downstream, divided by the length of the trajectory between the mesh and the Nth mesh downstream. The number N of meshes used for smoothing has been set at 50 meshes. If the calculated slope is equal to 0 (or even <0) or if there is no Nth mesh (on the edges of the image), this slope is assigned the value 0.001 m m−1. Slopes smoothed in this way range from 0.001 to 0.4 m m−1, with an average of 0.007 m m−1.
4.2.2 Calibration of the propagation model in the channelled network
The parameters λ and Pc, used to calculate the hydraulic radius, were set based on the dimensions of the collectors for which information on their characteristics (width and depth) is available in the preliminary and detailed technical reports produced as part of PROGEP. The roughness coefficient has been uniformly set to 50 m s−1, and flows are calculated over all channel sections, taking into account the overall rectangular cross-section. The slopes applied are obtained by smoothing the DTM altitudes as indicated above.
4.3 Calibration of the water storage model
All the retention basins were assumed to have regular shapes where the volume and the water level were proportional. They also were assumed to have linear reservoir behaviour, so the outflow and the storage volume (or the water level) are also proportional. Thus, the volume–water level–outflow can be reduced to only two lines, where the upper line denotes the lowest volume, water level, and outflow in the basin and the lower line the highest volume, water level, and outflow in the basin. For example, a basin that has 15 000 m3 maximal volume, 1.2 m maximal water level, and 3.90 m3 s−1 maximal outflow will be associated with Table 4.
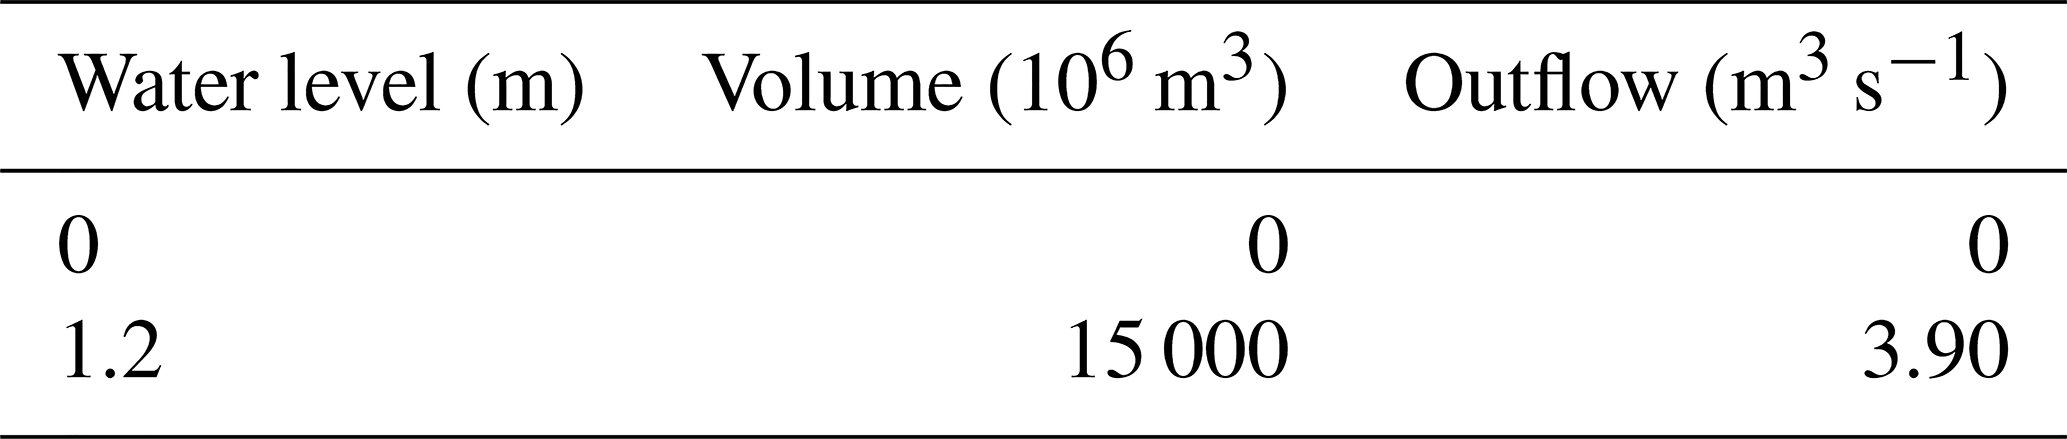
From this example table, each water level value or outflow corresponding to a given volume is linearly interpolated between the minimal and the maximal storage volumes. When the maximum reservoir storage value is reached, the inflow entering the reservoir is fully transferred downstream as outflow.
In the list of retention basins (106), only the retention basins built as part of the PROGEP project (84 basins) have detailed information (storage capacity, maximum water level, and discharge rate), which we have extracted from the various reports produced by this project. As for the other basins whose dimensions are unknown, we have assigned them, by default, characteristics based on a criterion of the similarity of the shapes of their contours to those of basins whose dimensions are known, as well as visually comparing them using satellite imagery from Google Earth.
5.1 Design storm construction
Design storms (Fig. 9) were constructed to be used as input data for the model to simulate runoff discharge (Zhenyu and Olivier, 2005; Balbastre-Soldevila et al., 2019).
The maximum rainfall provided by the IDF curves (Table 1) was used to construct the design storms. The design storm model used is the double-triangular rainfall model proposed in France by Desbordes and Raous (1976). It takes into account (i) the total duration of the rain, t3, whose height taken from the IDF is equal to P(t3,T); (ii) the period of intense rain of duration t1, whose height P(t1,T), is also taken from the IDF; and (iii) a period t2 (here in the case of a symmetric design rainfall) that constitutes a period of rain before and after the intense period. For its construction, the basic parameters to be determined are im (the maximum intensity before the intense period) and iM (the maximum intensity of the peak of the intense rainfall). They are calculated following Eqs. (17) and (18):
To build the design storm for different return periods, we selected a total duration t3=4 h, which is what is generally observed in African convective systems (Tadesse and Anagnostou, 2010). The duration of the intense rainfall t1 must be related to the time of concentration of the catchments; we chose t1=1 h according to the transfer time over the largest catchments. Other attempts using 30 and 10 min do not show significant differences in the flow discharges at the outlet of the catchments, regardless of their size.
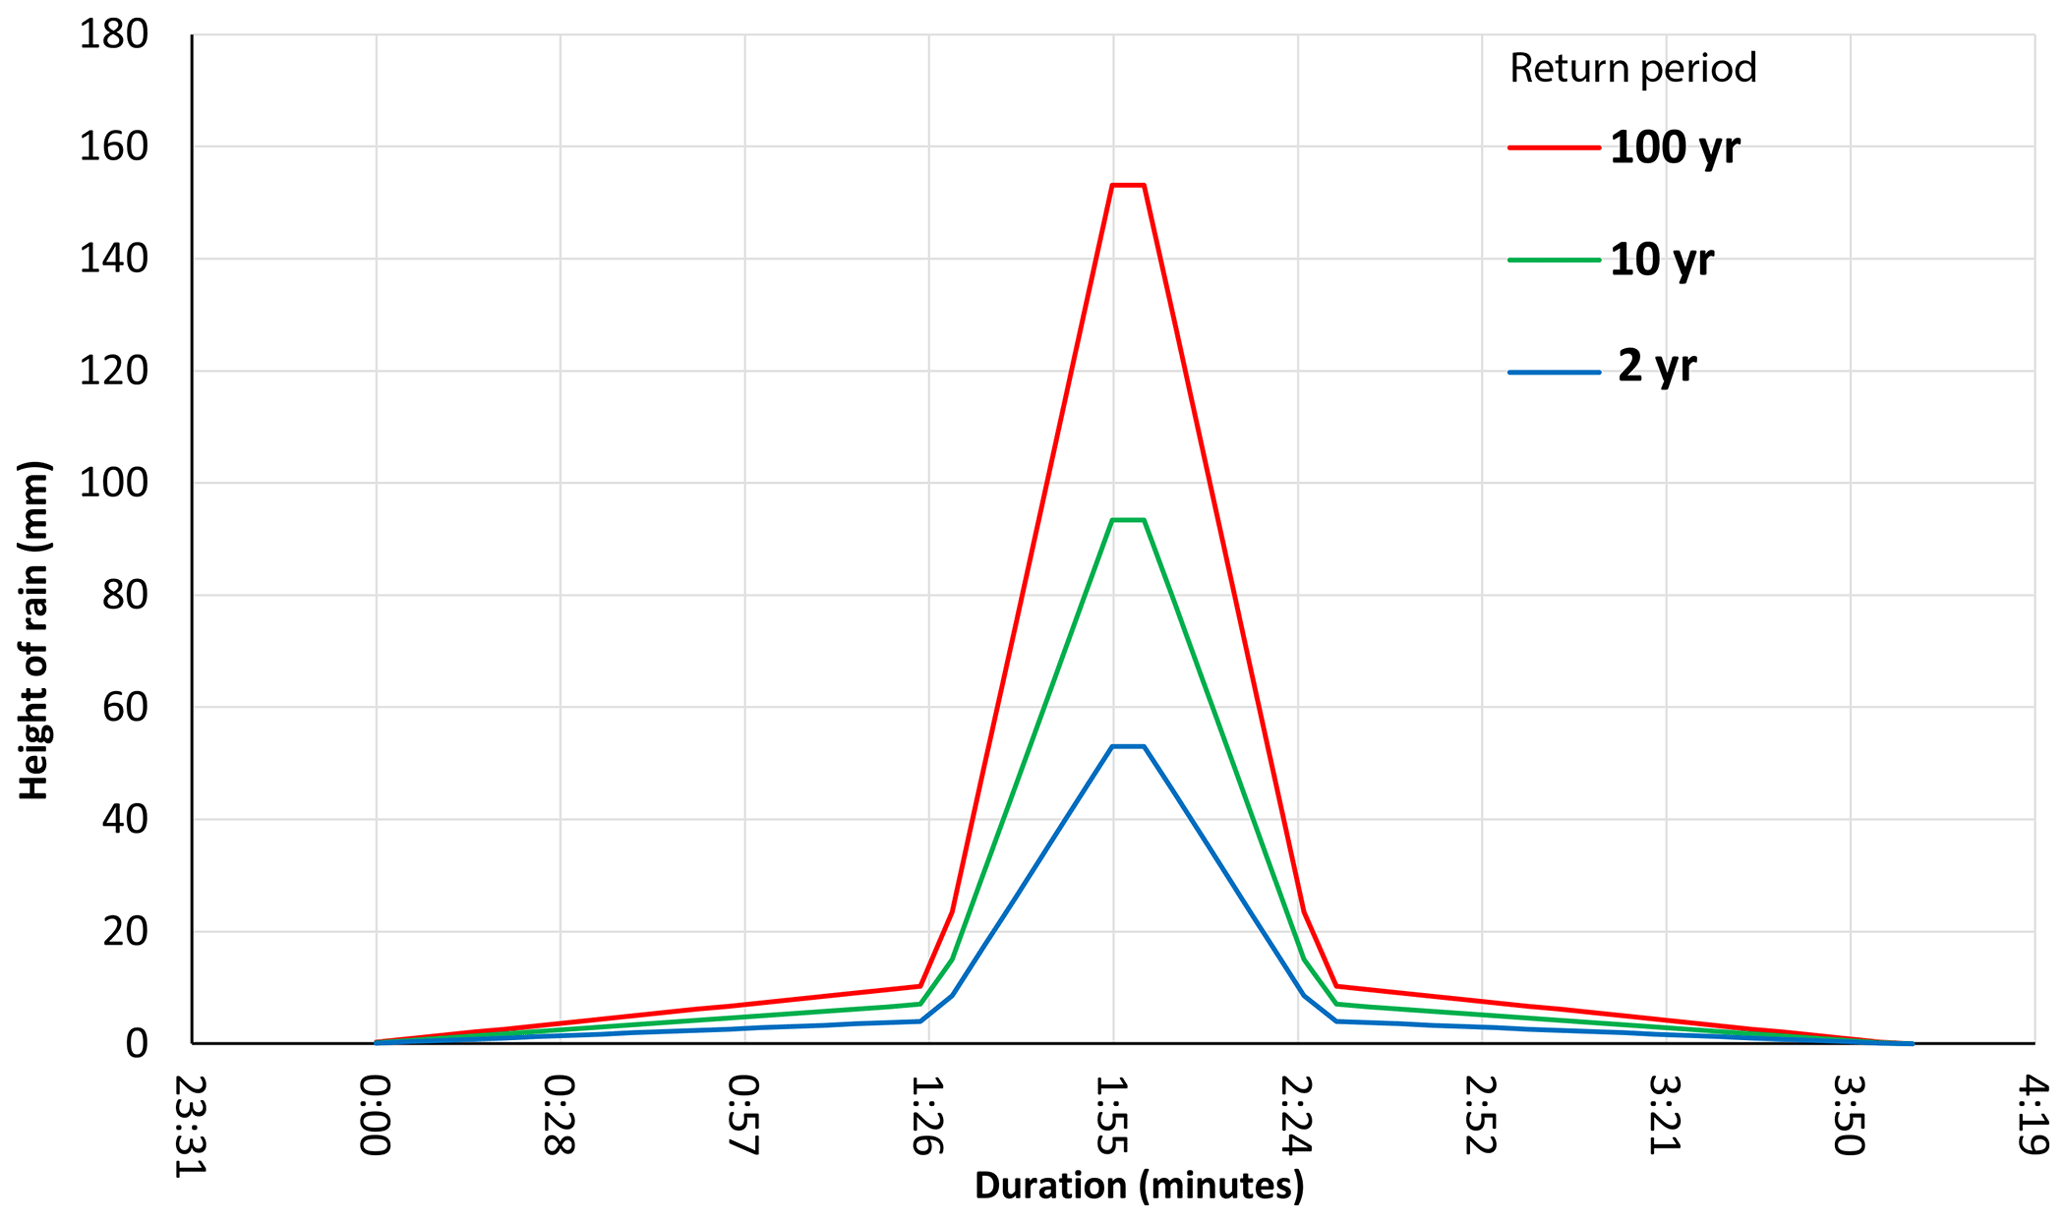
Figure 9Construction of the design storms for return periods of 2, 10, and 100 years, with an intense period of 1 h and a total duration of 4 h.
5.2 Implementation to detect network overflows
Running the simulation model provides the flows, heights, and velocities in the drainage and storage networks throughout the event. The overflows from the network correspond to a positive difference between the simulated flows and the full-load capacities for the drainage network and to a positive difference between the simulated volume and the maximum volume for the storage basins. The capacities of the drainage network were calculated by applying the Manning–Strickler formula at full load, i.e. with a head of water corresponding to the depth of the structure. The results are maps of overflows from the stormwater drainage network and retention basins at the scale of the study area. The results presented here are based on running the model with a 10-year (78 mm; Fig. 10) and 100-year (128 mm; Fig. 11) design storm over 4 h. The simulations were carried out under the assumption that the rainfall was uniform over all the defined catchment areas. The simulations carried out show that the network records significant overflows for rainfall with a 10-year return period, with overflow levels ranging from 1–12 m3 s−1 for some sections and up to 18 m3 s−1 for three sections. For most of the collectors that overflowed, the overflow rates varied between 1 and 6 m3 s−1.
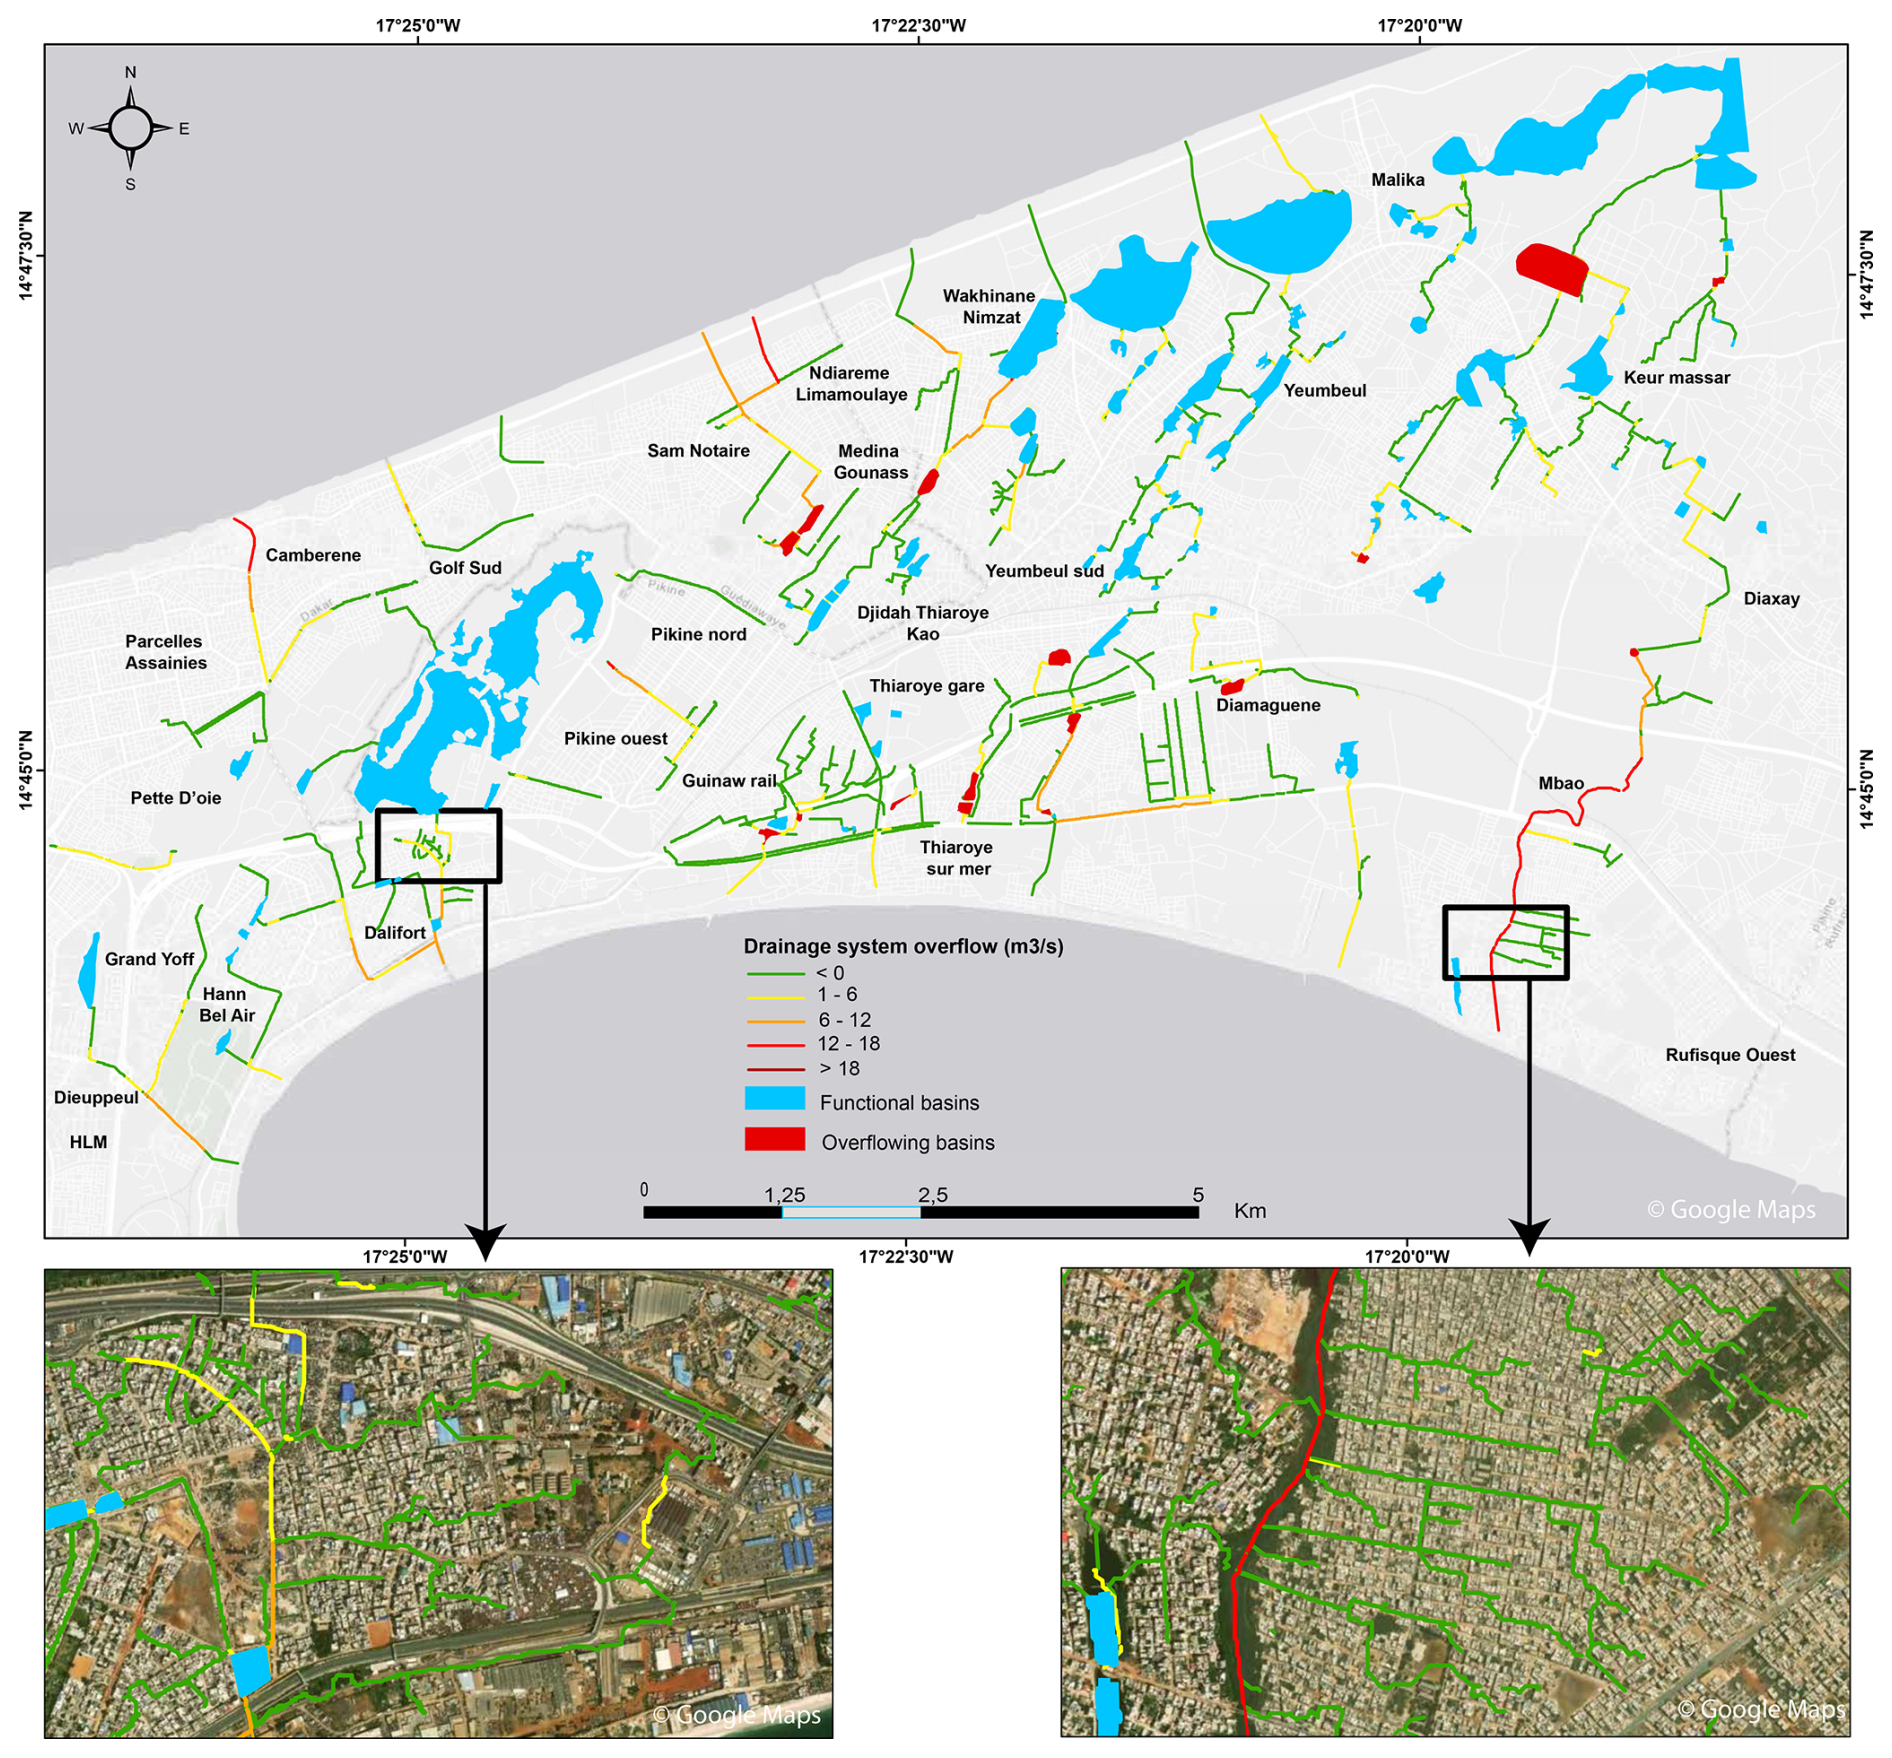
Figure 10Identification of network overflow points for a 10-year return period rainfall. Background maps © Google Maps 2023.
Beyond the 10-year rainfall frequency, the network shows widespread overflow levels. This applies to both collectors and storage basins. However, some reservoirs are still operational. The large natural depressions (the Niayes) do not overflow. Overflows are noted at a large proportion of the collectors, with thresholds sometimes exceeding 18 m3 s−1 in some cases. The simulations also show that the flow load caused a large number of retention basins to overflow.
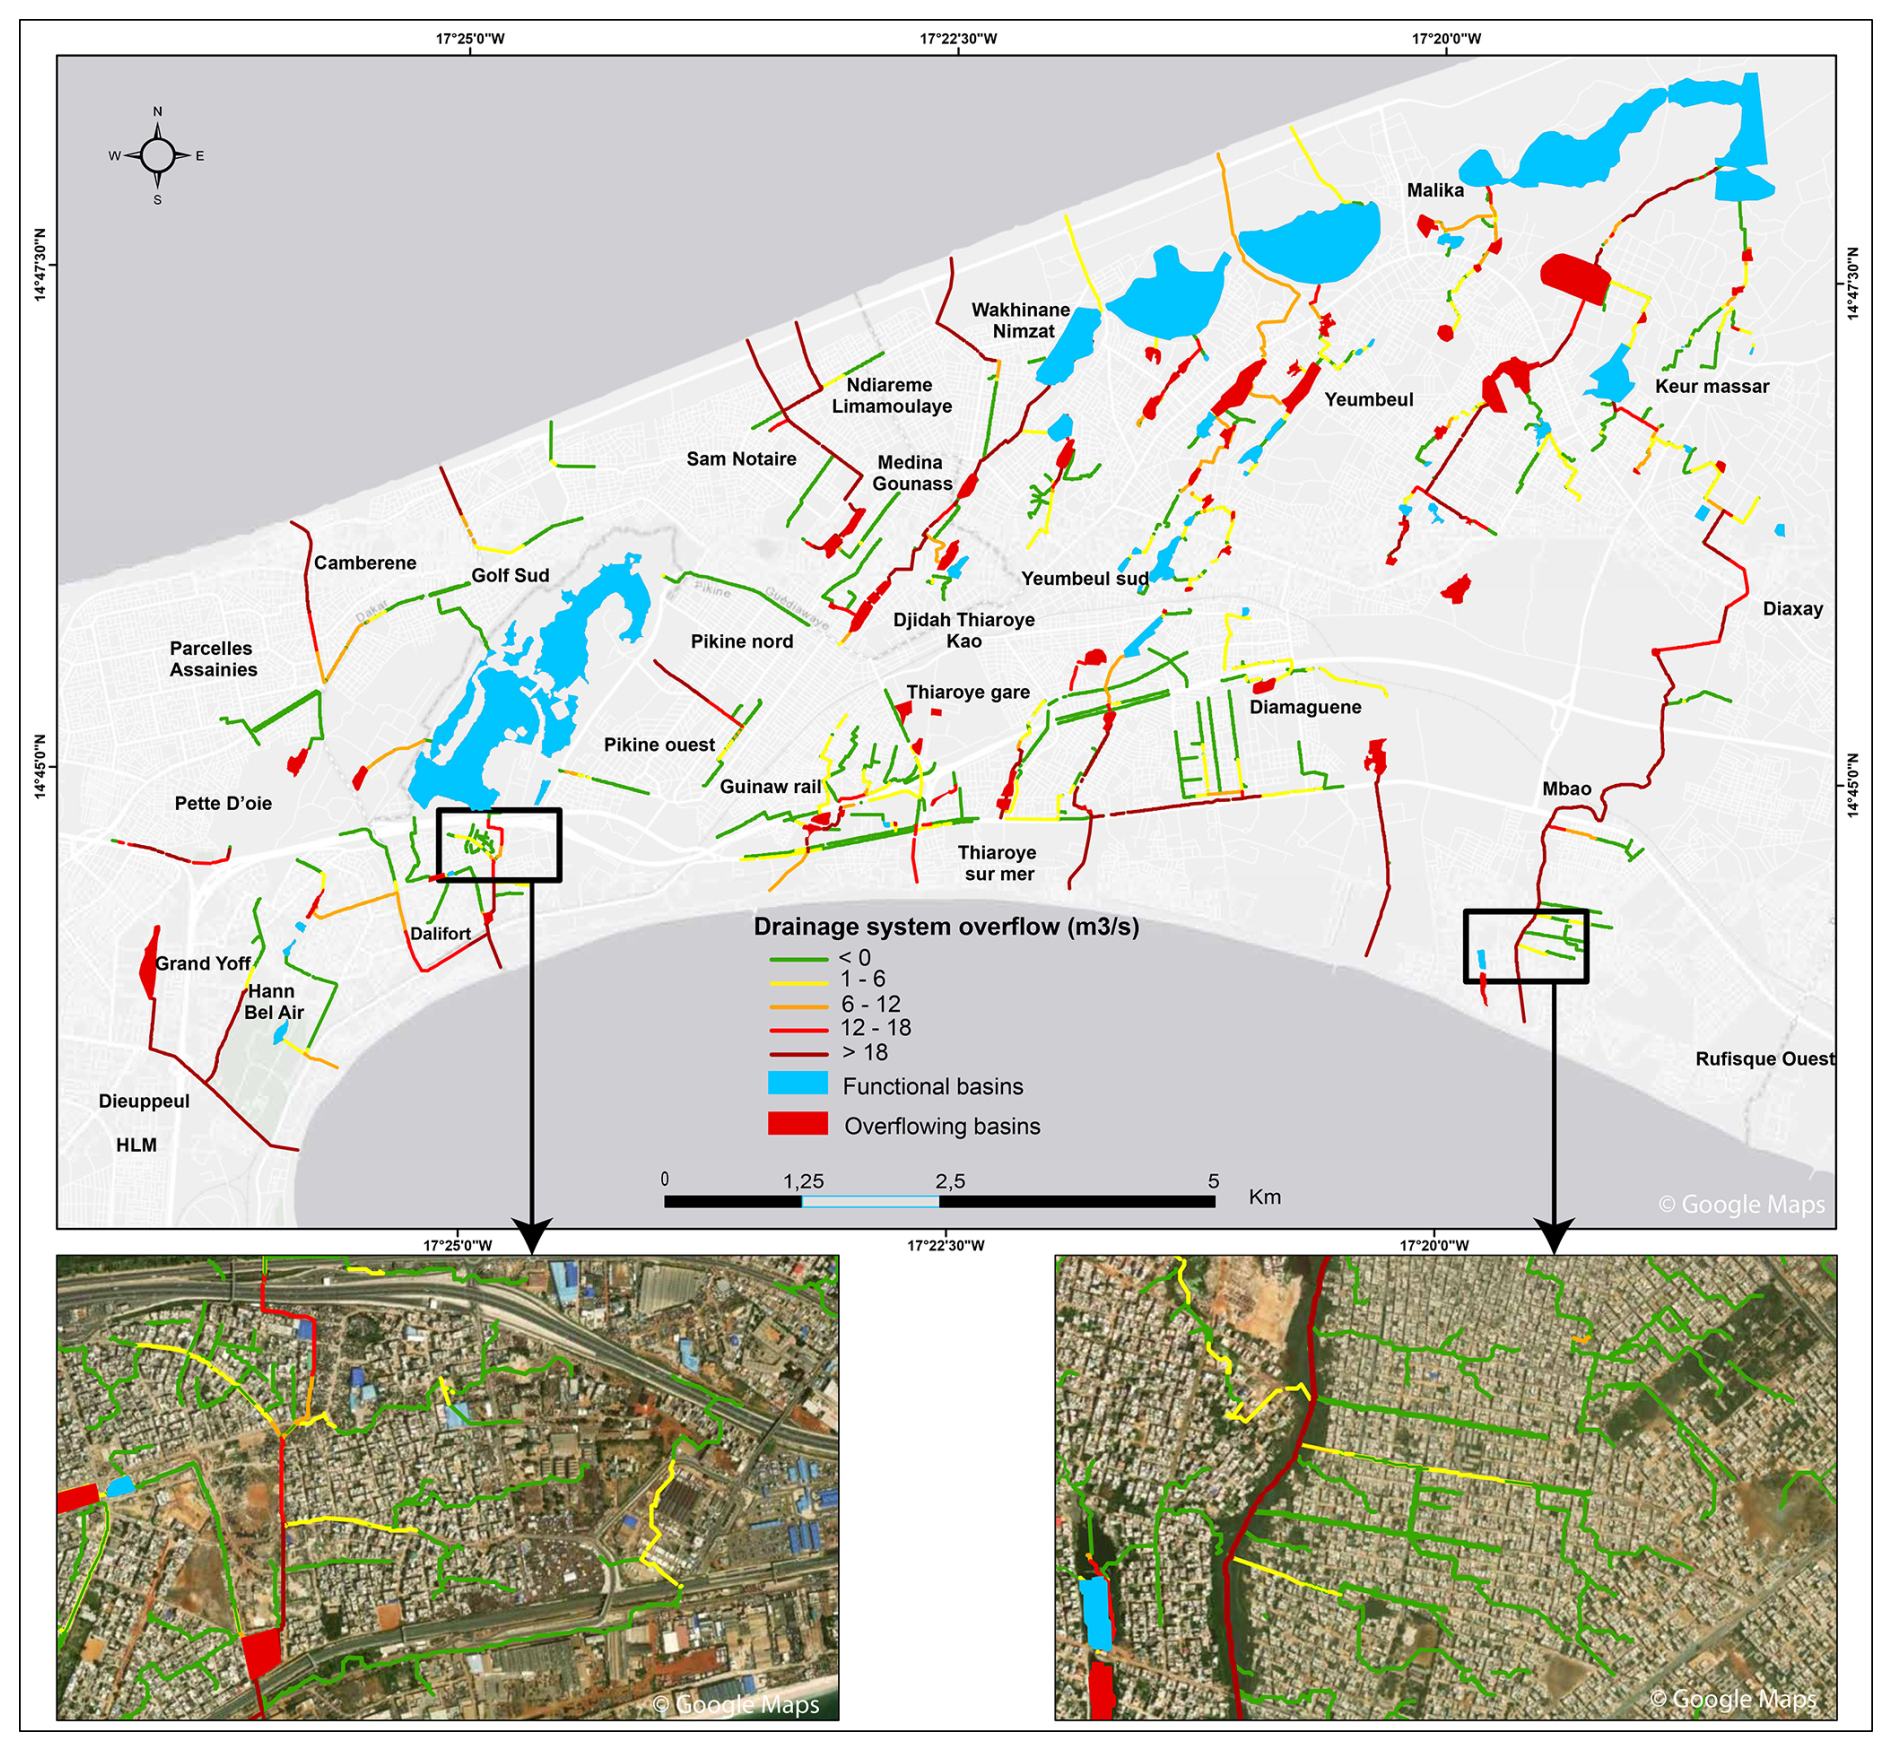
Figure 11Identification of network overflow points for a 100-year return period rainfall. Background maps © Google Maps 2023.
5.3 Discussion
The model used in this study has the advantage of being relatively simple and capable of covering an entire city, with a fine resolution (25 m2) and short calculation times (typically 5 min). This makes it a useful tool for assessing flood risk. The model is also compatible with real-time flood forecasting applications if remote rainfall data are available. However, this study has a number of limitations. An important factor is the construction of the drainage topology based on the DTM, which has focused solely on the effects of the location of buildings, canals, and storage basins that modify drainage directions. To obtain a more detailed view, the analysis should be extended to include other urban objects that influence the trajectories of surface runoff flows. Future work will focus on lidar data (currently being compiled for the Dakar region), which provide more detail than DTM regarding urban micro-objects and could thus be used to refine the reconstruction of induced drainage directions.
The other limitation of this work relates to the availability of the data (hydrological, hydrometric, or piezometric) required to calibrate the hydrological runoff-routing models (SCS-LR) applied to this drainage topology to calculate flows. In this study, the calibration of the SCS runoff model was based on a hypothesis established from a short series of data from the Fann–Mermoz experimental basin, assuming that the 10-year runoff coefficient was equal to the building coefficient. Although this simplification may be acceptable for the case of Dakar, where soils are generally sandy and very permeable (Diémé, 2023), new data must be produced to verify the hypothesis. In other cities where the soils are less permeable, direct (Kelleners et al., 2005) or indirect (Galagedara et al., 2003) infiltration measurements of several representative sites should be used as a basis for determining the contribution of these soils to surface runoff. A particular constraint is the influence of the rising water table in Dakar (Faye et al., 2019), which must be taken into account in the flow generation model. One possible solution is to obtain piezometric data giving the water table level and to reduce the S parameter of the SCS model in the meshes corresponding to outcrops of the water table. The rainfall data used as input for the model were applied with the assumption that the rainfall was uniform over all the defined catchment areas. Such a hypothesis does not account for the areal reduction factor but can be adopted because most of the catchments (i.e. 94 %) have small areas, less than 2 km2. The largest catchment areas account for 4 % (2 to 6 km2) and 2 % (6 to 12 km2) of the 890 catchment outlets that have been considered. Also, to better account for the extreme precipitation regime, it would be interesting to explore non-stationary statistical methods to determine IDF curves instead of the stationary IDF curves used in this study (Chagnaud et al., 2021), incorporating the uncertainties associated with climate change. Likewise, good integration of the spatial variability in precipitation is necessary for more accurate surface water runoff simulation. Alternative and innovative methods based on rainfall estimation using microwave links from cellular communication networks (Turko et al., 2021; Djibo et al., 2023) are currently being tested in African cities where the coverage of rainfall measurement stations is poor.
About the LR routing model: it was calibrated by assuming that the transfer velocity (Vo), calculated on the Fann–Mermoz experimental basin, was uniform over the entire study area. The slope conditions, which vary little in the study area, allow us to retain this approximation. It is clear that the calibration of both the SCS-LR runoff-routing models needs to be improved using new experimental data, which is relatively rare in African cities. This should motivate the setting up of new experimental sites in order to better estimate the parameters of the flow calculation models. Additionally, one of the improvements to be made to the model concerns the calculation of the slopes used by the KW hydraulic model to ensure the propagation of flows in the channelled and un-channelled network. A simplification has been applied, involving smoothing to reduce the sensitivity of the KW model to irregular variations in the slope of the terrain, which are sometimes linked to a mistake in the DTM. The availability of lidar data in the study area will enable us to compare the model's performance using more accurate slopes. Similarly, the congestion of collectors (from household waste, silting, etc.) can be incorporated into the hydraulic model. This could be taken into account by reducing the cross-section of the collector even if information on this congestion is difficult to obtain.
Finally, validating the results of the model simulations is one of the major perspectives of this study. As things stand at present, it was not possible to get the necessary data to validate the method, which means on the one hand, subdaily rainfall data, and on the other hand, flood maps for the recent events that occurred in Dakar. The imminent installation of a rain gauge radar in Dakar could help to facilitate this. Flood maps could be obtained by exploring citizen science tools (Sy et al., 2020); using information on feedback, recent flooding situations, and data on the intensity of rainfall events that cause flooding, as applied in Bamako (Mali) by Chahinian et al. (2023); or ordering a high-precision satellite image to map out flooded areas. Validation of the method would enable it to be extended to other towns and cities, thereby ensuring sound planning decisions.
A fine-scale simulation model of runoff over an entire urban area and an assessment of the response of the storm drainage network (canals and retention basins) to different rainfall events have been developed. They are based on a preliminary reconstruction of the drainage directions modified by urbanization and the implementation of combined hydrological and 1D hydraulic models calibrated to the city's urban conditions.
The results obtained are overflow maps of the city's drainage network for rainfall intensities of different return periods. The representation of overflow points is associated here with 1D modelling but is still sufficiently informative to guide the deployment of emergency services on the ground or to initiate action at strategic locations: assessment of the effectiveness of planned developments, tests of different rainfall and urbanization scenarios, or detection of overflows in near-real time with remote rainfall data. In addition, the model also provides boundary conditions for applying 2D hydraulic models to locally determine the propagation of overflows from the stormwater drainage network over limited areas. Future work will focus on improving the availability of data to facilitate the assessment of simulation uncertainties and validate the overflow results. Indeed, one of the challenges of urban hydrology in African cities is to set up the urban databases that are essential to conduct relevant studies and to better characterize and forecast floods.
The datasets used in this research are not public data and are the property of national institutions. But they are available from the first author, Laurent Pascal Malang Diémé, on request and/or subject to authorisation from the institutions.
LPMD conceptualized and performed the draft preparation. CB implemented the code in the ATHYS software. AB contributed to data analysis. AS provided geographic datasets. LPMD, CB, and AB developed the methodology and provided the simulation and details about it. All authors were involved in reviewing and editing the paper.
The contact author has declared that none of the authors has any competing interests.
Publisher's note: Copernicus Publications remains neutral with regard to jurisdictional claims made in the text, published maps, institutional affiliations, or any other geographical representation in this paper. While Copernicus Publications makes every effort to include appropriate place names, the final responsibility lies with the authors.
This article was produced with the support of the Water Cycle and Climate Change (CECC) 2021–2025 project, co-funded by IRD and AFD. The authors would also like to thank the technical organizations that agreed to make the data used in this article available.
This research has been supported by the AFD (Agence Française de Développement) and IRD as part of the CECC (Water Cycle and Climate Change) project (grant no. CZZ2625 01 C).
This paper was edited by Lindsay Beevers and reviewed by Ana Corrochano-Fraile and three anonymous referees.
Agonafir, C., Lakhankar, T., Khanbilvardi, R., Krakauer, N., Radell, D., and Devineni, N.: A review of recent advances in urban flood research, Water Secur., 19, 100141, https://doi.org/10.1016/j.wasec.2023.100141, 2023.
Balbastre-Soldevila, R., García-Bartual, R., and Andrés-Doménech, I.: A Comparison of Design Storms for Urban Drainage System Applications, Water, 11, 757, https://doi.org/10.3390/w11040757, 2019.
Barau, A. and Wada, A. S.: Do-It-Yourself Flood Risk Adaptation Strategies in the Neighborhoods of Kano City, Nigeria, in: African Handbook of Climate Change Adaptation, edited by: Oguge, N., Ayal, D., Adeleke, L., and da Silva, I., Springer International Publishing, Cham, 1353–1380, https://doi.org/10.1007/978-3-030-45106-6_190, 2021.
Bassel, M.: Eaux et environnement à Dakar-Pluies, ruissellement, pollution et évacuation des eaux. Contribution à l'étude des problèmes d'environnement liés aux eaux dans la région de Dakar, PhD thesis, Université Cheikh Anta Diop de Dakar, Département de Géographie, 244 pp., https://www.documentation.ird.fr/hor/fdi:010012652 (last access: 20 October 2023), 1996.
Bassel, M. and Pépin, Y.: Pluies, ruissellement, évacuation et qualité des eaux sur le bassin versant de Mermoz-Fann: Contribution à l'étude des problèmes d'environnement liés aux eaux dans la région de Dakar, rapport de campagne, ORSTOM, 59 pp., https://www.documentation.ird.fr/hor/fdi:010010028 (last access: 20 October 2023), 1995.
Bassel, M., Pépin, Y., and Thiébaux, J. P.: Rapport de campagne: Bassin urbain de Dakar, ORSTOM, 55 pp., https://www.documentation.ird.fr/hor/fdi:010020660 (last access: 27 October 2023), 1994.
Bentivoglio, R., Isufi, E., Jonkman, S. N., and Taormina, R.: Deep learning methods for flood mapping: a review of existing applications and future research directions, Hydrol. Earth Syst. Sci., 26, 4345–4378, https://doi.org/10.5194/hess-26-4345-2022, 2022.
Bichet, A. and Diedhiou, A.: West African Sahel has become wetter during the last 30 years, but dry spells are shorter and more frequent, Clim. Res., 75, 155–162, https://doi.org/10.3354/cr01515, 2018.
Bodian, A.: Caractérisation de la variabilité temporelle récente des précipitations annuelles au Sénégal (Afrique de l'Ouest), Physio-Géo, 8, 297–312, https://doi.org/10.4000/physio-geo.4243, 2014.
Bodian, A., Dacosta, H., Diouf, R. N., Ndiaye, E. H. O., and Mendy, A.: Contribution à la connaissance de l'aléa pluvial au Sénégal grâce à la valorisation des données pluviographiques historiques, Climatologie, 13, 38–46, https://doi.org/10.4267/climatologie.1194, 2016.
Bottazzi, P., Winkler, M. S., Boillat, S., Diagne, A., Maman Chabi Sika, M., Kpangon, A., Faye, S., and Speranza, C. I.: Measuring Subjective Flood Resilience in Suburban Dakar: A Before–After Evaluation of the “Live with Water” Project, Sustainability, 10, 2135, https://doi.org/10.3390/su10072135, 2018.
Bouadila, A., Bouizrou, I., Aqnouy, M., En-nagre, K., El Yousfi, Y., Khafouri, A., Hilal, I., Abdelrahman, K., Benaabidate, L., Abu-Alam, T., Stitou El Messari, J. E., and Abioui, M.: Streamflow Simulation in Semiarid Data-Scarce Regions: A Comparative Study of Distributed and Lumped Models at Aguenza Watershed (Morocco), Water, 15, 1602, https://doi.org/10.3390/w15081602, 2023.
Bouvier, C., Chahinian, N., Adamovic, M., Cassé, C., Crespy, A., Crès, A., and Alcoba, M.: Large-Scale GIS-Based Urban Flood Modelling: A Case Study on the City of Ouagadougou, in: Advances in Hydroinformatics, SimHydro2017, Sophia-Antipolis, France, 703–717, https://doi.org/10.1007/978-981-10-7218-5_50, 2017.
Bouvier, C., Bouchenaki, L., and Tramblay, Y.: Comparison of SCS and Green-Ampt Distributed Models for Flood Modelling in a Small Cultivated Catchment in Senegal, Geosciences, 8, 122, https://doi.org/10.3390/geosciences8040122, 2018.
Bulti, D. T. and Abebe, B. G.: A review of flood modeling methods for urban pluvial flood application, Model. Earth Syst. Environ., 6, 1293–1302, https://doi.org/10.1007/s40808-020-00803-z, 2020.
Chagnaud, G., Panthou, G., Vischel, T., Blanchet, J., and Lebel, T.: A unified statistical framework for detecting trends in multi-timescale precipitation extremes: application to non-stationary intensity-duration-frequency curves, Theor. Appl. Climatol., 145, 839–860, https://doi.org/10.1007/s00704-021-03650-9, 2021.
Chagnaud, G., Panthou, G., Vischel, T., and Lebel, T.: A synthetic view of rainfall intensification in the West African Sahel, Environ. Res. Lett., 17, 044005, https://doi.org/10.1088/1748-9326/ac4a9c, 2022.
Chahinian, N., Alcoba, M., Dembélé, N. D. J., Cazenave, F., and Bouvier, C.: Evaluation of an early flood warning system in Bamako (Mali): Lessons learned from the flood of May 2019, J. Flood Risk Manag., 16, e12878, https://doi.org/10.1111/jfr3.12878, 2023.
Chen, Y., Zhou, H., Zhang, H., Du, G., and Zhou, J.: Urban flood risk warning under rapid urbanization, Environ. Res., 139, 3–10, https://doi.org/10.1016/j.envres.2015.02.028, 2015.
Cissé Faye, S., Faye, S., Wohnlich, S., and Gaye, C. B.: An assessment of the risk associated with urban development in the Thiaroye area (Senegal), Env. Geol., 45, 312–322, https://doi.org/10.1007/s00254-003-0887-x, 2004.
Constantindes, C. A.: Numerical techniques for a two-dimensional kinematic overland flow model, Water SA, 7, 234–248, 1981.
Costabile, P., Costanzo, C., De Lorenzo, G., and Macchione, F.: Is local flood hazard assessment in urban areas significantly influenced by the physical complexity of the hydrodynamic inundation model?, J. Hydrol., 580, 124231, https://doi.org/10.1016/j.jhydrol.2019.124231, 2020.
Coulibaly, G., Leye, B., Tazen, F., Mounirou, L. A., and Karambiri, H.: Urban Flood Modeling Using 2D Shallow-Water Equations in Ouagadougou, Burkina Faso, Water, 12, 2120, https://doi.org/10.3390/w12082120, 2020.
Darabi, H., Choubin, B., Rahmati, O., Torabi Haghighi, A., Pradhan, B., and Kløve, B.: Urban flood risk mapping using the GARP and QUEST models: A comparative study of machine learning techniques, J. Hydrol., 569, 142–154, https://doi.org/10.1016/j.jhydrol.2018.12.002, 2019.
Dehotin, J., Chazelle, B., Laverne, G., Hasnaoui, A., Lambert, L., Breil, P., and Braud, I.: Mise en œuvre de la méthode de cartographie du ruissellement IRIP pour l'analyse des risques lies aux écoulements sur l'infrastructure ferroviaire, Houille Blanche, 101, 56–64, https://doi.org/10.1051/lhb/20150069, 2015.
Desbordes, M. and Raous, P.: Un exemple de l'intérêt des études de sensibilité des modèles hydrologiques, Houille Blanche, 62, 37–43, https://doi.org/10.1051/lhb/1976004, 1976.
Descroix, L., Diongue Niang, A., Dacosta, H., Panthou, G., Quantin, G., and Diedhiou, A.: Évolution des pluies de cumul élevé et recrudescence des crues depuis 1951 dans le bassin du Niger moyen (Sahel), Climatologie, 10, 37–49, https://doi.org/10.4267/climatologie.78, 2013.
DHI (Danish Hydraulic Institute): Mike Flood 1D-2D and 1D-3D Modelling – user manual, 154 pp., https://manuals.mikepoweredbydhi.help/2021/Water_Resources/MIKE_FLOOD_UserManual.pdf (last access: 17 October 2023), 2021.
Diémé, L. P.: Système de surveillance des inondations à l'échelle de l'agglomération de Dakar, PhD thesis, Université Gaston-Berger, Département de géographie, 177 pp., https://doi.org/10.13140/RG.2.2.19319.09121, 2023.
Diémé, L. P., Bouvier, C., Bodian, A., and Sidibé, A.: Construction de la topologie de drainage à fine résolution spatiale en milieu urbain: exemple de l'agglomération de Dakar (Sénégal), LHB, 108, 2061313, https://doi.org/10.1080/27678490.2022.2061313, 2022.
Diop, M. S.: Les capacités adaptatives des communautés de la périphérie de Dakar face aux inondations, PhD thesis, Université Paris Saclay (COmUE), 354 pp., https://tel.archives-ouvertes.fr/tel-02415826 (last access: 11 October 2023), 2019.
Djibo, M., Chwala, C., Ouedraogo, W. Y. S. B., Doumounia, A., Sanou, S. R., Sawadogo, M., Kunstmann, H., and Zougmoré, F.: Commercial microwave link networks for rainfall monitoring in Burkina Faso: First results from a dense network in Ouagadougou, in: 2023 IEEE Multi-conference on Natural and Engineering Sciences for Sahel's Sustainable Development (MNE3SD), Bobo-Dioulasso, Burkina Faso, 1–7, https://doi.org/10.1109/MNE3SD57078.2023.10079165, 2023.
Faye, S. C., Diongue, M. L., Pouye, A., Gaye, C. B., Travi, Y., Wohnlich, S., Faye, S., and Taylor, R. G.: Tracing natural groundwater recharge to the Thiaroye aquifer of Dakar, Senegal, Hydrogeol. J., 27, 1067–1080, https://doi.org/10.1007/s10040-018-01923-8, 2019.
Gaisie, E. and Cobbinah, P. B.: Planning for context-based climate adaptation: Flood management inquiry in Accra, Environ. Sci. Policy, 141, 97–108, https://doi.org/10.1016/j.envsci.2023.01.002, 2023.
Galagedara, L. W., Parkin, G. W., and Redman, J. D.: An analysis of the ground-penetrating radar direct ground wave method for soil water content measurement, Hydrol. Process., 17, 3615–3628, 2003.
Henonin, J., Russo, B., Mark, O., and Gourbesville, P.: Real-time urban flood forecasting and modelling – a state of the art, J. Hydroinform., 15, 717–736, https://doi.org/10.2166/hydro.2013.132, 2013.
Huang, M., Gallichand, J., Dong, C., Wang, Z., and Shao, M.: Use of soil moisture data and curve number method for estimating runoff in the Loess Plateau of China, Hydrol. Process., 21, 1471–1481, https://doi.org/10.1002/hyp.6312, 2007.
Hungerford, H., Smiley, S., Blair, T., Beutler, S., Bowers, N., and Cadet, E.: Coping with Floods in Pikine, Senegal: An Exploration of Household Impacts and Prevention Efforts, Urban Sci., 3, 54, https://doi.org/10.3390/urbansci3020054, 2019.
Jenson, S. K. and Domingue, J. O.: Extracting topographic structure from digital elevation data for geographic information system analysis, Photogramm. Eng. Rem. S., 54, 1593–1600, 1988.
Kelleners, T. J., Robinson, D. A., Shouse, P. J., Ayars, J. E., and Skaggs, T. H.: Frequency dependence of the complex permittivity and its impact on dielectric sensor calibration in soils, Soil Sci. Soc. Am. J., 69, 67–76, 2005.
Klutse, N. A. B., Quagraine, K. A., Nkrumah, F., Quagraine, K. T., Berkoh-Oforiwaa, R., Dzrobi, J. F., and Sylla, M. B.: The Climatic Analysis of Summer Monsoon Extreme Precipitation Events over West Africa in CMIP6 Simulations, Earth Syst. Environ., 5, 25–41, https://doi.org/10.1007/s41748-021-00203-y, 2021.
Kreibich, H., Di Baldassarre, G., Vorogushyn, S., Aerts, J. C. J. H., Apel, H., Aronica, G. T., Arnbjerg-Nielsen, K., Bouwer, L. M., Bubeck, P., Caloiero, T., Chinh, D. T., Cortès, M., Gain, A. K., Giampá, V., Kuhlicke, C., Kundzewicz, Z. W., Llasat, M. C., Mård, J., Matczak, P., Mazzoleni, M., Molinari, D., Dung, N. V., Petrucci, O., Schröter, K., Slager, K., Thieken, A. H., Ward, P. J., and Merz, B.: Adaptation to flood risk: Results of international paired flood event studies, Earths Future, 5, 953–965, https://doi.org/10.1002/2017EF000606, 2017.
Le Bourgeois, O., Bouvier, C., Brunet, P., and Ayral, P.-A.: Inverse modeling of soil water content to estimate the hydraulic properties of a shallow soil and the associated weathered bedrock, J. Hydrol., 541, 116–126, https://doi.org/10.1016/j.jhydrol.2016.01.067, 2016.
Lericollais, A. and Roquet, D.: Croissance de la population et dynamique du peuplement au Sénégal depuis l'indépendance, Espace Popul. Sociétés, 17, 93–106, https://doi.org/10.3406/espos.1999.1872, 1999.
Li, G., Zhao, H., Liu, C., Wang, J., and Yang, F.: City Flood Disaster Scenario Simulation Based on 1D–2D Coupled Rain–Flood Model, Water, 14, 3548, https://doi.org/10.3390/w14213548, 2022.
Maref, N. and Seddini, A.: Modeling of flood generation in semi-arid catchment using a spatially distributed model: case of study Wadi Mekerra catchment (Northwest Algeria), Arab. J. Geosci., 11, 116, https://doi.org/10.1007/s12517-018-3461-2, 2018.
Mark, O., Weesakul, S., Apirumanekul, C., Aroonnet, S., and Djordjevic, S.: Potential and limitations of 1D modelling of urban flooding, J. Hydrol., 299, 284–299, https://doi.org/10.1016/S0022-1694(04)00373-7, 2004.
Martínez, C., Sanchez, A., Toloh, B., and Vojinovic, Z.: Multi-objective Evaluation of Urban Drainage Networks Using a 1D/2D Flood Inundation Model, Water Resour. Manag., 32, 4329–4343, https://doi.org/10.1007/s11269-018-2054-x, 2018.
Mashi, S. A., Inkani, A. I., Obaro, O., and Asanarimam, A. S.: Community perception, response and adaptation strategies towards flood risk in a traditional African city, Nat. Hazards, 103, 1727–1759, https://doi.org/10.1007/s11069-020-04052-2, 2020.
Meng, X., Zhang, M., Wen, J., Du, S., Xu, H., Wang, L., and Yang, Y.: A Simple GIS-Based Model for Urban Rainstorm Inundation Simulation, Sustainability, 11, 2830, https://doi.org/10.3390/su11102830, 2019.
Miller, J., Vischel, T., Fowe, T., Panthou, G., Wilcox, C., Taylor, C. M., Visman, E., Coulibaly, G., Gonzalez, P., Body, R., Vesuviano, G., Bouvier, C., Chahinian, N., and Cazenave, F.: A modelling-chain linking climate science and decision-makers for future urban flood management in West Africa, Reg. Environ. Change, 22, 93, https://doi.org/10.1007/s10113-022-01943-x, 2022a.
Miller, J., Taylor, C., Guichard, F., Peyrillé, P., Vischel, T., Fowe, T., Panthou, G., Visman, E., Bologo, M., Traore, K., Coulibaly, G., Chapelon, N., Beucher, F., Rowell, D. P., and Parker, D. J.: High-impact weather and urban flooding in the West African Sahel – A multidisciplinary case study of the 2009 event in Ouagadougou, Weather Clim. Extrem., 36, 100462, https://doi.org/10.1016/j.wace.2022.100462, 2022b.
Mosavi, A., Ozturk, P., and Chau, K.: Flood Prediction Using Machine Learning Models: Literature Review, Water, 10, 1536, https://doi.org/10.3390/w10111536, 2018.
Moulds, S., Buytaert, W., Templeton, M. R., and Kanu, I.: Modeling the Impacts of Urban Flood Risk Management on Social Inequality, Water Resour. Res., 57, e2020WR029024, https://doi.org/10.1029/2020WR029024, 2021.
Ndiaye, I.: Étalement urbain et différenciation sociospatiale à Dakar (Sénégal), Cah. Géographie Qué., 59, 47–69, https://doi.org/10.7202/1034348ar, 2015.
Nicholson, S. E., Some, B., and Kone, B.: An Analysis of Recent Rainfall Conditions in West Africa, Including the Rainy Seasons of the 1997 El Niño and the 1998 La Niña Years, J. Climate, 13, 2628–2640, https://doi.org/10.1175/1520-0442(2000)013<2628:AAORRC>2.0.CO;2, 2000.
Nkrumah, F., Vischel, T., Panthou, G., Klutse, N. A. B., Adukpo, D. C., and Diedhiou, A.: Recent Trends in the Daily Rainfall Regime in Southern West Africa, Atmosphere, 10, 741, https://doi.org/10.3390/atmos10120741, 2019.
Nkwunonwo, U. C., Whitworth, M., and Baily, B.: A review of the current status of flood modelling for urban flood risk management in the developing countries, Sci. Afr., 7, e00269, https://doi.org/10.1016/j.sciaf.2020.e00269, 2020.
Nouaceur, Z.: La reprise des pluies et la recrudescence des inondations en Afrique de l'Ouest sahélienne, Physio-Géo Géographie Phys. Environ., 15, 89–109, https://doi.org/10.4000/physio-geo.10966, 2020.
Panthou, G., Lebel, T., Vischel, T., Quantin, G., Sane, Y., Ba, A., Ndiaye, O., Diongue-Niang, A., and Diopkane, M.: Rainfall intensification in tropical semi-arid regions: the Sahelian case, Environ. Res. Lett., 13, 064013, https://doi.org/10.1088/1748-9326/aac334, 2018.
Parvin, F., Ali, S. A., Calka, B., Bielecka, E., Linh, N. T. T., and Pham, Q. B.: Urban flood vulnerability assessment in a densely urbanized city using multi-factor analysis and machine learning algorithms, Theor. Appl. Climatol., 149, 639–659, https://doi.org/10.1007/s00704-022-04068-7, 2022.
Pla, G., Crippa, J., Djerboua, A., Dobricean, O., Dongar, F., Eugene, A., and Raymond, M.: ESPADA: un outil pour la gestion en temps réel des crues éclairs urbaines en pleine modernisation, Houille Blanche, 105, 57–66, https://doi.org/10.1051/lhb/2019027, 2019.
Ponce, V. M. and Hawkins, R. H.: Runoff curve number: Has it reached maturity?, J. Hydrol. Eng., 1, 11–19, https://doi.org/10.1061/(ASCE)1084-0699(1996)1:1(11), 1996.
Pons, F., Delgado, J., Guéro, P., Berthier, E., and Ile-de-France, C.: Exzeco: a gis and dem based method for predetermination of flood risk related to direct runoff and flash floods, 9th Int. Conf. Hydroinformatics HIC 2010, 7–11 September 2010, Tianjin, China, 2063–2070, 2010.
Rabori, A. M. and Ghazavi, R.: Urban Flood Estimation and Evaluation of the Performance of an Urban Drainage System in a Semi-Arid Urban Area Using SWMM, Water Environ. Res., 90, 2075–2082, https://doi.org/10.2175/106143017X15131012188213, 2018.
Rosenzweig, B. R., Herreros Cantis, P., Kim, Y., Cohn, A., Grove, K., Brock, J., Yesuf, J., Mistry, P., Welty, C., McPhearson, T., Sauer, J., and Chang, H.: The Value of Urban Flood Modeling, Earths Future, 9, e2020EF001739, https://doi.org/10.1029/2020EF001739, 2021.
Rubinato, M., Shucksmith, J., Saul, A. J., and Shepherd, W.: Comparison between InfoWorks hydraulic results and a physical model of an urban drainage system, Water Sci. Technol., 68, 372–379, 2013.
Sakijege, T. and Dakyaga, F.: Going beyond generalisation: perspective on the persistence of urban floods in Dar es Salaam, Nat. Hazards, 115, 1909–1926, https://doi.org/10.1007/s11069-022-05645-9, 2023.
Sambe-Ba, B., Espié, E., Faye, M. E., Timbiné, L. G., Sembene, M., and Gassama-Sow, A.: Community-acquired diarrhea among children and adults in urban settings in Senegal: clinical, epidemiological and microbiological aspects, BMC Infect. Dis., 13, 580, https://doi.org/10.1186/1471-2334-13-580, 2013.
Sané, O., Gaye, A. T., Diakhate, M., and Aziadekey, M.: Critical Factors of Vulnerability That Enable Medina Gounass (Dakar/Senegal) to Adapt against Seasonal Flood Events, J. Geogr. Inf. Syst., 08, 457–469, https://doi.org/10.4236/jgis.2016.84038, 2016.
Sane, Y., Panthou, G., Bodian, A., Vischel, T., Lebel, T., Dacosta, H., Quantin, G., Wilcox, C., Ndiaye, O., Diongue-Niang, A., and Diop Kane, M.: Intensity–duration–frequency (IDF) rainfall curves in Senegal, Nat. Hazards Earth Syst. Sci., 18, 1849–1866, https://doi.org/10.5194/nhess-18-1849-2018, 2018.
Sène, A., Sarr, M. A., Kane, A., and Diallo, M.: L'assèchement des lacs littoraux de la grande côte du Sénégal: Mythe ou réalité? Cas des lacs Thiourour, Warouwaye et Wouye de la banlieue de Dakar, J. Anim. Plant Sci., 35, 5623–5638, 2018.
Sène, A. M.: L'urbanisation de l'Afrique: davantage de bidonvilles ou des villes intelligentes?, Popul. Avenir, 739, 14–16, https://doi.org/10.3917/popav.739.0014, 2018.
Sene, S. and Ozer, P.: Evolution pluviométrique et relation inondations – événements pluvieux au Sénégal, Bull. Société Géographique Liège, 42, 27–33, 2002.
Sidek, L. M., Jaafar, A. S., Majid, W. H. A. W. A., Basri, H., Marufuzzaman, M., Fared, M. M., and Moon, W. C.: High-resolution hydrological-hydraulic modeling of urban floods using InfoWorks ICM, Sustainability, 13, 10259, https://doi.org/10.3390/su131810259, 2021.
Šimůnek, J., Genuchten, M. T., and Šejna, M.: Recent Developments and Applications of the HYDRUS Computer Software Packages, Vadose Zone J., 15, 1–25, https://doi.org/10.2136/vzj2016.04.0033, 2016.
Skrede, T. I., Muthanna, T. M., and Alfredesen, K.: Applicability of urban streets as temporary open floodways, Hydrol. Res., 51, 621–634, https://doi.org/10.2166/nh.2020.067, 2020.
Steenhuis, T. S., Winchell, M., Rossing, J., Zollweg, J. A., and Walter, M. F.: SCS Runoff Equation Revisited for Variable-Source Runoff Areas, J. Irrig. Drain. Eng., 121, 234–238, https://doi.org/10.1061/(ASCE)0733-9437(1995)121:3(234), 1995.
Sy, B., Frischknecht, C., Dao, H., Consuegra, D., and Giuliani, G.: Reconstituting past flood events: the contribution of citizen science, Hydrol. Earth Syst. Sci., 24, 61–74, https://doi.org/10.5194/hess-24-61-2020, 2020.
Tadesse, A. and Anagnostou, E. N.: African convective system characteristics determined through tracking analysis, Atmos. Res., 98, 468–477, https://doi.org/10.1016/j.atmosres.2010.08.012, 2010.
Taromideh, F., Fazloula, R., Choubin, B., Emadi, A., and Berndtsson, R.: Urban Flood-Risk Assessment: Integration of Decision-Making and Machine Learning, Sustainability, 14, 4483, https://doi.org/10.3390/su14084483, 2022.
Taylor, C. M., Belušić, D., Guichard, F., Parker, D. J., Vischel, T., Bock, O., Harris, P. P., Janicot, S., Klein, C., and Panthou, G.: Frequency of extreme Sahelian storms tripled since 1982 in satellite observations, Nature, 544, 475–478, https://doi.org/10.1038/nature22069, 2017.
Tazen, F., Diarra, A., Kabore, R. F. W., Ibrahim, B., Bologo/Traoré, M., Traoré, K., and Karambiri, H.: Trends in flood events and their relationship to extreme rainfall in an urban area of Sahelian West Africa: The case study of Ouagadougou, Burkina Faso, J. Flood Risk Manag., 12, e12507, https://doi.org/10.1111/jfr3.12507, 2018.
Tramblay, Y., Bouvier, C., Ayral, P.-A., and Marchandise, A.: Impact of rainfall spatial distribution on rainfall-runoff modelling efficiency and initial soil moisture conditions estimation, Nat. Hazards Earth Syst. Sci., 11, 157–170, https://doi.org/10.5194/nhess-11-157-2011, 2011.
Turko, M., Gosset, M., Kacou, M., Bouvier, C., Chahinian, N., Boone, A., and Alcoba, M.: Rainfall Measurement from Commercial Microwave Links for Urban Hydrology in Africa: A Simulation Framework for Sensitivity Analysis, J. Hydrometeorol., 22, 1819–1834, 2021.
Williams, D. S., Máñez Costa, M., Sutherland, C., Celliers, L., and Scheffran, J.: Vulnerability of informal settlements in the context of rapid urbanization and climate change, Environ. Urban., 31, 157–176, https://doi.org/10.1177/0956247818819694, 2019.
Yengoh, G. T., Fogwe, Z. N., and Armah, F. A.: Floods in the Douala metropolis, Cameroon: attribution to changes in rainfall characteristics or planning failures?, J. Environ. Plann. Man., 60, 204–230, https://doi.org/10.1080/09640568.2016.1149048, 2017.
Yuan, Y., Chen, S. S., and Miao, Y.: Unmanaged Urban Growth in Dar es Salaam: The Spatiotemporal Pattern and Influencing Factors, Sustainability, 15, 10575, https://doi.org/10.3390/su151310575, 2023.
Zanchetta, A. and Coulibaly, P.: Recent Advances in Real-Time Pluvial Flash Flood Forecasting, Water, 12, 570, https://doi.org/10.3390/w12020570, 2020.
Zhang, C., Huang, H., and Li, Y.: Analysis of water accumulation in urban street based on DEM generated from LiDAR data, Desalination Water Treat., 119, 253–261, https://doi.org/10.5004/dwt.2018.22049, 2018.
Zheng, X., Maidment, D. R., Tarboton, D. G., Liu, Y. Y., and Passalacqua, P.: GeoFlood: Large-Scale Flood Inundation Mapping Based on High-Resolution Terrain Analysis, Water Resour. Res., 54, 10013–10033, https://doi.org/10.1029/2018WR023457, 2018.
Zhenyu, X. and Olivier, B.: Conception des réseaux d'assainissement: Pluies de projet et norme NF EN 752-2, Rev. Eur. Génie Civ., 9, 401–413, https://doi.org/10.1080/17747120.2005.9692762, 2005.
Zhu, Z., Chen, Z., Chen, X., and He, P.: Approach for evaluating inundation risks in urban drainage systems, Sci. Total Environ., 553, 1–12, https://doi.org/10.1016/j.scitotenv.2016.02.025, 2016.