the Creative Commons Attribution 4.0 License.
the Creative Commons Attribution 4.0 License.
 | 21 Mar 2024
A new approach for drought index adjustment to clay-shrinkage-induced subsidence over France: advantages of the interactive leaf area index
Sophie Barthelemy
Bertrand Bonan
Jean-Christophe Calvet
Gilles Grandjean
David Moncoulon
Dorothée Kapsambelis
Séverine Bernardie
Clay shrinkage, which consists of a reduction in the volume of clay soils during dry periods, can affect buildings and cause subsidence damage. In France, losses due to subsidence are estimated at more than EUR 16 billion for the period 1989–2021 (CCR, 2021) and are expected to increase under the effect of climate warming. This work aims to improve the current understanding of the conditions triggering subsidence by proposing an innovative drought index. We use a daily soil wetness index (SWI) to develop a new annual drought index that can be related to subsidence damage. The SWI is derived from simulations of soil moisture profiles from the interactions between soil–biosphere–atmosphere (ISBA) land surface model developed by Météo-France. The ability of the drought index to correlate with insurance claim data is assessed by calculating the Kendall rank correlation over 20 municipalities in France. The insurance data, aggregated by year and municipality, are provided by the Caisse Centrale de Réassurance (CCR). A total of 1200 configurations of the drought index are considered. They are generated by combining different calculation methods, ISBA simulation settings, soil model layers, and drought percentile thresholds. The analysis includes a comparison with the independent claim data of six additional municipalities and with a record of official “CatNat” (the French national natural disaster compensation scheme) decrees, useful for the analysis. The best results are obtained for drought magnitudes based on SWI values of the 0.8-to-1.0 m deep soil layer, an ISBA simulation with interactive leaf area index (LAI), and consideration of low drought SWI percentile thresholds. Comparison with claim data shows that drought magnitude is able to identify subsidence events while being spatially consistent. This drought magnitude index provides more insight into subsidence triggers while benefiting from advanced land surface modeling schemes (interactive LAI, multilayer soil). This work paves the way for more reliable damage estimates.
- Article
(4364 KB) - Full-text XML
-
Supplement
(831 KB) - BibTeX
- EndNote


Clay shrink–swell is the change in volume of clayey soils in response to changes in soil moisture. This phenomenon is related to the high affinity of certain clay minerals commonly found in soils for water molecules.
These minerals, structured in aggregates, swell and shrink under wet and dry conditions, respectively (Bronswijk, 1989). In temperate European regions such as in France, soils are in a hydrated state for most of the year, which means that exceptional movements occur during droughts (Cojean, 2007). On the other hand, surface soil moisture variations result from soil–atmosphere interactions. Precipitation brings in water, only some of which infiltrates into the soil, while evaporation causes water loss. Vegetation affects both water inputs, by intercepting precipitation and preventing some of it from reaching the soil surface, and water outputs, through root water uptake and transpiration (Tessier et al., 2007).
Shrinking ground movements caused by droughts can affect buildings through their foundations, causing what is known as subsidence damage (Doornkamp, 1993). The damage is physically caused by the inability of a building to accommodate a relative displacement of its various parts, leading to structural failure. This relative displacement observed during droughts is caused by the different behavior of exposed shrinking and sheltered soils. The latter are immobile due to their constant moisture content. Local factors that increase spatial differences in soil moisture, such as the presence of vegetation, significant exposure to solar radiation, or a deficient domestic drainage system, are known to exacerbate subsidence (Page, 1998).
In France, subsidence losses were reported after the 1976 summer drought. A few years later, hundreds of thousands of houses were affected by the 1989 drought, which led to the inclusion of this peril in the French national natural disaster compensation scheme (CatNat) (Salagnac, 2007). Today, subsidence is still covered under the CatNat regime, where it is the second most costly peril after floods. Between 1989 and 2021, losses amounted to more than EUR 16 billion (CCR, 2021). Historically, the southwest of France has been the most exposed to subsidence. However, a significant number of events have been reported in the northeast since 2016 (CCR, 2022), showing a geographical expansion of the importance of subsidence in France. Since then, the cost of subsidence costs has averaged EUR 1 billion per year and even exceeded EUR 2 billion in 2022, which was marked by an exceptional drought (Toreti et al., 2022).
Several studies on subsidence damage (e.g., Crilly, 2001) have shown that single-family houses are the most vulnerable type of building because they tend to have shallow foundations. In 2019, approximately 19 million single-family houses were identified in France, more than half of which are located in zones with a medium to high exposure to clay shrinkage (MTES, 2021a). In addition, research led by Météo-France, the French meteorological service, within the CLIMSEC project (https://www.umr-cnrm.fr/spip.php?article605, last access: 11 March 2024) on the impact of climate change on soil water resources provided insight into climate-change-induced drought trends for the country (Vidal et al., 2010, 2012). It was shown that the duration and spatial extent of drought events affecting soils are bound to increase as a result of rising air temperatures and changes in the precipitation regime.
In this context, both policymakers and the insurance industry need more accurate predictions of subsidence losses. Research is needed to develop a better understanding of this phenomenon and of its financial consequences.
Subsidence depends on predisposing factors, such as the type of clayey soil or land use, and on triggering factors. The first studies to investigate the dependence of clay-shrinkage-induced subsidence on climate (Harrison et al., 2012; Corti et al., 2009, 2011) confirmed the ability of drought to trigger subsidence. These analyses were based on precipitation and air temperature data and recommended the use of land surface models (LSMs) as they provide more detailed information on droughts. In the wake of these findings, several works focusing on subsidence in France have used the soil wetness index (SWI) outputs of the interactions between soil–biosphere–atmosphere (ISBA) land surface model (LSM; Noilhan and Planton, 1989; Noilhan and Mahfouf, 1996) developed by Météo-France, in a simplified configuration (monthly averages, homogeneous vegetation and soil). This product, called “SWI uniforme”, is also used for drought monitoring in the CatNat regime. However, the criterion based on this SWI uniforme product for the promulgation of decrees has changed several times, making it impossible to link the history of decrees to quantitative drought characteristics. Using SWI uniforme, a number of studies have assessed the impact of climate change on subsidence costs (Gourdier and Plat, 2018; CCR and Météo-France, 2018; Covéa and RiskWeatherTech, 2022). All of these papers concluded that subsidence-related costs would increase, but no consensus was reached on the magnitude of the increase. Other studies attempted to improve the predictive power of subsidence damage models using advanced machine learning techniques (Heranval et al., 2022; Ecoto and Chambaz, 2022; Charpentier et al., 2022).
Motivated by the above context, a new drought index is proposed in this study, which is adapted to clay-shrinkage-induced subsidence damage. The novelty of the present work lies in the analysis of simulations using a version of the ISBA LSM with an extended vegetation representation. The index is based on soil moisture simulations from a version of ISBA capable of simulating the details of the soil moisture profile together with an interactive vegetation leaf area index (LAI) and is adjusted by comparison with insurance data. The objective is to determine (1) which soil layers should be considered for subsidence damage prediction and (2) the extent to which interactive LAI is needed.
In Sect. 2, all data sets and the methodology for computing the drought index are presented. In Sect. 3, we detail the obtained optimal drought index and its relationship to the subsidence damage data. Comparison with an independent data set and with a data set of CatNat decrees is included. All of these results are discussed in Sect. 4 before concluding in Sect. 5.
The objective of this work is to create a new soil drought index that is adapted to induced subsidence losses. We here describe how the indices are computed from “LAI_clim” and “LAI_model” soil moisture simulations and how they are evaluated through a pairwise ranking with the insurance damage data. A comparison with independent data is included in the analysis. The methodology is summarized as a flowchart in Fig. 1.
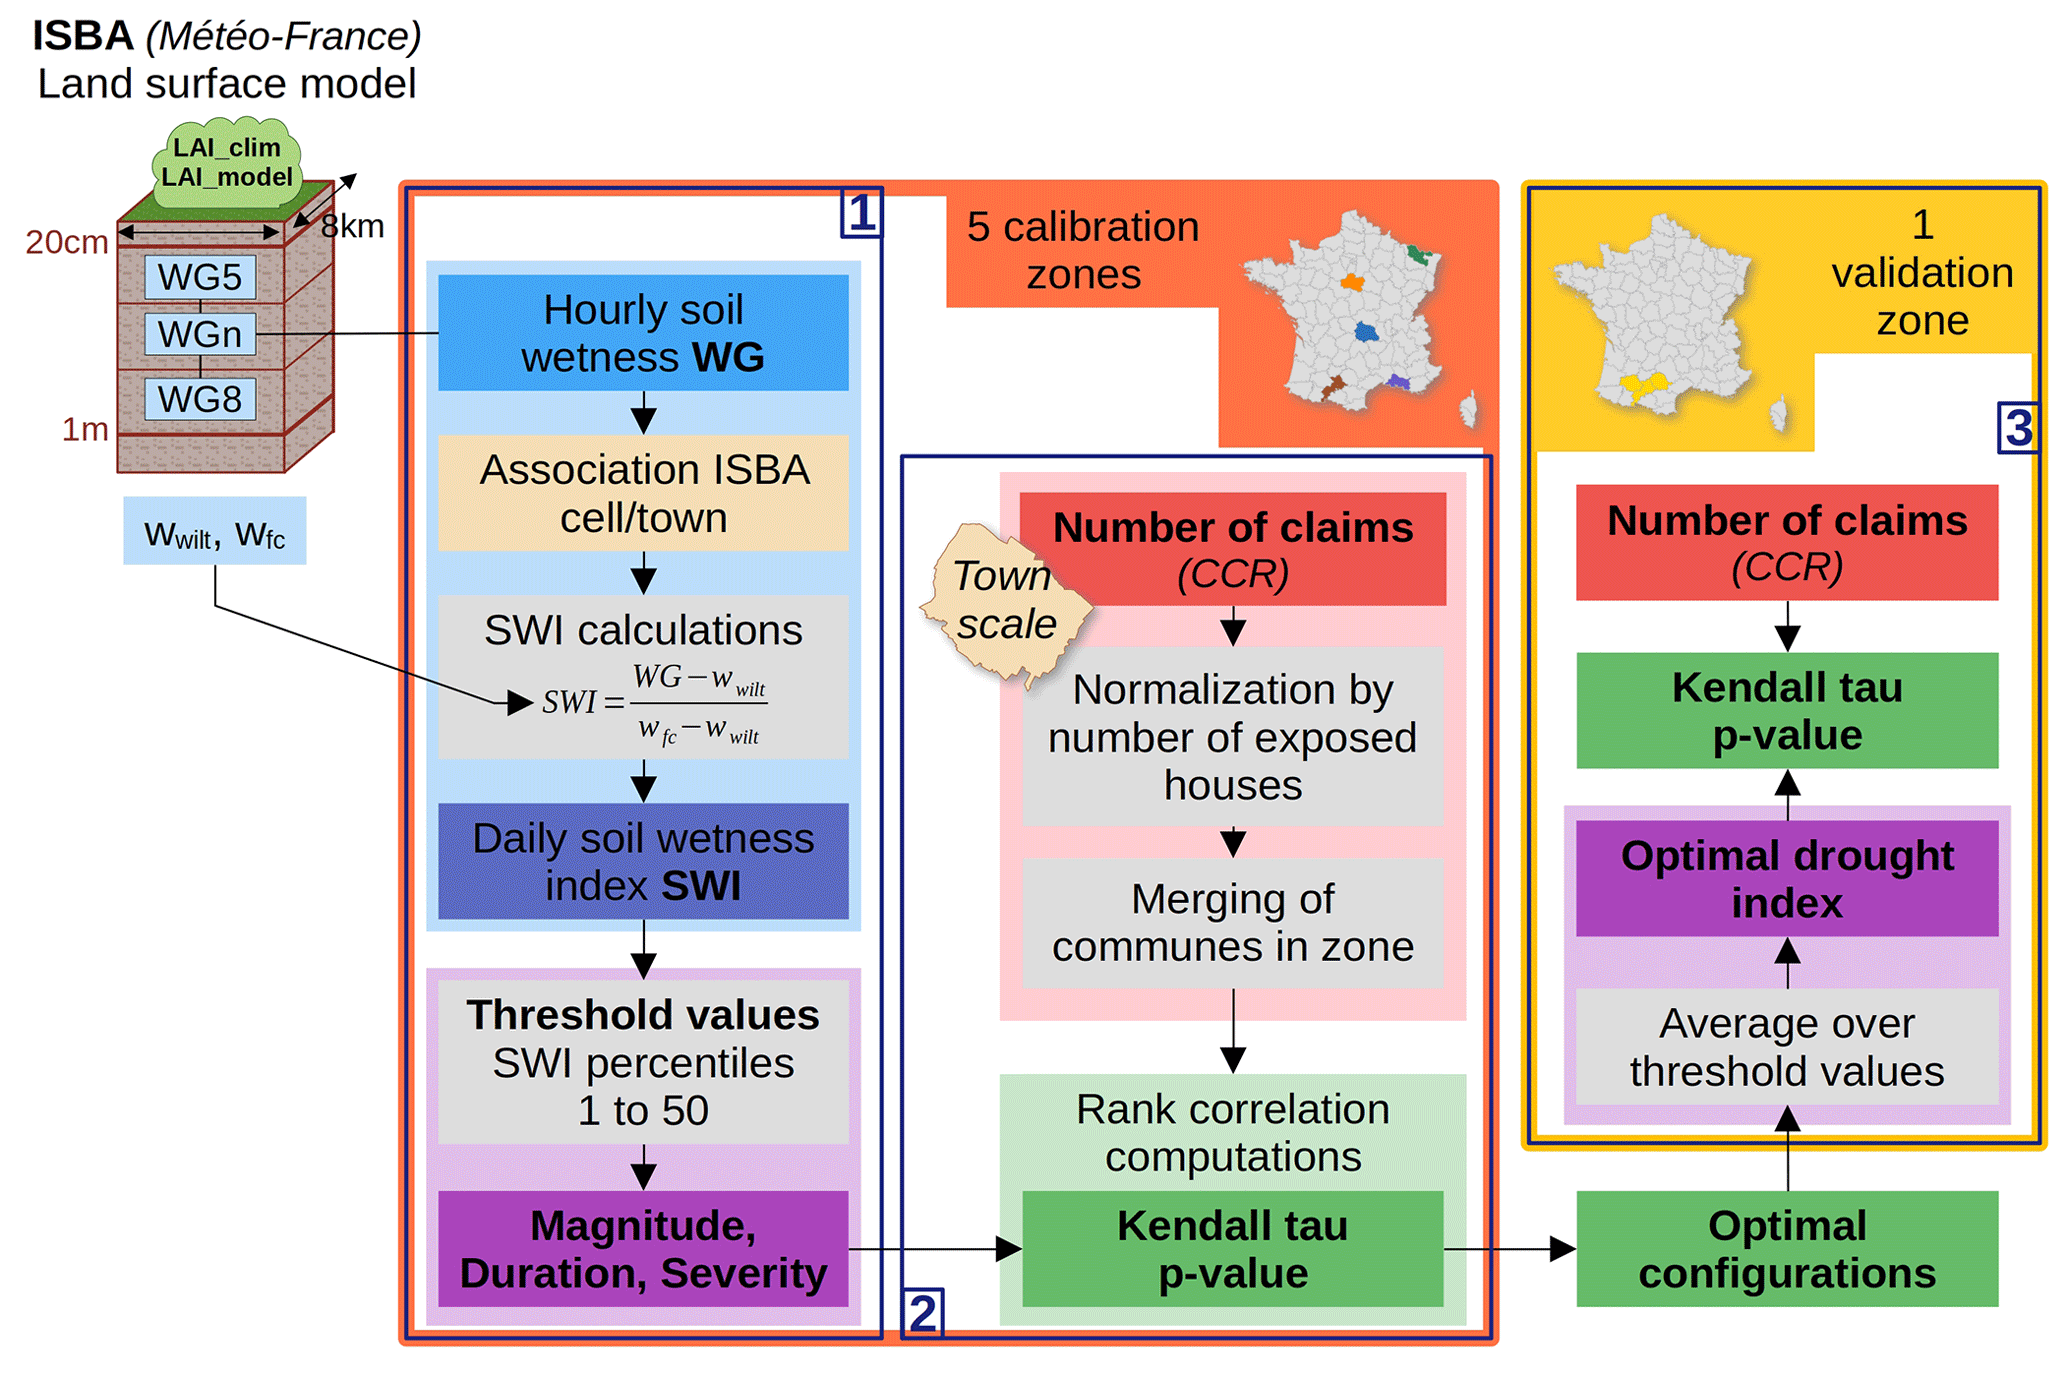
Figure 1Flowchart of the methodology deployed in this study with focus on the three main steps.
2.1 Soil moisture simulations
Soil moisture is simulated by ISBA within version 8.1 of the SURFEX (Surface Externalisée) modeling platform developed by Météo-France for numerical weather prediction and climate modeling (Masson et al., 2013; Le Moigne et al., 2020). ISBA calculates surface water and energy budgets in response to an atmospheric forcing. Soil moisture at a given time results from the balance between water inflows, from precipitation, and outflows, through runoff, infiltration, and evaporation. ISBA covers the entire French metropolitan area, on an 8 km meshed grid. It is used operationally for monitoring water resources in the SAFRAN-ISBA-MODCOU (SIM) hydrological suite (Habets et al., 2008), together with a meteorological analysis and a hydrogeological model. ISBA is used here “offline”; i.e., there is no feedback from the surface to the atmosphere. The SAFRAN reanalysis (Durand et al., 1993; Quintana-Seguí et al., 2008) is used as the atmospheric forcing.
A multilayer version of ISBA, ISBA-DIF (Boone et al., 2000; Decharme et al., 2011), with a diffusive scheme is used. The approach is to divide the soil column into layers whose respective thicknesses increase with depth to better represent hydrological processes, since important water and temperature gradients at the surface require a finer mesh. The number of layers considered is proportional to the rooting depth of the vegetation, reaching a maximum of 10 layers (adding up to 2 m depth) in the case of trees. It is important to analyze layers at different depths because moisture variations depend on both the distance to the surface and the vegetation roots.
As explained in Decharme et al. (2011), soil water-holding capacity and soil hydraulic parameters such as porosity, matric potential at saturation, and saturated hydraulic conductivity are related to soil texture in the model through empirical pedotransfer functions. The latter are described in Noilhan and Lacarrère (1995) and derived from Clapp and Hornberger (1978). In ISBA, texture is considered to be homogeneous throughout the whole soil column for each grid point. This texture is represented by clay, sand, and silt contents derived at the kilometer resolution from the Harmonized World Soil Database (HWSD) version 1.2 (Nachtergaele et al., 2012). Because soil texture is averaged within a model grid cell, this approach provides a large-scale representation but is not representative of what may be found on a house lot. Inferring the hydromechanical behavior of clayey soils from this information alone would be problematic. This is not the purpose of the drought index developed in this study.
To account for spatial variability within a grid cell, ISBA first runs separately for 12 generic plant functional types called patches (bare soil, rock, permanent snow, deciduous broadleaf trees, evergreen broadleaf trees, coniferous trees, C3 crops, C4 crops, irrigated C4 crops, grassland, tropical grassland, and wetlands). The runs are then aggregated by averaging the output variables, weighting each patch by its respective fraction in the grid cell. The maximum soil depth of a patch depends on the rooting depth of the corresponding vegetation type and varies from patch to patch. The geographic distribution of the patches as well as the land surface parameters is obtained from the ECOCLIMAP-II database at kilometer resolution (Faroux et al., 2013). The present work focuses on layers simulated for all patches, as we aim to assess differences induced only by depth. These conditions were met for four soil layers: 0.2–0.4, 0.4–0.6, 0.6–0.8, and 0.8–1.0 m, soil layers 5, 6, 7, and 8, respectively. Accordingly, we based our analysis on these four model layers. In this study, we are limited to a maximum depth of 1 m due to the patch continuity requirement. One of the direct consequences of climate warming is the spread of deep soil desiccation under severe and recurrent drought conditions. This can reach soil layers deeper than 1 m depending on the close environment configuration. Knowing that the amplitude of soil moisture variations decreases with depth (Ravina, 1983), a drought that reaches deep soil layers will intensively dry out shallow layers. Theoretically, such an event can be detected with surface layer information alone. However, it should be noted that drying occurs with a time lag that increases with depth. In this analysis, we have verified that even for the deepest model layers, the drought observed in a given year never overlaps with the following year, which would distort the index calculations. This assumption may be questioned under future climatic conditions, considering that the frequency and intensity of droughts in France will increase.
Because vegetation plays an important role in near-surface soil moisture variations, the ISBA model includes a representation of photosynthesis using a CO2-responsive stomatal conductance scheme, ISBA-A-gs (Calvet et al., 1998). This scheme has been improved over time to account for specific plant responses to drought (Calvet, 2000; Calvet et al., 2004).
In the operational SIM product (SURFEX v8.0), the leaf area index (LAI), which quantifies the leaf surface available for exchange with the atmosphere, is prescribed from ancillary data. For each grid point, the LAI changes every 10 d, and the cycle is repeated every year, based on a climatology established from SPOT-VGT satellite data for the period from 1999 to 2005. A first simulation with this configuration is tested in this study and is called LAI_clim.
In the ISBA-A-gs configuration, the LAI is not prescribed but simulated from the modeled leaf biomass, taking into account the mass-based leaf nitrogen concentration (Calvet and Soussana, 2001). Phenology is driven by photosynthesis. Since the modeled photosynthesis depends on soil moisture, leaf temperature, solar radiation, and air humidity, all environmental conditions can affect the simulated LAI. Based on this concept, the LAI is updated daily. The modeled LAI has been validated at global (Gibelin et al., 2006), continental (Szczypta et al., 2014), and regional (Brut et al., 2009) scales. In this work, a second simulation is tested with this configuration, which we call LAI_model.
Each simulation provides hourly volumetric soil moisture data for four 0.2 m thick soil layers from 0.2 to 1.0 m depth. Since we are focusing on longer-term droughts, the diurnal periodicity of the data is not required, and the hourly soil moisture values are averaged to daily values. In order to consider a single definition of drought, independent of the fact that water-holding capacity varies with soil texture, we convert volumetric soil moisture to soil wetness indices (SWIs). While volumetric soil moisture is expressed in m3 m−3, SWI is unitless. SWI is derived by rescaling volumetric soil moisture between wilting point wwilt and field capacity wfc as illustrated in Fig. S1 (see the Supplement). These two quantities are derived from the model soil texture through soil pedotransfer functions (Boone et al., 1999; Decharme et al., 2013). We refer to the SWI of layers 5, 6, 7, and 8 as SWI5, SWI6, SWI7, and SWI8, respectively.
2.2 Natural disaster (CatNat) decree database
In France, financial losses to insured property following a natural catastrophe may be covered by a national compensation scheme, the “régime d'indemnisation des catastrophes naturelles” (CatNat regime). Compensation under this scheme is, with a few exceptions, subject to the official recognition of the state of natural disaster through the publication of a decree, an “arrêté de reconnaissance de l'état de catastrophe naturelle” (CatNat decree), for a given year and municipality. Details of each CatNat decree (accepted and rejected requests) are available as individual files on the CCR website (https://catastrophes-naturelles.ccr.fr/les-arretes, last access: 11 March 2024). For this analysis, we retrieved and merged these data. This information is relevant for our research because subsidence damage has only been compensated by this scheme since 1989.
Since 2000, the publication of a CatNat decree has been conditional on meeting a geotechnical criterion and a meteorological criterion. The geotechnical condition requires the municipality to have at least 3 % of its surface mapped as shrinkable clay, based on the Bureau de Recherches Géologiques et Minières (French Geological Survey, BRGM) exposure to clay shrink–swell map. The meteorological condition aims to identify exceptional periods of drought. Its current version requires the 3-month average of SWI uniforme to be the lowest or second lowest of a 50-year reference associated with the same month. This criterion has evolved several times since the creation of the system as the phenomenon has been studied. The condition established in 2000 is a “winter” criterion, based on the rainfall of the winter preceding the drought event. Later, the timing of the successive drought events of 2003, 2011 and 2018 led to the creation of “summer”, “spring”, and “fall” criteria that were added to the existing criterion.
2.3 Normalized insurance data
The insurance data used in this study are provided by the Caisse Centrale de Réassurance (CCR), the French public reinsurance company that manages a large database of its clients' contributions. It consists of the number of subsidence claims aggregated per year and per municipality, from 2000 to 2018. By “municipality”, we mean a commune, the smallest administrative unit in France. Subsidence claims correspond to accepted “legitimate claims”, after a national recognition step of CatNat requests. The representativeness of the data varies over the years and the municipalities considered, depending on the proportion sent by insurers. Total and average annual costs were also provided by CCR, but we focused on the number of claims, which gave more satisfactory results. The data are aggregated at the municipal level for confidentiality reasons. In addition, this is an official and frequently used zoning classification, so there are a lot of additional data available.
For normalization purposes, the large number of subsidence claims is divided by the number of single-family houses in the municipality located in areas prone to subsidence. This information comes from a data set developed by the French Ministry of Ecological Transition (MTES/CGDD/SDES) (MTES, 2021b). It provides the number of houses per municipality in different exposure classes (no exposure, low, and medium to high). The zoning is based on a map of exposure to clay shrink–swell developed by the BRGM (BRGM, 2024), coupling a national susceptibility map (based on geotechnical data and 1:50 000 geological maps) and insurance statistics. We call the new variable obtained after normalization the “normalized number of claims”.
In this study, we use data from 26 municipalities, the locations of which are shown in Fig. 2. Although the spatial resolution of the insurance data leads us to an analysis at the municipal level, we generalize the results by repeating the process for areas exposed to different climates. The study is limited to a selection of municipalities with a significant history of clay shrink–swell losses, since only the dependence on climate is studied (see Sect. 3).
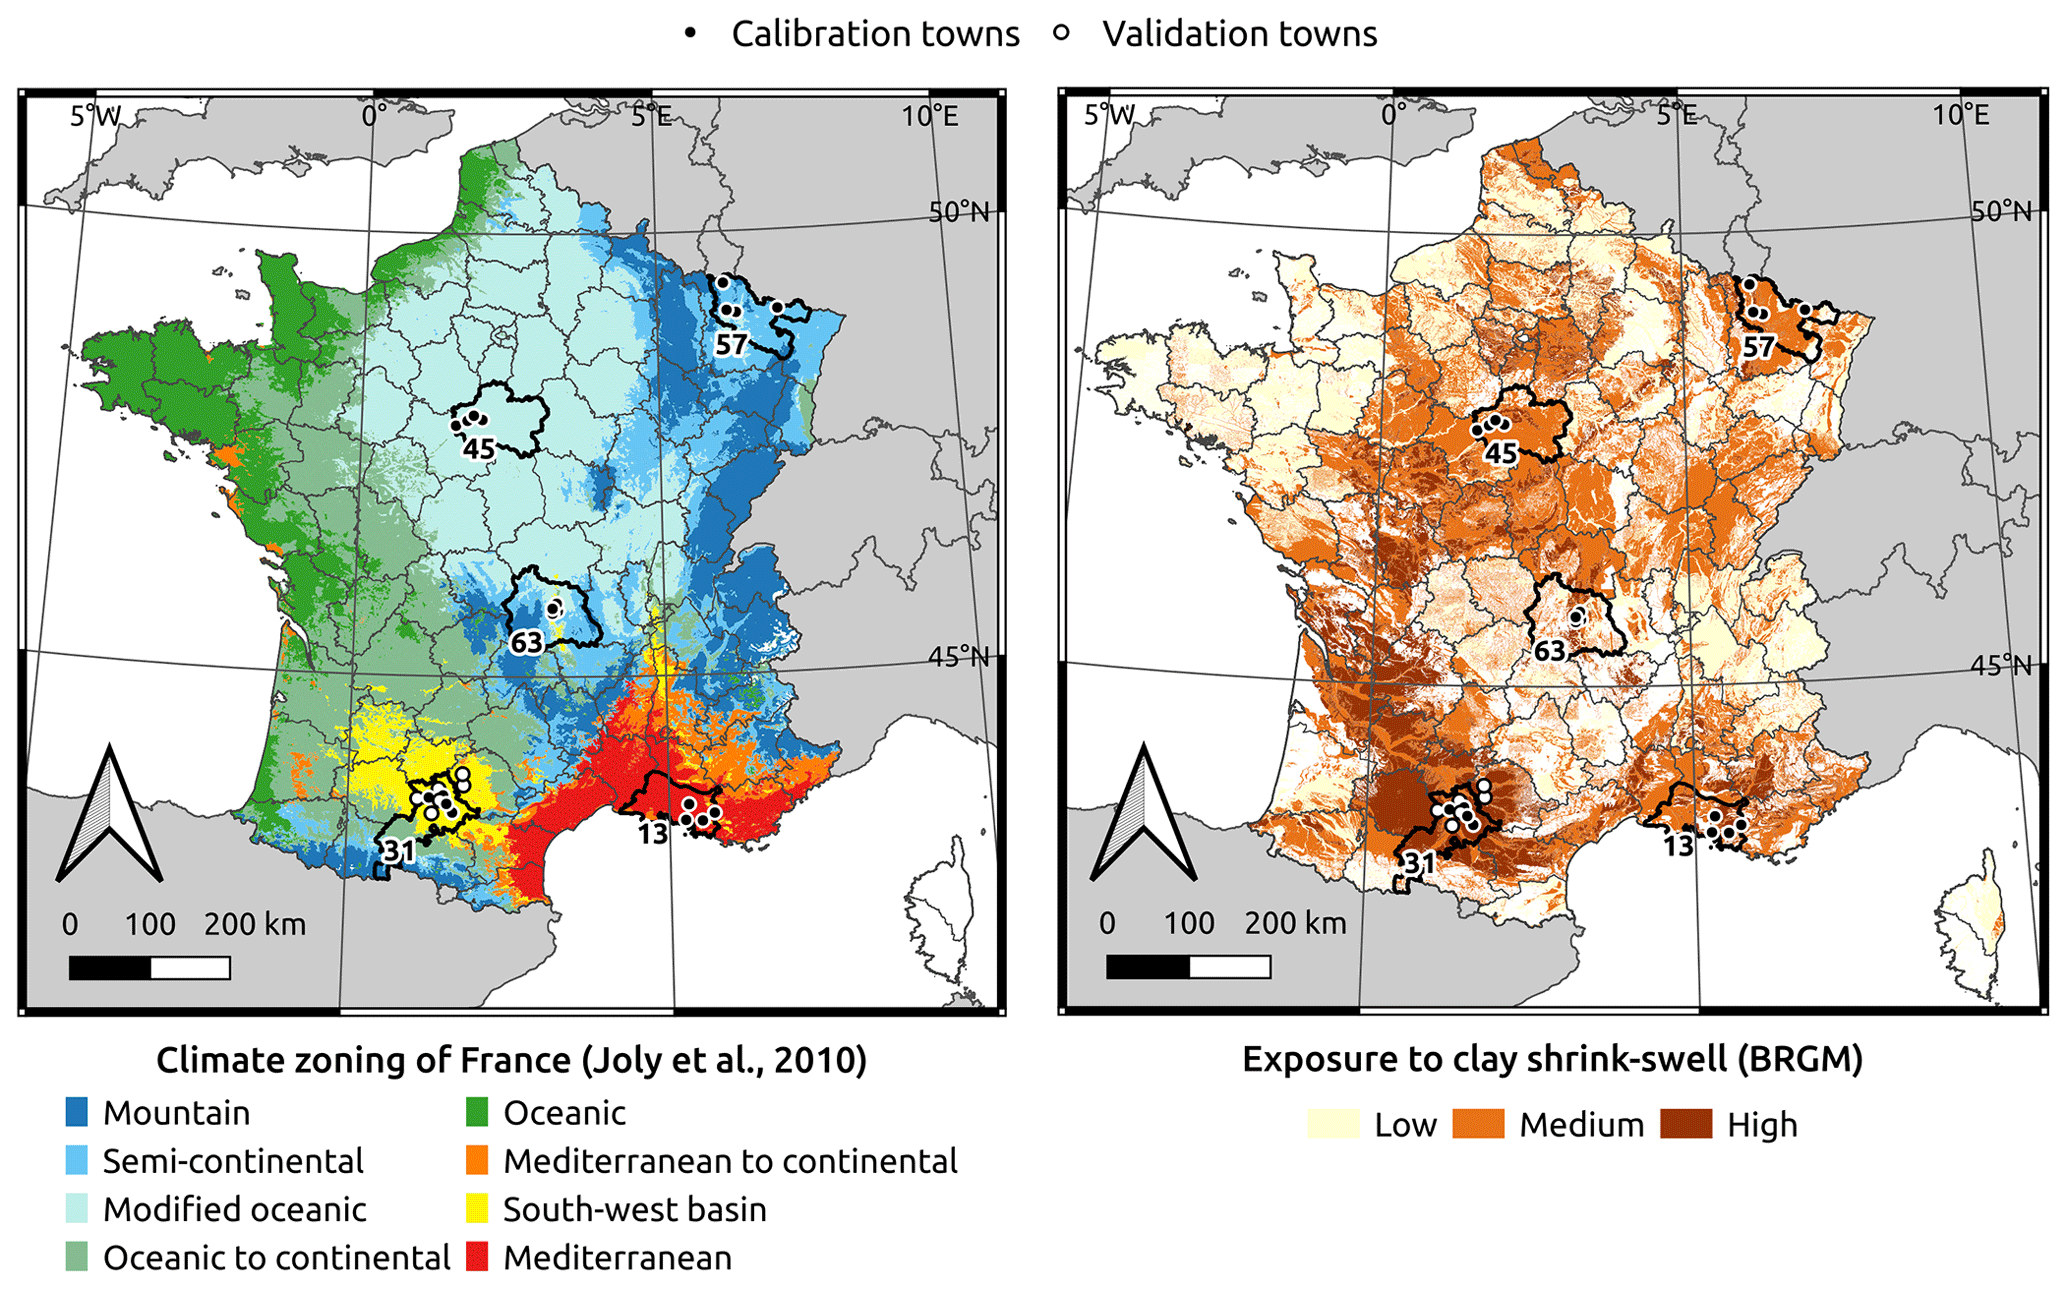
Figure 2Location of the 26 study municipalities, along with a climate (Joly et al., 2010) and clay shrink–swell exposure map (BRGM, 2024). The black markers depict the municipalities used for calibrating the indices, and the white ones are used for validation. Bold lines indicate the five French departments (13, 31, 45, 57, 63) in which are located the calibration subsets (Bouches-du-Rhône, Haute-Garonne, Loiret, Moselle, Puy-de-Dôme).
To investigate the influence of this national recognition stage on the end-of-chain insurance data, we also used the history of accepted and refused national recognition requests for the towns forming our sample. These data were obtained by merging individual decree files downloaded from the CCR website (https://catastrophes-naturelles.ccr.fr/les-arretes, last access: 11 March 2024).
2.4 Drought indices
Providing a universal and quantitative definition of drought is challenging because drought can affect different levels of the hydrological cycle: precipitation, soil moisture, and streamflow (Dracup et al., 1980). Numerous indices characterizing different types of drought are available in the literature. For example, the Standardized Precipitation Index (SPI) (McKee et al., 1993) quantifies meteorological droughts by fitting accumulated precipitation at different timescales to a given distribution. The same methodology has already been adapted for agricultural droughts, where calculations are based on the SWI, creating a standardized soil wetness index (SSWI) (Vidal et al., 2010). As Charpentier et al. (2022) recall from the conclusions of Soubeyroux et al. (2012), the SPI and the SSWI provide complementary information: for example, the 2003 drought over France, which was caused more by a heatwave than a lack of precipitation, is only detected by the SSWI.
Given the nature of the clay shrink–swell phenomenon, we focus here on droughts affecting soil moisture by analyzing the SWI outputs of the ISBA model. LSMs are capable of accounting for the atmospheric forcing, soil and vegetation characteristics, and initial conditions. They are reliable tools for studying soil moisture variations.
Subsidence damage affects several regions located throughout France and is therefore subject to different climates (see Fig. 2 for a climatic zoning of the country). We consider the tipping point for subsidence not as an absolute value of soil moisture but rather as a measure of the deviation from the mean. This definition is consistent with the physical mechanism of subsidence damage, which is related to a difference in soil moisture content relative to its average value (Sect. 1).
In this study, we define droughts as periods in which the value of the daily SWI is below a threshold value. The latter corresponds to a certain percentile of the empirical SWI distribution calculated over a given ISBA grid point. Based on in situ observations in the United States and Canada, Ford et al. (2016) showed that the record length required to obtain stable daily soil moisture distributions ranges from 3 to 15 years. Assuming that these results are applicable to France, our study period of 19 years is sufficient to obtain reliable SWI percentiles. The use of percentiles also avoids the need to standardize SWI values, as the shape of their distributions is quite variable depending on the local climate (D'Odorico et al., 2000; Vidal et al., 2010). In this study we deliberately make no assumption about the triggering drought frequency and therefore consider thresholds ranging from the first percentile to the median.
Once drought periods have been identified using the daily SWI percentile criterion, several options are considered to quantify the drought events. For this purpose, the characteristics of drought events are described in Vidal et al. (2010): severity, duration, and magnitude. We apply this concept to our definition of drought:
-
Severity is the maximum deviation of the SWI from the threshold.
-
Duration is the number of days below the threshold.
-
Magnitude is the sum of the daily SWI deficit values (equivalent to an integral) below the threshold.
All three indices are considered. Given the temporal resolution of the insurance data, we assume only one major drought event per year, as we are working on an annual scale. Therefore, a single index value is calculated each year.
For each municipality, the three indices are computed for two model configurations (LAI_clim and LAI_model), four model soil layers 5 to 8, and 50 SWI percentile values (from 1 to 50). This corresponds to 1200 configurations.
It should be noted that although the conversion from volumetric soil moisture to SWI is useful for unifying the information on a national scale (Fig. S1), it does not affect the magnitude calculations. In fact, the calculations are based on thresholds defined by percentiles of daily soil moisture, the distribution of which is unchanged by the linear transformation that is the conversion to SWI.
2.5 Pairwise ranking of years
To assess the ability of the drought indices to represent subsidence damage for a given year, we compute the Kendall rank correlation coefficient (Wilks, 2006) between the two variables, over the entire study period. The Kendall rank correlation test compares the respective ranks of paired data by counting concordant and discordant pairs. It produces a coefficient ranging from 0 to 1, the Kendall τ, and a p value (the null hypothesis being that the variables are not correlated). This test has the advantage of being nonparametric and robust to extreme values.
To maximize the number of observations used to compute the Kendall τ, we merge data from multiple municipalities to form regional subsets. An association is performed to pair the municipal insurance data with the soil moisture available on the ISBA grid. We compare the soil and vegetation characteristics of all the ISBA cells that are less than 2.5 km from the municipality boundary, ultimately selecting the cell with the highest grass and clay content (most representative of a damaged building environment) as the most representative cell. We choose to base the selection on soil and vegetation rather than distance because we believe that outside of mountainous areas, the atmospheric forcing does not change drastically for two neighboring cells.
For each regional subset, the Kendall τ is computed for all the 1200 possible drought index configurations. The highest Kendall τ values are used to identify optimal configurations. Correlation calculations are performed sequentially for regional subsets and are combined by calculating a mean Kendall τ.
2.6 Validation
The best drought index configuration is then applied to independent data to verify that we avoid overfitting. For this purpose, the drought index is computed for all the municipalities not used in the calibration (forming a validation set) and is confronted with the corresponding normalized number of claims. For further analysis, the optimal drought indices of both calibration and validation sets are sorted into classes and the distributions of the normalized damage counts are compared. Four drought index classes are defined from the calibration set: a first class that includes all zero values (no drought) and three other classes that divide the rest of the population into equal groups. The class delineation is applied to the validation set.
Finally, both the drought index and the normalized insurance data are compared to the set of historical CatNat decrees.
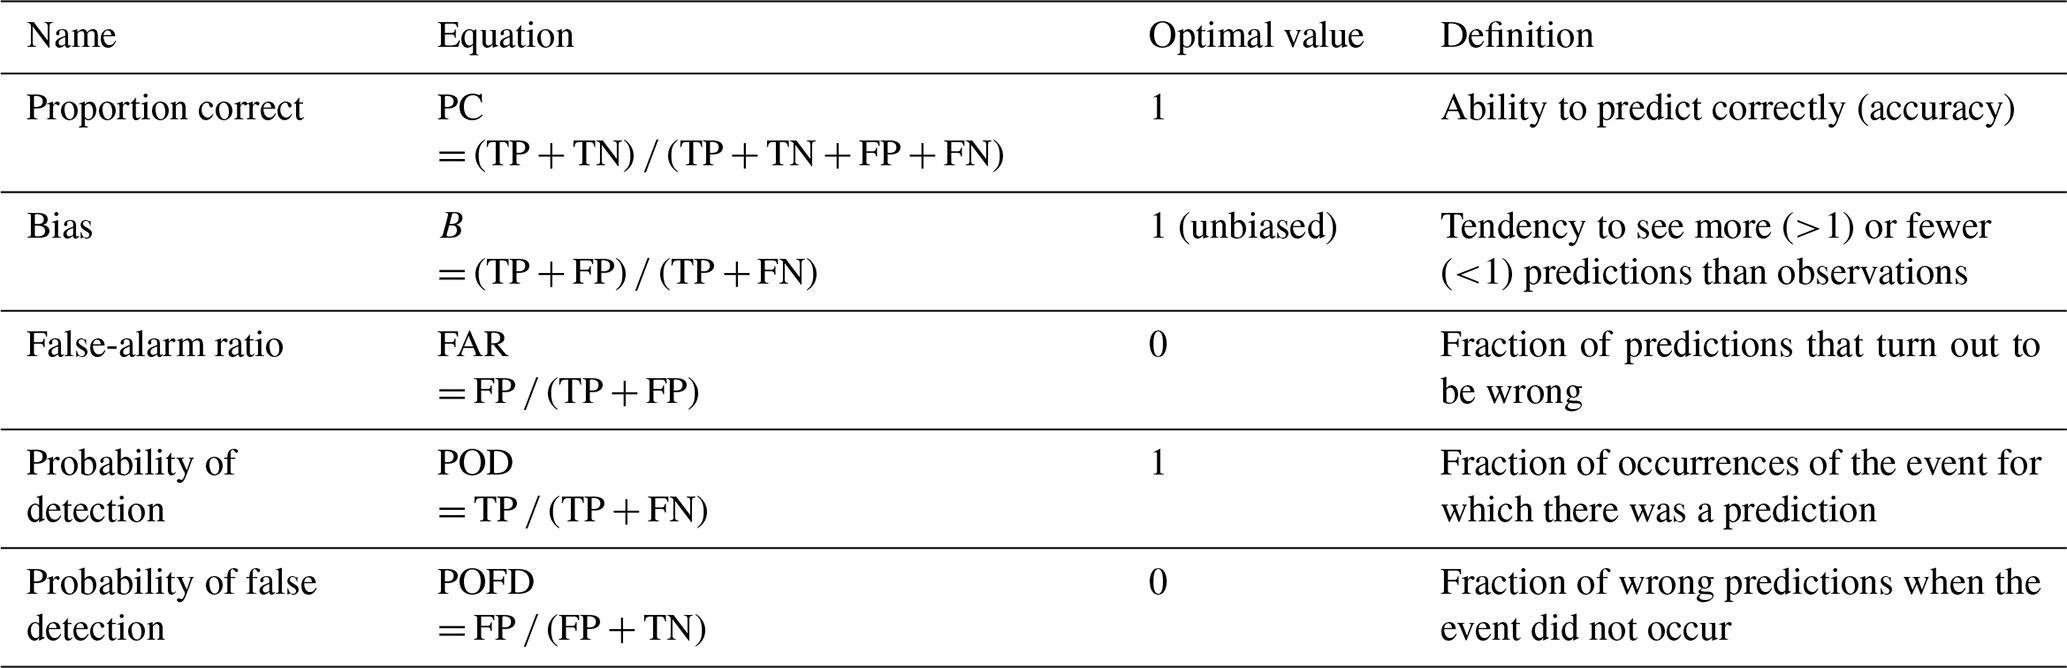
For each subset, we assess the ability of the optimal drought index to predict claims by counting contingencies and deriving scores (Wilks, 2006). First, we transform quantitative optimal drought magnitudes and normalized claim counts into Boolean occurrences of predictions and observations, respectively. The correspondences for each subset are reported in a contingency table. We refer to the four metrics in the contingency table as true positives, true negatives, false positives, and false negatives (TP, TN, FP, and FN, respectively). The performance of the index in identifying damage patterns is then evaluated for each set by calculating scores. From the variety of scores available in the literature, we selected the proportion correct (PC), bias (B), false-alarm ratio (FAR), probability of detection (POD), and probability of false detection (POFD). Each of these metrics is described in detail in Table 1.
Table 1Scores for assessing the performance of the optimal drought magnitude, based on the fractions of true positives, true negatives, false positives, and false negatives (TP, TN, FP, and FN, respectively).
2.7 Study area
The calibration set consists of five subsets of four municipalities distributed throughout France, in different climatic settings (continental, modified oceanic, Mediterranean, and southwest basin, based on the typology proposed by Joly et al., 2010). The validation set merges six municipalities in the southwest basin climate setting, from the same classification. We choose municipalities corresponding to different urban contexts (dense urban to rural) to have a representative sample as Corti et al. (2011) showed that urban centers are not susceptible to subsidence, while discontinuous urban areas are half as vulnerable as rural areas.
The locations of each set, as well as the climate (Joly et al., 2010) and exposure to clay shrink–swell maps (BRGM, 2024), are detailed in Fig. 2. Each calibration subset is referred to as the corresponding French department (administrative subdivision): Bouches-du-Rhône (13), Haute-Garonne (31), Loiret (45), Moselle (57), and Puy-de-Dôme (63).
3.1 Assessment of the drought index configurations
For the calibration set consisting of the five regional subsets, the 1200 drought index configurations are evaluated by measuring the Kendall rank correlation with the normalized number of claims. Figure 3 shows the Kendall τ coefficients averaged over the calibration subsets and by 5th-percentile threshold groups for each drought index type, simulation configuration, and model soil layer. Each group, of equal size, consists of 25 values (5 calibration subsets × 5 thresholds). The maximum p value obtained per group is plotted in the Supplement (Fig. S2).
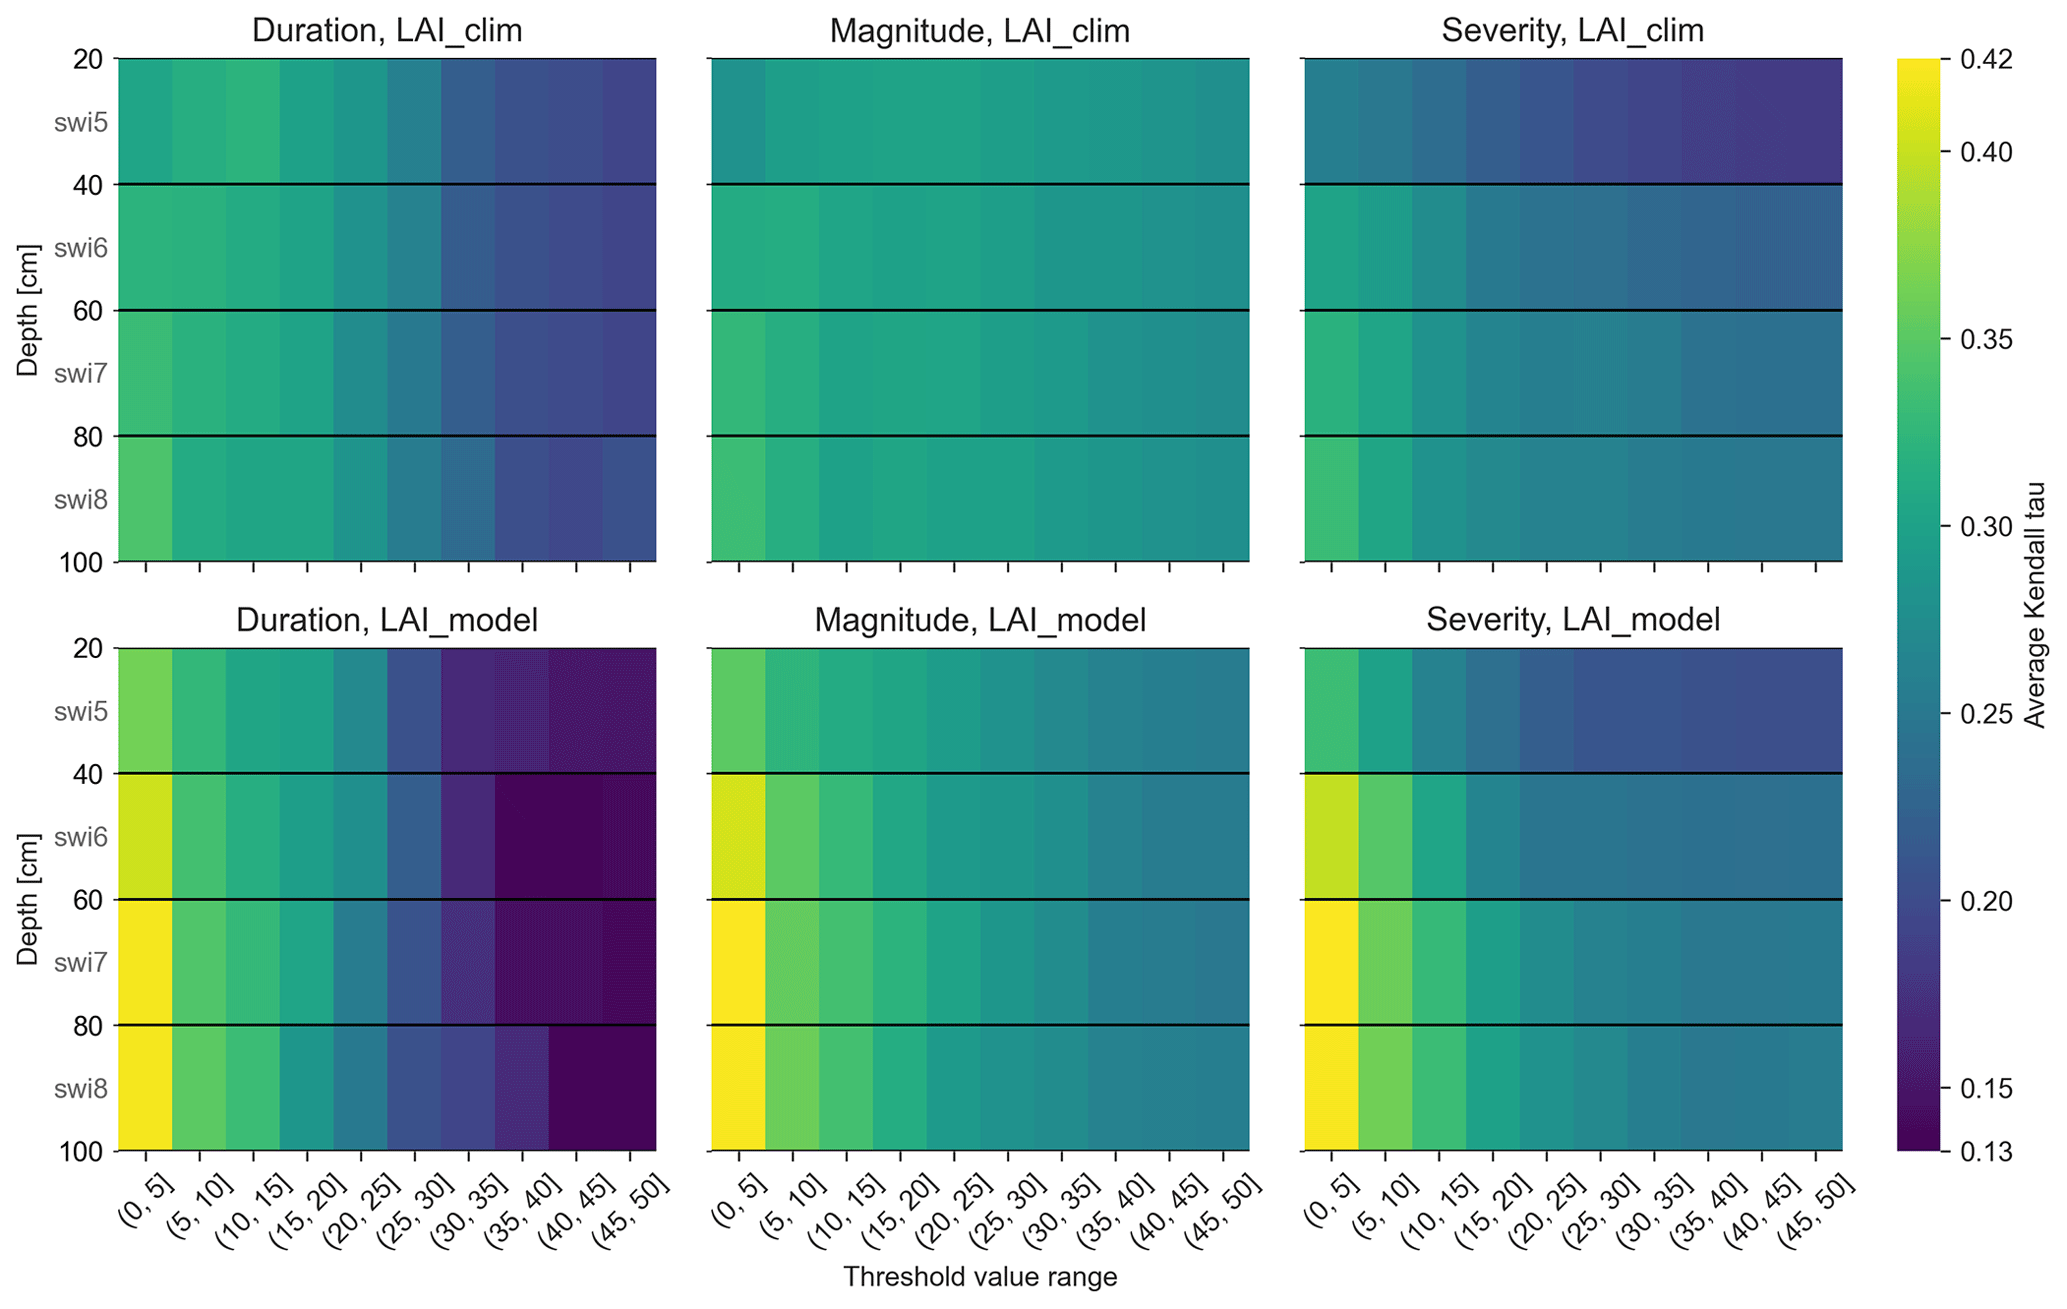
Figure 3Average Kendall τ per group, computing the rank correlation between drought index and normalized number of claims, for all calibration subsets, separating index type (duration, magnitude, severity), model simulation (LAI_clim, LAI_model), model layer (SWI5 to SWI8, i.e., 0.2–0.4 to 0.8–1.0 m), and threshold value range (from 1st to 50th percentiles in groups of five).
Figure 3 shows that the average Kendall τ calculated over the groups ranges between 0.13 and 0.42. Similarly, the maximum p value observed per group ranges between 0.0001 and 1. For both LAI_model and LAI_clim simulations, and especially for the duration index, the results tend to get worse as the thresholds get higher. We also note that the performance of the severity index decreases significantly for the most superficial 0.2–0.4 m model soil layer. The most stable index is the magnitude index. For extreme thresholds (1st to 5th percentiles), there is little difference between the three indices, and the average Kendall τ increases with the depth of the soil layer. Finally, the highest correlation coefficients are obtained with the LAI_model simulation, extreme thresholds, and layers below 0.6 m (model soil layers 7 and 8). We also observe with the LAI_model configuration that the p value of each group is always below 0.001 for model soil layer 8 (0.8–1.0 m); cf. Fig. S2 in the Supplement.
3.2 Optimal drought index
We define an optimal drought index from the LAI_model simulation, the SWI of the deepest model soil layer (layer 8, from 0.8 to 1.0 m), and averaged magnitudes computed with thresholds corresponding to the 1st to 5th percentiles. This index is hereafter referred to as the optimal drought magnitude.
Figure 4 plots the average optimal drought magnitude of the five calibration subsets against the corresponding average normalized number of claims over the entire study period. The error bars indicate the amplitude of the values (minimum and maximum of the variable in the subset). The same data are also presented as a scatterplot in the Supplement (Fig. S3).
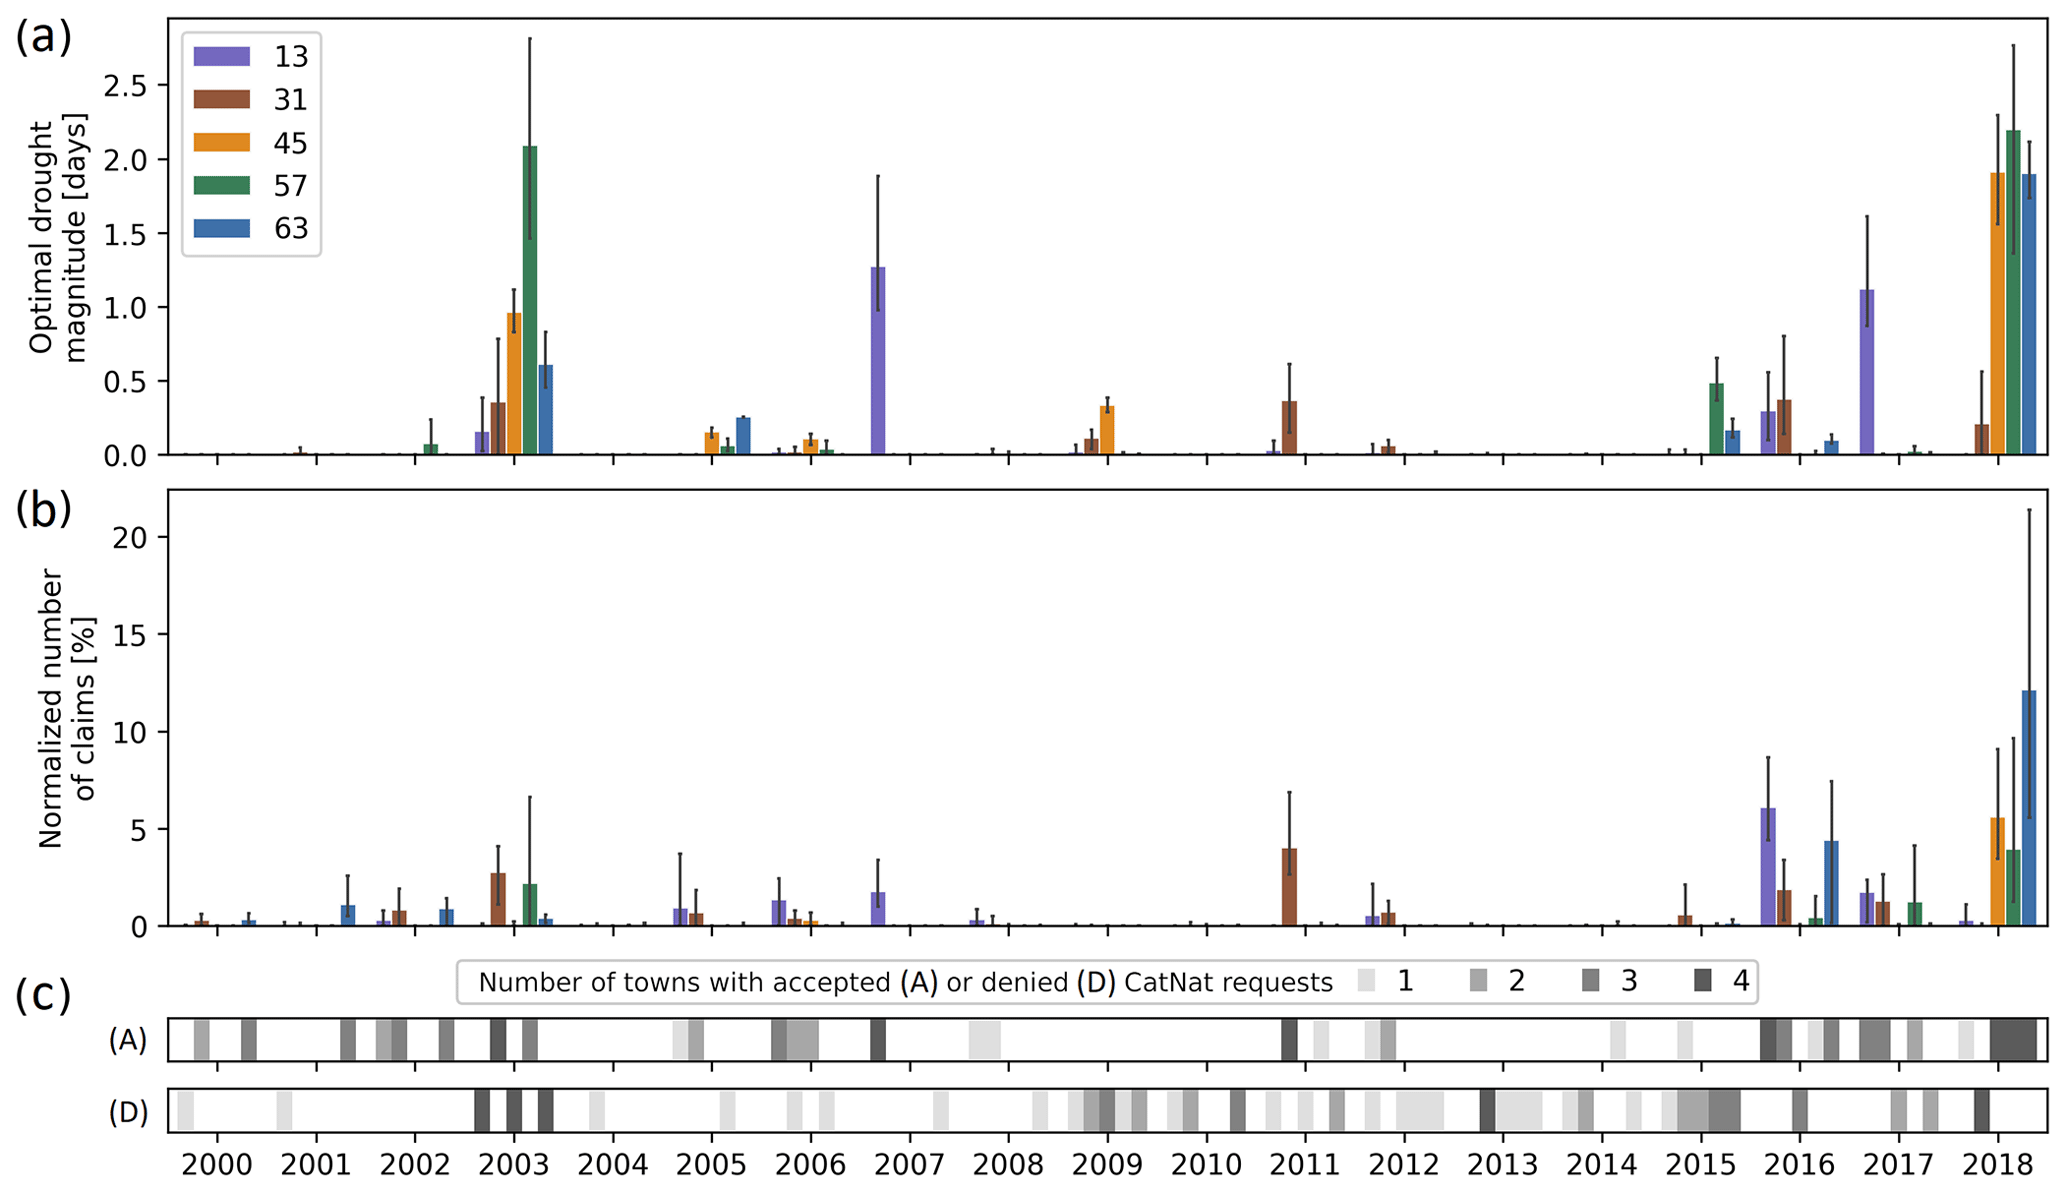
Figure 4Optimal drought magnitude (a) and normalized number of claims (b) averaged by calibration subset and numbers of towns per subset (c) with accepted (A) or denied (D) CatNat requests. The error bars indicate the amplitude of values.
The CatNat decrees issued over the period are also shown in Fig. 4, as gray bars whose shading changes with the number of decrees per year and subset. Over the whole period, we count 20, 25, 6, 12, and 16 decrees promulgated for subsets 13, 31, 45, 57, and 63, respectively.
From Fig. 4, we can see that the optimal drought index identifies 2003 and 2018 as the most important drought years for almost all subsets. This pattern appears in the normalized number of claims with some gaps. Discrepancies are also identified for years with zero drought magnitude when claims were reported, with the example of 2005 for Department 13. Some local drought events are detected by both magnitude and insurance data, such as 2011 for Department 31. The amplitude of the magnitudes indicates that when a drought is detected, every municipality in the calibration subset is affected. This means that the index is spatially consistent. Overall, there is a good correspondence between zero magnitudes and the absence of damage. Furthermore, we find a very strong association between normalized damage counts and CatNat decrees.
The number of rejected claims is also shown in Fig. 4. Situations in the calibration and validation sets can be identified where rejected claims could be the source of inconsistencies between the drought index and claims. In particular, all the inconsistencies noted between index and claims (positive index and no claims) observed in 2003 and 2018 can be explained by this factor (three inconsistencies in 2003 and one in 2018).
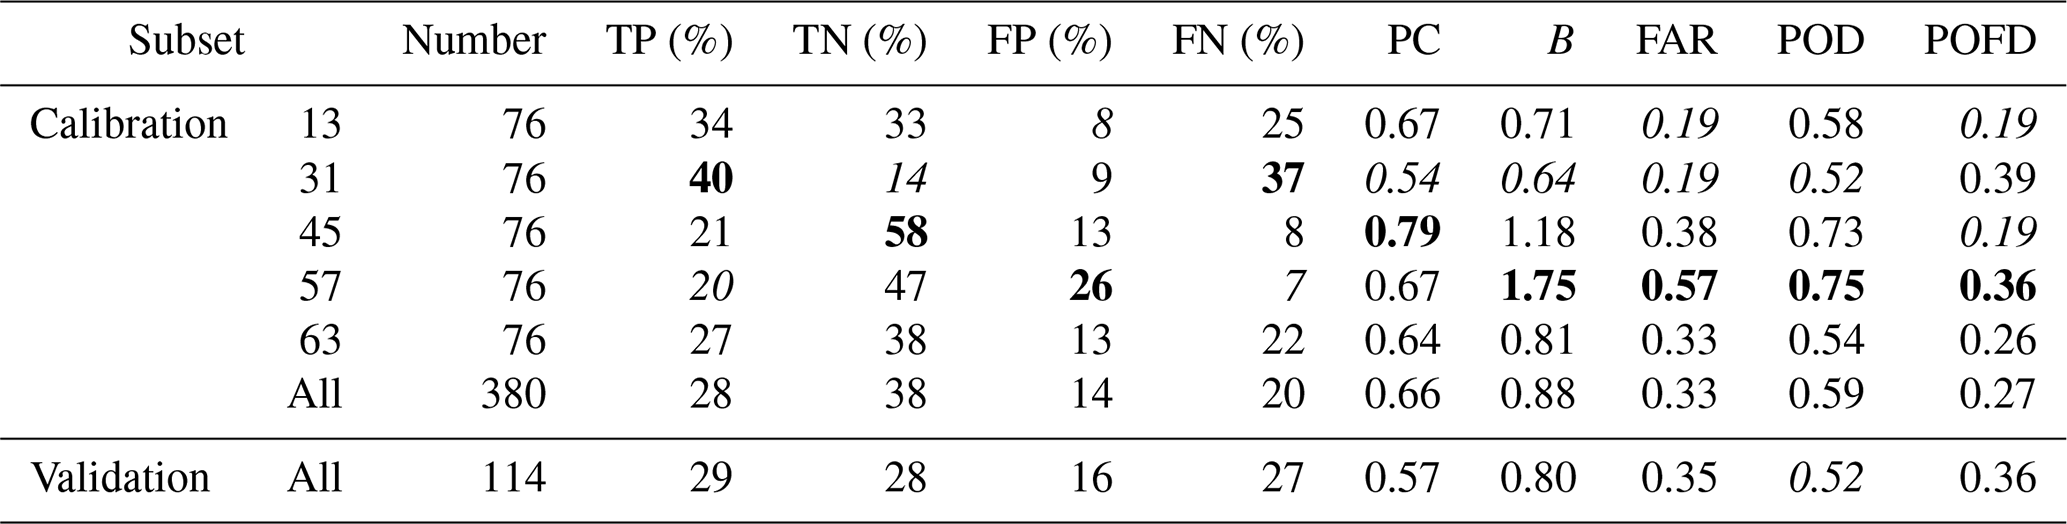
The predicted counts and scores calculated for all subsets are shown in Table 2. For all calibration subsets, the PC and POD are above 0.5 and the FAR and POFD are below 0.5 (except for the high FAR of 0.57 for zone 57). On the other hand, the obtained bias ranges between 0.64 and 1.75, with the subset having the smaller bias (closest to 1) being subset 45 (B=1.18). The scores are averaged when the calibration subsets are merged, compensating for differences.
Table 2Table of contingencies (TP, TN, FP, FN) and scores (PC, B, FAR, POD, POFD) for calibration and validation subsets. The highest and lowest values are in bold and in italics, respectively.
3.3 Validation
For the six municipalities of the validation set, we compute optimal drought magnitudes (LAI_model, layer 8, average of the 1st to 5th percentiles). The Kendall rank correlation between the optimal drought magnitude and the normalized number of claims yields a τ value of 0.23 and a p value of less than 0.001, indicating a statistically significant correlation. Figure 5 plots the average optimal drought magnitude and the normalized number of claims for this set over the 19-year study period. CatNat decrees are shown as gray bars in the background of the second graph. These results are also presented in a scatterplot in the Supplement (Fig. S4).
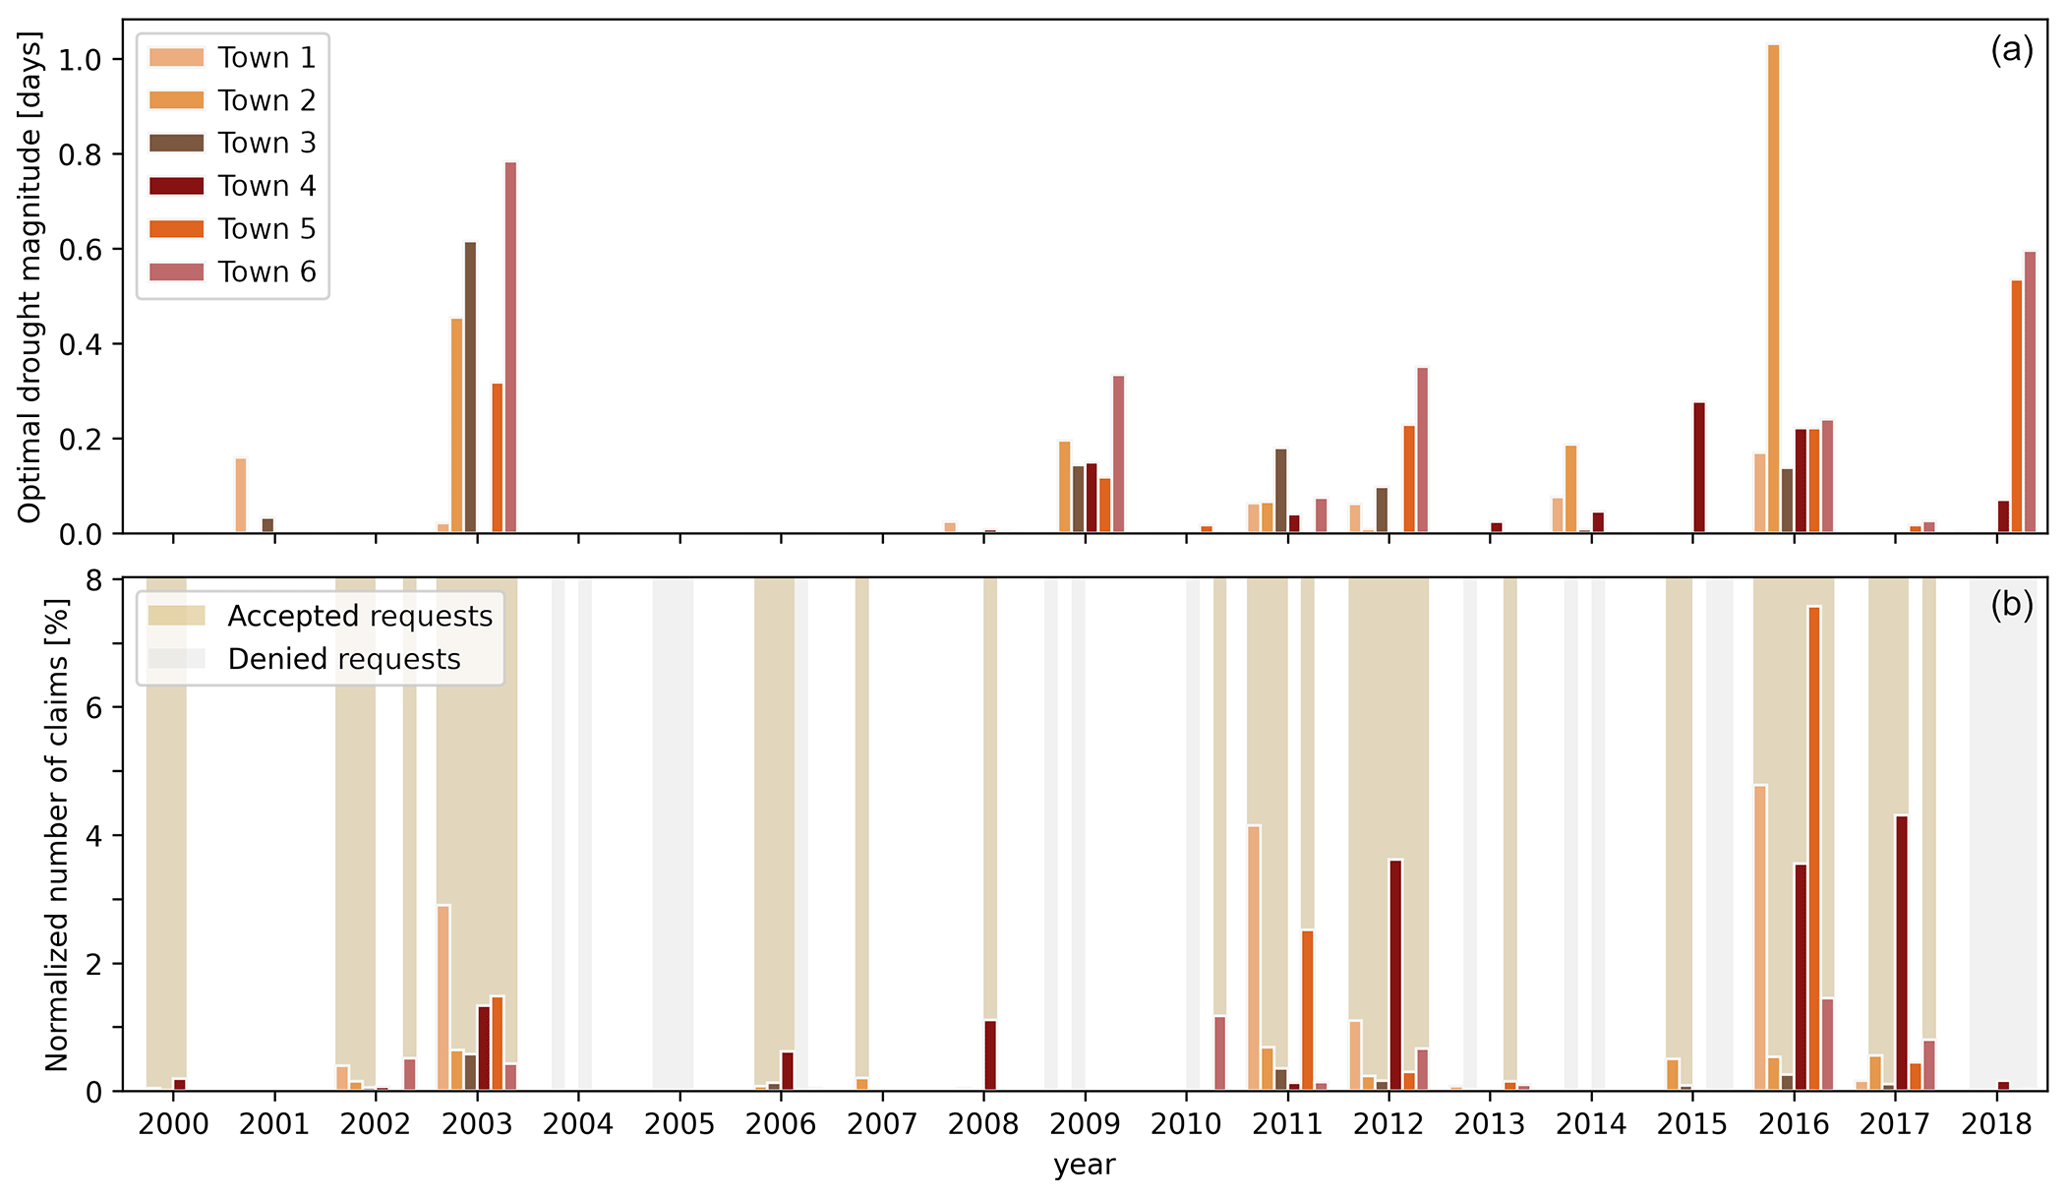
Figure 5Optimal drought magnitude (a) and normalized number of claims and CatNat decrees (b) for the six municipalities of the validation set.
In Fig. 5, we see that the magnitude index is able to identify droughts in more than half of the municipalities for the years 2003, 2009, 2011, 2012, 2014, 2016, and 2018. However, not all of these years correspond to years with significant damage (2002, 2003, 2011, 2012, 2016, 2017), and some years even remain undetected. As with the calibration set, we observe a very strong correspondence between normalized damage numbers and CatNat decrees. The scores obtained for the validation set, displayed in Table 2, are quite similar to the ones obtained for the merged calibration subsets.
Then, the optimal magnitudes of calibration and validation sets are sorted into four classes. Statistics describing the normalized number of claims per magnitude class for both sets are available in Table 3. Figure 6 shows the distribution of the same variable per class, separating the two sets.
Table 3Statistical distribution of normalized number of claims (in %) by magnitude class of calibration and validation sets. Class limits, numbers of observations, and quartiles (Q) are indicated.
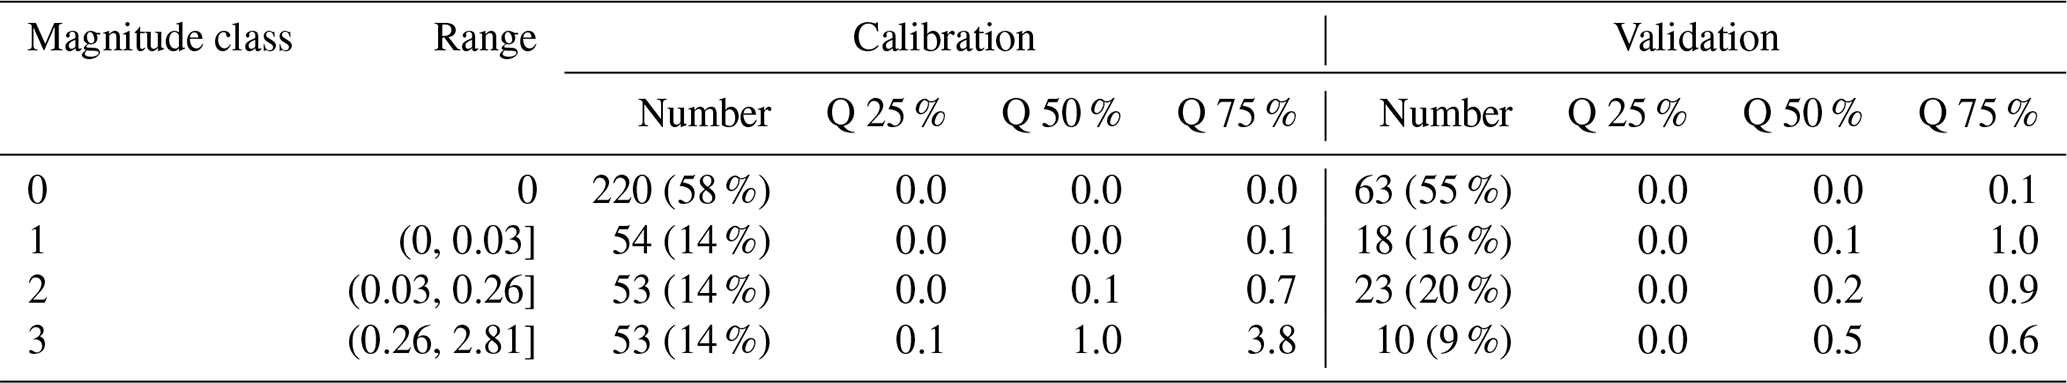
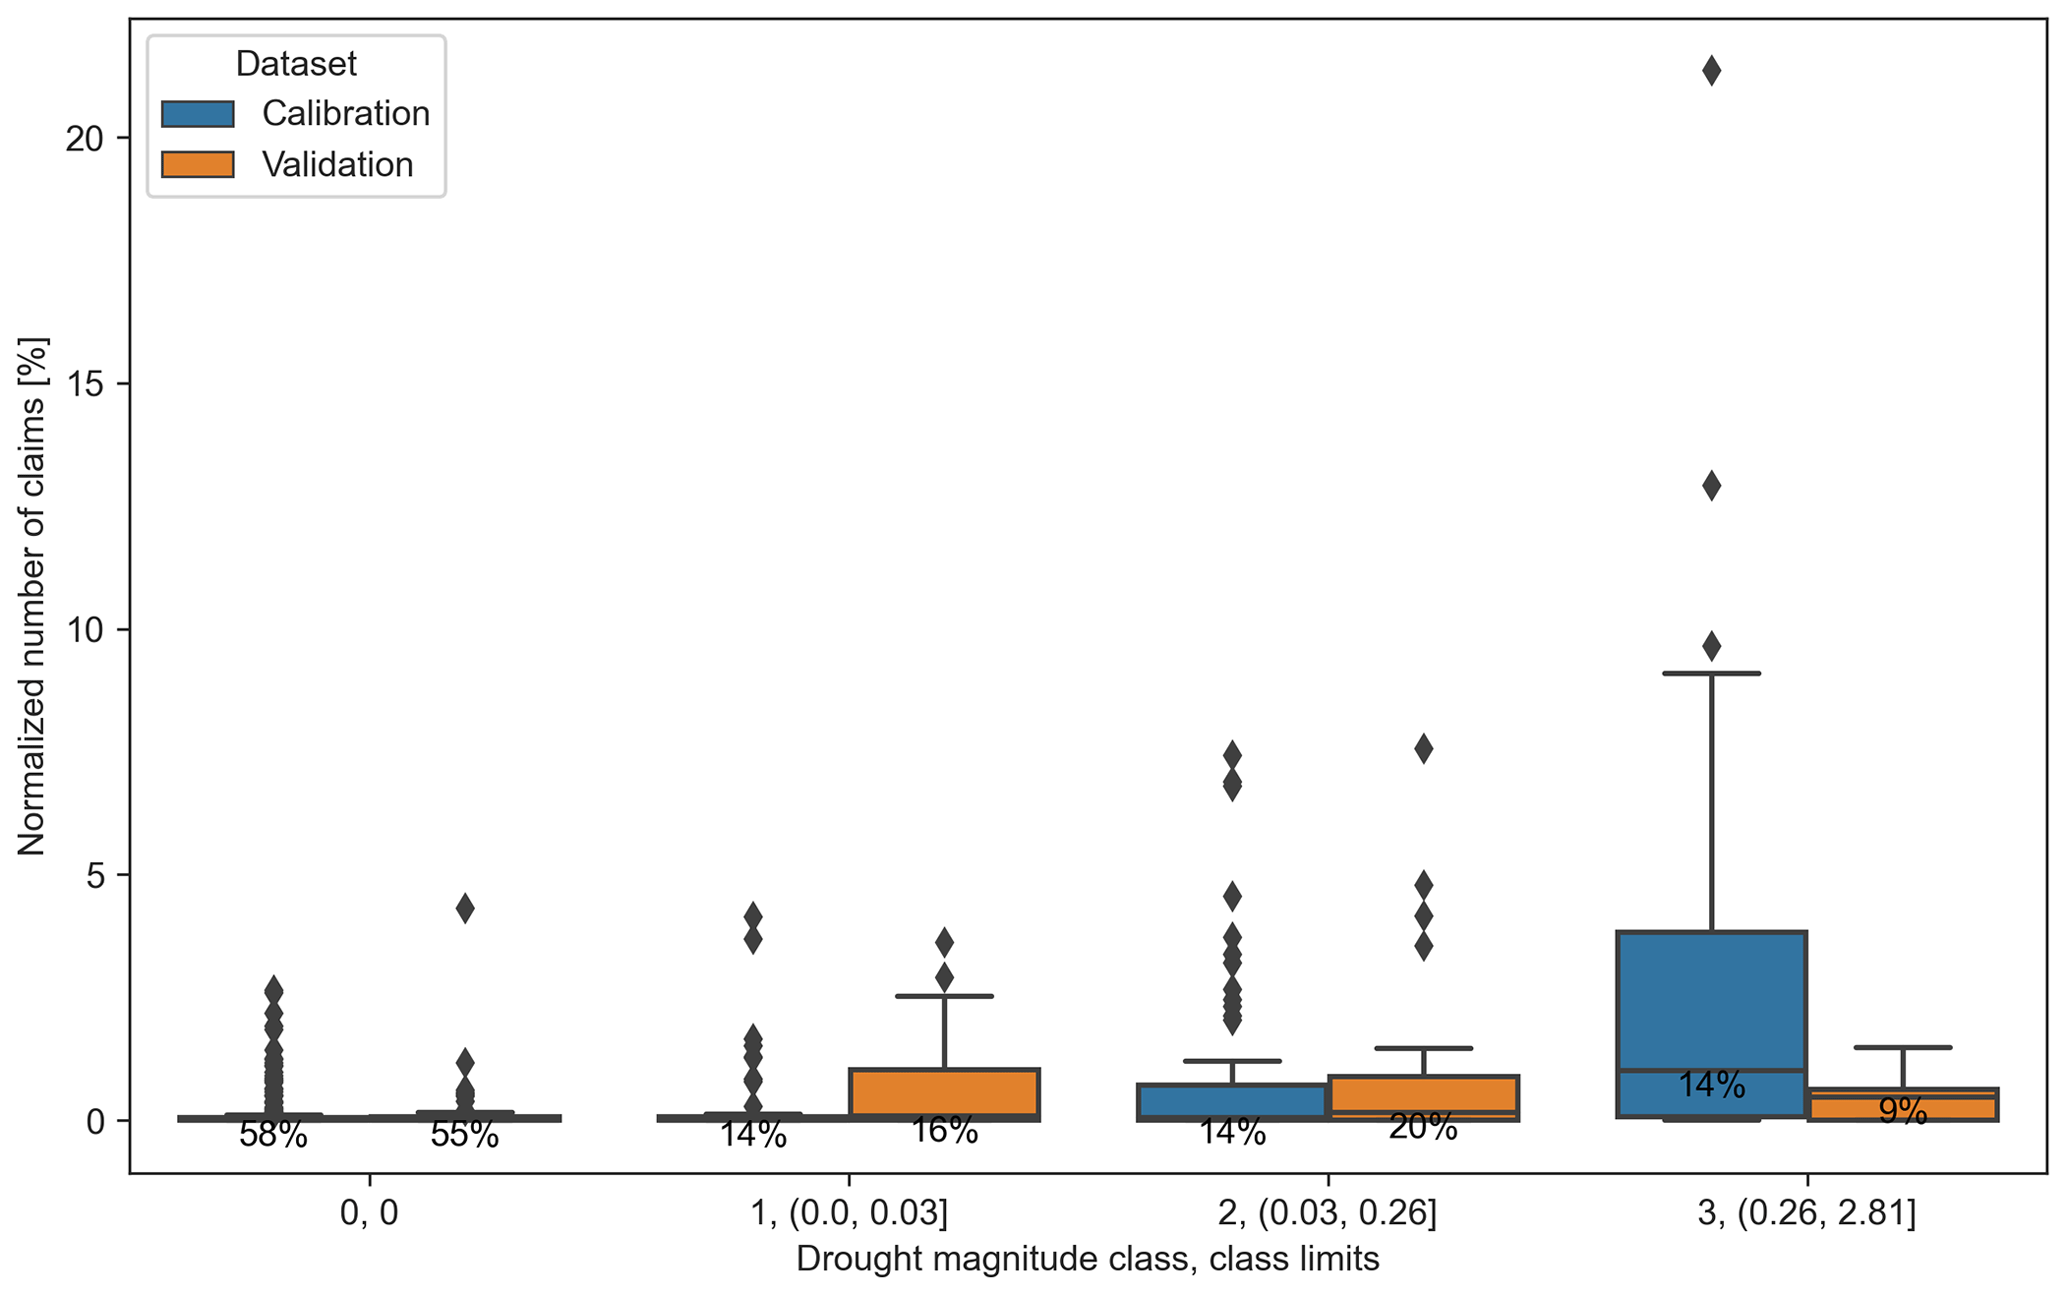
Figure 6Distributions of the normalized number of claims per magnitude class, separating the calibration and validation sets.
From Table 3 and Fig. 6, we can see that the entire population is evenly distributed among the classes for the two sets, except for classes 2 and 3 of the validation set, which contain more and fewer elements than class 1, respectively. For the calibration set, the value of the damage quartiles increases with the magnitude class, indicating a positive association. The same is observed for the validation set for the lower and middle quartiles. We observe that the distributions of the normalized number of claims are similar for both sets in classes 0 and 2. Class 1 of the validation set is characterized by a high upper quartile and class 3 by a low one, in contrast to the wide range noted in class 3 for the calibration set.
In the previous section, we presented an optimal drought index that we calibrated over five regional subsets and compared to independent data. The findings are discussed in the following section, along with perspectives.
4.1 How does the drought magnitude compare to existing drought indices?
This paper presents a new drought index, the yearly drought magnitude, which quantifies the yearly summed dry anomaly of an LSM-derived daily SWI. The reason for choosing a drought index based on LSM output is based on the nature of the phenomenon under study. As mentioned above, clay shrinkage is a physical response of soils to drying. Therefore, the most relevant way to monitor it is to focus on soil moisture variations. Meteorological variables alone are not able to provide a sufficient description of the hydric state of soils due to the multiple interactions between atmosphere, soil, and vegetation at the surface, hence the difference between the SPI and SSWI noted by Soubeyroux et al. (2012) and Charpentier et al. (2022). As illustrated by the indices listed by WMO and GWP (2016), the only way to assess soil moisture evolution is to weight contributions from simple water balance models to more complex LSMs.
Although both are based on an ISBA-modeled SWI, our approach has a major difference from the one developed by Vidal et al. (2010). In the latter, the magnitude index is calculated from an SSWI consisting of a monthly SWI standardized at different timescales by fitting to a given distribution over the period 1958–2008. This method was not applicable to our work because the insurance data lead us to focus on the years 2000–2018, a period which is too short for a proper distributional analysis of the monthly SWI. However, the standardization step is still included in the index calculation, since the thresholds are based on SWI percentiles.
4.2 Why is an interactive LAI needed?
The evaluation of 1200 possible index configurations showed the best performance of the magnitudes computed from the LAI_model simulation, model soil layer 8 (0.8–1.0 m), and extreme drought thresholds (1st to 5th percentiles).
The only difference between LAI_model and LAI_clim simulations is that the LAI varies over time in response to water and energy budgets for LAI_model, while the LAI cycle is the same each year, based on a climatology for LAI_clim. The interannual variability in the LAI depends on meteorological conditions and the effect of soil water deficit on photosynthesis and plant growth. At the same time, the simulated soil moisture depends on the amount of water extracted from the soil by plant transpiration, and thus the temporal evolution of soil moisture is linked to the LAI variable. The interactive leaf area index scheme of LAI_model is an improvement over the fixed pattern of LAI_clim because it includes vegetation feedback in response to soil drought. Drought conditions limit plant growth, LAI values, plant transpiration, and root water extraction from the soil. Figure 7 shows time series of the LAI, SWI5 (0.2–0.4 m), and SWI8 (0.8–1.0 m). Time series are shown for LAI_clim and LAI_model simulations at a single ISBA grid point located in the calibration subset corresponding to Department 31. It can be observed that larger LAI values in a simulation tend to trigger smaller SWI8 values at the end of the summer and during fall. For example, the lower soil moisture content of LAI_clim in 2003 with respect to LAI_model corresponds to higher LAI values during the warm season. This effect is much more visible for SWI8 than for SWI5. As explained by Ravina (1983), the hydraulic conductivity of the topsoil layer decreases with drying to the point where moisture in the deeper layers can remain practically unchanged. Soil moisture variations in deep layers are therefore more dependent on water uptake by roots than on diffusion processes. This explains the large impact of vegetation transpiration and the stronger correlation with the LAI.
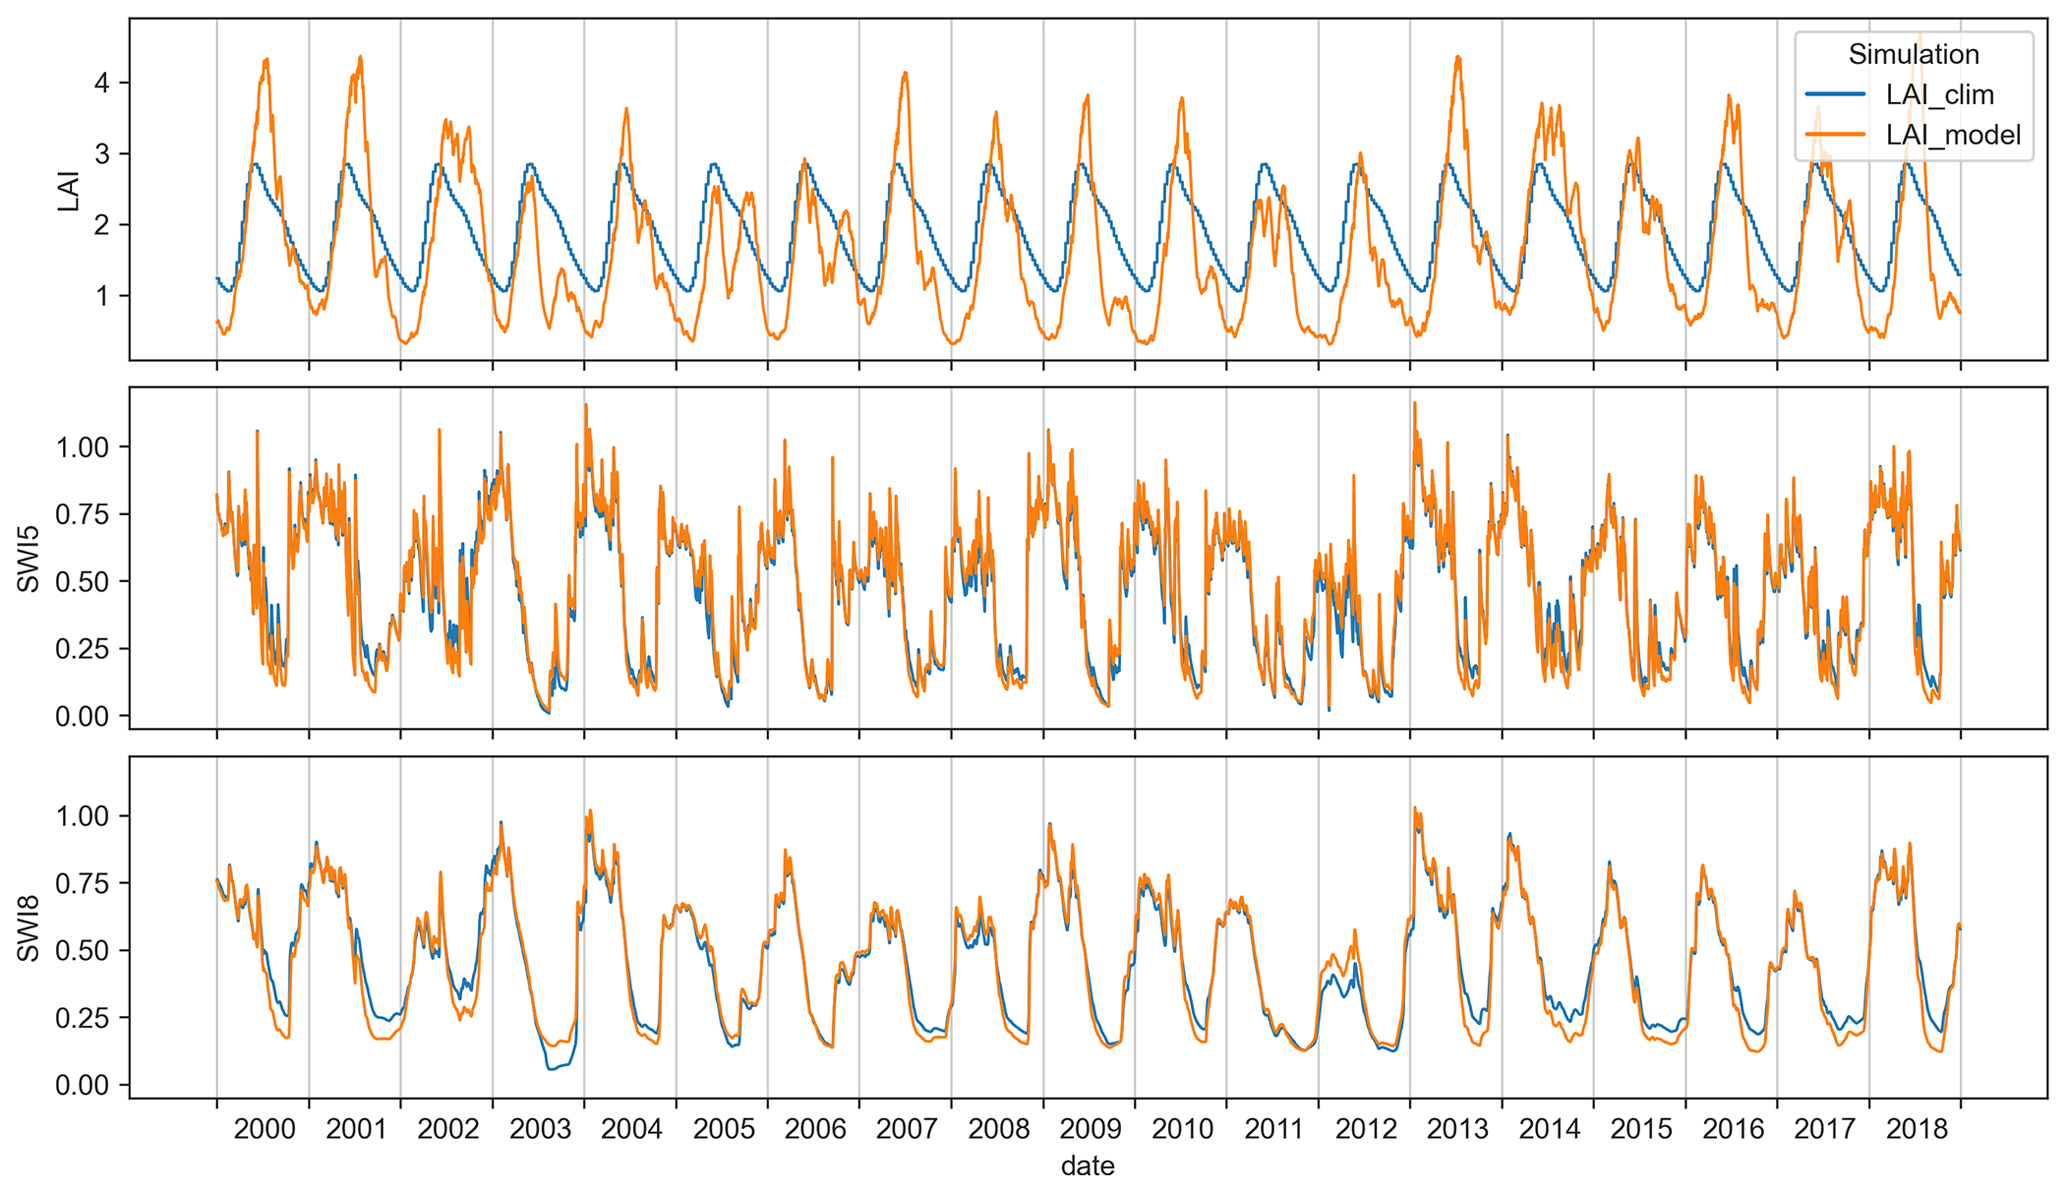
Figure 7Time series of the LAI and SWI5 and SWI8 (corresponding to soil layers 0.2–0.4 and 0.8–1.0 m, respectively), differentiating between simulations of LAI_clim and LAI_model, for a single ISBA grid point located in the calibration subset attached to Department 31.
Figure 3 shows that all annual drought indices correlate better with the number of insurance claims for deep soil layers. The best score values are obtained for SWI8. Figure 7 shows that the main difference between the two SWI variables is the presence of a high-frequency component in the SWI5 time series. The proximity of this most superficial layer to the surface, where meteorological exchanges take place, explains these short-term fluctuations, which consequently fade with depth. In other words, the SWI of a deep soil layer, which indirectly filters out high-frequency variations, reflects longer-term soil moisture trends compared to surface soil moisture. This explains the better correlation of the SWI8-based drought indices with damage data, considering that subsidence is a long-term, gradual phenomenon. For all simulations, layers, and index types, better results are observed for low thresholds. Consequently, a daily SWI below the 5th percentile of the empirical distribution is relevant for the definition of drought when monitoring subsidence.
4.3 Is the optimal drought magnitude a reliable proxy for subsidence damage?
Figure 3 shows that magnitude is a more robust drought index for representing subsidence damage than duration and severity. In particular, a deterioration in the performance of the duration and severity indices is observed for increasing percentile drought thresholds and decreasing soil layer depths. The duration index loses much information for large percentile drought thresholds, hence the lower correlation values. As with severity, this index is inherently sensitive to extreme values, which is not well suited to the frequent soil moisture variations in near-surface layers that are not representative of long-term trends (as seen in Fig. 7). Nevertheless, we note very similar Kendall τ values for the three indices at percentile drought thresholds of less than the 15th percentile. Finally, magnitude is chosen as the best index because it combines both duration and severity, compensating for their respective drawbacks. Also, as shown in Fig. 4, magnitudes are spatially consistent: similar drought trends are observed for points within the same regional calibration subset. The average Kendall τ of 0.42 between magnitudes and the standardized number of claims for the calibration set shows a strong positive association, with a high statistical significance (p value ≤ 0.001).
The optimal magnitude index identifies significant drought events in 2003 and 2018 for more than half of the study areas (see Fig. 4). These two years experienced notable summer drought events, which have been widely documented in the literature (see for example Buras et al., 2020). The index has the advantages of identifying not only the occurrence of such droughts but also their absence and of being spatially consistent.
Nevertheless, we observe discrepancies: drought years with no damage recorded and, conversely, damage recorded in the absence of drought. The functioning of the French CatNat system offers possible explanations for both situations. As explained above, the coverage of subsidence damage by this system requires the publication of a decree for a given year and municipality, the issuance of which is conditional upon meeting geotechnical and meteorological criteria. The meteorological criterion is currently calculated on a seasonal basis and requires a frequency threshold to be exceeded. Losses are only documented in years with decrees, hence their strong co-occurrence noted in Figs. 4 and 5. The absence of decrees provides an explanation for the inconsistencies between positive magnitudes and zero damage. A drought event can occur without leading to a decree if the seasonal criteria are not met. On the other hand, it is possible to have low drought magnitudes and a CatNat decree in the same year. Low threshold magnitudes quantify the driest moments of the year (summer to fall droughts), while a single season only needs to be drier than usual to satisfy the CatNat meteorological criterion. For such years, the presence of claims can be explained by delays in reporting, as it is difficult for both homeowners and insurers to accurately time the occurrence of subsidence damage. This would explain why, for certain years and municipalities, claims are reported without significant magnitudes. The link to the CatNat regime is not the only factor explaining the inconsistencies between magnitudes and claims: several sources of uncertainty have not been considered in this study. These are discussed in the next section.
The analysis of the scores provides more insight, subset-wise. The high PC (>0.5) obtained for all zones shows that the index makes a majority of correct predictions, despite the limitations mentioned above. The same conclusions can be drawn from the POD (>0.5): more than half of the loss events were detected for each subset. On the other hand, the important range of bias variation was unexpected: using thresholds defined from a given SWI frequency, the occurrence of subsidence damage is either under-predicted (subset 31) or over-predicted (subset 57). We can link this finding to the record of CatNat decrees: for the same number of years and cities, 25 decrees were issued for subset 31 and 12 for subset 57. Over-prediction is more likely for a small number of observations, and vice versa. This is not the only explanation, as the less biased subset (45, B=1.18) is associated with the smallest number of decrees (6). Finally, the FAR and POFD characterize the tendency of the index to make false predictions. For all subsets, the POFD is below 0.4: fewer than 4 out of 10 predictions turn out to be wrong in the absence of subsidence claims. The FAR is also below 0.4, except for in subset 57: fewer than 4 positive claim predictions out of 10 turn out to be wrong. In both cases, a minority of predictions are wrong. The high FAR obtained for subset 57 (0.57) is related to the high bias (1.75) noted above. The scores computed over the entire calibration data set compensate for the differences between the subsets; these results, which are more robust, were expected, given the largest number of conditions.
The validation step also provides useful information to analyze how the optimal magnitude index fits the subsidence hazard. The lower Kendall τ of 0.23 indicates a weaker association of the index with subsidence damage compared to the calibration set while maintaining high statistical significance (p value less than 0.001). Once again, we can explain the disparities between drought magnitude and damage by the absence of CatNat decrees and the delays in reporting. Nevertheless, the magnitude index manages to identify most of the years with significant damage. The results obtained for the validation set from the contingency table are quite similar to, if not slightly less effective than, those obtained for the entire calibration set. The satisfactory performance of the index computed from unseen data proves that we successfully avoid overfitting, i.e., the over-adaptation of the model to specific patterns of a given data set, in our case the calibration set. In addition, the magnitude classification reveals underlying trends in both the calibration and the validation sets (Fig. 6). The similar distributions of both sets across classes indicate that the validation set, although smaller, is representative. However, these distributions are uneven, with the first class, corresponding to no damage, containing more than half of the magnitudes (Table 3). This is not surprising, since we are focusing on extreme and thus rare events. This is problematic for the validation set, as there are only a limited number of data left to divide into classes. For example, the last class in the validation set contains 9 % of the magnitudes, or 10 values, which is too small for a proper analysis. While the data in the validation set are representative of the proportion of null events, they are insufficient to provide reliable damage distributions associated with positive magnitudes. This provides an explanation for the incoherent decreasing upper-quartile observation from magnitude class 1 to magnitude class 3 in Table 3. The zoning between classes can be refined using a larger data set. While the magnitude drought index is able to identify the occurrence of drought events relevant for subsidence damage monitoring, the index alone is not able to provide accurate quantitative damage estimates at this stage. The validation step could be improved using a larger data set.
4.4 What are the sources of uncertainty?
The non-linearity of the relationship between optimal drought magnitudes and losses can be explained by several sources of uncertainty. Subsidence losses are the result of a combination of factors, not all of which have been considered at the same level of detail in this paper.
4.4.1 Representativeness of the insurance database
The number of subsidence claims used in this paper is a sample from a database compiled by CCR from insurance company submissions. It is important to keep in mind that the representativeness of these data varies across years and cities, depending on what was submitted. This is truer the smaller the city (see the number of single-family houses with moderate to high exposure to clay shrinkage per city in the Supplement).
4.4.2 Circularity
As already explained, knowledge of the history of the CatNat decrees issued is crucial for the interpretation of a subsidence damage record. However, the meteorological criterion that determines the issuance of these decrees is based on the ISBA model, just like the magnitude index we developed, although in a different configuration. Therefore, there is an indirect link between the two variables we are correlating, which induces a certain circularity in the approach. This weakness is recognized, but no valuable alternative can be considered: insurance claims are the only available evidence of subsidence, and LSMs are the tools that currently provide the most consistent estimates of soil moisture at the national scale. Nevertheless, we can consider the dependency between magnitudes and claims low, since the meteorological criterion of the CatNat decree is based on a version of the ISBA model (SWI uniforme) that is very different from the one used in this study and that has been modified several times. A possible alternative to insurance claims as a proxy for subsidence is the direct use of remotely sensed ground motion. In particular, satellite-borne interferometric synthetic aperture radar (InSAR) data can be used to infer vertical motion after appropriate processing, as done by Burnol et al. (2021). For example, the European Ground Motion Service (EGMS; Crosetto et al., 2021) has provided vertical displacements over Europe with high spatial and temporal resolution, based on the Copernicus Sentinel-1 satellites, since 2018. The main advantage of this technique is its large spatial coverage. However, the interpretation of such data is not trivial. In the case of clay shrink–swell, the vertical displacements are non-linear (seasonal periodicity), of small amplitude (a few to tens of millimeters), and spatially heterogeneous due both to the natural irregularity of clay soils and to the contrasting responses of reflectors (less movement is expected for tall buildings on pile foundations, as explained by Tzampoglou et al., 2022). It can therefore be challenging to separate a signature expansive soil signal from other phenomena such as subsidence induced by water pumping (Meisina et al., 2006). We recognize the potential of these data, but the EGMS data set was not available at the time of the study. In addition, it begins in 2018, which barely overlaps with our study period, which spans 2000 to 2018.
4.4.3 Differences in temporal and spatial resolution
Uncertainty is also introduced by the different temporal and spatial resolution of the two main data sets compared in this study, i.e., soil moisture and the number of claims.
The annual temporal resolution of this study is forced by the insurance claim data set, while the soil moisture simulations are more precise (daily). The coarse resolution of the first data set is explained by the difficulty for insurers of precisely dating the occurrence of subsidence damage due to the slow nature of the phenomenon. For this reason, this work could not be carried out at a finer temporal scale. However, there is an advantage to using daily instead of annual soil moisture data: the SWI distribution is expected to be more robust over a 19-year period due to the large number of observations. This is particularly important in the context of a changing climate. The hypothesis of a stable daily soil moisture distribution remains a source of uncertainty inherent to this work.
The two data sets also present a difference in spatial resolution: the number of claims is available at the municipal scale, while soil moisture is modeled at an 8 km × 8 km scale. These two grids are of the same order of magnitude. The overlap allows them to be paired using a criterion other than distance alone.
4.4.4 Cumulative effect of subsidence
After a particularly hot summer, the soil under perennial plants is likely to be so dry that a single wet season may not be able to compensate for the water deficit. This leads to a cumulative effect of droughts and thus soil movement (Page, 1998). For simplicity, the drought index described in this study is calculated from the SWI of a single year only. The cumulative effect is therefore neglected and is a source of uncertainty. The good agreement obtained here between drought magnitudes and normalized claims indicates that the conditions of a single year are a satisfactory enough predictor of subsidence occurrence. Taking into account the cumulative effect would improve the agreement with the numbers of claims. This step could be implemented in a damage model by, for example, weighting magnitudes by their history.
4.4.5 Zoning of clay shrink–swell exposure
Clay shrinkage depends on triggering factors, such as drought, and predisposing factors, the most important of which are the presence of clay, its nature, and its ability to shrink and swell. In order to minimize the influence of these factors, we focused our analysis on the housing stock located in moderate- to high-hazard zones of municipalities with a significant history of subsidence damage. The blending of moderate- and high-exposure zones in the housing data set is an initial source of uncertainty, as the same drought is expected to trigger different responses in soils of different susceptibility. Despite the selection of the housing data set, the uncertainty arising from the exposure to clay shrink–swell exposure map itself must be considered. The exposure map, made at a regional scale of 1:50 000, does not integrate very local clayey soil occurrences. The latter are frequent in relation to clay formation and depositional geological processes (BRGM, 2024). The lack of precision of the clay maps here affects the number of houses in different hazard zones used in the normalization step. The associated uncertainty is transferred to the value of the normalized number of claims. At this stage, we are not trying to make precise damage predictions but rather only identify drought years. Therefore, this source of uncertainty is not the most dominant. Moreover, this study does not take into account the intensity of the deformation induced by the shrink–swell mechanism, which is a significant component explaining the deformations of the structures induced by variations in water content.
4.4.6 Local factors
Local factors other than the sporadic presence of swelling clay play a significant role in the subsidence phenomenon:
-
The presence of vegetation (especially deciduous trees) around the building is critical, as roots are known to locally intensify soil drying during droughts (Freeman et al., 1992; Hawkins, 2013; Page, 1998).
-
The characteristics of the building itself (e.g., building type, number of floors, presence of a basement) determine its vulnerability to subsidence damage. This is important in understanding the causes of a subsidence claim (Page, 1998).
-
Various elements of the building environment, such as its orientation, the slope of the land, or the presence of pavement, can limit or enhance soil moisture variations and thus seasonal ground movements (Cooling and Ward, 1948; Page, 1998).
None of these factors were considered in this work because this information was not available for integrated municipal-scale data. The specific effect of trees on soil moisture fluctuations could be investigated by modifying the ISBA model configuration. For all the other local factors, evaluation of their influence on subsidence is only possible through local analysis using instrumented sites.
4.5 What are the possible applications for this work, in and outside of France?
The main result of this research is a new index, the yearly drought magnitude, specifically adapted to the problem of clay-shrinkage-induced subsidence. It is computed from the SWI output of the ISBA LSM and is calibrated and validated with insurance data. As shown above, this index is relevant for the identification of subsidence-induced drought events. It faces several limitations due to the various sources of uncertainty.
The research was carried out on a sample of 20 cities, but the index can be calculated for the whole country. A first possible application is the use of the magnitude of drought itself to monitor conditions likely to cause subsidence over time, as is currently done by French institutions. Another possible application, this time for the insurance industry, would be to use the index as an improved predictor in subsidence loss models, such as the one developed by Charpentier et al. (2022).
As several regions worldwide face similar clay-shrinkage-induced subsidence problems (see for example MacQueen et al., 2023, and Mostafiz et al., 2021, for the UK and the USA, respectively), the methodology can be adapted to other countries. The SURFEX modeling platform, in which ISBA is implemented, can be applied anywhere, provided that high-resolution atmospheric forcing is available.
In this paper, we propose a new annual drought index, the optimal drought magnitude, tailored to the subsidence hazard. Our work can be summarized as follows.
-
The proposed optimal drought magnitude is the mean of five annual integrals of daily soil wetness index (SWI) values under several thresholds (1st to 5th percentiles of the empirical SWI distribution). It is based on the eighth model layer (depth of 0.8 to 1.0 m) of the ISBA land surface model in a configuration that allows interactive LAI simulation. In this configuration, the average Kendall τ between the drought index and the normalized number of claims is equal to 0.42 with a high statistical significance (p value ≤ 0.001). The validation step indicates that we avoid overfitting.
-
The optimal drought magnitude identifies events that are likely to generate subsidence claims. It is spatially consistent. Differences with subsidence damage claims can be explained by the way claims are collected and by the lack of information on local conditions.
-
The optimal drought magnitude benefits from recent advances in land surface modeling (multilayer, interactive LAI). It could be used as a predictor in subsidence loss models to provide more accurate cost estimates. As this index is based on ISBA simulations, future subsidence damage risks could be assessed by forcing ISBA through downscaled climate model simulations.
Future developments will focus on reducing uncertainties by working at finer spatial scales and by investigating the specific effects of different vegetation types.
The analysis was carried out with Python codes that can be made available upon request. SURFEX can be downloaded freely at http://www.umr-cnrm.fr/surfex/data/OPEN-SURFEX/open_surfex_v8_1_20210914.tar.gz (CNRM, 2016). It is provided under a CECILL-C license (French equivalent to the LGPL license).
The data presented in the figures are available online at https://doi.org/10.6084/m9.figshare.23559507 (Barthelemy, 2023). Geographic distribution of exposed single-family houses can be downloaded freely at https://www.statistiques.developpement-durable.gouv.fr/nouveau-zonage-dexposition-au-retrait-gonflement-des-argiles-plus-de-104-millions-de-maisons (MTES, 2021b).
The supplement related to this article is available online at: https://doi.org/10.5194/nhess-24-999-2024-supplement.
SBa and JCC designed the experiments. SBa performed the investigation, did the formal analysis, and wrote the paper. BB processed the LAI_model data set. All co-authors participated in the interpretation of the results and the revision of the paper.
The contact author has declared that none of the authors has any competing interests.
Publisher’s note: Copernicus Publications remains neutral with regard to jurisdictional claims made in the text, published maps, institutional affiliations, or any other geographical representation in this paper. While Copernicus Publications makes every effort to include appropriate place names, the final responsibility lies with the authors.
This article is part of the special issue “Drought, society, and ecosystems (NHESS/BG/GC/HESS inter-journal SI)”. It is a result of the Panta Rhei Drought in the Anthropocene workshop 2022, Uppsala, Sweden, 29–30 August 2022.
The authors would like to thank the operational services of Météo-France (DCSC), especially Jean-Marie Willemet, for providing the LAI_clim soil moisture data set, as well as Jean-Philippe Naulin (CCR) and the three anonymous reviewers for helpful comments. This paper is dedicated to the memory of David Moncoulon.
The PhD thesis work of Sophie Barthelemy was co-funded by BRGM (Bureau de Recherches Géologiques et Minières), CCR (Caisse Centrale de Réassurance), and Météo-France.
This paper was edited by Floris van Ogtrop and reviewed by three anonymous referees.
Barthelemy, S.: A new drought index fitted to clay shrinkage induced subsidence over France: benefits of interactive leaf area index, Barthelemy et al. 2023 – Figure data, Figshare [data set], https://doi.org/10.6084/m9.figshare.23559507.v1, 2023.
Boone, A., Calvet, J. C., and Noilhan, J.: Inclusion of a third soil layer in a land surface scheme using the force-restore method, J. Appl. Meteorol., 38, 1611–1630, https://doi.org/10.1175/1520-0450(1999)038<1611:IOATSL>2.0.CO;2, 1999.
Boone, A., Masson, V., Meyers, T., and Noilhan, J.: The Influence of the Inclusion of Soil Freezing on Simulations by a Soil–Vegetation–Atmosphere Transfer Scheme, J. Appl. Meteorol., 39, 1544–1569, https://doi.org/10.1175/1520-0450(2000)039<1544:TIOTIO>2.0.CO;2, 2000.
BRGM: M'informer sur le retrait-gonflement des argiles – Exposition du territoire au phénomène, https://www.georisques.gouv.fr/articles-risques/retrait-gonflement-des-argiles/exposition-du-territoire-au-phenomene, last access: 11 March 2024.
Bronswijk, J. J. B.: Prediction of actual cracking and subsidence in clay soils, Soil Sci., 148, 87–93, https://doi.org/10.1097/00010694-198908000-00002, 1989.
Brut, A., Rüdiger, C., Lafont, S., Roujean, J.-L., Calvet, J.-C., Jarlan, L., Gibelin, A.-L., Albergel, C., Le Moigne, P., Soussana, J.-F., Klumpp, K., Guyon, D., Wigneron, J.-P., and Ceschia, E.: Modelling LAI at a regional scale with ISBA-A-gs: comparison with satellite-derived LAI over southwestern France, Biogeosciences, 6, 1389–1404, https://doi.org/10.5194/bg-6-1389-2009, 2009.
Buras, A., Rammig, A., and Zang, C. S.: Quantifying impacts of the 2018 drought on European ecosystems in comparison to 2003, Biogeosciences, 17, 1655–1672, https://doi.org/10.5194/bg-17-1655-2020, 2020.
Burnol, A., Foumelis, M., Gourdier, S., Deparis, J., and Raucoules, D.: Monitoring of expansive clays over drought-rewetting cycles using satellite remote sensing, Atmosphere, 12, 1262, https://doi.org/10.3390/atmos12101262, 2021.
Calvet, J.-C.: Investigating soil and atmospheric plant water stress using physiological and micrometeorological data, Agric. For. Meteorol., 103, 229–247, https://doi.org/10.1016/S0168-1923(00)00130-1, 2000.
Calvet, J.-C. and Soussana, J.-F.: Modelling CO2-enrichment effects using an interactive vegetation SVAT scheme, Agric. For. Meteorol., 108, 129–152, https://doi.org/10.1016/S0168-1923(01)00235-0, 2001.
Calvet, J.-C., Noilhan, J., Roujean, J.-L., Bessemoulin, P., Cabelguenne, M., Olioso, A., and Wigneron, J.-P.: An interactive vegetation SVAT model tested against data from six contrasting sites, Agric. For. Meteorol., 92, 73–95, https://doi.org/10.1016/S0168-1923(98)00091-4, 1998.
Calvet, J.-C., Rivalland, V., Picon-Cochard, C., and Guehl, J.-M.: Modelling forest transpiration and CO2 fluxes – Response to soil moisture stress, Agric. For. Meteorol., 124, 143–156, https://doi.org/10.1016/j.agrformet.2004.01.007, 2004.
CCR: Les Catastrophes naturelles en France, Bilan 1982–2021, https://catastrophes-naturelles.ccr.fr/documents/148935/368920/BILAN+Cat+Nat+1982-2021.pdf/cb6ffbc8-f096-e8a6-5f71-3fe68ee8d78e?t=1675351436030 (last access 11 March 2023), 2021.
CCR: Rapport au Ministre de l'économie, des finances, et de la souveraineté industrielle et numérique sur le régime d'indemnisation des catastrophes naturelles, https://www.ccr.fr/documents/35794/1130659/Rapport+au+ministre+-+Decembre+2022.pdf/c6edbb8e-e5ba-e5d6-2d30-d2750c229086?t=1675073436815 (last access: 11 March 2024), 2022.
CCR and Météo-France: Conséquences du changement climatique sur le coût des catastrophes naturelles en France à horizon 2050, 32 pp., https://www.ccr.fr/documents/35794/35836/Etude+Climatique+2018+version+complete.pdf/6a7b6120-7050-ff2e-4aa9-89e80c1e30f2?t=1536662736000 (last access: 11 March 2024), 2018.
Charpentier, A., James, M., and Ali, H.: Predicting drought and subsidence risks in France, Nat. Hazards Earth Syst. Sci., 22, 2401–2418, https://doi.org/10.5194/nhess-22-2401-2022, 2022.
Clapp, R. B. and Hornberger, G. M.: Empirical equations for some soil hydraulic properties, Water Resour. Res., 14, 601–604, https://doi.org/10.1029/WR014i004p00601, 1978.
CNRM: SURFEX code, CNRM [code], http://www.umr-cnrm.fr/surfex/data/OPEN-SURFEX/open_surfex_v8_1_20210914.tar.gz (last access: 11 March 2024), 2016.
Cojean, R.: Introduction, Rev. Française Géotechnique, 120–121, 7–9, https://doi.org/10.1051/geotech/2007120007, 2007.
Cooling, L. F. and Ward, W. H.: Some examples of foundation movements due to causes other than structural loads, in: Proceedings 2nd international conference on soil mechanics and foundation engineering, Rotterdam, the Netherlands, 21 to 30 June 1948, 162–167, https://www.issmge.org/publications/publication/some-examples-of-foundation-movements-due-to-causes-other-than-structural-loads (last access: 11 March 2024), 1948.
Corti, T., Muccione, V., Köllner-Heck, P., Bresch, D., and Seneviratne, S. I.: Simulating past droughts and associated building damages in France, Hydrol. Earth Syst. Sci., 13, 1739–1747, https://doi.org/10.5194/hess-13-1739-2009, 2009.
Corti, T., Wüest, M., Bresch, D., and Seneviratne, S. I.: Drought-induced building damages from simulations at regional scale, Nat. Hazards Earth Syst. Sci., 11, 3335–3342, https://doi.org/10.5194/nhess-11-3335-2011, 2011.
Covéa and RiskWeatherTech: Changement climatique et Assurance: Quelles conséquences sur la sinistralité à horizon 2050?, https://www.covea.com/sites/default/files/2022-02/202202_Livre_Blanc_Cov%C3%A9a_Risques_Climatiques.pdf (last access: 11 March 2024), 2022.
Crilly, M.: Analysis of a database of subsidence damage, Struct. Surv., 19, 7–14, https://doi.org/10.1108/02630800110384185, 2001.
Crosetto, M., Solari, L., Balasis-Levinsen, J., Bateson, L., Casagli, N., Frei, M., Oyen, A., Moldestad, D. A., and Mróz, M.: Deformation Monitoring at European Scale: The Copernicus Ground Motion Service, Int. Arch. Photogramm. Remote Sens. Spatial Inf. Sci., XLIII-B3-2021, 141–146, https://doi.org/10.5194/isprs-archives-XLIII-B3-2021-141-2021, 2021.
Decharme, B., Boone, A., Delire, C., and Noilhan, J.: Local evaluation of the Interaction between Soil Biosphere Atmosphere soil multilayer diffusion scheme using four pedotransfer functions, J. Geophys. Res.-Atmos., 116, D20126, https://doi.org/10.1029/2011JD016002, 2011.
Decharme, B., Martin, E., and Faroux, S.: Reconciling soil thermal and hydrological lower boundary conditions in land surface models, J. Geophys. Res.-Atmos., 118, 7819–7834, https://doi.org/10.1002/jgrd.50631, 2013.
D'Odorico, P., Ridolfi, L., Porporato, A., and Rodriguez-Iturbe, I.: Preferential states of seasonal soil moisture: The impact of climate fluctuations, Water Resour. Res., 36, 2209–2219, https://doi.org/10.1029/2000WR900103, 2000.
Doornkamp, J. C.: Clay Shrinkage Induced Subsidence, Geogr. J., 159, 196–202, https://doi.org/10.2307/3451410, 1993.
Dracup, J. A., Lee, K. S., and Paulson, E. G.: On the definition of droughts, Water Resour. Res., 16, 297–302, https://doi.org/10.1029/WR016i002p00297, 1980.
Durand, Y., Brun, E., Merindol, L., Guyomarc'h, G., Lesaffre, B., and Martin, E.: A meteorological estimation of relevant parameters for snow models, Ann. Glaciol., 18, 65–71, https://doi.org/10.3189/S0260305500011277, 1993.
Ecoto, G. and Chambaz, A.: Forecasting the cost of drought events in France by super learning, EGUsphere [preprint], https://doi.org/10.5194/egusphere-2022-541, 2022.
Faroux, S., Kaptué Tchuenté, A. T., Roujean, J.-L., Masson, V., Martin, E., and Le Moigne, P.: ECOCLIMAP-II/Europe: a twofold database of ecosystems and surface parameters at 1 km resolution based on satellite information for use in land surface, meteorological and climate models, Geosci. Model Dev., 6, 563–582, https://doi.org/10.5194/gmd-6-563-2013, 2013.
Ford, T. W., Wang, Q., and Quiring, S. M.: The observation record length necessary to generate robust soil moisture percentiles, J. Appl. Meteorol. Climatol., 55, 2131–2149, https://doi.org/10.1175/JAMC-D-16-0143.1, 2016.
Freeman, T. J., Burford, D., and Crilly, M. S.: Seasonal foundation movements in London Clay, in: Proceedings of the 4th International Conference on Ground Movements and Structures, Cardiff, UK, 8–11 July 1991, 485–501, 1992.
Gibelin, A.-L., Calvet, J.-C., Roujean, J.-L., Jarlan, L., and Los, S. O.: Ability of the land surface model ISBA-A-gs to simulate leaf area index at the global scale: Comparison with satellites products, J. Geophys. Res.-Atmos., 111, D18102, https://doi.org/10.1029/2005JD006691, 2006.
Gourdier, S. and Plat, E.: Impact du changement climatique sur la sinistralité due au retrait-gonflement des argiles, in: Journées Nationales de Géotechnique et Géologie de l'Ingénieur (JNGG), https://hal-brgm.archives-ouvertes.fr/hal-01768395/document (last access: 11 March 2024), 2018.
Habets, F., Boone, A., Champeaux, J.-L., Etchevers, P., Franchistéguy, L., Leblois, E., Ledoux, E., Le Moigne, P., Martin, E., Morel, S., Noilhan, J., Seguí, P. Q., Rousset-Regimbeau, F., and Viennot, P.: The SAFRAN-ISBA-MODCOU hydrometeorological model applied over France, J. Geophys. Res.-Atmos., 113, D06113, https://doi.org/10.1029/2007JD008548, 2008.
Harrison, A. M., Plim, J. F. M., Harrison, M., Jones, L. D., and Culshaw, M. G.: The relationship between shrink-swell occurrence and climate in south-east England, Proc. Geol. Assoc., 123, 556–575, https://doi.org/10.1016/j.pgeola.2012.05.002, 2012.
Hawkins, A. B.: Some engineering geological effects of drought: Examples from the UK, Bull. Eng. Geol. Environ., 72, 37–59, https://doi.org/10.1007/s10064-013-0458-7, 2013.
Heranval, A., Lopez, O., and Thomas, M.: Application of machine learning methods to predict drought cost in France, Eur. Actuar. J., 13, 731–753, https://doi.org/10.1007/s13385-022-00327-z, 2022.
Joly, D., Brossard, T., Cardot, H., Cavailhes, J., Hilal, M., and Wavresky, P.: Les types de climats en France, une construction spatiale, CyberGeo, 2010, 2–22, https://doi.org/10.4000/cybergeo.23155, 2010.
Le Moigne, P., Besson, F., Martin, E., Boé, J., Boone, A., Decharme, B., Etchevers, P., Faroux, S., Habets, F., Lafaysse, M., Leroux, D., and Rousset-Regimbeau, F.: The latest improvements with SURFEX v8.0 of the Safran–Isba–Modcou hydrometeorological model for France, Geosci. Model Dev., 13, 3925–3946, https://doi.org/10.5194/gmd-13-3925-2020, 2020.
MacQueen, M., Lawson, M., and Ding, W.-N.: The 2018–2019 UK residential dwellings clay shrinkage subsidence event, Int. J. Build. Pathol. Adapt., https://doi.org/10.1108/IJBPA-06-2022-0091, 2023.
Masson, V., Le Moigne, P., Martin, E., Faroux, S., Alias, A., Alkama, R., Belamari, S., Barbu, A., Boone, A., Bouyssel, F., Brousseau, P., Brun, E., Calvet, J.-C., Carrer, D., Decharme, B., Delire, C., Donier, S., Essaouini, K., Gibelin, A.-L., Giordani, H., Habets, F., Jidane, M., Kerdraon, G., Kourzeneva, E., Lafaysse, M., Lafont, S., Lebeaupin Brossier, C., Lemonsu, A., Mahfouf, J.-F., Marguinaud, P., Mokhtari, M., Morin, S., Pigeon, G., Salgado, R., Seity, Y., Taillefer, F., Tanguy, G., Tulet, P., Vincendon, B., Vionnet, V., and Voldoire, A.: The SURFEXv7.2 land and ocean surface platform for coupled or offline simulation of earth surface variables and fluxes, Geosci. Model Dev., 6, 929–960, https://doi.org/10.5194/gmd-6-929-2013, 2013.
McKee, T. B., Doesken, N. J., and Kleist, J.: The relationship of drought frequency and duration to time scales, in: Eight Conference on Applied Climatology, Anaheim, USA, 17–22 January 1993.
Meisina, C., Zucca, F., Fossati, D., Ceriani, M., and Allievi, J.: Ground deformation monitoring by using the Permanent Scatterers Technique: The example of the Oltrepo Pavese (Lombardia, Italy), Eng. Geol., 88, 240–259, https://doi.org/10.1016/j.enggeo.2006.09.010, 2006.
Mostafiz, R. Bin, Friedland, C. J., Rohli, R. V., Bushra, N., and Held, C. L.: Property Risk Assessment for Expansive Soils in Louisiana, Front. Built Environ., 7, 1–10, https://doi.org/10.3389/fbuil.2021.754761, 2021.
MTES: Cartographie de l'exposition des maisons individuelles au retrait-gonflement des argiles, https://www.statistiques.developpement-durable.gouv.fr/sites/default/files/2021-06/note_methode_croisement_retrait_gonflement_argiles_juin2021v3.pdf (last access: 11 March 2024), 2021a.
MTES: Nouveau zonage d'exposition au retrait-gonflement des argiles: plus de 10,4 millions de maisons individuelles potentiellement très exposées, https://www.statistiques.developpement-durable.gouv.fr/nouveau-zonage-dexposition-au-retrait-gonflement-des-argiles-plus-de-104-millions-de-maisons (last access: 19 March 2024), 2021b.
Nachtergaele, F., Velthuizen, H., Verelst, L., and Wiberg, D.: Harmonized World Soil Database Version 1.2 [data set], https://esdac.jrc.ec.europa.eu/ESDB_Archive/Soil_Data/Docs_GlobalData/Harmonized_World_Soi_Database_v1.2.pdf (last access: 11 March 2024), 2012.
Noilhan, J. and Lacarrère, P.: GCM Grid-Scale Evaporation from Mesoscale Modeling, J. Climate, 8, 206–223, https://doi.org/10.1175/1520-0442(1995)008<0206:GGSEFM>2.0.CO;2, 1995.
Noilhan, J. and Mahfouf, J. F.: The ISBA land surface parameterisation scheme, Glob. Planet. Change, 13, 145–159, https://doi.org/10.1016/0921-8181(95)00043-7, 1996.
Noilhan, J. and Planton, S.: A Simple Parameterization of Land Surface Processes for Meteorological Models, Mon. Weather Rev., 117, 536–549, https://doi.org/10.1175/1520-0493(1989)117<0536:ASPOLS>2.0.CO;2, 1989.
Page, R. C. J.: Reducing the cost of subsidence damage despite global warming, Struct. Surv., 16, 67–75, https://doi.org/10.1108/02630809810219641, 1998.
Quintana-Seguí, P., Le Moigne, P., Durand, Y., Martin, E., Habets, F., Baillon, M., Canellas, C., Franchisteguy, L., and Morel, S.: Analysis of near-surface atmospheric variables: Validation of the SAFRAN analysis over France, J. Appl. Meteorol. Climatol., 47, 92–107, https://doi.org/10.1175/2007JAMC1636.1, 2008.
Ravina, I.: The influence of vegetation on moisture and volume changes, Géotechnique, 33, 151–157, https://doi.org/10.1680/geot.1983.33.2.151, 1983.
Salagnac, J.-L.: Lessons from the 2003 heat wave: A French perspective, Build. Res. Inf., 35, 450–457, https://doi.org/10.1080/09613210601056554, 2007.
Soubeyroux, J.-M., Kitova, N., Blanchard, M., Vidal, J.-P., Martin, É., and Dandin, P.: Sécheresses des sols en France et changement climatique: Résultats et applications du projet ClimSec, La Météorologie, 8, 21–30, https://doi.org/10.4267/2042/47512, 2012.
Szczypta, C., Calvet, J.-C., Maignan, F., Dorigo, W., Baret, F., and Ciais, P.: Suitability of modelled and remotely sensed essential climate variables for monitoring Euro-Mediterranean droughts, Geosci. Model Dev., 7, 931–946, https://doi.org/10.5194/gmd-7-931-2014, 2014.
Tessier, D., Coquet, Y., Lefèvre, Y., and Bréda, N.: Rôle de la végétation dans les processus de propagation de la sécheresse dans les sols argileux, Rev. Française Géotechnique, 120–121, 35–43, https://doi.org/10.1051/geotech/2007120035, 2007.
Toreti, A., Bavera, D., Acosta Navarro, J., Cammalleri, C., de Jager, A., Di Ciollo, C. ., Hrast Essenfelder, A., Maetens, W., Masante, D., Magni, D., Mazzeschi, M., and Spinoni, J.: Drought in Europe – August 2022, 19 pp., https://doi.org/10.2760/264241, 2022.
Tzampoglou, P., Loukidis, D., and Koulermou, N.: Seasonal Ground Movement Due to Swelling/Shrinkage of Nicosia Marl, Remote Sens., 14, 1440, https://doi.org/10.3390/rs14061440, 2022.
Vidal, J.-P., Martin, E., Franchistéguy, L., Habets, F., Soubeyroux, J.-M., Blanchard, M., and Baillon, M.: Multilevel and multiscale drought reanalysis over France with the Safran-Isba-Modcou hydrometeorological suite, Hydrol. Earth Syst. Sci., 14, 459–478, https://doi.org/10.5194/hess-14-459-2010, 2010.
Vidal, J.-P., Martin, E., Kitova, N., Najac, J., and Soubeyroux, J.-M.: Evolution of spatio-temporal drought characteristics: validation, projections and effect of adaptation scenarios, Hydrol. Earth Syst. Sci., 16, 2935–2955, https://doi.org/10.5194/hess-16-2935-2012, 2012.
Wilks, D. S.: Statistical methods in the atmospheric sciences, 2nd edn., Int. Geophys. Series, Academic Press, Elsevier, 91, 627 pp., ISBN 13: 978-0-12-751966-1, 2006.
WMO and GWP: Handbook of Drought Indicators and Indices, in: Integrated Drought Management Programme (IDMP), Integrated Drought Management Tools and Guidelines Series 2, Geneva, edited by: Svoboda, M. and Fuchs, B. A., https://www.droughtmanagement.info/literature/GWP_Handbook_of_Drought_Indicators_and_Indices_2016.pdf (last access: 13 July 2023), 2016.