the Creative Commons Attribution 4.0 License.
the Creative Commons Attribution 4.0 License.
 | 05 Mar 2024
Nearshore tsunami amplitudes across the Maldives archipelago due to worst-case seismic scenarios in the Indian Ocean
Shuaib Rasheed
Simon C. Warder
Yves Plancherel
Matthew D. Piggott
The Maldives face the threat of tsunamis from a multitude of sources. However, the limited availability of critical data, such as bathymetry (a recurrent problem for many island nations), has meant that the impact of these threats has not been studied at an island scale. Conducting studies of tsunami propagation at the island scale but across multiple atolls is also a challenging task due to the large domain and high resolution required for modelling. Here we use a high-resolution bathymetry dataset of the Maldives archipelago, as well as corresponding high numerical model resolution, to carry out a scenario-based tsunami hazard assessment for the entire Maldives archipelago to investigate the potential impact of plausible far-field tsunamis across the Indian Ocean at the nearshore island scales across the atolls. The results indicate that the bathymetry of the atolls, which are characterized by very steep boundaries offshore, is extremely efficient in absorbing and redirecting incoming tsunami waves. Results also highlight the importance that local effects have in modulating tsunami amplitude nearshore, including the location of the atoll in question, the location of a given island within the atoll, and the distance of that island to the reef, as well as a variety of other factors. We also find that the refraction and diffraction of tsunami waves within individual atolls contribute to the maximum tsunami amplitude patterns observed across the islands in the atolls. The findings from this study contribute to a better understanding of tsunamis across complex atoll systems and will help decision and policy makers in the Maldives assess the potential impact of tsunamis across individual islands. An online tool is provided which presents users with a simple interface, allowing the wider community to browse the simulation results presented here and assess the potential impact of tsunamis at the local scale.
- Article
(6128 KB) - Full-text XML
- BibTeX
- EndNote


The 2004 Boxing Day tsunami is the single most significant natural disaster to hit the Maldives in nearly a millennium of recorded history. The widespread impact of the tsunami, the loss of human life and the economic impact of the event are unprecedented in the history of the country, with losses estimated at over 62 % of the gross domestic product (GDP), representing the highest relative losses of any affected country (World Bank and System, 2005). The severity of the aftermath highlighted the necessity of developing a better understanding of tsunami propagation in the Indian Ocean (Okal and Synolakis, 2008). Field studies aiming to quantify the amplitudes and inundation levels of the 2004 Boxing Day tsunami across the Maldives revealed that different regions of the Maldives experienced vastly different levels of damage in spite of them having similar elevation. These studies indicate that the geography of the islands and the source location of the tsunami strongly influence the amplitude and the inundation levels across the islands. (e.g. Fritz et al., 2006; Kan et al., 2007; Fujima et al., 2006).
Historical impacts of tsunamis are not well documented, and since large tsunamis occur with return periods in the hundreds of years and affect very large scales, data from such events have rarely been recorded since oceanic observations began (Synolakis and Bernard, 2006). As indicated by RMSI (2006), even though there is no documented historical record of a tsunami in the Maldives prior to the December 2004 event, despite a written history spanning nearly a millennium, it is highly probable that historical tsunamis generated from mega-thrust earthquakes in the Indian Ocean have impacted the Maldives. Along this line, Kench et al. (2006) also argue that the Maldives have been exposed to multiple tsunamis during the Holocene, but it is not possible to identify tsunami events from stratigraphic records due to the extremely dynamic geomorphology of coral islands. Other flooding events known to impact the Maldives, for example, those due to the periodic swells originating in the Southern Ocean impacting the south and central regions of the Maldives, as well as meteo-tsunamis in the form of local swells (Wadey et al., 2017), are also not well documented or well understood. More recently, Amores et al. (2021) calculated return periods and characteristics of these swell waves across the deeper regions of the Maldives archipelago through the analysis of global wave datasets.
It is essential to understand the impact of potential tsunami events across the country at the island scale to realize the effectiveness of safety measures, embodied by the “safe island concept” in the Maldives (Naseer, 2006), which plans to develop islands with protective measures against hazards such as tsunamis and to evaluate protective mitigation measures. High-resolution numerical simulations are necessary to fully understand the impact of potential tsunamis in the Maldives. Particular geographic features of the Maldives archipelago, through their role in modulating complex wave reflection and refraction patterns, have likely resulted in some regions experiencing the impact more than others. The ability to understand how local geography affects tsunami propagation within the archipelago represents a step change in disaster risk management for the Maldives. However, accurate island-scale tsunami simulations across the Maldives have not yet been carried out because, until recently, bathymetry data of suitable resolution were lacking. Here we employ a new bathymetry product built specifically for the Maldives (Rasheed et al., 2020). This product represents an amalgamation of new satellite-derived bathymetry ground-truthed with field data gathered over the past century (e.g. Gardiner, 1902, 1903; Sewell, 1936; Hass, 1965; Stoddart, 1966). This new product enables high-resolution ocean modelling across the archipelago and is used here to simulate, for the first time, the nearshore impacts of an array of plausible seismic scenarios in the Indian Ocean on the Maldives.
Tsunami propagation has been modelled at the single-island scale (e.g. Tonini et al., 2014, in the Seychelles and Gelfenbaum et al., 2011, and Dilmen et al., 2018, in Tutuila, American Samoa), at the single-atoll scale (e.g. Gica, 2015, considered Midway Atoll) and at large-basin scales (as used in tsunami warning systems). However, hydrodynamic simulations of tsunami propagation across and within large complex atoll systems, where local reflection and refraction patterns are simulated with sufficient resolution to account for local effects, are rare. Even where hydrodynamic simulations of such domains have been carried out, e.g. for Tokelau in the South Pacific (Orpin et al., 2016) and Xisha archipelago (also known as the Paracel Islands; Xie et al., 2019), complex multi-atoll interactions have not been considered. The Maldives archipelago, consisting of a string of multiple atolls, each characterized by many islands and bathymetric features, provides an excellent case study to assess tsunami propagation in a complex multi-atoll system and learn how across-atoll and within-atoll effects can influence the local impact of tsunamis.
Below we develop and discuss tsunami simulations for the Maldives designed to investigate the main factors that influence local variability in the maximum tsunami amplitudes across the islands. The analysis uses the better-observed 2004 Boxing Day tsunami to validate the model. The model is then run for various plausible far-field tsunami scenarios originating from around the Indian Ocean.
2.1 Geological setting
The Maldives archipelago stretches for approximately 900 km from north to south and lies in the central region of the Chagos–Laccadive Ridge, located in the central Indian Ocean. The archipelago consists of 25 geographic atolls, further classified as 16 complex atolls, five oceanic faros and four oceanic platform reefs (Naseer and Hatcher, 2004). The Maldives archipelago contains the world's largest atoll system, with numerous reefs numbering in excess of 2000, representing 5 % of the world's coral reefs (Emerton et al., 2009). Even though there are more than 1200 individual islands in the archipelago, the islands are very small, with the largest, Gan island in Hadhunmathi Atoll, being only 5 km2 in size. The islands are extremely flat, with their topography rarely exceeding an elevation of 2 m above mean sea level (ADB, 2020). Approximately 200 of the islands are inhabited, and numerous others are utilized for other purposes, especially for the tourism industry and the development of luxury resorts. Limited usable exposed land, rapid population growth in the past few decades and competition for land use have led to a state of scarcity such that land reclamation is now taking place across the archipelago on an industrial scale (Duvat and Magnan, 2019). Studies indicate that the coastline of nearly all inhabited islands of the Maldives has been modified in the past few decades to cater for this growth (ADB, 2020). This in turn has an impact on the flow regime of the atolls (Rasheed et al., 2021, 2020).
While it has been hypothesized that the complex bathymetry of the archipelago, shown in Fig. 1b, contributed to attenuated tsunami amplitudes across the archipelago during the 2004 Boxing Day event (Fritz et al., 2006), a quantitative test of this hypothesis has never been attempted. As can be seen in Fig. 1, one of the most prominent bathymetric features is the steep depth gradient characterizing the atolls and the lagoons, giving rise to the “leaky bucket” concept that is used to describe flow in and out of the atoll systems (Betzler et al., 2016).
The northern atolls of the Maldives are generally characterized by few exposed islands, separated by numerous channels with depths of about 30 m, with small individual reefs hosting islands (Riyaz and Suppasri, 2016). The southern atolls tend to be more continuous, comprising large shallow lagoons with multiple islands and fewer deep channels. Most large islands of the Maldives have developed on the rims of the atolls, with the central lagoon of most atolls devoid of any large islands (Luthfee, 1995).
Towards the open ocean, the bathymetry rapidly drops from just below sea level to more than 1000 m within 1 km from the atoll rim. Even towards the atoll basins where the depths are much shallower, this steepness is evident in bathymetry charts. The bathymetry of the channels between the atolls varies across the archipelago; in the inner sea of the Maldives, which separates the double chain of atolls in the central regions of the archipelago running north to south, the bathymetry varies from 300 m to more than 500 m, gradually deepening towards the southeast. In the southern region, the depths of the channels between the atolls are in excess of 1000 m (Luthfee, 1995).
2.2 Seismic scenarios
To build confidence in the model, we initially consider the 2004 event for validation against observational data. We employ the fault mechanism defined by Grilli et al. (2007), which discretizes the fault mechanism into five fault plates, as the primary tsunami-generating mechanism. Poisson et al. (2011) studied the event using various source models in numerical simulations with nested models of Sri Lanka and concluded that the fault model described by Grilli et al. (2007) is adequate for hydrodynamic modelling. This mechanism has also been used by a number of other studies to model the impact of the 2004 Boxing Day tsunami across the Indian Ocean, e.g. in the Seychelles (Tonini et al., 2014).
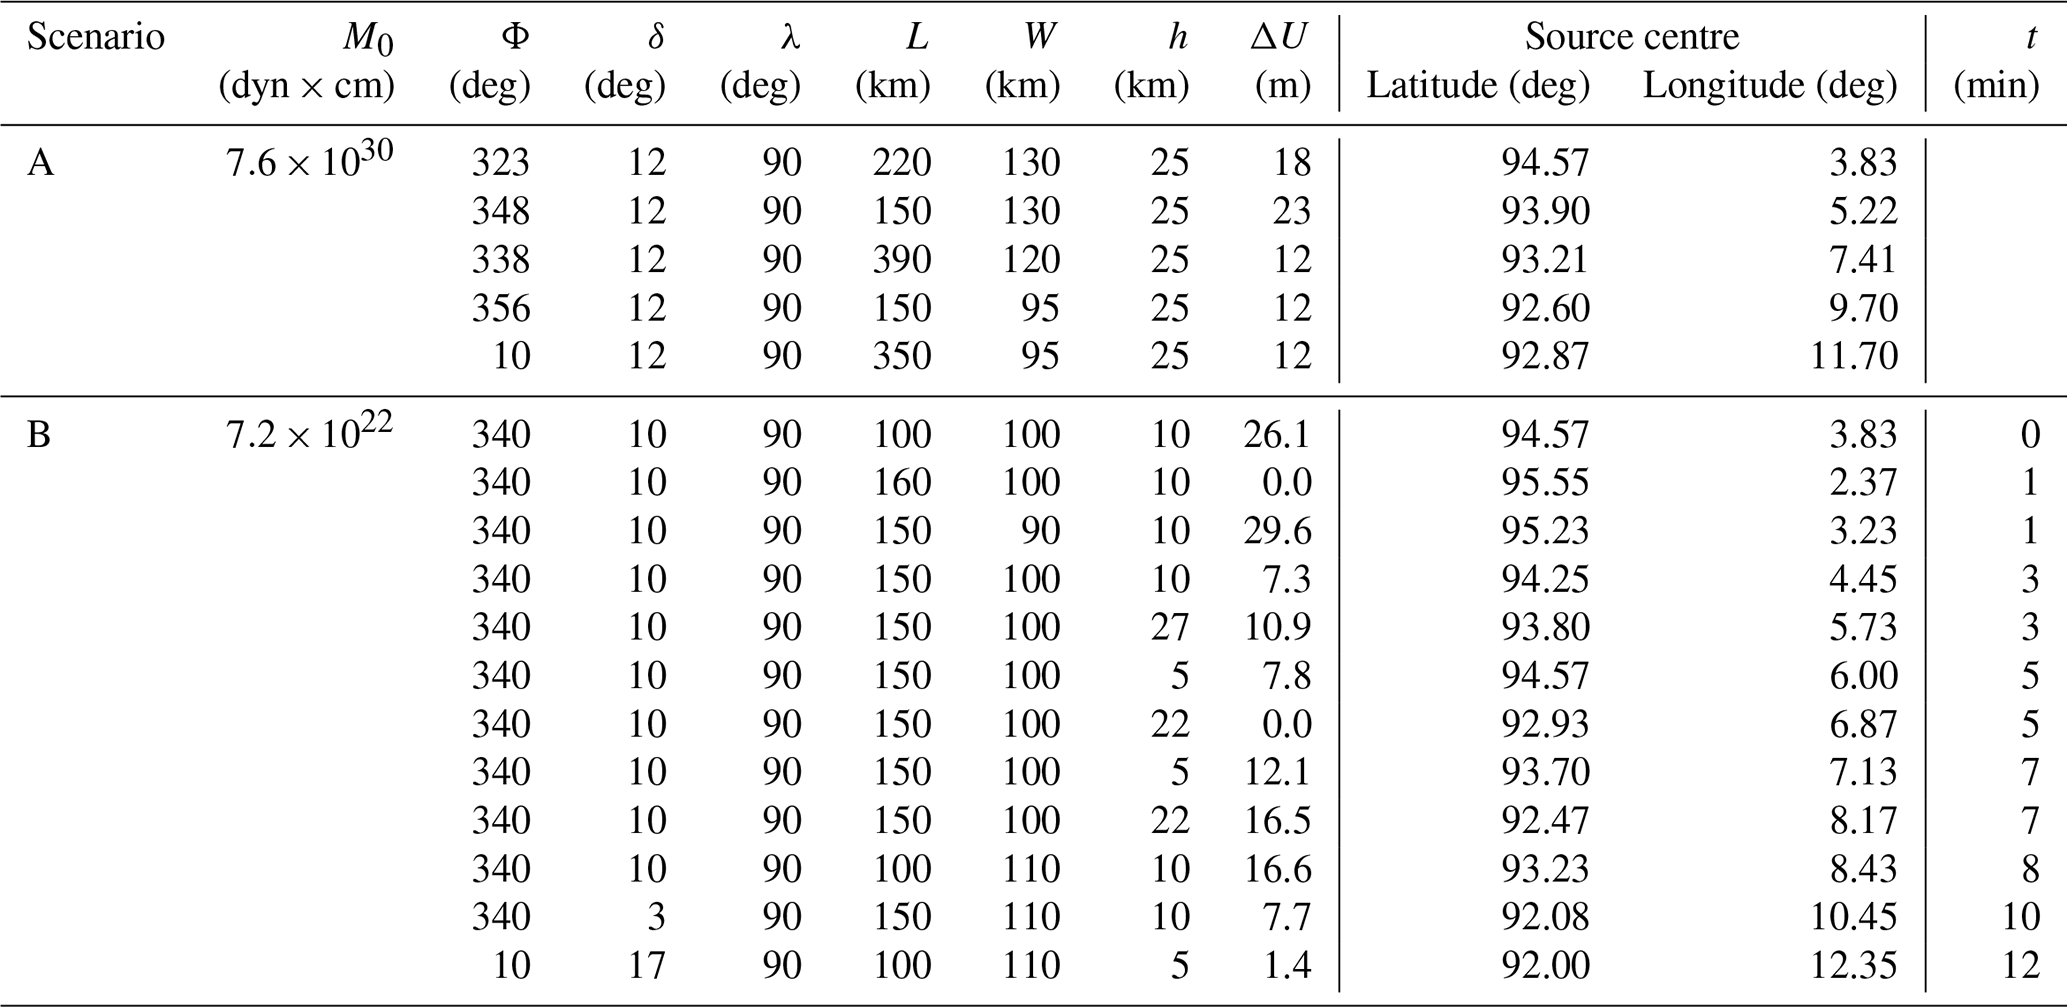
To test the sensitivity of our results to the tsunami source model, we also employ here a multi-dimensional seismic scenario of the Boxing Day event, as defined by Tanioka et al. (2006), in addition to the simple fault model described by Grilli et al. (2007). The more complex model involves 12 fault plates in the spatial domain and also includes a temporal discretization of each fault plate. Harig et al. (2008) also used the more complex fault model identified in Tanioka et al. (2006) to study the nearshore impacts in Indonesia and obtained results comparable to field data. By simulating two fault models, we can evaluate the impact of the fault model on the simulated tsunami. These two scenarios are labelled A (the 5-subfault case, Grilli et al., 2007) and B (the 12-subfault case, Tanioka et al., 2006). The parameters for each subfault for these two scenarios are summarized in Table 1.
Table 1Summary of the seismic scenarios used to simulate the 2004 Indian Ocean tsunami. Fault mechanisms for scenario A from Grilli et al. (2007) and scenario B from Tanioka et al. (2006).
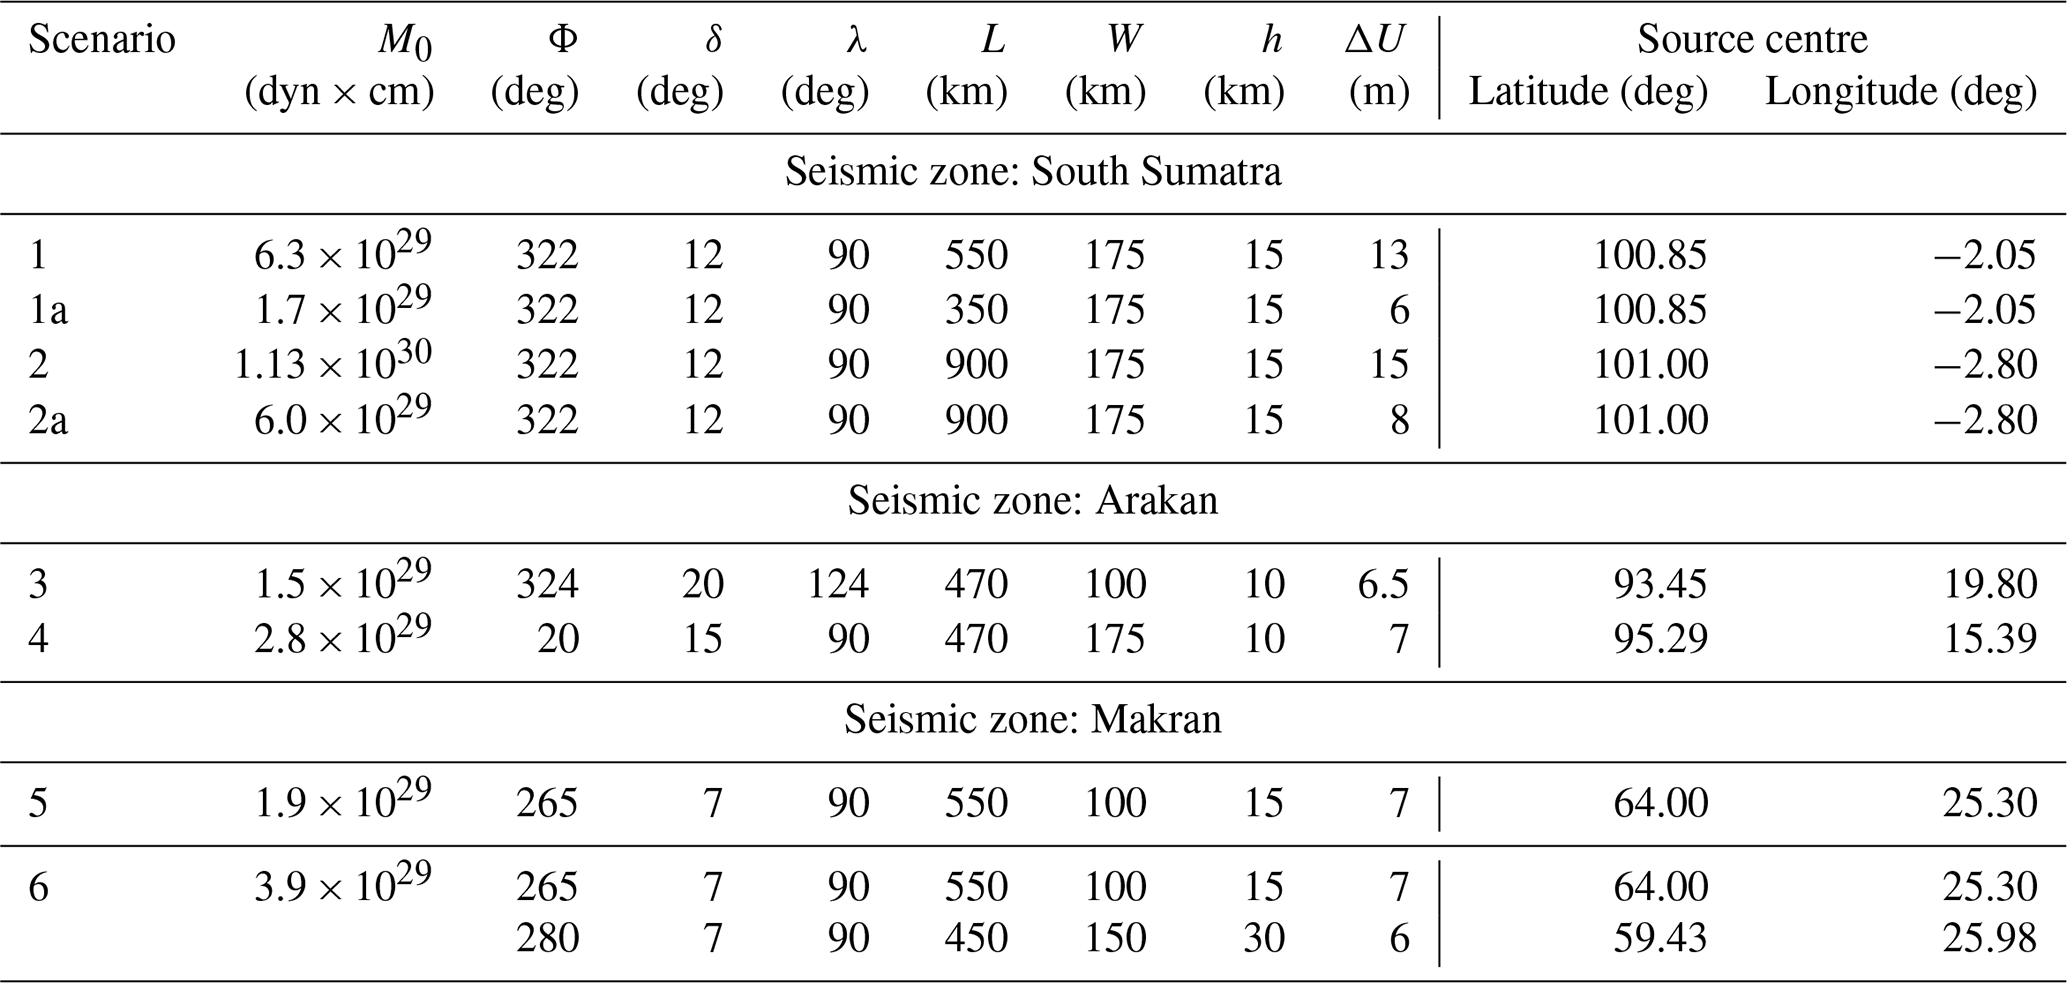
Further, Okal and Synolakis (2008) identified 11 worst-case seismic scenarios across the Indian Ocean which are capable of generating transoceanic tsunamis, akin to the 2004 Boxing Day event. They carried out tsunami simulations for these scenarios, assessing the large-scale impact across the Indian Ocean. Wijetunge (2012) used these seismic scenarios to assess the resulting tsunami amplitudes at higher resolution along the coast of Sri Lanka. Here we consider eight selected scenarios (out of the 11 available from Okal and Synolakis, 2008). These eight scenarios are selected in order to assess the potential impact of some of the most-likely tsunamis that could affect the Maldives and to assess the role of across-atoll and within-atoll effects. The selected scenarios are detailed in Table 2, their fault origins are shown in Fig. 1 and they are described below.
Table 2Summary of the eight plausible fault mechanisms across the Indian Ocean proposed by Okal and Synolakis (2008), which we consider in this study.
-
South Sumatra subduction zone. Studies such as RMSI (2006), which provide return periods for various hazards associated with the Maldives, predict return periods of approximately 140 years for tsunamis with amplitudes greater than 2 m in the Maldives that originate from the South Sumatra subduction zone. Given this relatively short return period, we consider all four plausible worst-case scenarios from Okal and Synolakis (2008), as summarized in Table 2, with probable impact in the Maldives. Scenario 1 represents a repeat of the 24 November 1833 earthquake, which is reported to have generated a small tsunami observed as far west as the Seychelles. Scenario 2 represents the plausible worst-case scenario for the 1833 earthquake with the same focal geometry but with an extended fault length of 900 km and increased slip of up to 15 m, releasing a total moment equivalent to the 26 December 2004 megathrust event. Scenarios 1a and 2a are modifications of scenarios 1 and 2, which account for the energy accumulated along the fault plane since 1833, taking into account the energy released due to the 2007 Bengkulu earthquake.
-
Arakan subduction zone. Two plausible fault mechanisms capable of tsunamigenesis with implications in the far field are simulated for the Arakan subduction zone (Table 2). Scenario 3 represents the fault mechanism for the 1762 Bangladesh–Myanmar earthquakes. Scenario 4 represents a less probable but plausible fault mechanism accounting for the residual energy from the 2004 megathrust event. Despite the lack of evidence that a large tsunami greater than 2 m in the Maldives could originate from the Arakan subduction zone due to the bathymetry of the Bay of Bengal (Okal and Synolakis, 2008), we include these scenarios that originate in the Arakan subduction zone as RMSI (2006) predicts tsunamis from this region to have the shortest return period, with significant impact on the Maldives amongst all the regions of origin considered in this study.
-
Makran subduction zone. We consider two fault scenarios originating from the Makran subduction zone. Scenario 5 considers the combined mechanisms of the ruptures in the three easternmost zones of the fault line as per Byrne et al. (1992), which corresponds to the combined fracture zones triggering the 1851–1864, 1945 and 1765 earthquakes. Scenario 6 further adds the plausible fault zone corresponding to the 1483 earthquake, extending the fault line further west. RMSI (2006) predicts relatively long return periods for tsunamis that impact the Maldives that originate from the Makran subduction zone, with a return period just over 250 years for a tsunami with amplitudes of 2 m in the Maldives.
2.3 Numerical simulations
In this study, simulations are carried out using Thetis, a 2D (Angeloudis et al., 2018) and 3D (Kärnä et al., 2018; Pan et al., 2019) finite-element flow solver, built using the Firedrake framework (Rathgeber et al., 2016). We employ Thetis in its 2D configuration, which solves the depth-averaged shallow water equations in non-conservative form, given by
where η is the free-surface displacement (m), Hd is the total water depth (m), u) with x and y components u and v respectively, and ν is the kinematic viscosity of the fluid (m). The term fu⟂ represents the Coriolis force, where f=2Ωsin (ζ), Ω is the angular rotation of the Earth, ζ the latitude and u⟂ the velocity vector rotated 90°.
The model uses a discontinuous-Galerkin finite-element discretization (DG-FEM), using the P– finite-element pair. For time stepping, we employ a semi-implicit Crank–Nicolson scheme, with time step Δt= 5 s.
The model treats wetting and drying via the formulation of Kärnä et al. (2011), which introduces a modification to the water depth f(Hd), such that the modified depth is given by . The function f(Hd) is selected such that is always positive, and this modified depth is simply substituted for Hd within the governing Eq. (1). Following Kärnä et al. (2011), we define f(Hd) as
where α is a tunable constant which for all simulations in this work is set to α=2.0 m. Although inundation is not the focus of this work, we found that the introduction of a small minimum depth decreases the computation time of the simulation.
Bed shear stress τb is implemented through Manning's n formulation as
To derive the free-surface elevation from the fault parameters, we use the Okada analytical formulae (Okada, 1992) and assume that the initial instantaneous free-surface water displacement is equal to the seafloor displacement and impose these as either the initial condition or at the appropriate time in the model (Table 1).
2.3.1 Model setup
Each scenario was initially run in a domain which spatially extended across the Indian Ocean as seen in Figs. 1a and 2a, as well as a nested simulation focused on the Maldives archipelago, as seen in Figs. 1b and 2b. Absorbing boundary conditions were set using a sponge region of increased viscosity at the open boundaries of the full simulation. For the nested simulation, tsunami amplitudes from the full simulation were used to force the model at the domain boundary depending on the direction of the tsunami wave; i.e. here a one-way coupling approach was employed. Tidal forcing was not taken into account, as earlier studies of tidal amplitudes (Rasheed et al., 2020) have shown that the tidal regime of the region is very small, with maximum variations of 1 m from the mean sea level.
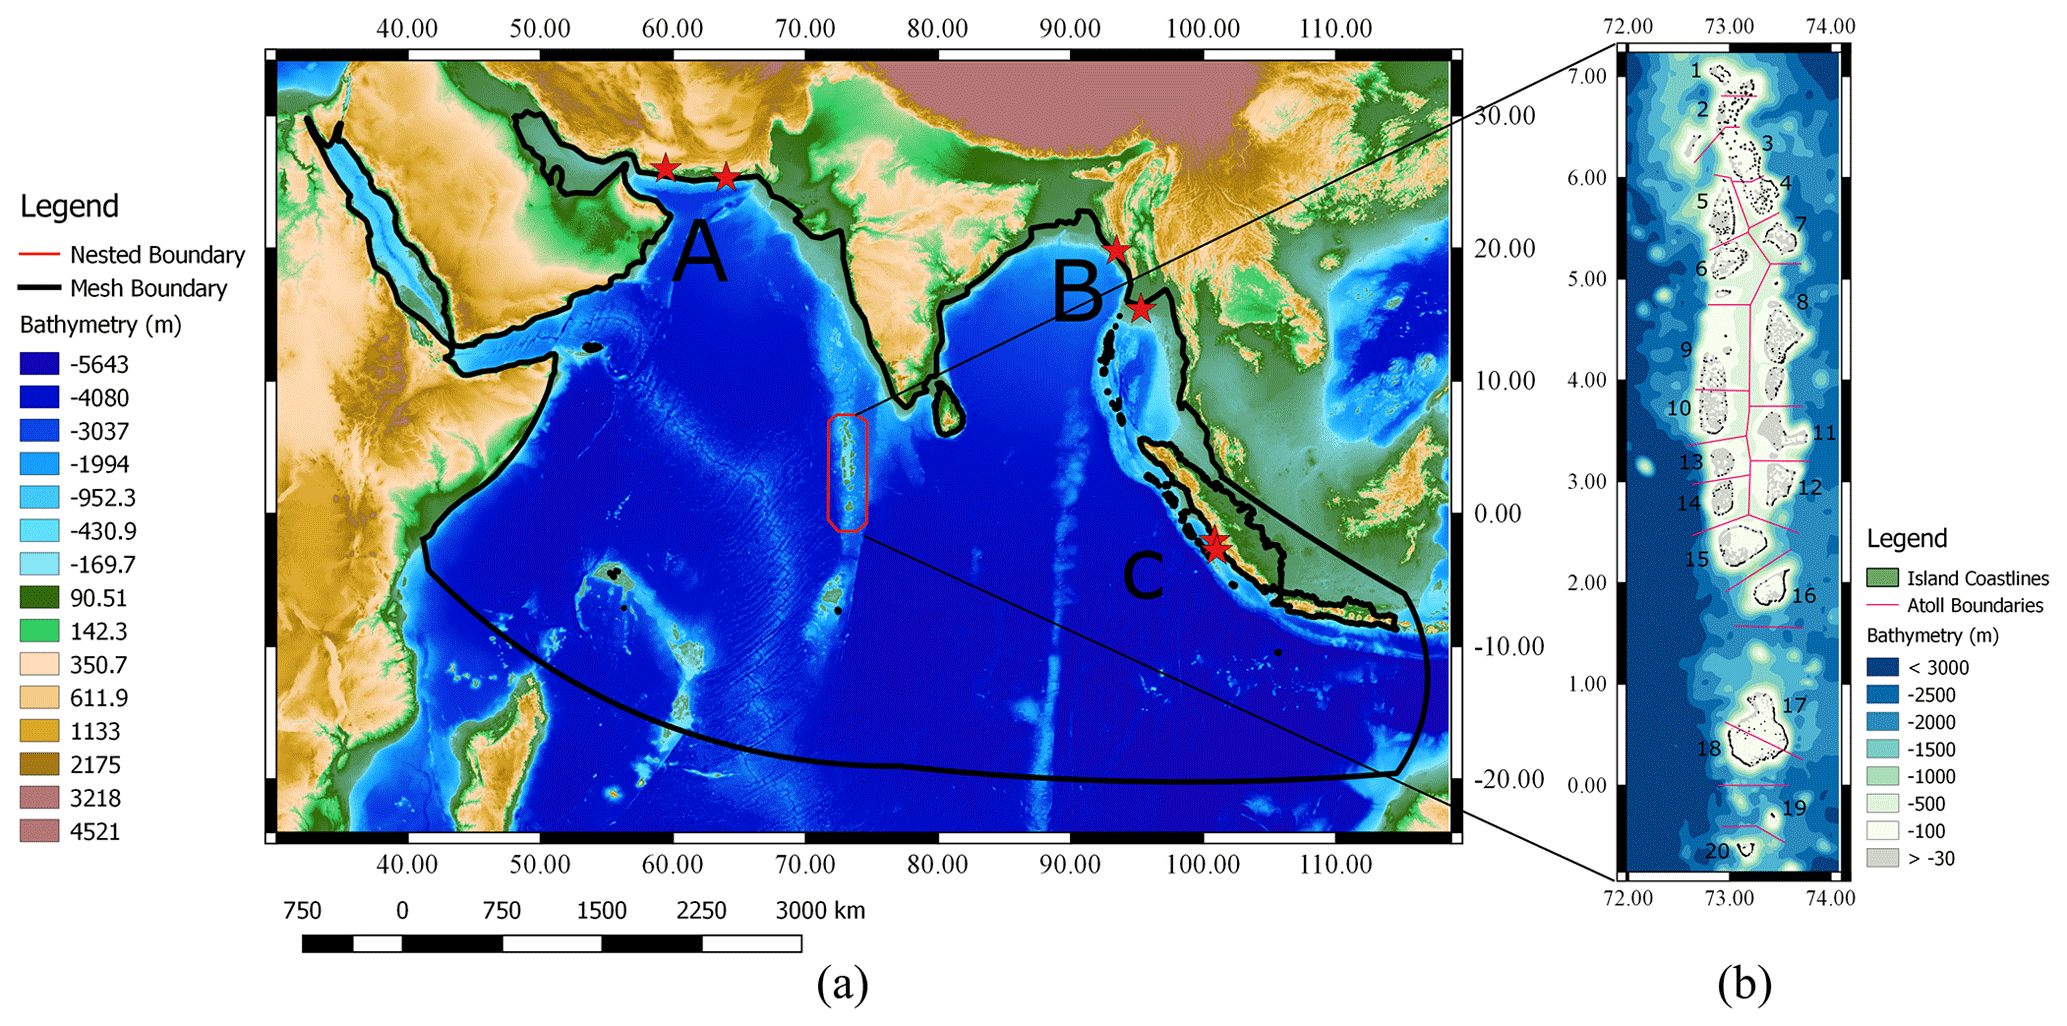
Figure 1(a) Bathymetry of the Indian Ocean and topography of the region from GEBCO 2019 (Weatherall et al., 2015) and (b) the bathymetry of the Maldives as per Rasheed et al. (2020) used for the nested high-resolution modelling. The seismic zones of fault origins (marked by red stars) are labelled in panel (a) as A – Makran subduction zone; B – Arakan subduction zone; and B – South Sumatra subduction zone. The current administrative atoll boundaries of the Maldives archipelago are shown in panel (b) and labelled using official names as (1) North Thiladhunmathi, (2) South Thiladhunmathi, (3) North Miladhunmadulu, (4) South Miladhunmadulu, (5) North Maalhosmadulu, (6) South Maalhosmadulu, (7) Faadhippolhu, (8) Malé, (9) North Ari, (10) South Ari, (11) Felidhe', (12) Mulaku, (13) North Nilandhe, (14) South Nilandhe, (15) Kolhumadulu, (16) Hadhunmathi, (17) North Huvadhoo (also known as Huvadhu), (18) South Huvadhoo, (19) Fuvahmulah and (20) Addu Atoll.
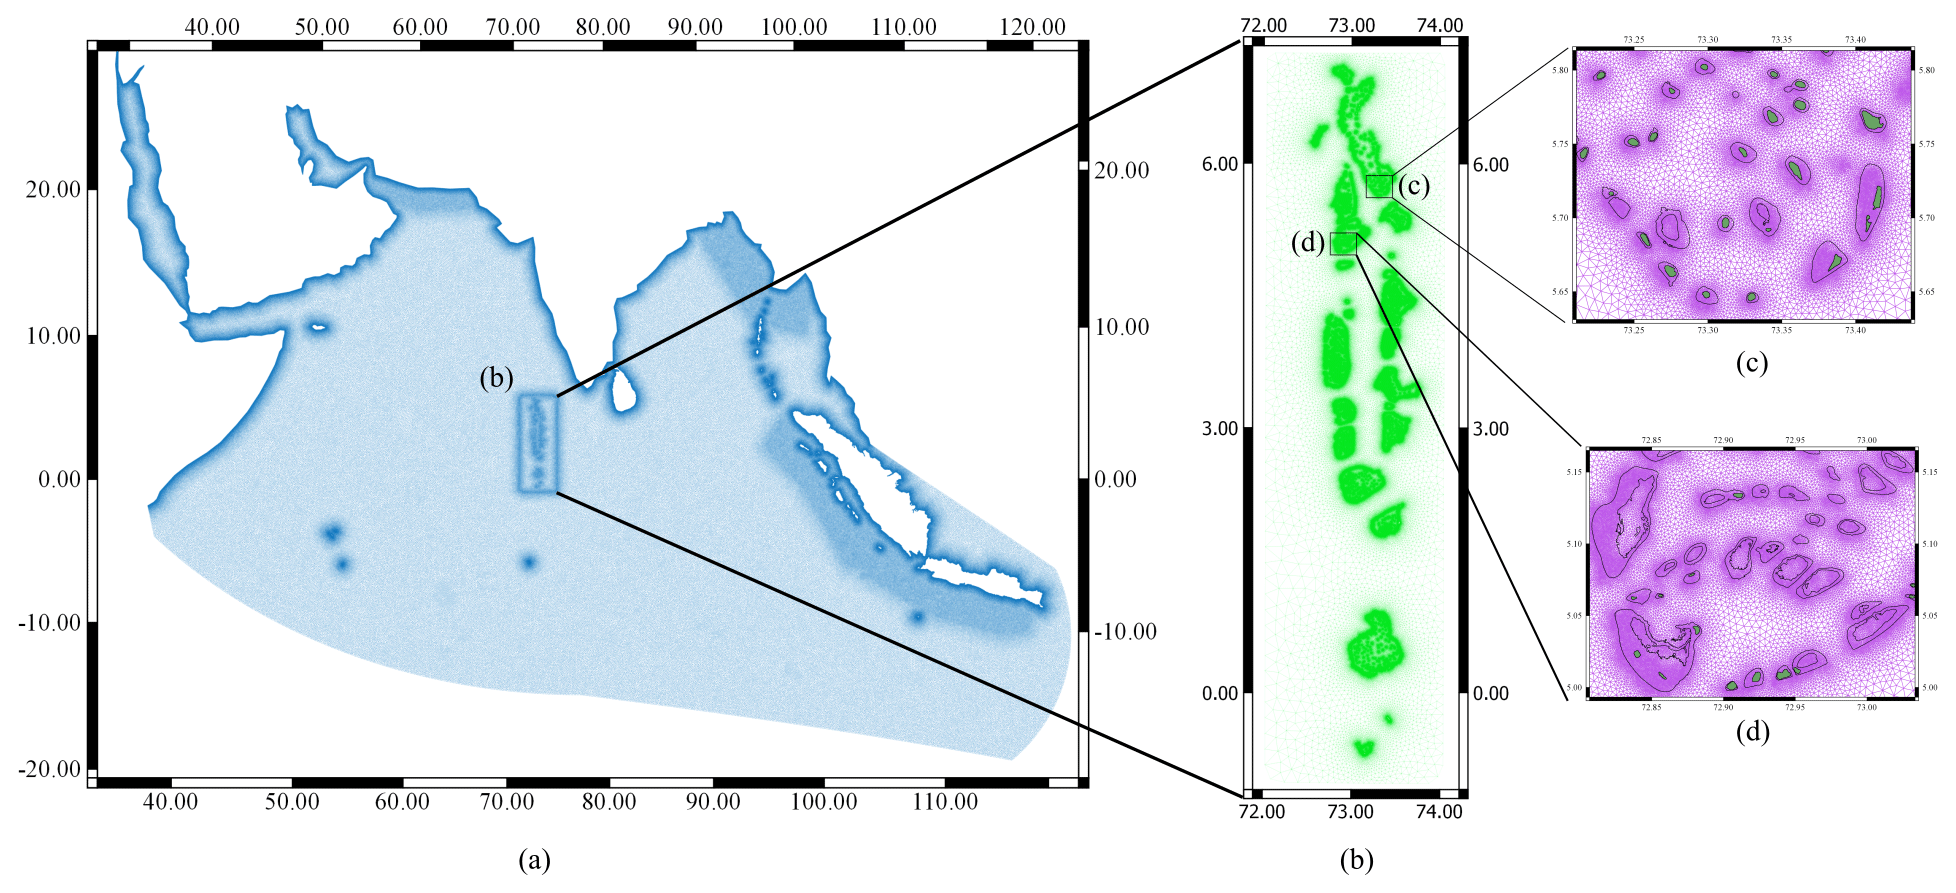
Figure 2(a) The unstructured mesh used for the full simulation, showing increased mesh resolution around fault zones and coastal areas. (b) The unstructured mesh used for the nested simulations showing increased resolution near the Maldives archipelago. Panel (c) highlights discontinuous reefs of South Miladhunmadulu Atoll, while panel (d) zooms in on the unique faro system of South Maalhosmadulu Atoll.
2.3.2 Bathymetry
We used the GEBCO 2019 global bathymetry dataset (Weatherall et al., 2015), as seen in Fig. 1a, for the large-scale simulation, but a finer bathymetry dataset is essential to run meaningful regional hydrodynamic simulations at the scale of atolls and islands as demonstrated by Rasheed et al. (2020). This is particularly important for the complex atoll systems of the Maldives archipelago where bathymetry can vary from being at sea level to extreme depths within a small spatial distance. The high-resolution bathymetry dataset of the Maldives of Rasheed et al. (2020) (see Fig. 1b) is therefore used for the nested simulations. The use of this new bathymetry dataset is essential: field studies by Riyaz et al. (2010) and Riyaz and Suppasri (2016), which analysed various statistical correlations between island size, shape and distance to reef edge with respect to the impact of the 2004 Boxing Day tsunami across the Maldives, suggested that small-scale features present within the atolls likely affect wave propagation and therefore tsunami impact. Fujima et al. (2006) carried out a numerical simulation of the 2004 tsunami event using a bathymetry dataset with a spatial resolution of 2 arcmin and highlighted the need for more accurate bathymetry data to account for the complex bathymetry of the atolls. The bathymetry dataset used here has been used previously for hydrodynamic modelling of the Maldives at the atoll scale (Rasheed et al., 2020) and archipelago scale (Rasheed et al., 2021) and has been successfully validated against qualitative and quantitative field data.
2.3.3 Coastline data
The simulation domain contains a wide variety of coastlines, ranging from numerous small islets in the range of tens of metres to continental shorelines in the range of thousands of kilometres. Following the study by Rasheed et al. (2021), we used the GADM database (Areas, 2018), as illustrated in Fig. 1b, to represent the coastlines of the islands of the Maldives in the nested simulation, and no islands or islets were removed. For the full simulation, we used the low-resolution GSHHG coastline data from Wessel and Smith (2013) (see Fig. 1a), from which we removed smaller islands as the emphasis of this study is the impact of potential tsunamis across the islands of the Maldives archipelago, and large-scale propagation is not affected by the presence of small-scale islands.
2.3.4 Bed friction
A uniform Manning friction parameter of 0.025 s m was applied across the domain for both the full and the nested simulations, and the minimum water depth was set as 0.1 m, applying a quadratic drag coefficient (CD) that varies with the bathymetry, between ∼ 0.0005 in the open ocean and ∼ 0.026 in shallow areas. These values are in line with Kraines et al. (1998), who reported similar values in shallow water lagoons and reefs characteristic of the Maldives. Dilmen et al. (2018) studied the impact of bed friction on tsunami amplitudes in a reef environment and found that the use of different bed friction values yields varying results within different geographic areas in a reef environment. Here, we use these generic values, as bed friction for coral atolls such as that of the Maldives is not sufficiently known (Rosman and Hench, 2011).
2.3.5 Unstructured mesh generation
The Python package qmesh (Avdis et al., 2016, 2018) was used to generate the meshes used for the simulations within this work. The mesh for the full simulation, shown in Fig. 2a, contains 444 865 nodes and 889 852 triangular elements. The meshes were generated in the UTM43N coordinate reference system, the mesh element size was set to 15 km in the open regions, and a refinement of 2500 m was applied towards continental coastlines and large islands. A further refinement of 5000 and 7500 m was set at the atoll boundaries of the Maldives archipelago and fault regions. Very small features such as small islands were excluded from the full simulation mesh, while all islands of the Maldives were included in the nested simulation (see Sect. 2.3.3).
For the higher-resolution nested simulation covering the Maldives area, we use a high-resolution mesh which contains 1 156 656 nodes and 2 314 856 triangular elements. The mesh element size varied from 10 km at the open boundaries to 50 m at the coastline of the islands of the Maldives. Further refinement of 100 m was applied towards the shallow lagoon areas as shown in Fig. 2 (b1) and (b2). These mesh refinement scales were selected based on the mesh resolution study by Rasheed et al. (2021), which showed that this scale of refinement is necessary to fully capture the numerous small-scale features of the complex atolls of the Maldives. Further sensitivity testing is considered in the following section.
3.1 Model sensitivity
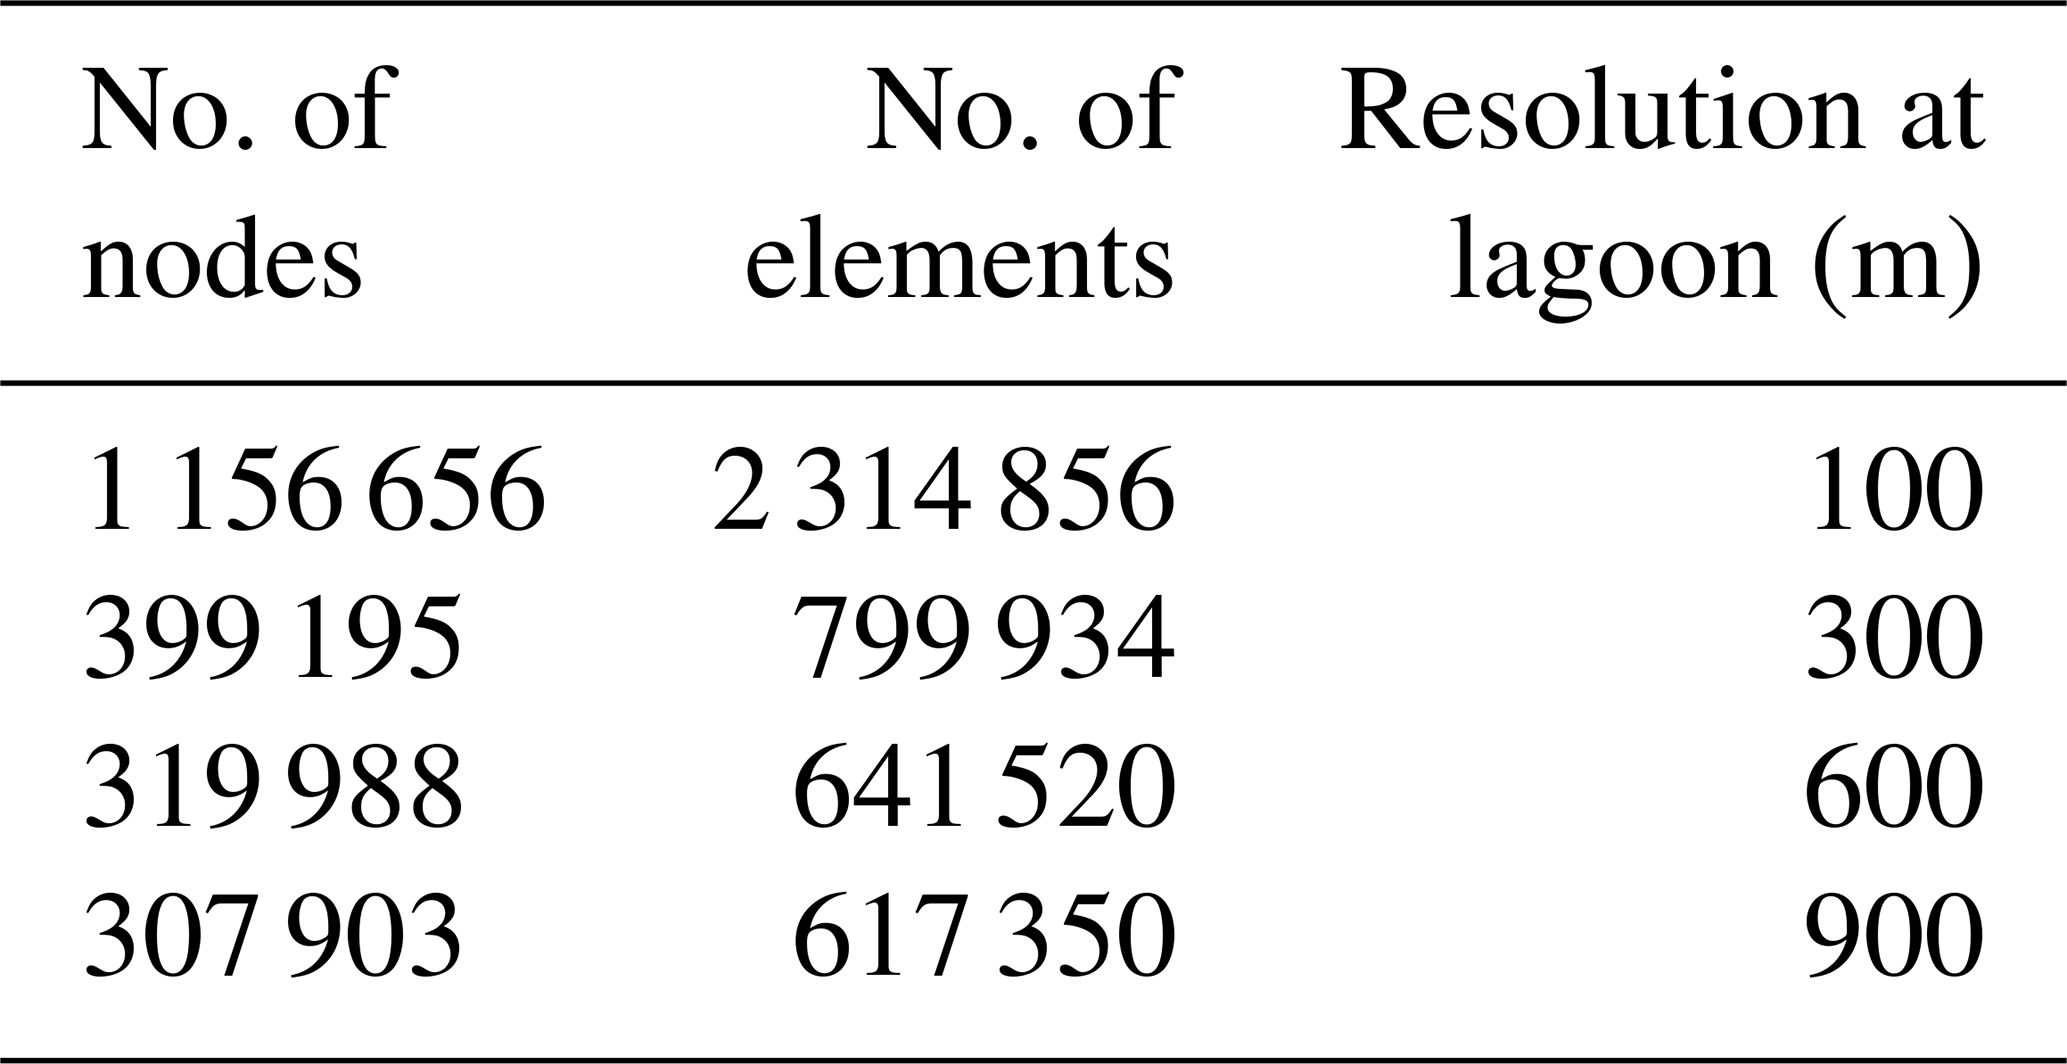
To select the most appropriate mesh resolution and the fault model used for the study, initially we ran a series of numerical simulations for a series of different meshes as summarized in Table 3. To quantitatively compare the performance of the models, we use the Pearson correlation coefficient, defined as
where N is the number of data points, On and Mn are the observed and modelled values, and and are the means of the observed and modelled values. This metric was used to quantify agreement in tsunami heights between simulations and field data for the 2004 event at 41 locations across the country, where field data are available.
Table 3Summary of the different meshes used for the study. The mesh resolution at the coastlines was set at 50 m and permitted to gradually increase in size up to 15 km towards the open boundaries.
Before we present the results for the mesh sensitivity study, we provide an introduction to the validation data that were used throughout this study.
3.2 Simulations of the 2004 Boxing Day tsunami
The Indian Ocean tsunami of 2004 provides observational data, which can be used for model validation purposes. Various investigators have gathered field data across the Maldives archipelago, documenting the aftermath of the 2004 tsunami. Since we here use both qualitative and quantitative data from these sources, we first present a brief summary of surveys carried out in the Maldives that report tsunami amplitudes at different points across the archipelago and then compare results from the 2004 Boxing Day simulations with these field observations.
3.2.1 Observed tsunami amplitudes from field surveys
Fritz et al. (2006) carried out a field survey across 11 islands in the central Maldives, which included the islands worst affected by the 2004 Boxing Day tsunami. The survey noted that the low-lying nature of the islands, likely combined with the local bathymetry, resulted in complete flooding of the islands surveyed and that classic tsunami features such as different inundation lines at different elevations and tsunami run-up could not be observed. The maximum tsunami heights reported in the study are of order 1 to 4 m, but these were noted to be less than half of the values reported in east Africa at almost twice the distance.
Fujima et al. (2006) carried out a similar survey across seven Maldivian atolls, with similar conclusions to Fritz et al. (2006). The survey of Fujima et al. (2006) also included locations with tide gauges in the north, south and central regions of the archipelago. The survey results of Fujima et al. (2006) highlight the high degree of regional variability of the tsunami amplitudes along the coastlines and between islands, even if the islands show little variation in topography. For instance, the tide gauge in Gan island, Seenu Atoll (also known as Addu Atoll), recorded tsunami amplitudes of less than 1 m, but survey results from the field study revealed that tsunami amplitudes across the island in the vicinity of the tide gauge varied by more than 1 m.
Kan et al. (2007) carried out an extensive survey across 43 islands of the archipelago to observe the impact of the tsunami, focusing on islands along the eastern rim of the archipelago, where the initial tsunami surge hit the islands. In addition to inundation heights, the Kan et al. (2007) survey also reports the cross-sectional topography of the islands for the locations surveyed, providing a snapshot of the tsunami wave in the local vicinity of the islands and the impact of local topography on inundation across the islands.
Survey results from all of these field studies are included here. However, where the spatial distances between the field observations are very small, we considered the measurement which was closest to the coastline, since the model used here does not capture inundation of islands as explicit simulations of inland flooding would require high-resolution data capturing land features, which is not currently available.
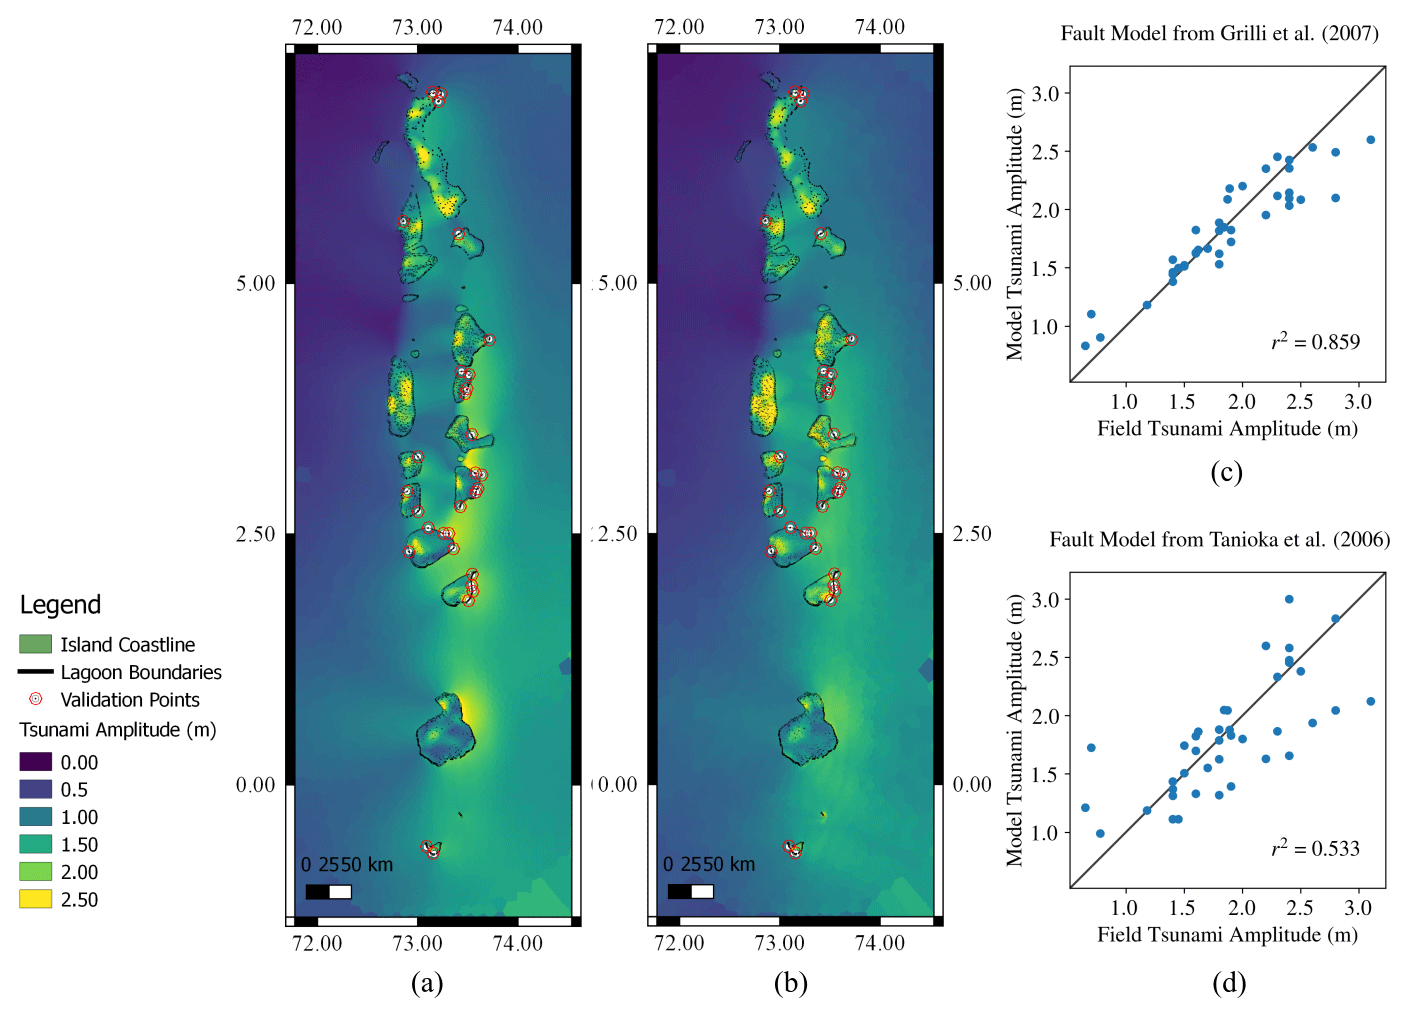
Figure 3Maximum tsunami amplitude across the Maldives, modelled using (a) the fault model described in Grilli et al. (2007) (scenario A) and (b) a multi-scale fault model described in Tanioka et al. (2006) (scenario B). Panels (c) and (d) compare simulated tsunami amplitudes with observations from field surveys for 41 validation points, for scenarios A and B, respectively.
3.2.2 Mesh sensitivity
Figure 4 presents the results of the numerical sensitivity study carried out using the fault model given by Grilli et al. (2007). The correlation metric is based on comparing the simulated and observed maximum amplitudes from across the archipelago, as discussed in Sect. 3.2.1. The results show that model outputs are very sensitive to the mesh resolutions used at the lagoons. The use of 100 m mesh resolution at the lagoon boundaries produces a correlation (R2) of approximately 0.9, while using larger mesh element sizes at the lagoon produces significantly lower correlations. Based on these results, we proceed with the mesh featuring 100 m resolution at the lagoons. While the sensitivity study suggests that refinement of the mesh at the lagoon boundaries even further may improve the correlation, as seen in Table 3, this will result in a very large number of mesh elements, making the computational cost prohibitive. Further, the island coastlines within the lagoons are meshed with a resolution of 50 m, improving the overall mesh.
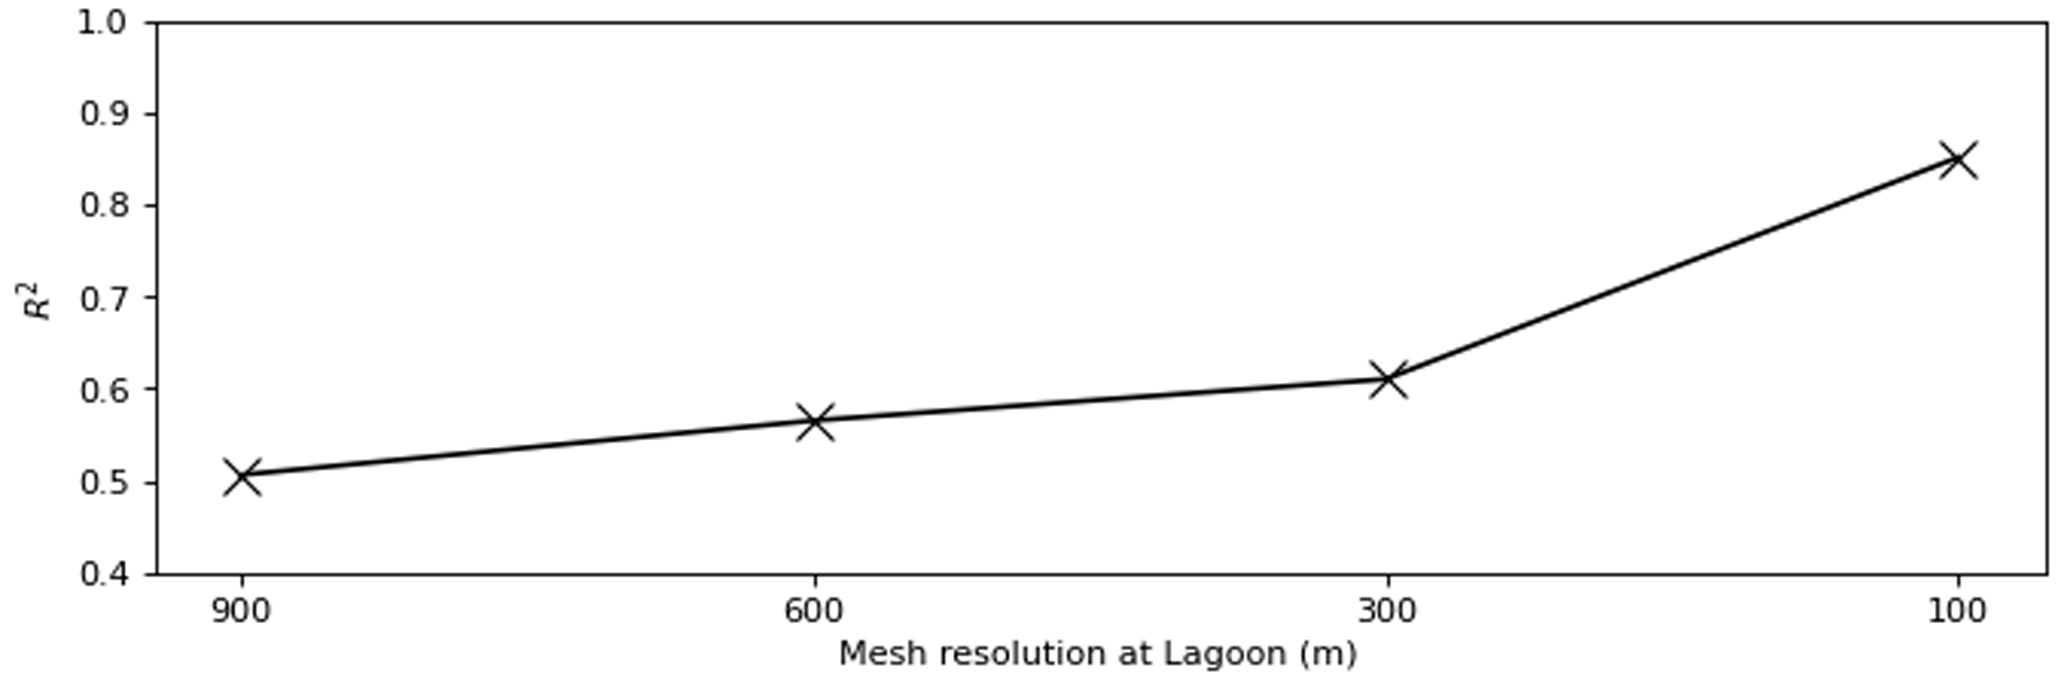
Figure 4Correlation between the field observations and simulated maximum amplitudes for different mesh resolutions at the lagoon.
Initially, we test the capacity of the meshes to accurately represent the bathymetry of the domain. This is of particular interest here as the complex bathymetry of the domain is predicted to govern the tsunami flow pattern across the domain. We linearly interpolated the high-resolution bathymetry onto each of the meshes. The correlation between the meshes and the high-resolution original bathymetry given in Fig. 5 shows that all of the meshes used for the simulation were able to represent the bathymetry with a high degree of correlation (> 90 %), with the usage of 100 m mesh lengths across the lagoons providing up to 98 % correlation, which is in line with results from Rasheed et al. (2021) for a single administrative atoll in comparison to the entire archipelago considered here.
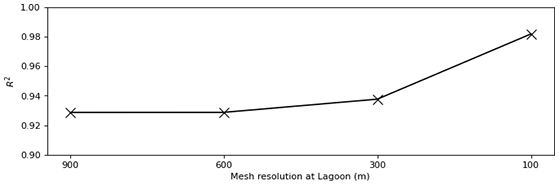
Figure 5Correlation between the interpolated bathymetry onto the mesh and the original high-resolution bathymetry dataset for different element sizes at the lagoon.
Since, all of the meshes considered in the bathymetry sensitivity study provided correlations above 90 %, we used all of the meshes to study the sensitivity of the simulation outputs to mesh resolution.
3.2.3 Sensitivity to fault model
With a distance of over 2000 km from the fault origin, the Maldives qualifies as far field for the 2004 Indian Ocean tsunami, and the use of different fault models is generally not expected to result in significant differences (Okal and Synolakis, 2008). However, we observe differences in maximum tsunami amplitudes for the simulations when the fault model is changed as seen in Figs. 3 and 6. These differences arise from differences in the seismic moment and fault geometry inherent to the two fault models (see Table 1).

Figure 6Maximum tsunami amplitude across (a) Huvadhoo Atoll and the region around the islands of (b) Vilufushi (northeast Kolhumadulu), (c) Kolhufushi (southeastern Mulaku Atoll), and (d) Vaanee and Gemendhoo (southeastern zone of South Nilandhe Atoll), (a–d) using the fault model by Grilli et al. (2007) and (e–h) using the fault model by Tanioka et al. (2006).
Comparison of model results with field data indicates that the results using the fault model of Grilli et al. (2007) and the more complex fault model of Tanioka et al. (2006) are consistent in predicting the regions of maximum impact across the archipelago (Fig. 3a and b). Both simulations predict large variations in tsunami amplitude across very small spatial distances, in line with field observations and consistent with expectations given the complex nature of the bathymetry and coastline of the islands, which is for the first time incorporated in these high-resolution results.
Using the Pearson correlation coefficient to quantify the agreement between the simulated and observed tsunami amplitudes, Fig. 3c and d show that a correlation coefficient of 0.9 was obtained for scenario A (using the fault model by Grilli et al., 2007), while the corresponding value obtained for scenario B (using the fault model by Tanioka et al., 2006) is 0.73. This shows that the maximum tsunami elevations are highly sensitive to fault parameters.
We also note that the islands of the southeastern Kolhumadulu Atoll, the northeastern Mulaku Atoll and the eastern Hadhunmathi Atoll are shown by the model to experience the maximum impact (see Fig. 3). Kan et al. (2007) report that the islands in this zone experienced the maximum damage across the archipelago, observations that are consistent with the model outputs obtained here. Out of the 106 persons either missing or known to have died across the archipelago, this region alone accounted for at least 78. The islands on the northeastern zone of Huvadhoo Atoll (Fig. 6a and e) were both inhabited and also reported fatalities; the model simulations also predict high tsunami amplitudes there. The southeastern zone of South Nilandhe Atoll and the inner atoll basin regions of several atolls, such as North Maalhosmadulu and South Nilandhe Atoll, are also predicted by the model to have high maximum tsunami amplitudes.
These differences are in line with results from Poisson et al. (2011), who also found differences in modelled tsunami amplitudes across the coast of Sri Lanka when different fault mechanisms were used for the 2004 event. Figure 6a–h show maximum tsunami amplitudes simulated across various locations for both fault models, indicating that the more energetic fault model by Grilli et al. (2007) leads to a general increase in maximum tsunami amplitude across the domain. However, the maximum tsunami amplitudes simulated with the fault model by Tanioka et al. (2006) are greater in some areas. Figure 6b and c, showing the maximum tsunami amplitude in the vicinity of the hard-hit Kolhufushi island (southeastern zone of Mulaku Atoll), illustrate this phenomenon.
The fault models differ in their direction of focus. Figure 6b shows a significant increase in amplitude in the northeastern part of Kolhumadulu Atoll, an area which suffered devastation during the event, destroying the inhabited island of Vilufushi and significantly altering the geomorphology of the uninhabited island of Kalhufahalaafushi to the south. However, Fig. 6f shows that the fault model of Tanioka et al. (2006) focuses the maximum impact across the island of Kalhufahalaafushi, leading to no significant increase in tsunami amplitude simulated for Vilufushi island.
3.3 Impact of various tsunami scenarios from around the Indian Ocean on the Maldivian archipelago
-
South Sumatra subduction zone. We find that the impact across the Maldives archipelago for the worst-case tsunami scenarios simulated with an origin in the South Sumatra subduction zone is significantly lower than due to the 2004 event. Nevertheless, these worst-case scenarios can still have an impact in the Maldives. The lower severity of waves produced by earthquakes along the South Sumatra subduction zone is due to the tsunami wave direction which, in this case, is focused away from the Maldives and towards the southwestern Indian Ocean (Okal and Synolakis, 2008).
Scenario 1 (Fig. 7a) is a tsunami simulation of the 1833 South Sumatra earthquake. This event is predicted to have had little impact on the Maldives, with maximum local tsunami amplitudes averaging only 0.5 m (Fig. 7a). South Malé Atoll, central regions of North Maalhosmadulu Atoll and Ari Atoll are predicted to suffer the greatest impact, but even then the predicted amplitude is relatively small, and there exist no records of damage in the Maldives for that 1833 event. Scenario 1a, which simulates the more recent Bengkulu earthquake (2007), also produces very small amplitudes across the Maldives (Fig. 7b) and warrants no further discussion.
Scenario 2, which represents a plausible extension of scenario 1, leads to larger impacts across the archipelago (Fig. 7c), particularly for atolls located in the central region, with tsunami amplitudes close to or exceeding 1 m at some locations, due to the tsunami being directed towards this region. Given that the maximum tsunami amplitude distribution simulated for that event is similar to the 2004 Indian Ocean tsunami, one would expect that tsunamis generated by an event similar to scenario 2 could lead to significant damage. Scenario 2a, which is a modification of scenario 2 that reduces the total energy of the tsunami, accounting for the 2007 Bengkulu earthquake, leads to reduced tsunami amplitude predictions across the Maldives as expected, but the forecasted amplitudes in the Maldives region are still higher than those predicted for scenario 1.
-
Arakan subduction zone. Two fault scenarios were considered in the Arakan subduction zone as described in Table 2. Scenario 3 considers the fault mechanism involved in the 1762 earthquake, and scenario 4 simulates a plausible fault to the north of the 2004 Boxing Day event. As predicted by Okal and Synolakis (2008), simulated amplitudes for both scenarios are relatively small across the Maldives (Fig. 8). This result is in line with simulations predicting that tsunamis originating from the Arakan subduction zone do not propagate away from the Bay of Bengal due to the seafloor bathymetry (Okal and Synolakis, 2008). Given that the maximum tsunami amplitudes of the worst-case scenarios in the Arakan subduction zone are minimal, this suggests that earthquakes from the Arakan subduction zones are not likely to be a significant threat to the Maldives.
-
Makran subduction zone. Scenario 5 simulates the 1945 Makran tsunami originating from an earthquake along the Makran subduction zone. Simulation results from this scenario indicate that tsunamis with this origin can have a substantial impact in the Maldives (Fig. 9a), particularly across the northern atolls of the Maldives. We also find that due to the bathymetry of the Arabian Sea, tsunami waves originating there reach the northern atolls of the Maldives before reaching regions that are closer in proximity, such as major cities along the coast of western India. Localized maximum tsunami amplitudes are predicted to be close to 1 m for some key islands of the northern Maldives. We conclude that earthquakes from the Makran subduction zone could cause considerable damage, especially if combined with high tidal conditions.
It is plausible that the damage due to the 1945 event in the Maldives was left undocumented due to the fact that the most impacted region was mostly uninhabited at the time. However, it is expected that events of this amplitude would have a considerable impact on infrastructure if repeated today. For example, Hanimaadhoo island, which today hosts the only international airport in the northern Maldives, would be expected to face tsunami waves of 0.8 m. Further, the islands of the northern atolls of the Maldives are more populous in comparison to the southern regions of the Maldives. Our results for scenario 5, coupled with recent increases in the populations of some of the impacted areas, indicate that Makran area earthquakes represent a new risk for the Maldives.
Maximum tsunami amplitudes simulated for scenario 6, which represents an extended fault system in addition to the 1945 earthquake, are predicted to have a slightly smaller impact than scenario 5, in agreement with results by Okal and Synolakis (2008) (Fig. 9b). The smaller impact of this larger-earthquake-generating mechanism is due to destructive interference of the waves near the source.
Even though tsunamis with origin in the Java subduction zone are predicted to produce waves with implications in the far field (Okal and Synolakis, 2008), the impact of these tsunamis across the Maldives is predicted to be negligible, in line with similar studies in the region such as Wijetunge (2012) in Sri Lanka.
Further, even though a number of transformation faults exist along the southwestern Indian Ocean (SWIO) ridge and some of the world's largest earthquakes have been recorded at these locations, according to Okal and Synolakis (2008), none of these are capable of generating tsunamis that impact the far field. Here we exclude Carlsberg Ridge as a plausible fault mechanism, because RMSI (2006) predicts return periods of ≈ 400 years for a tsunami with amplitude greater than 1.5 m in the Maldives area.
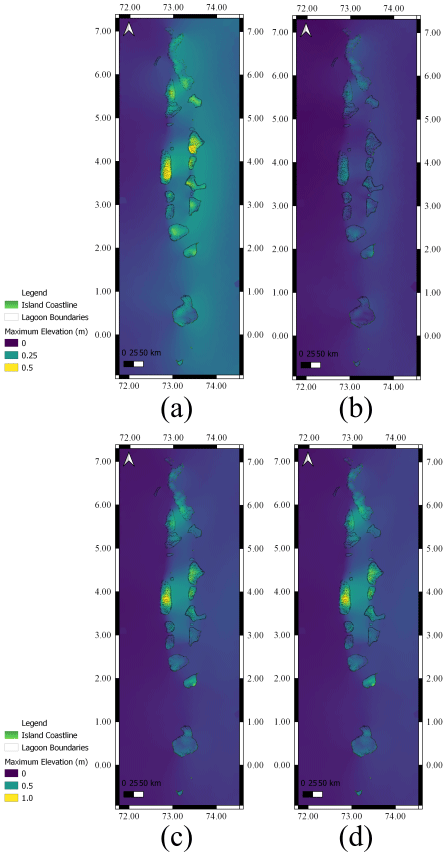
Figure 7Maximum tsunami amplitude across the Maldives for (a) scenario 1, (b) scenario 1b, (c) scenario 2 and (d) scenario 2b from Table 2. Even for the worst-case scenarios, the maximum tsunami amplitude is relatively small.
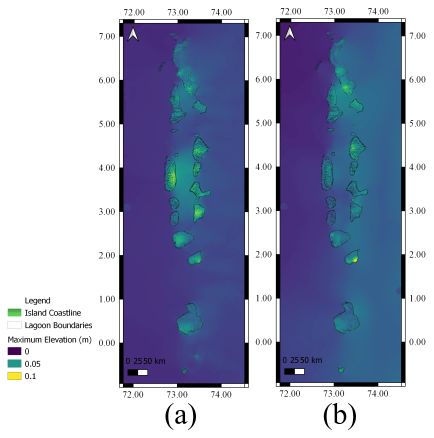
Figure 8Maximum tsunami amplitude across the Maldives due to plausible worst-case fault case scenarios in the Arakan subduction zone, corresponding to scenarios 3 and 4 from Table 2.
4.1 Importance of local and regional bathymetry-induced refraction/diffraction patterns in modulating the local impact of the 2004 Boxing Day event
The use of a high-resolution bathymetry dataset of the archipelago allows the simulation of tsunami characteristics hitherto not modelled at this scale. Here we summarize and compare some of the observations from the model which demonstrate refraction, diffraction and reflection patterns within the atolls and show how these contribute to zones of maximum impact during the 2004 Boxing Day event.
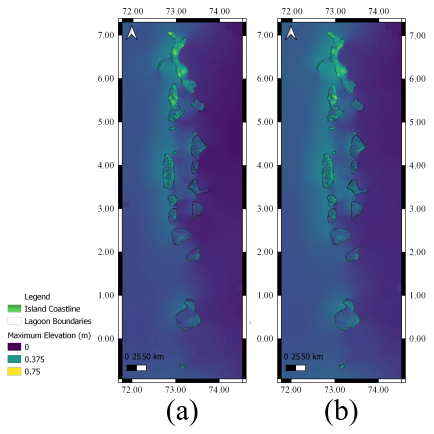
Figure 9Maximum tsunami amplitude across the Maldives due to plausible worst-case fault case scenarios in the Makran subduction zone, corresponding to (a) scenario 5 and (b) scenario 6 from Table 2.
The simulations using the fault model defined by Grilli et al. (2007) are used here to discuss the impact of the 2004 tsunami event in more detail since these yielded better correlation results when comparing data to model results.
The steep bathymetry of the Maldivian atolls and the geomorphology of the lagoons are extremely efficient at reducing the impact of tsunamis at the island scale. This is demonstrated by the fact that of the various individual scenarios simulated in this study, none is predicted to have as high an impact across the Maldives as the mega 2004 event, highlighting that the geographic features of the Maldives archipelago naturally attenuate the impact of far-field tsunamis, and extremely large events are required to breach the natural defences offered by the natural geomorphology of the lagoon, in spite of the low elevation of the islands themselves.
However, the simulations conducted also clearly demonstrate that the location and shape of atolls play an important role in amplifying and focusing the tsunami impact locally. The location of Kolhufushi island in the southern zone of Mulaku Atoll, combined with the shape of the Kolhufushi lagoon, causes water to build up across the island as seen in Fig. 6c and g and Fig. 10a. A similar observation is made in Vilufushi island in the northeastern Kolhumadulu Atoll across the channel. The location of the island, in a headland (Villufusi Muli) (Luthfee, 1995) projecting out to the area of primary tsunami impact, causes tsunami amplitudes to build up between these islands. These two islands (Kolhufushi and Vilufushi), where maximum tsunami amplitudes were recorded across the archipelago, were the only two islands to record double-digit figures for people dead or missing.
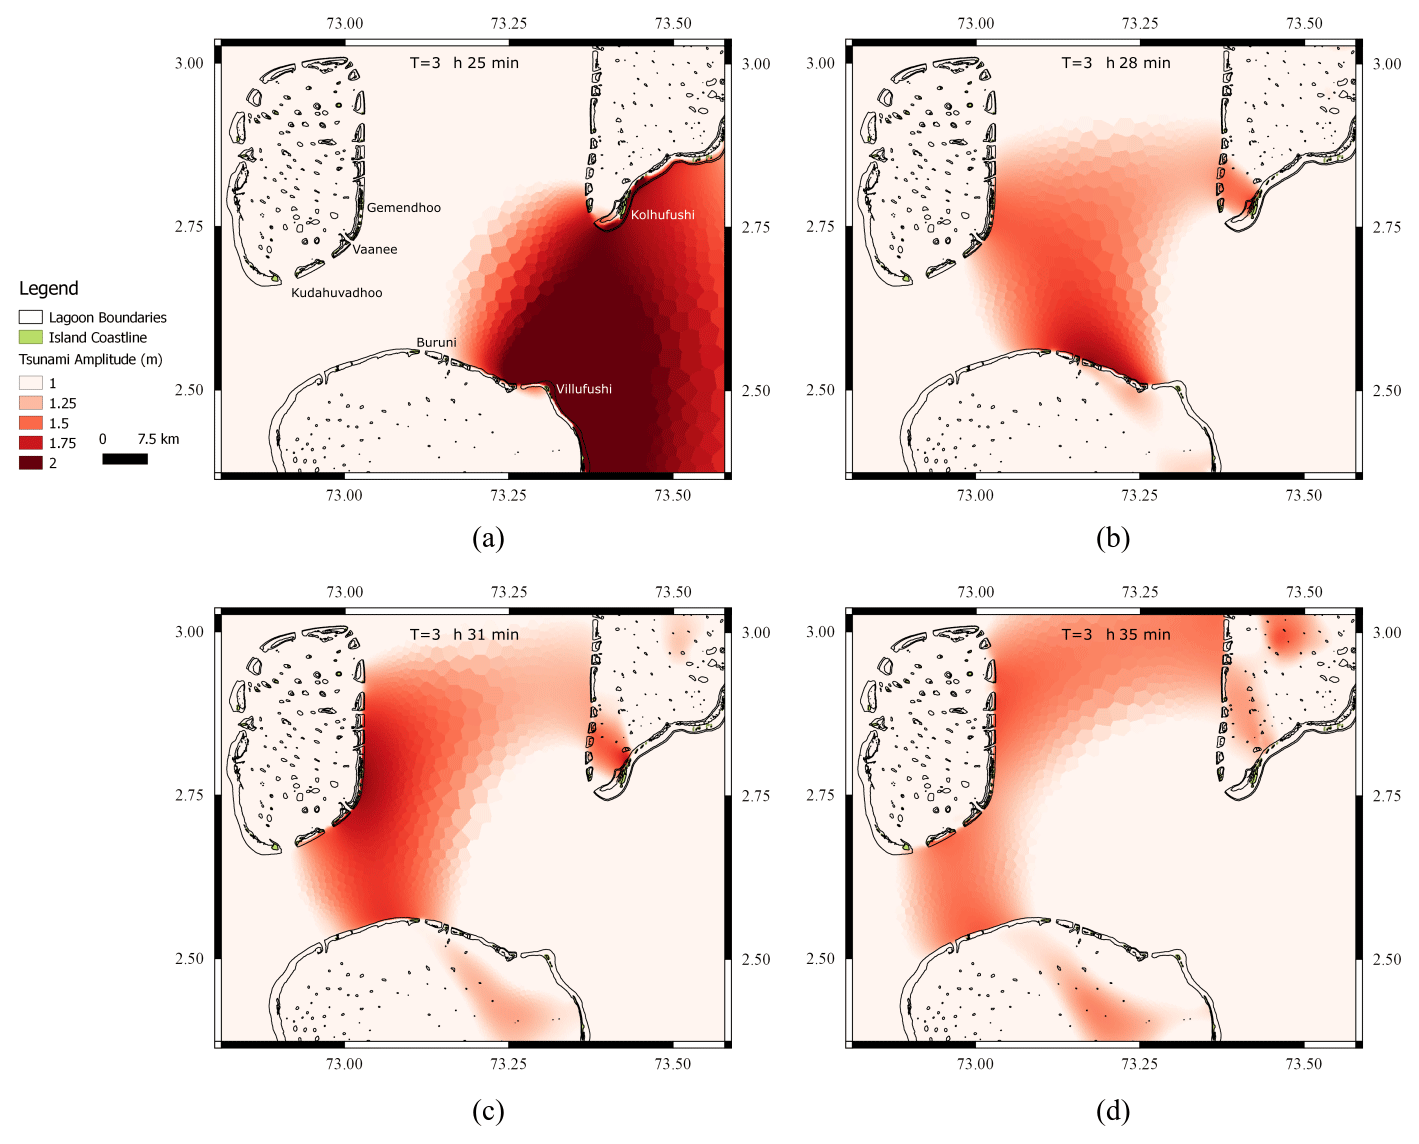
Figure 10The 2004 Boxing Day tsunami propagation across Kudahuvadhoo Kandu (Sea of Kudahuvadhoo) (the junction of South Nilandhe Atoll, Mulaku Atoll and Kolhumadulu Atoll) at (a) T = 3 h 25 min, (b) T = 3 h 28 min, (c) T = 3 h 31 min and (d) T = 3 h 35 min. Panel (a) shows the high tsunami amplitude across Kolhufushi island in Mulaku Atoll and Vilufushi island in Kolhumadulu Atoll. Panels (b)–(d) show the formation of a bow wave across the channel between Mulaku and Kolhumadulu atolls, which propagates towards Vaanee and Gemendhoo island in the southeastern part of South Nilandhe Atoll.
We also observe that the geometry of the northeastern Kolhumadulu and southwestern Kolhumadulu Atoll forces a surge in tsunami amplitude along the southeastern rim of South Nilandhe Atoll, as seen in Fig. 10a–d. Both inhabited islands in the region, Gemendhoo and Vaanee, were completely destroyed during the tsunami and remain uninhabited today.
Model predictions show that while the amplitude of the tsunami is lower at the southwestern zone of South Nilandhe Atoll in comparison to the eastern rim of Mulaku, Kolhumadulu and Hadhunmathi atolls, the build-up of the tsunami surge persists across this region for a longer period of time, due to the very shallow bathymetry of the region with depths less than 3 m. Further, the geomorphology of the region, which consists of a chain of small islets, is predicted to contribute to the build-up of the amplitude with high tsunami flow velocities across the shallow and narrow channels. On the other hand, we also find that Kudahuvadhoo island in the south of South Nilandhe Atoll is predicted to have relatively low maximum tsunami amplitudes, in line with field surveys (Hameed, 2005).
The shape of the atoll and the location of the island within a large lagoon, as well as the steep bathymetry of the atoll, caused the build-up of tsunami amplitude to pass through the channel between South Nilandhe Atoll and Kolhumadulu Atoll without any destructive impact to the island. Residents of both Gemendhoo and Vaanee were evacuated to Kudahuvadhoo on the day of the tsunami by the residents of Kudahuvadhoo and since then have been permanently relocated to the island. These simulations show that local and regional refraction and diffraction patterns can lead to vastly different outcomes, even for neighbouring islands of otherwise similar elevation.
Furthermore, we find that some of the field observations reported in the literature do not fully agree with other studies of tsunami hazard assessment across the Maldives based on statistical correlations between various parameters such as reef and island geomorphology. To illustrate, Kudahuvadhoo island, discussed earlier, is frequently predicted (e.g. by Riyaz et al., 2010; Riyaz and Suppasri, 2016) to be very vulnerable to tsunami impact, particularly for the 2004 Boxing Day event, while field data and results of numerical modelling such as those conducted here show that the island suffered no visible damage. Hence, we note that statistical correlations between various parameters such as the location of the island from the reef edge alone are not sufficient for tsunami vulnerability mapping for regions such as the Maldives, as these models do not account for the complex bathymetry of the reef environments which can significantly alter the local tsunami amplitude. Results of studies at other similar locations also stress that tsunami wave characteristics are extremely complex. For example, Baba et al. (2008) found that the Great Barrier Reef reduced the impact of the 2007 Solomon Islands tsunami by several orders of magnitude, while Ford et al. (2014) found that the level of attenuation offered by coral reefs depends on a variety of other factors, which statistical models do not take into account. In the present simulation domain of the Maldives archipelago, we find that the complexity of the tsunami wave propagation is amplified by the presence of numerous coral reefs within individual atolls, as well as the presence of multiple atolls within close vicinity.
The use of a high-resolution bathymetry dataset allows the simulation to predict features such as an increase in tsunami amplitudes due to shoaling as the tsunami passes through relatively shallow water, contributing to increased damage. This is evident in North Maalhosmadulu Atoll, where a relatively shallow area with numerous coral reefs and faros is observed to have larger-amplitude tsunami waves than surrounding areas. The shoaling effect at Kandholhudhoo island (the only inhabited island in the zone), combined with a variety of other local factors, such as the absence of coastal vegetation and the removal of reef for reclamation, led to the complete destruction of the island; at the time this was the most densely populated island in the Maldives. Similar predictions of higher tsunami amplitudes are made in the shallow water regions of the western Ari Atoll and western Kolhumadulu Atoll as seen in Fig. 3. However, as the islands at these locations were uninhabited at the time of the Boxing Day tsunami, no field data exist for these regions against which to validate the model predictions.
We also observe that the model predicts diffraction and refraction wave patterns inside the atoll basin, leading to high amplitudes at islands which are not in the direct path of the tsunami. As seen in Fig. 3a, the central regions of South Nilandhe Atoll are predicted to have a high tsunami amplitude. This is in agreement with eyewitness accounts and field observations at Rinbudhoo island (Kan et al., 2007), where high inundation depths with the flow of water from all directions was reported. Modelled results agree with these field observations and predict high tsunami amplitudes well within the central basin of the atoll. Simulation results predict that high tsunami amplitudes at this zone occurred due to the refraction patterns within the atoll basin. Similar observations were made by Ford et al. (2014) based upon simulations of the 2011 Tōhoku earthquake in Majuro Atoll in the Marshall Islands, where tsunami simulations exhibited long-lasting tsunami amplitude peaks within the atoll for up to 60 min.
4.2 Atoll Tsunami Explorer tool
Traditionally, the results of tsunami impact studies across the Maldives have been mainly represented via printed charts (e.g. RMSI, 2006; ADB, 2020; Riyaz et al., 2010; Riyaz and Suppasri, 2016). However, given the variation in tsunami impact across the archipelago, interpretation of these charts to assess the nearshore impact across the coastline of islands, and especially to assess island-scale variations, is extremely difficult. To address this, we here present an interactive application tool built on the Google Earth Engine (Gorelick et al., 2017) that can be used to explore the simulation results presented in this study.
The application Atoll Tsunami Explorer is hosted within the Island Health Explorer (I-Hex) platform (https://i-hex.github.io, last access: 2 January 2022), which brings together a host of similar interactive applications specific to the Maldives archipelago based on satellite imagery and various other datasets. An illustration of the user interface of the Atoll Tsunami Explorer is shown in Fig. 11. Users can explore the maximum tsunami amplitudes at high resolution across the archipelago for any scenario described in this paper. The tool was produced by uploading files generated from the simulation results to the Google Earth Engine platform. The Atoll Tsunami Explorer is designed to be user-friendly and targets decision makers as well as the wider community. To make interpretation easier, the lagoon boundaries (Spalding et al., 2001) as well as the coastline files used in the simulation (Areas, 2018) are also added to the platform. Simulation results are clipped to the lagoon boundaries for better visualization; however, an option is included that allows visualization of country-wide scenarios.
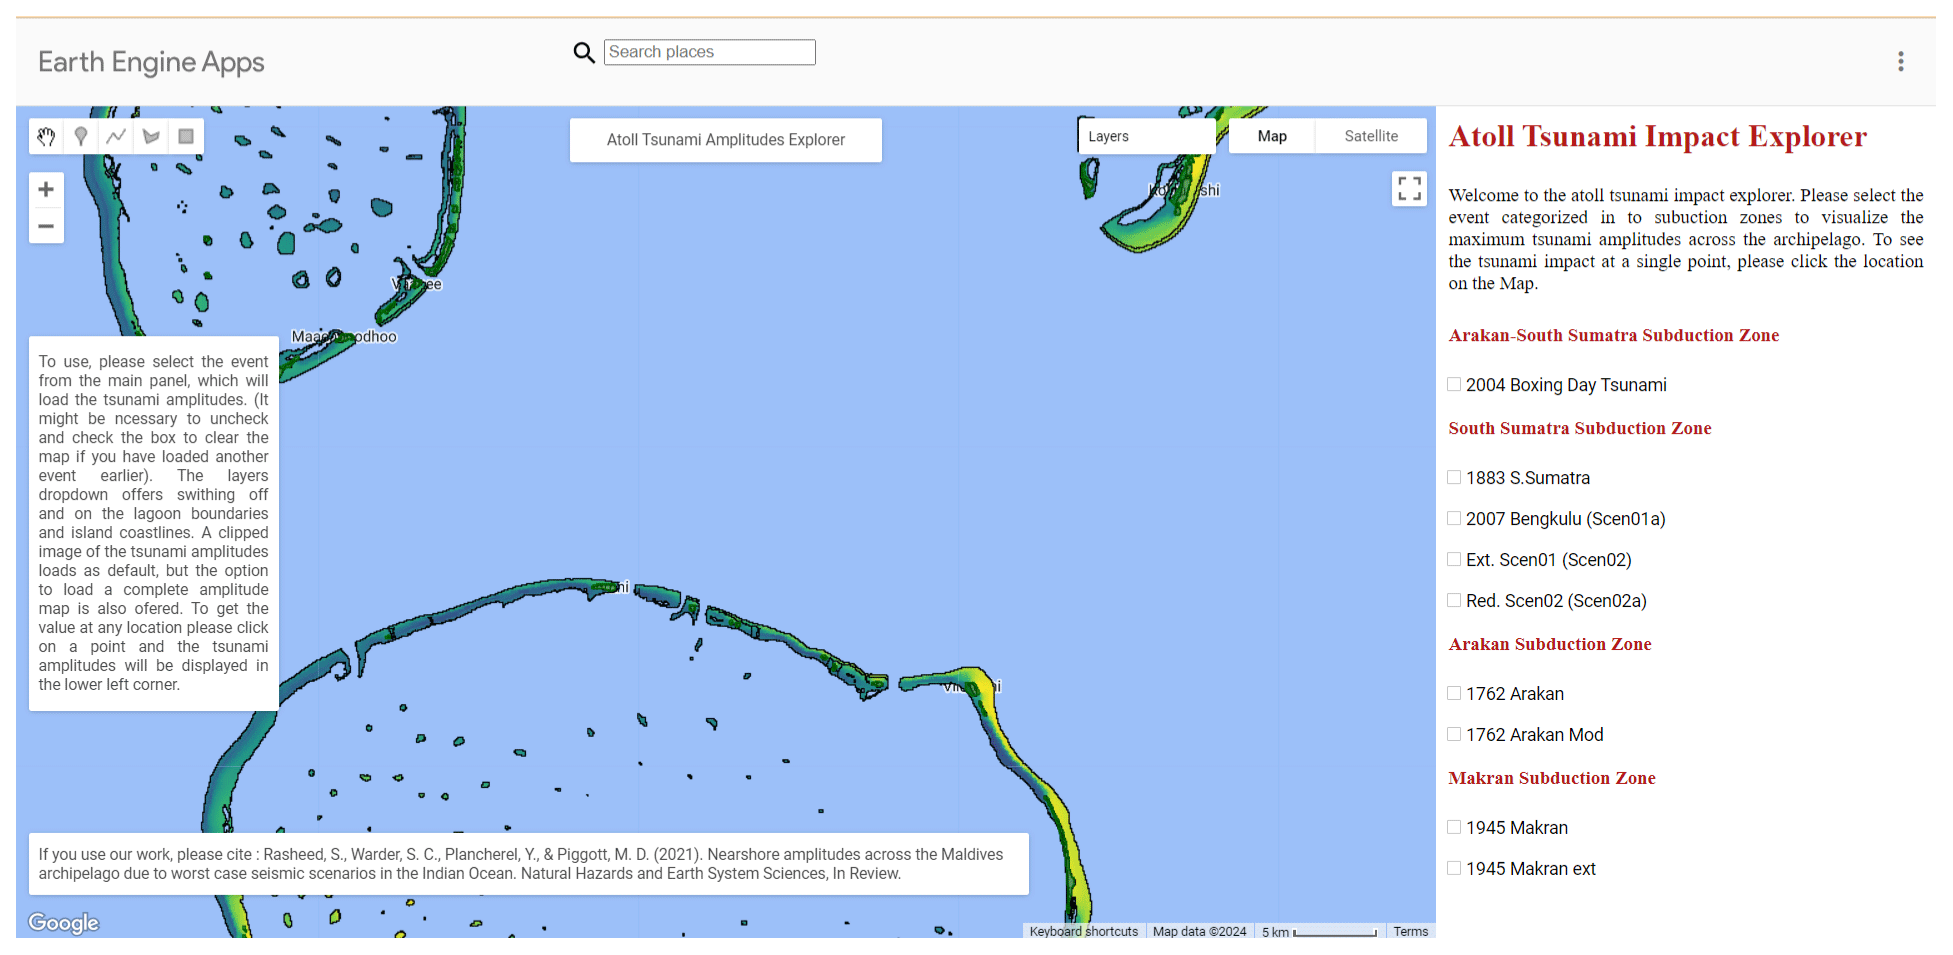
Figure 11Atoll Tsunami Explorer based on the Google Earth Engine platform © Google Earth Engine, showing the default view with the 2004 tsunami amplitudes visualized with the lagoon and island boundaries.
4.3 Limitations of the study and recommendations for improvement
The main limitation of this study is the lack of availability of suitable data both for model setup and validation, including bathymetry and bed friction fields. Even though the bathymetry dataset used (Rasheed et al., 2020) is the highest resolution currently available for the Maldives, it is comprised of data from a variety of sources, and the defects of these datasets will manifest as defects in this study. We find that the bathymetry exerts a major influence in directing tsunami waves across the complex geometry of the atolls of the Maldives, in agreement with Orpin et al. (2016), who showed similar effects in Tokelau in the Pacific. Availability of better bathymetry data, particularly near the coastline, can be used to further improve the model, and thus the collection of such data should be a priority for the Maldives as it will have clear and direct benefits for risk management across the archipelago. Additionally, topographic data (currently unavailable) would also provide a means of incorporating inundation modelling (not considered in this study). The availability of topographic data will also enable higher-resolution nearshore simulations using the 3D, non-hydrostatic version of Thetis (Pan et al., 2019), which has been validated against standard tsunami benchmarks, at geographical regions of interest identified from this large-scale study.
In addition to bathymetry data, the model friction parameter also has an influence on predictions of tsunami behaviour. Dilmen et al. (2018) studied the impact of different Manning coefficients in tsunami modelling within a reef environment at Tutuila island in American Samoa and found that use of a single Manning n value, as used in this study, was not sufficient to fully account for tsunami-induced flow within a reef environment. Further, Gelfenbaum et al. (2011) predict that beyond a critical reef width the tsunami amplitude is dominated by the friction parameter, which generally reduces the tsunami amplitude. The availability of data to better describe the friction parameters is needed to facilitate model calibration.
Additionally, the model was run in a UTM (Universal Transverse Mercator) coordinate system, which introduces geometrical errors. However, comparison of the simulation results carried out in Sect. 3.2.3 shows good agreement with field observations. This justifies its use here, especially in light of the other error sources listed above.
Lastly, parameters used in fault models have also been suggested to contribute to overall limitations in tsunami modelling (Poisson et al., 2011). We note that the numerical model used within this work, Thetis, has an adjoint model available. Similar studies for other natural hazards have utilized adjoint methods to perform more complete sensitivity analysis and uncertainty quantification, e.g. Warder et al. (2021). Such methods could be utilized for tsunami hazard assessment to quantify model uncertainties arising from a variety of sources.
Detailed high-fidelity tsunami modelling of the Maldives archipelago has been conducted for the first time using a high-resolution bathymetry dataset, with a focus on nearshore maximum tsunami amplitudes. Modelled results, validated against field data obtained for the 2004 tsunami event, show that the model compares well with observational data. Model results emphasize that tsunami risk assessments for the archipelago need to incorporate high-resolution modelling, because atoll shapes and island geography induce a high level of control over the resulting tsunami amplitudes, due to the development of complex refraction and reflection wave patterns.
Sensitivity studies carried out show that, while numerical simulations are effective in capturing large-scale flow patterns, the output of the simulations is very sensitive to the input parameters. Here, we investigated the mesh resolutions used and the source fault model, and we found that both have significant influence over the resulting tsunami amplitudes simulated to develop across the near shore of the islands.
On account of the large-scale coastal modifications seen across the Maldives archipelago in recent years (DNP, 2019), future work will need to take into account the possible impact of such large-scale modifications on the natural resilience of the islands to minimize the impact of far-field tsunamis, as opposed to potentially exacerbating any localized risk. Coastal modifications have already been shown to affect bed stress (Rasheed et al., 2021) across the larger atoll domain as well as at the nearshore regions of islands, and the results of this study could be incorporated in such future studies to better understand the resilience of islands to such events.
The source code of Thetis coastal ocean model used in this study is available from https://thetisproject.org/download.html (Kärnä et al., 2018) as well as https://github.com/thetisproject/thetis (Angeloudis et al., 2018).
The data presented in this study can be viewed using the Atoll Tsunami Explorer app, available from https://zubba1989.users.earthengine.app/view/tsunamimv (Earth Engine Apps, 2022), as well as within the I-Hex platform.
SR ran the simulations, carried out the analysis of results and initiated the writing of the paper. SCW provided support for model setup and analysis of the results. MDP and YP provided supervision, guidance and insights at every stage of the project. All authors participated in the writing and editing of the paper.
The contact author has declared that none of the authors has any competing interests.
Publisher’s note: Copernicus Publications remains neutral with regard to jurisdictional claims made in the text, published maps, institutional affiliations, or any other geographical representation in this paper. While Copernicus Publications makes every effort to include appropriate place names, the final responsibility lies with the authors.
This article is part of the special issue “Tsunamis: from source processes to coastal hazard and warning”. It is not associated with a conference.
The authors would like to acknowledge funding from a Research England GCRF award made to Imperial College London, as well as the Imperial College London Strategic Priorities Fund 2020-21 awarded for the Island Health Explorer project. Shuaib Rasheed would like to acknowledge PhD funding from the Islamic Development Bank and Imperial College London.
This research has been supported by the Islamic Development Bank and Imperial College London, both of which sponsored the PhD of Shuaib Rasheed.
This paper was edited by Shane Murphy and reviewed by Joern Behrens and one anonymous referee.
ADB: Multi Harzard risk atlas of the Maldives, Tech. rep., Asian Development Bank, https://doi.org/10.22617/TCS200049, 2020. a, b, c
Amores, A., Marcos, M., Pedreros, R., Le Cozannet, G., Lecacheux, S., Rohmer, J., Hinkel, J., Gussmann, G., van der Pol, T., Shareef, A., and Khaleel, Z.: Coastal flooding in the Maldives induced by mean sea-level rise and wind-waves: From global to local coastal modelling, Frontiers in Marine Science, 8, 22967745, https://doi.org/10.3389/fmars.2021.665672, 2021. a
Angeloudis, A., Kramer, S. C., Avdis, A., and Piggott, M. D.: Optimising tidal range power plant operation, Appl. Energ., 212, 680–690, https://doi.org/10.1016/j.apenergy.2017.12.052, 2018 (code available at: https://github.com/thetisproject/thetis). a
Areas, G. A.: GADM Database of Global Administrative Areas, version 2.8, 2015, http://www.gadm.org (last access: 15 July 2021), 2018. a, b
Avdis, A., Jacobs, T. C., Mouradian, L. S., Hill, J., and Piggott, D. M.: Meshing ocean domains for coastal engineering applications, in: The European Community on Computational Methods in Applied Sciences and Engineering (ECCOMAS) VII Congress Proceedings, Crete, Greece, 5 June 2016, 2016. a
Avdis, A., Candy, A. S., Hill, J., Kramer, S. C., and Piggott, M. D.: Efficient unstructured mesh generation for marine renewable energy applications, Renew. Energ., 116, 842–856, https://doi.org/10.1016/j.renene.2017.09.058, 2018. a
Baba, T., Mleczko, R., Burbidge, D., Cummins, P. R., and Thio, H. K.: The effect of the Great Barrier Reef on the propagation of the 2007 Solomon Islands tsunami recorded in northeastern Australia, in: Tsunami Science Four Years after the 2004 Indian Ocean Tsunami, Springer, https://doi.org/10.1007/978-3-0346-0057-6_3 2008. a
Betzler, C., Lindhorst, S., Lüdmann, T., Weiß, B., Wunsch, M., and Braga, J. C.: Grain size distribution of the lagoonal deposits within the South Malé Atoll, Maldives, Indian Ocean, Mar. Geol., 366, 16–33, https://doi.org/10.1016/j.margeo.2015.04.009, 2016. a
Byrne, D. E., Sykes, L. R., and Davis, D. M.: Great thrust earthquakes and aseismic slip along the plate boundary of the Makran subduction zone, J. Geophys. Res.-Sol. Ea., 97, 449–478, 1992. a
Dilmen, D. I., Roe, G. H., Wei, Y., and Titov, V. V.: The role of near-shore bathymetry during tsunami inundation in a reef island setting: A case study of Tutuila Island, Pure Appl. Geophys., 175, 1239–1256, 2018. a, b, c
DNP: Statistical Year Book of Maldives 2019, http://statisticsmaldives.gov.mv/yearbook/2019/ (last access: 8 December 2021), 2019. a
Duvat, V. K. and Magnan, A. K.: Rapid human-driven undermining of atoll island capacity to adjust to ocean climate-related pressures, Sci. Rep., 9, 1–16, 2019. a
Earth Engine Apps: Atoll Tsunami Amplitudes Explorer, Earth Engine Apps [data set], https://zubba1989.users.earthengine.app/view/tsunamimv, 2022.
Emerton, L., Baig, S., and Saleem, M.: Valuing biodiversity: the economic case for biodiversity conservation in the Maldives, AEC Project, Ministry of Housing, Transport and Environment, Maldives, 2009. a
Ford, M., Becker, J. M., Merrifield, M. A., and Song, Y. T.: Marshall Islands fringing reef and atoll lagoon observations of the Tohoku tsunami, Pure Appl. Geophys., 171, 3351–3363, 2014. a, b
Fritz, H. M., Synolakis, C. E., and McAdoo, B. G.: Maldives field survey after the December 2004 Indian Ocean tsunami, Earthq. Spectra, 22, 137–154, 2006. a, b, c, d
Fujima, K., Shigihara, Y., Tomita, T., Honda, K., Nobuoka, H., Hanzawa, M., Fujii, H., Ohtani, H., Orishimo, S., Tatsumi, M., and Koshimura, S.-I.: Survey results of the Indian Ocean tsunami in the Maldives, Coast. Eng. J., 48, 81–97, 2006. a, b, c, d, e
Gardiner, J. S.: The formation of the Maldives, The Geographical Journal, 19, 277–296, https://www.jstor.org/stable/1775312 (last access: 5 January 2020), 1902. a
Gardiner, J. S.: The Fauna and Geography of the Maldive and Laccadive Archipelagoes: Being the Account of the Work Carried on and of the Collections Made by an Expedition During the Years 1899 and 1900, Vol. 1, University Press, 1903. a
Gelfenbaum, G., Apotsos, A., Stevens, A. W., and Jaffe, B.: Effects of fringing reefs on tsunami inundation: American Samoa, Earth-Sci. Rev., 107, 12–22, 2011. a, b
Gica, E.: A tsunami forecast model for Midway Atoll, https://doi.org/10.7289/V5RJ4GCP, 2015. a
Gorelick, N., Hancher, M., Dixon, M., Ilyushchenko, S., Thau, D., and Moore, R.: Google Earth Engine: Planetary-scale geospatial analysis for everyone, Remote Sens. Environ., 202, 18–27, 2017. a
Grilli, S. T., Ioualalen, M., Asavanant, J., Shi, F., Kirby, J. T., and Watts, P.: Source constraints and model simulation of the December 26, 2004, Indian Ocean Tsunami, J. Waterw. Coast., 133, 414–428, 2007. a, b, c, d, e, f, g, h, i, j, k, l
Harig, S., Pranowo, W. S., and Behrens, J.: Tsunami simulations on several scales, Ocean Dynam., 58, 429–440, 2008. a
Hass, H.: Expedition into the unknown: a report on the expedition of the research ship Xarifa to the Maldive and the Nicobar Islands and on a series of 26 television films, Hutchinson, 1965. a
Hameed, H.: Tsunami Impact Assessment 2005 Reupublic of Maldives: A socio-economic countrywide assessment at household level, six months after the tsunami, Tech. rep., Government of Maldives, https://maldivesindependent.com/files/2015/03/TIA_2005_Main_Report-UNDP-and-Nat.-Planning-Detp.pdf (last access: 5 January 2022), 2005. a
Kan, H., Ali, M., and Riyaz, M.: The 2004 Indian Ocean tsunami in the Maldives: scale of the disaster and topographic effects on atoll reefs and islands, National Museum of Natural History, Smithsonian Institution, https://doi.org/10.5479/si.00775630.554.1, 2007. a, b, c, d, e
Kärnä, T., De Brye, B., Gourgue, O., Lambrechts, J., Comblen, R., Legat, V., and Deleersnijder, E.: A fully implicit wetting–drying method for DG-FEM shallow water models, with an application to the Scheldt Estuary, Comput. Method. Appl. M., 200, 509–524, 2011. a, b
Kärnä, T., Kramer, S. C., Mitchell, L., Ham, D. A., Piggott, M. D., and Baptista, A. M.: Thetis coastal ocean model: discontinuous Galerkin discretization for the three-dimensional hydrostatic equations, Geosci. Model Dev., 11, 4359–4382, https://doi.org/10.5194/gmd-11-4359-2018, 2018 (code available at: https://thetisproject.org/download.html). a
Kench, P. S., McLean, R. F., Brander, R. W., Nichol, S. L., Smithers, S. G., Ford, M. R., Parnell, K. E., and Aslam, M.: Geological effects of tsunami on mid-ocean atoll islands: The Maldives before and after the Sumatran tsunami, Geology, 34, 177–180, 2006. a
Kraines, S., Yanagi, T., Isobe, M., and Komiyama, H.: Wind-wave driven circulation on the coral reef at Bora Bay, Miyako Island, Coral Reefs, 17, 133–143, 1998. a
Luthfee, M. I.: Dhivehi Raajjeige Geographyge' Vanavaru, Vol. 1–2, Ministry of Education, 1995. a, b, c
Naseer, A. and Hatcher, B. G.: Inventory of the Maldives’ coral reefs using morphometrics generated from Landsat ETM+ imagery, Coral Reefs, 23, 161–168, 2004. a
Naseer, A.: Pre-and post-tsunami coastal planning and land-use policies and issues in the Maldives, in: Proceedings of the workshop on coastal area planning and management in Asian tsunami-affected countries, FAO Bangkok, 27–29 pp., 2006. a
Okada, Y.: Internal deformation due to shear and tensile faults in a half-space, B. Seismol. Soc. Am., 82, 1018–1040, 1992. a
Okal, E. A. and Synolakis, C. E.: Far-field tsunami hazard from mega-thrust earthquakes in the Indian Ocean, Geophys. J. Int., 172, 995–1015, 2008. a, b, c, d, e, f, g, h, i, j, k, l, m
Orpin, A. R., Rickard, G. J., Gerring, P. K., and Lamarche, G.: Tsunami hazard potential for the equatorial southwestern Pacific atolls of Tokelau from scenario-based simulations, Nat. Hazards Earth Syst. Sci., 16, 1239–1257, https://doi.org/10.5194/nhess-16-1239-2016, 2016. a, b
Pan, W., Kramer, S. C., and Piggott, M. D.: Multi-layer non-hydrostatic free surface modelling using the discontinuous Galerkin method, Ocean Model., 134, 68–83, https://doi.org/10.1016/j.ocemod.2019.01.003, 2019. a, b
Poisson, B., Oliveros, C., and Pedreros, R.: Is there a best source model of the Sumatra 2004 earthquake for simulating the consecutive tsunami?, Geophys. J. Int., 185, 1365–1378, 2011. a, b, c
Rasheed, S., Warder, S. C., Plancherel, Y., and Piggott, M. D.: An Improved Gridded Bathymetric Dataset and Tidal Model for the Maldives Archipelago, Earth and Space Science, 8, e2020EA001207, https://doi.org/10.1029/2020EA001207, 2020. a, b, c, d, e, f, g, h
Rasheed, S., Warder, S. C., Plancherel, Y., and Piggott, M. D.: Response of tidal flow regime and sediment transport in North Malé Atoll, Maldives, to coastal modification and sea level rise, Ocean Sci., 17, 319–334, https://doi.org/10.5194/os-17-319-2021, 2021. a, b, c, d, e, f
Rathgeber, F., Ham, D. A., Mitchell, L., Lange, M., Luporini, F., Mcrae, A. T. T., Bercea, G.-T., Markall, G. R., and Kelly, P. H. J.: Firedrake: Automating the Finite Element Method by Composing Abstractions, ACM T. Math. Software, 43, 1–27, https://doi.org/10.1145/2998441, 2016. a
Riyaz, M. and Suppasri, A.: Geological and Geomorphological Tsunami Hazard Analysis for the Maldives Using an Integrated WE Method and a LR Model, J. Earthq. Tsunami, 10, 1650003, https://doi.org/10.1142/S1793431116500032, 2016. a, b, c, d
Riyaz, M., Park, K.-H., Ali, M., and Kan, H.: Influence of geological setting of islands and significance of reefs for tsunami wave impact on the Atoll Islands, Maldives, B. Eng. Geol. Environ., 69, 443–454, 2010. a, b, c
RMSI: Developing a Disaster Risk Profile for Maldives, Tech. rep., United Nations Development Programme, http://files.epa.gov.mv/file/1522 (last access: 20 December 2021), 2006. a, b, c, d, e, f
Rosman, J. H. and Hench, J. L.: A framework for understanding drag parameterizations for coral reefs, J. Geophys. Res.-Oceans, 116, C08025, https://doi.org/10.1029/2010JC006892, 2011. a
Sewell, R. S.: An account of Addu Atoll, British Museum, 1936. a
Spalding, M., Spalding, M. D., Ravilious, C., and Green, E. P.: World atlas of coral reefs, Univ. of California Press, ISBN 0-520-23255-0, 2001. a
Stoddart, D. R.: Reef studies at Addu Atoll, Maldive Islands: preliminary results of an expedition to Addu Atoll in 1964, Pacific Science Board, National Academy of Sciences – National Research Council, 1966. a
Synolakis, C. E. and Bernard, E. N.: Tsunami science before and beyond Boxing Day 2004, Philos. T. R. Soc. A, 364, 2231–2265, 2006. a
Tanioka, Y., Kususose, T., Kathiroli, S., Nishimura, Y., Iwasaki, S.-I., and Satake, K.: Rupture process of the 2004 great Sumatra-Andaman earthquake estimated from tsunami waveforms, Earth Planets Space, 58, 203–209, 2006. a, b, c, d, e, f, g, h, i, j
Tonini, R., Armigliato, A., Pagnoni, G., and Tinti, S.: Modeling the 2004 Sumatra tsunami at Seychelles Islands: site-effect analysis and comparison with observations, Nat. Hazards, 70, 1507–1525, 2014. a, b
Wadey, M., Brown, S., Nicholls, R. J., and Haigh, I.: Coastal flooding in the Maldives: an assessment of historic events and their implications, Nat. Hazards, 89, 131–159, 2017. a
Warder, S. C., Horsburgh, K. J., and Piggott, M. D.: Adjoint-based sensitivity analysis for a numerical storm surge model, Ocean Model., 160, 101766, https://doi.org/10.1016/j.ocemod.2021.101766, 2021. a
Weatherall, P., Marks, K. M., Jakobsson, M., Schmitt, T., Tani, S., Arndt, J. E., Rovere, M., Chayes, D., Ferrini, V., and Wigley, R.: A new digital bathymetric model of the world's oceans, Earth Space Science, 2, 331–345, 2015. a, b
Wessel, P. and Smith, W.: GSHHG — A Global Self-Consistent, Hierarchical, High-Resolution Geography Database, Honolulu, Hawaii, Silver Spring, Maryland, http://www.soest.hawaii.edu/pwessel/gshhg/ (last access: 10 January 2013), 2013. a
Wijetunge, J.: Nearshore tsunami amplitudes off Sri Lanka due to probable worst-case seismic scenarios in the Indian Ocean, Coast. Eng., 64, 47–56, 2012. a, b
World Bank, A. D. B. and System, U.: Maldives Tsunami: Impact and Recovery, Joint Needs Assessment, https://recovery.preventionweb.net/media/75353/download?startDownload=true (last access: 15 February 2024), 2005. a
Xie, X., Chen, C., Li, L., Wu, S., Yuen, D. A., and Wang, D.: Tsunami hazard assessment for atoll islands inside the South China Sea: A case study of the Xisha Archipelago, Phys. Earth Planet. In., 290, 20–35, https://doi.org/10.1016/j.pepi.2019.03.003, 2019. a