the Creative Commons Attribution 4.0 License.
the Creative Commons Attribution 4.0 License.
 | 21 Feb 2024
How to mitigate flood events similar to the 1979 catastrophic floods in the lower Tagus
Diego Fernández-Nóvoa
Alexandre M. Ramos
José González-Cao
Orlando García-Feal
Cristina Catita
Moncho Gómez-Gesteira
Ricardo M. Trigo
The floods that struck the lower Tagus valley in February 1979 correspond to the most intense floods in this river and affected the largest number of people in a river flow event in Portugal during the last 150 years. In fact, the vast area affected significantly impacted circa 10 000 people in the lower Tagus sector (and an additional 7000 in other regions of Portugal), including thousands of people evacuated or made homeless. In this context, the present study focuses on an in-depth analysis of this event from a hydrodynamic perspective by means of the Iber+ numerical model and on developing strategies to mitigate the flood episodes that occur in the lower section of the Tagus River using the exceptional floods of February 1979 as a benchmark. In this sense, dam operating strategies were developed and analyzed for the most important dam along the Tagus River basin in order to propose effective procedures to take advantage of these infrastructures to minimize the effect of floods. Overall, the numerical results indicate a good agreement with watermarks and some descriptions of the 1979 flood event, which demonstrates the model capability to evaluate floods in the area under study. Regarding flood mitigation, results obtained indicate that the frequency of floods can be reduced with the proposed strategies, which were focused on providing optimal dam operating rules to mitigate flooding in the lower Tagus valley. In addition, hydraulic simulations corroborated an important decrease in water depth and velocity for the most extreme flood events, and also a certain reduction in the flood extension was detected. This confirms the effectiveness of the proposed strategies to help in reducing the flood impact in the lower Tagus valley through the efficient functioning of dams.
- Article
(13000 KB) - Full-text XML
-
Supplement
(688 KB) - BibTeX
- EndNote


The Iberian Peninsula corresponds to a relevant region that has been historically affected by intense river floods (Benito et al., 1996, 2003; Pereira et al., 2016; Rebelo et al., 2018; Santos et al., 2018; González-Cao et al., 2021, 2022). In particular, its western area is especially vulnerable to these phenomena since it can be directly affected by the storm tracks of the Northern Hemisphere that transport heat and moisture (Peixoto and Oort, 1992; Trigo, 2006). Some specific synoptic features can favor extreme weather conditions that promote high precipitation rates and thus important associated river floods (Trigo and DaCamara, 2000; Trigo, 2006; Rebelo et al., 2018). In this context, in the last few decades there has been a steep increase in the number of works dealing with historical river floods that took place in the western half of the Iberian Peninsula, namely the floods that occurred in the Minho, Lima and Douro basins in 1909 (Pereira et al., 2016); in the Tagus basin in 1876 and 1979 (Benito et al., 2003; Salgueiro et al., 2013; Trigo et al., 2014; Rebelo et al., 2018); or in the Guadiana basin in 1876 (Trigo et al., 2014; González-Cao et al., 2021). The floods that struck the lower Tagus valley from 5 to 16 February 1979 correspond to the most intense floods that have occurred in this valley since, at least, the mid-19th century. Additionally, this outstanding event also corresponded to the largest number of people affected in the Iberian Peninsula in a river flood event in the last 150 years. The area affected by prolonged precipitation was much larger; thus other regions of western Iberia were also seriously affected. In fact, the vast area affected impacted roughly 10 000 people in the lower Tagus sector (and an additional 7000 in other regions of Portugal), including thousands of people evacuated or made homeless. A detailed description of the causes behind this event and its main consequences can be found in Rebelo et al. (2018). Unlike previous more historical events (such as the 1876 floods), in 1979 there were already several large dams and reservoirs in both the Spanish and the Portuguese sections of the Tagus River basin which could have mitigated the amplitude of the flood. These structures are one of the main mechanisms for flood reduction (Lee et al., 2009; Valeriano et al., 2010; Chou and Wu, 2015); indeed, certain research endeavors have been undertaken to identify optimal sites for the establishment of new dams, aiming to tackle this problem, among other objectives (Pathan et al., 2022). However, a lack of communications between the management authorities in both countries at the time (a joint action protocol was not established until the beginning of the 21st century; https://www.boe.es/diario_boe/txt.php?id=BOE-A-2000-2882, last access: November 2023; Escartín, 2002), coupled with poor dam operations, translated into poor performance in terms of mitigating the 1979 flood (Rebelo et al., 2018). When flow peaks arrived, dams controlling the Tagus flow were close to full capacity, therefore hampering the ability to exert sufficient control over the peak river flow (Rebelo et al., 2018). Thus, the main aims of the present study are (i) to reproduce and analyze this historical event from a hydrologic–hydraulic point of view using the Iber+ numerical model and (ii) to develop dam operating strategies to mitigate the flood episodes that occur in the lower section of the Tagus River using the exceptional floods of February 1979 as a benchmark. The effectiveness of the strategies proposed in terms of reducing the flood impact will be evaluated by means of numerical model simulations. In this sense, hydrodynamic numerical models are a key tool in flood risk management by providing information on critical flood indicators (Shah et al., 2022; Zhang et al., 2022). This will contribute to addressing the flood mitigation challenges that the scientific community will face in the coming decades (IPCC, 2012, 2021; Prieto et al., 2020). These are related to the increasing temperatures due to the significant rates of global warming that have contributed to and will continue to contribute to the recent and future increase in extreme precipitation and floods in some parts of the world (Dankers and Feyen, 2008; Petrow and Merz, 2009; Alfieri et al., 2015, 2017; Diakakis, 2016; Arnell and Gosling, 2016; Modarres et al., 2016; Jongman, 2018; IPCC, 2021), including vast areas of the Iberian Peninsula (Lorenzo and Alvarez, 2020). Additionally, this study also intends to prove that with open data and free applications for modeling, the results are satisfactory enough to apply the methodology proposed here in other regions where more detailed data may be scarce or non-existent.
This paper is organized as follows: in Sect. 2 a brief motivation of the study is provided. In Sect. 3 a brief description of the area within the scope of the study is presented. In Sect. 4, the data required to develop the study, the hydrodynamic model used and a proposal of dam operating strategies to mitigate lower Tagus floods are described. Section 5 is devoted to results, including (i) testing different digital elevation models (DEMs) to select the most accurate for the area, (ii) the modeling and in-depth analysis of the flood registered in 1979 in the lower Tagus valley, and (iii) the analysis of the effectiveness of proposed dam operating strategies to mitigate floods in the lower Tagus valley. Finally, the main conclusions are summarized in Sect. 6.
The main motivations driving this study are, on the one hand, to improve our knowledge and understanding of flood development in the lower Tagus valley, an area especially vulnerable to these events. In this sense, one of the main motivations for carrying out this analysis was the scarcity of studies available addressing this issue, especially from a hydrodynamic point of view. For that, different freely available products were tested in order to provide the most accurate tools that can serve as a basis for future studies focused on addressing different aspects related to flooding in the lower Tagus valley. On the other hand, the study also intends to provide different strategies to mitigate floods in the lower Tagus valley, taking advantage of existing infrastructures, namely large dams. To the best of our knowledge, there are no previous studies that have developed this type of strategy for the area within our scope, so the strategies presented in this work could represent an important advance in this field. This proposal will allow for the provision of an affordable new approach to flood mitigation compared to the implementation of additional structural measures that have to be built. For that, dam operating strategies will be proposed and tested in the most important Tagus dam. The benefits provided by the dam strategies proposed in relation to flood mitigation will also be evaluated. This will also serve as a basis for developing future studies focused on optimizing dam strategies or even interconnecting the strategies of different dams of the Tagus basin to improve flood mitigation.
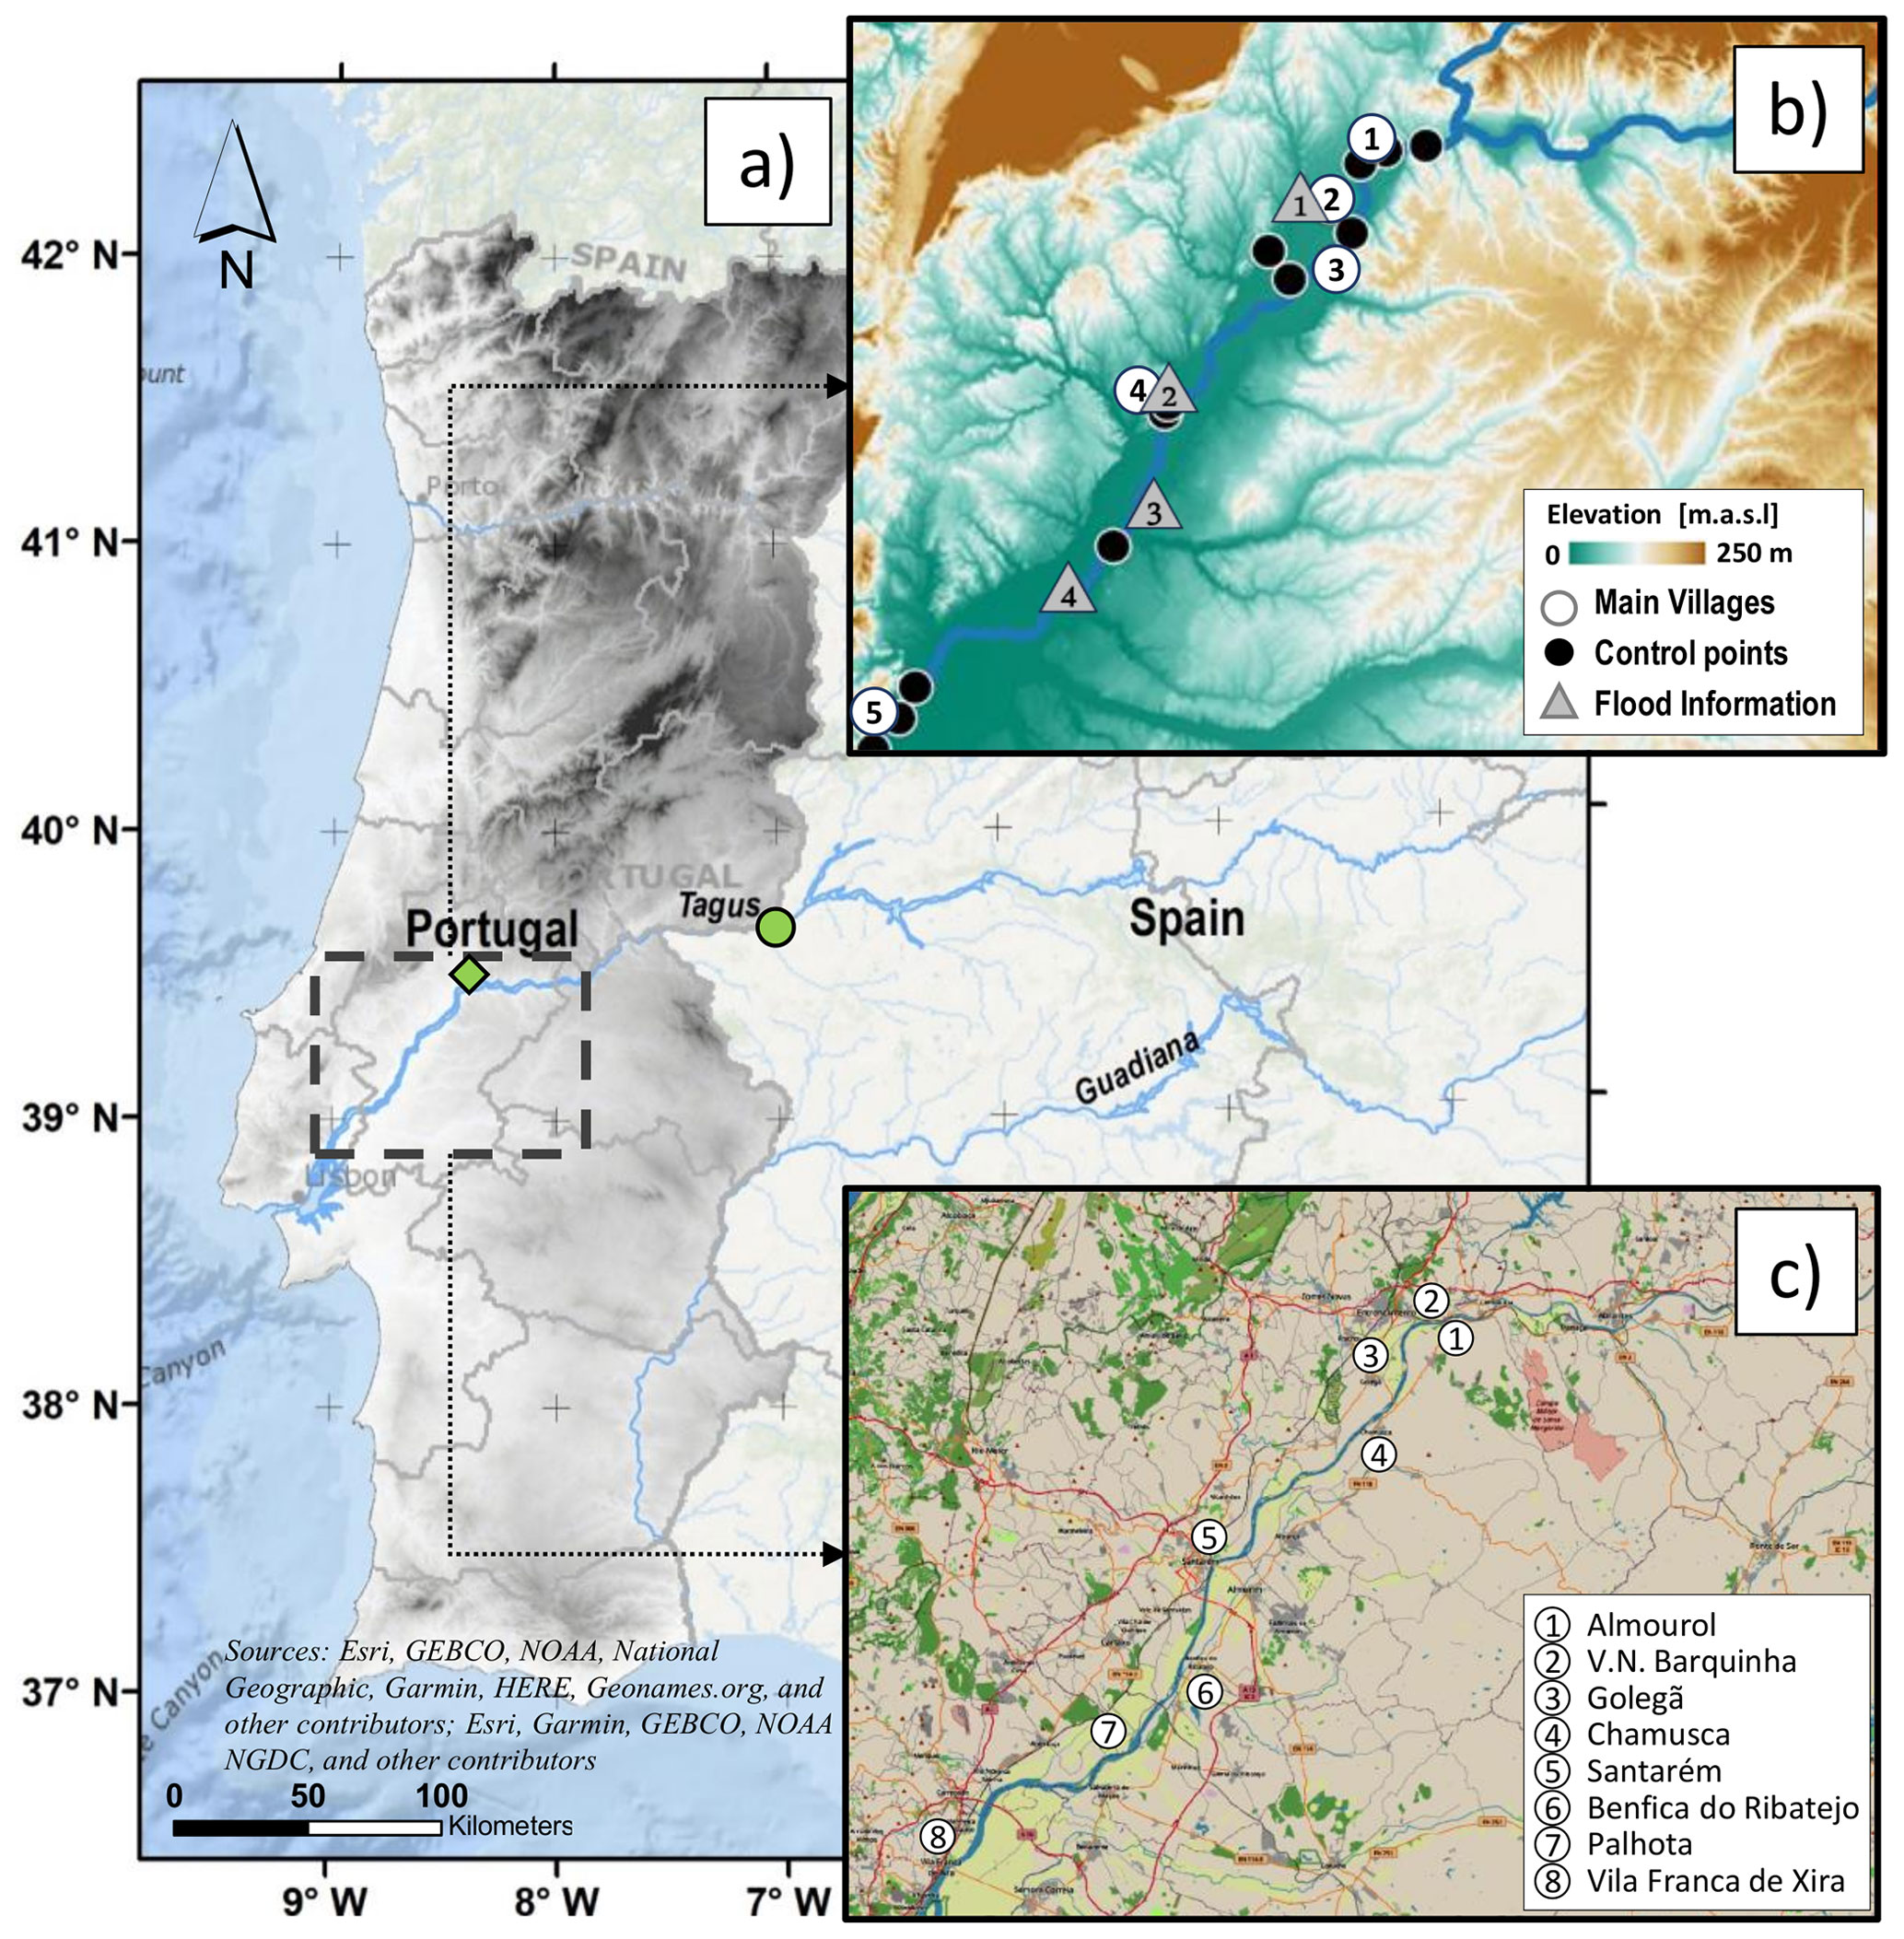
Figure 1Area of study. Panel (a) indicates the location of the study area (dashed black rectangle) including the lower Tagus valley. The green diamond indicates the location of the Almourol station, and the green circle indicates the location of the Alcántara dam. In panel (b), the black circles represent the control points where there are data on the water levels reached in the 1979 flood event. The numbered grey triangles represent areas with relevant flood information (particular flooded areas, water depths, etc.) for the 1979 event: 1 – railroad of Golegã, 2 – Santa Iria statue at Santarém, 3 – football field at Benfica do Ribatejo and 4 – town of Palhota. The numbered white circles indicate the location of the main villages affected by the flood: 1 – Vila Nova (V. N.) da Barquinha, 2 – Golegã, 3 – Chamusca, 4 – Santarém and 5 – Vila Franca de Xira. In panel (c), the main locations of interest are represented. Bathymetry and topography base maps were provided by Esri©. Sources: Esri, GEBCO, NOAA, National Geographic, Garmin, HERE, GeoNames and other contributors; Esri, Garmin, GEBCO, NOAA NGDC and other contributors.
The international Tagus basin is one of the largest river basins located in the Iberian Peninsula, draining more than 80 000 km2 (approximately 70 % in Spain and 30 % in Portugal) (Ramos and Reis, 2001). The Tagus River flows from an elevation close to 1600 m a.s.l. in the headwaters (Sierra de Albarracín, Spain) to sea level at its mouth in the Atlantic Ocean in Lisbon, with an approximate length of 1100 km (Agência Portuguesa do Ambiente, 2016) (Fig. 1). Its flow is characterized by a pluvial regime with higher discharges in winter months and lower ones in summer, with a mean discharge of approximately 450 m3 s−1 (Ramos and Reis, 2001; Fernández-Nóvoa et al., 2017). The natural regime of the Tagus River was highly modified following the construction of several reservoirs, not only in the main river but also in some of its tributaries. Among them, the Alcántara dam stands out for its sheer volume, located on the border between Spain and Portugal (Fig. 1), with a total capacity surpassing 3160 hm3, being the second most important reservoir in the Iberian Peninsula and presenting a high capacity for flow retention. It drains a total extent larger than 50 000 km2, which comprises about 70 % of the total extent of the Tagus basin. The capacity and location of the Alcántara dam imply that the Tagus River flow in the Portuguese sector is controlled, to a large extent, by this dam (Rebelo et al., 2018). Therefore, operating strategies focused on mitigating floods in the lower Tagus valley will be developed and applied to the dam of Alcántara as a case study.
Finally, it is important to remark that the particular characteristics of the lower Tagus valley are especially relevant to the scope of this study. This valley is characterized by a Cenozoic sedimentary basin, with a large and flattened alluvial plain, which promotes floods affecting large extensions causing significant damage (Rebelo et al., 2018) (Fig. 1). This makes this area highly susceptible to periodic flooding associated with different phenomena, such as upstream hydrological floods, downstream tidal floods or storm surge (Vargas et al., 2008; Rocha et al., 2020; Lopes et al., 2022).
4.1 Data
Precipitation data for the area within our scope were obtained from the Iberia01 database (Herrera et al., 2019). This dataset provides daily precipitation data with the highest spatial resolution of 0.1∘ (≈10 km) covering the entire Iberian Peninsula available at the moment. It was produced using a dense network of stations spanning the period 1971–2015. Data are freely available at https://doi.org/10.20350/digitalCSIC/8641.
Daily mean Tagus River discharge data at the Almourol station (Fig. 1) were downloaded from the SNIRH (Sistema Nacional de Informação de Recursos Hídricos) database for the period 1973–2021. SNIRH is the national information system on water resources of Portugal, whose data are freely available at http://www.snirh.pt (last access: November 2023).
Information of the level reached by the water in different points of the lower Tagus valley during the flood event that occurred in February 1979 was also obtained from the SNIRH database (see control points (black circles) in Fig. 1).
Daily outflow and volume data at the Alcántara dam were provided by CEDEX (Centro de Estudios y Experimentación de Obras Públicas) for the period from October 1970 to September 2019. CEDEX is the Spanish institution in charge of managing part of the hydrologic data of the country, which are freely available at http://www.cedex.es/ (last access: November 2023).
4.2 Hydraulic model
Iber is a numerical model that solves the 2D depth-averaged shallow-water equations applying the finite-volume methodology (Bladé et al., 2014). Recently, this code was improved by means of a new implementation in C and CUDA, resulting in Iber+ (García-Feal et al., 2018). This improved model allowed for a much higher efficiency of the simulations, achieving a speedup of 2 orders of magnitude while maintaining the same precision. This was made possible by using GPU (graphical processing unit) computing and HPC (high-performance computing) techniques. This reduction in computation times allows for dealing with large spatial domains and long-term events, thus providing a high capacity to simulate flood events with high accuracy (García-Feal et al., 2018; Fernández-Nóvoa et al., 2020; Bermúdez et al., 2021; Bonasia and Ceragene, 2021; González-Cao et al., 2021). An executable Iber+ version is freely available for download from its official website (https://iberaula.es, last access: November 2023).
In the present study, Iber+ was used to study flood events in the lower Tagus valley and to analyze the effectiveness of several dam operating strategies in terms of flood mitigation. For that, the domain defined in Iber+ includes the Tagus basin from Almourol to its mouth in Mar da Palha (the large basin in the estuary of the Tagus River near its mouth) at Lisbon (Fig. 1). The inlet is defined as a critical/subcritical condition, which allows representing the real conditions of the river using the daily mean river flow estimated in Almourol as input, whereas the outlet of the domain is defined by means of a supercritical/critical condition, which allows the drainage of water without altering the flow regime and provides an adequate representation of the river downstream (Iber user manual in https://www.iberaula.es/54/iber-model/downloads, last access: November 2023). Both conditions were successfully applied in previous studies where flood hydraulic simulations were also performed (Fernández-Nóvoa et al., 2020; Santillán et al., 2020; González-Cao et el., 2021, 2022). Precipitation data from Iberia01 were included in the domain, being the infiltration computed by means of the SCS-CN (Soil Conservation Service curve number) methodology (Mockus, 1964; Beven, 2012), which is especially suitable and widely applied to address rainfall–runoff computations in precipitation events (Wang, 2018; Fernández-Nóvoa et al., 2020), and according to data provided by GCN250 (Jaafar et al., 2019). The spatial patterns of different land uses were defined using CORINE Land Cover data, which provides a minimum mapping unit of 25 ha with a minimum width of 100 m (CLC, 2000). The land uses for the area under study, as well as the associated roughness Manning coefficients that were used in the model, are detailed in Fig. 2.
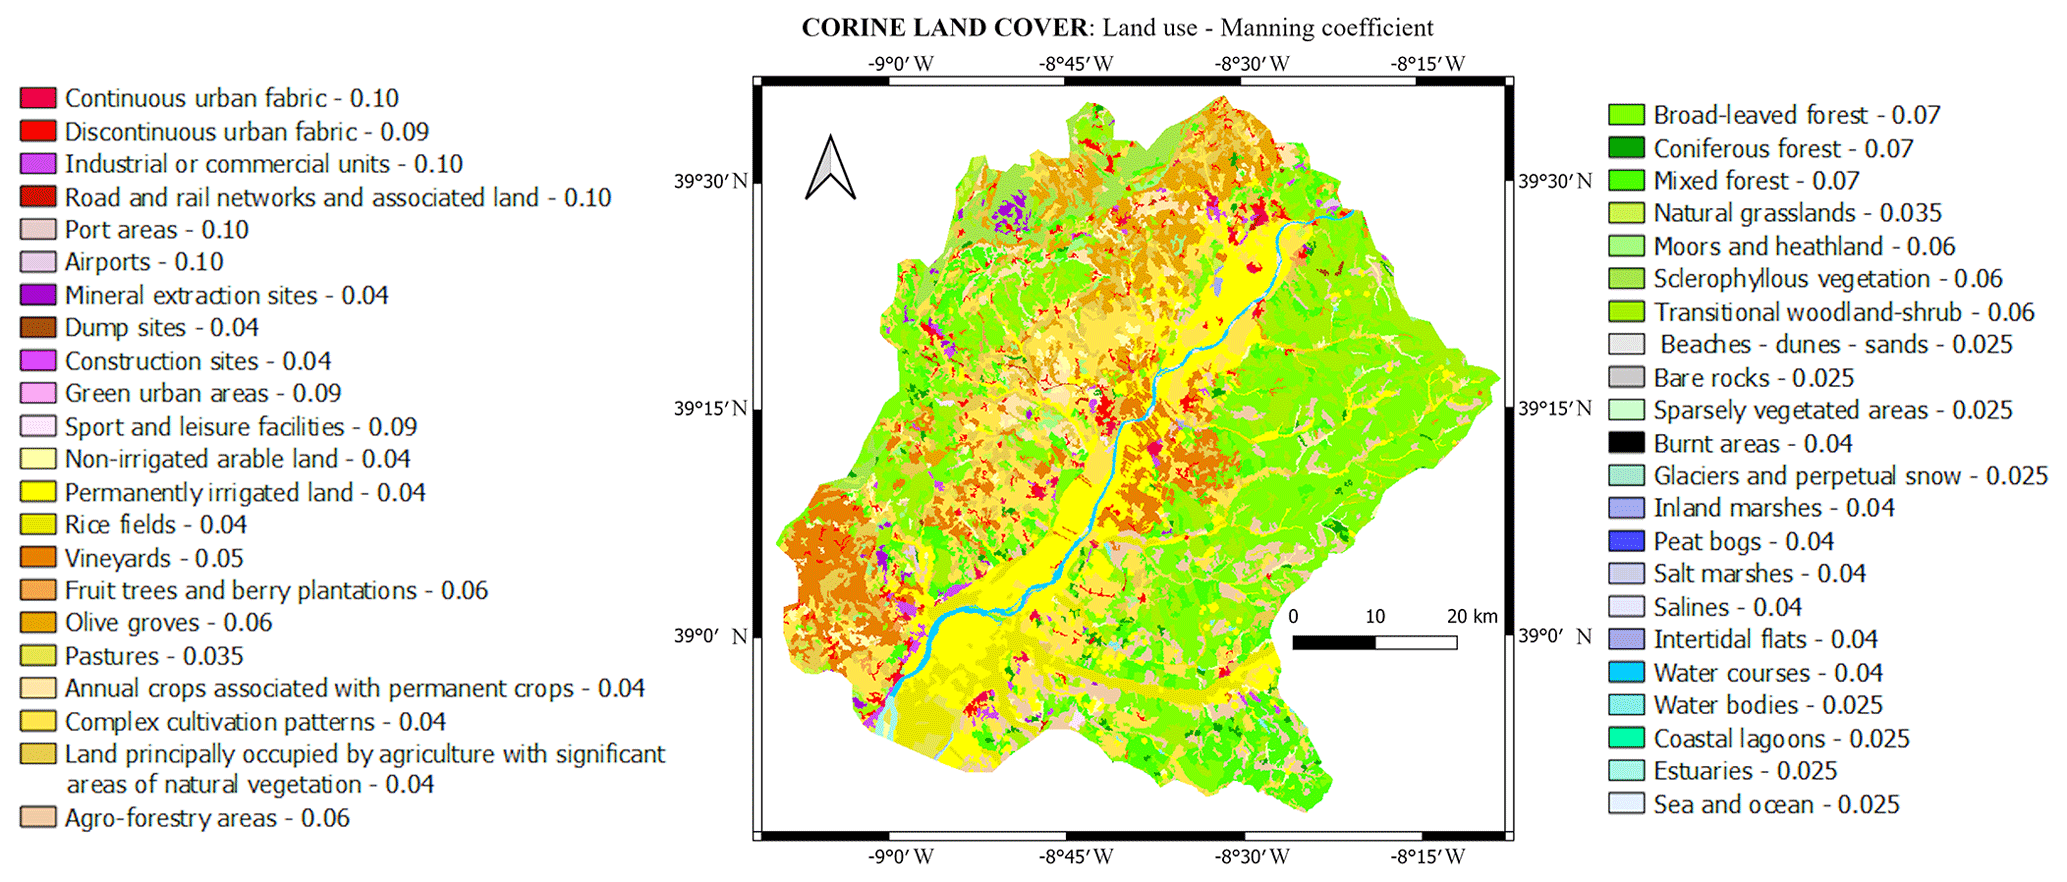
Figure 2Land uses, from CORINE Land Cover, for the study area and associated Manning coefficients.
The entire domain was discretized using a mesh of unstructured triangles with an average side length varying from 25 m in the flood valley to 100 m in the rest of the domain, surpassing 6 000 000 elements. The computational time step is variable and was calculated following the Courant–Friedrichs–Lewy (CFL) condition (Courant et al., 1967). The Courant number was set to 0.45, and the average computational time step varied between 0.05–0.55 s for the different simulations.
Regarding the model simulations, it is also important to note that the aggradational and degradational processes were not considered in the simulations due to the lack of available data and also considering the macroscopic scope of the research, covering the entire lower Tagus valley, which prevent analyzing multiple processes in detail. In the same way, the in-line structures such as bridges were not considered in the simulations. We acknowledge that in further studies addressing local areas with more detail by using higher-resolution modeling, these issues should be included and evaluated in the flood analysis.
Several simulations were used here. The first (Simulation_Control_1979) is focused on reproducing the spatial extension and depth of the flood observed in the lower Tagus section in the 1979 event, considering the historical timing and magnitude of water released by the main dams upstream as well as the precipitation downstream. The results obtained with this simulation were also used to validate the accuracy of the model by comparing it with the available information on this flood. The remaining simulations (Simulation_Dam), deal with artificial changes imposed on the dams with the aim of mitigating the flood magnitude in the lower Tagus area.
4.3 Digital elevation models (DEMs)
Different widely used and tested freely available global DEMs (Mukherjee et al., 2013; Szabó et al., 2015; Becek et al., 2016; Carrera-Hernandez, 2021; Guth and Geoffroy, 2021) were evaluated to select the most suitable one to reproduce the floods in the area within our scope. The analyzed DEMs were (i) the Esri DEM for the Portugal mainland, which was made available by Esri Portugal (Esri copyright ©) through the ArcGIS online platform (downloadable from https://www.arcgisonline.com/home/search.html?t=content&q=owner:ESRI-PT, last access: July 2023) and is based on data obtained by the Terra ASTER (Advanced Spaceborne Thermal Emission and Reflection Radiometer) sensor adapted to Portugal; (ii) the ASTER GDEM obtained by photogrammetric methods from the Japanese ASTER VNIR sensor (infrared nadir and backward sensors with 15 m ground sampling distance) and provided by NASA Earthdata and Japan Space Systems (downloadable from the USGS, https://earthexplorer.usgs.gov/, last access: July 2023); (iii) the SRTM DEM obtained by the Shuttle Radar Topography Mission by SAR interferometry (downloadable from the USGS, https://earthexplorer.usgs.gov/, last access: July 2023); and (iv) the Copernicus DEM (COP DEM GLO-30) provided by the European Space Agency (ESA) and Airbus. This DEM is based on the WorldDEM™, which is in turn based on edited and smoothed radar satellite data acquired during the TanDEM-X mission (downloadable from ESA's Copernicus Space Component Data Access (CSCDA) system, https://panda.copernicus.eu/, last access: July 2023). Some original characteristics of these DEMs are specified in Table S1 in the Supplement. All the databases are freely available and provide horizontal resolutions of about 30 m.
At this point it is important to note that, although the events to be simulated occurred several years ago and the DEMs tested are more recent, their use is appropriate for the purposes of this study. Despite the fact that some changes may have occurred at a local scale, the macroscopic picture of the terrain topography is similar. In addition, there is a lack of precise and well-distributed older terrain information to perform an accurate reconstruction of the terrain elevation for the periods of interest. In fact, previous studies analyzing past events at very local scale in nearby areas have also used current elevation information due to the limited changes in terrain elevation along with the lack of precision of older data (González-Cao et al., 2021, 2022). Furthermore, the flood events analyzed span several years between them, and a common framework is necessary to compare and evaluate the differences in flood impact under the mitigation strategies proposed, as well as in order for them to be applied in further studies. Together, this justifies the use of the available current DEMs.
4.4 Validation method of the hydraulic model coupled with different DEMs
The flood event of 1979 was simulated with the Iber+ model coupled to each of these different DEMs to evaluate its performance in representing flooding in the lower Tagus valley, taking advantage of the information provided by the SNIRH database on the maximum water level reached during this event at some points located throughout the area within our scope (see black circles in Fig. 1). For that, the maximum water levels reached at these control points were extracted for the simulation carried out with each DEM. Thus, real maximum water levels were compared with water levels obtained in each simulation performed using the different DEMs under analysis. Taylor diagrams (Taylor, 2001) were used to make this comparison and, therefore, test the performance of the hydraulic model coupled with the different DEMs. These diagrams provide a concise statistical summary of the degree of correspondence between simulated and observed fields through the joint representation of the respective statistical parameters (Taylor, 2001). It should be noted that this methodology is especially suitable and widely used to analyze the performance of models in relation to observations (González-Cao et al., 2019; Wijayarathne and Coulibaly, 2020; Muñoz et al., 2022). The normalized standard deviation (Eq. 1), the normalized centered root mean square difference (Eq. 2) and the correlation coefficient (Eq. 3) were used.
where S is the simulated water level obtained with the numerical model, O is the observed water level, barred variables refer to mean values, N is the total number of observed data, subscript i refers to the different points of available data, subscript n refers to normalized values, and σ is the standard deviation.
4.5 The Alcántara dam and optimal operating strategies for flood mitigation
4.5.1 The role of the Alcántara dam in the lower Tagus valley
The Alcántara dam has by far the greatest water storage capacity in the Tagus basin, which, together with its location, acts as an important regulation of river flow in the lower Tagus valley, as mentioned above. Therefore, the evaluation of possible flood mitigation in the lower Tagus by dams will be focused on Alcántara functioning. To better know the impact of the very large Alcántara dam releases in the lower Tagus valley, a comparison between dam outflow and the river flow reaching Almourol was established. It was detected that, for the common period of available data (1973–2019), Alcántara provides, on average, 59.60 % of water reaching Almourol. In addition, it is known that the lower Tagus starts to overflow when it exceeds approximately 1500 m3 s−1 (Ramos and Reis, 2001; Rebelo et al., 2018). Thus, in terms of flood analysis, this means that a dam release of approximately 1000 m3 s−1 would imply a flood risk situation. Therefore, we will consider a flood flow at the Alcántara dam when the outflow exceeds 1000 m3 s−1. Obviously, this is a general approximation since the instantaneous flow that reaches the lower Tagus valley depends on the particular conditions downstream, and therefore, the percentage of the contribution from the Alcántara dam can fluctuate over time. However, the present approach, considering the flow of Alcántara as 60 % of the total flow that reaches the lower Tagus valley, will be used to analyze the dam functioning in terms of flood mitigation (the corresponding flow in the lower Tagus valley, that is, Alcantara_Outflow/0.6, will be considered the input of the respective Simulation_Dam).
4.5.2 Development of optimal dam operating strategies for flood mitigation in the lower Tagus valley
In a first approach, a general dam operating strategy was proposed to provide a controlled outflow focused on mitigating floods. To be operational, the strategy must be sustained in a clear sequence of logical principles, such as keeping an average water storage similar to the historical one. In this sense, it is important to remember that dams are multi-purpose water resource systems, and a balance should be struck between ensuring flood mitigation and other purposes, such as water supply or hydropower production (Lee et al., 2009). Hence, the need to maintain a storage similar to the real one must be equally considered. In fact, previous studies have also highlighted the need to maintain dam volume conditions similar to the real ones in order to develop useful dam operating strategies (Shrestha and Kawasaki, 2020). In this sense, the Alcántara dam had a mean annual volume of 62 % during the available data period (1970–2019), and it was slightly lower (59 % on average) during the rainy season (from November to March). In this context, to maintain this dam filling level at around 60 % seems to represent a good compromise, not undermining the normal operability of the dam. Therefore, the dam level remains at 60 % occupancy as long as river flow allows it. Thus, the proposal is based on two principles: (i) a dam fill level that allows a certain free dam capacity to deal with peak flows, whenever possible, is maintained, hereafter referred to as the base filling level (BFL); (ii) the maximum outflow will be limited to 1000 m3 s−1 whenever allowed by dam capacity. This value corresponds to the security outflow level considered, that is, an outflow below the threshold that the downstream channel is capable of safely conveying. Similar approaches have been used by previous studies that develop dam release rules based on safe flow limits (e.g., Lei et al., 2018).
The dam operation under the approach rules defined above was carried out starting in October 1970 and extended to the entire available period (September 2019), forced with the real inflow. Thus, dam volume will vary according to the differences between inflow and outflow. Controlled outflow is obtained by means of the following equation:
where Qo is the controlled outflow; Ql is the security outflow level (1000 m3 s−1); Qf is the dam outflow necessary to not exceed the dam capacity, that is, to maintain the dam at a full level (if the dam is already full, this corresponds to Qi, the river inflow); Vi is the inflow volume; Vd–1 is the dam volume of the previous day; VT is the total capacity of the dam; and (corresponding to BFL=60 %). In addition, a function is applied to avoid abrupt differences between the outflow of the first two proposed outflow conditions. The overall approach used here corresponds to Operational Strategy 1 (OS1 from now on). A flowchart defining the OS1 operation is presented in Fig. 3.
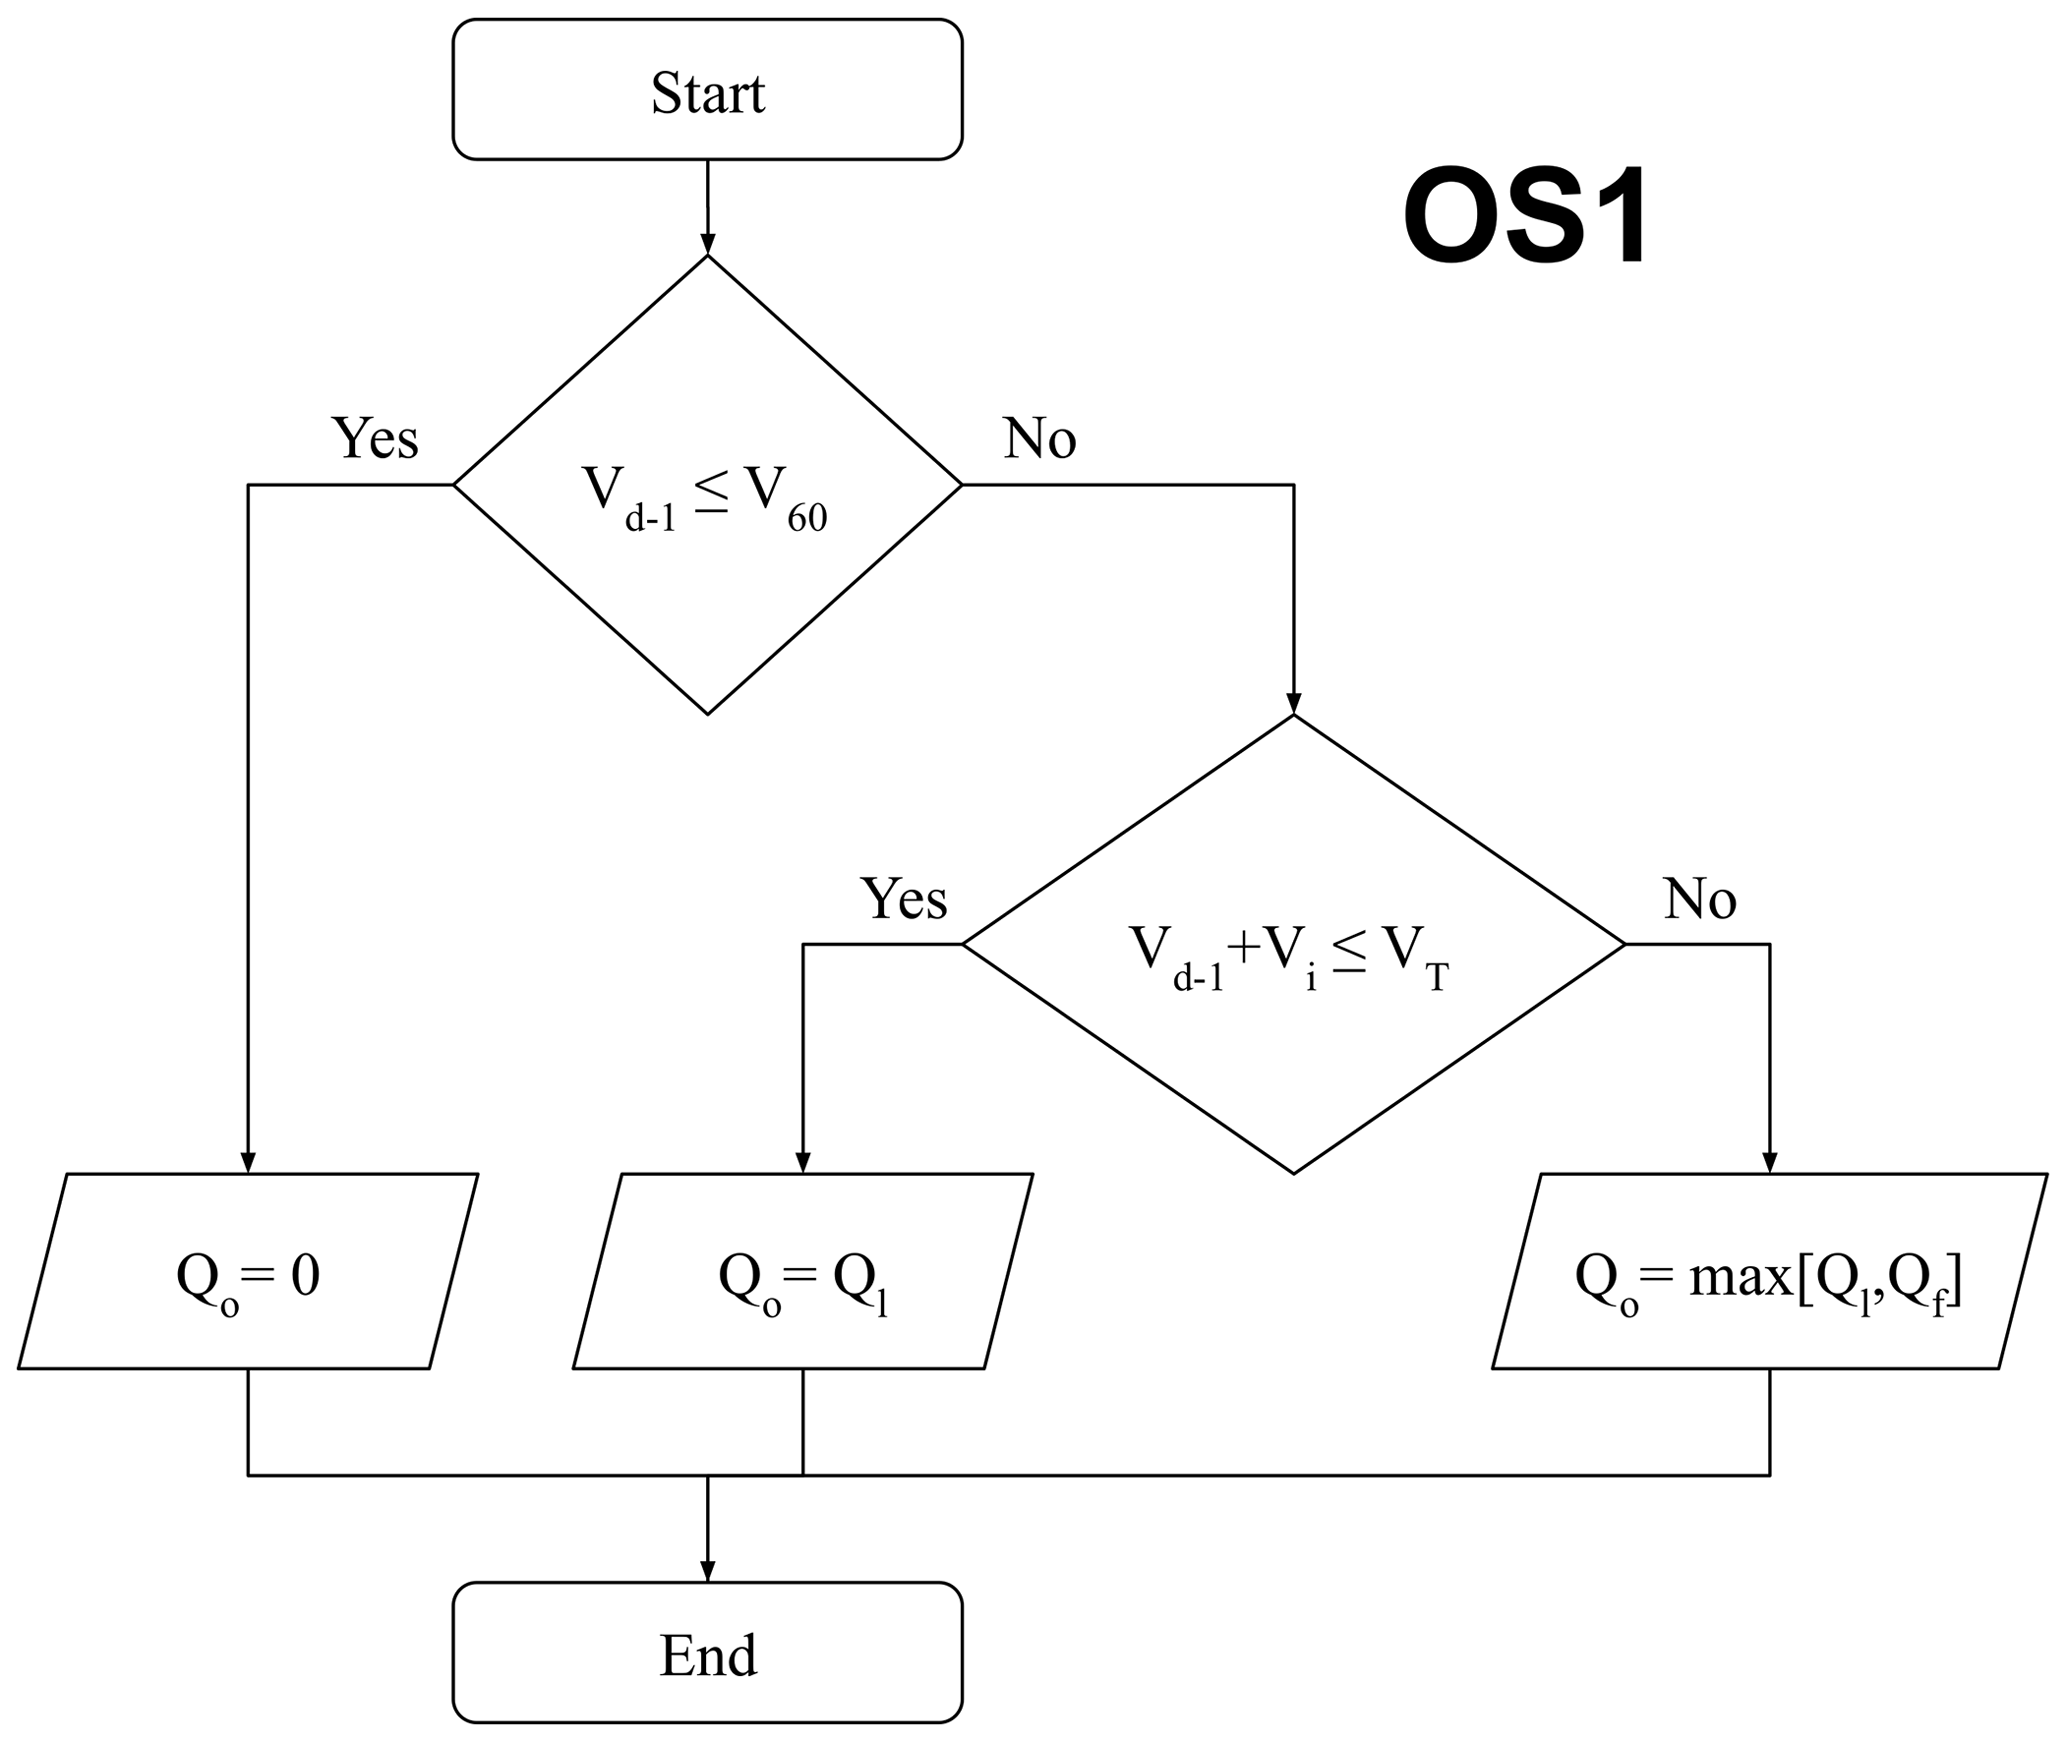
Figure 3Flowchart of the dam operation strategy presented in Eq. (4): OS1. Qo is the controlled outflow; Ql is the security outflow level (1000 m3 s−1); Qf is the dam outflow necessary to not exceed the dam capacity, that is, to maintain the dam at a full level (if the dam is already full, this corresponds to Qi, the river inflow); Vi is the inflow volume; Vd–1 is the dam volume of the previous day; VT is the total capacity of the dam; and (corresponding to BFL=60 %). In addition, a function is applied to avoid abrupt differences between the outflow of the first two proposed outflow conditions.
The application of OS1 is focused on avoiding flooding for as long as possible, without considering the possible peaks that may arrive later. For that, a dam operating strategy more focused on mitigating the most extreme peak flows, those that can cause catastrophic floods like those recorded in 1979, was also proposed. This also allows for comparing the overall implications of different approaches of dam operation. Thus, an efficient approach mostly focused on minimizing the effects of the extreme peak flows could be to allow higher outflows, above 1000 m3 s−1, on the previous days, guaranteeing a sufficient dam free volume to minimize the extreme peaks, which would result in producing controlled floods. However, it is important to take into account that the outflow must always be limited by the inflow when it exceeds the safety flow; that is, the outflow can never exceed the inflow under flood conditions. This allows for reducing the extreme peaks but avoids inducing human-made floods, an approach that has also been considered fundamental in previous studies addressing dam operation to mitigate floods (Chou and Wu, 2015). To achieve this goal, a second approach was added to OS1 to deal with extreme flow situations. Analyzing the existing data, it will only be necessary to apply this approach for the most extreme events, that is, when the expected accumulated volume for the following 7 d exceeds the 99.9th percentile of the historical series. Under these conditions, controlled outflow is obtained by means of the following equation:
V90 is the volume considered the security base filling level for extreme events, considered 90 % of dam capacity (). Vmax refers to the day when the peak of the event is expected. is the outflow which allows the maintenance of the volume of the dam at 90 % of its capacity, and is the outflow that allows the dam capacity not to be exceeded. A function is applied to avoid abrupt differences between the outflow of the first two proposed outflow conditions. The overall approach used here corresponds to Operational Strategy 2 (OS2 from now on). A flowchart defining the OS2 operation is presented in Fig. 4.
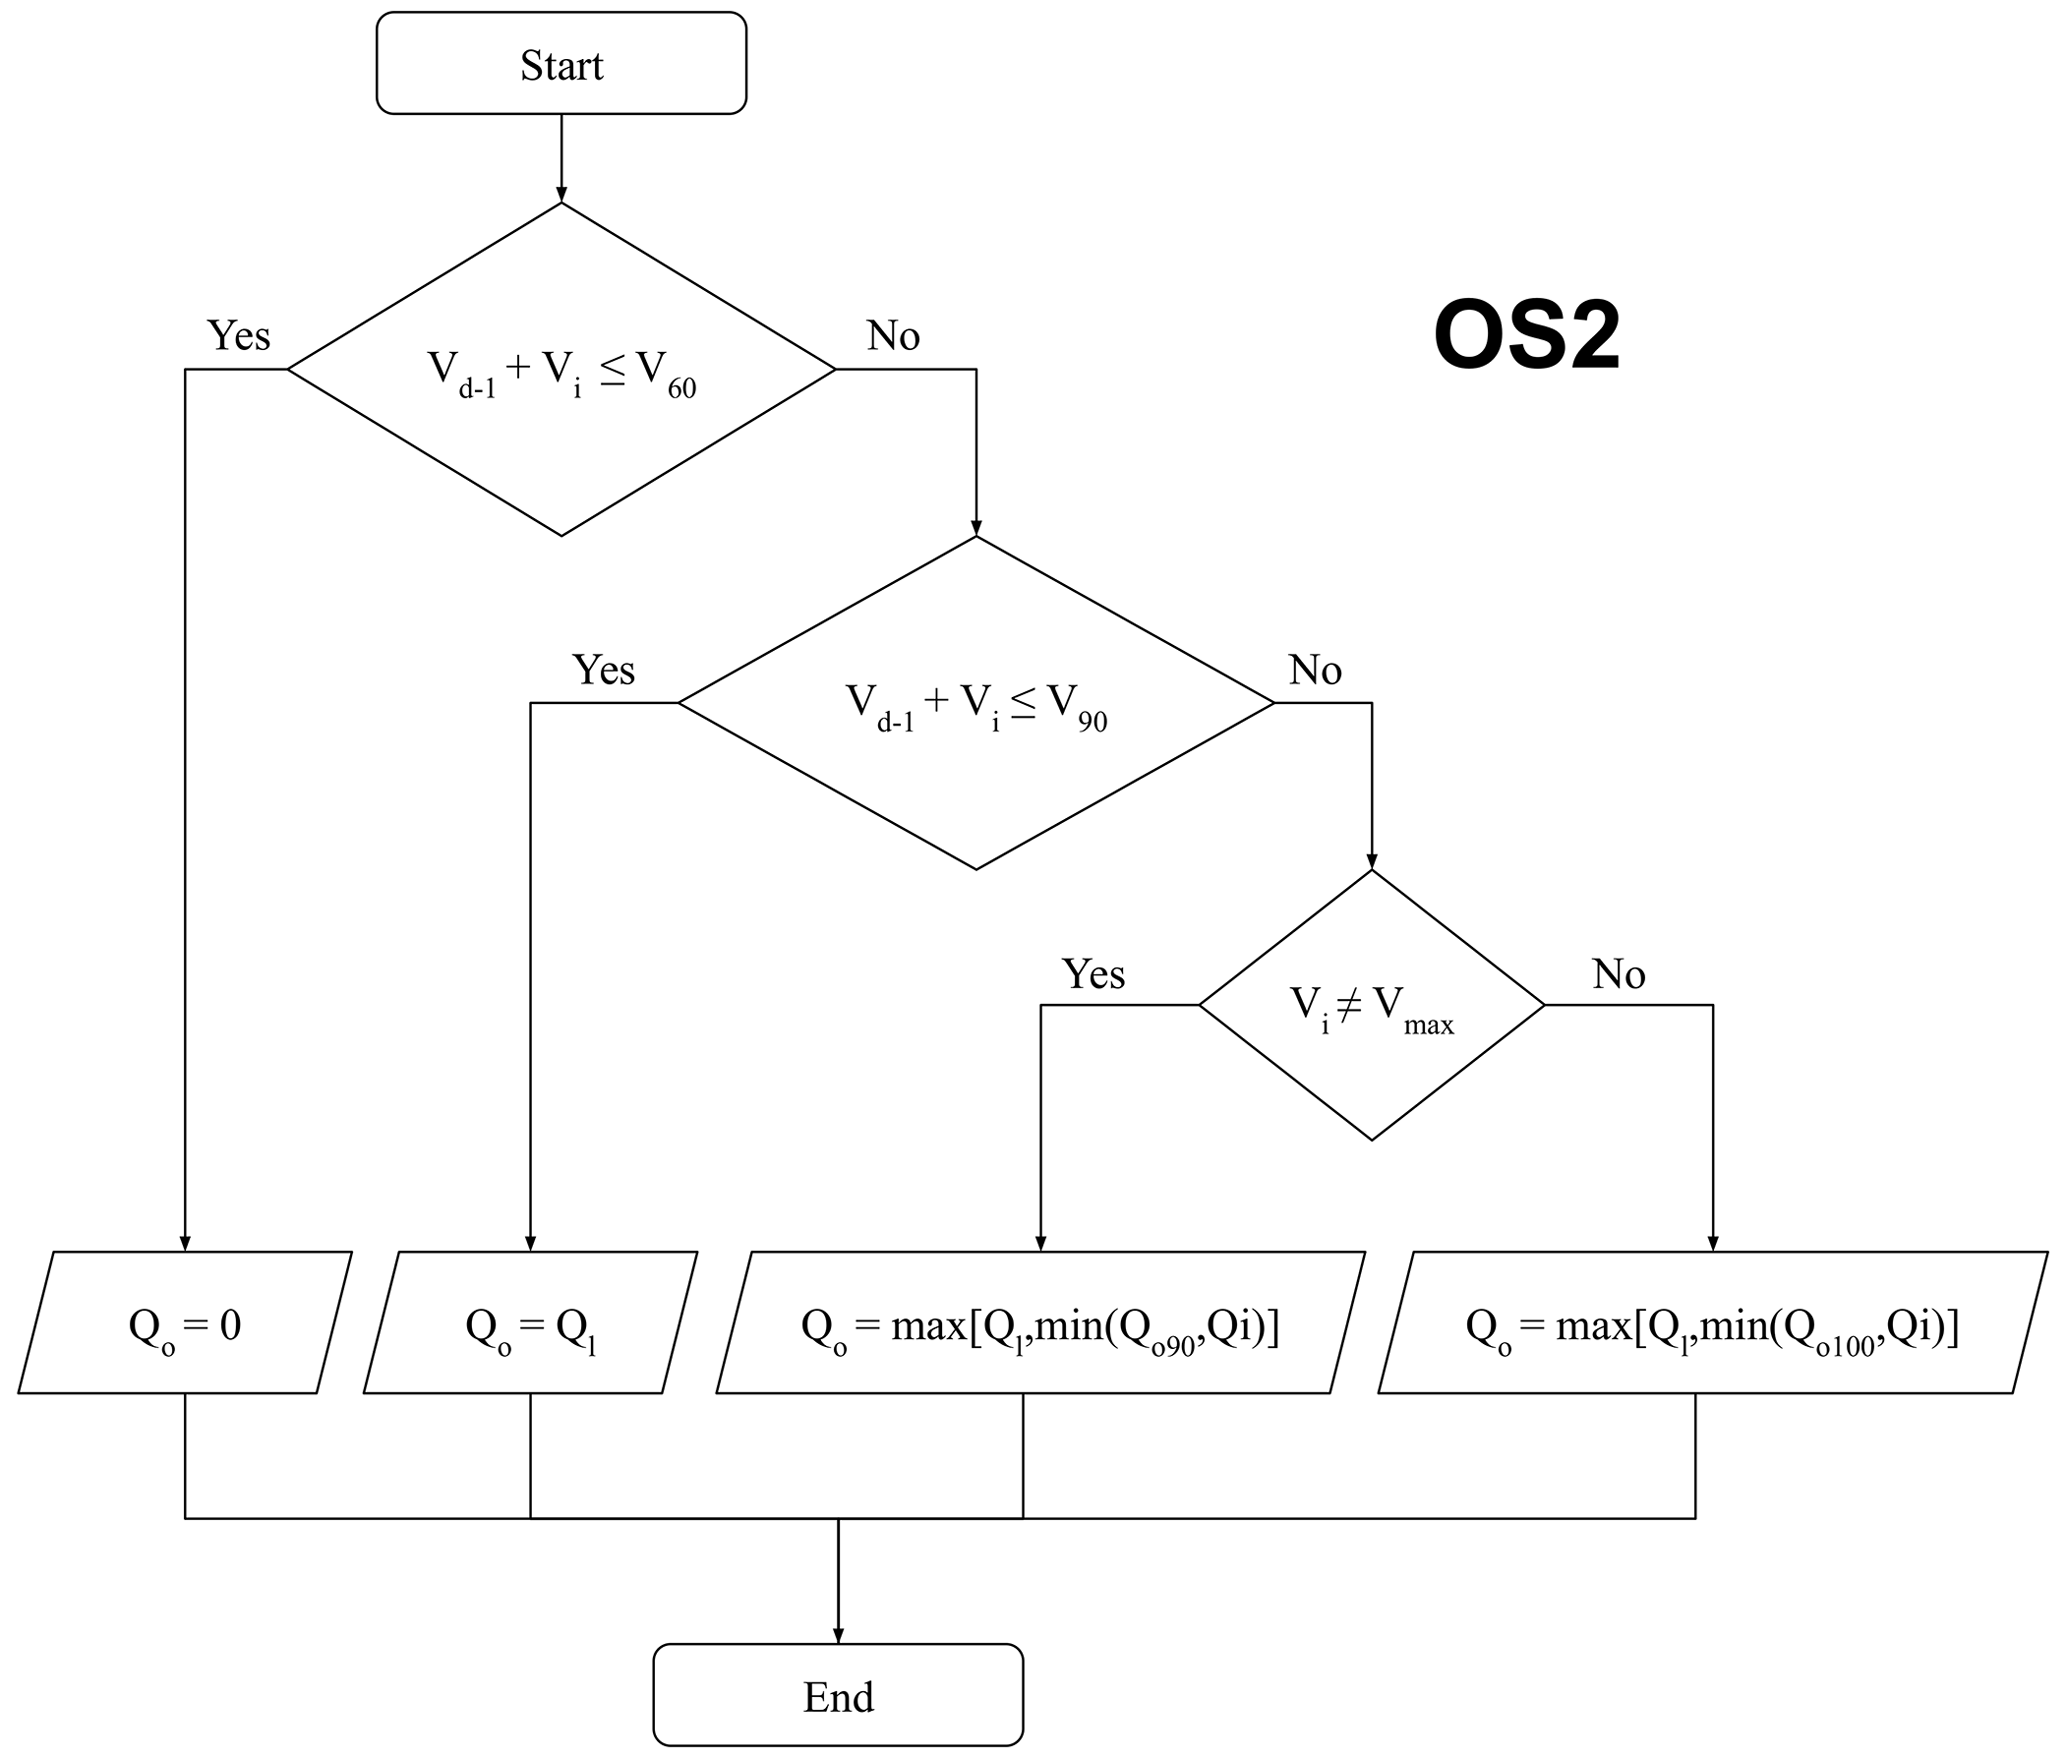
Figure 4Flowchart of the dam operation strategy presented in Eq. (5): OS2. V90 is the volume considered the security base filling level for extreme events, considered 90 % of dam capacity (). Vmax refers to the day when the peak of the event is expected. is the outflow which allows the maintenance of the volume of the dam at 90 % of its capacity, and is the outflow that allows the dam capacity to not be exceeded. A function is applied to avoid abrupt differences between the outflow of the first two proposed outflow conditions.
Thus, the present condition is focused on guaranteeing a certain free reservoir capacity to smooth the most extreme peak flows, so it will only be applied in very extreme conditions, since the necessary conditions for application are highly restrictive. In the rest of the cases, OS1 would be applied.
We acknowledge that one important caveat of OS2 is that in order to detect possible extreme situations, it is necessary to know approximately the expected volume for the following days; however the uncertainty associated with strategies based on more precise forecasts is reduced. In fact, currently, new approaches based on the analysis and forecast of atmospheric structures that transport large amounts of moisture (such as atmospheric rivers), which are responsible for most of the extreme and large intense precipitation events, namely in the western Iberian Peninsula (Ramos et al., 2015, 2020), can provide better predictability and detection of those possible extreme situations (Ramos et al., 2020). This allows us to apply the proposed strategy efficiently. However, we acknowledge that further analysis should be necessary to assess the uncertainty associated with these forecasts and their application to this case.
Finally, we consider it important to note that, although the strategies developed in the present study may be highly efficient for the case within our scope, previous studies have developed and applied other approaches that are also effective in developing dam operating strategies for flood mitigation in other locations. For example, Chou and Wu (2015) showed a methodology, applied to a dam in Taiwan, based on developing operating rules that consider three flood stages: prior to flood arrival, preceding flood peak and after the flood peak. Each stage has its owns rules, being the determination of the stages based on real-time measurements. While the rules intend to be based on real-time measurements and depend as little as possible on forecast, preliminary detection (forecast) of the flood events is also necessary to initialize the process. Lei et al. (2018) showed an example of interconnected rules to operate several flood reservoirs in China, through different optimization approaches. On the one hand, a single-objective optimization was proposed to mitigate the flood in a specific location (for example, the most vulnerable city). In this sense, all the dams operate focused on minimizing flooding in this particular location. On the other hand, a multi-objective optimization was proposed to mitigate flooding in several vulnerable areas. Consequently, the flood mitigation in the most vulnerable location is less effective than with the single-objective optimization. Hasebe and Nagayama (2002) demonstrated that the application of neural networks for decision support could provide efficient dam operation to flood control in Japan. Other approaches were based on reproducing different hypothetical situations, including distinct ranges of river flow, as well as different conditions for dams, specifically focused on the initial water level and the degree of opening of the gates. This approach is used by some authors, who show that it allows for the provision of information about the best dam operation under different flood conditions (Hardesty et al., 2018; Ridolfi et al., 2019). Other authors have reproduced historical floods with hydrodynamic models, associated with critical dam releases, also carrying out studies on the resulting flooded areas with and without protection structures, such as levees, under different dam outflows and thereby providing useful information to help in the development of mitigation strategies (Patel et al., 2017). We acknowledge that although the dam operating strategies proposed in the present work serve as a basis for developing future studies focused on optimizing dam strategies for the area within our scope, some of these other approaches could also be tested and applied in future studies.
4.5.3 Evaluation of the performance of dam operating strategies developed
The efficiency of both proposed strategies (OS1 and OS2) was evaluated analyzing firstly the floods that would occur considering the natural regime (dam inflow), as well as the floods under the real dam operation, and then evaluating the mitigation achieved with the proposed strategies throughout the entire study period. Then, special attention was focused on those more extreme events to analyze the efficiency of the dam operating strategies in these critical situations. In particular, five extreme cases were selected according to the literature and to the available data series (http://www.cedex.es/, last access: November 2023): February 1972, March 1978, February 1979, December 1989 and November 1997. All these five cases are characterized by peak flows higher than 5000 m3 s−1 at the Alcántara location. In addition, most of them are also included in the top 10 most important extreme events in terms of daily and accumulated precipitation considering the entire Tagus basin (Ramos et al., 2014, 2017). A hydraulic analysis was also made for these most extreme events in order to analyze the effective flood reduction achieved in the lower Tagus valley by means of the two strategies proposed (OS1 and OS2). The analysis is especially focused on evaluating the reduction achieved in flood extent, water depth and water velocity. In this sense it is important to highlight that water depth is a critical and dangerous factor in these events, since the damage caused by floods is closely linked to the water depths reached (Tsakiris, 2014; Huizinga et al., 2017). In addition, the velocity reached by water is also another factor that can increase flood damage (Cox et al., 2010).
5.1 Validation of different DEMs
Unlike other countries such as Spain, Portugal has only freely available high-resolution digital elevation models (DEMs) for the coastal area and a few additional areas (https://www.ign.es/web/ign/portal, last access: November 2023; https://dados.gov.pt/pt/, last access: November 2023). Therefore, it is no surprise that for the lower Tagus (depicted in Fig. 1), a high-resolution DEM is not freely available, as such DEMs can generally only be acquired from national organizations that produce topographical and bathymetric cartography at scales compatible with local studies. This could represent a limitation to analyzing in detail flood development over concrete locations, namely within towns or villages where high resolution is necessary to adequately address the flood progress through the streets. However, global DEMs can provide an adequate representability to analyze the large-scale evolution and the magnitude of flood events (Yan et al., 2013; Courty et al., 2019). Available global DEM products have spatial resolutions varying from meters to kilometers. Horizontal and vertical accuracies can also vary greatly depending on the type of topography, and they can reach tens of meters (Thompson et al., 2001; Zhang et al., 2014).
In this context and considering the wide range of available DEMs, it was felt necessary to evaluate the suitability of different freely available DEMs to adequately represent floods in the lower Tagus valley. To achieve this goal, one of the most important flood events which occurred in that area in February 1979 was simulated and analyzed for different DEMs in order to test which one was most appropriate for the area within our scope. As was mentioned above, four DEMs were tested, namely the Esri, ASTER, SRTM and Copernicus DEMs (Karlsson and Arnberg, 2011; Wang et al., 2012; Garrote, 2022).
In general terms, the results obtained with the Copernicus, SRTM and ASTER DEMs clearly indicate better performance for simulating floods in the lower Tagus valley compared to the Esri DEM, which provides worse results in all the statistics analyzed by means of a Taylor diagram (Fig. 5). Especially notable are the results obtained with the Copernicus DEM, which are clearly the closest to the reference data, indicating that the Copernicus DEM presents the best accuracy, i.e., the best capability to address floods in the area within our scope. In particular, it presents a high correlation with the measured data, above 0.99, with a normalized standard deviation close to 1 and the lowest normalized centered root mean square difference (<0.1). The SRTM DEM also presents a correlation above 0.99, although the normalized standard deviation (1.11) and the normalized centered root mean square difference (0.17) are worse than those obtained with the Copernicus DEM. The ASTER DEM presents statistics that are slightly worse than those of the SRTM DEM. In addition, the original elevation data from these DEMs were also compared with the official altimetric values by calculating several statistical indicators to evaluate the associated error and deviation, including the mean absolute error (MAE), standard deviation (SD), root mean square error (RMSE) and the mean error (ME) (see Table S2 in the Supplement). The Copernicus DEM is also corroborated as the most accurate, presenting the best values in all the analyzed statistics, followed again by the SRTM DEM (see the detailed analysis provided in the Supplement). Additionally, the spatial distribution of the standard deviation of the absolute error for the Copernicus DEM was further investigated (Fig. S1 in the Supplement). The results confirm that overall, the Copernicus DEM displays low error values throughout the study area (see detailed analysis in the Supplement). Recent studies comparing the accuracy of different DEMs across the European continent (Guth and Geoffroy, 2021) and in other parts of the world (Garrote, 2022) also confirm the higher precision of the Copernicus DEM in comparison with other global products.
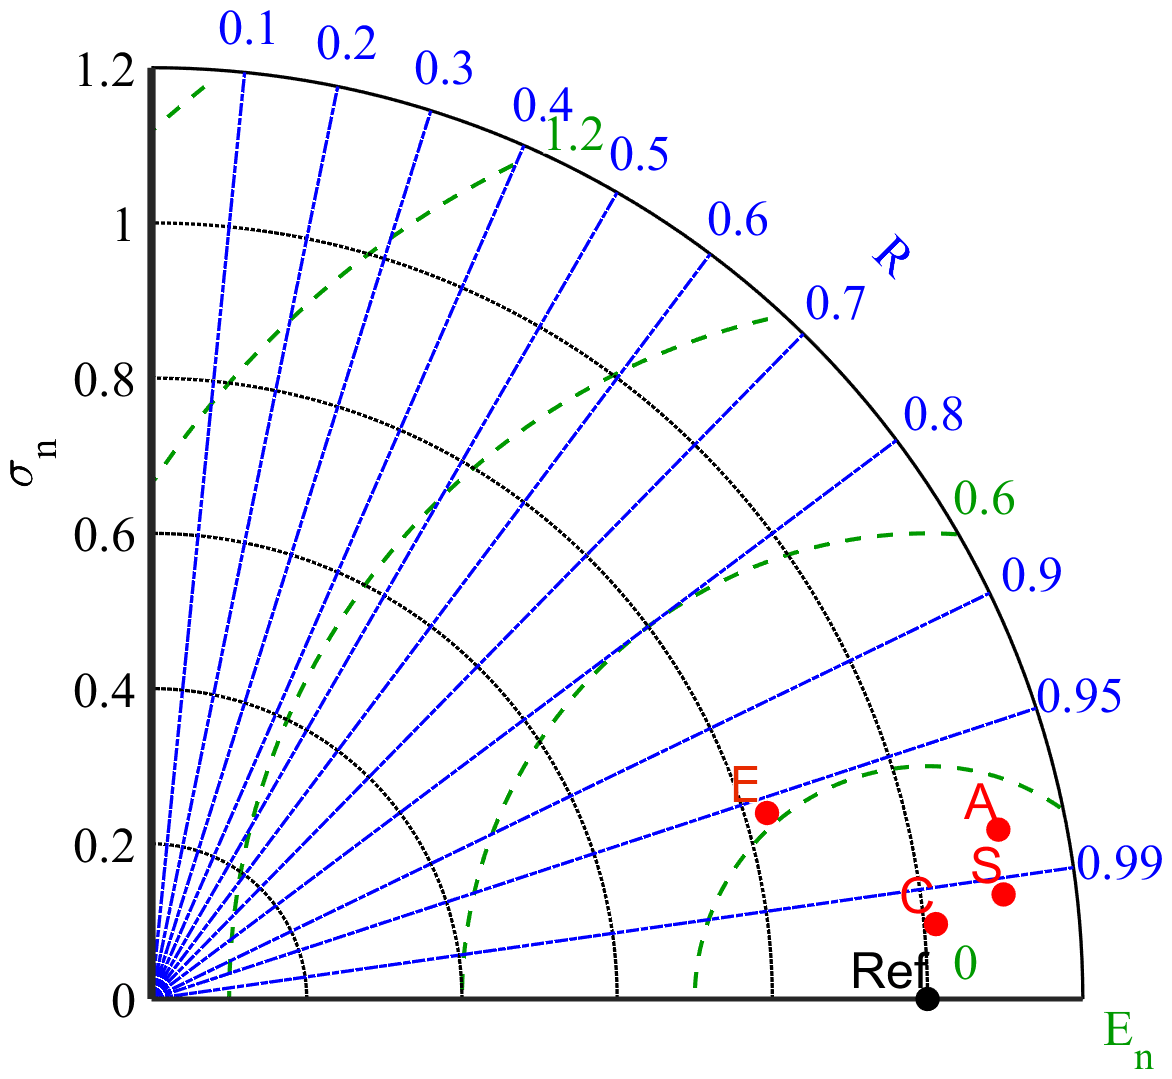
Figure 5A Taylor diagram of the water elevation obtained with Iber+ using the field data as reference. E, A, S and C indicate the Iber+ data obtained using the Esri, ASTER, SRTM and Copernicus digital elevation models, respectively.
This confirms that the Copernicus DEM, coupled with the Iber+ model, is capable of adequate reproduction, at large scale, of the flood events in the lower Tagus. In fact, the statistical parameters analyzed by means of the Taylor diagrams corroborate not only the better performance compared to the other DEMs analyzed, but also the accurate representation of the reference flood data. Therefore, the Copernicus DEM was selected for the remaining analysis.
5.2 Flood event of 1979
This event was simulated (Simulation_Control_1979) in order to analyze the spatial–temporal evolution of the flood (Fig. 6). In general terms, previous studies have detected that the high precipitation rates that occurred during the event and the previous days caused an increase in the Tagus River flow until it reached a relative maximum surpassing 5000 m3 s−1 at Almourol on 5 February, an amount that has been associated with the beginning of the significant impacts of flood (Zêzere et al., 2014; Rebelo et al., 2018). As can be observed in Fig. 6a, the simulation indicates that a large part of the valley is flooded under these conditions, although the water depth values are relatively low near the villages. On the following days, river flow experienced a certain decrease, and consequently, the simulation shows a decreasing water depth, with water slightly receding from some locations (Fig. 6b). However, the situation degrades again afterwards and starts to be critical from 9 February on, reaching an outstanding maximum on around 11 February, surpassing 13 000 m3 s−1 at Almourol. Under these conditions most of the valley is flooded, but the most important fact detected by the simulation is that the water depth reveals a significant increase (Fig. 6c). The high water levels reached near the villages in the simulation are a clear indication that they were affected by the flood, as confirmed by previous studies (Zêzere et al., 2014; Rebelo et al., 2018). These publications corroborate the flood impact on several important villages located in the valley, including V. N. da Barquinha, Golegã, Chamusca, Santarém and Vila Franca de Xira (Fig. 1). As mentioned above, the resolution of the available DEMs does not allow for resolving all topographic characteristics of the villages; however results obtained by the simulation indicate the flooding of these locations. In addition, previous analyses have shown that these high water levels caused the isolation of some of these village populations, and, on several occasions, people had to be evacuated by boats and helicopters, since roads or railroads were waterlogged (Zêzere et al., 2014; Rebelo et al., 2018). Although these structures usually present a certain elevation with respect to the surrounding terrain, the water depths reached during this event meant that they were equally flooded (Rebelo et al., 2018). Overall, the reports of flooded locations and specific sites are supported by the model results. In particular, the simulation indicates an increase in the water level of the Tagus River in Santarém above 4 m with respect to the non-flood situation, a similar increase to that detected with the measured data (Rebelo et al., 2018), stressing the unusual level of this flood event. Although the river flow decreased over the following days, the flood situation still lasted. Our simulation indicates that, on 16 February (Fig. 6d), although water levels suffered an important decrease and water receded from some locations of the valley, a large fraction of the valley remained flooded.
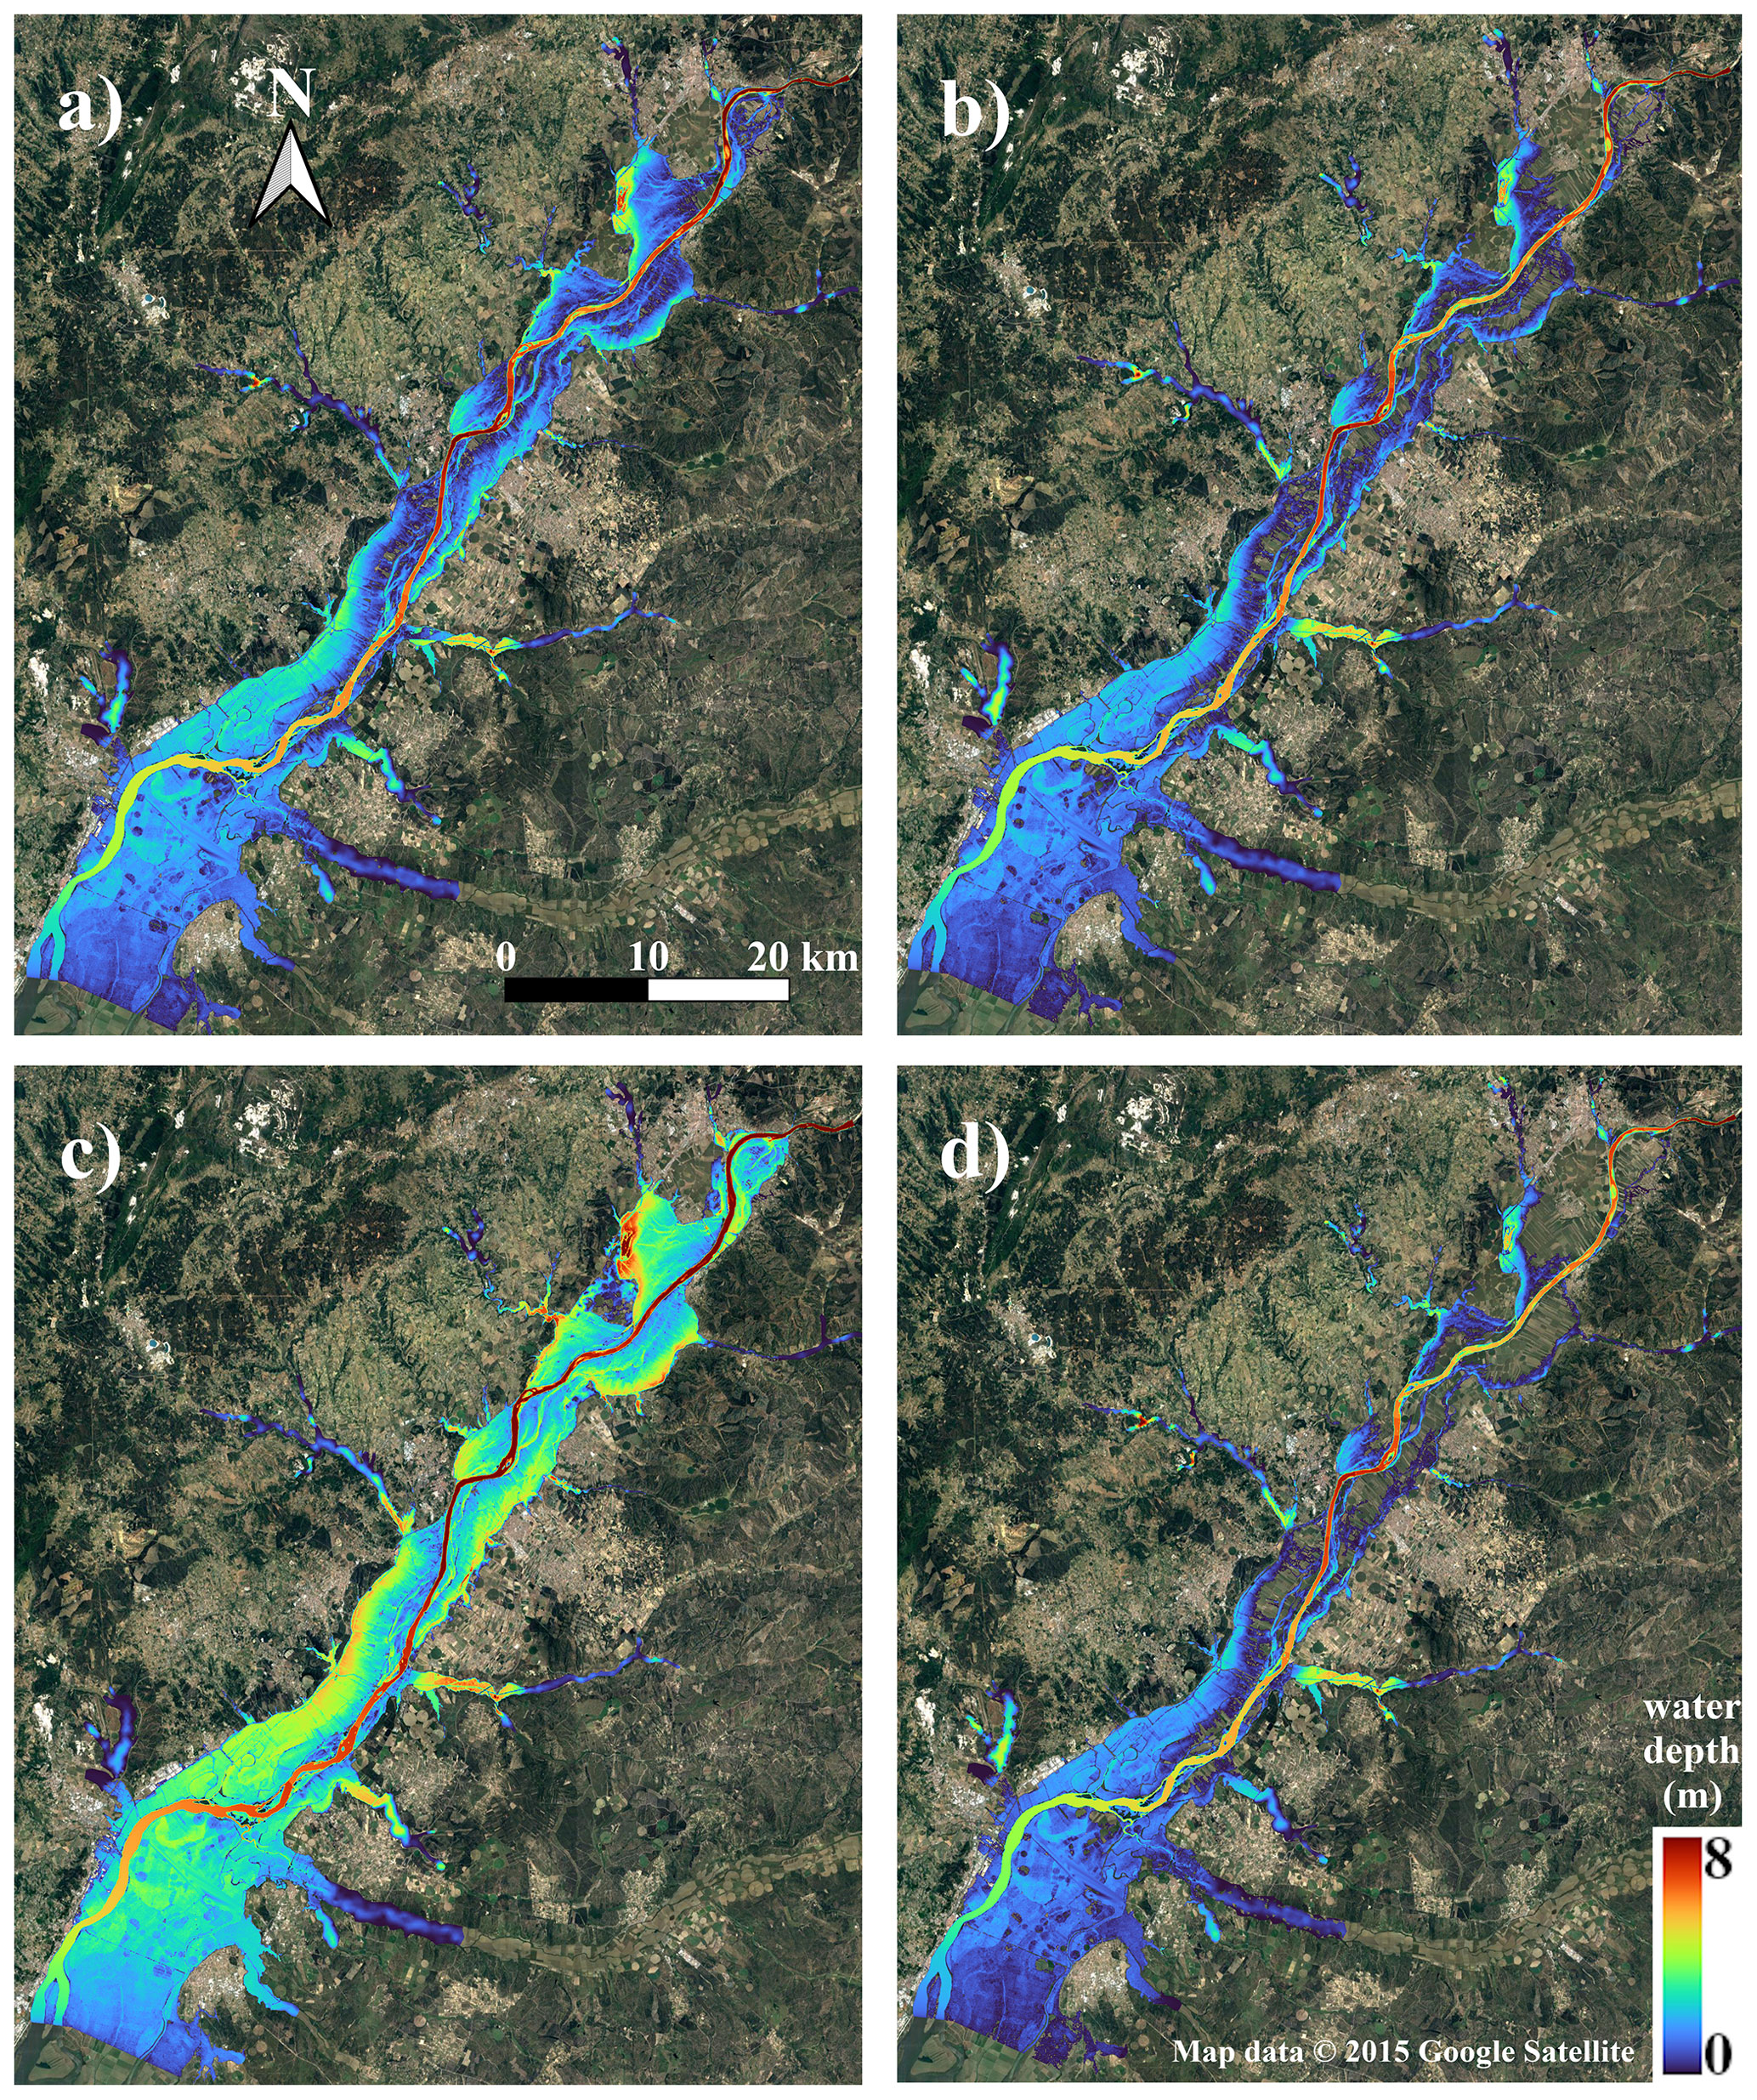
Figure 6Reproduction of water depth (m) for the flood event that occurred in February 1979 in the lower Tagus valley, using the Iber+ hydraulic model. Panels (a)–(d) represent the flood situation on 5, 8, 11 and 16 February under Simulation_Control_1979. Map data © Google Earth.
There are some documents that collect detailed information related to the maximum water depths reached during this flood, constituting a valuable additional source of data useful for validating the accuracy of the model. First of all, the Portuguese National Civil Engineering Laboratory (LNEC) and Water Institute (INAG) reconstructed the maximum flooding area during this event (Fig. 7, white line). As can be observed in Fig. 7, the simulated flood extension is practically coincident with the registered flood extension. Only in the areas inside the towns is the flood extension provided by the simulation a little smaller due to the limitations of the DEMs noted above, whereby representing the advance of water in towns is limited.
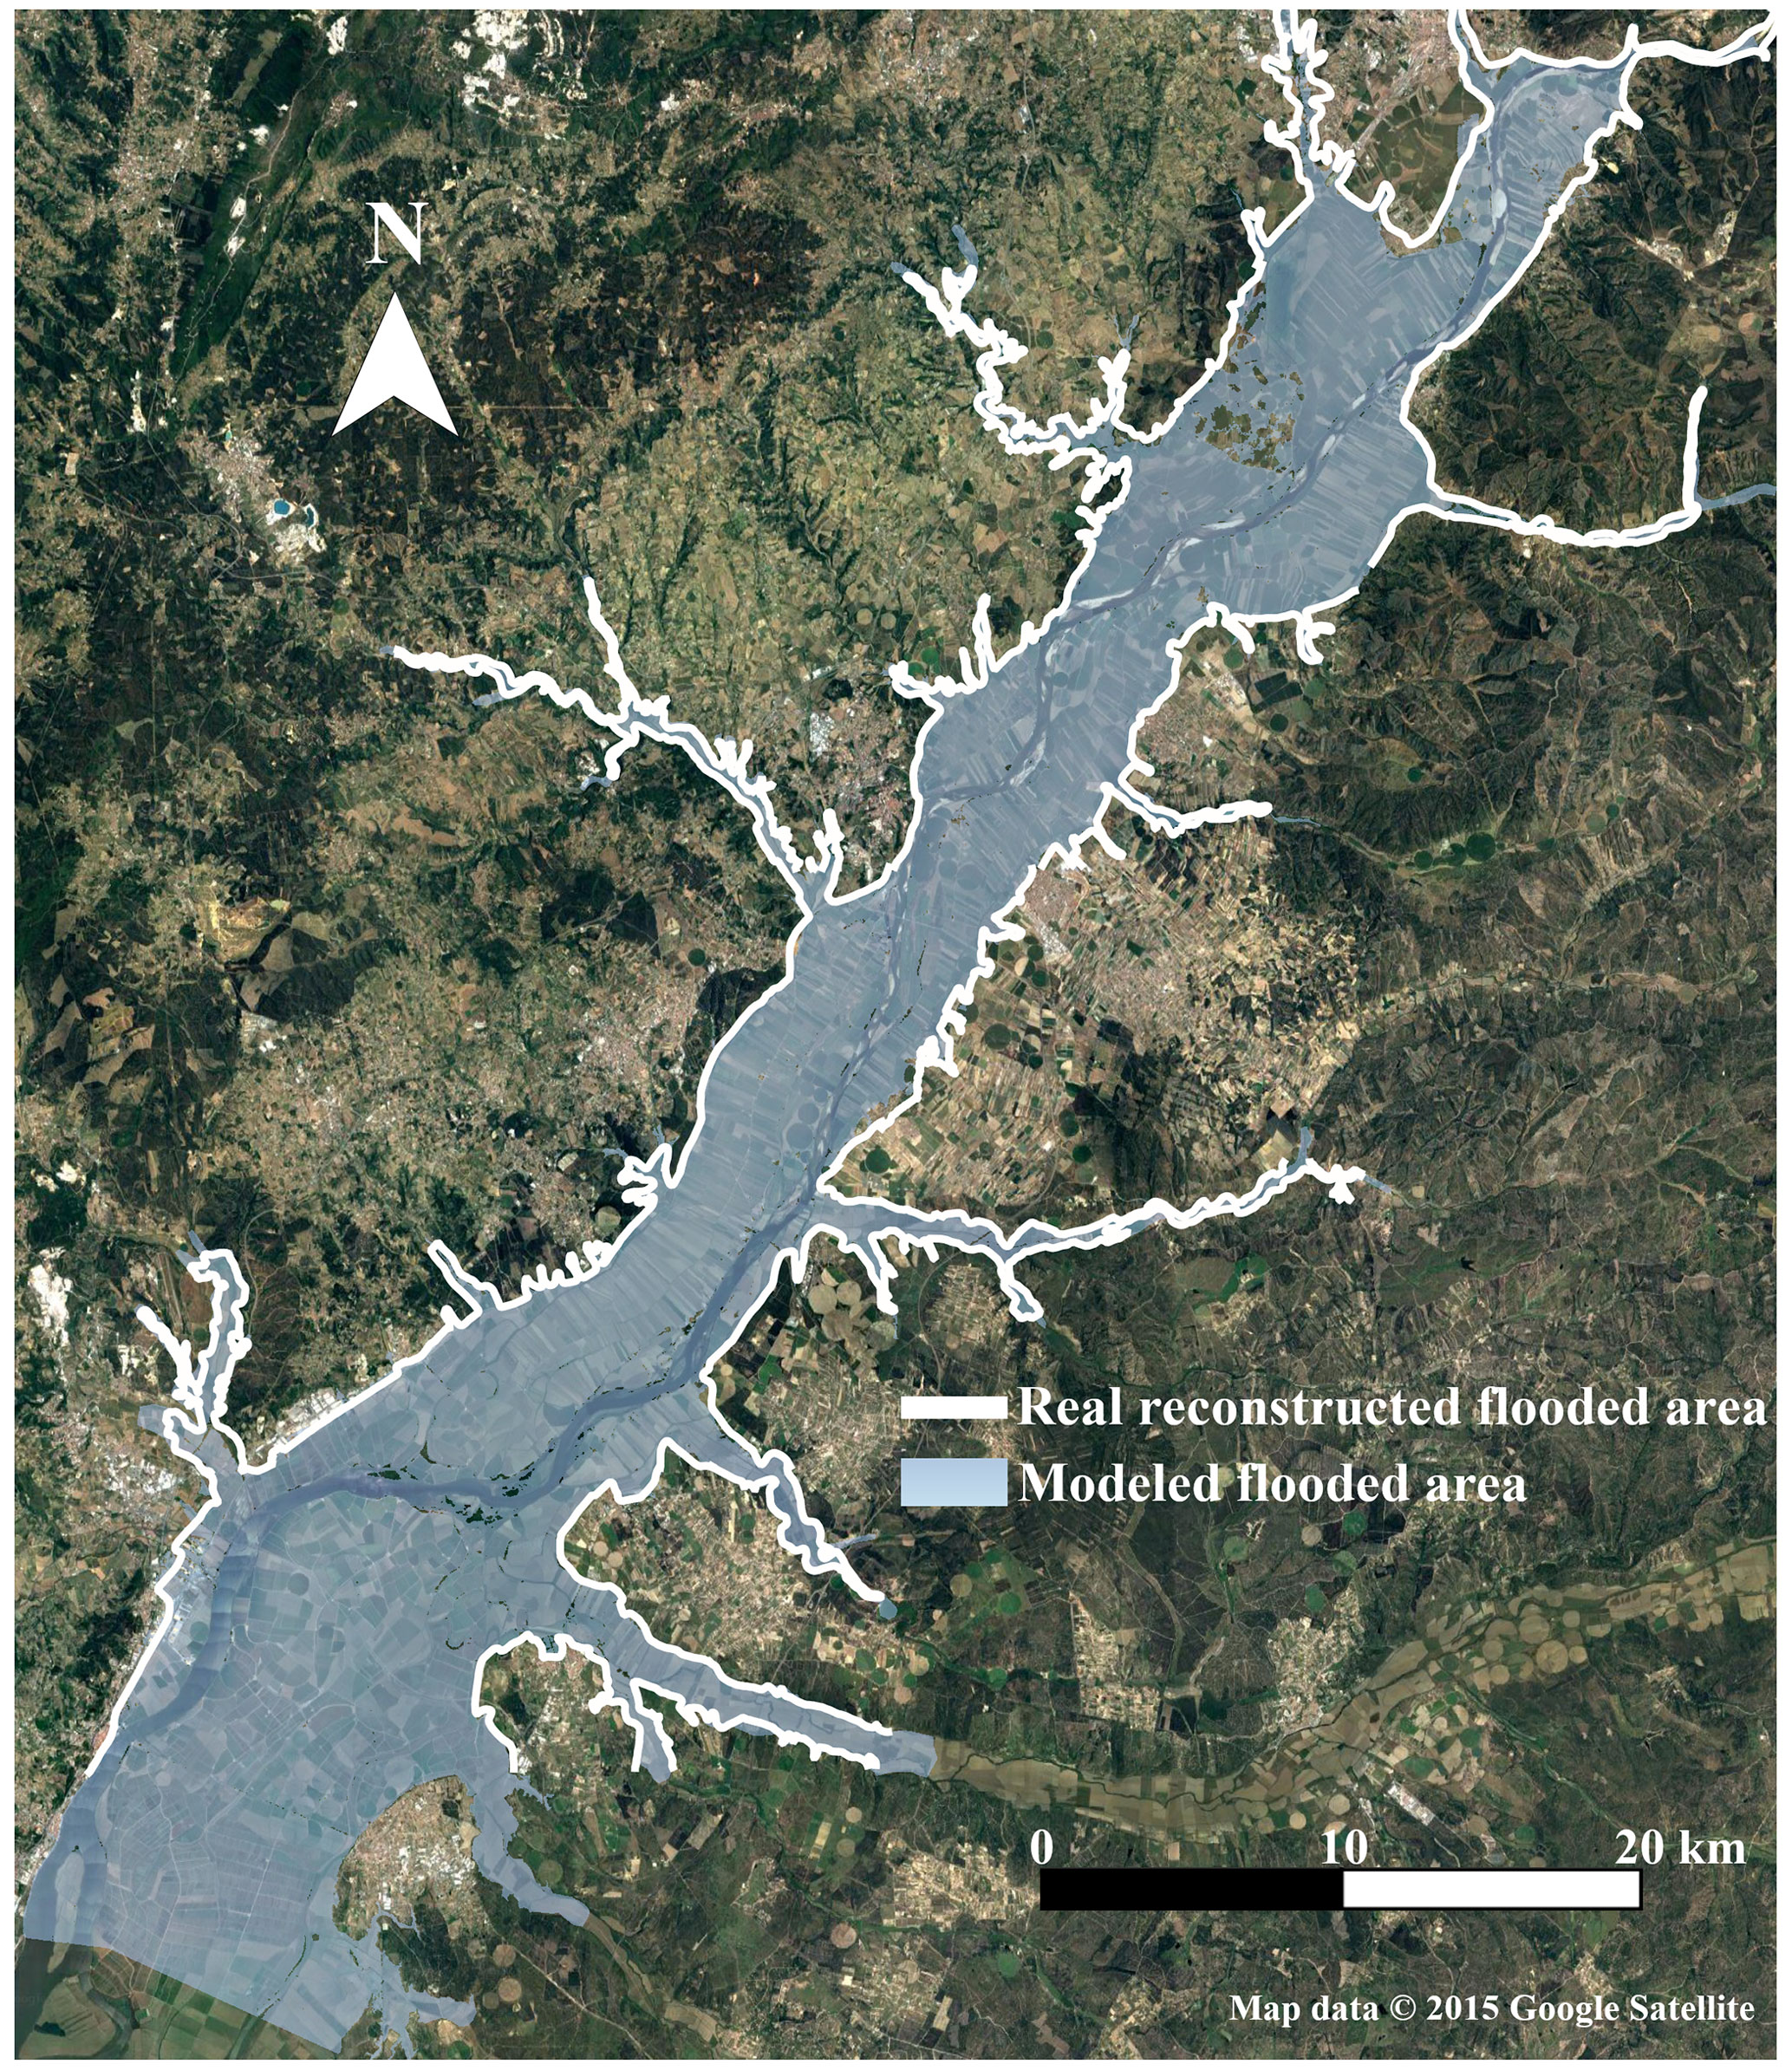
Figure 7Maximum flood extension for the event of February 1979, in the lower Tagus, obtained from the hydraulic simulation (Simulation_Control_1979). The white line represents the real extension of the flood reconstructed by the National Civil Engineering Laboratory (LNEC) and the Water Institute (INAG) of Portugal (http://www.snirh.pt, last access: November 2023). Map data © Google Earth.
More specifically, Rebelo et al. (2018) stated that the railroad line near to Golegã was flooded and an important means of transport was interrupted. As can be observed in Fig. 8 (panel 1), the simulation detected that this infrastructure was flooded over a large section, corroborating the blocking of the railroad. Another location with valuable information on the flood is the town of Benfica do Ribatejo. In particular, some photographs indicate the flooding of the football field of this location, a situation also reproduced in the model (Fig. 8, panel 3). In the surroundings of Santarém, specifically at the statue dedicated to Santa Iria (Fig. 8, panel 2), there is information about the depth reached by water during this event. The existing documents indicate that water almost reached the feet of the statue (Loureiro, 2007), which indicates a water depth of about 3 m. In the model simulation, water also reaches this area (Fig. 8, panel 2), with water depths surpassing 2.5 m, which is in good agreement with the real situation. Additionally, Fig. 8 (panel 4) represents the town of Palhota. In this location there are several watermarks in different houses, indicating an approximate water depth of 1.8 m. In the simulation, this town is also affected by floods, as can be detected in Fig. 8 (panel 4), with a water depth ranging between 1 and 2 m in the surroundings of this area, in line with the in situ measurements. This larger range of values reflects the particular location of this watermark, inside the town where the global DEMs present higher uncertainty. Therefore, it can be concluded that the simulations carried out in this work, using the Iber+ model in combination with the Copernicus DEM, allow for a good reproduction of the 1979 flood extent and water depth in the lower Tagus valley. However, we acknowledge that there are some caveats regarding our modeling, namely the relatively low resolution of our DEM, especially over constructed areas that have been flooded and where a more detailed analysis requires a higher-resolution DEM such as the DEM produced and made available by the Direção Geral do Território (DGT), which corresponds to a strip of 600 m at sea and 400 m on land, of the coastal areas of mainland Portugal with a resolution of 2 m, obtained from a survey with lidar technology. An equivalent DEM but for all continental territory was already announced to be in construction in 2021 by DGT, although it is not yet available at the time of this study. Thus, although the DEM used appears to provide an adequate macroscopic view of the flood and allows for the general analysis of flood mitigation under the different dam strategies presented below, the absolute values obtained in some locations should be taken with caution for the reasons mentioned above.
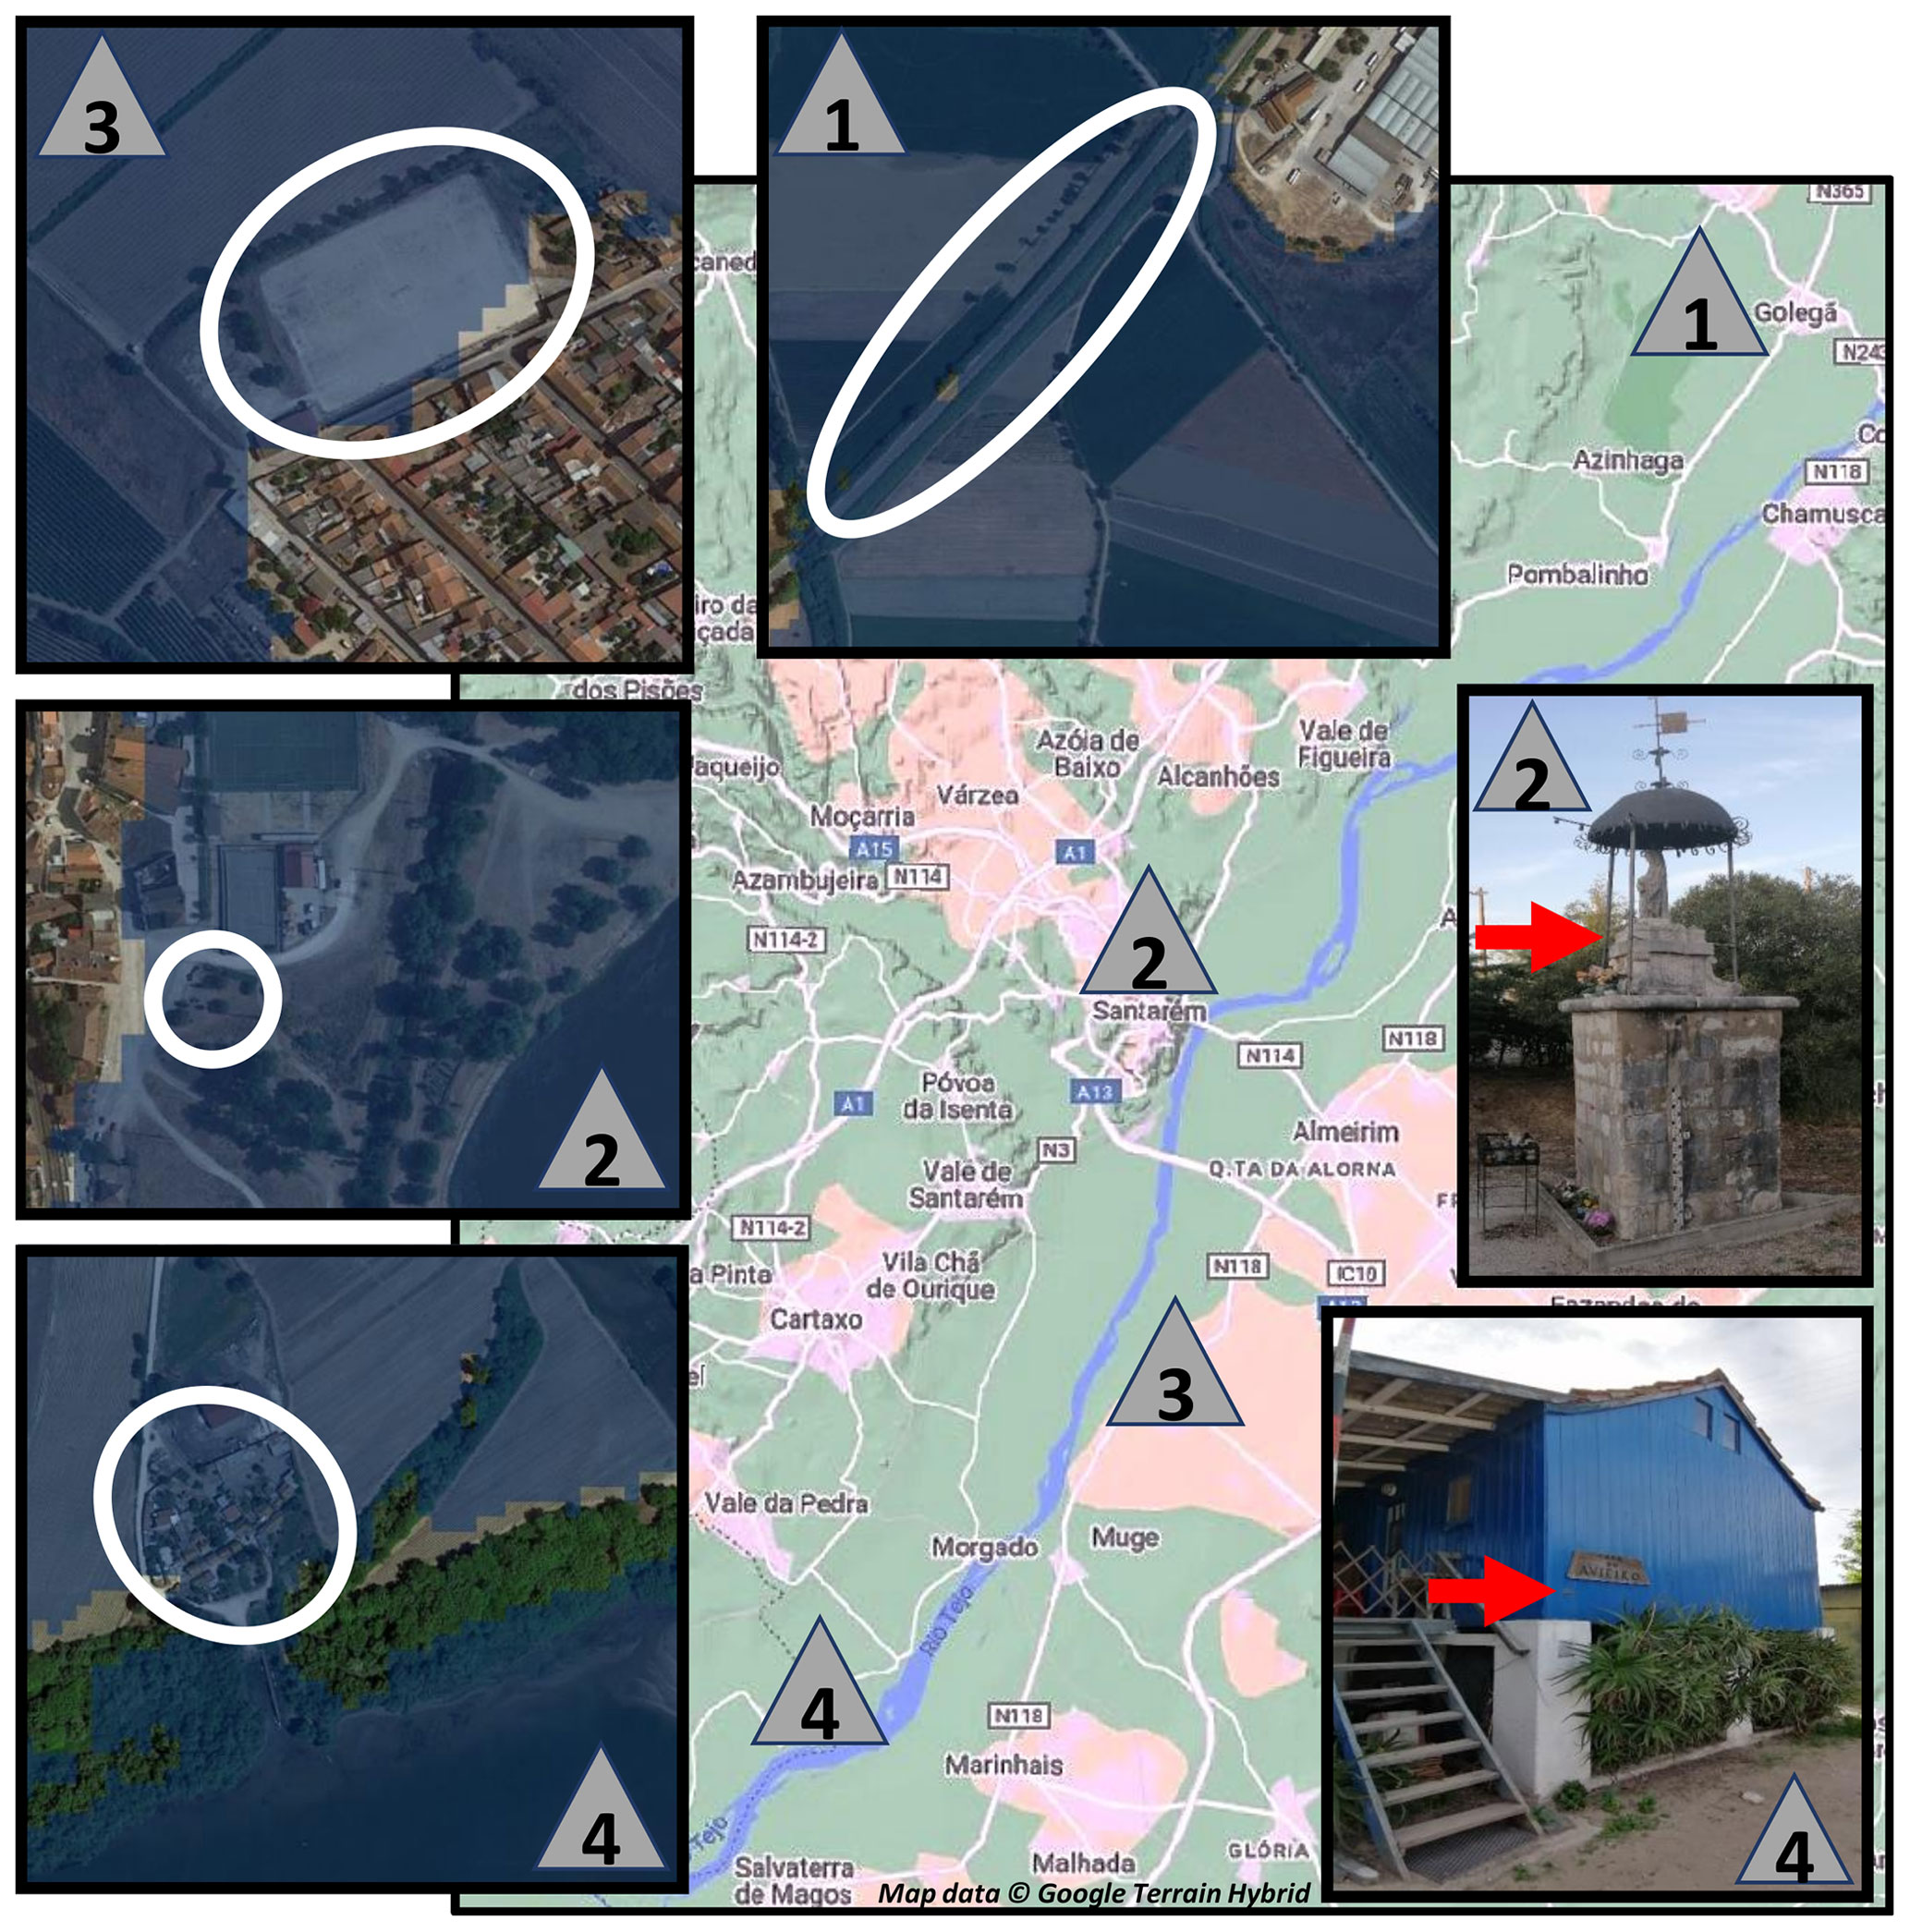
Figure 8Detailed flooded area obtained with hydraulic simulation (Simulation_Control_1979) for the (1) railroad of Golegã, (2) Santa Iria statue at Santarém, (3) football field at Benfica do Ribatejo and (4) town of Palhota. The red arrow indicates the level reached by the water. The photographs and measurements in panels (2) and (4) (right) were taken by the authors. The base map is from Google Terrain Hybrid. Aerial maps in panels (1)–(4) are from map data © Google Earth.
5.3 Mitigation of Tagus floods
5.3.1 General analysis of the effectiveness of the dam operating strategies proposed in relation to flood reduction
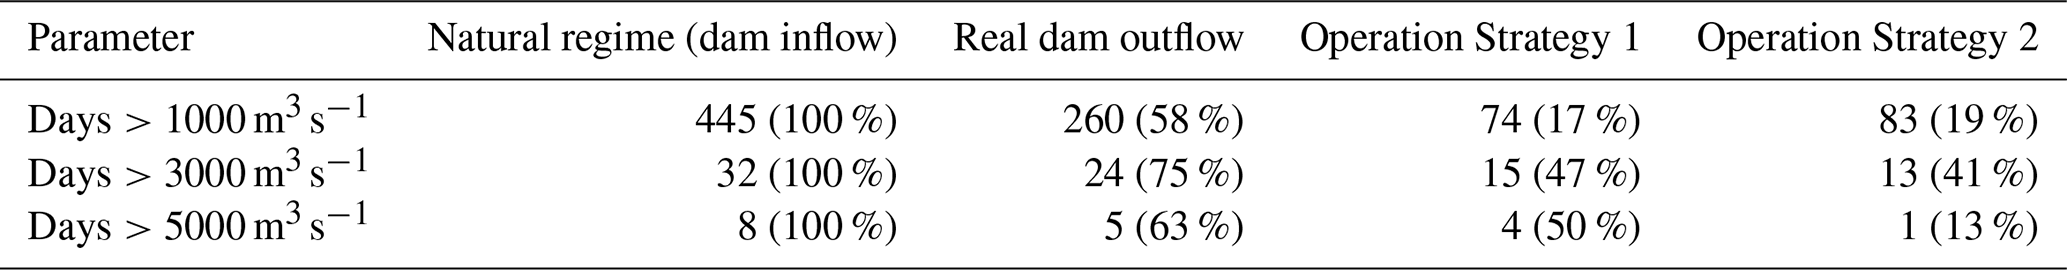
Firstly, a general analysis of the historical functioning of the Alcántara dam in relation to floods, together with the functioning when applying OS1, was carried out. For that, the number of days with outflows with a high probability of causing flooding downstream (>1000 m3 s−1) was evaluated considering the following: (i) the inflow, which represents an approximation of the natural regime of the Tagus River (from now on considered the natural regime); (ii) the real dam outflow, which corresponds to what really happened; and (iii) a controlled outflow provided by OS1.
The results of the three approaches, natural regime, real dam outflow and controlled outflow by the dam operating as proposed, are summarized in Table 1. Considering a natural regime, Tagus River flow at Alcántara higher than the security level considered was observed for 445 d (average of 9.1 d yr−1). The actual dam regulation over these years promoted an important reduction in these risk flows, with 42 % fewer cases and a total number of 260 (5.3 d yr−1). The reduction in risk flows achieved with the OS1 strategy is much higher, with a total number of days under flood conditions of 74 (1.5 d yr−1), i.e., a decrease of 83 % in the number of cases compared to the corresponding number for natural flow. In addition, OS1 provides an effective reduction of the most critical river flows, reducing by 53 % the likelihood of cases in which the daily flows exceed 3000 m3 s−1 and by 50 % those days with flows greater than 5000 m3 s−1. Thus, under OS1, the mean dam volume throughout the simulation is practically the same as in reality, but the number of floods decreases considerably.
Table 1Number of days under different critical flows at the Alcántara location considering the real inflow (natural regime), the real outflow and the dam outflow under OS1 and OS2. Percentages refer to the differences with respect to the worst scenario (natural regime), which is assigned a percentage of 100 %.
Having demonstrated the soundness of OS1 in decreasing the number of days under flood flow conditions, the question that remains is whether that approach is sufficient to prevent flooding in the most extreme cases. The inflow and the controlled outflow (following OS1) are represented in Fig. 9 for the five extreme cases under study. Although, the number of days under flood conditions is significantly reduced for the extreme events analyzed (7(0), 14(6), 27(10), 28(12), 27(0)), extreme flood conditions are not completely prevented. In the events with higher river flows that persist for several days, the most extreme peak flows are not smoothed, as observed in the cases of the events in 1978, 1979 and 1989. Therefore, an improvement is needed to also address these most extreme cases. In particular, considering the flood that occurred in 1979 a benchmark, it can be observed that with the application of OS1, the simulated outflow coincides with the natural regime (inflow) for the maximum peak flow, as well as for the following days (Fig. 9, third panel), indicating that the dam was full. When the dam operating strategy focused on extreme peak flows is applied (OS2), dam functioning can improve the efficiency to mitigate extreme peaks, as shown in Table 2, which provides the main characteristics of the controlled dam outflow for the extreme cases. It can be noticed that the main peak flow is reduced by about 30 % in the 1979 flood event. An important reduction also occurred in the other extreme cases equally not smoothed with OS1: the peak flow of the 1978 flood event is reduced by more than 25 %, and the peak of the 1989 extreme event is reduced by about 40 %. In fact, when the series across the entire period under study is analyzed, it can be observed that OS2 provides a greater reduction in the number of high-peak-flow cases (>3000 and >5000 m3 s−1; see Table 1). In return, the total number of days under flood conditions (>1000 m3 s−1) is slightly increased when OS2 is applied in relation to OS1 due to the fact that under OS2, flows above the flood threshold are allowed prior to extreme peaks in order to minimize them, as mentioned above. In any case, when applying OS2, the total number of days under flood conditions is also significantly reduced compared to natural regime and real dam outflow (see Tables 1 and 2).
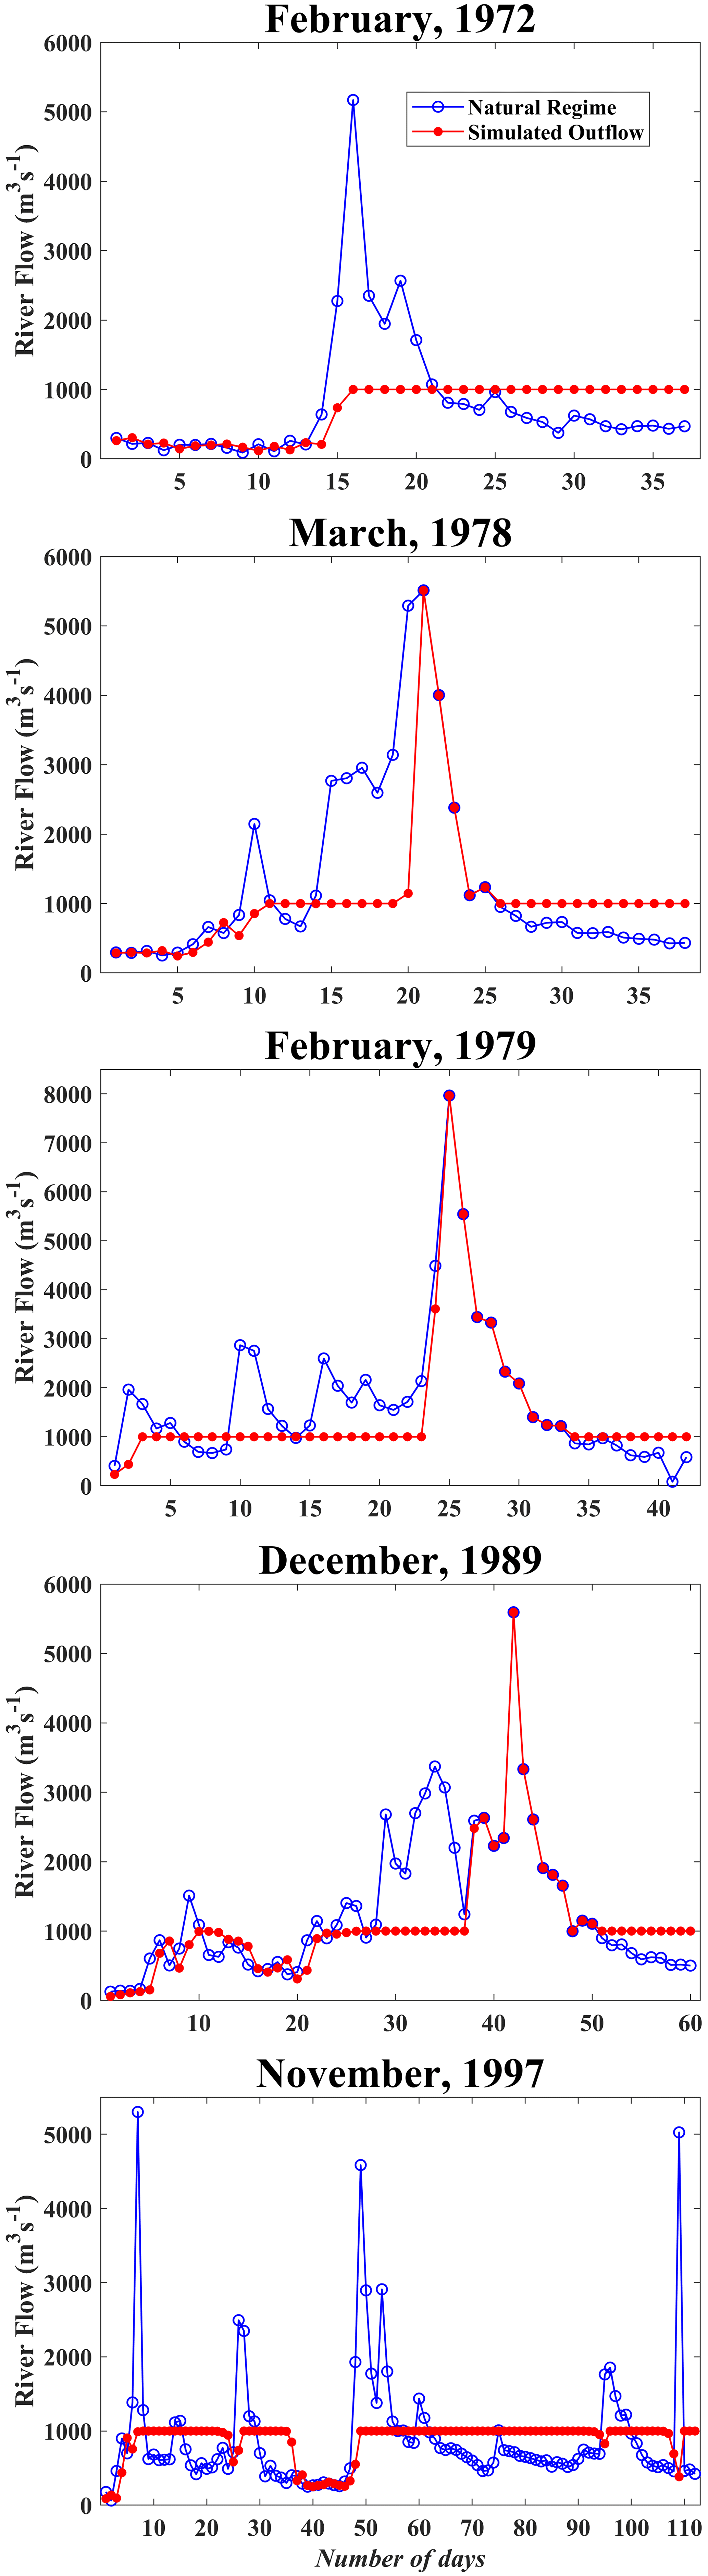
Figure 9Natural regime (blue line) and simulated outflow resulting for Operation Strategy 1 (red line) for the Alcántara dam in the most extreme cases. The date (month) refers to the occurrence of the highest peak flow. The initial date considered for each event is, from top to bottom, 19 January 1972, 11 February 1978, 18 January 1979, 15 November 1989 and 31 October 1997.
Table 2Hydrologic characteristics of most extreme flood events under different dam configurations: NR (natural regime – no dam), OS1 and OS2 (operation strategies 1 and 2 in Eqs. 4 and 5, respectively). Flood days refer to the number of days exceeding the flood threshold. Peak flow refers to the real maximum daily inflow in the case of the natural regime, and to the maximum daily outflow from the dam under the different operation strategies. Percentages are referred to the differences with respect to the worst scenario (natural regime), which is assigned a percentage of 100 %.
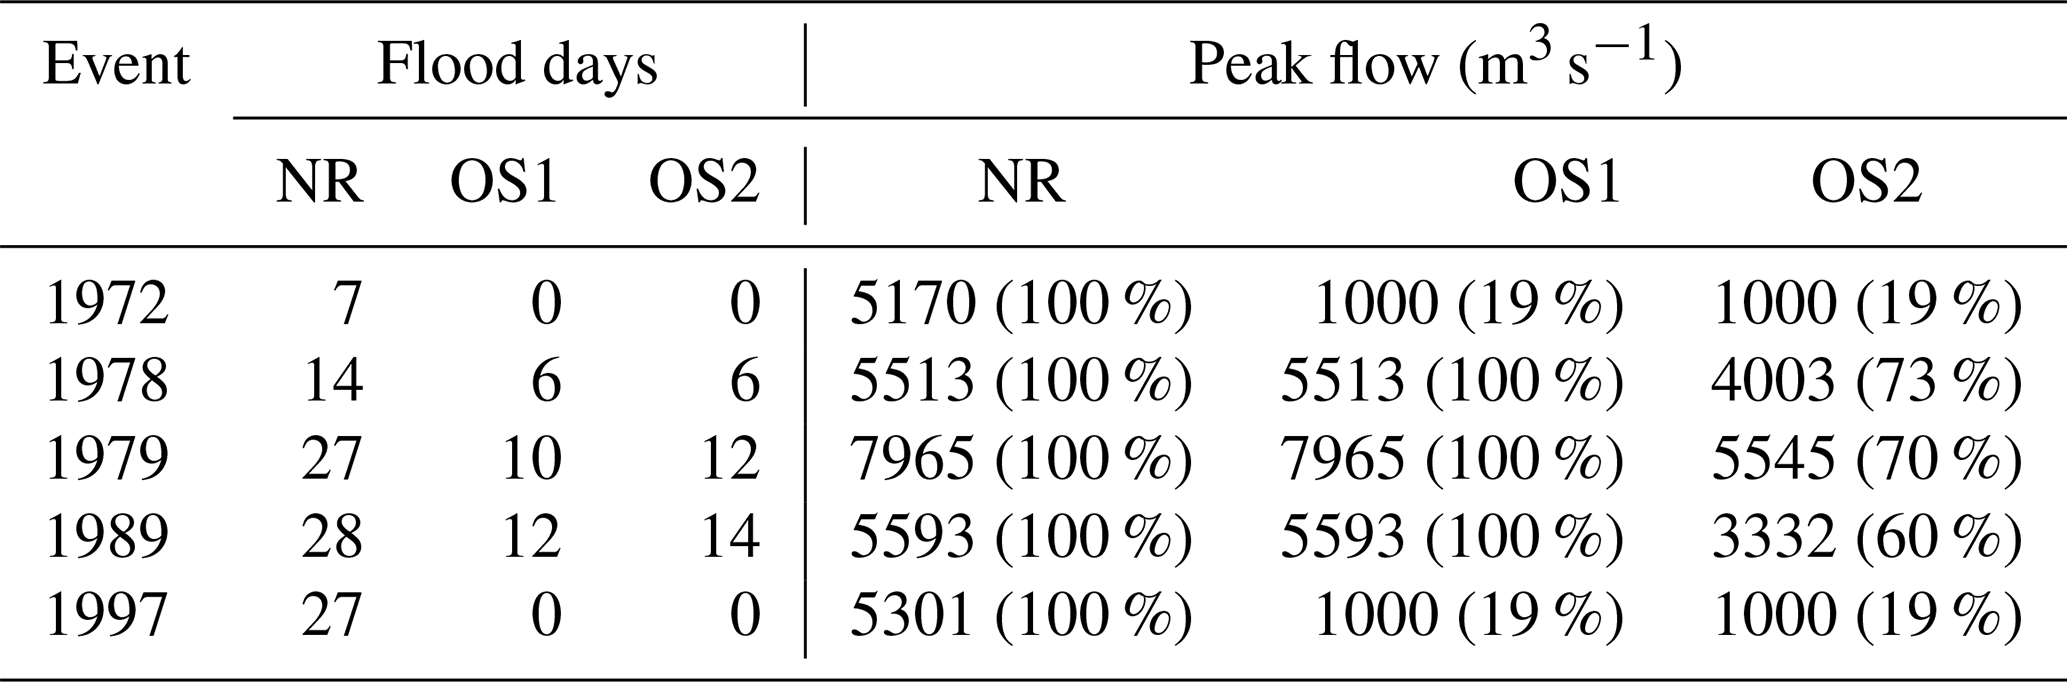
Table 3Average number of days (and the corresponding standard deviation) exceeding different critical flows at the Alcántara location, calculated taking into account all the perturbed river flow series (created by varying randomly in ±25 % the original dam inflow). Natural regimes and dam outflows obtained by applying OS1 and OS2 were evaluated.
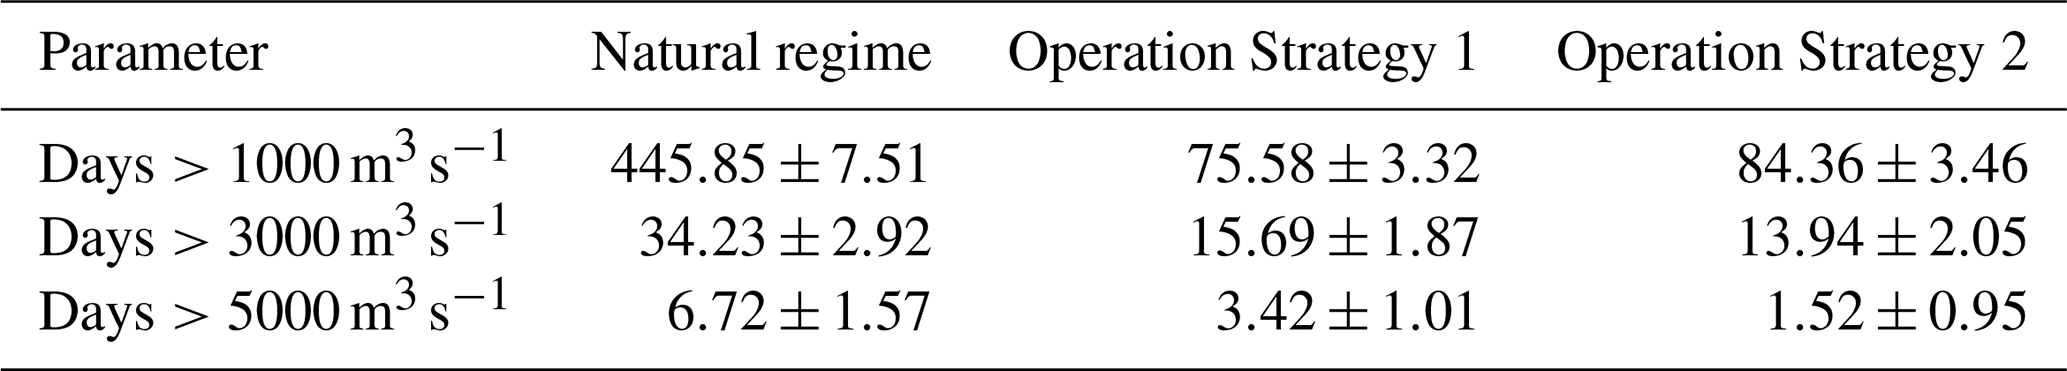
Having demonstrated the efficiency of the proposed dam operating strategies considering the actual conditions of river flow for the period within our scope, the series of river flow was perturbed through the addition of noise in order to analyze the applicability of the proposed strategies in other scenarios of river flow. For that, perturbed random series were generated, allowing a deviation of ±25 % from the original values of dam inflow; that is, each real daily value of river flow has been allowed a random variation of ±25 %. Following this procedure, as many perturbed series as the original number of data were generated (>17 000). Then, the average number of floods generated by the river flow of the perturbed series (hypothetical natural regime), as well as the respective floods resulting from applying the dam operating strategies proposed, was evaluated (Table 3). The efficiency of both proposed strategies was clearly maintained in terms of reducing the total number of floods. In fact, even considering the worst possible situation taking into account the associated deviation in each case, floods are significantly reduced. Moreover, the efficiency of OS2 to mitigate the most extreme floods was also maintained. The results obtained corroborate the robustness and the applicability of dam operating strategies proposed under different scenarios of river flow.
5.3.2 Hydraulic analysis of the effectiveness of the dam operating strategies in relation to flood mitigation
It is important to take into account that although the peaks are reduced applying OS2, the total multi-day outflow volume throughout the events is similar (within each event) for the dam operations considered. Therefore, it is crucial to assess what both approaches imply in terms of effective flooding reduction in the lower Tagus valley. This is especially relevant taking into account the flattened shape of the valley, which implies that a large area can be flooded, even with relatively low flows as is detected in Fig. 6. This issue can be addressed again taking advantage of the Iber+ hydraulic model. Therefore, three simulations (Simulation_Dam) were performed for each extreme event, that is, considering outflow at Alcántara corresponding to (i) the natural regime, (ii) OS1 and (iii) OS2. To keep the analysis at a manageable size, we restrict the full assessment to the flood event of 1979 considered a benchmark, where Fig. 10a shows the natural river flow and the controlled outflow of the dam obtained by applying the configuration focused on the extreme events (OS2). In addition to the reduction in maximum amplitude, the peak flow is delayed by 1 d, which can further decrease flood damage downstream. To evaluate the real reduction in flooding in the lower Tagus valley for the event of 1979 under the different strategies presented, the simulated maximum flood caused by the Alcántara outflow resulting from the natural regime and OS2 is shown in Fig. 10b and c, respectively. The most important fact is that the entire area presents an important reduction in water depth under the most effective dam operating strategy. This reduction is shown in more detail in Fig. 11, where the differences between both cases are highlighted, with a decrease that can surpass 1 m in some locations. In addition, although the reduction in flood extension is small compared to the total extension of the valley, it can be detected because water is also retracted to some extent in the surroundings of the villages (see zoomed-in areas in Fig. 11). Therefore, the application of OS2 could bring about important flood alleviation for the area within the scope of the study.
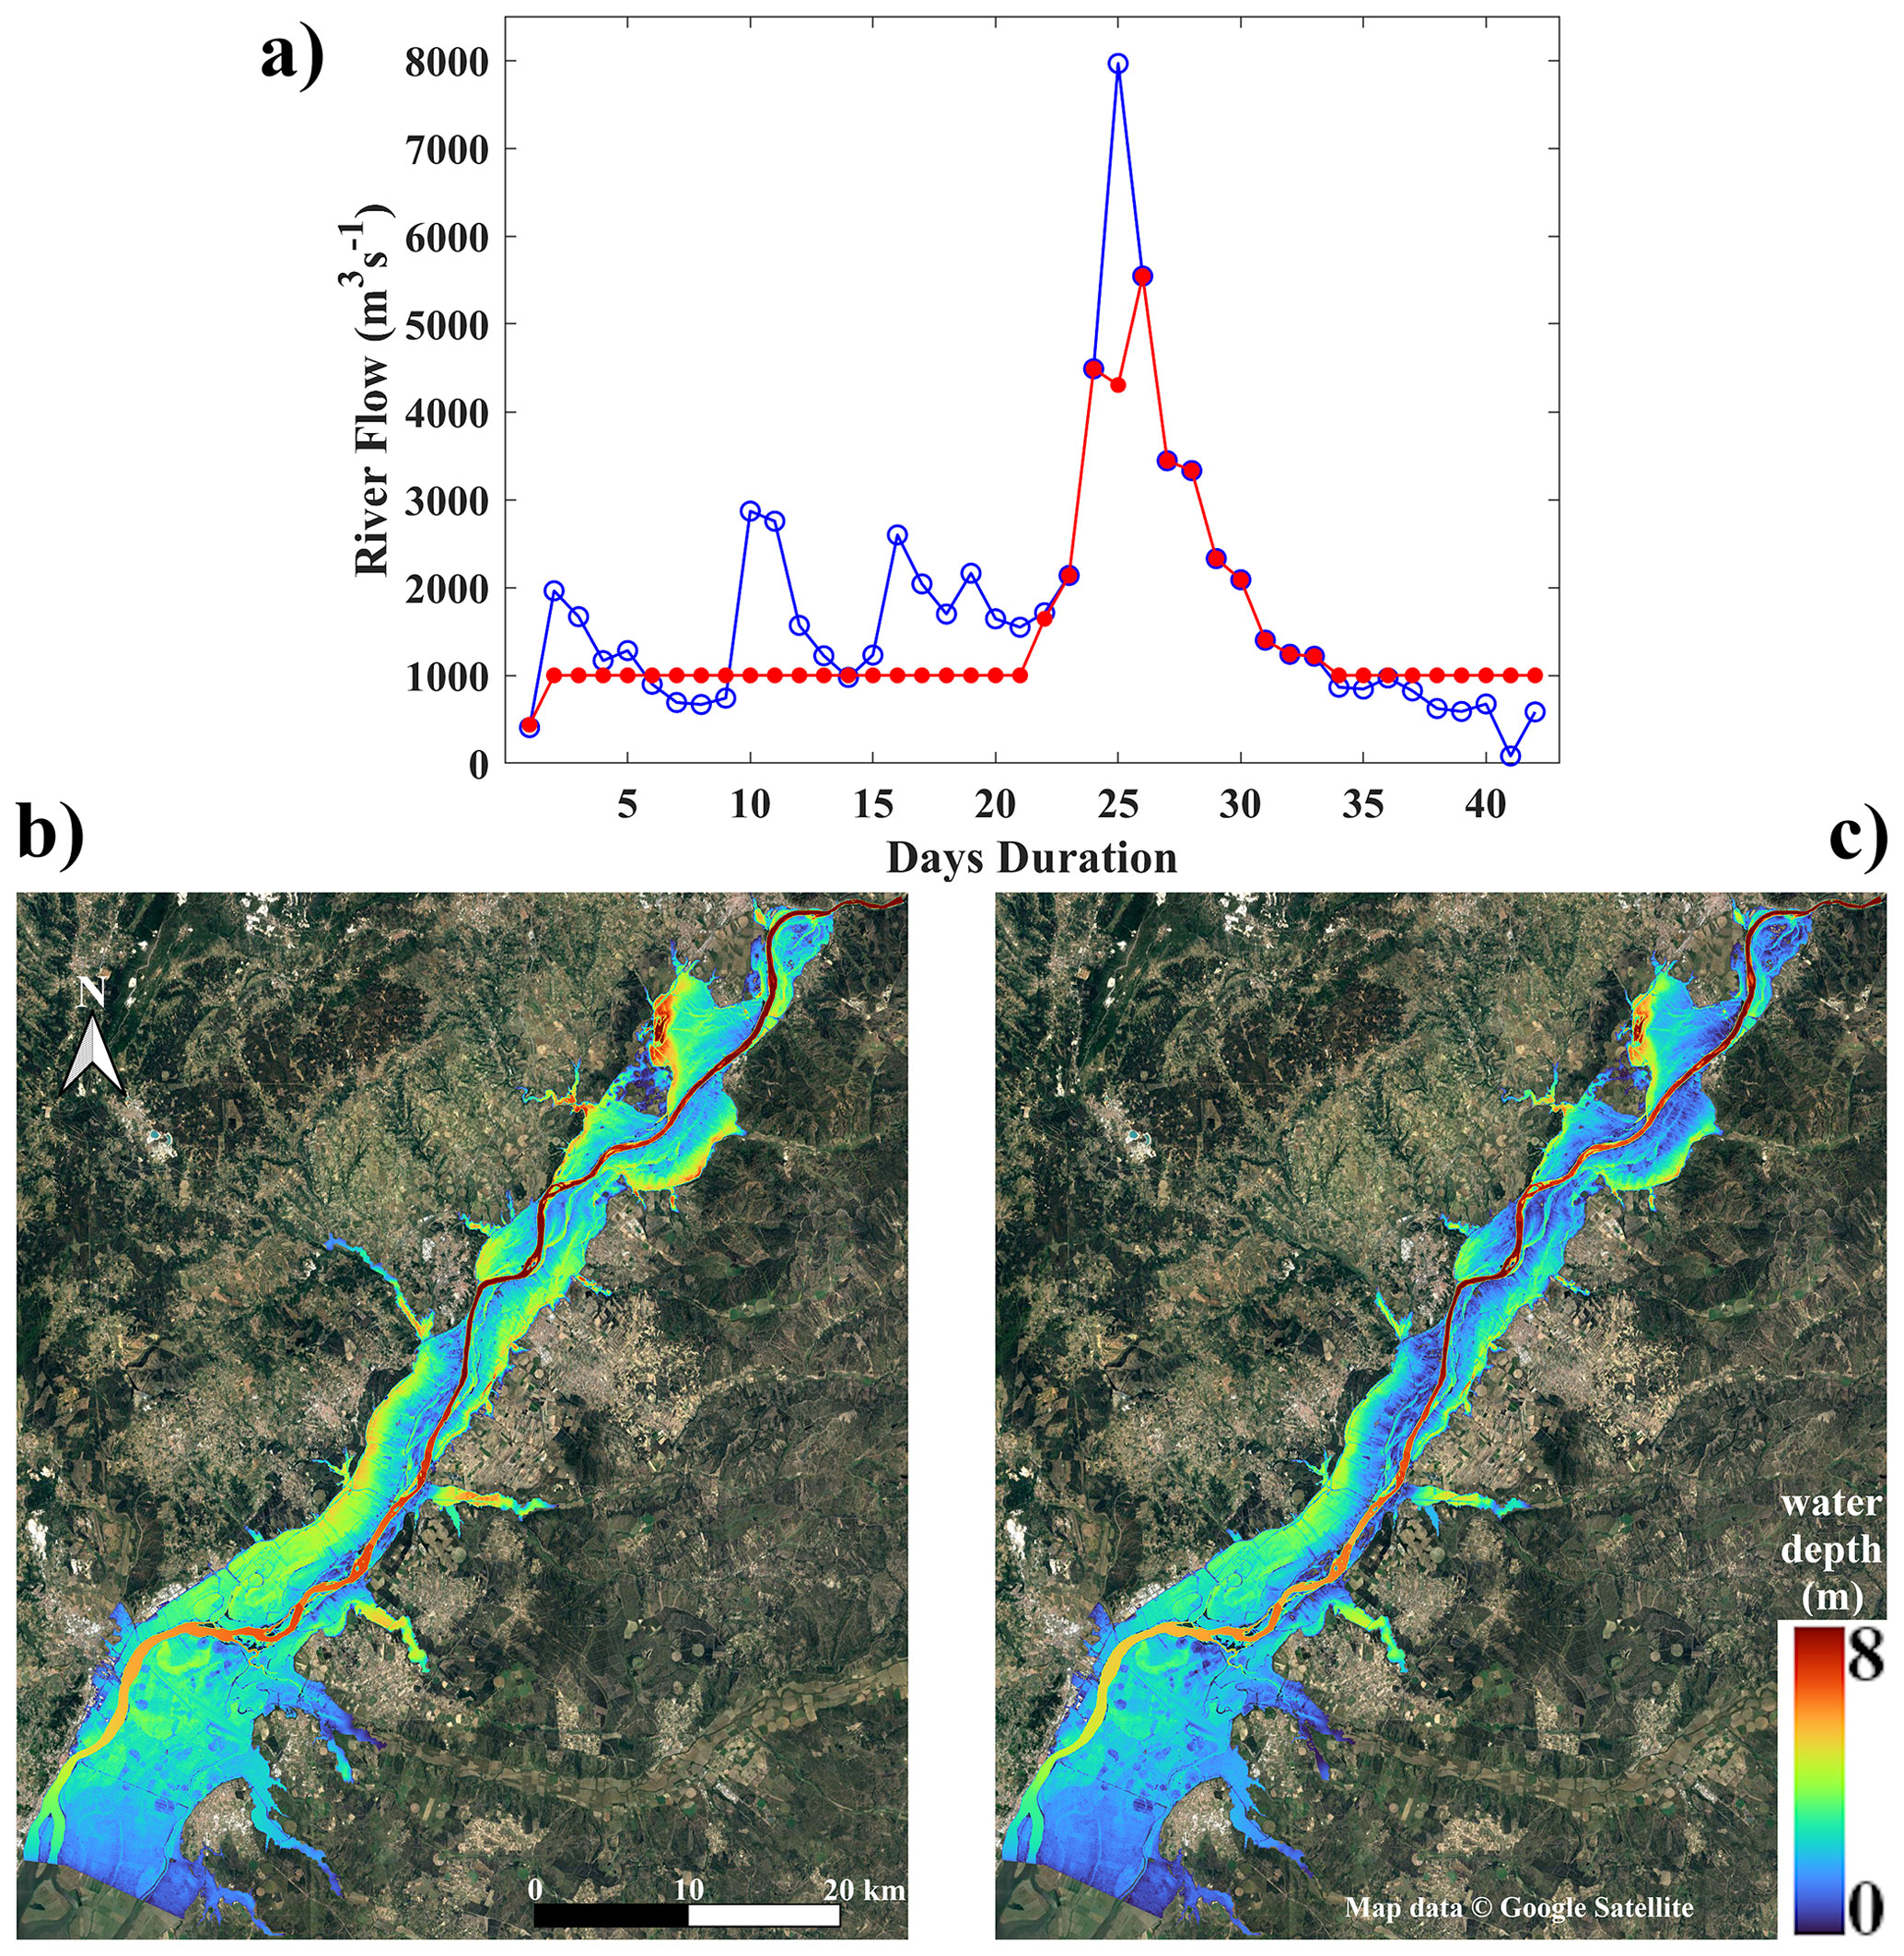
Figure 10(a) Natural regime (dam inflow) at Alcántara (blue line) and simulated Alcántara dam outflow under Operation Strategy 2 (red line), considering the flooding of 1979. The lower panels show the maximum water depth (m) obtained with Iber+ for the outflows corresponding to (b) the natural regime and (c) Operation Strategy 2. Map data © Google Earth.
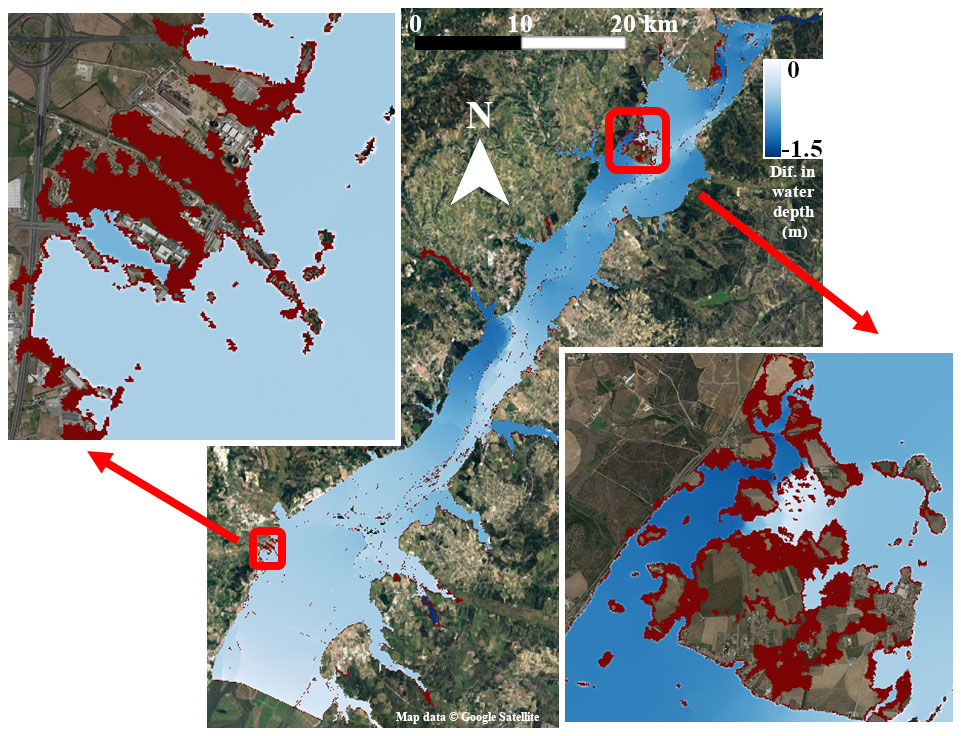
Figure 11Difference in maximum water depth (m) caused by the Alcántara outflows corresponding to the natural regime (NR) and Operation Strategy 2 (OS2 − NR), applied to the 1979 flood event. Red colors represent locations reached by water under the most extreme case (NR) and not flooded when OS2 is applied. The left zoomed-in area represents the surroundings of the town of Castanheira do Ribatejo, whereas the right zoomed-in area represents the zone delimited by the towns of Mato de Miranda, Azinhaga and Pombalinho in the surroundings of the Golegã location. Map data © Google Earth.
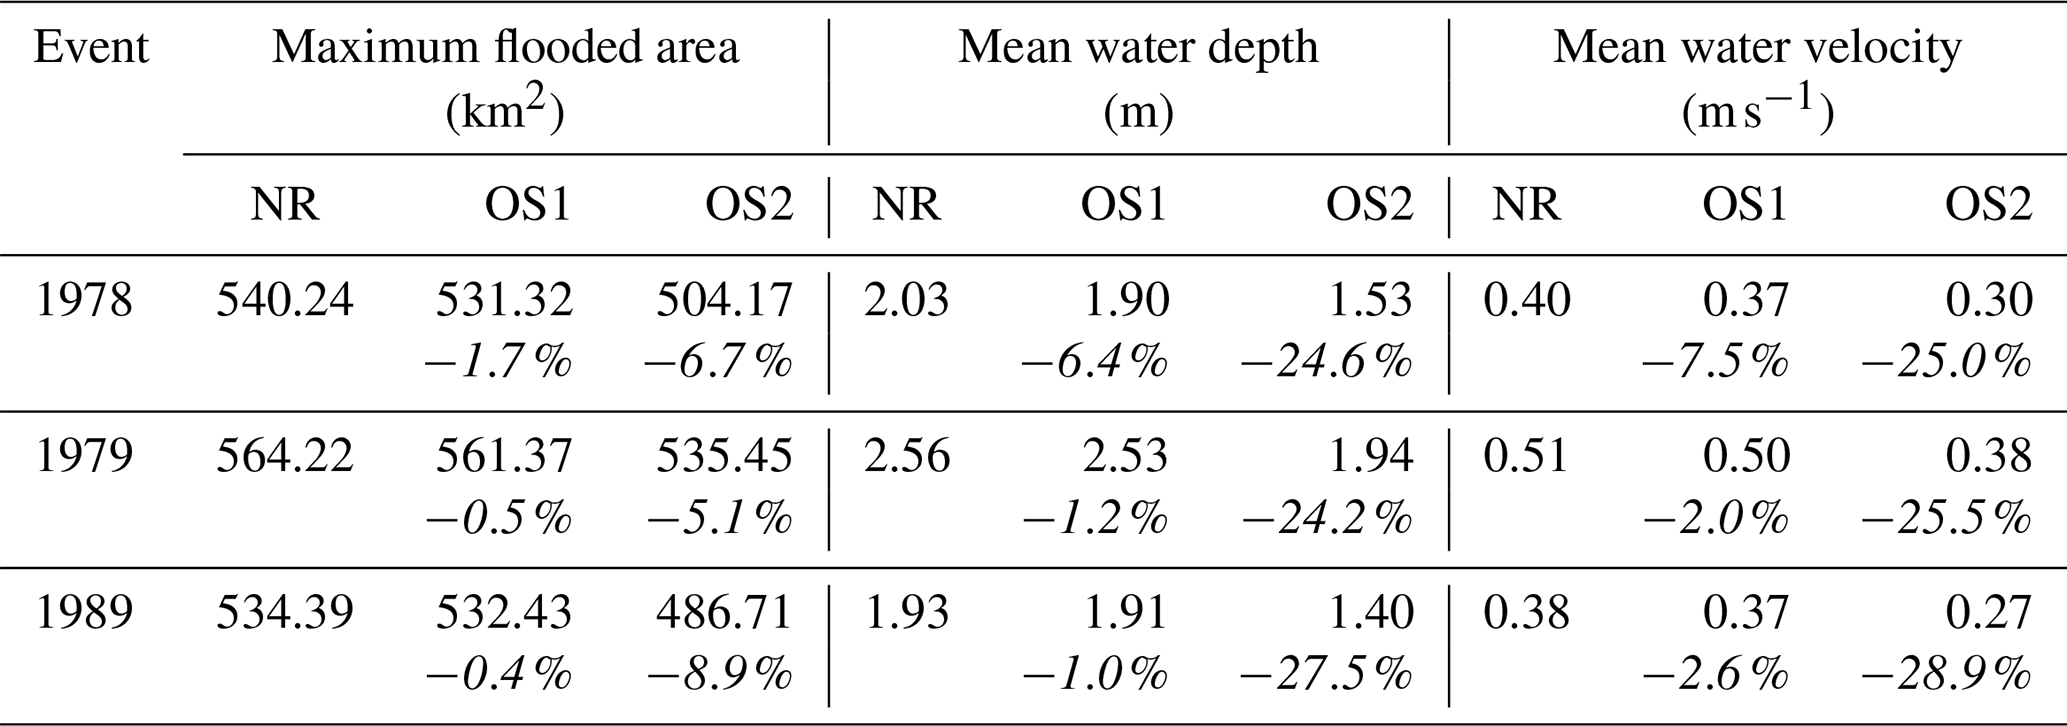
This flood mitigation analysis was also applied to all the other extreme events in order to provide information focused on effective mitigation measures and to understand their impact on flood reduction. For that, the floods caused by the different configurations, that is, the natural flow regime and OS1 and OS2, were analyzed and compared for the most critical events by means of the respective hydraulic simulations (Table 4). This allows us to extract key information for the area within the scope of the study. As mentioned above, the events that occurred in 1972 and 1997 can be completely avoided at the Alcántara location; therefore the analysis will be focused on the rest of the extreme events. According to hydraulic simulations, in these most extreme events it is not possible to prevent most of the valley from being flooded even with the dam regulation presented in OS2. This is mainly due to the flattened shape of the valley, which favors flooding even with lower discharges, as mentioned above. Specifically, a reduction of around 5 %–10 % in the total extension of the flood is achieved on average in the most extreme cases (from 564 to 535 km2 in the 1979 flood event). Once most of the valley is flooded, the main increase occurs in terms of water depth. In this sense, the mitigation of floods in the lower Tagus valley allowed by an efficient regulation of dams is especially effective in terms of water depth reduction (Table 4). On average, OS2 allows reducing water depths in flooded areas by more than 0.5 m, which gives a reduction of around 25 % in water depth. In the particular case of the 1979 flood, the average maximum water depth is reduced from 2.56 to 1.94 m. This contributes to a significant reduction in flood damage and the associated costs, which are proportional to the water depths (Huizinga et al., 2017), as mentioned above. Another important aspect that should be taken into account to assess flood damage is the maximum velocity reached by water (Cox et al., 2010). In this sense, the presented strategy also contributed to a reduction in this flood hazard metric, reducing the maximum velocity reached by the water in the flooded areas by around 25 %–30 % (Table 4). In particular, the average maximum velocity of the water in flooded areas is reduced from 0.51 to 0.38 m s−1 in the 1979 flood.
Table 4Hydraulic characteristics of the most extreme flood events in the lower Tagus valley considering the outflows provided by the different dam configurations considered (Simulation_Dam): NR (natural regime), OS1 (Operation Strategy 1) and OS2 (Operation Strategy 2). The percentage values represent the reduction obtained with respect to the situation under natural regime.
The results obtained corroborate the important mitigation of flood impacts that can be achieved in the lower Tagus basin taking advantage of the existing dam capacity.
This work aimed to present dam operating strategies that allow taking advantage of existing infrastructures in the Tagus River to effectively mitigate the floods that have occurred in its lower valley in recent decades and may occur again in the future. For this, dam operating strategies were developed and, in combination with the Iber+ hydraulic model, the effectiveness of the proposal in relation to flood mitigation was analyzed. To perform this analysis, the other important objective achieved was the validation of the hydraulic model for the lower Tagus valley by evaluating its ability to reproduce the 1979 flood.
Thus, firstly, the Iber+ model was validated for the area within the scope of the study. In this process, several DEMs were used to also determine the best one to macroscopically reproduce the floods in the lower Tagus valley. The Copernicus DEM shows the best accuracy. In fact, the Iber+ model coupled with the Copernicus DEM was able to provide an adequate macroscopic reproduction of the most important flood of the last 150 years in the Tagus valley, the 1979 flood, which demonstrates its capability to evaluate floods in the area under study and allows the hydrodynamic analysis of this event. This also provides information on robust and useful tools that could serve as a basis for future studies addressing other aspects related to flooding in the lower Tagus valley.
Once the Iber+ model was validated, the analysis was focused on developing dam operating strategies to help in flood mitigation. Specifically, the analysis was focused on the Alcántara dam, the most important on the Tagus River. In general terms, results indicate that the first proposed strategy (OS1) allows for a reduction in the number of days under flood conditions by more than 80 % with respect to the natural regime, and an important reduction is also obtained in relation to the historical dam operation. In addition, the mitigation of the most extreme flood events was achieved. Hydraulic simulations confirm that the proposed operating strategy focused on the mitigation of extreme events (OS2) is especially effective in reducing water depth and water velocity in the flooded areas (∼25 %–30 %), the most critical factors in terms of flood damage. In addition, a smaller reduction in the flood extension is also achieved (∼5 %–10 %). Therefore, hydraulic simulations corroborate the significant flood mitigation in the lower Tagus valley that can be achieved with more appropriate use of dam strategies, as proposed in this work. This demonstrates the effectiveness of the strategies proposed to address the future implications of climate change in relation to the more frequent and intense flood events expected in the future. Thus, the mitigation strategies OS1 and OS2 represent an example of a set of non-expensive strategies that will allow for the mitigation of floods, taking advantage of the existing infrastructures, and that can serve as an example for application to other basins.
In summary, this study can be viewed as a first step to improve our knowledge on extreme floods in the lower Tagus valley and to provide strategies to mitigate these events by taking advantage of the existing infrastructures, thus addressing one of the most important challenges that the scientific community will have to face in the coming decades as a consequence of climate change. Future improvements should be focused, on the one hand, on the development of similar strategies applied to other important dams throughout the Tagus basin, in both the Spanish and the Portuguese sections, providing a cascading interconnection between the different dams and the operation strategies developed, which will improve and make more effective the flood mitigation provided by these infrastructures. On the other hand, future improvements should also consider the integration of the dam operating strategies for real-time early warning systems. These strategies, in combination with the hydraulic models and good weather forecasts, will allow for evaluating in advance the likelihood of flood scenarios and applying the right measures that minimize the floods (Chang et al., 2010; Chou and Wu, 2015; Fakhruddin et al., 2015; Fraga et al., 2020). This will also allow us to improve and make more precise the dam strategies applied. Furthermore, although the model used showed sufficient capacity to simulate floods in the lower Tagus valley on a large scale, we acknowledge that improvements should be made in order to analyze in detail the flood impact in local areas such as villages or specific infrastructures. In particular, the development of high-resolution DEMs would be essential as this allows for more detailed definition of the terrain topography. In consequence, it would also be advisable to obtain more detailed information on other features such as river and flood plain roughness, along with a specific evaluation of the most precise model parameters for higher resolutions (flood cell size, Courant number, etc.). The inclusion of detailed local structures that can affect flood development would also be welcome. These improvements will contribute to improving the precision of the simulations, which is needed to address impacts at a local scale.
Freely available data and software were used for this work. Regarding the hydrodynamic model used, it should be noted that although the open-source code is only accessible to collaborators, an executable Iber+ version is freely available for download from its official website (https://www.iberaula.es/54/iber-model/downloads, Iber, 2023).
The supplement related to this article is available online at: https://doi.org/10.5194/nhess-24-609-2024-supplement.
DFN: conceptualization, methodology, formal analysis, investigation, writing (original draft). AMR: methodology, investigation, writing (review and editing). JGC: methodology, investigation, writing (review and editing). OGF: methodology, investigation, writing (review and editing). CC: methodology, investigation, writing (review and editing). MGG: conceptualization, methodology, writing (review and editing), supervision. RMT: conceptualization, methodology, writing (review and editing), supervision.
At least one of the (co-)authors is a member of the editorial board of Natural Hazards and Earth System Sciences. The peer-review process was guided by an independent editor, and the authors also have no other competing interests to declare.
Publisher's note: Copernicus Publications remains neutral with regard to jurisdictional claims made in the text, published maps, institutional affiliations, or any other geographical representation in this paper. While Copernicus Publications makes every effort to include appropriate place names, the final responsibility lies with the authors.
This article is part of the special issue “Advances in pluvial and fluvial flood forecasting and assessment and flood risk management”. It is a result of the EGU General Assembly 2022, Vienna, Austria, 23–27 May 2022.
The authors thank the Sistema Nacional de Informação de Recursos Hídricos (SNIRH), the Centro de Estudios y Experimentación de Obras Públicas (CEDEX), the developers of the Iberia01 database and the respective developers of the DEMs used for the information provided for this work. The authors thank Google for providing some of the aerial maps used in this work.
This research has been partially supported by Xunta de Galicia, Consellería de Cultura, Educación e Universidade, under project ED431C 2021/44 “Programa de Consolidación e Estructuración de Unidades de Investigación Competitivas”. This research has also been partially supported by the European Regional Development Fund under the Interreg POCTEP project RISC_PLUS (code: 0031_RISC_PLUS_6_E). This research has also been partially funded by the Portuguese Fundação para a Ciência e a Tecnologia (FCT) I.P./MCTES through national funds (PIDDAC) – UIDB/50019/2020 (https://doi.org/10.54499/UIDB/50019/2020), UIDP/50019/2020 (https://doi.org/10.54499/UIDP/50019/2020) and LA/P/0068/2020 (https://doi.org/10.54499/LA/P/0068/2020).
Diego Fernández-Nóvoa was supported by Xunta de Galicia through a post-doctoral grant (ED481B-2021-108). Alexandre M. Ramos was supported by the Helmholtz “Changing Earth – Sustaining our Future” program. Cristina Catita was supported by EEA Financial Mechanism 2014–2021 and the Portuguese Environment Agency through Pre-defined Project 2 National Roadmap for Adaptation XXI (PDP-2). Orlando García-Feal was funded by the Spanish Ministerio de Universidades and European Union – NextGenerationEU – through a Margarita Salas post-doctoral grant. Ricardo M. Trigo was supported by the Portuguese Fundação para a Ciência e a Tecnologia (FCT) I.P./MCTES, through project AMOTHEC – DRI/India/0098/2020 (https://doi.org/10.54499/DRI/India/0098/2020).
This paper was edited by Cristina Prieto and reviewed by Marvin Höge, Almudena Barona, and three anonymous referees.
Agência Portuguesa do Ambiente: Plano De Gestão De Região Hidrográfica. Parte 2 – Caracterização E Diagnóstico. Região Hidrográfica Do Tejo e Ribeiras do Oeste (RH5), Agência Portuguesa do Ambiente, Ministério do Ambiente e da Transição Energética, Lisbon, Portugal, https://apambiente.pt/sites/default/files/_Agua/DRH/ParticipacaoPublica/PGRH/2016-2021/3_Fase/PGRH_2_RH5A_Parte2.pdf (last access: July 2023), 2016.
Alfieri, L., Burek, P., Feyen, L., and Forzieri, G.: Global warming increases the frequency of river floods in Europe, Hydrol. Earth Syst. Sci., 19, 2247–2260, https://doi.org/10.5194/hess-19-2247-2015, 2015.
Alfieri, L., Bisselink, B., Dottori, F., Naumann, G., de Roo, A., Salamon, P., Wyser, K., and Feyen, L.: Global projections of river flood risk in a warmer world, Earths Future, 5, 171–182, https://doi.org/10.1002/2016EF000485, 2017.
Arnell, N. W. and Gosling, S. N.: The impacts of climate change on river flood risk at the global scale, Climatic Change, 134, 387–401, https://doi.org/10.1007/s10584-014-1084-5, 2016.
Becek, K., Koppe, W., and Kutoğlu, Ş. H.: Evaluation of vertical accuracy of the WorldDEM™ using the runway method, Remote Sens.-UK, 8, 934, https://doi.org/10.3390/rs8110934, 2016.
Benito, G., Machado, M. J., and Pérez González, A.: Climate change and flood sensivity in Spain, in: Global continental Changes: the context of palaeohydrology, edited by: Brarndson, J., Brown, A. G., and Gregory, K. L., Geological Society Special Publication no. 115, 85–98, Geological Society, London, https://doi.org/10.1144/GSL.SP.1996.115.01.08, 1996.
Benito, G., Díez-Herrero, A., and de Villalta, M.: Magnitude and frequency of flooding in the Tagus Basin (Central Spain) over the last millennium, Climatic Change, 58, 171–192, 2003.
Bermúdez, M., Farfán, J. F., Willems, P., and Cea, L.: Assessing the Effects of Climate Change on Compound Flooding in Coastal River Areas, Water Resour. Res., 57, e2020WR029321, https://doi.org/10.1029/2020WR029321, 2021.
Beven, K.: Rainfall-Runoff Modelling: The Primer, 2nd edn., Wiley-Blackwell, Chichester, UK, ISBN 978-1-119-95101-8, 2012.
Bladé, E., Cea, L., Corestein, G., Escolano, E., Puertas, J., Vázquez-Cendón, E., Dolz, J., and Coll, A.: Iber – River modelling simulation tool [Iber: herramienta de simulación numérica del flujo en ríos], Rev. Int. Metod. Numer., 30, 1–10, https://doi.org/10.1016/j.rimni.2012.07.004, 2014.
Bonasia, R. and Ceragene, M.: Hydraulic numerical simulations of La Sabana river floodplain, Mexico, as a tool for a flood terrain response analysis, Water, 13, 3516, https://doi.org/10.3390/w13243516, 2021.
Carrera-Hernandez, J. J.: Not all DEMs are equal: An evaluation of six globally available 30 m resolution DEMs with geodetic benchmarks and LiDAR in Mexico, Remote Sens. Environ., 261, 112474, https://doi.org/10.1016/j.rse.2021.112474, 2021.
Chang, L. C., Chang, F. J., and Hsu, H. C.: Real-time reservoir operation for flood control using artificial intelligent techniques, Int. J. Nonlin. Sci. Num., 11, 887–902, https://doi.org/10.1515/IJNSNS.2010.11.11.887, 2010.
Chou, F. N. F. and Wu, C. W.: Stage-wise optimizing operating rules for flood control in a multi-purpose reservoir, J. Hydrol., 521, 245–260, https://doi.org/10.1016/j.jhydrol.2014.11.073, 2015.
CLC: European Union, Copernicus Land Monitoring Service 2000, European Environment Agency (EEA), https://land.copernicus.eu/ (last access: November 2023), 2000.
Courant, R., Friedrichs, K., and Lewy, H.: On the partial difference equations of mathematical physics, IBM J. Res. Dev., 11, 215–234, https://doi.org/10.1147/rd.112.0215, 1967.
Courty, L. G., Soriano-Monzalvo, J. C., and Pedrozo-Acuña, A.: Evaluation of open-access global digital elevation models (AW3D30, SRTM, and ASTER) for flood modelling purposes, J. Flood Risk Manag., 12, e12550, https://doi.org/10.1111/jfr3.12550, 2019.
Cox, R. J., Shand, T. D., and Blacka, M. J.: Australian Rainfall and Runoff revision project 10: appropriate safety criteria for people, Water Research Laboratory, P10/S1/006, ISBN 978-085825-9454, 2010.
Dankers, R. and Feyen, L.: Climate change impact on flood hazard in Europe: An assessment based on high-resolution climate simulations, J. Geophys. Res.-Atmos., 113, D19105, https://doi.org/10.1029/2007JD009719, 2008.
Diakakis, M.: Have flood mortality qualitative characteristics changed during the last decades? The case study of Greece, Environ. Hazards-UK, 15, 148–159, https://doi.org/10.1080/17477891.2016.1147412, 2016.
Escartín, C. M.: The Agreement between Spain and Portugal for the Sustainable Development of the Shared River Basins, in: International Conference of Basin Organizations, 4–6 November 2002, Madrid, Spain, 2022.
Fakhruddin, S. H. M., Kawasaki, A., and Babel, M. S.: Community responses to flood early warning system: Case study in Kaijuri Union, Bangladesh, Int. J. Disast. Risk Re., 14, 323–331, https://doi.org/10.1016/j.ijdrr.2015.08.004, 2015.
Fernández-Nóvoa, D., deCastro, M., Des, M., Costoya, X., Mendes, R., and Gómez-Gesteira, M.: Characterization of Iberian turbid plumes by means of synoptic patterns obtained through MODIS imagery, J. Sea Res., 126, 12–25, https://doi.org/10.1016/j.seares.2017.06.013, 2017.
Fernández-Nóvoa, D., García-Feal, O., González-Cao, J., de Gonzalo, C., Rodríguez-Suárez, J. A., Ruiz del Portal, C., and Gómez Gesteira, M.: MIDAS: A New Integrated Flood Early Warning System for the Miño River, Water, 12, 2319, https://doi.org/10.3390/w12092319, 2020.
Fraga, I., Cea, L., and Puertas, J.: MERLIN: a flood hazard forecasting system for coastal river reaches, Nat. Hazards, 100, 1171–1193, https://doi.org/10.3390/w12092319, 2020.
García-Feal, O., González-Cao, J., Gomez-Gesteira, M., Cea, L., Domínguez, J. M., and Formella, A.: An accelerated tool for flood modelling based on Iber, Water, 10, 1459, https://doi.org/10.3390/w10101459, 2018.
Garrote, J.: Free Global DEMs and Flood Modelling – A Comparison Analysis for the January 2015 Flooding Event in Mocuba City (Mozambique), Water, 14, 176, https://doi.org/10.3390/w14020176, 2022.
González-Cao, J., García-Feal, O., Fernández-Nóvoa, D., Domínguez-Alonso, J. M., and Gómez-Gesteira, M.: Towards an automatic early warning system of flood hazards based on precipitation forecast: the case of the Miño River (NW Spain), Nat. Hazards Earth Syst. Sci., 19, 2583–2595, https://doi.org/10.5194/nhess-19-2583-2019, 2019.
González-Cao, J., Fernández-Nóvoa, D., García-Feal, O., Figueira, J. R., Vaquero, J. M., Trigo, R. M., and Gómez-Gesteira, M.: Numerical reconstruction of historical extreme floods: The Guadiana event of 1876, J. Hydrol., 599, 126292, https://doi.org/10.1016/j.jhydrol.2021.126292, 2021.
González-Cao, J., Fernández-Nóvoa, D., García-Feal, O., Figueira, J. R., Vaquero, J. M., Trigo, R. M., and Gómez-Gesteira, M.: The Rivillas flood of 5–6 November 1997 (Badajoz, Spain) revisited: An approach based on Iber+ modelling, J. Hydrol., 610, 127883, https://doi.org/10.1016/j.jhydrol.2022.127883, 2022.
Guth, P. L. and Geoffroy, T. M.: LiDAR point cloud and ICESat-2 evaluation of 1 s global digital elevation models: Copernicus wins, T. GIS, 25, 2245–2261, https://doi.org/10.1111/tgis.12825, 2021.
Hardesty, S., Shen, X., Nikolopoulos, E., and Anagnostou, E.: A numerical framework for evaluating flood inundation hazard under different dam operation scenarios – A case study in Naugatuck river, Water, 10, 1798, https://doi.org/10.3390/w10121798, 2018.
Hasebe, M. and Nagayama, Y.: Reservoir operation using the neural network and fuzzy systems for dam control and operation support, Adv. Eng. Softw., 33, 245–260, https://doi.org/10.1016/S0965-9978(02)00015-7, 2002.
Herrera, S., Cardoso, R. M., Soares, P. M. M., Espírio-Santo, F., Viterbo, P., and Gutiérrez, J. M.: Iberia01: Daily gridded (0.1∘ resolution) dataset of precipitation and temperatures over the Iberian Peninsula, DIGITAL.CSIC, https://doi.org/10.20350/digitalCSIC/8641, 2019.
Huizinga, J., De Moel, H., and Szewczyk, W.: Global flood depth-damage functions: Methodology and the database with guidelines, Joint Research Centre, JRC105688, (Seville site), https://doi.org/10.2760/16510, 2017.
Iber: General information, https://www.iberaula.es/54/iber-model/downloads (last access: November 2023), 2023.
IPCC: Managing the Risks of Extreme Events and Disasters to Advance Climate Change Adaptation. A Special Report of Working Groups I and II of the Intergovernmental Panel on Climate Change, edited by: Field, C. B., Barros, V., Stocker, T. F., Qin, D., Dokken, D. J., Ebi, K. L., Mastrandrea, M. D., Mach, K. J., Plattner, G.-K., Allen, S. K., Tignor, M., and Midgley, P. M., Cambridge University Press, Cambridge, UK, and New York, NY, USA, 582 pp., ISBN 978-1-107-02506-6, 2012.
IPCC: Climate Change 2021: The Physical Science Basis. Contribution of Working Group I to the Sixth Assessment Report of the Intergovernmental Panel on Climate Change, edited by: Masson-Delmotte, V., Zhai, P., Pirani, A., Connors, S. L., Péan, C., Berger, S., Caud, N., Chen, Y., Goldfarb, L., Gomis, M. I., Huang, M., Leitzell, K., Lonnoy, E., Matthews, J. B. R., Maycock, T. K., Waterfield, T., Yelekçi, O., Yu, R., and Zhou, B., Cambridge University Press, Cambridge, UK and New York, NY, USA, https://doi.org/10.1017/9781009157896, 2021.
Jaafar, H. H., Ahmad, F. A., and El Beyrouthy, M.: GCN250, new global gridded curve numbers for hydrologic modeling and design, Scientific Data, 6, 1–9, https://doi.org/10.1038/s41597-019-0155-x, 2019.
Jongman, B.: Effective adaptation to rising flood risk, Nat. Commun., 9, 1–3, https://doi.org/10.1038/s41467-018-04396-1, 2018.
Karlsson, J. M. and Arnberg, W.: Quality analysis of SRTM and HYDRO1K: a case study of flood inundation in Mozambique, Int. J. Remote Sens., 32, 267–285, https://doi.org/10.1080/01431160903464112, 2011.
Lee, S. Y., Hamlet, A. F., Fitzgerald, C. J., and Burges, S. J.: Optimized flood control in the Columbia River Basin for a global warming scenario, J. Water Res. Plan. Man., 135, 440–450, 2009.
Lei, X., Zhang, J., Wang, H., Wang, M., Khu, S. T., Li, Z., and Tan, Q.: Deriving mixed reservoir operating rules for flood control based on weighted non-dominated sorting genetic algorithm II, J. Hydrol., 564, 967–983, https://doi.org/10.1016/j.jhydrol.2018.07.075, 2018.
Lopes, C. L., Sousa, M. C., and Ribeiro, A.: Evaluation of future estuarine floods in a sea level rise context, Sci. Rep.-UK, 12, 8083, https://doi.org/10.1038/s41598-022-12122-7, 2022.
Lorenzo, M. N. and Alvarez, I.: Climate change patterns in precipitation over Spain using CORDEX projections for 2021–2050, Sci. Total Environ., 723, 138024, https://doi.org/10.1016/j.scitotenv.2020.138024, 2020.
Loureiro, J. M.: Rio Tejo. As Grandes Cheigas, 1800–2007, Tágides, ISBN 978-989-96162-0-2, 2007.
Mockus, V.: National engineering handbook, US Soil Conservation Service, Washington, DC, USA, 4, https://www.irrigationtoolbox.com/NEH/Part630Hydrology/neh630-ch21.pdf (last access: July 2023), 1964.
Modarres, R., Sarhadi, A., and Burn, D. H.: Changes of extreme drought and flood events in Iran, Global Planet. Change, 144, 67–81, https://doi.org/10.1016/j.gloplacha.2016.07.008, 2016.
Mukherjee, S., Joshi, P. K., Mukherjee, S., Ghosh, A., Garg, R. D., and Mukhopadhyay, A.: Evaluation of vertical accuracy of open source Digital Elevation Model (DEM), Int. J. Appl. Earth Obs., 21, 205–217, https://doi.org/10.1016/j.jag.2012.09.004, 2013.
Muñoz, D. F., Abbaszadeh, P., Moftakhari, H., and Moradkhani, H.: Accounting for uncertainties in compound flood hazard assessment: The value of data assimilation, Coast. Eng., 171, 104057, https://doi.org/10.1016/j.coastaleng.2021.104057, 2022.
Patel, D. P., Ramirez, J. A., Srivastava, P. K., Bray, M., and Han, D.: Assessment of flood inundation mapping of Surat city by coupled 1D/2D hydrodynamic modeling: a case application of the new HEC-RAS 5, Nat. Hazards, 89, 93–130, https://doi.org/10.1007/s11069-017-2956-6, 2017.
Pathan, A. I., Agnihotri, P. G., and Patel, D.: Integrated approach of AHP and TOPSIS (MCDM) techniques with GIS for dam site suitability mapping: a case study of Navsari City, Gujarat, India, Environ. Earth Sci., 81, 443, https://doi.org/10.1007/s12665-022-10568-6, 2022.
Peixoto, J. P. and Oort, A. H.: Physics of Climate, American Institute of Physics, New York, NY, 412–433, https://doi.org/10.1063/1.2809772, 1992.
Pereira, S., Ramos, A. M., Zêzere, J. L., Trigo, R. M., and Vaquero, J. M.: Spatial impact and triggering conditions of the exceptional hydro-geomorphological event of December 1909 in Iberia, Nat. Hazards Earth Syst. Sci., 16, 371–390, https://doi.org/10.5194/nhess-16-371-2016, 2016.
Petrow, T. and Merz, B.: Trends in flood magnitude, frequency and seasonality in Germany in the period 1951–2002, J. Hydrol., 371, 129–141, https://doi.org/10.1016/j.jhydrol.2009.03.024, 2009.
Prieto, C., Patel, D., and Han, D.: Preface: Advances in flood risk assessment and management, Nat. Hazards Earth Syst. Sci., 20, 1045–1048, https://doi.org/10.5194/nhess-20-1045-2020, 2020.
Ramos, A. M., Trigo, R. M., and Liberato, M. L.: A ranking of high-resolution daily precipitation extreme events for the Iberian Peninsula, Atmos. Sci. Lett., 15, 328–334, https://doi.org/10.1002/asl2.507, 2014.
Ramos, A. M., Trigo, R. M., Liberato, M. L. R., and Tome, R.: Daily precipitation extreme events in the Iberian Peninsula and its association with Atmospheric Rivers, J. Hydrometeorol., 16, 579–597, https://doi.org/10.1175/JHM-D-14-0103.1, 2015.
Ramos, A. M., Trigo, R. M., and Liberato, M. L.: Ranking of multi-day extreme precipitation events over the Iberian Peninsula, Int. J. Climatol., 37, 607–620, https://doi.org/10.1002/joc.4726, 2017.
Ramos, A. M., Sousa, P. M., Dutra, E., and Trigo, R. M.: Predictive skill for atmospheric rivers in the western Iberian Peninsula, Nat. Hazards Earth Syst. Sci., 20, 877–888, https://doi.org/10.5194/nhess-20-877-2020, 2020.
Ramos, C. and Reis, E.: As cheias no Sul de Portugal em diferentes tipos de bacias hidrográficas, Finisterra, 36, 61–82, 2001.
Rebelo, L., Ramos, A. M., Pereira, S., and Trigo, R. M.: Meteorological Driving Mechanisms and Human Impacts of the February 1979 Extreme Hydro-Geomorphological Event in Western Iberia, Water, 10, 454, https://doi.org/10.3390/w10040454, 2018.
Ridolfi, E., Di Francesco, S., Pandolfo, C., Berni, N., Biscarini, C., and Manciola, P.: Coping with extreme events: Effect of different reservoir operation strategies on flood inundation maps, Water, 11, 982, https://doi.org/10.3390/w11050982, 2019.
Rocha, C., Antunes, C., and Catita, C.: Coastal Vulnerability Assessment Due to Sea Level Rise: The Case Study of the Atlantic Coast of Mainland Portugal, Water, 12, 360, https://doi.org/10.3390/w12020360, 2020.
Salgueiro, A. R., Machado, M. J., Barriendos, M., García Perira, H., and Benito, G.: Flood magnitudes in the Tagus River (Iberian Peninsula) and its stochastic relationship with daily North Atlantic Oscillation since mid-19th Century, J. Hydrol., 502, 191–201, https://doi.org/10.1016/j.jhydrol.2013.08.008, 2013.
Santillán, D., Cueto-Felqueroso, L., Sordo-Ward, A., and Garrote, L.: Influence of Erodible Beds on Shallow Water Hydrodynamics during Flood Events, Water, 12, 3340, https://doi.org/10.3390/w12123340, 2020.
Santos, M., Fragoso, M., and Santos, J. A.: Damaging flood severity assessment in Northern Portugal over more than 150 years (1865–2016), Nat. Hazards, 91, 983–1002, https://doi.org/10.1007/s11069-017-3166-y, 2018.
Shah, Z., Saraswat, A., Samal, D. R., and Patel, D.: A single interface for rainfall-runoff simulation and flood assessment-a case of new capability of HEC-RAS for flood assessment and management, Arab. J. Geosci., 15, 1526, https://doi.org/10.1007/s12517-022-10721-2, 2022.
Shrestha, B. B. and Kawasaki, A.: Quantitative assessment of flood risk with evaluation of the effectiveness of dam operation for flood control: A case of the Bago River Basin of Myanmar, Int. J. Disast. Risk Re., 50, 101707, https://doi.org/10.1016/j.ijdrr.2020.101707, 2020.
Szabó, G., Singh, S. K., and Szabó, S.: Slope angle and aspect as influencing factors on the accuracy of the SRTM and the ASTER GDEM databases, Phys. Chem. Earth Pt. A/B/C, 83, 137–145, https://doi.org/10.1016/j.pce.2015.06.003, 2015.
Taylor, K. E.: Summarizing multiple aspects of model performance in a single diagram, J. Geophys. Res.-Atmos., 106, 7183–7192, https://doi.org/10.1029/2000JD900719, 2001.
Thompson, J. A., Bell, J. C., and Butler, C. A.: Digital elevation model resolution: effects on terrain attribute calculation and quantitative soil-landscape modeling, Geoderma, 100, 67–89, https://doi.org/10.1016/S0016-7061(00)00081-1, 2001.
Trigo, I. F.: Climatology and interannual variability of storm-tracks in the Euro-Atlantic sector: a comparison between ERA-40 and NCEP/NCAR reanalyses, Clim. Dynam., 26, 127–143, https://doi.org/10.1007/s00382-005-0065-9, 2006.
Trigo, R. M. and DaCamara, C. C.: Circulation weather types and their influence on the precipitation regime in Portugal, Int. J. Climatol., 20, 1559–1581, https://doi.org/10.1002/1097-0088(20001115)20:13<1559::AID-JOC555>3.0.CO;2-5, 2000.
Trigo, R. M., Varino, F., Ramos, A. M., Valente, M. A., Zêzere, J. L., Vaquero, J. M., Gouveia, C. M., and Russo, A.: The record precipitation and flood event in Iberia in December 1876: description and synoptic analysis, Front. Earth Sci., 2, 3, https://doi.org/10.3389/feart.2014.00003, 2014.
Tsakiris, G.: Flood risk assessment: concepts, modelling, applications, Nat. Hazards Earth Syst. Sci., 14, 1361–1369, https://doi.org/10.5194/nhess-14-1361-2014, 2014.
Valeriano, O. C. S., Koike, T., Yang, K., and Yang, D.: Optimal dam operation during flood season using a distributed hydrological model and a heuristic algorithm, J. Hydrol. Eng., 15, 580–586, 2010.
Vargas, I. C. C., Oliveira, S. B. F., Oliveira, A., and Charneca, N.: Análise da Vulnerabilidade de uma Praia Estuarina à Inundação: Aplicação à Restinga do Alfeite (Estuário do Tejo), Revista da Gestão Costeira Integrada, 8, 25–43, 2008.
Wang, D.: A new probability density function for spatial distribution of soil water storage capacity leads to the SCS curve number method, Hydrol. Earth Syst. Sci., 22, 6567–6578, https://doi.org/10.5194/hess-22-6567-2018, 2018.
Wang, W., Yang, X., and Yao, T.: Evaluation of ASTER GDEM and SRTM and their suitability in hydraulic modelling of a glacial lake outburst flood in southeast Tibet, Hydrol. Process., 26, 213–225, https://doi.org/10.1002/hyp.8127, 2012.
Wijayarathne, D. B. and Coulibaly, P.: Identification of hydrological models for operational flood forecasting in St. John's, Newfoundland, Canada, J. Hydrol. Regional Studies, 27, 100646, https://doi.org/10.1016/j.ejrh.2019.100646, 2020.
Yan, K., Di Baldassarre, G., and Solomatine, D. P.: Exploring the potential of SRTM topographic data for flood inundation modelling under uncertainty, J. Hydroinform., 15, 849–861, https://doi.org/10.2166/hydro.2013.137, 2013.
Zêzere, J. L., Pereira, S., Tavares, A. O., Bateira, C., Trigo, R. M., Quaresma, I., Santos, P. P., Santos, M., and Verde, J.: DISASTER: A GIS database on hydro-geomorphologic disasters in Portugal, Nat. Hazards, 72, 503–532, https://doi.org/10.1007/s11069-013-1018-y, 2014.
Zhang, K., Shalehy, M. H., Ezaz, G. T., Chakraborty, A., Mohib, K. M., and Liu, L.: An integrated flood risk assessment approach based on couple hydrological-hydraulic modeling and bottom-up hazard vulnerability analysis, Environ. Modell. Softw., 148, 105279, https://doi.org/10.1016/j.envsoft.2021.105279, 2022.
Zhang, P., Liu, R., Bao, Y., Wang, J., Yu, W., and Shen, Z.: Uncertainty of SWAT model at different DEM resolutions in a large mountainous watershed, Water Res., 53, 132–144, https://doi.org/10.1016/j.watres.2014.01.018, 2014.