the Creative Commons Attribution 4.0 License.
the Creative Commons Attribution 4.0 License.
 | 13 Feb 2024
Numerical-model-derived intensity–duration thresholds for early warning of rainfall-induced debris flows in a Himalayan catchment
Sudhanshu Dixit
Srikrishnan Siva Subramanian
Piyush Srivastava
Ali P. Yunus
Tapas Ranjan Martha
Sumit Sen
Debris flows triggered by rainfall are catastrophic geohazards that occur compounded during extreme events. Few early warning systems for shallow landslides and debris flows at the territorial scale use thresholds of rainfall intensity–duration (ID). ID thresholds are mostly defined using hourly rainfall. Due to instrumental and operational challenges, current early warning systems have difficulty forecasting sub-daily time series of weather for landslides in the Himalayas. Here, we present a framework that employs a spatio-temporal numerical model preceded by the Weather Research And Forecast (WRF) Model for analysing debris flows induced by rainfall. The WRF model runs at 1.8 km × 1.8 km resolution to produce hourly rainfall. The hourly rainfall is then used as an input boundary condition in the spatio-temporal numerical model for debris flows. The debris flow model is an updated version of Van Asch et al. (2014) in which sensitivity to volumetric water content, moisture-content-dependent hydraulic conductivity, and seepage routines are introduced within the governing equations. The spatio-temporal numerical model of debris flows is first calibrated for the mass movements in the Kedarnath catchment that occurred during the 2013 North India floods. Various precipitation intensities based on the glossary of the India Meteorological Department (IMD) are set, and parametric numerical simulations are run identifying ID thresholds of debris flows. Our findings suggest that the WRF model combined with the debris flow numerical model shall be used to establish ID thresholds in territorial landslide early warning systems (Te-LEWSs).
- Article
(11539 KB) - Full-text XML
-
Supplement
(1299 KB) - BibTeX
- EndNote


Rainfall-induced debris flow disasters are catastrophic and affect people's livelihood in mountainous regions (Cannon and DeGraff, 2009; Stoffel et al., 2014; Turkington et al., 2016). The increasing frequency and number of extreme-rainfall events driven by climate change may aggravate the occurrence of disastrous debris flows in several regions around the world (Field et al., 2012; Dash and Maity, 2021; Westra et al., 2014; Bharti et al., 2016). These make debris flow disaster mitigation an urgent need (Suzuki et al., 2020). Structural and non-structural mitigation measures are practised to mitigate debris flow impacts (Fan et al., 2019; Huebl and Fiebiger, 2005). However, non-structural mitigation measures, i.e. early warning systems, adapt to practices of efficient early warning and are implemented on larger scales, which is essentially required during extreme events (Piciullo et al., 2018; Guzzetti et al., 2020). Nations, e.g. the United States of America, Japan, Italy, and China, have developed debris flow early warning systems that work at the territorial scale, few of them covering certain regions and another few an entire nation (Baum and Godt, 2010; Osanai et al., 2010; Ju et al., 2020; Alfieri et al., 2012). These systems use radar-based rainfall forecasts and observed data-derived intensity–duration (ID) of rainfall to set the triggering thresholds of landslides for early warning systems (Bogaard and Greco, 2018; Brunetti et al., 2010; Guzzetti et al., 2008; Staley et al., 2013). With the help of historical records of debris flows and their corresponding triggering rainfall intensity and duration, the determination of thresholds is usually considered in these early warning systems (Intrieri et al., 2013; Segoni et al., 2018; Stähli et al., 2015).
In India, the National Remote Sensing Centre (NRSC), under the Indian Space Research Organisation (ISRO), developed an “experimental landslide early warning system for rainfall-triggered landslides” along selected road corridors in Uttarakhand, India (Jayaraman, 2013; Khatri et al., 2017; Bharwad, 2019). The system's historical landslide data and rainfall records are sourced from the Border Roads Organization (BRO) and the India Meteorological Department (IMD). Experimentally forecasted rainfall data from the Space Applications Centre (SAC) and landslide hazard zonation maps from NRSC are used. Combinations of 24 h rainfall and various antecedent duration-based thresholds are statistically combined to estimate the probability of landslide occurrences (Mathew et al., 2014). The thresholds used were determined based on 3 hourly rainfalls from TRMM 3B42 V.6 data, whereas the actual LEWS operated by National Remote Sensing Centre (NRSC), Indian Space Research Organisation (ISRO), uses daily as well as multiple-day antecedent rainfall based on Mathew et al. (2014). However, the 24-hourly/daily rainfall threshold may perform well for predicting shallow landslides but not for debris flows. Runoff generation depends on shorter-duration rainfall intensities, and early warning system thresholds of hourly rainfall become fundamental for debris flows (Pan et al., 2018; Hürlimann et al., 2019). Due to instrumental and operational challenges, current early warning systems have difficulty forecasting sub-daily time series of weather for landslides in the Himalayas (Bhandari, 1987, 2006; Gariano et al., 2023).
Many nations use territorial landslide early warning systems (Te-LEWSs) as a cost-effective non-structural mitigation measure for landslides (Piciullo et al., 2018; Guzzetti et al., 2020). However, most Te-LEWSs or models, e.g. ID, antecedent rainfall, or Soil Water Index (SWI), have genetic inaccuracies since traditional methods derive thresholds from statistical/data-driven correlations of past events and monitoring data (Lagomarsino et al., 2013). Implementing Te-LEWSs in new geological settings, e.g. the Himalayas and the Western Ghats, India, with limited historical events and precipitation records, is very challenging (Gariano et al., 2023). With a limited number of recorded historical landslides, capturing the exact value of the threshold is cumbersome. An alternative approach is required to simulate landslide occurrence under various magnitudes of precipitation and inform about the landslide-triggering conditions. Early warning systems that use ID for debris flows rely on an hourly forecast of rainfall data (Hürlimann et al., 2019). In India, however, the current thresholds are based on daily rainfall. The above reasons invite improvements to India's existing Te-LEWSs.
In this study, we present a framework for an early warning system comprised of a Weather Research And Forecast (WRF) Model (Srivastava et al., 2022) followed by a spatio-temporal numerical model for debris flows (Van Asch et al., 2014; Domènech et al., 2019; Siva Subramanian et al., 2021). Using the framework, we analyse the debris flows in Kedarnath, Uttarakhand, India, during the 2013 North India floods. The hourly precipitation time series is obtained from the WRF simulations and compared with observations from the India Meteorological Department (IMD). Then, the triggering intensity–duration (ID) thresholds are derived through parametric numerical simulations under various rainfall intensities. As the study is introduced above, we organize the rest of the article as follows. Section 2 introduces the debris flow event that occurred in Kedarnath, Uttarakhand, India, during the 2013 North India floods. The data and methods adopted in this study are first detailed in Sect. 3. Then, the methodology is detailed, starting from the WRF model followed by the numerical model for debris flows (Van Asch et al., 2014; Domènech et al., 2019; Siva Subramanian et al., 2021). After this, the ID threshold method adapted in this study is presented briefly. The results of the numerical modelling and ID threshold analysis are presented in Sect. 4. In Sect. 5, we discuss the importance of hourly rainfall data for the early warning of debris flows in Uttarakhand, India, and highlight the improvements further needed to improve the precision of ID thresholds.
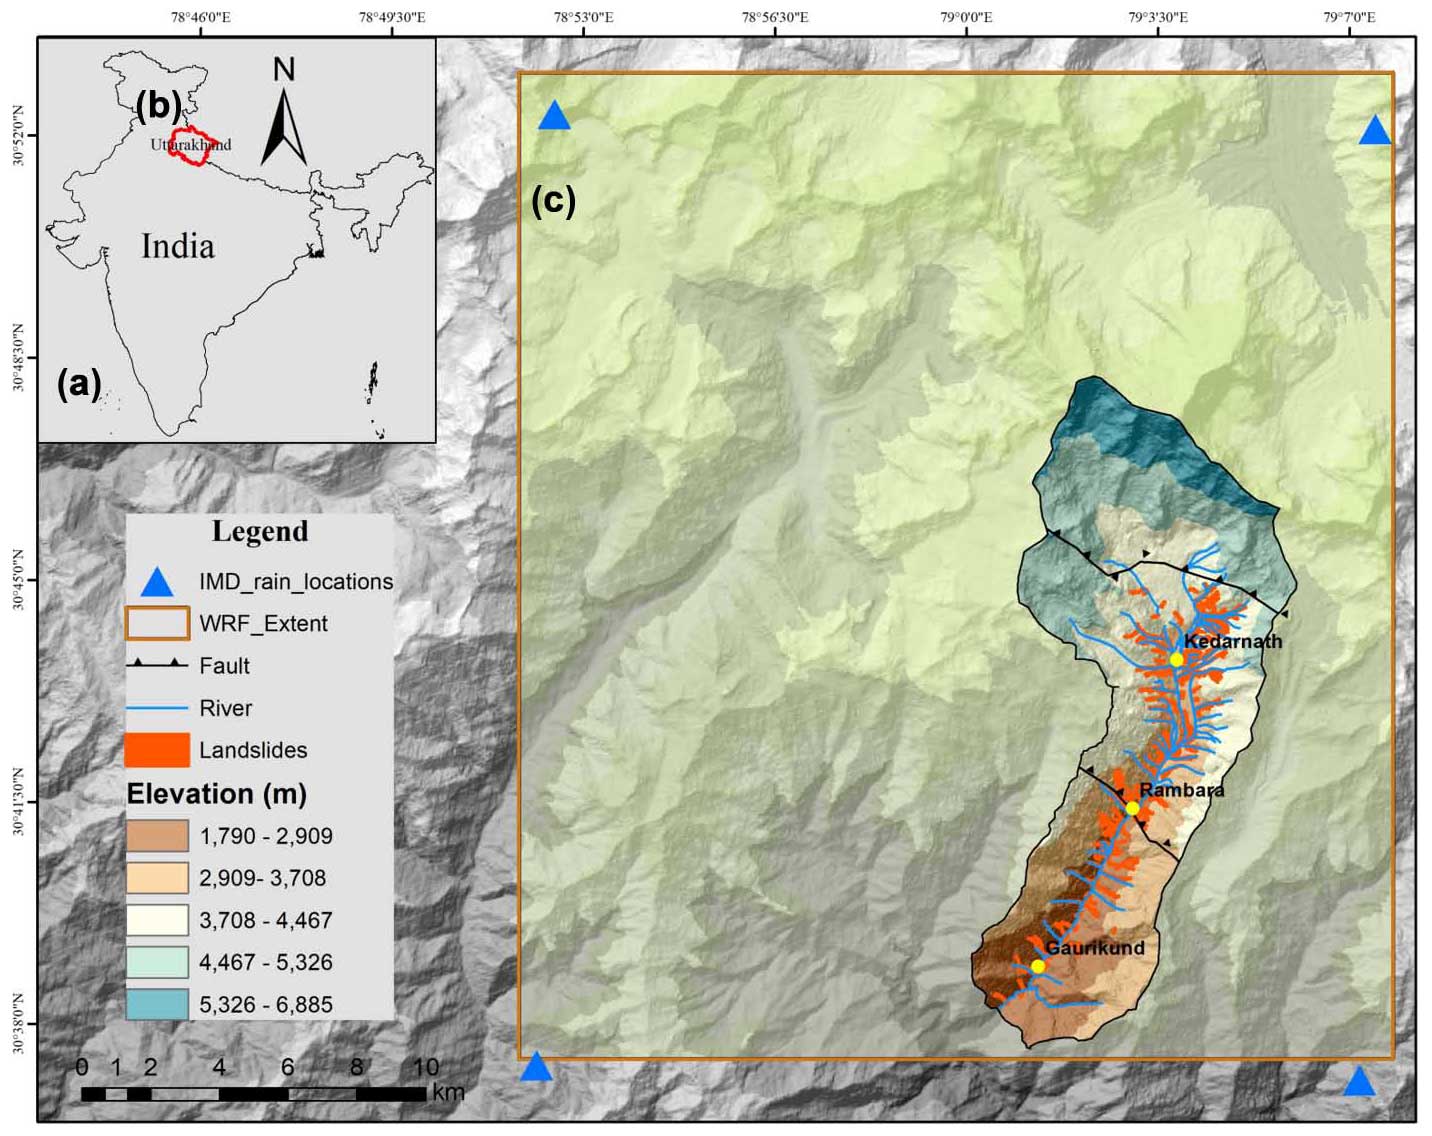
Figure 1Map showing the extent of the study area within Uttarakhand, India. (a) India administrative boundary highlighting Uttarakhand (© Survey of India, downloaded from: https://onlinemaps.surveyofindia.gov.in/Home.aspx, last access: 15 March 2023), (b) the location of Uttarakhand (© Survey of India, downloaded from: https://onlinemaps.surveyofindia.gov.in/Home.aspx, last access: 15 March 2023), and (c) the extent of debris flows overlaid by ALOS PALSAR 12.5 m digital elevation model in and around the disaster sites in Kedarnath, Uttarakhand, India. The domain to retrieve output from the Weather Research and Forecast (WRF) numerical model is shown in a red box; the locations for data inferred from the India Meteorological Department (IMD) gridded data are marked in blue triangles. The landslides are shown in red polygons. Two major faults run through the study area. The catchments possess zero-, first- and second-order streams.
This study considers the 2013 extreme rainfall-induced debris flows in Kedarnath as a case example. The study area is located inside the Himalayan tectonic zone, and the landscapes here are weakened geological formations with undulated terrain, narrow valleys, and steep slopes (Fig. 1). The area is situated towards the north portion of the Main Central Thrust (MCT) and Tethyan Detachment Fault bounds the other direction (Martha et al., 2013). The rocks are composed of Higher Himalayan Crystalline of metamorphic origin with occasional granitic intrusions. Gneiss, kyanite, calc silicate, biotite granite, quartzite, marble, and schists are major rock types in this area (Fig. 2a). The unmapped area mainly surrounds the glacier. Over this fragile terrain, due to extreme rainfall, over 120 landslides, mostly of debris flows and slides followed by flash floods, occurred during 15–17 June 2013 (Martha et al., 2015; Champati Ray et al., 2016; Allen et al., 2016). Martha et al. (2015) mapped a total of 6013 landslides over the entire Uttarakhand and found that 3472 landslides newly occurred over an area of 30.4 km2. The disaster caused more than 5000 casualties and severe economic impacts. Surrounding the Kedarnath, India Meteorological Department (IMD) observed unprecedented extreme rainfall amounts of over 350 mm between 14 and 18 June 2013 (Dobhal et al., 2013; Singh et al., 2015). Numerical weather prediction model studies have also found the cumulative daily rainfall during 16 and 17 June was close to 200 mm (Shekhar et al., 2015; Kumar et al., 2016; Chevuturi and Dimri, 2016; Dube et al., 2014). Continuous rainfall occurred on 15, 16, and 17 June, triggering catastrophic debris flows through runoff-induced erosion of weak sediments overlying the hillslopes (see the location of landslides, mostly debris flows/slides in Fig. 1). Martha et al. (2015) mapped a total of 121 landslides within the Kedarnath catchment (Fig. 2b). Photographs taken during field work in the Kedarnath valley during December 2022 are shown in Fig. 3.
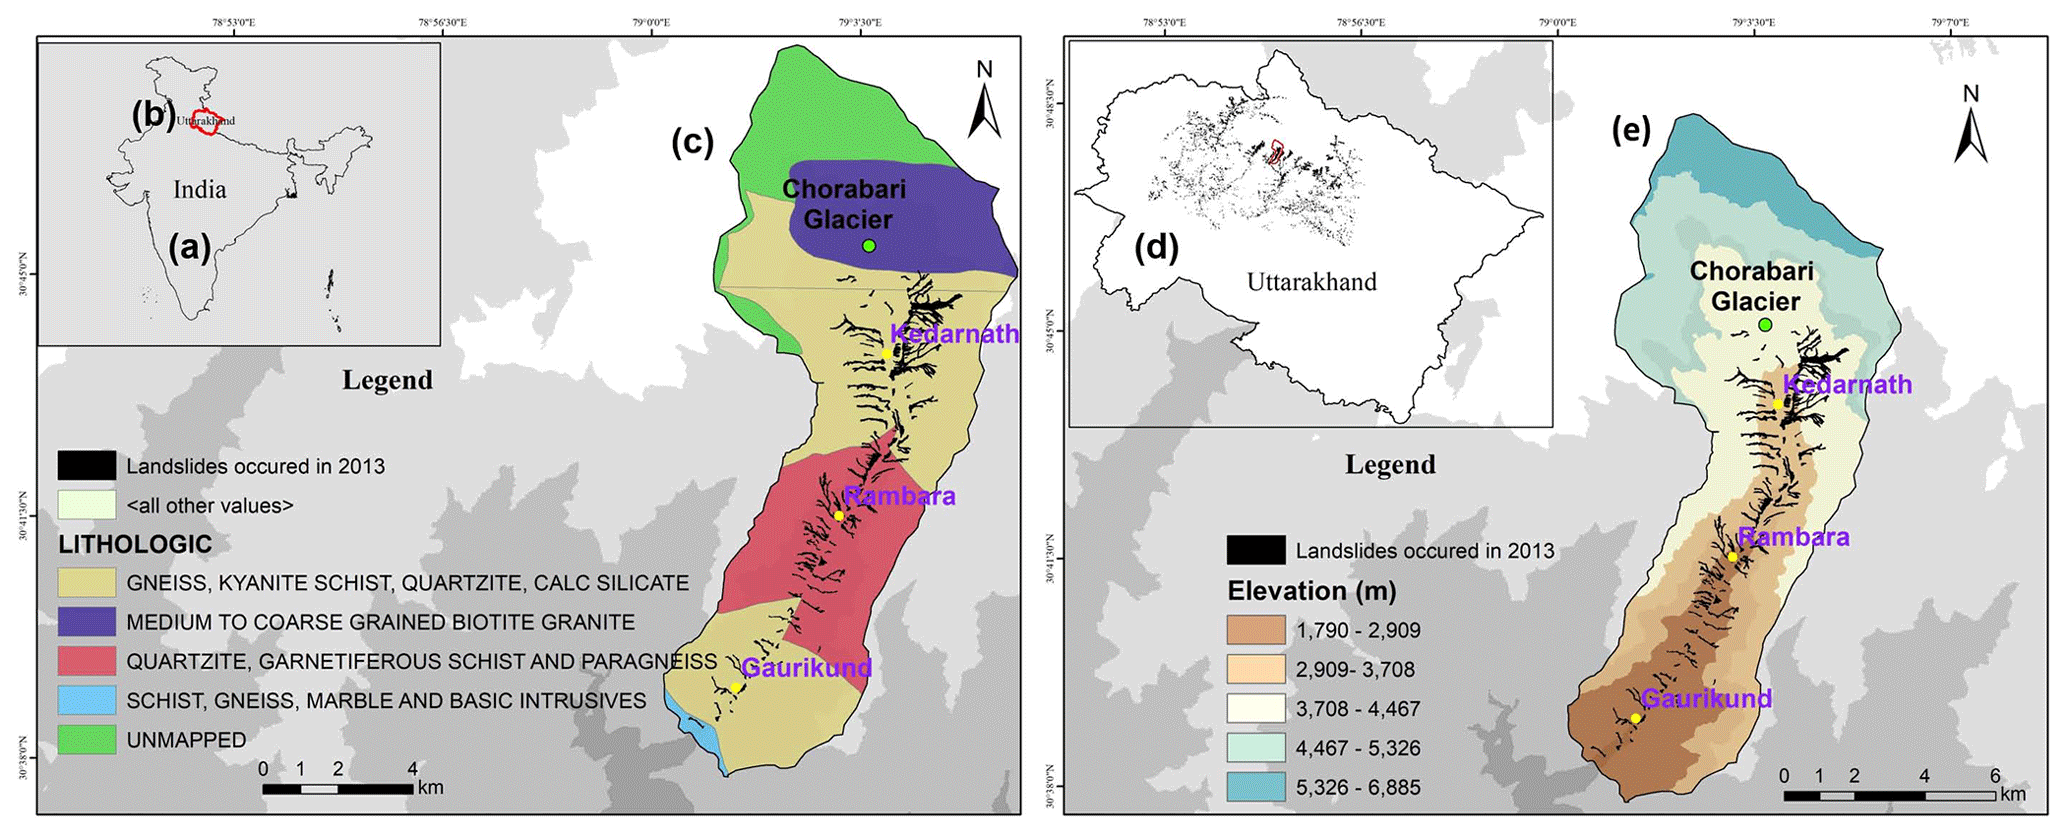
Figure 2(a) India, (b) Uttarakhand, and (c) lithology of the Kedarnath catchment (© Geological Survey of India, downloaded from Bhukosh Portal: https://bhukosh.gsi.gov.in/Bhukosh/Public, last access: 16 March 2023). (d) All landslides within Uttarakhand state occurred during the 2013 North India floods. (e) Extent of landslides that occurred from 15 to 17 June 2013 is mapped by Martha et al. (2015).
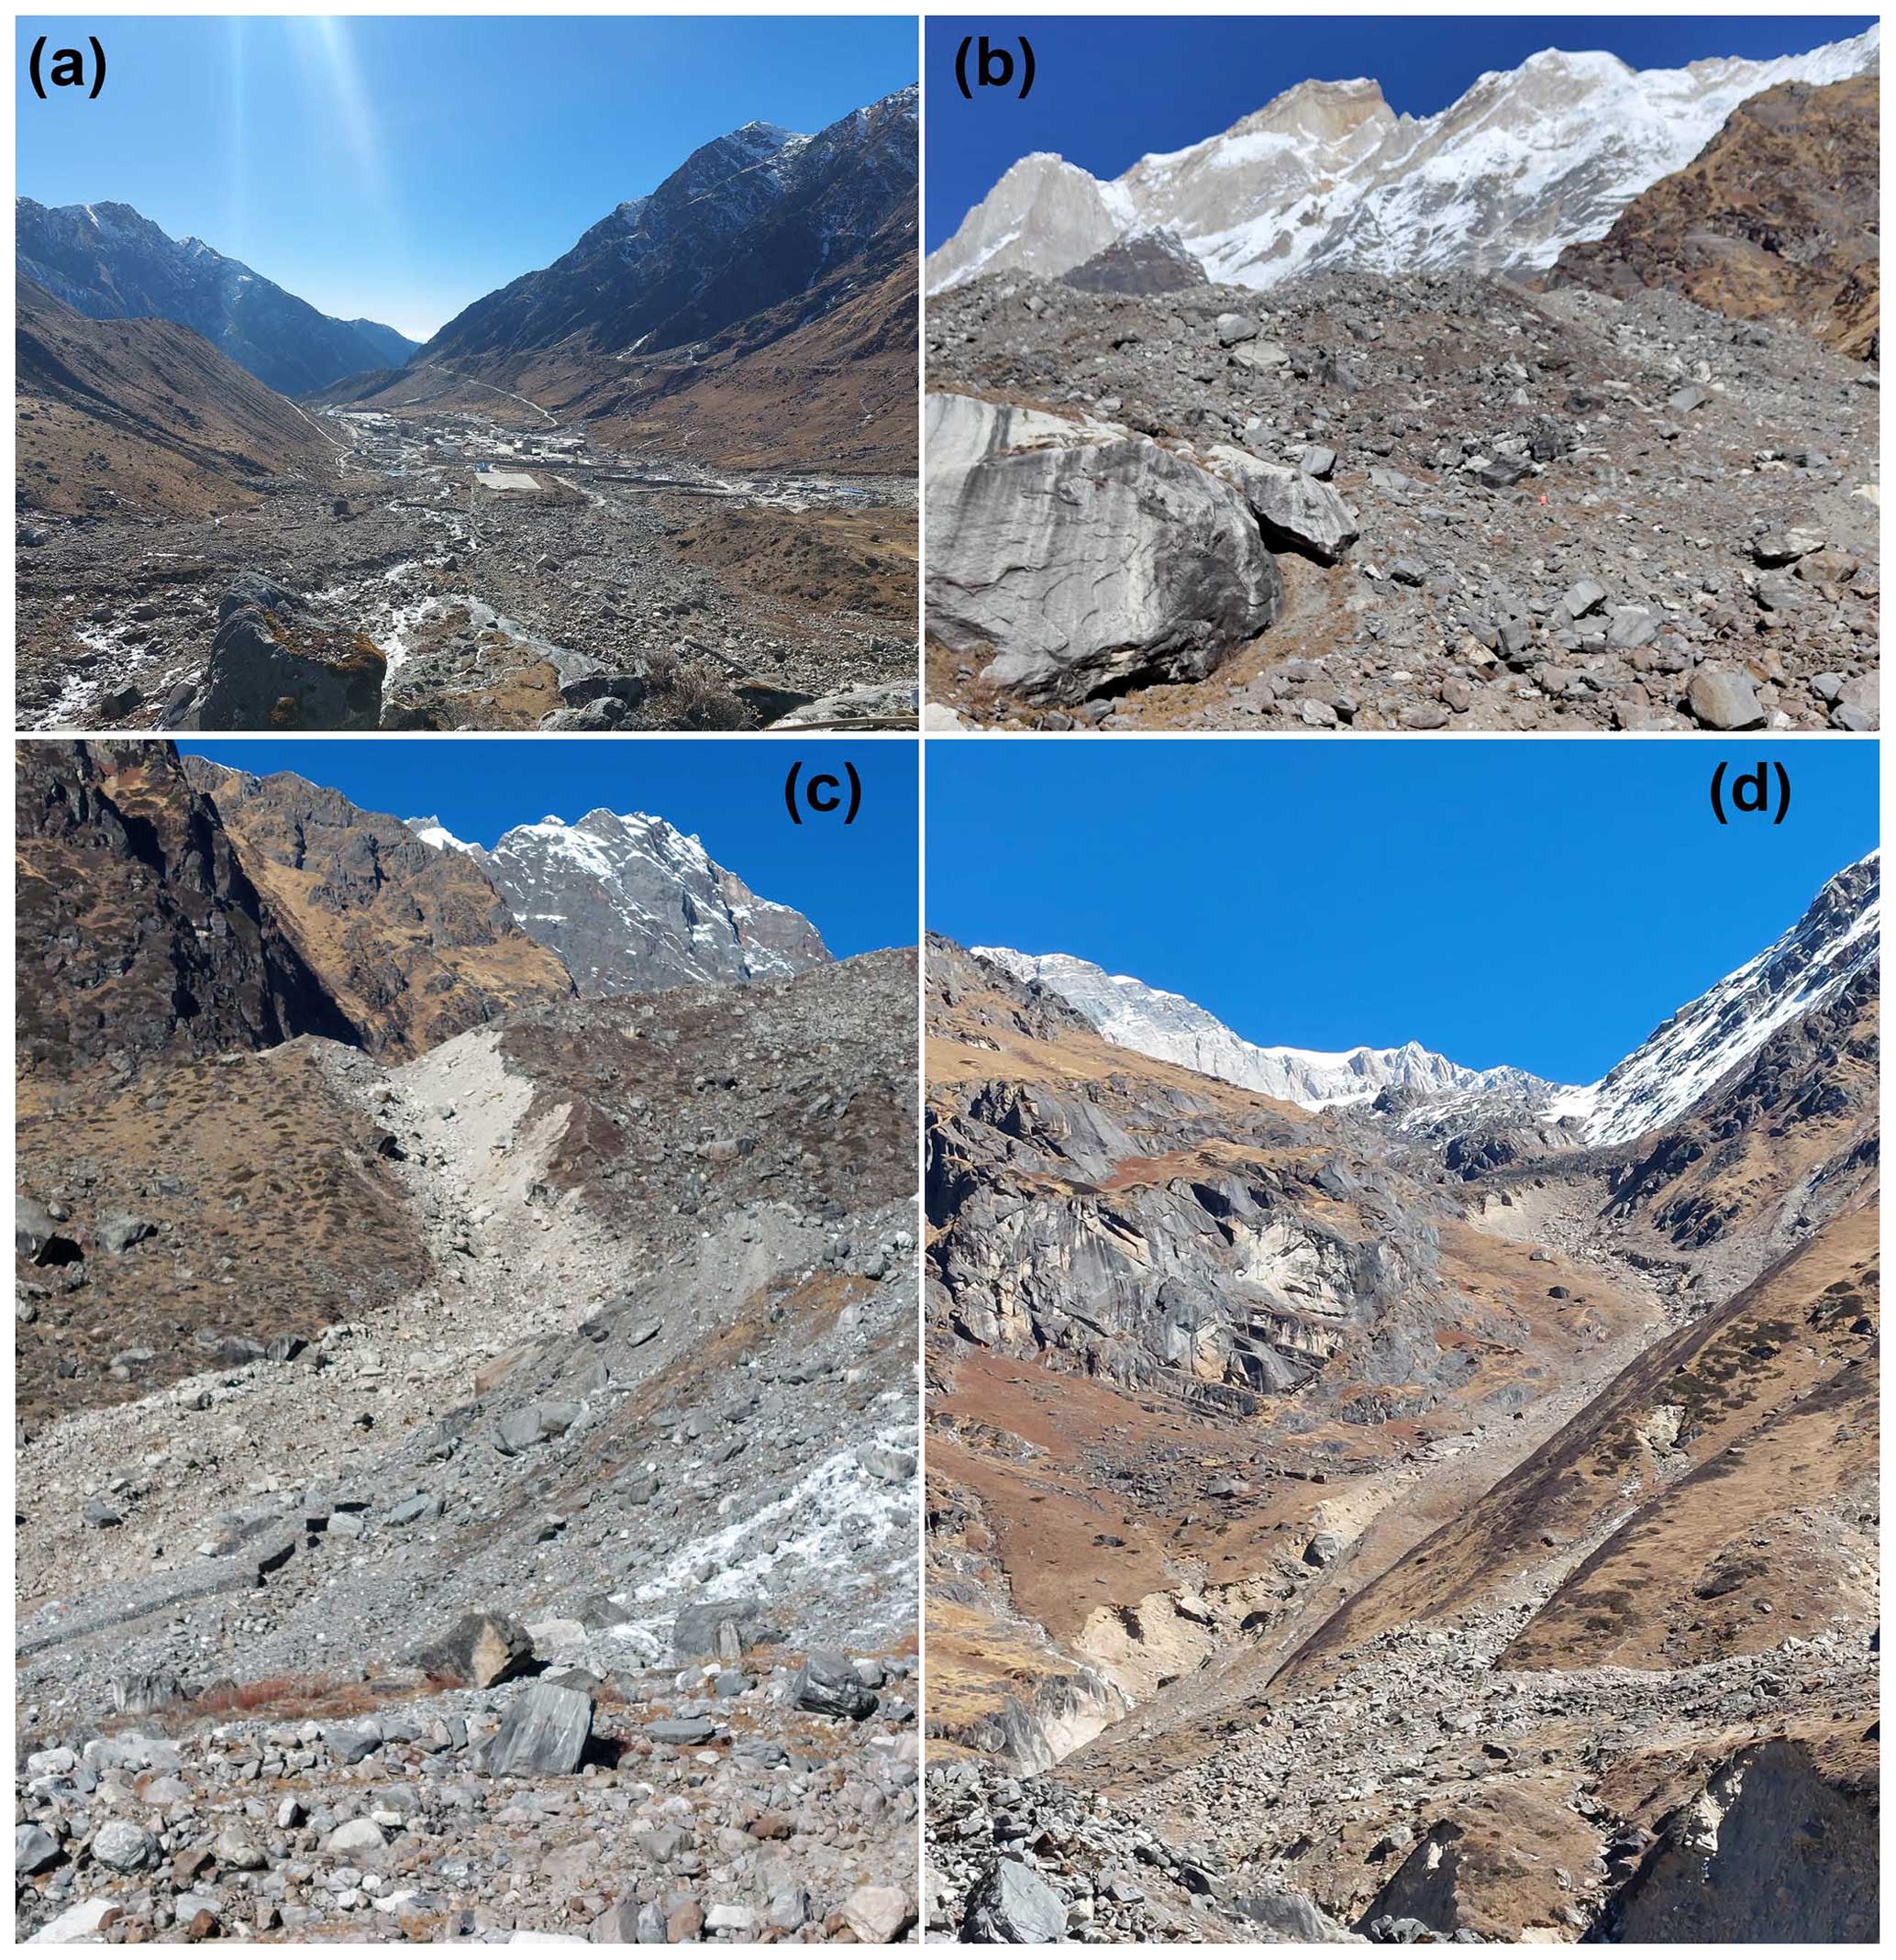
Figure 3Photographs taken during fieldwork in the Kedarnath valley during December 2022. (a) Viewing from north towards downstream side of the Kedarnath valley, (b) debris flow deposits approximately 1 km behind the Kedarnath shrine, (c) runout path of debris flow flood, and (d) major debris flow that hit the Chorabari glacier lake (this photograph was taken climbing above the debris flow deposits shown in Fig. 3b).
3.1 Meteorological data and WRF simulations
The methodological flowchart used for the modelling is shown in Fig. (4). The numerical modelling approach starts with the rainfall simulation in an hourly time step. For this purpose, the Weather Research and Forecasting (WRF) numerical model version 4.2.2 (Skamarock et al., 2019) is used in this study. The WRF model is a state-of-the-art mesoscale numerical weather prediction system designed for atmospheric research and operational forecasting applications. In this study, this model is used for deriving the hourly rainfall time series during the 2013 North India floods over the Kedarnath region, Uttarakhand, India (Srivastava et al., 2022). The model has a fully compressible setup with a non-hydrostatic dynamical core. The model uses terrain-following hydrostatic pressure over the vertical coordinates for numerical simulations. Figure 5 shows the geographical coverage of the WRF model setup. The black rectangular boxes represent two one-way nested domains: domain d01 (9 × 9 km) and domain d02 (1.8 × 1.8 km). The output for the study area is obtained by defining a rectangular box shown in Fig. 1.
For comparison of the WRF-derived rainfall, we use the India Meteorological Department (IMD) gridded data and Global Satellite Mapping of Precipitation (GSMaP) data respectively at daily and hourly rain rates with respective spatial resolutions 0.25 × 0.25∘ 0.1 × 0.1∘. The meteorological data from IMD are obtained at locations 1, 2, 3, and 4 (see Fig. 1, blue triangles). A comparison of the data from IMD with the WRF-derived data (cumulative to daily time steps) is shown in Fig. 6a and b. The data from IMD comprise daily gridded rainfall information for India, featuring a spatial resolution of 0.25 × 0.25∘ and spanning a lengthy period from 1901 to 2022. This dataset, covering 122 years, provides detailed insights into daily rainfall in millimetres. For the WRF simulation, ERA5 reanalysis data are used as initial boundary data. The temporal interval of the ERA5 boundary data used is 6 h. Further configuration of the WRF model to reproduce the analysis is shown in Fig. 5.
Spatially explicit rainfall time series maps at an interval of 1 h are derived as an output from the WRF model. The area used to derive the rainfall maps is shown in Fig. 1. The WRF numerical model-based rainfall during the days 15, 16, and 17 June 2013 sourced precisely at the centre of 121 landslide polygons are plotted in Fig. 7a, b, and c respectively for average, minimum, and maximum rainfall. The hourly rainfall time series from WRF for average, minimum, and maximum rainfall is compared with GSMaP data, as shown in Fig. 7a, b, and c.
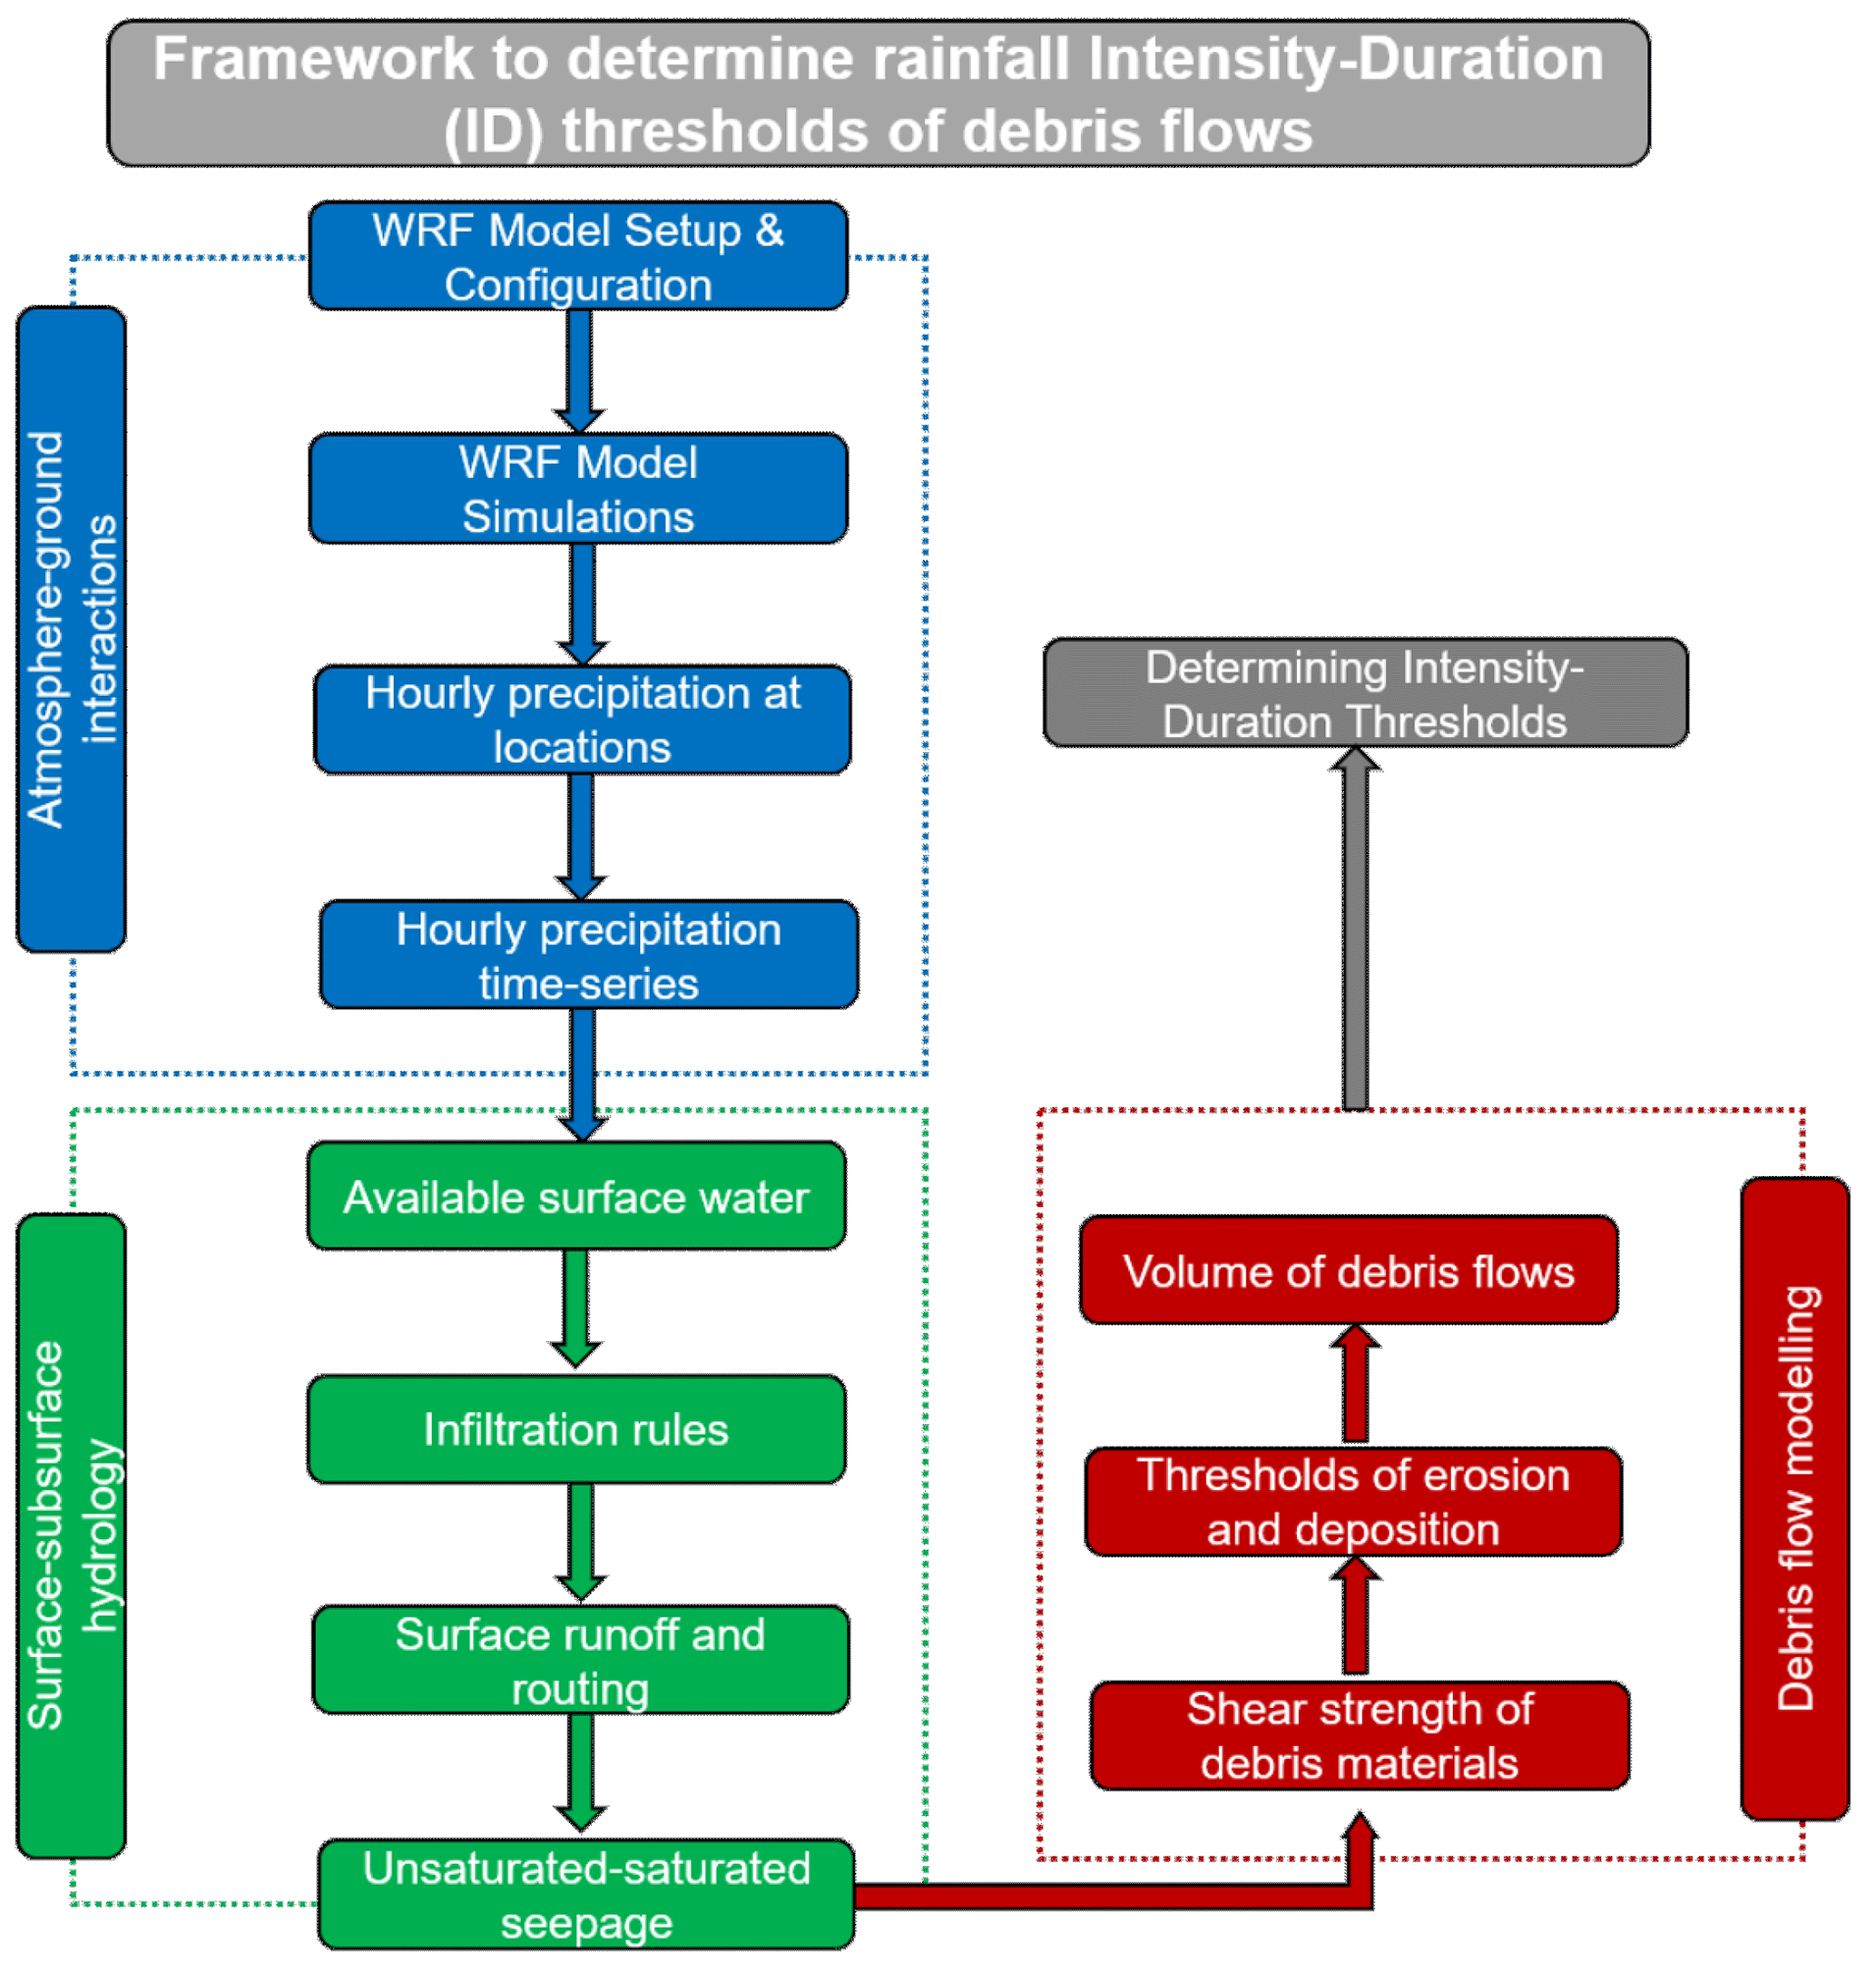
Figure 4Methodological framework proposed in this study to determine the rainfall ID thresholds of debris flows.
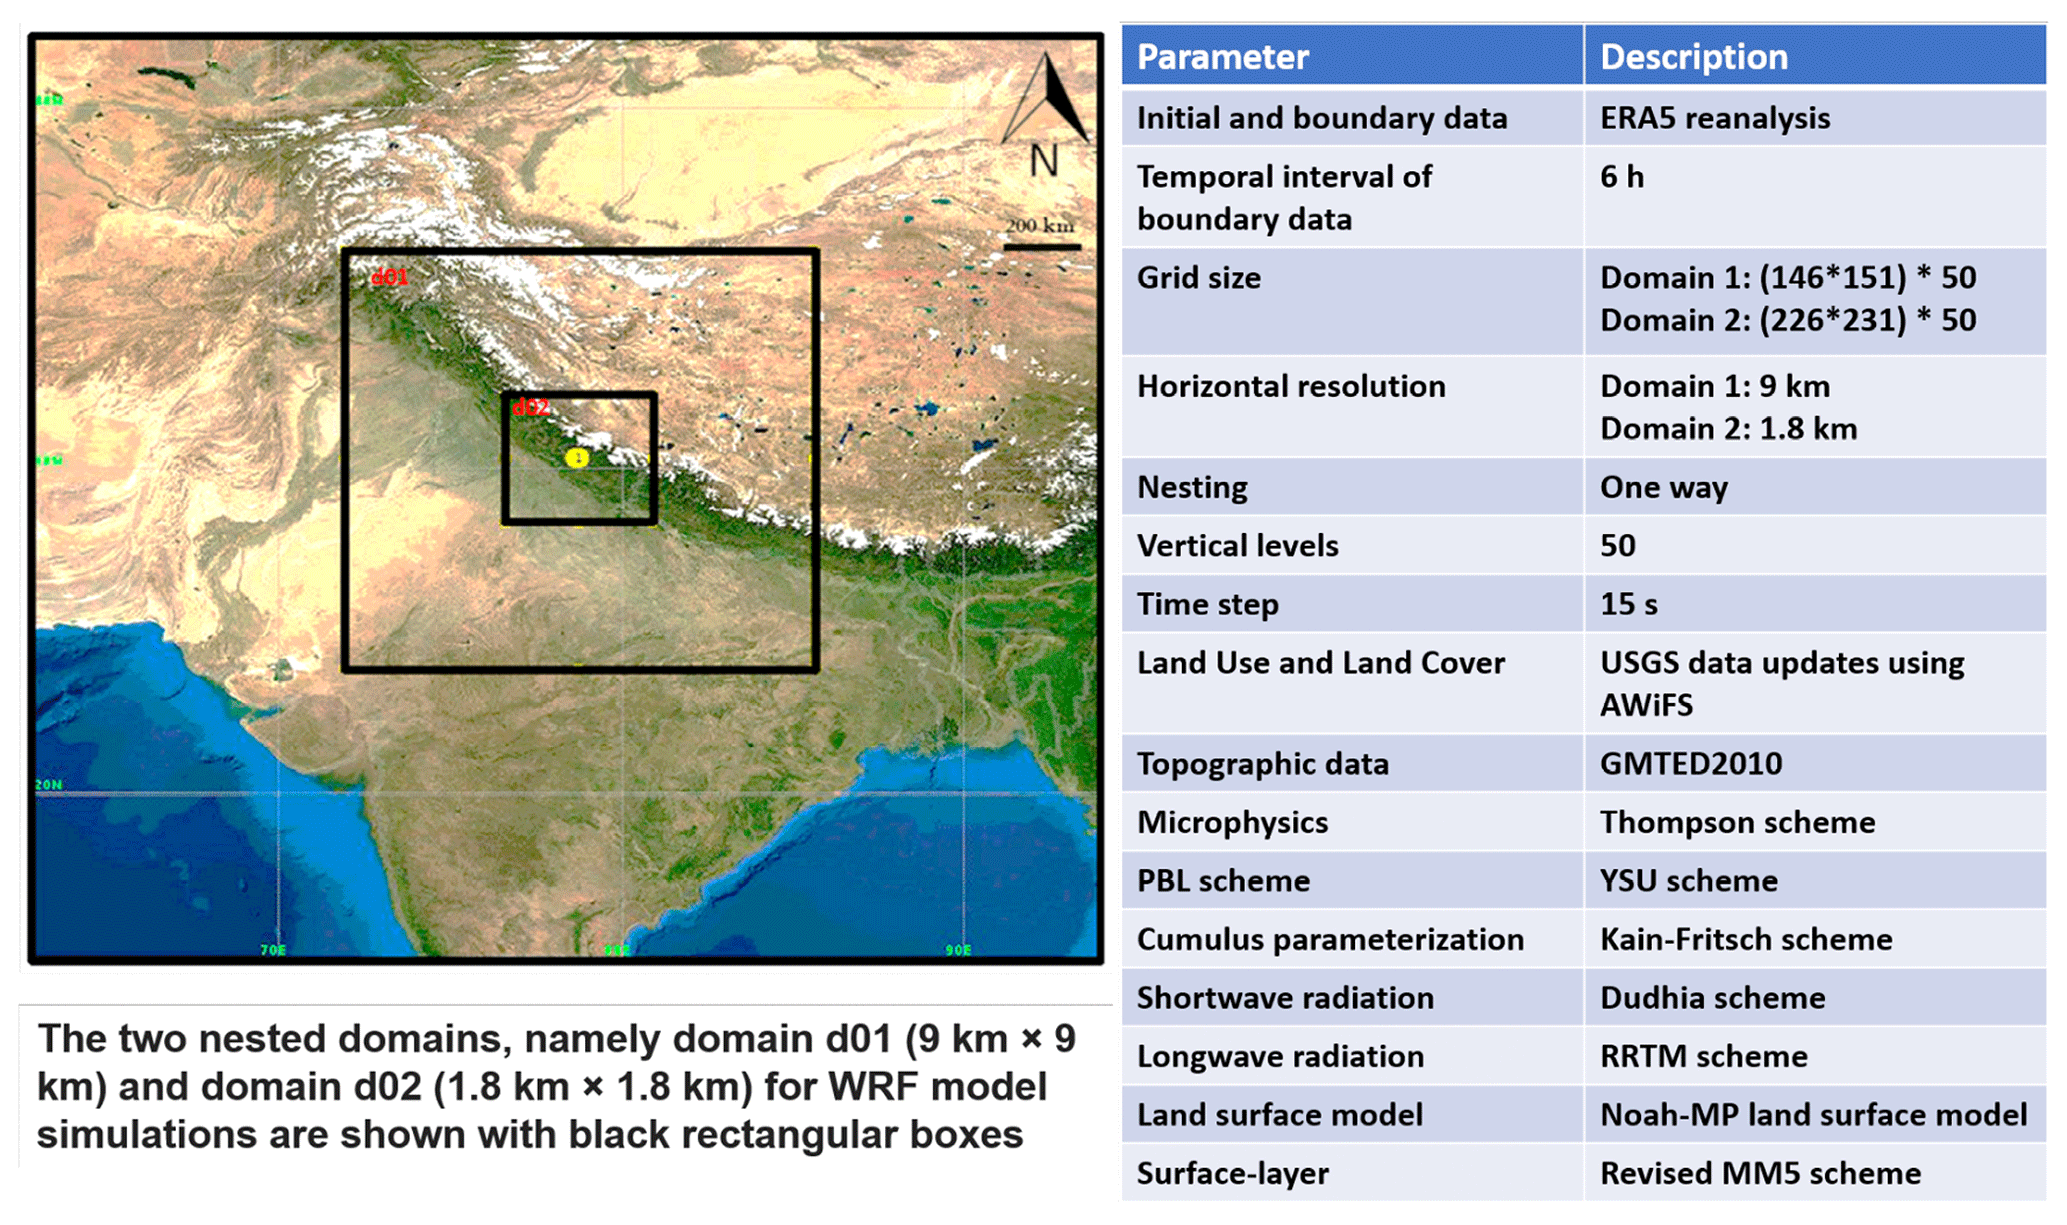
Figure 5The setup and configuration of Weather Research and Forecast (WRF) numerical model to derive hourly rainfall time series from 15 to 17 June 2013. Modified from Srivastava et al. (2022).
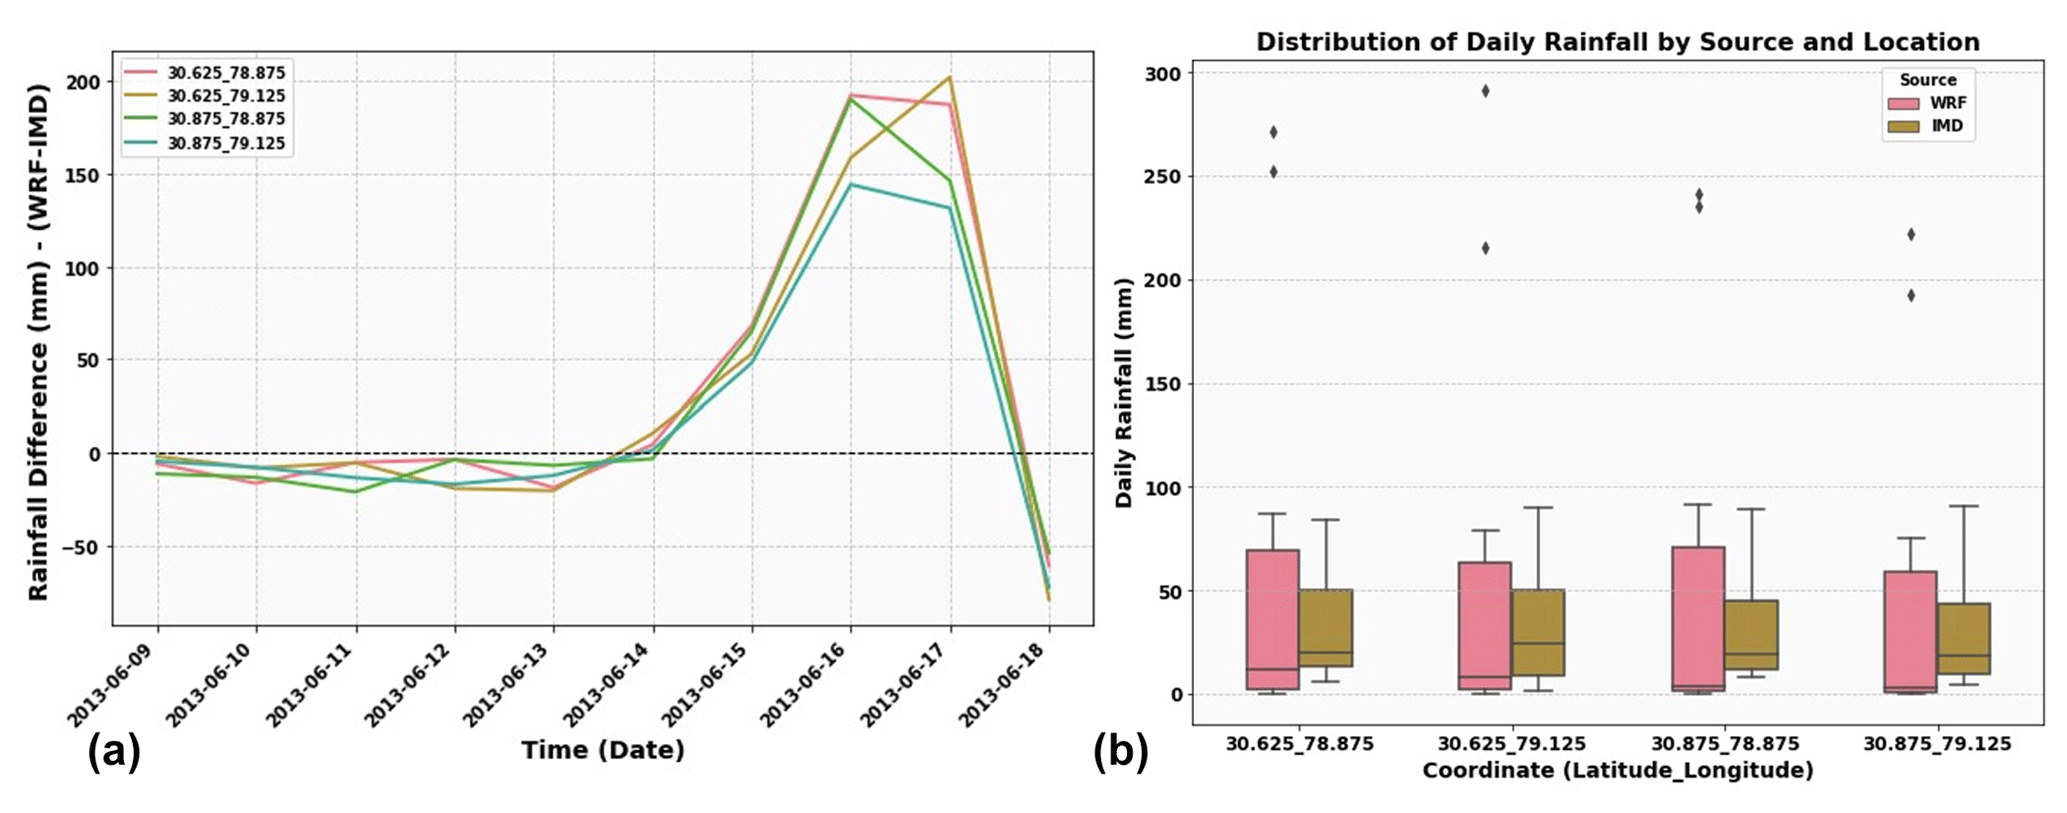
Figure 6(a) Daily rainfall data at four locations around Kedarnath catchment (see Fig. 1) and (b) distribution of daily rainfall at four locations from 15 to 17 June 2013 compared between WRF numerical model and IMD data.
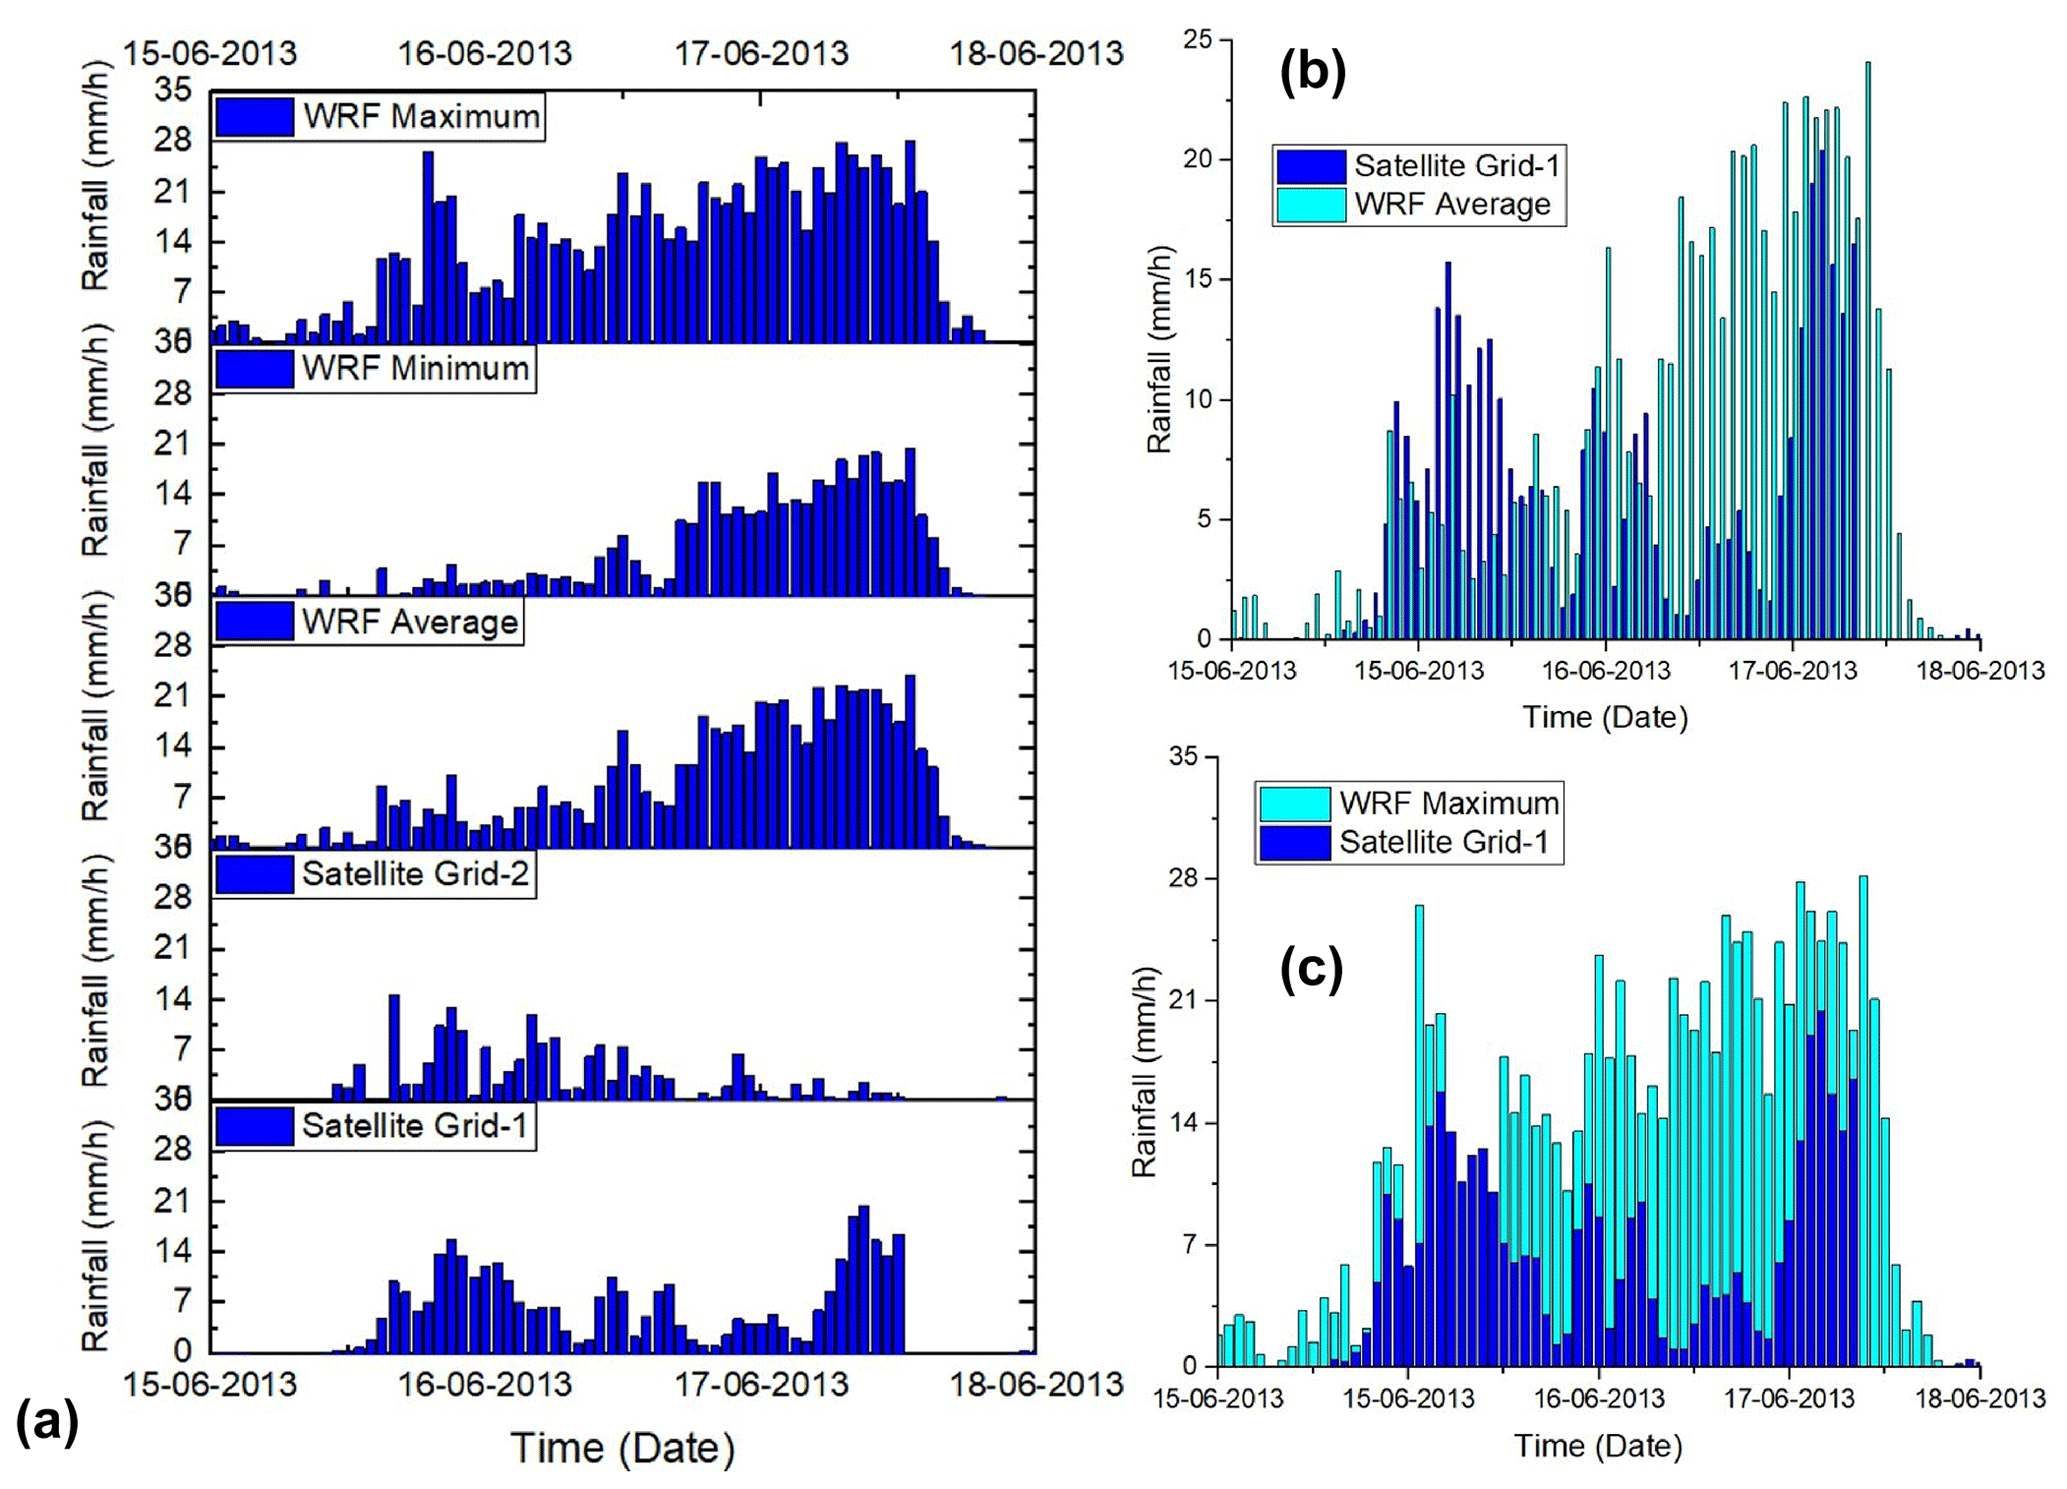
Figure 7(a) Hourly rainfall time series from 15 to 17 June 2013 derived from WRF numerical model: average, minimum, and maximum over 121 locations of landslides within the study area. Satellite Grid-1 and Grid-2 show the data from GSMaP. (b) Average of WRF rainfall compared with satellite data for region Grid-1 and (c) maximum of WRF rainfall compared with satellite data for region Grid-1.
3.2 Numerical modelling of debris flows
In this study, we use the numerical model developed by Van Asch et al. (2014) and Siva Subramanian et al. (2021). The model is an updated version of Van Asch et al. (2014) in which sensitivity of soil moisture, moisture-content-dependent hydraulic conductivity, and seepage routines are embedded (Siva Subramanian et al., 2021). A Python-based script and command line are used to code the model in PCRaster, a dynamic programming tool based on a geographical information system (GIS) platform (Van Deursen, 1995). A digital elevation model (DEM) is required to run the model. The resolution of the DEM sets the mesh size of the model. In addition to the DEM, other DEM derivatives, e.g. slope, and drainage direction, are input as maps having the same resolution. We use the publicly available 12.5 m resolution ALOS PALSAR DEM for this study. Other spatial inputs, e.g. the area of the catchment, depth of soil or regolith (Hengl et al., 2017), area of precipitation, and local drainage direction (LDD) maps, are used. Pre-processing of these datasets is done using ArcGIS version 10.8.2 (Ormsby et al., 2001). Readers are directed to Van Asch et al. (2014) and Van Asch et al. (2018) for more information on the source model's governing equations. The infiltration and seepage schemes are based on the equations of Siva Subramanian et al. (2020). The complete governing equations of the model are available from Siva Subramanian et al. (2021) and are explained briefly below and detailed in the Supplement. The code shall be accessed from Subramanian and Dixit (2024).
In the model, debris flow initiation occurs when the bed shear stress (τ, kPa) is larger than the critical erosive shear stress (τc, kPa), and the volumetric concentration of solids in the debris flow (CV) is smaller than an equilibrium value (CV∞). The equilibrium value, also referred to as the transport capacity of the flow, is defined based on stability theory using the expression proposed by Takahashi et al. (1992):
where ρw (kg m−3) is the density of water, usually assumed to be 1000 kg m−3, ρs (kg m−3) is the density of the solids, ϕbed (∘) is the angle of internal friction of the bed/slope materials, and α (∘) is the slope angle of the hillslope derived from the DEM. The rate of erosion (er) is expressed based on Takahashi et al. (1992):
where δe is the coefficient of erosion rate, which is non-dimensional and back-calculated for any given analysis, ac (m) is the depth within the sediment layer under the condition τc=τ , dL is d50 mean diameter of the grain, U (m s−1) is the velocity of the flow-through vertical section, CV∗ is the volumetric fraction of solids, and qt (m2 s−1) is the routed total discharge of the sum of sediments and water per unit width expressed by Van Asch et al. (2014). For further details of the governing equations of the source model, readers are referred to Van Asch et al. (2014) and Van Asch et al. (2018). Part of the infiltration and seepage schemes are from Siva Subramanian et al. (2020). The percolation-based infiltration model is available from Siva Subramanian et al. (2020) and van Beek (2002).
At first, the input parameters listed in Table 1 and the rainfall data acquired from the WRF model are given to the numerical model. Then, we run the numerical model (see Fig. 6). The numerical analysis will last for a total of 3 d, from 15 to 17 June 2013. For the purposes of convergence, the time step is set to 1 h and the total duration is 72 h. Courant–Friedrichs–Lewy (CFL) condition checks the mass balance and convergence at every time step (De Moura and Kubrusly, 2013). The model monitors changes in erosion and deposition, as well as volumetric water content response, at various catchment areas. The volume of eroded debris is monitored at the confluence of first-order and second-order streams to the main river.
Table 1Parameters used for the numerical analysis. ρs, CV*, ϕb, τc, Ks, μ, and n are set referring to the literature (Siva Subramanian et al., 2021). d50, δe, and δd are set by calibration and back analysis.

In Table 1, d50 is the mean grain size, ρw is the density of water, ρs is the density of solid particles, CV* is the volume fraction of solids in the erodible bed, ϕb is the friction angle of soil, τc is the yield strength, δe is the coefficient of erosion rate, δd is the coefficient of deposition rate, Ks is the soil infiltration capacity, μ is the dynamic viscosity, and n is Manning's number.
3.3 Determination of intensity–duration (ID) thresholds that trigger debris flows
Caine (1980) proposed the relationship between I (rainfall intensity) and D (rainfall duration) shown in Eq. (3), which is now commonly used to establish rainfall thresholds in territorial landslide early warning systems (Te-LEWSs) for shallow landslides and debris flows (Destro et al., 2017; Iadanza et al., 2016; Intrieri et al., 2013; Peruccacci et al., 2017; Scheevel et al., 2017).
Here, two constant fitting parameters α and β are used.
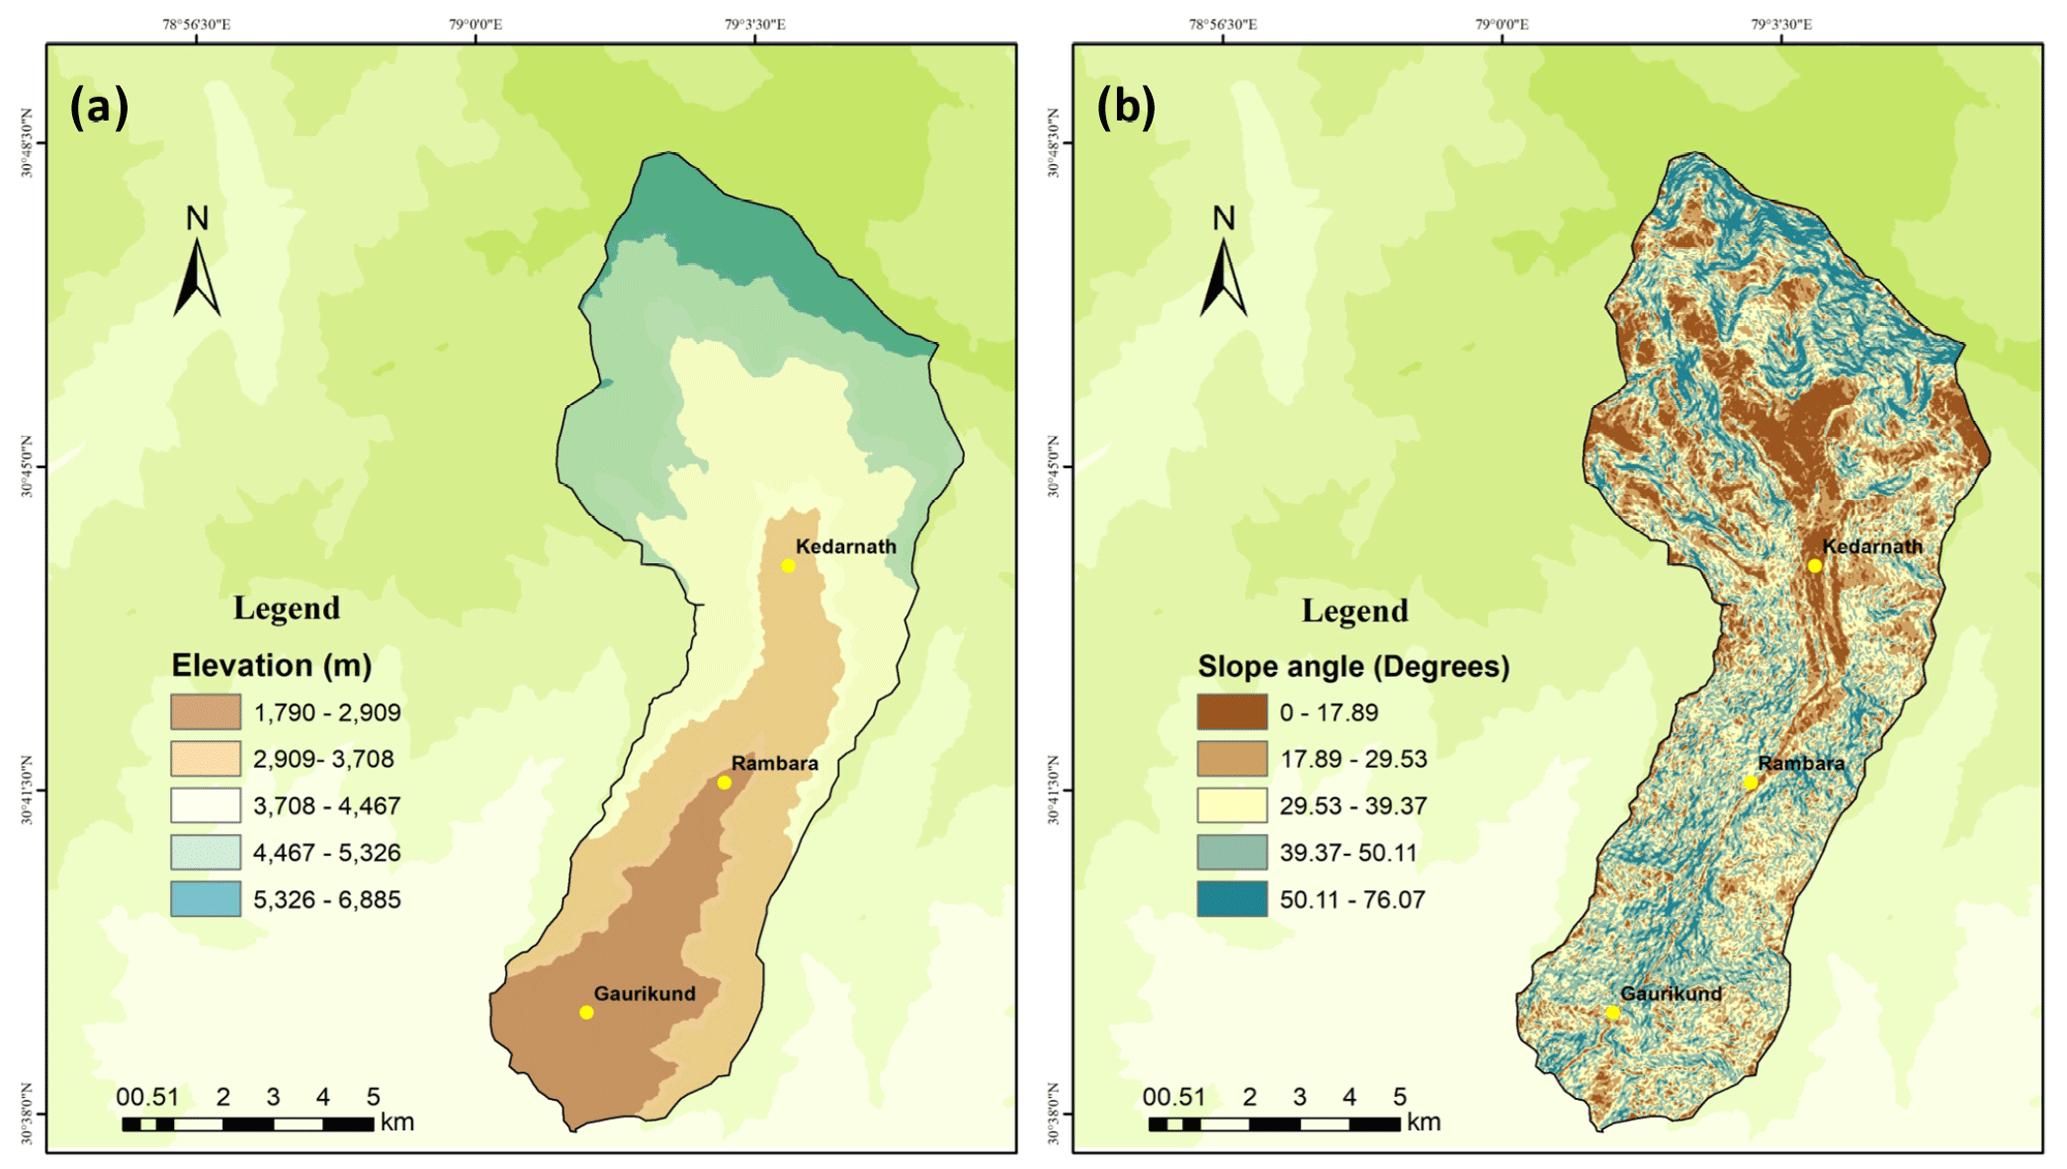
Figure 8Spatial datasets required for numerical modelling. (a) Elevation (m) and (b) slope angle (degrees). Other spatial inputs for the debris flow model are shown in the Supplement.
Traditionally, ID thresholds are determined statistically, correlating the rainfall data with the occurrence of landslides. A relationship proposed by Caine (1980) is plotted in Fig. 9. In India, few studies have identified ID threshold for landslides in the Himalayas (Kanungo and Sharma, 2014; Mathew et al., 2014). Figure 9 also shows a few proposed threshold lines from India. Very recently, Jiang et al. (2021) defined inter-event time (IET) of rainfall episodes for debris flow early warning systems. Because of the global application of this approach, the same method is used in ISRO's experimental landslide early warning system (Mathew et al., 2014).
Since it is proven that these statistical thresholds hold a physical explanation of the initiation processes of debris flows (D'Odorico et al., 2005; Thomas et al., 2018; Berti et al., 2020), a numerical model that simulates debris flow triggering through rainfall and runoff-erosion shall be used to determine the ID thresholds. Where historical data are unavailable, these numerical simulations may be the best alternative to determine the triggering rainfall thresholds (Van Asch et al., 2014, 2018). At first, we calibrate the numerical model using the methods described above. By doing the calibration, we obtain the best-suited values for the model's parameters, shown in Table 1. At this stage, the numerical model is ready to simulate the triggering of debris flows for any precipitation intensity. Instead of determining the ID thresholds using a statistical approach, we run the numerical model with different rainfall intensities based on IMD glossary (see Figs. S9 and S10 in the Supplement) in this study. Then we estimate the duration at which a debris flow will be triggered for the area where the model is already calibrated. Then, we run 10 numerical simulations under rainfall intensities (I) ranging from 10 to 15 mm h−1, 20, 25, 30, 35, 40, 45, 50, 55, and 60 mm h−1. The duration (D) for each set of numerical simulations is observed tracking the arrival time of debris flow at the confluence. By correlating the intensity and duration derived from each set of numerical simulations, ID thresholds are established.
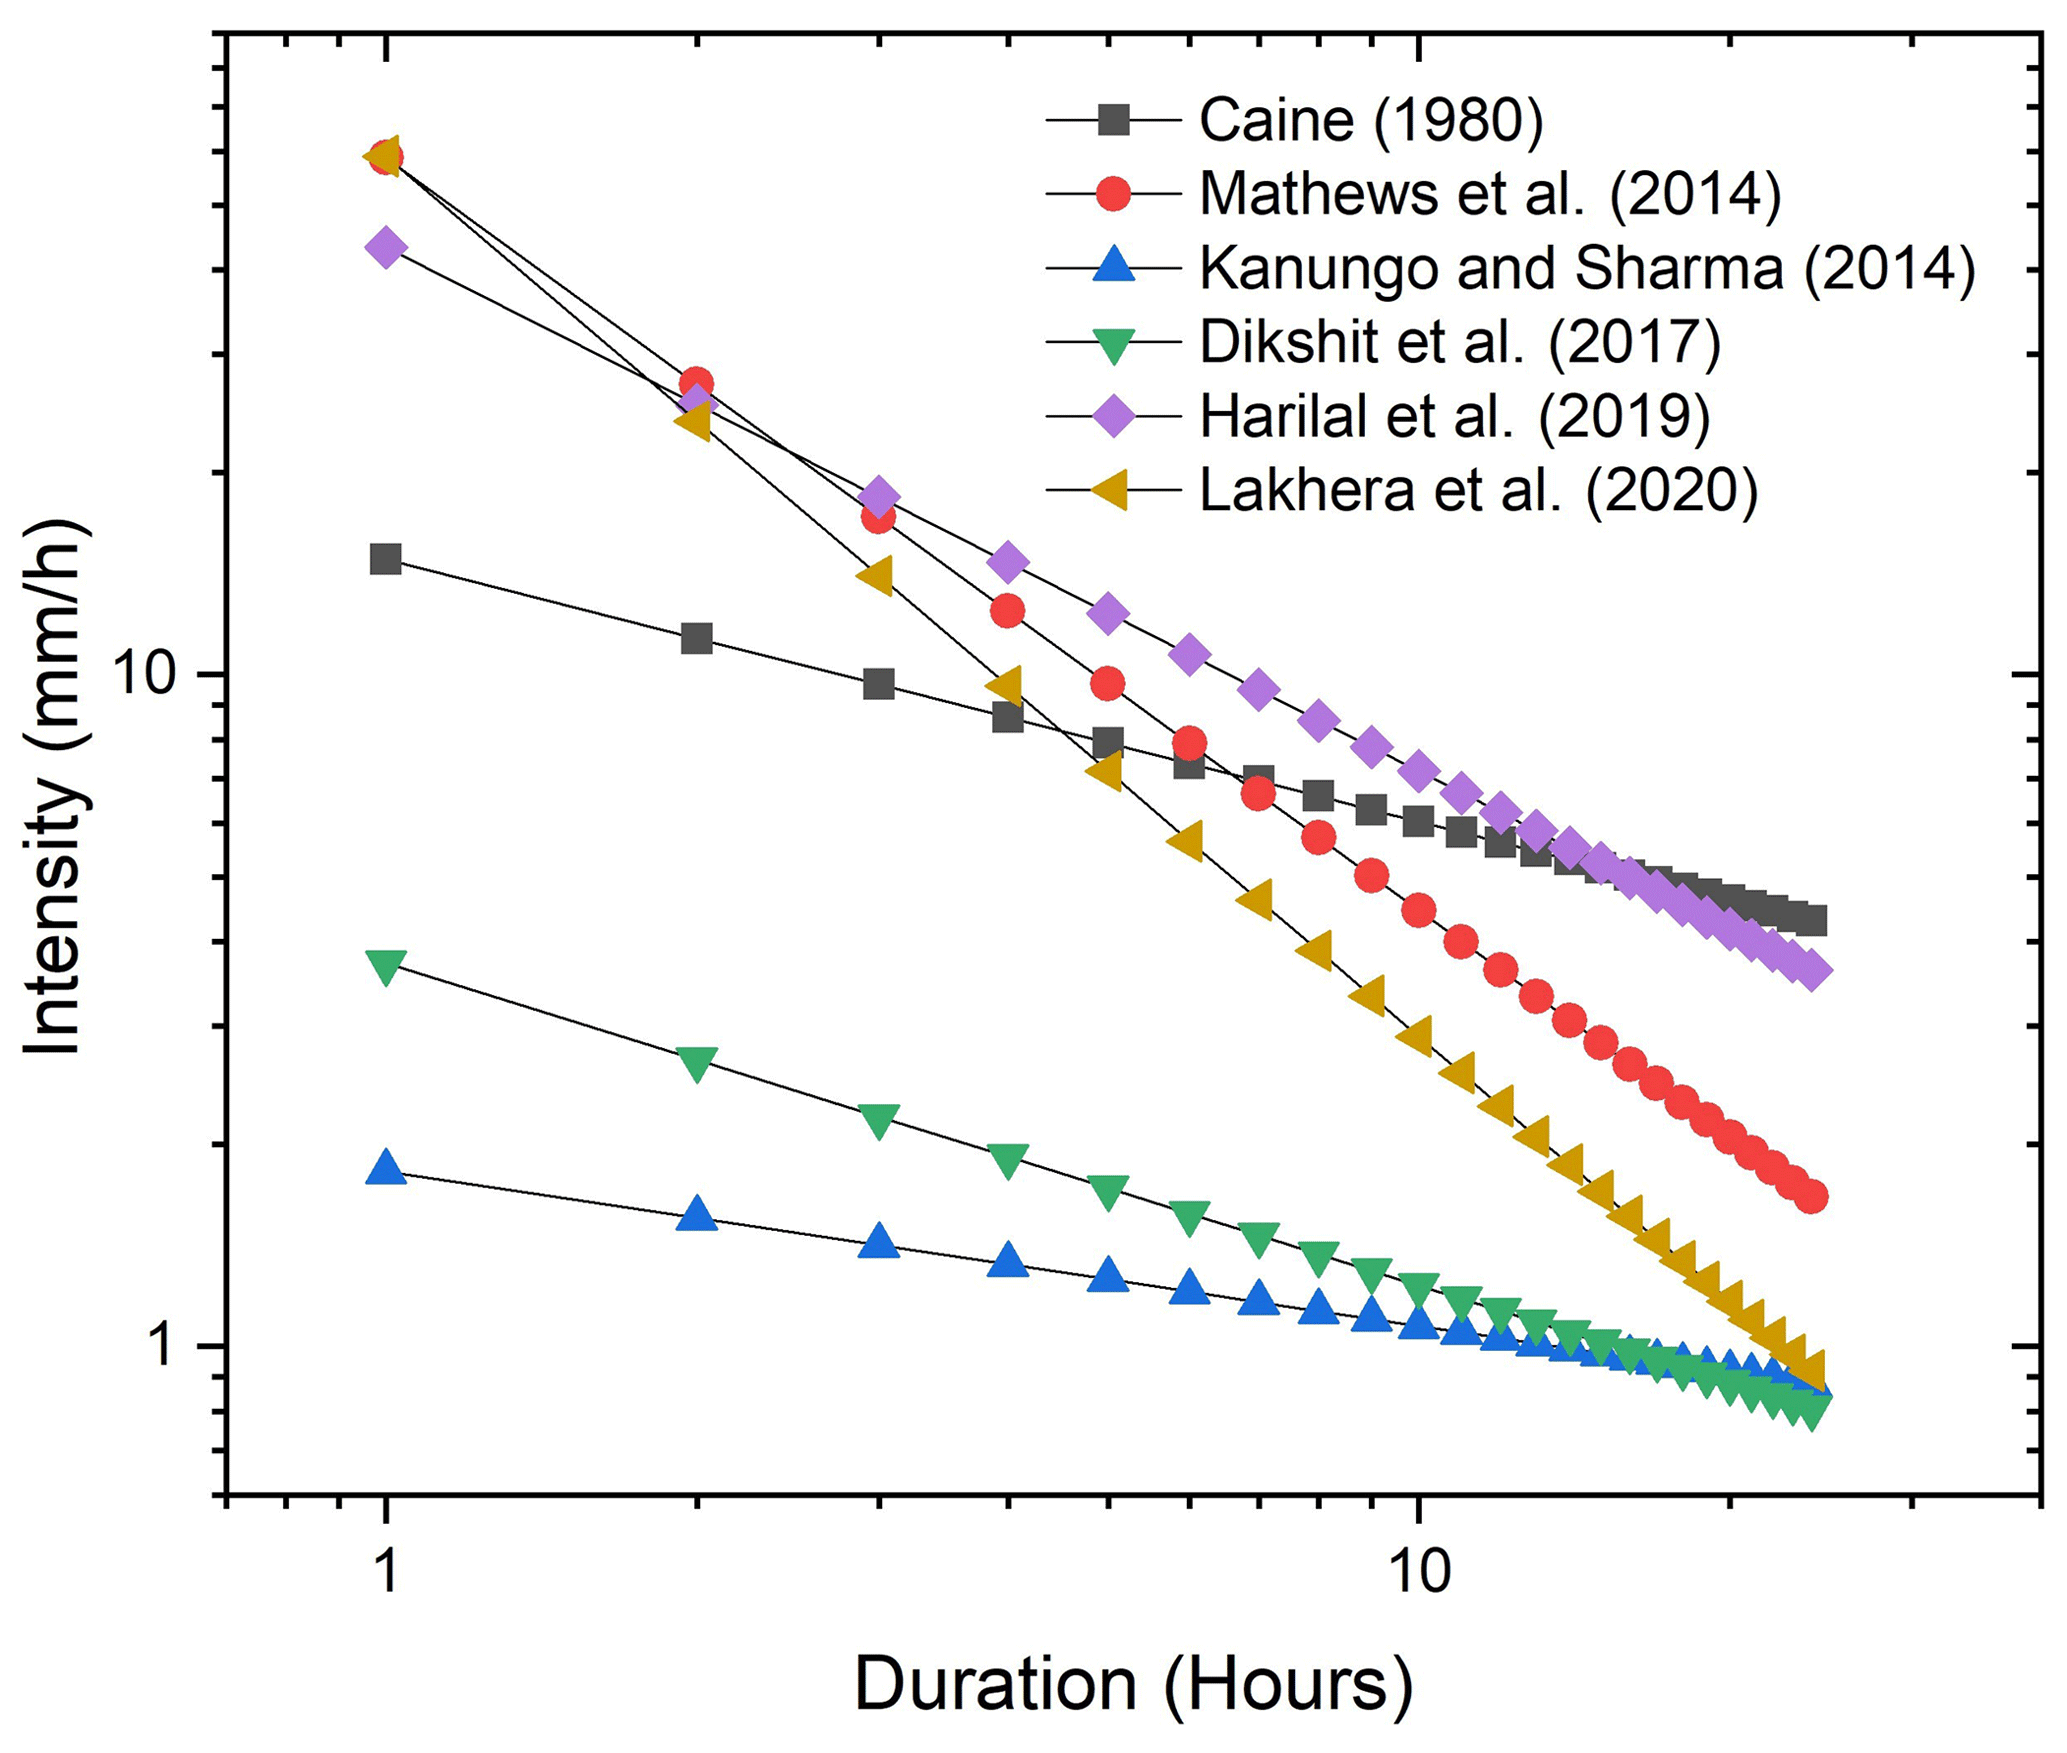
Figure 9Intensity–duration rainfall thresholds used for classifying occurrences and non-occurrences of landslides for early warning. The plot shows ID thresholds determined by various studies (Caine, 1980; Mathew et al., 2014; Dikshit et al., 2020; Lakhera et al., 2020; Kanungo and Sharma, 2014; Harilal et al., 2019).
3.4 Estimating volume of debris flows
To calibrate the numerical model, estimating the volume of debris flow is essential. Martha et al. (2015) mapped the landslide polygons of 2013 Kedarnath debris flows and estimated the area of landslides. However, no information on the volume of debris flow is available from the literature. In this study, we use an empirical formulation of debris flow volume to estimate the total volume of sediments generated during the 2013 extreme rainfall event in the Kedarnath catchment. For this, the parameters, e.g. area of the watershed, area of landslides, cumulative rainfall, and duration of rainfall, are considered following the empirical equation by Chang et al. (2011).
Here, AW is the area of the catchment (94 724 450 m2), AL is the area of the landslides (2 303 777 m2), GI is the geological index based on lithology (5) (Chang et al., 2011), D is the duration of rainfall (72 h), and CR is the cumulative rainfall for the debris flow event (646 mm). The total volume of debris flows generated during the 2013 extreme rainfall within the Kedarnath catchment is estimated as 2 320 000 m3. Here, it is not straightforward to expect an empirical equation originally developed for Taiwan to approximate debris flow volume in the Himalayas reasonably. However, the empirical equation proposed by Chang et al. (2011) accounts for different lithology, rainfall intensity, duration, and catchment characteristics, i.e. area of the watershed to estimate the volume of debris flows generated during extreme rainfall events. As discussed by Chang et al. (2011), the equation shall be applied to other areas having debris flows generated by extreme rainfall. In addition, Marchi and D'Agostino (2004) suggest that the debris flow sediment volume does not possess a strong sensitivity to the lithology. Rickenmann and Koschni (2010) suggest that the volume of sediments during debris flows is strongly affected by the flood volume, i.e. runoff and catchment characteristics. Considering these advantages, in this study, the debris flow volume is estimated using the empirical equation given by Chang et al. (2011), and it seemed appropriate to use in the Himalayas.
The rainfall data obtained from the WRF model are cumulated to daily time steps and compared with the data from IMD, as shown in Fig. 6. Figure 6a shows the difference in daily rainfall at four locations (blue triangles in Fig. 1) between the WRF model and IMD data. It is observed that the rainfall difference is not substantial from 9 to 14 June 2013 but increases significantly during the days of heavy rain on 15, 16, and 17 June 2013. A similar trend is also observed from the interpretation of Fig. 6b. The hourly time series of rainfall from WRF compared with the GSMaP data Fig. 7a, b, and c shows an overestimation of WRF rainfall. However, the trend of the rainfall simulated by WRF agrees with the satellite data in Fig. 7b and c. Considering the coarse resolution of satellite data, the WRF model shall be used to discretely obtain rainfall intensity–duration thresholds of debris flows in data-scarce regions.
The estimated volume of debris flow based on the empirical equation by Chang et al. (2011) is 2 320 000 m3. The debris flow volume as computed by the numerical simulation is 2 820 000 m3 (see Fig. 10). This value is the closest to the empirical estimation achieved by the numerical model after performing rigorous parametric simulations considering a range of values for the parameters d50, δe, and δd. For validation, the debris flow extents obtained from the numerical analysis are superimposed over the debris flow polygons mapped by Martha et al. (2015) (see Fig. 10a). We statistically evaluated the spatial accuracy of debris flow inundation, comparing it with the inventory. The model correctly classifies the debris flow areas and non-debris flow areas as about 63.3 %, whereas the model incorrectly classifies the debris flow and non-debris flow areas as about 36.7 %. Most of these false positives are spread over hillslopes away from river channels. This could be due to the different debris flow mechanisms, i.e. distinguishing hillslope-originated debris flows vs. runoff-generated debris flows (Iverson et al., 1997; Kean et al., 2013; Tang et al., 2019), which the model did not simulate satisfactorily. The model’s accuracy is 63 %. Cohen's κ of the prediction is 0.26, which is a fair agreement (McHugh, 2012). Please see more details of the accuracy assessment in the Supplement.
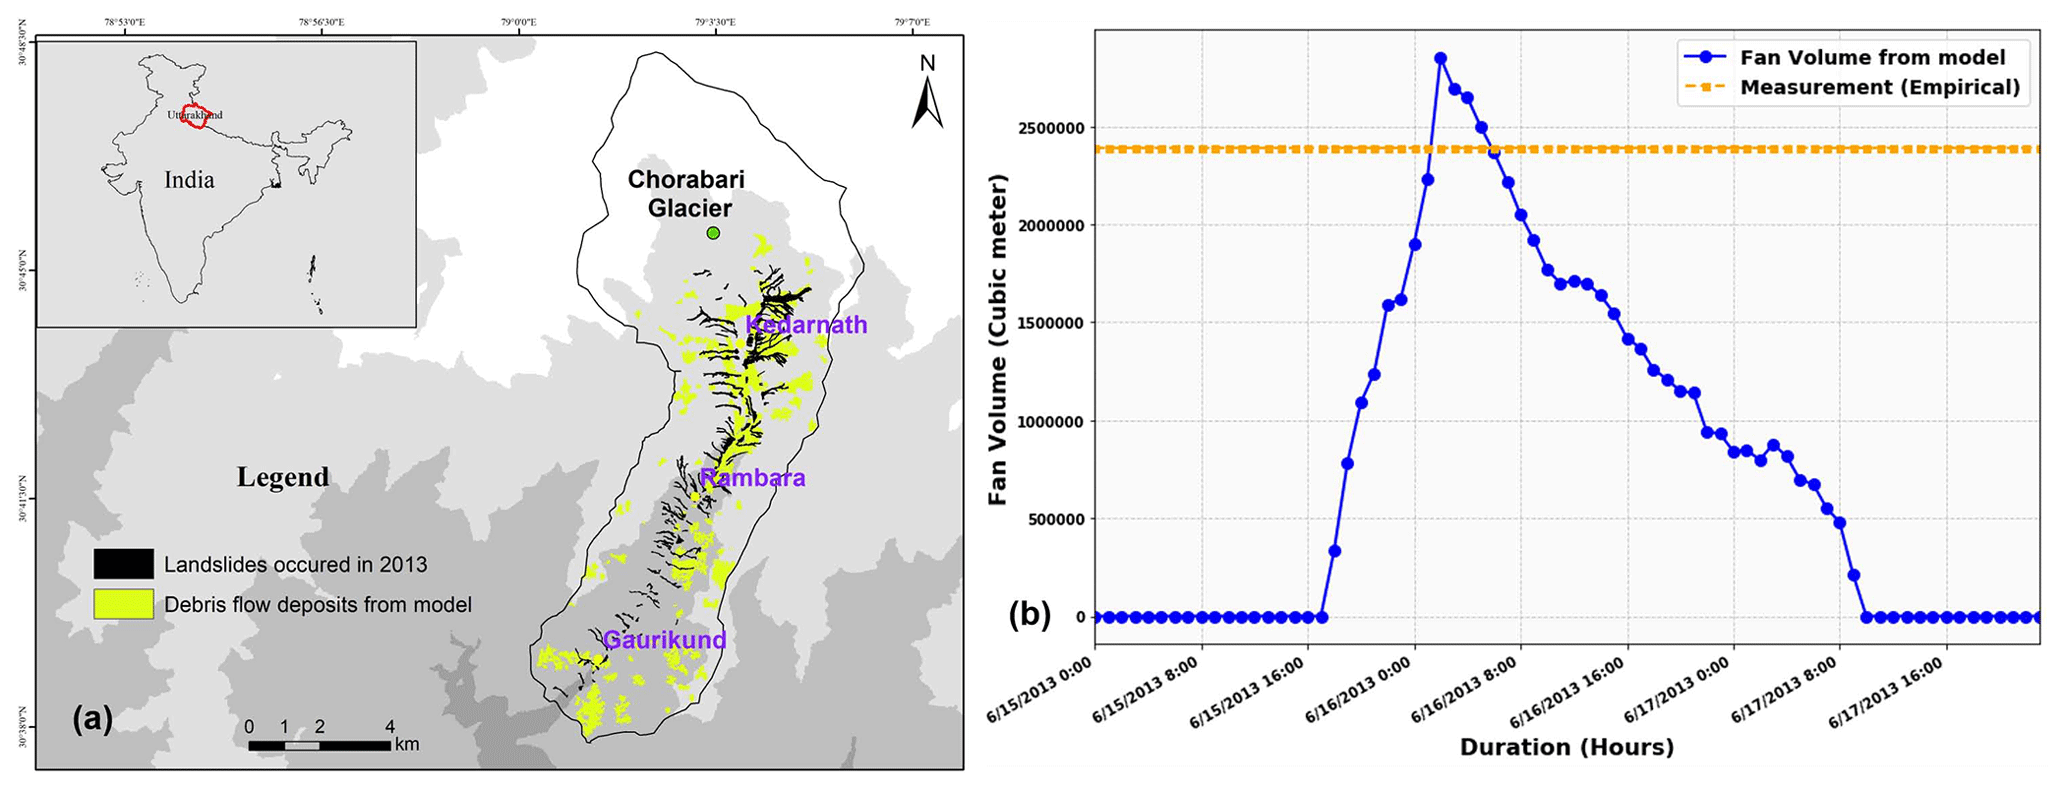
Figure 10(a) Debris flow extents obtained from the numerical analysis are superimposed over the debris flow polygons mapped by Martha et al. (2015) and (b) numerically estimated debris flow volume compared with empirical estimation.
The major devastation in Kedarnath occurred on 16 June 2013, as per sources (Champati Ray et al., 2016; Dobhal et al., 2013). The triggering of the largest debris flow that caused the outburst from the Chorabari glacial lake occurred on 16 June 2013 (Martha et al., 2015). Champati Ray et al. (2016) also identified that the major debris flow and reactivated landslides occurred on 16 June 2013. The numerical model results shown in Fig. 10b show the largest volume of debris flow to occur on 16 June 2013 and then the sediment to move further downstream. With these agreements in the volume and timing of debris flows from the model and actual scenario, the model shall be considered calibrated for the 2013 rainfall-induced debris flows.
From the parametric numerical simulations performed to identify the intensity–duration thresholds of debris flows in Kedarnath, it is found that debris flows occur under all eight rainfall intensities except for 10 mm h−1 and 15 mm h−1 based on the results of numerical simulations. Figure 12 shows the ID thresholds plotted in a 2D plane from all the eight numerical simulations. The difference in the arrival of debris flows under constant rainfall intensities is shown in Fig. 11. It is observed that the duration of rainfall needed to trigger the debris flow decreases as the intensity of rainfall increases because higher intensities of rainfall trigger debris flows quickly. For a given rainfall intensity (I, in mm h−1), the duration at which the debris flow arrives at the confluence of the river is considered D (hours). Through this analysis, an ID threshold is obtained for the debris flow event using the material parameters similar to the calibration of the numerical model (see Fig. 12). The ID threshold shown in Fig. 12 is fitted using Eq. (3) with α and β being 33.96 and −0.47 respectively.
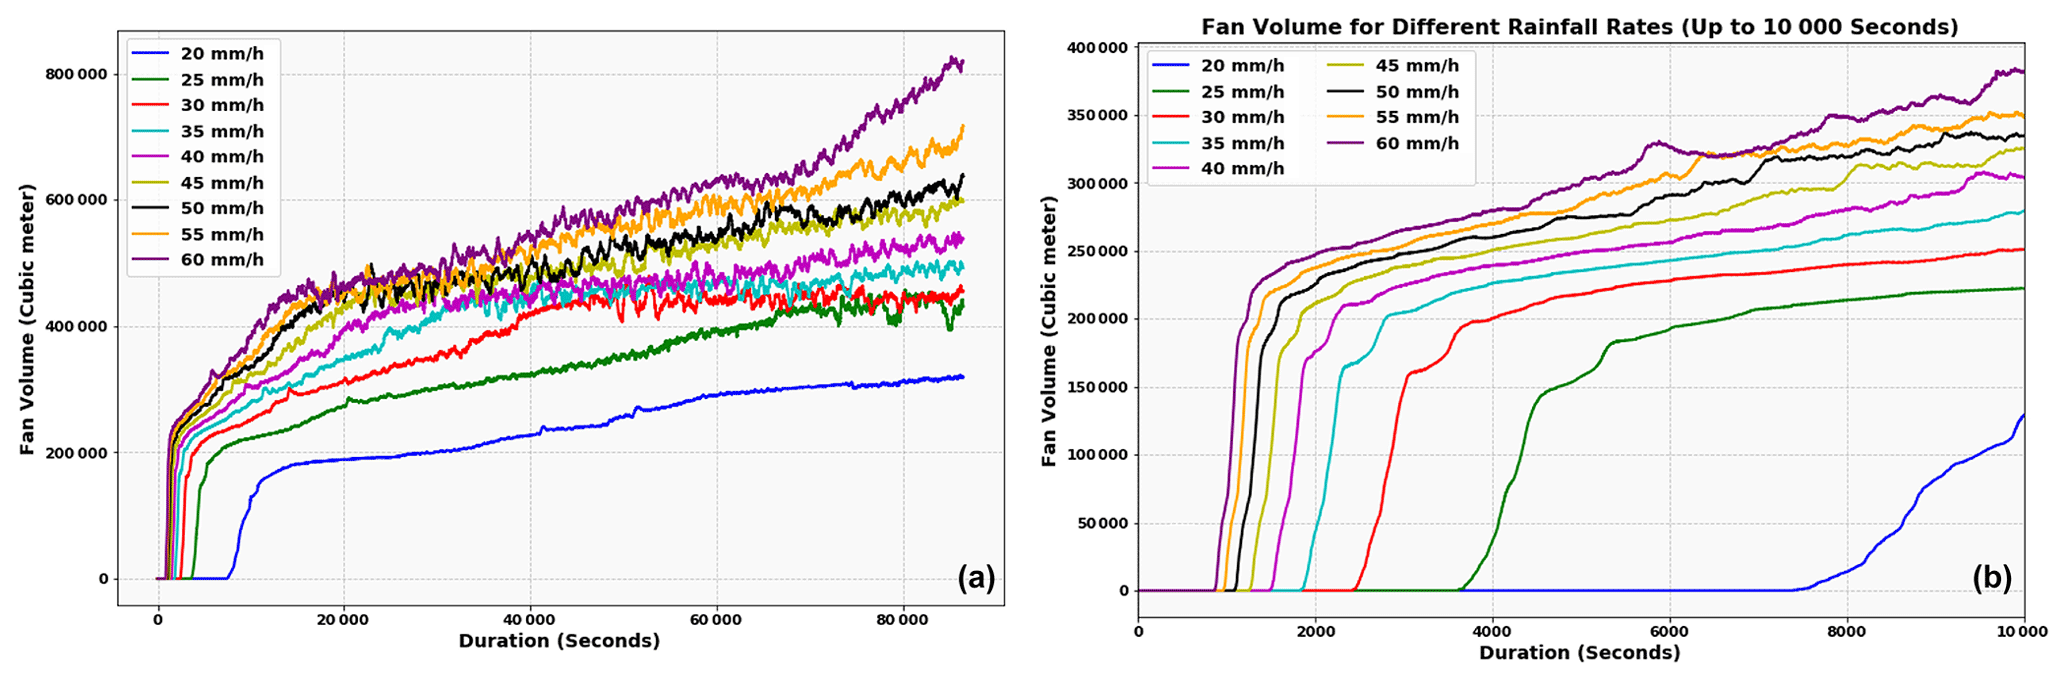
Figure 11Initiation of debris flows in response to various constant rainfall intensities from 20 to 60 mm h−1. (a) Plot showing comparison of debris flow fan volumes generated by various rainfall intensities up to a duration of 86 400 s = 24 h and (b) magnified view of Fig. 11a up to 10 000 s duration.
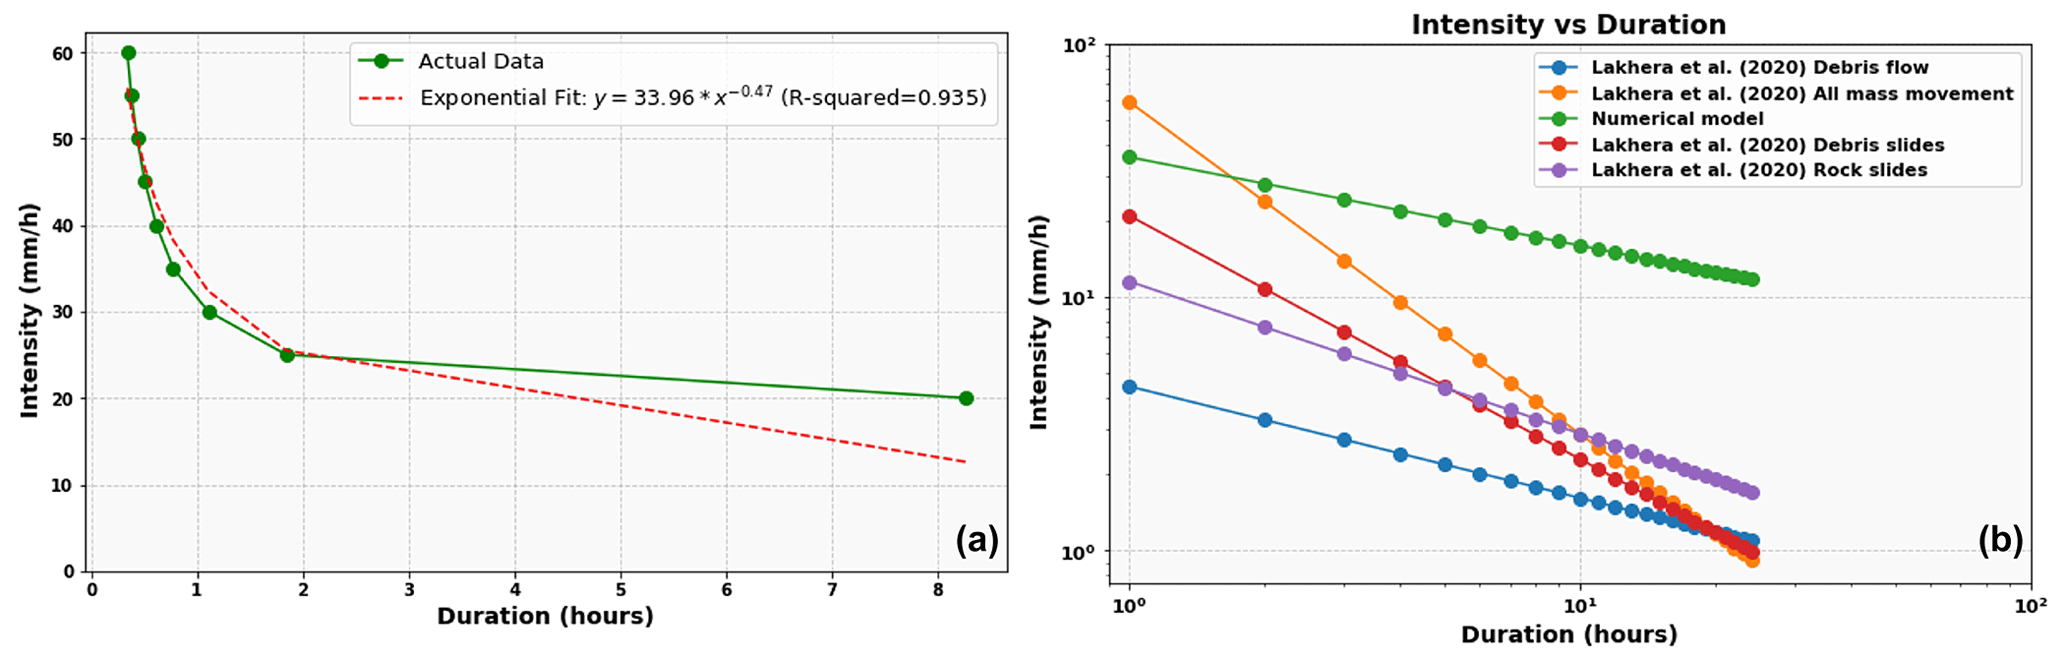
Figure 12Numerical model derived intensity duration threshold for early warning of debris flows in Kedarnath catchment. (a) ID curve compared with Lakhera et al. (2020) and (b) ID curves and comparison plotted in log–log plot.
5.1 Rainfall intensity–duration thresholds for landslides in the Himalayas
Berti et al. (2020) clarified the physical significance of the ID threshold relationship for runoff-induced debris flows. In India, studies that determine the intensity and duration of triggering rainfall for landslides, particularly in the Himalayas (Dikshit et al., 2020; Teja et al., 2019; Kundalia et al., 2009; Kanungo and Sharma, 2014) are available. The use of daily, 3 d, and 15 d cumulative rainfall for threshold determination is a major similarity between these studies. The cumulative thresholds could help predict or forecast rainfall-induced shallow landslides. However, for debris flows, the thresholds must be determined using hourly rainfall data. This is due to the fact that runoff-induced erosion occurs during extreme rainfall events that last only a few hours, like in Kedarnath. Though the rainfall was continuous for 3 d, the debris flow episodes lasted only between 3–4 h (Champati Ray et al., 2016). Te-LEWSs for debris flows in the United States, Italy, and Japan also use hourly rainfall data to forecast the ID thresholds of landslides (Godt et al., 2006; Guzzetti et al., 2008; Mirus et al., 2018; Guzzetti et al., 2020; Piciullo et al., 2018; Baum and Godt, 2010; Osanai et al., 2010; Ju et al., 2020; Alfieri et al., 2012). These countries also use radar-based rainfall forecasts to help predict precipitation magnitudes 6 h in advance. However, in India, where such radar-based forecasts are yet to be available, using WRF models is unavoidable and prudent.
In India, the authors have found studies that consider the sub-daily rainfall as a threshold (Lakhera, 2015; Lakhera et al., 2020). We preferably compare the ID thresholds obtained from the numerical model with the results of Lakhera et al. (2020) (see Fig. 12b). It is seen that the thresholds estimated in this study are higher than all the thresholds estimated by Lakhera et al. (2020). The possible reason for the higher magnitude of thresholds could be due to the nature of the debris present in the Kedarnath catchment, and these thresholds correspond to only extreme rainfall events, whereas the thresholds considered by previous studies incorporate landslides from different catchments. The divergence in ID thresholds between our numerical model and the study by previous work underscores the nuanced nature of rainfall-induced debris flows, influenced by regional variations. The higher thresholds identified in our study for the Kedarnath catchment might be indicative of its distinct characteristics, emphasizing the importance of tailoring threshold analyses to the specific geological and hydrological attributes of the study area.
5.2 Limitations of the study
This study uses a hydrological model to simulate debris flow dynamics from hourly rainfall. The model considers moisture-content-dependent seepage through the unsaturated debris, runoff, and overland flow based on Horton's equation, erosion based on critical thresholds, and debris flow deposition based on sediment concentrations. The following are the study's few limitations. The model uses an open-source DEM with a resolution of 12.5 m. The effect of DEM resolution on debris flow routing is not considered. However, Boreggio et al. (2018) found that re-sampling the DEM to a finer resolution had no significant effect on the model results, but this was not considered in this study. This study's erosion equation is a simplified representation of various erosion mechanisms occurring over loose material deposits in the hillslopes and in the channel (Iverson et al., 1997). The numerical model for debris flows that we used and developed in this study is a single-phase flow dynamic model compared to models that use a two-phase flow assumption (Pudasaini, 2012; Bout et al., 2018). Through a digital elevation model, it simulates debris flow dynamics from rainfall, runoff, erosion, and deposition of debris flow. An infinite slope model underpins the stability theory. This study's numerical modelling strategy has several limitations due to the simplified numerical approaches and empirical equations. It is possible to introduce more robust erosion modules to simulate the processes in channel systems (Egashira et al., 2001; Berti and Simoni, 2005; Medina et al., 2008; Quan Luna et al., 2011). However, this needs extensive fieldwork and instrumentation of advanced monitoring systems, which may be possible in future studies. In future works, we aim to establish an in situ monitoring system in the Kedarnath valley to understand the controlling factors and dynamics of debris flows in the Himalayas. This study has explored the use of numerical modelling to derive the ID threshold for debris flow early warning using the 2013 Kedarnath disaster despite the above limitations.
Rainfall-induced debris flows are catastrophic geohazards that multiply in number during intense rainfall events. Rainfall intensity–duration (ID) thresholds are used in early warning systems for shallow landslides and debris flows at the territorial scale. In India, Te-LEWSs have trouble predicting and correlating sub-daily time series of weather for landslides in the Himalayas because of instrumental and operational difficulties.
In conclusion, this study aims to contribute a thoughtful framework to address the challenges faced by Te-LEWSs in predicting rain-induced debris flows in the Himalayas. By integrating a spatio-temporal numerical model with the WRF model, we aim to offer a practical solution within existing operational constraints. Our approach involves careful model calibration using data from the 2013 landslides in Uttarakhand, India. This calibration serves as a grounding mechanism that tries to align the model with the unique geological characteristics of the region. A subsequent validation process that compares our trigger intensity–duration (ID) thresholds with established findings from the literature modestly confirms the reliability of our model in a specific context. Using the WRF model at 1.8 km × 1.8 km resolution improves our ability to analyse hourly precipitation patterns and provides a finer understanding of the temporal dynamics. Our survey of constant rainfall intensities (ranging from 20 to 60 mm h−1) modestly confirms our established thresholds against earlier research findings for Uttarakhand. In an attempt to address the challenges faced by Te-LEWSs, our integration of the WRF model into an early warning system based on ID rainfall thresholds has a potential for improved forecasts. While we acknowledge the limitations of our study, particularly with respect to the inherent uncertainties in weather forecasting and changing terrain conditions, we hope that our approach will make a modest contribution to the ongoing discussion on increasing the effectiveness of early warning systems for rainfall-induced debris flows. As we conclude, we recognize the ever-evolving nature of meteorological and numerical modelling and their application to landslide early warning. This study may pave the way for further refinements and applications of Te-LEWSs in various geological settings.
The spatio-temporal numerical model for debris flows developed and used in this study is publicly available together with the datasets for modelling and analysis. It can be accessed from our GitHub repository: https://github.com/srikrishnan-ss/aschpeired.git (last access: 5 February 2024; DOI: https://doi.org/10.5281/zenodo.10616760, Subramanian and Dixit, 2024).
The supplement related to this article is available online at: https://doi.org/10.5194/nhess-24-465-2024-supplement.
SD performed the revised analysis, post-processed the numerical model outputs, prepared the plots, and contributed to the revised design of this study. SSS designed the study and performed the debris flow numerical modelling and ID threshold analysis. SD and SSS contributed equally. PS performed the Weather Research and Forecast (WRF) model analysis. APY performed the debris flow volume calculation and contributed to the design of this study. TRM prepared the landslide inventory. SS provided the required precipitation datasets. All the authors have contributed to the writing of this manuscript.
The contact author has declared that none of the authors has any competing interests.
Publisher’s note: Copernicus Publications remains neutral with regard to jurisdictional claims made in the text, published maps, institutional affiliations, or any other geographical representation in this paper. While Copernicus Publications makes every effort to include appropriate place names, the final responsibility lies with the authors.
This article is part of the special issue “Estimating and predicting natural hazards and vulnerabilities in the Himalayan region”. It is not associated with a conference.
The authors sincerely acknowledge the Indian Institute of Remote Sensing (IIRS), Indian Space Research Organisation (ISRO), for grant-in-aid support through a research project under the Disaster Management Support Program (ISRO-DMSP) grant nos. IIRS/DO/DMSP-ASCB/AS/2022/01 and IIR-1902-DMC/22-23. The authors thank Akshat Vashistha and Manish Dewrari, Centre of Excellence in Disaster Mitigation and Management (CoEDMM), IIT Roorkee, for their assistance during fieldwork in Kedarnath. The authors acknowledge the help of Rajendra Singh Rawat and Anandu P, CoEDMM IIT Roorkee, in post-processing the WRF model outputs. Anamika Sekar and Shivani Joshi, CoEDMM IIT Roorkee, are thanked for help in processing some figures. The corresponding author sincerely acknowledges the late Theo van Asch for his time and insightful discussions during the course of development and programming of the debris flow numerical model. All authors pay tribute to the late Theo van Asch for his contributions in research on landslides and debris flows in particular. The authors sincerely thank the reviewers of this article for providing critical and constructive comments, which helped to improve the quality.
This research has been supported by the Indian Space Research Organisation (grant nos. IIRS/DO/DMSP-ASCB/AS/2022/01 and IIR-1902-DMC/22-23).
This paper was edited by Ugur Ozturk and reviewed by four anonymous referees.
Alfieri, L., Salamon, P., Pappenberger, F., Wetterhall, F., and Thielen, J.: Operational early warning systems for water-related hazards in Europe, Environ. Sci. Policy, 21, 35–49, 2012. a, b
Allen, S. K., Rastner, P., Arora, M., Huggel, C., and Stoffel, M.: Lake outburst and debris flow disaster at Kedarnath, June 2013: hydrometeorological triggering and topographic predisposition, Landslides, 13, 1479–1491, 2016. a
Baum, R. L. and Godt, J. W.: Early warning of rainfall-induced shallow landslides and debris flows in the USA, Landslides, 7, 259–272, 2010. a, b
Berti, M. and Simoni, A.: Experimental evidences and numerical modelling of debris flow initiated by channel runoff, Landslides, 2, 171–182, 2005. a
Berti, M., Bernard, M., Gregoretti, C., and Simoni, A.: Physical interpretation of rainfall thresholds for runoff-generated debris flows, J. Geophys. Res.-Earth, 125, e2019JF005513, https://doi.org/10.1029/2019JF005513, 2020. a, b
Bhandari, R. K.: Slope Instability in the Fragile Himalaya and Strategy for Development, Ninth Indian Geotechnical Society Annual Lecture, Indian Geotechnical Journal, 1, 275–325, https://www.igs.org.in/storage/annual-lecture/annual-lecture-1986-180523064435.pdf (last access: 19 June 2023), 1987. a
Bhandari R. K.: The Indian Landslide Scenario, Strategic Issues and Action Points, A Key Note address – Technical Session on Landslides, First India Disaster Management Congress, New Delhi, 29-30 November 2006, https://citeseerx.ist.psu.edu/document?repid=rep1&type=pdf&doi=36d99ab60f5a56be73f3a0105c34e21da47e5841 (last access: 20 April 2023), 2006. a
Bharti, V., Singh, C., Ettema, J., and Turkington, T.: Spatiotemporal characteristics of extreme rainfall events over the Northwest Himalaya using satellite data, Int. J. Climatol., 36, 3949–3962, 2016. a
Bharwad, D.: Space Technology Based Disaster Management and Its Societal Implications, in: 1st International Conference on Remote Sensing for Disaster Management 2017, held in Visakhapatnam, Andhra Pradesh, India on 11–13 October 2017, Springer, 493–501, https://doi.org/10.1007/978-3-319-77276-9_44, 2019. a
Bogaard, T. and Greco, R.: Invited perspectives: Hydrological perspectives on precipitation intensity-duration thresholds for landslide initiation: proposing hydro-meteorological thresholds, Nat. Hazards Earth Syst. Sci., 18, 31–39, https://doi.org/10.5194/nhess-18-31-2018, 2018. a
Boreggio, M., Bernard, M., and Gregoretti, C.: Evaluating the differences of gridding techniques for Digital Elevation Models generation and their influence on the modeling of stony debris flows routing: A case study from Rovina di Cancia basin (North-eastern Italian Alps), Front. Earth Sci., 6, 89, https://doi.org/10.3389/feart.2018.00089, 2018. a
Bout, B., Lombardo, L., van Westen, C. J., and Jetten, V. G.: Integration of two-phase solid fluid equations in a catchment model for flashfloods, debris flows and shallow slope failures, Environ. Modell. Softw., 105, 1–16, https://doi.org/10.1016/j.envsoft.2018.03.017, 2018. a
Brunetti, M. T., Peruccacci, S., Rossi, M., Luciani, S., Valigi, D., and Guzzetti, F.: Rainfall thresholds for the possible occurrence of landslides in Italy, Nat. Hazards Earth Syst. Sci., 10, 447–458, https://doi.org/10.5194/nhess-10-447-2010, 2010. a
Caine, N.: The rainfall intensity-duration control of shallow landslides and debris flows, Geografiska annaler: series A, Phys. Geogr., 62, 23–27, 1980. a, b, c
Cannon, S. H. and DeGraff, J.: The increasing wildfire and post-fire debris-flow threat in western USA, and implications for consequences of climate change, in: Landslides–disaster risk reduction, Springer, 177–190, https://doi.org/10.1007/978-3-540-69970-5_9, 2009. a
Champati Ray, P., Chattoraj, S. L., Bisht, M., Kannaujiya, S., Pandey, K., and Goswami, A.: Kedarnath disaster 2013: causes and consequences using remote sensing inputs, Nat. Hazards, 81, 227–243, 2016. a, b, c, d
Chang, C.-W., Lin, P.-S., and Tsai, C.-L.: Estimation of sediment volume of debris flow caused by extreme rainfall in Taiwan, Eng. Geol., 123, 83–90, 2011. a, b, c, d, e, f
Chevuturi, A. and Dimri, A.: Investigation of Uttarakhand (India) disaster-2013 using weather research and forecasting model, Nat. Hazards, 82, 1703–1726, 2016. a
Dash, S. and Maity, R.: Revealing alarming changes in spatial coverage of joint hot and wet extremes across India, Scientific Reports, 11, 18031, https://doi.org/10.1038/s41598-021-97601-z, 2021. a
De Moura, C. A. and Kubrusly, C. S.: The Courant–Friedrichs–Lewy (CFL) condition, AMC, 10, 45–90, https://doi.org/10.1007/978-0-8176-8394-8, 2013. a
Destro, E., Marra, F., Nikolopoulos, E. I., Zoccatelli, D., Creutin, J. D., and Borga, M.: Spatial estimation of debris flows-triggering rainfall and its dependence on rainfall return period, Geomorphology, 278, 269–279, 2017. a
Dikshit, A., Sarkar, R., Pradhan, B., Segoni, S., and Alamri, A. M.: Rainfall induced landslide studies in Indian Himalayan region: a critical review, Applied Sciences, 10, 2466, https://doi.org/10.3390/app10072466, 2020. a, b
Dobhal, D. P., Gupta, A., Manish, M., Khandelwal, D. D.: Kedarnath disaster: Facts and plausible causes, Current Science, 105, 171–174, 2013. a, b
D'Odorico, P., Fagherazzi, S., and Rigon, R.: Potential for landsliding: Dependence on hyetograph characteristics, J. Geophys. Res.-Earth, 110, F01007, https://doi.org/10.1029/2004JF000127, 2005. a
Domènech, G., Fan, X., Scaringi, G., van Asch, T. W., Xu, Q., Huang, R., and Hales, T. C.: Modelling the role of material depletion, grain coarsening and revegetation in debris flow occurrences after the 2008 Wenchuan earthquake, Eng. Geol., 250, 34–44, 2019. a, b
Dube, A., Ashrit, R., Ashish, A., Sharma, K., Iyengar, G., Rajagopal, E., and Basu, S.: Forecasting the heavy rainfall during Himalayan flooding – June 2013, Weather and Climate Extremes, 4, 22–34, 2014. a
Egashira, S., Itoh, T., and Takeuchi, H.: Transition mechanism of debris flows over rigid bed to over erodible bed, Phys. Chem. Earth Pt. B, 26, 169–174, 2001. a
Fan, X., Scaringi, G., Korup, O., West, A. J., van Westen, C. J., Tanyas, H., Hovius, N., Hales, T. C., Jibson, R. W., Allstadt, K. E., Zhang, L., Evans, S. G., Xu, C., Li, G., Pei, X., Xu, Q., and Huang, R.: Earthquake-induced chains of geologic hazards: Patterns, mechanisms, and impacts, Rev. Geophys., 57, 421–503, 2019. a
Field, C. B., Barros, V., Stocker, T. F., and Dahe, Q.: Managing the risks of extreme events and disasters to advance climate change adaptation: special report of the intergovernmental panel on climate change, Cambridge University Press, Hardback ISBN 978-1-107-02506-6, Paperback ISBN 978-1-107-60780-4, 2012. a
Gariano, S. L., Melillo, M., Brunetti, M. T., Kumar, S., Mathiyalagan, R., and Peruccacci, S.: Challenges in defining frequentist rainfall thresholds to be implemented in a landslide early warning system in India, in: Progress in Landslide Research and Technology, Volume 1, Issue 1, Springer, 409–416, https://doi.org/10.1007/978-3-031-16898-7_27, 2023. a, b
Godt, J. W., Baum, R. L., and Chleborad, A. F.: Rainfall characteristics for shallow landsliding in Seattle, Washington, USA, Earth Surf. Proc. Landf., 31, 97–110, 2006. a
Guzzetti, F., Peruccacci, S., Rossi, M., and Stark, C. P.: The rainfall intensity–duration control of shallow landslides and debris flows: an update, Landslides, 5, 3–17, 2008. a, b
Guzzetti, F., Gariano, S. L., Peruccacci, S., Brunetti, M. T., Marchesini, I., Rossi, M., and Melillo, M.: Geographical landslide early warning systems, Earth-Sci. Rev., 200, 102973, https://doi.org/10.1016/j.earscirev.2019.102973, 2020. a, b, c
Harilal, G. T., Madhu, D., Ramesh, M. V., and Pullarkatt, D.: Towards establishing rainfall thresholds for a real-time landslide early warning system in Sikkim, India, Landslides, 16, 2395–2408, 2019. a
Hengl, T., Mendes de Jesus, J., Heuvelink, G. B., Ruiperez Gonzalez, M., Kilibarda, M., Blagotić, A., Shangguan, W., Wright, M. N., Geng, X., Bauer-Marschallinger, B., Guevara, M. A., Vargas, R., MacMillan, R. A., Batjes, N. H., Leenaars, J. G. B., Ribeiro, E., Wheeler, I., Mantel, S., and Kempen, B.: SoilGrids250m: Global gridded soil information based on machine learning, PLoS one, 12, e0169748, https://doi.org/10.1371/journal.pone.0169748, 2017. a
Huebl, J. and Fiebiger, G.: Debris-flow mitigation measures, in: Debris-flow hazards and related phenomena, Springer, 445–487, https://doi.org/10.1007/3-540-27129-5_18, 2005. a
Hürlimann, M., Coviello, V., Bel, C., Guo, X., Berti, M., Graf, C., Hübl, J., Miyata, S., Smith, J. B., and Yin, H.-Y.: Debris-flow monitoring and warning: Review and examples, Earth-Sci. Rev., 199, 102981, https://doi.org/10.1016/j.earscirev.2019.102981, 2019. a, b
Iadanza, C., Trigila, A., and Napolitano, F.: Identification and characterization of rainfall events responsible for triggering of debris flows and shallow landslides, J. Hydrol., 541, 230–245, 2016. a
Intrieri, E., Gigli, G., Casagli, N., and Nadim, F.: Brief communication “Landslide Early Warning System: toolbox and general concepts”, Nat. Hazards Earth Syst. Sci., 13, 85–90, https://doi.org/10.5194/nhess-13-85-2013, 2013. a, b
Iverson, R. M., Reid, M. E., and LaHusen, R. G.: Debris-flow mobilization from landslides, Annu. Rev. Earth Pl. Sc., 25, 85–138, 1997. a, b
Jayaraman, V.: Space Based Disaster Risk Reduction: Indian Framework & Perspectives, Executives Development Programme (EDP), Space Applications Centre, Ahmedabad, 1–17, https://doi.org/10.13140/2.1.3759.6160, 2013. a
Jiang, Z., Fan, X., Subramanian, S. S., Yang, F., Tang, R., Xu, Q., and Huang, R.: Probabilistic rainfall thresholds for debris flows occurred after the Wenchuan earthquake using a Bayesian technique, Eng. Geol., 280, 105965, https://doi.org/10.1016/j.enggeo.2020.105965, 2021. a
Ju, N., Huang, J., He, C., Van Asch, T., Huang, R., Fan, X., Xu, Q., Xiao, Y., and Wang, J.: Landslide early warning, case studies from Southwest China, Eng. Geol., 279, 105917, https://doi.org/10.1016/j.enggeo.2020.105917, 2020. a, b
Kanungo, D. and Sharma, S.: Rainfall thresholds for prediction of shallow landslides around Chamoli-Joshimath region, Garhwal Himalayas, India, Landslides, 11, 629–638, 2014. a, b, c
Kean, J. W., McCoy, S. W., Tucker, G. E., Staley, D. M., and Coe, J. A.: Runoff-generated debris flows: Observations and modeling of surge initiation, magnitude, and frequency, J. Geophys. Res.-Earth, 118, 2190–2207, 2013. a
Khatri, K., Kumari, B., and Shahana, K.: ISRO’s Capabilities in Disaster Management, in: 3rd World Congress on Disaster Management, 1–8, https://www.researchgate.net/profile/Shahana-Khaleel/publication/342657614_ISRO's_Capabilities_in_Disaster_Management/links/5fb1fa6645851518fda9c617/ISROs-Capabilities-in-Disaster-Management.pdf (last access: 18 May 2023), 2017. a
Kumar, P., Shukla, B. P., Sharma, S., Kishtawal, C., and Pal, P.: A high-resolution simulation of catastrophic rainfall over Uttarakhand, India, Nat. Hazards, 80, 1119–1134, 2016. a
Kundalia, S., van Westen, C. J., and Champatiray, P.: Establishing precipitation thresholds for landslide initiation in the upper catchment of Alaknanda river, Uttarakhand, India, in: EOGC 2009: Proceedings of the 2nd international conference on earth observation for global changes, 25–29 May 2009, Chengdu, Sichuan, China, vol. 1417, 2009. a
Lagomarsino, D., Segoni, S., Fanti, R., and Catani, F.: Updating and tuning a regional-scale landslide early warning system, Landslides, 10, 91–97, 2013. a
Lakhera, S.: Precipitation Intensity–Duration Based Threshold Modelling and landslide impact assessment in Alaknanda Valley, Master's thesis, Andhra University, Visakhapatnam, https://www.iirs.gov.in/iirs/sites/default/files/StudentThesis/SHOBHANA_MTech_2013-15.pdf (last access: 20 March 2023), 2015. a
Lakhera, S., Champati Ray, P., Jaboyedoff, M., and Tiwari, H.: Establishing Soil Moisture and Rainfall Intensity-Duration Thresholds for Initiation of Mass Movements Along the National Higway-58 in the Chamoli District of Uttarakhand, in: Workshop on World Landslide Forum, Springer, 237–244, https://doi.org/10.1007/978-3-030-60311-3_27, 2020. a, b, c, d, e
Marchi, L. and D'Agostino, V.: Estimation of debris-flow magnitude in the Eastern Italian Alps, Earth Surf. Proc. Landf., 29, 207–220, 2004. a
Martha, T. R., van Westen, C. J., Kerle, N., Jetten, V., and Kumar, K. V.: Landslide hazard and risk assessment using semi-automatically created landslide inventories, Geomorphology, 184, 139–150, 2013. a
Martha, T. R., Roy, P., Govindharaj, K. B., Kumar, K. V., Diwakar, P., and Dadhwal, V.: Landslides triggered by the June 2013 extreme rainfall event in parts of Uttarakhand state, India, Landslides, 12, 135–146, 2015. a, b, c, d, e, f, g, h
Mathew, J., Babu, D. G., Kundu, S., Kumar, K. V., and Pant, C.: Integrating intensity–duration-based rainfall threshold and antecedent rainfall-based probability estimate towards generating early warning for rainfall-induced landslides in parts of the Garhwal Himalaya, India, Landslides, 11, 575–588, 2014. a, b, c, d, e
McHugh, M. L.: Interrater reliability: the kappa statistic, Biochem. Medica, 22, 276–282, 2012. a
Medina, V., Hürlimann, M., and Bateman, A.: Application of FLATModel, a 2D finite volume code, to debris flows in the northeastern part of the Iberian Peninsula, Landslides, 5, 127–142, 2008. a
Mirus, B. B., Becker, R. E., Baum, R. L., and Smith, J. B.: Integrating real-time subsurface hydrologic monitoring with empirical rainfall thresholds to improve landslide early warning, Landslides, 15, 1909–1919, 2018. a
Ormsby, T., Napoleon, E., Burke, R., Groessl, C., and Feaster, L.: Getting to know ArcGIS desktop: basics of ArcView, ArcEditor, and ArcInfo, ESRI, Inc., 538 pp., https://www.google.co.in/books/edition/Getting_to_Know_ArcGIS_Desktop/jLOJAUnOx90C?hl=en (last access: 18 April 2023), 2001. a
Osanai, N., Shimizu, T., Kuramoto, K., Kojima, S., and Noro, T.: Japanese early-warning for debris flows and slope failures using rainfall indices with Radial Basis Function Network, Landslides, 7, 325–338, 2010. a, b
Pan, H.-L., Jiang, Y.-J., Wang, J., and Ou, G.-Q.: Rainfall threshold calculation for debris flow early warning in areas with scarcity of data, Nat. Hazards Earth Syst. Sci., 18, 1395–1409, https://doi.org/10.5194/nhess-18-1395-2018, 2018. a
Peruccacci, S., Brunetti, M. T., Gariano, S. L., Melillo, M., Rossi, M., and Guzzetti, F.: Rainfall thresholds for possible landslide occurrence in Italy, Geomorphology, 290, 39–57, 2017. a
Piciullo, L., Calvello, M., and Cepeda, J. M.: Territorial early warning systems for rainfall-induced landslides, Earth-Sci. Rev., 179, 228–247, 2018. a, b, c
Pudasaini, S. P.: A general two-phase debris flow model, J. Geophys. Res.-Earth, 117, F03010, https://doi.org/10.1029/2011JF002186, 2012. a
Quan Luna, B., Blahut, J., van Westen, C. J., Sterlacchini, S., van Asch, T. W. J., and Akbas, S. O.: The application of numerical debris flow modelling for the generation of physical vulnerability curves, Nat. Hazards Earth Syst. Sci., 11, 2047–2060, https://doi.org/10.5194/nhess-11-2047-2011, 2011. a
Rickenmann, D. and Koschni, A.: Sediment loads due to fluvial transport and debris flows during the 2005 flood events in Switzerland, Hydrol. Process., 24, 993–1007, 2010. a
Scheevel, C. R., Baum, R. L., Mirus, B. B., and Smith, J. B.: Precipitation thresholds for landslide occurrence near Seattle, Mukilteo, and Everett, Washington, Tech. Rep., US Geological Survey, https://doi.org/10.3133/ofr20171039, 2017. a
Segoni, S., Piciullo, L., and Gariano, S. L.: A review of the recent literature on rainfall thresholds for landslide occurrence, Landslides, 15, 1483–1501, 2018. a
Shekhar, M., Pattanayak, S., Mohanty, U., Paul, S., and Kumar, M. S.: A study on the heavy rainfall event around Kedarnath area (Uttarakhand) on 16 June 2013, J. Earth Syst. Sci., 124, 1531–1544, 2015. a
Singh, R., Siingh, D., Gokani, S. A., Sreeush, M. G., Buchunde, P. S., Maurya, A. K., Singh, R. P., and Singh, A. K.: Brief Communication: Climatic, meteorological and topographical causes of the 16–17 June 2013 Kedarnath (India) natural disaster event, Nat. Hazards Earth Syst. Sci., 15, 1597–1601, https://doi.org/10.5194/nhess-15-1597-2015, 2015. a
Siva Subramanian, S., Fan, X., Yunus, A., Van Asch, T., Scaringi, G., Xu, Q., Dai, L., Ishikawa, T., and Huang, R.: A sequentially coupled catchment-scale numerical model for snowmelt-induced soil slope instabilities, J. Geophys. Res.-Earth, 125, e2019JF005468, https://doi.org/10.1029/2019JF005468, 2020. a, b, c
Siva Subramanian, S., Yunus, A. P., Jasin, F., Abraham, M. T., Sathyam, N., van Asch, T., and Bhatia, U.: Mechanisms of initiation, runout, and rainfall thresholds of extreme-precipitation-induced Debris flows, Research Square, https://doi.org/10.21203/rs.3.rs-941010/v1, 2021. a, b, c, d, e, f
Skamarock, W. C., Klemp, J. B., Dudhia, J., Gill, D. O., Liu, Z., Berner, J., Wang, W., Powers, J. G., Duda, M. G., Barker, D., and Huang, X.-Y.: A Description of the Advanced Research WRF Model Version 4.1, No. NCAR/TN-556+STR, https://doi.org/10.5065/1dfh-6p97, 2019. a
Srivastava, P., Namdev, P., and Singh, P. K.: 7 February Chamoli (Uttarakhand, India) Rock-Ice Avalanche Disaster: Model-Simulated Prevailing Meteorological Conditions, Atmosphere, 13, 267, https://doi.org/10.3390/atmos13020267, 2022. a, b, c
Stähli, M., Sättele, M., Huggel, C., McArdell, B. W., Lehmann, P., Van Herwijnen, A., Berne, A., Schleiss, M., Ferrari, A., Kos, A., Or, D., and Springman, S. M.: Monitoring and prediction in early warning systems for rapid mass movements, Nat. Hazards Earth Syst. Sci., 15, 905–917, https://doi.org/10.5194/nhess-15-905-2015, 2015. a
Staley, D. M., Kean, J. W., Cannon, S. H., Schmidt, K. M., and Laber, J. L.: Objective definition of rainfall intensity–duration thresholds for the initiation of post-fire debris flows in southern California, Landslides, 10, 547–562, 2013. a
Stoffel, M., Mendlik, T., Schneuwly-Bollschweiler, M., and Gobiet, A.: Possible impacts of climate change on debris-flow activity in the Swiss Alps, Climatic Change, 122, 141–155, 2014. a
Subramanian, S. and Dixit, S.: SeDiRe-lab/aschpeired: ASCHPEIRED_v1.0.0 (ASCHPEIRED), Zenodo [code and data set], https://doi.org/10.5281/zenodo.10616760, 2024. a, b
Suzuki, M., Kagohara, K., Sakaguchi, K., Matsugi, H., and Kataoka, S.: Urgent Issues and New Suggestions for Geo-disaster Prevention in Japan, in: World Landslide Forum (WLF5) 2–6 November 2020, Kyoto, Japan, 123–129, https://doi.org/10.1007/978-3-030-60311-3_13, 2020. a
Takahashi, T., Nakagawa, H., Harada, T., and Yamashiki, Y.: Routing debris flows with particle segregation, J. Hydraul. Eng., 118, 1490–1507, 1992. a, b
Tang, H., McGuire, L. A., Rengers, F. K., Kean, J. W., Staley, D. M., and Smith, J. B.: Evolution of debris-flow initiation mechanisms and sediment sources during a sequence of postwildfire rainstorms, J. Geophys. Res.-Earth, 124, 1572–1595, 2019. a
Teja, T. S., Dikshit, A., and Satyam, N.: Determination of rainfall thresholds for landslide prediction using an algorithm-based approach: case study in the Darjeeling Himalayas, India, Geosciences, 9, 302, https://doi.org/10.3390/geosciences9070302, 2019. a
Thomas, M. A., Mirus, B. B., and Collins, B. D.: Identifying physics-based thresholds for rainfall-induced landsliding, Geophys. Res. Lett., 45, 9651–9661, 2018. a
Turkington, T., Remaître, A., Ettema, J., Hussin, H., and van Westen, C.: Assessing debris flow activity in a changing climate, Climatic Change, 137, 293–305, 2016. a
Van Asch, T. W., Tang, C., Alkema, D., Zhu, J., and Zhou, W.: An integrated model to assess critical rainfall thresholds for run-out distances of debris flows, Nat. Hazards, 70, 299–311, 2014. a, b, c, d, e, f, g, h, i
Van Asch, T. W., Yu, B., and Hu, W.: The development of a 1-D integrated hydro-mechanical model based on flume tests to unravel different hydrological triggering processes of debris flows, Water, 10, 950, https://doi.org/10.3390/w10070950, 2018. a, b, c
van Beek, L. P. H.: Assessment of the influence of changes in land use and climate on landslide activity in a Mediterranean environment, PhD thesis, Utrecht University, https://dspace.library.uu.nl/bitstream/handle/1874/560/full.pdf?sequence=20&isAllowed=y (last access: 29 June 2023), 2002. a
Van Deursen, W. P. A.: Geographical Information Systems and Dynamic Models, PhD thesis, Utrecht University, NGS Publication 190, 198 pp., http://www.dpi.inpe.br/cursos/ser301/referencias/thesis_pcraster.pdf (last access: 2 September 2023), 1995. a
Westra, S., Fowler, H. J., Evans, J. P., Alexander, L. V., Berg, P., Johnson, F., Kendon, E. J., Lenderink, G., and Roberts, N.: Future changes to the intensity and frequency of short-duration extreme rainfall, Rev. Geophys., 52, 522–555, 2014. a