the Creative Commons Attribution 4.0 License.
the Creative Commons Attribution 4.0 License.
Sedimentary record of historical seismicity in a small, southern Oregon lake
Mark D. Shapley
Daniel G. Gavin
Alan R. Nelson
Chris Goldfinger
We compare event deposits from the historical portion of the sedimentary record from lower Acorn Woman Lake, Oregon, to historical records of regional events to determine if the lake records Cascadia megathrust earthquakes. We use the sedimentological characteristics and X-ray fluorescence (XRF) provenance of disturbance deposits (labeled A–J) from the historical portion (∼1650 CE and younger) of the record to discriminate between deposit types. We show that earthquake-triggered deposits can be differentiated from flood deposits, and Cascadia megathrust earthquake deposits can be differentiated from other types of earthquake deposits. Event deposit J dates close to 1700 CE (1680–1780 CE) through multiple approaches, suggesting it was the result of shaking from the M8.8–9.2 1700 CE Cascadia megathrust earthquake. Event deposits H and I are interpreted to be the result of the ∼M7.0 1873 CE Brookings earthquake, which is explained here to be a crustal earthquake immediately followed by a subduction earthquake. These results demonstrate the usefulness of lake sediments to infer earthquake hazards in Cascadia.
- Article
(30997 KB) - Full-text XML
- Companion paper
-
Supplement
(1115 KB) - BibTeX
- EndNote
1.1 Approach
Lake sediments can provide high-resolution, continuous records of earthquake-triggered disturbances (Goldfinger et al., 2017; Howarth et al., 2014; Moernaut et al., 2014; Monecke et al., 2004; Praet et al., 2022; Strasser et al., 2013). They have even been used to distinguish the imprints of megathrust and intraplate earthquakes (Van Daele et al., 2019). Lakes are also good recorders of other types of disturbances, such as floods (Gilli et al., 2013; Wilhelm et al., 2013, 2018; Vandekerkhove et al., 2020), postfire erosion (Howarth et al., 2012; Colombaroli et al., 2018) and wildfires (Bradbury, 1996; Long et al., 1998; Hennebelle et al., 2020). Lake sediments in Cascadia are increasingly exploited for their paleoseismic potential (Leithold et al., 2018, 2019; Goldfinger et al., 2017; Morey et al., 2013); however, most other studies that have examined the differences between earthquake-triggered deposits and those from other types of disturbances are from large lakes (>100 km2). Understanding the influence of Cascadia megathrust earthquakes on lakes is crucial because researchers have long suspected an influence from megathrust earthquakes in Cascadia lakes in the Oregon Coast Range (Long et al., 1998), Lake Washington (Karlin and Abella, 1992, 1996; Karlin et al., 2004), the Olympic Peninsula (Leithold et al., 2018), the Seattle area (Goldfinger et al., 2017), and the Klamath Mountains and Oregon Coast Range (Morey et al., 2013). Understanding the impact of megathrust earthquakes in Cascadia lakes has the potential to provide insight into Cascadia megathrust earthquake behavior, provide opportunities to obtain information about intraslab and crustal earthquakes, and improve the interpretation of environmental proxy data.
Differentiating between flood- and earthquake-triggered deposits can be challenging. Some research suggests that flood-triggered turbidites are more evenly distributed throughout the lake and earthquakes are thickest in the lake's depocenter (Vandekerkhove et al., 2020, and references therein). Other studies show that flood deposits exhibit reverse and then normal grading in contrast to the normal grading of turbidites (Mulder et al., 2003; St-Onge et al., 2004; Beck, 2009; Wirth et al., 2011) or contain larger clastic particles compared to background sediment (Toonen et al., 2015; Schillereff et al., 2014; Campbell, 1998). Many factors contribute to the characteristics of the resulting deposits (particle size, clastic supply, slope angle, basin shape, slope stability, etc.); therefore each lake must be evaluated independently.
To determine if small (<10 km2) lakes record evidence of Cascadia megathrust earthquakes and ascertain how the resulting deposits differ from other types of event deposits (such as flood deposits), we investigated the sedimentary record from lower Acorn Woman Lake, Oregon, located ∼180 km inland of the Cascadia subduction zone trench. We compare the historical portion of the sedimentary record to the record of extreme events known to influence the region. The lake is an ideal study site because it has experienced extreme events, including earthquakes and floods, and the bedrock that immediately surrounds the lake is locally distinctive from the bedrock of the steep watershed that contributes sediment to the north end of the lake. This heterogeneity of bedrock is important because it improves the ability to determine sediment provenance and suggests possible mechanisms controlling deposition. Lower Acorn Woman Lake is also located adjacent to upper Acorn Woman Lake, which has an existing record of watershed disturbances, some of which are already suspected to be the result of Cascadia megathrust earthquakes (Morey et al., 2013; Colombaroli et al., 2018).
1.2 Background
1.2.1 Setting
Upper and lower Acorn Woman Lakes (42°01′55′′ N, 123°00′56′′ W) are located in the Klamath Mountains, ∼180 km inland of the trench (the surface expression of the Cascadia Fault; Fig. 1, top left) at an elevation of ∼920 m. The lakes formed when a landslide dammed Acorn Woman and Slickear creeks near their confluence, creating two basins draining watersheds of different sizes and bedrock types. The lakes are located near the southern extent of the Cascadia subduction zone, just inland of the boundary between the obliquely subducting (∼27–45 mm yr−1) Juan de Fuca Plate and the Gorda deformation zone ∼200 km north of the northward-migrating Mendocino triple junction. The lakes are ∼35 km above the inferred location of the transition from seismic to aseismic slip on the Juan de Fuca Plate (yellow star in Fig. 1, left; McCrory et al., 2014; Yeats, 2004) near the zone of maximum episodic tremor density.
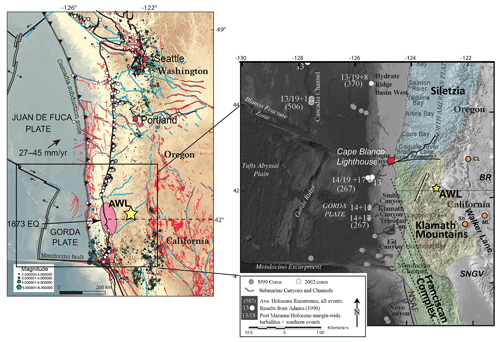
Figure 1Location map and tectonic setting. Left panel: map showing the location of Acorn Woman Lakes with respect to the Cascadia subduction zone. Upper and lower Acorn Woman Lakes are located in southern Cascadia approximately 180 km inland east of the deformation front. The open circles indicate the locations of coastal paleoseismic sites (base map modified from Leonard et al., 2010). The pink oval represents the approximate location of the epicenter for the 1873 CE Brookings earthquake. Blue lines are faults from a simplified Cascadia forearc fault model (from Wells et al., 2017; also identified as Canyonville and Safari faults in map on the right). Acorn Woman Lakes are located at ∼35 km above the transition from the seismically to aseismically slipping reaches of the plate interface. Figure adapted from Fig. DR3, Wells et al. (2017) data repository item no. 201716; Mb>2.0 from McCrory et al. (2012); USGS Quaternary Fault database (red lines). Right panel: map expanded to show details of the geologic terranes and highlight the locations of local crustal faults near Acorn Woman Lakes; open circles are from Goldfinger et al. (2012). AWL is Acorn Woman Lakes, CL is Crater Lake, ML is Medicine Lake volcano, Sh is Mount Shasta, NSAF is northern San Andreas fault, and SNGV is Sierra Nevada–Great Valley block. Dashed lines are a simplification of the zone of faults that include the Lost Man fault, Bald Mountain fault zone, Grogan fault, Eaton Roughs fault zone and Lake Mountain fault zone.
The tectonic setting at Acorn Woman Lakes is complex. The lakes are located within the Klamath Mountains Province (KMP), which acts as a relatively rigid block that is subjected to forces related to the northward migration of the Mendocino triple junction (MTJ; and associated Mendocino Crustal Conveyor – MCC), the north-northwest translation of the Sierra Nevada–Great Valley (SNGV) block, and the oblique subduction of the Gorda and Juan de Fuca plates from the north and west and the Basin and Range Province (BRP) extension from the east (McKenzie and Furlong, 2021). As a result, the KMP is currently moving north-northwestward at ∼8–12 mm yr−1, primarily as a result of pushing from the south by the SNGV block (McKenzie et al., 2022). The Franciscan complex, which surrounds the western boundary of the KMP, is accommodating high north-northwest- and northeast-directed shortening strain related to the MCC and subduction coupling. McKenzie and Furlong (2021) state that these forces, including the inferred injection of Franciscan crust into the southwest KMP, may explain the relatively recent crustal deformation within and west of the KMP over the past ∼2–3 Myr.
The KMP is bounded to the east by the Walker Lane–Eastern California Shear Zone (WLECSZ), which extends northward from the Gulf of California to Crater Lake (Waldien et al., 2019). The WLECSZ is a shear zone, an incipient transform fault, which is propagating northward independent of the MTJ, which is controlled in part by BRP expansion (Waldien et al., 2019). Although the majority (∼75 %) of the Pacific–North American plate motion is currently along the San Andreas transform fault, ∼25 % of the motion is along the WLECSZ (Thatcher et al., 1999; Oldow et al., 2001; Bennett et al., 2003). The Klamath Graben, located east of Acorn Woman Lakes, is the inferred termination of the Walker Lane belt (Waldien et al., 2019).
The most likely sources of regional seismicity with the potential to disturb lower Acorn Woman Lake sediments are earthquakes within the subducting plate, megathrust earthquakes on the plate interface and earthquakes on crustal faults in the overriding North American plate. The USGS Quaternary Fault and Fold database for the United States (with additional information from the California Geological Survey; https://earthquake.usgs.gov/hazards/qfaults/, last access: May 2019) identifies few active regional faults; however, the simplified Cascadia forearc fault model of Wells et al. (2017) identifies a series of trench-perpendicular faults along the coast of northern California and Oregon. An additional likely active fault, the north-northeast-trending Cave Junction fault (also called the Eight Dollar Mountain fault), has been recently identified in the region ∼50 km northwest of Acorn Woman Lakes (von Dassow and Kirby, 2017; Kirby et al., 2021; shown in Fig. 1).
The largest historical earthquake in Oregon since 1700 CE was a ∼M7 earthquake that occurred on 23 November 1873 (Wong, 2005). This earthquake was strong enough to topple chimneys in Jacksonville, Oregon (Wong and Bott, 1995), 15–20 km east of Acorn Woman Lakes and has been interpreted as an intraplate earthquake primarily because of the lack of reported aftershocks (Wong, 2005). Numerous investigations of felt reports published in regional newspapers suggest the intensity center was located ∼10 km inland from the coast, from just south of Cape Blanco, OR, to Crescent City, CA (Bakun, 2000; Toppozada et al., 1981).
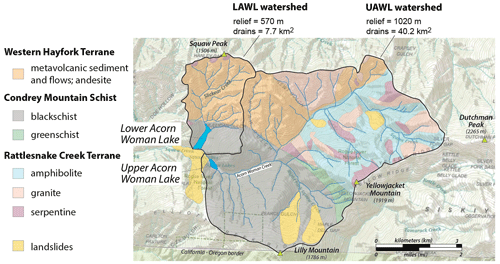
Figure 2Geologic and geomorphic setting. Upper and lower Acorn Woman Lakes (UAWL and LAWL) are situated in the Condrey Mountain Schist; however, the bedrock of the lake catchments consists of distinctive metamorphic and plutonic lithologies. Note the large landslide responsible for lake creation. Geology from Donato (1993).
Both upper and lower Acorn Woman Lakes are situated within the Condrey Mountain Schist (“lake bedrock”, dark-gray unit in Fig. 2), a heavily foliated quartz–muscovite schist (Hotz, 1979), that has been described as failure-prone (Coleman et al., 1983). The northern portion of lower Acorn Woman Lake is fed primarily by Slickear Creek, which is almost entirely located in a unit mapped as metavolcanic sediment and flows (andesite) and quartz diorite (“Slickear Creek watershed bedrock”, orange unit shown in Fig. 2). The boundary between these two units is located at the Slickear Creek delta. The Slickear Creek watershed rocks have a different composition and are more resistant to erosion than the schist that surrounds the lakes and most of the Acorn Woman Creek watershed.
1.2.2 Climate
The Klamath Mountains ecoregion experiences a Mediterranean climate characterized by hot dry summers and wet winters (Sleeter and Calzia, 2012). The wet winters are the result of equatorward shifts in midlatitude storm tracks during the winter months (Swain et al., 2018). The latitude at which this shift occurs is variable through time and can result in extreme shifts between flooding and drought (Horton et al., 2015). Atmospheric rivers are narrow pathways of tropical moisture that are regionally important because they provide a large amount of rainfall and snow at high elevations to the region (Goldenson et al., 2018). Sustained atmospheric river events can produce extreme flooding (Safeeq et al., 2015), such as that which occurred during the 40 d event that occurred in 1861–1862 (Engstrom, 1996).
1.2.3 Sediment transport
For the post-logging era (1930–present) the dominant influence on sediment accumulation rates identified from the sedimentary record from upper Acorn Woman Lake is rainfall (Colombaroli et al., 2018). Prior to that, the largest accumulation rates are related to postfire erosion and possibly earthquakes, as part of complex feedback processes (Colombaroli et al., 2018). Slope failures and slumps around lower Acorn Woman Lake are common on the steep hillslopes and were observed as changes in the landscape and vegetation, suggesting possible instability during shaking. Rainfall, the dominant influence on slope wash from hillslopes to streams in upland regions (Lamoureux, 2002; Zolitschka, 1998), occurs primarily during the wet season from November to April (Sleeter and Calzia, 2012). Stream bank outcrops suggest occasional extreme, erosive flow. Snowmelt floods, which occur when rain-on-snow events melt snow in the upper reaches of the watershed, may also introduce pulses of sediment into the lake. Flash floods in Slickear Creek have been observed to transport and deposit sand to boulder-sized sediment on the delta near the lake margin where vegetation is dense (Bert Harr, personal communication, September 2015; landowner).
Table 1Historical events with the potential to disturb the sediments of lower Acorn Woman Lake. EQ signifies earthquake.
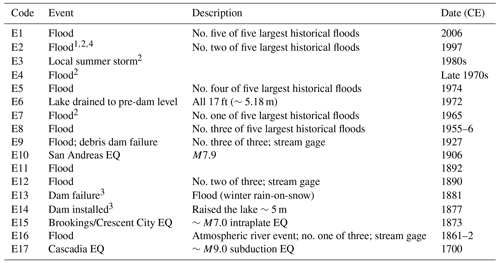
1 An observer described water shooting out 10 ft (∼3 m) past the dam. 2 A local landowner described a thick layer of coarse sediment deposited over the entire Slickear Creek delta as looking like a “moonscape”. 3 Reported in the Jacksonville Times newspaper. 4 US Forest Service personnel observed and removed logs that blocked the overflow at the dam, elevating the lake level by 3–4 ft (∼0.91–1.22 m). This flood caused the Applegate dam, located downstream from lower Acorn Woman Lake, to overflow and begin to erode the sediment on the sides of the dam (Peter Jones, personal communication, December 2019).
1.2.4 Lake and watershed characteristics
Lower Acorn Woman Lake (previously called Lower Squaw Lake) is a long, narrow (area is 0.226 km2), deep (∼40 m) lake at 915 m elevation. The Slickear Creek watershed to the north is smaller (7.7 km2) than the Acorn Woman Creek watershed to the east (40.2 km2). The level of lower Acorn Woman Lake was raised above its natural level by ∼5 m in 1877 when a dam was built to increase water pressure for hydraulic gold mining (Jacksonville Times, 25 September 1878). The ∼0.5 km long Slickear Creek delta is composed of coarse sand, cobbles and a few boulders near the shore of the lake where vegetation is dense. The delta has been built rapidly by floods that have occurred every ∼10–20 years, occasionally depositing a thick layer of coarse sediment over the entire delta (Bert Harr, personal communication, September 2015; see Table 1). Most of the water flows into the lake from the north as subsurface flow; however, overland flow occasionally occurs along the narrow (a few meters wide) incised stream channel on one side of the delta.
Upper Acorn Woman Lake (previously called Upper Squaw Lake) is a small (0.073 km2), shallow (14.2 m) lake at ∼930 m elevation with a capacity of ∼564 000 m3. Upper Acorn Woman Lake drains a large watershed (40 km2) of steep terrain (∼1020 m relief), and Acorn Woman Creek flows throughout the year into the southern portion of lower Acorn Woman Lake near the dam. Although the terrain is steep throughout much of the watershed, the proximal ∼2.0 km near lower Acorn Woman Lake becomes gently sloping, and the creek meanders and branches as it nears the lake and then enters the lake over a delta front composed of angular, well-sorted, medium to coarse sand. Groundwater likely flows through the delta, as water-tolerant trees and shrubs are present.
The Atlas of Oregon Lakes (Johnson, 1996) describes lower Acorn Woman Lake as an unusually deep lake for its size, with a high concentration of ions, especially of calcium and magnesium. Alkalinity and conductivity are also high, with pH value of 8+. It has been classified as a mesotrophic to oligotrophic lake based on a Secchi disk depth of 6.2 m. The lake shows evidence of oxygen depletion at depth. A phytoplankton sample taken on 13 July 1982 identified the dominant species as Ceratium hirundinella. Also present were Dinobryon sertularia, Melosira granulata and Asterionella formosa. Water column measurements of temperature, oxygen and specific conductance were acquired in June 2014 (this study), which are presented in Fig. 3 (right) along with the water column data collected by Larson (1975).
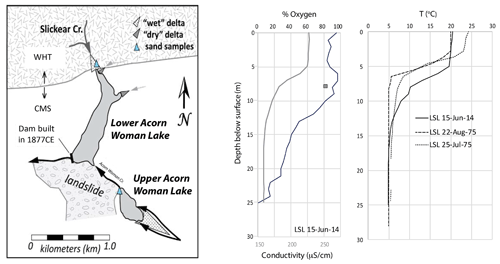
Figure 3Left panel: upper and lower Acorn Woman Lakes can be thought of as a single system, with the landslide between them separating the two basins. Upper Acorn Woman Lake is fed by Acorn Woman Creek, which forms a large sandy delta ∼0.5 km long as it enters the lake from the southeast. Acorn Woman Creek continuously flows between the two lakes, transporting water and sediment from upper Acorn Woman Lake to the southern end of lower Acorn Woman Lake. Blue triangles indicate the locations of sand samples taken to determine sediment provenance. CMS: Condrey Mountain Schist; WHT: Western Hayfork Terrane. Wet deltas are saturated, and dry deltas are not (inferred from vegetation types). Right panel: temperature, conductivity and percent oxygen for lower Acorn Woman Lake (abbreviated here as LSL). Data collected in June 2014 were supplemented by data from Larson (1975). The lake is stratified with a thermocline between 5–7 m water depth. At this same depth an unstable spike in conductivity was measured (square marker) indicating the presence of groundwater flowing into the lake at that depth. It is not connected to the conductivity line because the value at that depth fluctuated.
Upper Acorn Woman Lake continuously overflows into lower Acorn Woman Lake via Acorn Woman Creek. Water accumulates in lower Acorn Woman Lake from upper- and lower-lake watersheds (Fig. 3, left). Local people and US Forest Service employees observed flood waters in 1997 filling lower Acorn Woman Lake to capacity, forcing water, sediment and downed trees to the south, blocking the outflow and raising the lake level above the dam (Peter Jones, personal communication; January 2020). Accounts of this event describe lower Acorn Woman Lake during this event as a wide, fast-flowing stream that undercut the lake shore, resulting in soils and colluvium slumping into the lake.
2.1 Sediment cores
We collected sediment cores from lower Acorn Woman Lake during field seasons in 2013, 2014 and 2015. We used a modified Livingstone corer (Wright, 1967) deployed from a custom platform fitted with a stainless-steel pipe attached to two inflatable rafts (2013) or canoes (2014) to collect cores 1, 2, and 4, 5 (overlapping drives at a single location). We used a Kullenberg piston corer (Kelts et al., 1986) to collect cores in 2015 and collected surface samples from the same locations with a gravity corer, both deployed from an aluminum platform supported by two 7 m skiffs (Continental Scientific Drilling (CSD) facility). Prevailing winds affected our ability to stay on location for coring down this narrow lake, causing deep-water cores to be taken near, but not exactly at, the lake's depocenter. We acquired single-beam bathymetric data in May 2015 by a canoe fitted with a Garmin GPS-enabled “fish finder” and receiver. In addition, a 10 m composite sediment core from upper Acorn Woman Lake was taken from near the lake center (water depth of 14.1 m) that contains a record of watershed-sourced deposits over the past ∼2000 years (Colombaroli et al., 2018).
2.2 Sediment properties
We described the sedimentology and deposit characteristics of core sediment using the following data types: Munsell color, sediment texture, composition (microscopic analysis of smear slides), and grading and contact characteristics (sharp, gradational, discontinuous, etc.). We acquired particle-size data at 0.5 cm intervals through event deposits and less frequently between them. Particle-size data (volumetric % by size) were determined by laser diffraction analysis using a HORIBA grain size analyzer (LA-920; CSD, University of Minnesota) or Beckman Coulter grain size analyzer (LS 13-320; Oregon State University). We measured volume magnetic susceptibility (k) using a Bartington MS2E point sensor at 0.5 cm resolution. We acquired combustion data at 0.5–1.0 cm intervals through event deposits and less frequently elsewhere, resulting in data for percentage of inorganic content (clastic particles other than CaCO3), percentage of organic matter and percentage of CaCO3 (calculated from dry weights). We acquired CT imagery and data using the Toshiba Aquilion 64 slice CT unit at the Oregon State University Veterinarian Hospital (at 0.5 mm resolution). Inferred mineralogy was spot-checked using the CSD desktop scanning electron microscope (Hitachi TM-1000).
2.3 Identification of event deposits and lithostratigraphic correlation
We identified event deposits in cores as abrupt increases in petrophysical-property data (magnetic susceptibility and CT imagery and data – also called radiodensity), in contrast to the typical organic-rich background sediment and then used lithostratigraphic methods to correlate units between cores. Petrophysical properties typically reflect the vertical grain size distribution of the particles in marine cores (Kneller and McCaffrey, 2003; Goldfinger et al., 2012; Patton et al., 2015) and lake cores (Karlin and Seitz, 2007); however, they have also been shown to reflect the inorganic content in lake cores dominated by organic sedimentation (Morey et al., 2013).
Lithostratigraphic correlation takes advantage of the characteristics of both the sequence pattern of event deposits and the petrophysical properties through the event deposits themselves. The petrophysical properties of the event deposits can be considered fingerprints of the time history of deposition of the event deposit (Goldfinger et al., 2008, 2013; Patton et al., 2015), and individual events from independent records have been shown to correlate over long distances even though they are from different depositional settings (Goldfinger et al., 2012; Morey et al., 2013). Radiodensity has been shown to be the most sensitive property to changes in fine-grained inorganic disturbances (Inouchi et al., 1996) and does not display as much of an edge effect as magnetic susceptibility; therefore the high-resolution radiodensity was heavily relied upon for correlation.
2.4 Sediment provenance data
We used X-ray powder diffraction (XRD) spectra to determine the mineralogy of the two endmember bedrock types. XRD allows qualitative and semiquantitative analysis of the mineralogy of sediments and rocks by measuring the diffraction properties of their mineral components. We interpreted the results using the automated pattern-matching routine in Jade Software (previously found at http://ksanalytical.com/jade-9/, last access: 2016, now a revised version – Jade Pro – can be found at https://www.materialsdata.com/prodjd.html; last access: 18 October 2024), which compares the relative peak heights and areas from unknowns to those from samples of known mineralogy contained in the software database.
We acquired X-ray fluorescence (XRF) data with an Itrax core scanner (Oregon State University) from downcore sediment at 0.4 mm intervals and from discrete samples of lake-margin beach sand and Slickear Creek streambed sand (also using the Itrax core scanner; source locations are shown as blue triangles in Fig. 3, left). The XRF downcore data were used to determine the upper and lower boundaries of each deposit in addition to identifying sediment provenance.
2.5 Development of event-free stratigraphy and age–depth model
2.5.1 Event-free stratigraphy
Rapidly deposited sediment was removed from the stratigraphic sequence prior to creating the age–depth model to avoid misinterpreting it as being deposited at the same rate as background sediment. This event-free stratigraphy was created by identifying the event deposit boundaries using XRF and estimating missing sediment at erosional contacts using correlations between shallow and depocenter cores. XRD data from endmember rock samples were used to initially determine the best choice of elemental variables to use as XRF provenance indicators. XRF variability through the event deposits was then used to determine where deposit boundaries exist. Sharp increases in sediment density (higher Hounsfield units (HUs); lighter values), compared to lower-density background sediment (lower HUs; darker values), indicate rapid deposition or reworking as described in Morey et al. (2013).
2.5.2 Radiocarbon samples and data
We sampled lower Acorn Woman Lake sediment cores for radiocarbon dating after splitting cores longitudinally. We removed macroscopic samples of fragile plant material (such as fir needles and buds) from the targeted horizons of undisturbed sediment, cleaned and dried them, and then had them analyzed by AMS (accelerator mass spectrometry) for radiocarbon. We selected the target horizons for sampling based on a suspected temporal tie point between the lower Acorn Woman Lake record and the dated sequence from upper Acorn Woman Lake. We used the strong similarity in sequences between the upper and lower lakes to infer that the first of these clastic event deposits was deposited close to 1964–1965 (as shown in Fig. S1 in the Supplement).
2.5.3 Age–depth model
An age–depth model was developed using a Bayesian approach in OxCal (v 3.4.2; Bronk Ramsey, 2017).
3.1 The historical record of extreme events
Historical events with the potential to influence lower Acorn Woman Lake sedimentation are compiled from personal accounts (from landowners and US Forest Service Rangers), published hydrologic data, regional historical newspapers and US Forest Service documents (Table 1). We did not include large land-use events (logging efforts and road building) or wildfire in Table 1 because these events require water to transport the resulting increase in available sediment into the lake; however, extreme runoff from these types of events can cause debris flows (Wall et al., 2020). Homesteading began in the region when gold was found by settlers between 1850–1852 CE (LaLande, 1995).
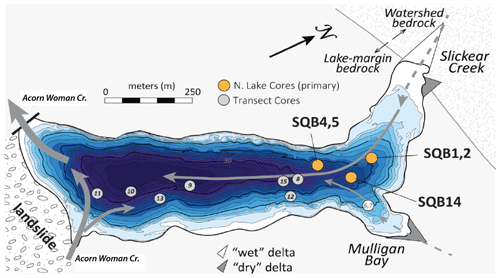
Figure 4Core locations. Cores were collected along a north–south transect. The primary core sites (northern cores) are identified by the orange circles, and the other cores collected are identified by the numbered gray circles. The northern cores were used because the deeper-water cores were disturbed as a result of coring in the historic portions of the records. Prevailing winds caused the coring platform to move slightly off of the lake depocenter when coring this narrow lake.
Table 2Sediment core locations, water depths and lengths.
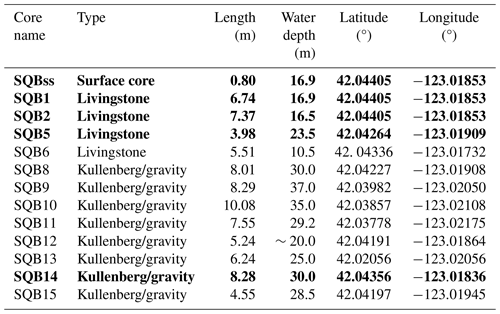
Cores highlighted in bold text are those identified by orange circles in Fig. 5. * Cores SQB4 and SQB7 are not included in this list because they are less complete due to partial recovery compared to cores SQB5 and SQB6 (from the same locations). Note that SQBss is a surface sample (push core). Kullenberg cores are mildly to moderately disturbed at the top because the coring tubes collapsed some during coring. Sediments in the deeper-water cores contained methane; when cutting coring tubes into sections, some sediment was extruded and captured in small subsections.
3.2 Sediment core locations and recovery
This study investigated historical records from the northern cores (Fig. 4, orange circles) near the Slickear Creek delta, which is saturated near the surface. Sediment core locations, lengths and water depths are shown in Table 2. Several of the upper sections of the first Kullenberg cores were distorted (especially the historical portions) during coring and stuck in the casing; therefore the focus is on the shallower-water cores (with a comparison to depocenter cores where possible). Small adjustments to composite sediment depths accounted for core section breaks and minor distortion.
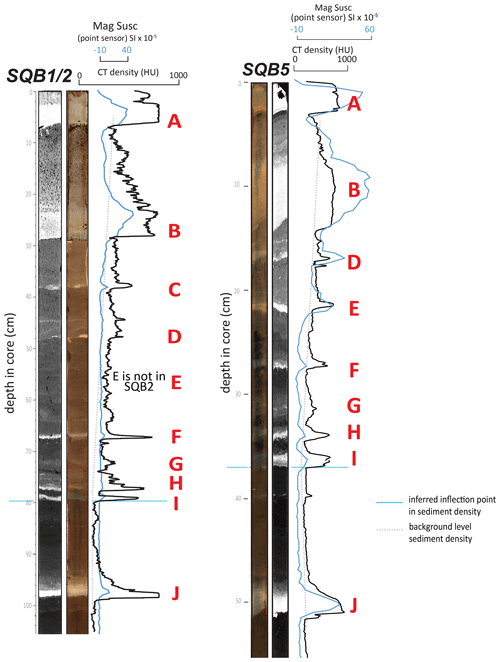
Figure 5Disturbance deposits A–J were identified as excursions in radiodensity and magnetic susceptibility in cores SQB1/2 and SQB5. Shown are grayscale images of radiodensity and RGB images of core color. Blue traces are magnetic susceptibility (SI units), and black traces are radiodensity (Hounsfield units). Note that deposit C, present in core SQB2, is missing from core SQB5, and deposit E is missing from core SQB1/2 (and all other cores). The dashed line reflects background sediment density, showing an inflection in the trend near deposits H and I.
3.3 Sediment facies
3.3.1 Background facies
Background sediment is a very dark-brown to black (Munsell color: 2.5YR 2.5/1) organic-rich sediment containing planktonic diatoms (∼30 %); particulate organic matter; and angular, poorly sorted medium to coarse silt (50 %-60 %). Split sections change color quickly (over a period of hours to days) from very dark-brown (or black if the core was taken in deep water) to a lighter-brown or slightly orange color and become concreted if exposed to air. A shift in sediment radiodensity occurs just below deposit I in all cores (see Fig. 5). This horizon, referenced in Fig. 5 and Table 3 as “inflection”, refers to the change in sediment radiodensity that is suspected to reflect changes in sedimentation from around the time settlers cleared land (mid-1800s) and first dammed the lower lake (1877 CE). Loss on ignition and physical-property changes associated with this shift are shown in Fig. 5 (data are from core SQB2; Table 3).
Table 3Background sediment characteristics.

Mag susc is magnetic susceptibility; CT is computed tomography density. Diatom tests were not removed from samples prior to combustion; therefore inorganic : organic data include a small influence from the remaining silica from diatoms in the percent inorganic data (estimated to be less than 6 %). CT density is expressed in Hounsfield units (HU). Note that organic, inorganic and CaCO3 percentages were calculated from dry weights. Percent inorganic data do not include percent CaCO3.
3.3.2 Event deposit facies
A total of 10 event deposits from the sediment cores were identified as abrupt increases in sediment radiodensity compared to background levels (based on the downcore CT radiodensity data). The events identified in core SQB5 using this method are labeled A–J in Fig. 5. Disturbance event facies are inorganic layers (>80 % clastics of total by weight) of two primary types: a lighter-gray (Munsell color: 2.5Y 4/1), medium-grained silt without visible mica flakes and a darker-gray (Munsell color: Gley2 4/5PB), coarse micaceous silt. We observed two thick (5–25 cm, depending on core location and water depth), visually similar, massive to normally graded silt units in the upper ∼100 cm of each core. A third type of event deposit facies is slightly denser than background sediment with little change in magnetic susceptibility and, although visible to the eye, is not identifiable as different by the Munsell color scale. This facies type is more common in the cores but is generally thinner compared to the other types of event deposit facies.
3.4 Characteristics of event deposits A–J
3.4.1 Deposits A and B
Deposits A and B are thick units (5–20 cm, depending on the location of the core in the lake; Fig. 6) with sharp basal contacts. These disturbances are found throughout the lake. They vary with distance from Acorn Woman Creek in the south: deposits are thicker and more complex to the south and show evidence of erosion in all cores except those recovered from near the lake's depocenter (cores SQB9 and SQB10). Interevent sediment sections are also thicker and more complex in the south. Basal sediment contains rootlets and other particulate and degraded organic matter (Fig. 7). Grading proceeds from poorly sorted coarse silt and fine sand upward to well-sorted fine–medium silt, followed by a thin, poorly sorted multimodal fine-silt and thin (<1 cm) silty-clay tail. The deposits are gray (2.5Y 3/2); however, the lower halves of deposits A and B are browner compared to the upper half of the deposit. Smear-slide inspection suggests this brown color is from degraded organic matter entrained in the sediment. Magnetic susceptibility is highest near the top of the sequence, just below the silty-clay cap. Although deposits A and B have similar characteristics, the base of deposit A has a thin layer of lighter-colored coarse fine-silt sand without visible mica, which was not observed at the base of deposit B. The presence of rootlets and broken diatoms in the lower portion of the deposit and sharp contact indicate erosion and reworking of lake-margin sediment.
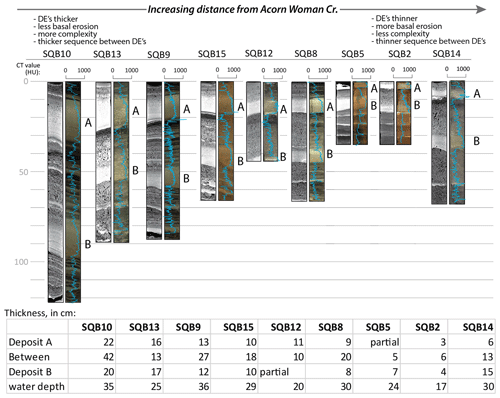
Figure 6Two distinctive lake-wide inorganic disturbance event deposits were observed in the upper portions of all cores. Event deposits and interevent sediment thicknesses are all greater closer to creek inflows and in the deeper-water cores.
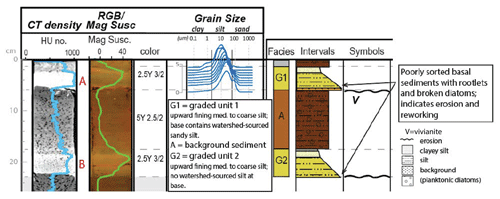
Figure 7Deposit types A and B in the surface core SQBss (the surface sample at the location of cores SQB1 and SQB2). Facies types G1 and G2 are very similar, other than the presence of a thin layer of sandy silt at the base of deposit A. The bases of each deposit are poorly sorted and coarse-grained, containing rootlets and broken diatoms, indicative of erosion and reworking. Deposits are upward-fining, with a clayey-silt cap.
Core log data for deposits C–J are shown in Fig. 8.
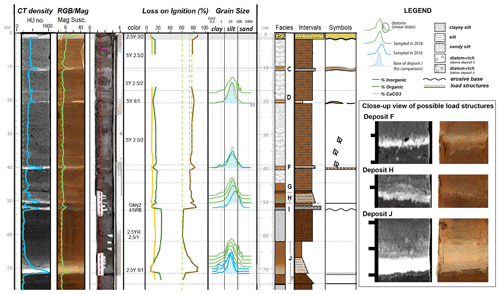
Figure 8Core log data for deposits C–J of section SQB2A (stratigraphically below deposits A and B). Particle-size data are shown as distributions rather than ratios or median sizes to show how they compare from the base upward and compare to the size and narrow range shown for deposit J (shown as a pale blue filled distribution). Data shown from left to right: radiodensity data are presented as a grayscale image with the HU data shown in light blue; RGB data are presented as a color image with the magnetic susceptibility data shown in light green (dashed line is a reference line indicating the lowest magnetic susceptibility for that section); photo compilation showing the location of some of the samples; Munsell color; loss on ignition (%) data representing % inorganic (brown), percent organic (green) and percent calcium carbonate (yellow); grain size distributions; core log representation of the core where the interval horizontal widths reflect a combination of density and grading characteristics (wider intervals are denser and coarser-grained and narrower intervals are finer-grained with lower density); and enlarged grayscale representation of raster radiodensity data for deposits that show evidence of silt loading on the less-dense organic sediment below. Note that the cartoon core profile represents sediment density and grain size.
3.4.2 Deposit C
Deposit C is a fine-grained (medium silt), light-colored (5Y 2.5/2) unit that is wavy and discontinuous. It is thin (<1 cm) and becomes thinner with distance from Acorn Woman Creek but is thicker (∼3 cm) and slightly brown (but still 5Y 2.5/2) in color in core SQB15. It is present in all cores except for core SQB5 (where it has been eroded away).
3.4.3 Deposit D
Deposit D is a sequence of two thin (<0.5 cm), wavy, medium-silt layers in background sediment that is slightly stiffer than the surrounding sediment. The basal layer is distinctive because it appears orange (5Y 4/1).
3.4.4 Deposit E
Deposit E is a thin (∼1 cm), dark-gray (GLEY2 4/5PB), medium-grained, poorly sorted silt deposit containing visibly large mica flakes. This deposit is present only in core SQB5. The deposit has a sharp base and is normally graded. We observed rootlets and other organic matter, particulate and degraded, near the deposit base.
3.4.5 Deposit F
Deposit F is a slightly lighter gray (compared to background, 5Y 2.5/2), normally graded, medium-silt unit with a sharp basal contact. Both magnetic susceptibility and radiodensity are higher than background sediment, suggesting a high concentration of inorganic particles, supported by the loss on ignition data indicating a 5 % increase in inorganic content compared to the background (data from SQB2A). The loading of this silt layer into the organic sediment below suggests rapid deposition of denser sediment (most obvious in the radiodensity image of SQB2A at about 40 cm depth in Fig. 8).
3.4.6 Deposit G
Deposit G is visually indistinct with a gradual increase and decrease in radiodensity (see radiodensity trace in Fig. 9). There is little change in magnetic susceptibility through the deposit. It is ∼3 cm thick (based on radiodensity) and found in all the northern cores. Smear-slide data do not show differences in composition through the deposit; however, a 2 %–3 % increase was observed in the inorganic content (with a peak near the center of the deposit). The base and top are indistinct: peak radiodensity occurs at the midpoint of the deposit.
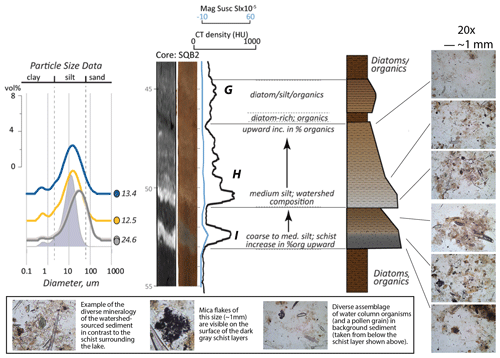
Figure 9Deposits G, H and I in core SQB2. This figure shows particle-size distributions from the layers shown in core SQB2 (median particle size, in millimeters, is shown to the left of the colored dots indicating sample locations in core). The blue (filled) distribution represents the particle-size distribution for disturbance J (shown for comparison). Core imagery produced from radiodensity and RGB color data is shown in comparison to magnetic susceptibility (point sensor; light-blue trace) and radiodensity data (black trace) taken from the center of the core. Descriptions of the sediment are presented for each of the facies identified by the horizontal gray lines. To the right of the core imagery and facies descriptions is a schematic representation of the core where excursions to the right represent denser sediment. The smear slides show that the composition of the disturbance deposits varies in mineralogy and organic content. Note the different species of diatoms in the smear slide taken from the very top of the sequence (between disturbances G and H). At the bottom of the figure are higher-resolution images of details from the smear slides shown at the far right of the schematic.
3.4.7 Deposit H
Deposit H (Fig. 9) is slightly lighter gray (2.5Y 4/1 at the very base) and appears slightly stiffer than background sediment. It is a thick unit (basal silt is ∼1 cm, and radiodensity suggests the entire deposit may be up to ∼4 cm thick in core SQB2) with normal grading and a sharp basal contact. Grading proceeds from poorly sorted medium silt upward to a more well-sorted medium silt, and loss on ignition data indicate an upward increase in the ratio of organics to inorganics with grading. This deposit tail appears mottled in the radiodensity imagery. Deciduous leaves were observed at the basal contact in some of the cores.
3.4.8 Deposit I
Deposit I (Fig. 9) is a dark-gray (GLEY2 4/5PB), coarse silt dominated by large, visible mica flakes (∼90 % inorganic). The deposit has a sharp basal contact and is initially reverse (upward coarsening) and then normally graded. The reverse-graded portion of the deposit has a higher percentage of organics (including rootlets) compared to the normally graded portion of the deposit. The base of the deposit is very sharp with evidence of erosion (truncated beds). Correlation to other cores indicates missing sediment below it, more so in SQB1, SQB2 and SQB14 than in SQB5. Deposit characteristics (mica-rich graded deposit) are similar to deposit E; however, unlike deposit E, deposit I is found in all cores.
3.4.9 Deposit J
Deposit J (Fig. 10) is a lighter-gray (2.5Y 4/1) silt unit. It is thick (∼7–15 cm), dense (∼1000 HU at the base), weakly graded, medium- to fine-grained silt unit with a long tail. The silt is fine-grained and well-sorted (∼90 % inorganics) at the base, lacking other components such as reworked diatoms and organic matter. The visible layer of silt is 3–4 cm thick and becomes less well-sorted (but not finer-grained) upward. The percentage of organic matter increases upward with fining. There is evidence of loading of the silt into the less-dense sediment below (Fig. 8, right), suggesting rapid deposition. The silt identified as deposit J is preceded by a thin silt unit with an organic tail (Fig. 10).
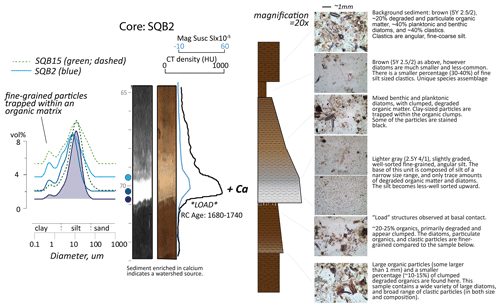
Figure 10Particle-size data, core imagery, physical properties, and schematic with smear slides and detailed descriptions of sediment composition for deposit J. Particle-size data for cores SQB2 and SQB15 both show a narrower distribution at the base of the silt, increasing in width upward. There is evidence of loading (or coseismic injection) of the silt unit onto the organic sediment below. Note that although magnetic susceptibility and radiodensity (light-blue and black traces, respectively) show similar variability, there is greater detail present in the radiodensity allowing, for the identification of a long deposit tail above not visible to the eye and the presence of another cryptic unit below the silt unit (light in color and radiodensity > ∼700 HU). These units also have distinct compositions as described in detail on the right. Note that excursions to the right in the schematic representation of the core represent denser sediment.
3.5 Radiocarbon results
Radiocarbon determinations are shown in Table 4. Samples 6, 7 and 8 are included here even though they are more than 1000 14C yr BP because they provide a key temporal tie point between the cores. Sample 0 was not included in the age model because it is much older than the others in the sequence (suggesting it does not represent the time of deposition). Samples 1–4 were used to create the age–depth model for the historical portion of the core, and samples 5–7 are included here to show the temporal relationship between cores at the lower end of the section used in the age–depth model. Note the close similarity in ages between samples 6 and 7.
Table 4Age control data. The sample in italicized text (sample 0) was not included in the age model because it is much older than the others in the sequence. Samples 1–4 were used to create the age–depth model, and the other ages were used to align the sections shown in Fig. 6. S-ANU is Australian National University AMS lab, UCIAMS is University of Southern California – Irvine AMS lab, and NOSAMS is National Ocean Sciences Accelerator Mass Spectrometry Facility.

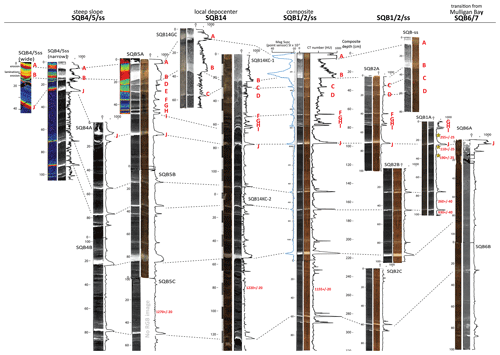
Figure 11Tie points between northern cores; SQB9 from the lake's depocenter; and the composite core created from SQB1, SQB2 and the surface sample. Each downcore section of the northern cores is represented in this figure by a grayscale image of sediment radiodensity (brighter signifies higher radiodensity, darker signifies lower radiodensity), radiodensity traces (black lines; higher density to the right) through the core (in Hounsfield units (HU)) and RGB color imagery (other than a few exceptions). Note the strong similarity between each ∼1 m section, as shown in the inset, lower left. To the right of the compilation core SQB1/2/ss are the sections and radiocarbon age data available to show how these sections of overlapping drives were spliced together. Eroded sections are apparent when comparing the false color radiodensity imagery in cores SQB4 and SQB5 and the associated surface sample.
3.6 Composite core section and correlation points among cores
We used the radiocarbon ages from detrital plant fragments (Table 4), core imagery and descriptions, and physical-property data to (a) create the composite core, SQB1/2/ss, for the historical portion of the lower Acorn Woman Lake record and (b) identify stratigraphic tie points for the northern cores (Fig. 11). Radiodensity was heavily relied upon for correlations because of its very high resolution (sub-millimeter scale). Little sediment is missing between each 1 m section in core SQB2, based on a comparison with SQB1; therefore only section SQB1A was needed to complete the splice. We used the surface sample (ss) to reconstruct the two upper event deposits because they are missing from the top of SQB2 and SQB1. Note that only the northern cores were used for the splice because core length differences from north to south suggested large changes in sedimentation rate.
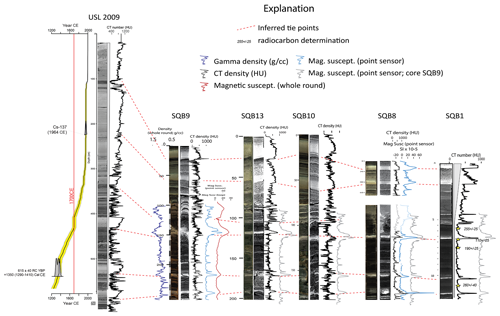
Figure 12Tie points between upper Acorn Woman Lake (USL) upper sections and the composite core from USL. This figure shows the age–depth model, radiodensity imagery and physical-property data for the upper Acorn Woman Lake (USL 2009) core compared to key cores in lower Acorn Woman Lake. All lines are dashed to indicate uncertainty; however, the relationships between the lower-lake cores are more certain than the relationship to the upper-lake core because each of the cores has two distinct upper units that correlate to one another. In the USL core these units are greatly expanded, likely reflecting the higher sedimentation rate and land use changes at that location. Note that each of the cores has the same pattern of disturbances as indicated by the ghost radiodensity trace (light gray) from SQB9; however, deeper-water cores from lower Acorn Woman Lake, such as SQB9 and the USL core, show higher-frequency disturbances between the thicker, more dominant silt layers as compared to the shallower-water cores such as SQB1.
The radiocarbon data were used to tentatively link cores for the splice. The numbered stars in Fig. 11 identify the locations of radiocarbon samples 1–3 (Table 4). We used additional radiocarbon data (samples 4–8) to create the tie points and splices but did not include them in the age model for the historical record because they predate it. The radiocarbon age for sample 0 (gray text) is too old (reversed) for the sequence, and we did not use it. We identified the historical portion of the record as being just younger than sample 3 because this radiocarbon age likely represents a horizon that is older than the 1700 CE earthquake. We used this horizon to define the lower boundary of the historical section of the record. A splice table (Table 5) shows the depth equivalencies of sections used to create the composite core. Note that the length of the SQBss image was adjusted to match the stratigraphy of SQB2A. The age model was created using the upper 2.5 m of the composite section. Sections showing significant erosion are the surface samples: these cores are shown in false color (far left) to highlight the stratigraphy and to improve the identification of erosional contacts and missing sediment.
Table 5Splice data for SQB1/2/ss composite as shown in Fig. 6. Section SQB1-A is the only section in this core that was used to create the composite core. SQB2A 101 cm is at the same stratigraphic location as SQB1-A 56 cm, as shown in Fig. 6 (which is a graphical representation of the relationships between sections presented in the SQB1/2/ss splice represented by this table). Note that SQBss is expanded relative to cores SQB1 and SQB2 and was compressed to match the stratigraphy as shown in Fig. 12a.
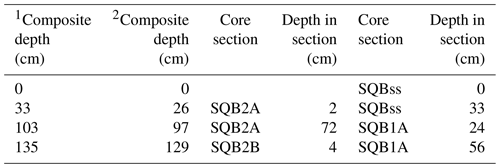
1 Composite depth (cm) without adjusting the length of section SQBss. 2 Composite depth (cm) after compressing section SQB2ss to match the stratigraphy of SQB2A.
Lake-wide tie points were created using the distinctive sequence of event deposits in the record using core log correlation and radiocarbon data where these data were available (Fig. 12). The distinctive sequence includes two, thick upper disturbances, followed by one disturbance with two at the very end of the sequence used for the upper portions of the cores. The relationship between the lower Acorn Woman Lake and upper Acorn Woman Lake sequences is shown in Fig. 12 (left).
A compilation of all core data for key cores from lower Acorn Woman Lake is shown in Fig. 13.
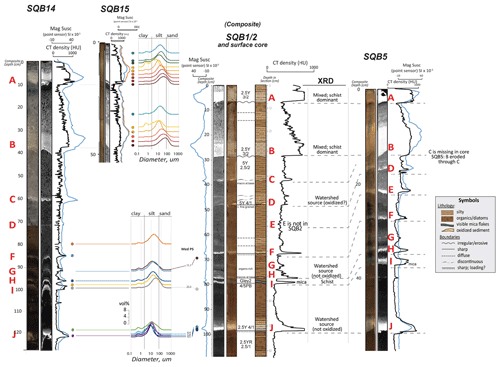
Figure 13Summary of the sedimentological data for the northern cores and correlations between cores. Radiodensity was acquired from sediment cores while still as whole-round sections, and therefore the sediments contain methane pockets (black regions in radiodensity imagery). These pockets are very low density compared to the sediment and are the source of radiodensity noise in the radiodensity trace in core SQB14 (especially between 40 and 85 cm in this figure). The bases of silt units were “flattened” to those of correlative units in the reference core SQB1/2 to emphasize the inferred relationships between cores. The anomalous disturbance event deposits (thicker or denser silt units) are identified by the letters A–J.
3.7 Sediment provenance data
3.7.1 XRD
We identified provenance endmembers by XRD analysis of watershed and lake bedrock samples (Table 6; see Fig. S2). The bedrock that surrounds the lake is composed of a quartz–muscovite schist with chlorite minerals, similar to what has been mapped, whereas the Slickear Creek bedrock is composed of Ca and Fe amphibolites, chlorite minerals, and albite. We also analyzed silt samples from the upper portion of core SQB2 and a gravel sample from the base of the core. Results confirmed a schist bedrock source for the dark-gray silt layers containing visibly large mica flakes and a Slickear Creek watershed source for the lighter-gray silt and basal gravel samples. Inspection by energy-dispersive X-ray spectroscopy (Bruker QUANTAX 50 EDS; CSD Facility) showed that some mica flakes from the Condrey Mountain Schist surrounding the lake contain a large amount of carbon (as much as 77 %), and scanning-electron-microscopic analysis shows the presence of pyrite. This finding suggests that some of the schist is likely graphitic, which (along with pyrite and reduced manganese) may contribute to the black color of some of the sediment from deeper-water cores.
Table 6XRD mineralogy.
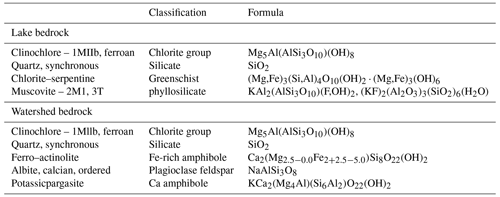
XRD mineralogy for single samples of lake and watershed bedrock and samples of sediment taken from core SQB2 (light-gray, dark-gray and basal gravel units). The lake bedrock is a quartz–muscovite schist with chlorite minerals, and the watershed bedrock is composed of chlorite minerals, plagioclase, and Fe and Ca amphiboles.
3.7.2 XRF
The downcore XRF (core SQB5) data and results from the analysis of individual sand samples (from locations identified by blue triangles in Fig. 3) are shown in Fig. 14. Figure 14 (left) shows that, as expected, the raw counts for elemental variables covary downcore with radiodensity and magnetic susceptibility, especially iron, silicon and potassium. Some deviations from this relationship emerge, however. For example, whereas most elements covary with sediment density, deposit E and deposit I do not have coincident increases in calcium and manganese with radiodensity. Virtually no overlap exists between the samples of sand surrounding the lake and the Slickear Creek bed sand, regardless of whether it was normalized by titanium or strontium or left as raw counts. This lack of overlap between Ca versus K in the scatterplots of the XRF data from lake-margin beach sand and watershed streambed sand (Fig. 14, right) is consistent whether data are represented as peak areas (raw counts, top) or normalized by titanium (middle) or strontium (bottom).
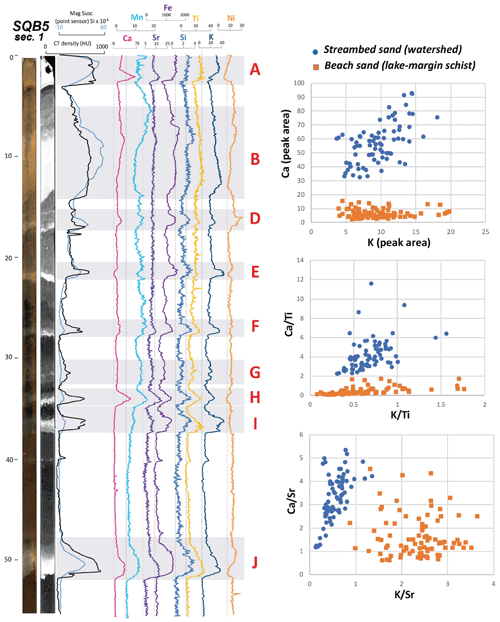
Figure 14X-ray fluorescence (XRF) data for section 1 of core SQB5. Left panel: RGB imagery, radiodensity grayscale imagery, radiodensity (black trace), magnetic susceptibility (light-blue line) and raw XRF data (peak area) for eight elements are shown with colored lines. Right panels: calcium (Ca) and potassium (K) from watershed and beach sand samples do not overlap, whether data are represented as raw counts (peak area) or normalized by titanium or strontium. This suggests that these elements (Ca and K) may be useful to identify sediment provenance endmembers.
Each of the event deposits identified downcore are shown as separate scatterplots in Fig. 15. These scatterplot patterns are different in terms of the direction in which the deposit evolves (clockwise or counterclockwise), direction with respect to the axes and the changes in one variable with respect to the other. Most of the disturbances (deposits B, D, E, F and I) show counterclockwise rotation, whereas deposits J and H rotate clockwise. Those with clockwise rotation are also those enriched to some degree in Ca compared to the counterclockwise deposits which are enriched relatively in K. Deposit J is the only deposit that shows complex variability not in the direction of Ca or K but rather in the loops between the two.
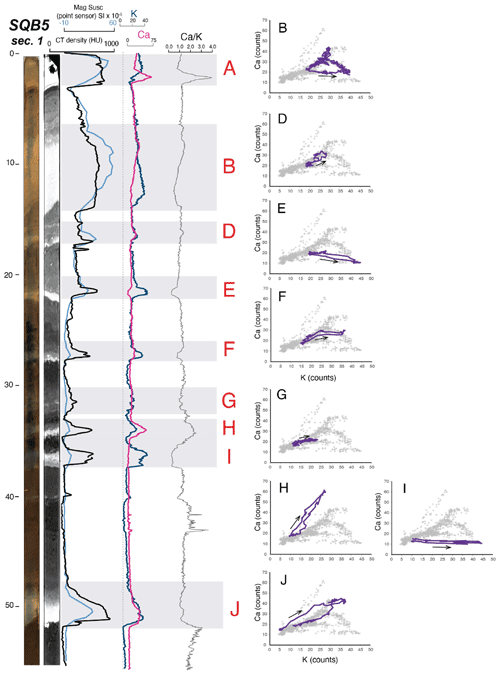
Figure 15Calcium and potassium downcore XRF data and scatterplots for deposits B–J in core SQB5. Each of the gray bars represents the event deposit boundaries for units B–J based on the beginning and end of scatterplot loops (raw, unsmoothed data) on the right. The direction of elemental composition from the base of the deposit upward is identified by the black arrows. Note that some of the scatterplots show clockwise evolution and others show counterclockwise evolution of calcium and potassium through the deposits. See the Discussion section for a detailed interpretation of the scatterplots.
3.8 Age–depth model
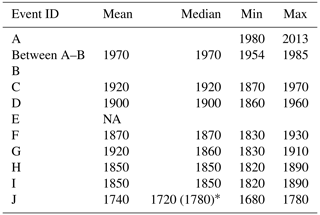
We created the age–depth model using the radiocarbon ages (samples 1–4) shown in Table 4, the event-free stratigraphy for SQBss/1/2 and erosion estimates using a P_Sequence in OxCal (v 4.2; Bronk Ramsey, 2017) as described in the Methods section. We use a k value of 1 (typical of centimeter-scale sedimentation rate variability to allow changes every 1 cm) and then define a prior for that allows variation by 2 orders of magnitude. The goal of this is to allow some flexibility in the age model to account for a variable sedimentation rate. The upper end of the record is constrained based on the sediment inflection representing approximately the time of land use changes in the mid-1800s (LaLande, 1995; including the raising of the lake level in 1877; see inflection in sediment radiodensity in Fig. 5) and using the assumption that deposit B was deposited in 1964. The 1964 horizon was determined based on a comparison of the upper- and lower-lake records (as shown in Fig. S1). The resulting modeled and unmodeled age ranges, as well as agreements between them, are shown in Table 7a. For comparison, the same information is shown for the same model, but instead of sample 2 a calendar date of 1700 CE is used (Table 7b). The resulting model and estimated age ranges for event deposits A–J are plotted as shown in Fig. 16 and listed in Table 8.
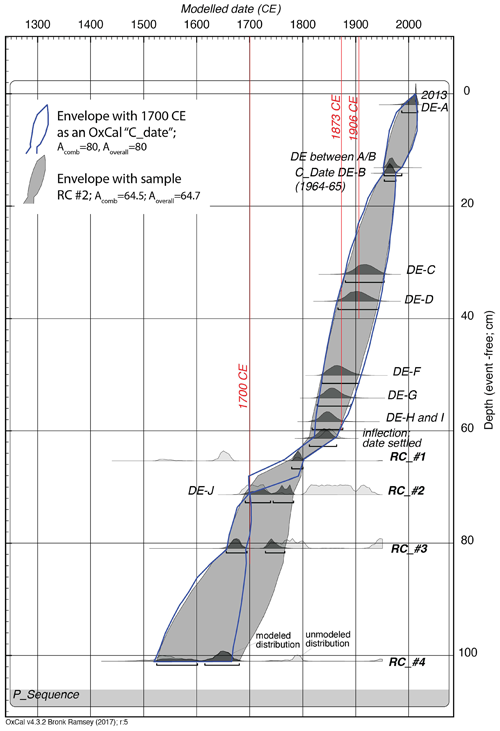
Figure 16Age–depth model for core SQB1/2/ss composite. The age–depth model for composite core SQB1/2/ss was developed using event-free sediment accumulation as described in the Methods section. The depths of the event bases were used to extract age ranges and median values in calendar years for disturbances A–J (sample RC no. 2 was taken from just below the base of deposit J) and other unlabeled events in the sequence. The known timings of the 1700, 1873 and 1906 CE earthquakes are identified by vertical red lines. Acomb is 64.5, and Aoverall is 64.7. Note that Aoverall refers to the product of the individual agreement indices, and Acomb refers to the test if distributions can be combined. A second version of the age–depth model was created with a calendar date (C_date) of 1700 CE used in place of radiocarbon sample no. 2, resulting in a higher Acomb and Aoverall (both of which are 80). The OxCal code for this historical age–depth model is a subset of the downcore OxCal code (see link to code in the “Code availability” section at the end of this paper), which is the code used in the companion paper (Morey and Goldfinger, 2024a, b). The downcore portion of the code is included because it adds stability to the historical model results. A list of all radiocarbon samples used in this downcore model can be found in Table S1.
Table 7Unmodeled and modeled calendar age distributions for radiocarbon (RC) samples 1–4. Agreement (Amodel) indices represent the percentage overlap between the modeled and unmodeled distributions.
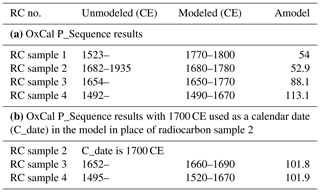
Amodel is the model agreement index used to see if the model as a whole is not likely given the data and should usually be over 60 %.
This study seeks to determine if sediments from lower Acorn Woman Lake, Oregon, contain evidence of Cascadia megathrust earthquakes. Each description of event deposits below includes a reference to the age–depth model (Fig. 16) and resulting modeled calendar ages for each of the deposits in the sequence. To determine if Cascadia megathrust earthquakes disturb sediments in the lake, we evaluate the timing and characteristics of the disturbances in the sedimentary record, starting with deposit J, which is suspected to have been deposited in response to the 1700 CE Cascadia megathrust earthquake. First, however, we summarize types of disturbances and how previous studies have differentiated between them.
4.1 Possible sources of event beds
The event deposits in this record could be a result of floods, post-disturbance (wildfire, land-clearing, earthquake) erosion or earthquakes (including megathrust, intraplate and crustal earthquakes). Because water is required to carry sediment, any watershed event deposits are included with flood deposits. Flood deposits can be of two basic types based on relative flood water (plus sediment) density: (1) inter- or surface-flow deposits or (2) density current (turbidity or hyperpycnal flow) deposits. Given that turbidites are not a unique identifier of earthquake deposits, we must differentiate between earthquake-triggered turbidites and other types of turbidites.
Turbidites can be of many forms and can result from different types of extreme events, including earthquakes (e.g., Goldfinger et al., 2012; Morey et al., 2013; Howarth et al., 2014; Moernaut et al., 2014; Monecke et al., 2018; and Vandekerkhove et al., 2020) and floods (e.g., Wilhelm et al., 2012; Gilli et al., 2013; Wirth, 2013; Vandekerkhove et al., 2020). Earthquake-triggered deposits are typically mass-transport deposits (resulting from subaquatic and subaerial landslides and debris flows) which form thick turbidites (Moernaut et al., 2014; Simmoneau et al., 2013), although smaller turbidites can result as well (Wilhelm et al., 2016; Moernaut et al., 2017; Monecke et al., 2018). Flood deposits are of two general types. Whereas interflow deposits result in simple normally graded deposits, floods that last days to weeks frequently produce deposits that may have pulses and reflect the waxing and waning of the flow which form inverse and then normally graded deposits (Alexander and Mulder, 2002; St-Onge et al., 2004).
In contrast, earthquake-triggered turbidites are typically normally graded deposits. Van Daele et al. (2019) have successfully discriminated between intraplate and megathrust earthquakes using lake sediments. The authors demonstrate that megathrust earthquakes are more likely to produce subaquatic slope failures as compared to intraslab earthquakes, which produced subaerial rock wall failures. These intraslab earthquake deposits are followed by the post-seismic removal of sediment from the watershed. Another study by Praet et al. (2022) provides additional information; they find that intraplate earthquakes may only disturb surficial slope sediment, resulting in thinner deposits as compared to megathrust earthquake deposits. The explanation for these findings is that intraslab earthquake spectra peak at a higher frequency (>5 Hz) compared to megathrust earthquakes (<5 Hz) and therefore have a greater potential to cause subaerial rockslides in the watershed, resulting in the post-seismic deposits resulting from the removal of sediment from the watershed. The soft lake sediments, however, are more likely to amplify the sustained low-frequency accelerations from subduction earthquakes, resulting in subaquatic slope failures.
4.2 Does the lower Acorn Woman Lake record contain an event deposited in 1700 CE?
Finding an event deposit dated to 1700 CE in the sedimentary record from lower Acorn Woman Lake would be strong evidence that the lake records Cascadia megathrust earthquakes; however, this is difficult to determine because of the challenges presented by the radiocarbon production curve (IntCal20; Reimer et al., 2020). Over the past 300–400 years variations in the radiocarbon production curve result in multiple intersections during radiocarbon calibration for a sample deposited in 1700 CE. The result is that there are multiple calendar ages that cannot be evaluated for their likelihood without additional information. As previously mentioned, the radiocarbon samples are detrital and therefore may be older than the time of deposition (typically by decades to centuries; see, for example, Streig et al., 2020) because they resided in the watershed for an unknown amount of time prior to emplacement and therefore must be considered maximum limiting ages.
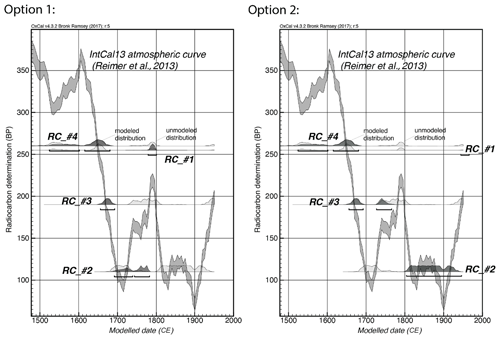
Figure 17Options for radiocarbon calibration assuming samples died close to the time surrounding sediment was deposited for deposit J. Option 1 is the result of the OxCal P_Sequence age–depth model presented in Fig. 16 (with RC no. 2), and option 2 is the alternative. Because the event-free sediment thickness is 71 cm (representing hundreds of years), option 1 is considered most likely. See text.
Sample 2, taken from just below deposit J, produced a radiocarbon determination of 110±25, similar to what would be expected for a sample that died around 1700 CE; however, calibration of this sample results in three probability peaks. If we assume that the age of the samples represents the stratigraphic order in which they were deposited, there are two options for radiocarbon samples 1–4 with respect to the radiocarbon production curve that are younger than 1950. A third option (youngest calendar age distribution) is discounted because sample J was deposited prior to the inflection in sediment density that reflects a change in land use (logging and road building). Option 1 is the modeled distribution determined by the age–depth model (shown in Fig. 17, left), which places sample 2 at 1680–1780, and option 2 is an alternative which places sample 2 between 1800–1940 (Fig. 17, right). Constraining the upper portion of the record can be approached by using the sedimentation rates from nearby lakes. Given there are 71 cm of event-free sediment above deposit J and a sedimentation rate of ∼1–3 cm per 10 years (based on the nearby Bolan Lake sedimentation rate – Briles et al., 2005 – and the upper Acorn Woman Lake sedimentation rate (known to have a higher sedimentation rate than lower Acorn Woman Lake but is used here too as a maximum possible rate) – Colombaroli et al., 2018), the range of possible time represented between the time of collection and deposition at the location of sample 2 is between ∼240–710 years. Using the average sedimentation rate from the age–depth model in Fig. 16 (∼2 cm per 10 years), the time represented by 71 cm is ∼350 years. Because the radiocarbon age for this sample is 1680–1940 (unmodeled), the maximum age for deposit J is 1680 CE, which is ∼330 years prior to the time of collection. This places the likely age of the sample between ∼240–330 years prior to the date of collection, supporting the interpretation that the older of the calibration peak options for sample 2 (Fig. 17, left) is more likely.
The formation of deposit J at around the time of the 1700 CE earthquake is supported by additional information from upper Acorn Woman Lake. Colombaroli et al. (2018) used CT scans to estimate the proportion of fluvial silt at millimeter resolution and then modeled the age–depth time series using the fluvial silt-free sediment depths. Their method identified seven anomalously thick, rapidly deposited layers (compared to a frequency–magnitude distribution) that were suspected to have been formed in response to a different process than erosion, possibly earthquakes. One of these thick events correlates to deposit J (see Fig. 12). Their age–depth model resulted in an age range of 1718–1758 CE for this deposit, close to the maximum limiting radiocarbon age for deposit J, suggesting that the older part of the radiocarbon distribution is consistent with the sedimentation above the event and the likelihood of stratigraphic order.
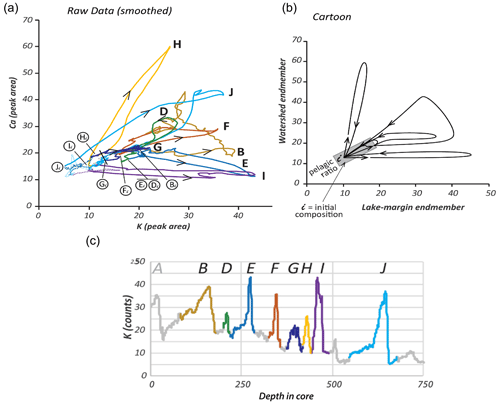
Figure 18XRF scatterplots: results and interpretation. Colored lines represent the individual disturbance deposits also shown individually in Fig. 15. (a) Variability through the disturbance deposits in core SQB5 can be expressed in terms of the endmembers K and Ca (shown here after smoothing). Each of the deposits displays variability that is unique and related to the initial composition of the disturbed sediment, sediment partitioning and/or additional inputs during deposition. (b) This cartoon demonstrates how patterns in the data may be interpreted as changes in composition of provenance indicators from the base of an event to the top as it evolves during deposition. Arrows show the direction with depth from the base of the deposit to the top as in Fig. 15. Each deposit begins at the initial background ratio between Ca and K and increases and decreases along a distinctive path before the deposit ends as the composition returns to the initial background ratio. A suggested explanation for these patterns is that they reflect the relative amounts of each variable (calcium and potassium) and a third implicit variable related to sediment density, organic content and grain size. (c) Key to colors represented by the data is shown in (a).
Replacing radiocarbon sample 2 with a calendar age of 1700 CE (blue lines indicating envelope boundaries shown in Fig. 16) produces model agreement statistics that support the assumption that deposit J was deposited close to 1700 CE. The original model with sample 2 results in moderate agreement between the data and model (overall agreement is 64.7 %), whereas for the model using the 1700 CE date in place of sample 2 the agreement between the data and model is higher, suggesting a better fit than that obtained by the model with the radiocarbon sample 2 date (Acomb is 0.8 and 0.65, respectively).
4.3 Insight into depositional processes and attributions
4.3.1 XRF data
Distinctive patterns exist in the raw XRF data through the event deposits (Figs. 14 and 15). To investigate these patterns, we represent the relationship between endmember indicators Ca and K (expressed as raw counts, after smoothing with a nine-point Gaussian filter) for core SQB5 as a scatterplot (Fig. 18). Ca and K are useful elements for provenance tracking because Ca amphiboles (sourced primarily from the Slickear Creek drainage to lower Acorn Woman Lake from the north) are present in Slickear Creek watershed rocks, while K is more prevalent in muscovite (sourced from the Condrey Mountain Schist which provides material from Acorn Woman Creek to lower Acorn Woman Lake; Table 7). No calcium-rich rocks were detected in the Condrey Mountain Schist.
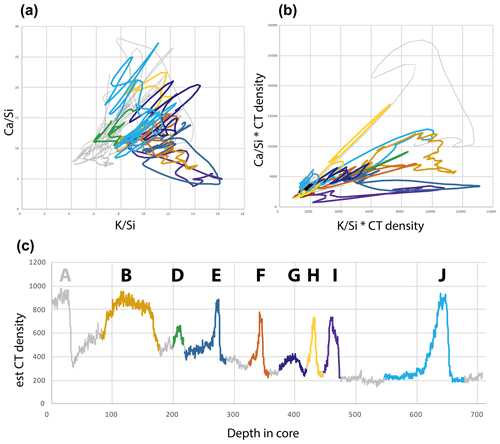
Figure 19XRF data normalized by silicon and scaled by radiodensity. The smoothed, raw data were normalized by silicon (a) and then scaled by radiodensity (b). The similarity between (a) in Fig. 18 and (b), this figure, suggests that the relationships between variables calcium and potassium for each of the disturbance event deposits A–J (c) are different and reflect both sediment provenance and sediment density.
The scatterplot of the raw, smoothed data (Fig. 18a) reveals patterns that were not obvious from the downcore representation of the elemental data (compare Fig. 18 to Figs. 14 and 15). A cartoon (Fig. 18b) illustrates that the original interpretation of the patterns in the raw data appear to reflect the relative amounts of each component with deposition (key to color-coding for each disturbance A–J shown in Fig. 18c) through deposits. The XRF variables Ca and K expressed as peak area (raw counts), however, are not true endmember concentrations because the data contain artifacts. These artifacts are primarily related to bulk density (porosity), which affects the amount of material present in the X-ray beam, and are different for each sample as a result of the “closed sum effect” (Rollinson, 1993; van der Weijden, 2002). A variety of factors, such as X-ray tube age, surface roughness, dilution by organic matter and X-ray attenuation differences from variations in water content, also contribute to these artifacts (Boyle et al., 2015; Löwemark et al., 2011; Thomson et al., 2006). To account for this, another variable is frequently used to normalize XRF elemental data (i.e., the log ratio method of Weltje et al., 2015) to better quantify the composition of different components but at the expense of potentially adding analytical noise (see Bertrand et al., 2024, for an expanded discussion of the use of XRF and other tools to interpret sediment geochemistry).
We normalized the raw data to silicon (Fig. 19a) and then plotted potassium versus calcium for comparison with the raw data to remove the influence from the artifacts. The results clearly show that deposits J and H are enriched in calcium compared to other event deposits. To determine if sediment density contributes to the patterns observed in the raw data, the normalized data are scaled by radiodensity (Fig. 19b). The patterns in the scatterplot look very similar to the scatterplot of the raw data (Fig. 18a). If normalizing reduces the effect of other influences such as radiodensity to more accurately represent mineralogical changes, then similar patterns in Figs. 19b and 18a suggest that radiodensity (and correlated variables) is inherently part of the raw XRF counts. Because the raw data are highly reproducible, and to first order the raw data represent the composition and density of the sediment, the raw data were chosen for this investigation and are interpreted to approximate endmember composition changes with an implicit third variable related to radiodensity (and not, therefore, a rigorous investigation of the geochemistry). Although using raw XRF data in this way does not remove artifacts, it does allow for the characterization of sediment layers (as was similarly done in Lu et al., 2021). The resulting loops in the scatterplots can then be interpreted to represent approximate elemental changes with grading through deposits, where the XRF loops begin to deviate from the initial background value at the base of the deposit (identified by the encircled letters with subscript i in Fig. 18a). The identification of boundaries between disturbed and undisturbed sediment using this method was essential for creating the event-free stratigraphic sequence for the development of the age–depth model.
Here we demonstrate the usefulness of the XRF scatterplots, along with other information, to infer mechanisms controlling deposition for deposits A–J and then use all data (including age data) to make inferences regarding attribution.
Deposit J
Deposit J, described previously as a medium-silt deposit displaying unusual grading characteristics, is well-sorted at the base (becoming less so upward) and lacks diatoms and particulate and degraded organics in the basal silt. The basal silt is visibly light in color with a sharp base, and there appears to be evidence of loading into the organic-rich sediment below. The age–depth model suggests that deposit J may have been formed in response to the 1700 CE Cascadia megathrust earthquake.
To gain insight into the processes influencing deposition, we look to the raw XRF geochemical data (Fig. 20) as a scatterplot of potassium to calcium for deposit J. Note that the visible base and top of the deposit do not start and end at the background ratio (represented by the initial positions of deposits G, H and I). This “gap” suggests that there is more at the base and the top of the deposit than is visible to the eye. In other words, the basal silt may be preceded by, and/or followed by, sediment that is part of the event deposit (or from closely spaced events without interevent sedimentation between them). Sediment below the primary silt unit (blue line, center top) suggests the preferential reduction in K prior to the more obvious base of the silt, which has a preferential initial increase in Ca (representing sediment sourced from the Slickear Creek watershed). Microscopic inspection identifies a thin (sub-millimeter scale) micaceous-silt layer followed by organic-rich sediment a few centimeters below the primary silt. Whereas this silt layer is indistinct in the northern cores, it is more obvious in the deeper-water cores, especially SQB9. This suggests that the precursor may be a bypass turbidite (fine-grained turbidites that are formed when the coarser sediment bypasses the location; see Bouma, 2000) that is visibly present in deeper-water cores but indistinct in the northern shallower-water cores. Alternatively, this may be the result of a separate, smaller event that occurred immediately prior to deposit J.
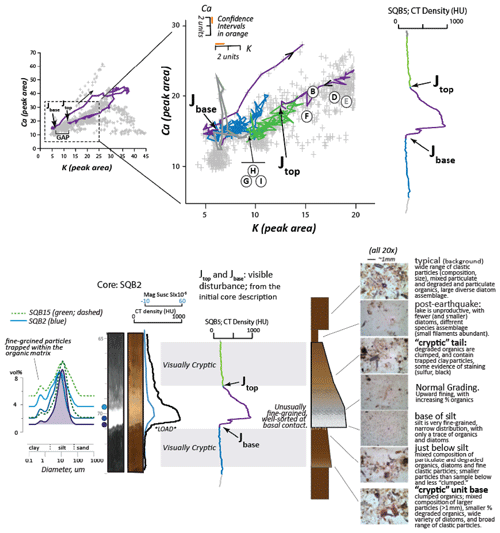
Figure 20Deposit J is a complex sequence with cryptic components. Upper panel: the gap that exists between the initial and final ratios in the XRF scatterplot for deposit J can be filled in by including the sediment below (shown in blue) and by interpreting the upper portion to be a long tail (shown in green). XRF calcium and potassium confidence intervals (inset in blow-up of the scatterplot, center top) were produced by repeatedly measuring the same section of core. The cryptic components of deposit J meet close to the initial positions of deposits G, H and I. The base of the visible silt unit is slightly enriched in calcium relative to background and is very well-sorted and fine-grained. This unit appears to “bleed down” from the clastic base into the very fine, organic-rich sediment below, suggesting loading which can result when dense sediment abruptly settles onto sediment that is less dense. Alternatively, this could be the result of coseismic injection of silt into the sediment below. The cryptic tail of the deposit is followed by a change in the size and types of diatoms and other components, suggesting a post-earthquake change in water column organisms, possibly as a result of flocculation. Note that the data in the scatterplot are not smoothed to show the true variability in the data. Note also the pulse of watershed-sourced sediment (high in calcium, low in potassium) identified by the gray line above the cryptic tail of deposit J. Lower panel: descriptive core data and imagery are shown for deposit J and surrounding sediment with the visually cryptic components (gray bars above and below the dense silt unit) identified.
Sediment above the primary silt unit (green line, center top) represents a long tail that returns to the initial position with respect to the background ratio. This tail is also apparent in the radiodensity (Fig. 20, lower panel). The tail is followed by a very low radiodensity layer (a few centimeters thick) that visually appears to be part of the background sediment; however, the diatoms and other water column organisms are of different species (see smear slides in Fig. 20, bottom right). The presence of an organic tail is supported by the loss on ignition data that show a 30 % decrease in inorganic content along its length.
The XRF data suggest that grading through the dominant silt layer is complex. As grading progresses upward, the XRF pattern changes in a way that appears to reflect the partitioning of entrained sediment into components slightly enriched in each elemental endmember: as the deposit grades upward, first in the direction of Ca, it loops around (suggesting the influence of another variable) and then returns to a background slightly depleted in Ca with respect to background sediment. This complexity is unlikely to reflect multiple events through time because values do not ever go back to background. Possible explanations for the characteristics of deposit J are that suspended material remained in the water column while being partitioned as shaking continued and then slowed (possibly influenced by an internal wave, as the lake was likely ice-covered given the elevation and the earthquake occurred in January), or it could be the result of simple differential settling as shaking ceased. Differentiating between these interpretations of the XRF grading pattern requires experimentation and further investigation to prove.
The lack of organic matter and diatoms and associated enrichment of Ca in the base of the silt would be expected from a delta-sourced turbidite. The low-frequency sustained ground motions would have triggered a turbidite sourced from the soft delta sediment, already enriched in Ca because the majority of the delta sediment would be sourced from the Slickear Creek watershed. This turbidite would have produced a suspension cloud with a larger fraction of Ca because the platy mica-enriched water would be denser and would flow more quickly downslope away from the proximal location of SQB5. This suspended fraction would then settle from the water column once shaking slowed, producing a Ca-rich deposit that is initially free of diatoms and other organic components.
Deposits H and I
Deposits H and I are a complex sequence that formed between 1819–1875 CE (based on the age–depth model).
Deposit I is a relatively thick (∼2 cm thick in SQB2) turbidite composed of disaggregated schist with visible mica fragments. The XRF scatterplot for deposit I demonstrates it varies almost entirely in the direction of K and therefore is not sourced from lake-margin slope sediment (which would be a mixture) or delta slope sediment (which would be enriched in Ca). It displays reversed and then normal grading from a coarse- to medium-grained silt upward to form a short organic tail followed by a thin layer of deciduous leaves (forming the boundary between the schist turbidite and the silt from deposit H above). Deposit I is very similar to deposit E, a local subaerial lake-margin slope-failure deposit, in that it is a turbidite formed of dark-gray schist with large mica flakes. It contrasts with deposit E in that it is found in all cores, suggesting that deposit I was formed because of a disturbance great enough to result in terrestrial landslides around the lake. As a result, this event deposit is interpreted to be a subaerial lake-margin slope failure from an earthquake, likely the 1873 CE Brookings earthquake because of timing and because shaking was strong enough in the region to topple chimneys. This deposit is unlike a thin slope-derived intraplate deposit and therefore is interpreted to be the result of a nearby crustal earthquake.
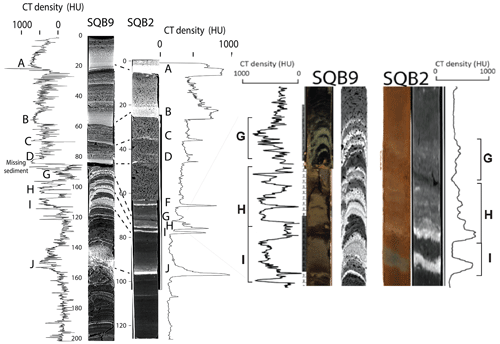
Figure 21Comparison of deposits G, H and I from shallow and deep cores. A comparison of deposits G, H and I from SQB2 to G, H and I from deeper-water core SQB9 (selected because it is from near the lake depocenter and therefore less likely to be missing sediment due to erosion). Depth intervals are in centimeters.
In contrast, deposit H is composed of Ca-rich sediment sourced from the Slickear Creek watershed in core SQB5 (more so than any other deposit based on XRF; Fig. 15), suggesting it also was the result of a delta slope failure. This suggests a subduction earthquake origin for this deposit because the basal silt is not a thin turbidite sourced from the slope (forming a thin, mixed-source turbidite like an intraplate earthquake deposit) or a thick turbidite from a subaerial landslide (like deposit I, the result of a crustal earthquake). The enrichment of Ca in this deposit relative to deposit J suggests that either the delta slope contained a larger proportion of Ca-rich sediment (which could happen if there was a shift to a wetter climate, which is suggested by the sedimentation rate inferred by the age–depth model) or there could be the addition of Ca-rich sediment into the water column during shaking as a result of liquefaction or settling of the Slickear Creek delta matrix.
The tail of this event deposit in SQB2 is hummocky with respect to radiodensity instead of smoothly grading upward (Fig. 21). SQB9 (from near the lake's depocenter) contains a temporal correlative to deposit H, but it is composed of multiple turbidites (Fig. 21). The multiple turbidites forming deposit H in deep-water core SQB9 have several possible explanations: they could be (a) synchronously triggered “amalgamated turbidites” (using the terminology of Van Daele et al., 2017, 77–78) from a single earthquake producing multiple individual slope failures that traveled different distances (and therefore different travel times) to reach the lake's depocenter (SQB9), depositing one over the other; (b) the result of reflection waves or a seiche from a single earthquake producing multiple stacked deposits; (c) a mainshock and aftershock sequence for a single earthquake; (d) an earthquake with a complex source function; (e) a post-earthquake retrogressive failure sequence; or (f) “turbidite stacks” (again, using the terminology Van Daele et al., 2017, 77–78), suggesting multiple earthquakes occurred in sequence.
The simplest explanation is that the multiple turbidites forming deposit H in core SQB9 are the result of mechanism (a) and as a result are amalgamated turbidites. This, however, is unlikely because deposit J appears as a single pulse in core SQB9, suggesting one channel (Fig. 21). Deposit H in core SQB9, however, has more than one turbidite pulse, suggesting that the number of channels is not the explanation for the observed sequence. This interpretation may be influenced, however, by the location of SQB9, which is just off of the lake's depocenter.
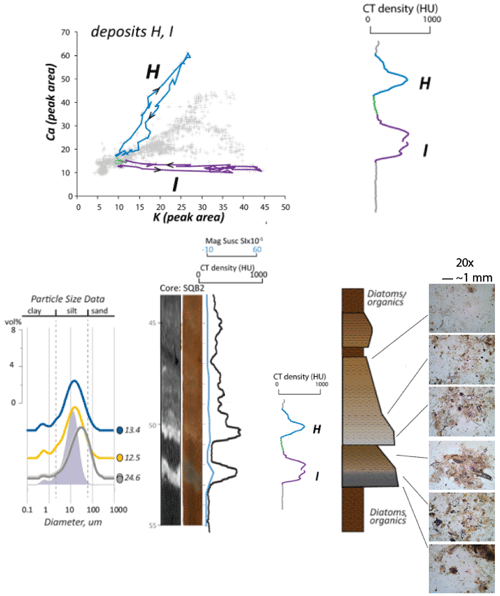
Figure 22Characteristics of disturbance event deposits H and I. These deposits appear to be triggered closely spaced in time because sediment composition does not stay at background levels, but deposit I instead transitions immediately into deposit H. Top panels: XRF loop for H (light blue) is clockwise increasing along the calcium axis, while the loop for I (purple) is counterclockwise along the potassium axis, suggesting different depositional mechanisms. The purple-shaded particle-size data are from deposit J for comparison with the particle-size data from deposits H and I. Note that the horizontal axis for the cartoon of the deposit sequence (bottom right panel) represents sediment radiodensity.
There is little evidence supporting the following alternative hypotheses. Mechanism (c), explaining the deposit characteristics as the result of a mainshock and aftershock sequence, seems unlikely because the pulses do not get smaller upward as would be expected if there was a combination of mainshocks and aftershocks and there is no background sediment between pulses. This explanation is also unlikely because the deposits are less likely to have been deposited over time (weeks or longer) because the XRF scatterplot through deposit H in core SQB5 is a continuous loop (which does not go back to background until the end; Fig. 22). A single event with aftershocks can sometimes occur immediately after the mainshock and continue for hours (Toda and Stein, 2018); however, there were few aftershocks felt (Wong, 2005) in response to the 1873 CE Brookings earthquake (although the area was sparsely populated by settlers at the time). Mechanism (d), which explains the observed sequence as a result of a complex source function, is possible, but there is no evidence to support this. There is also no evidence to support mechanism (f), explaining the deposit as the result of multiple earthquakes at this location (based on newspaper accounts, Tom Brocher, personal communication, April 2024). Mechanism (e), explaining the multiple turbidites in SQB9 as post-earthquake retrogressive subaerial failures, is also unlikely because the turbidites are not composed of schist-derived sediment (like deposit I) in both deep and shallow cores.
This leaves mechanism (b), which explains the multiple turbidites as seiche deposits, which is our preferred hypothesis.
A subduction source is supported by evidence from newspaper reports of the 1873 CE earthquake. The pattern of ground motions in the region influenced by the earthquake is highly variable and does not simply dissipate with distance from the inferred epicenter (see Fig. S3). There was also a report of a small local tsunami wave just north of Cape Blanco, Oregon (Crescent City Courier, 29 November 1873): “about ten minutes after the shake he heard a noise off to the westward loud as a report of a hundred cannon, and that he noticed indications on the beach of very high water mosses and sand being thrown up to the highest water marks”. Although not conclusive, this supports the possibility of a subduction component to what appears to be the 1873 CE earthquake sequence of a crustal earthquake followed by a southern Cascadia megathrust earthquake.
In summary, the preferred interpretation is that deposits H and I were formed in response to two earthquakes in 1873 CE. Deposit I was formed first and was the result of a nearby crustal earthquake that caused lake-wide subaerial landslides. This was closely followed (∼ minutes) by another earthquake, a southern Cascadia megathrust earthquake that caused a seiche to form in the lake, producing deposit H. This suggests the 1873 CE earthquake may have been similar to the 2016 Kaikoura earthquake, which was a synchronous rupture on the megathrust and a set of crustal faults above the rupture in the overlying plate (Furlong and Herman, 2017). Although the Kaikoura earthquake is considered unusual in its complexity, several other fault systems, including southern Cascadia, have similar conditions required for this type of simultaneous rupture (Herman et al., 2023).
Deposit G
Deposit G, based on the age–depth model, settled between 1827–1892 CE. It is visibly indistinct in SQB2 but slightly denser than background sediment, with maximum radiodensity at the deposit center. The age–depth model suggests that deposit G could be the result of the large flood in 1890 (no. two of three based on stream gage data), a flood and dam failure in 1881 CE, the 1873 CE Brookings earthquake, or the flood of 1861–1862 CE. The 1873 CE Brookings earthquake caused strong shaking in the region (Wong, 2005) and therefore is more likely to have caused large event deposits H and I (see Discussion section above) which occurred prior to deposit G. Because the size of the 1890 CE flood was larger than the rain-on-snow event that caused the dam to fail in 1881, this deposit is most likely the result of the 1890 CE flood. This interpretation of deposit G is supported by a comparison with shallow and deep-water sites. Figure 21 shows that deposit G in SQB9 is a set of stacked flood deposits that accumulate through time because XRF indicates the deposit remains at background levels through the deposit (with a slight enrichment in K in the center of the deposit; Fig. 15). The proximity of the event deposit to deposits H and I, as well as the likelihood of subaerial landslides from the 1873 CE Brookings earthquake, suggests it is plausible that this deposit was created when flooding removed post-seismic sediment from both watersheds (because the sediment is of mixed composition) during the flood of 1890 CE.
Deposit F
Deposit F is a simple graded deposit which the age–depth model suggests settled between 1835–1908 CE. This deposit shows evidence of loading onto the organic sediment below in SQB2. The XRD mineralogy is unknown; however, the XRF data suggest a mixed composition enriched in K that does not vary in composition with changes in radiodensity at the midpoint of the deposit. Lower Acorn Woman Lake was influenced by a sequence of closely spaced events that began with the 1861–1862 event. These include the 1861–1862 CE atmospheric river flood event, the 1873 CE Brookings earthquake, the installation of the dam in 1877 CE, the winter rain-on-snow event in 1881 CE which caused the dam to fail, a large flood in 1890 CE (no. two of three based on stream gage data), a smaller flood in 1892 CE and the 1906 CE San Andreas earthquake. Because the larger flood occurred in 1890 CE, it seems likely that deposit F occurred as a result of an interflow deposit that resulted from this flood; however, a source from the smaller flood in 1892 CE cannot be ruled out.
Deposit E
This deposit is only found in core SQB5. There are no age data for this deposit because it cannot definitively be identified in the chronology core SQBss/1/2 composite; however, we know that the time of deposition is between deposits D and F. Deposit E is a subaerially sourced turbidite predominantly composed of Condrey Mountain Schist (based on XRD and the dark-gray color of the deposit with visible mica flakes). The XRF data show that changes through the deposit go primarily in the direction of K, implying a relative increase in schist-derived sediment. Slope failures are common at the location of SQB5, indicated by the large amount of sediment missing between deposits B and J in the short cores identified as narrow- and wide-diameter short cores (see false color image of core density at the top left of Fig. 11). This deposit was likely the result of a local terrestrial lake-margin wall failure because it is found in only one core, and the schist-derived composition suggests a lake-margin bedrock source for the sediment (not a mixed source as would be expected from the disturbance of subaquatic surficial sediment). An aseismic local wall failure deposit could have resulted from heavy winter rains (like the deep-seated slope failure that occurred in response to heavy rains during the winter of 2016 (which post-dates field work). Alternatively, it is possible that deposit E is a local wall failure deposit that resulted from an earthquake; however, it is considered unlikely because an earthquake is more likely to disturb sediment at more than just one location.
Deposit D
The age–depth model suggests that deposit D settled between 1870–1940 CE. Deposit D is unusual in several ways. It is a sequence of two silt units (the lowermost is thickest and is visually obvious) within a stiff layer of organic-rich sediment. This deposit displays a small counterclockwise loop in XRF (Fig. 15), and the lower silt unit is a simple graded unit. This basal silt is orange in color and is fine-grained and well-sorted. The XRF and XRD data suggest that although the majority of the deposit is of mixed composition, there is some enrichment of sediment sourced from the Slickear Creek watershed at the deposit base.
The age–depth model suggests that deposit D may be the result of a flood event or the 1906 CE San Andreas earthquake. Given that there is 58 cm (event-free) over the past 126 years (based on the location of the inflection in sediment density) and there is 14 cm between this inflection and deposit D, this makes the age of deposit D the date of inflection (∼1850 to ∼1880) plus 30 years, which is 1880 to 1910 CE. This is very close to the time of the 1906 CE San Andreas earthquake or the 1890 flood. The presence of an event deposit from the ∼M7.9 1906 CE San Andreas earthquake is considered plausible because felt reports from the region suggest minimum Modified Mercalli Intensity (MMI) values of IV in this region (Dengler, 2008; close to the limit of V–VI for delta failures suggested by Van Daele et al., 2019). Directivity of the 1906 CE San Andreas earthquake was from south to north (toward Acorn Woman Lakes), and seismic waves traveling in the direction of the rupture can have higher frequencies and amplitudes compared to those traveling perpendicular to the rupture direction (Daxer et al., 2024). Attribution to the 1906 San Andreas earthquake is further supported by the earthquake occurring along two main slip patches (Song et al., 2008) and deposit D containing two pulses of silt in sediments from lower Acorn Woman Lake.
Could deposit D be the result of an interflow flood deposit containing sediment sourced from the Slickear Creek watershed? Any flood would transport a mixture of sediment sources into the lake because there are two creek systems that feed the lake. To produce a flood deposit that is enriched in sediment sourced from the Slickear Creek watershed would require a very localized rainfall event only in the Slickear Creek watershed. Although the orange color of the portion of the deposit sourced from the Slickear Creek watershed indicates oxide formation on the grains (suggesting that the sediment resided in a subaqueous but oxygenated environment), this could happen in either a stream system or the delta. Because a small, localized flood (affecting the Slickear Creek system only) is unlikely, the preferred interpretation is that deposit D was deposited in response to the 1906 CE San Andreas earthquake. This suggests that distant (but large) crustal earthquakes can also destabilize the lake delta, resulting in a slight enrichment of Ca, but the result is thinner deposits as compared to deposits H and J, interpreted to be the result of Cascadia megathrust earthquakes.
Deposit C
The age–depth model suggests deposit C settled between 1880–1950 CE. Deposit C is a normally graded unit with an unknown composition that becomes thinner with distance from Acorn Woman Creek (see below deposits A and B in Fig. 5) near the dam, suggesting it may be the result of a flood. XRF data do not exist because deposit C is not in core SQB5 (it was eroded out of this core by the event producing deposit B). The most likely events to produce this deposit (based on the size of the event) are the third largest flood (which occurred in 1955) or the flood in 1927 associated with a debris dam failure. Given that the average sedimentation rate is ∼2.5 yr cm−1 and the interevent sediment thickness between deposits B and C is 18 cm (after accounting for erosion; Fig. 8, top left), it is suggested that deposit C is the result of the 1927 CE flood with debris dam failure. This interpretation is supported by a comparison with previous work that suggests that dam failures result in coarser and thicker deposits toward the dam (e.g., the 1929 CE dam collapse in Eklutna Lake; Boes et al., 2018); however, this may be confounded by other influences that change with distance from the dam (such as water depth). No sediment provenance data exist for this deposit; however, in core SQB2, this deposit is brown in color, similar to the lower portions of deposits A and B. Because deposit C was deposited well after the inflection point in radiodensity assumed to be the result of land use changes in ∼1850, the possibility that it is the result of the 1861–1862 CE flood event is considered very unlikely. The simplest explanation is that deposit C was deposited as a result of the 1927 CE flood and dam failure.
Deposits A and B
Deposits A (deposited between 1980–2013 CE) and B (attributed to the 1964 CE flood based on comparison with upper Acorn Woman Lake) are 5–20 cm thick, depending on the location in the lake, with a lake-wide extent and similar characteristics (Fig. 6). They have sharp bases with sediment likely missing below in all cores other than the deepest-water cores (SQB9 and SQB10); contain basal sediment with rootlets and degraded organic matter; and are coarse-grained, normally graded deposits. These characteristics suggest they are the result of erosive turbidity currents. Although the deposits are similar to one another, the base of deposit A (which is incomplete in core SQB5) has a thin layer of calcium-rich coarse silt, whereas the base of deposit B is composed of potassium-rich coarse micaceous silt.
Deposits A and B were most likely deposited in response to large flood events because the most recent historical events are the two largest historical flood events that occurred in 1997 and 1964 CE. Multiple first-hand reports describe the nature of the extreme flood of 1997 CE in the vicinity of lower Acorn Woman Lake: a landowner described the flood as having transported watershed-sourced beach sand from one end of the lake to the other (Bert Harr, personal communication, June 2015), and US Forest Service employees (Peter Jones, personal communication, December 2019; John McKelligott, personal communication, December 2020) described debris caught at the dam that caused the lake level to rise a few feet above the maximum water level. Water was seen shooting 10 ft (∼3 m) out of the spillway and caused damage to the gate. At Applegate Reservoir, a few kilometers downstream from Acorn Woman Lakes, water was flowing over the earthen dam and observed to undercut surficial slope sediment, causing slumping into the reservoir (Peter Jones, personal communication, December 2019). The extreme nature of this flood, relative timing compared to the 1964 flood and observations of beach sand suggest that the 1997 flood produced deposit A, the uppermost event deposit in the record. There were no other disturbance events around this time. Because there are no other event deposits with similar characteristics downcore, either flood events are more extreme than in the past or the supply of readily mobilized sediment has increased (which is likely assuming significant contributions to erosion as a result of logging and road building), or both. It is also possible that the built dam is more likely to trap debris and elevate the lake level in response to extreme flooding than the natural landslide dam. We conclude that deposit A resulted from the 1997 CE flood and deposit B resulted from the 1964 flood.
A summary of the deposit characteristics described in the preceding sections and their attributions to the closest temporal historical events based on the age–depth model is shown in Table 9.
Table 9Table of deposit characteristics and attributions.
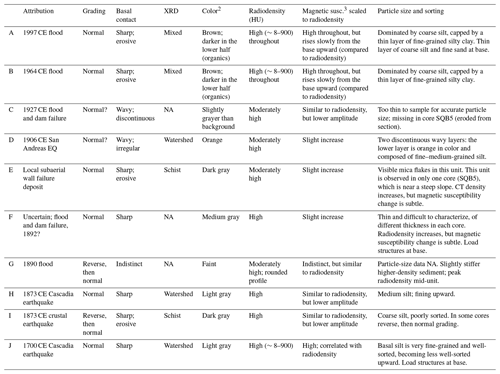
1 See Fig. 12. 2 Brown is 2.5Y 3/2, light gray is 2.5Y 4/1, dark gray is Gley 2 4/5PB, and orange is 5Y 4/1. Variations in colors through deposits were visibly obvious but frequently difficult to differentiate from one another using Munsell color charts. 3 Magnetic susceptibility variability was compared to the variability in radiodensity. Note that magnetic susceptibility data is influenced by surrounding sediment (exponential decrease with distance), and therefore the magnitude can be influenced by the thickness of the unit if thin (∼1 cm or less; see Fig. 13). Note that “watershed” refers to the Slickear Creek watershed. NA means not available.
4.4 Two other events of note
There are two event deposits that were not initially identified in the lower Acorn Woman Lake record that allow us to check our use of XRF to identify disturbances and differentiate between deposit types. The first is located between deposits I and J at 40 cm depth in core SQB5 (Fig. 5), and the second is below that, located in what appears to be the tail of deposit J (not visible to the eye in the physical-property data but located at ∼43 cm in core SQB5; Fig. 5). To determine the origins of these deposits, we turn to the XRF data.
The deposit located between deposits I and J rises and then falls in radiodensity and is followed by denser sediment that could be a tail. The XRF data, however, show that there is no sequential grading pattern to the deposit (red trace, Fig. 23). This deposit overlaps with deposit G, another suspected flood deposit. The interpretation is that this must be the result of a flood. One of the largest atmospheric river events in recorded history in the west occurred in 1861–1862 CE and lasted for 40 d (Engstrom, 1996). The stratigraphic position of this deposit supports this interpretation as having occurred just prior to the 1873 CE Brookings earthquake. If correct in that this deposit is the result of the 1861–1862 CE atmospheric river event, this would explain the denser sediment between this deposit and deposit I as a reflection of changes in land use around 1850 CE and does not represent a deposit tail.
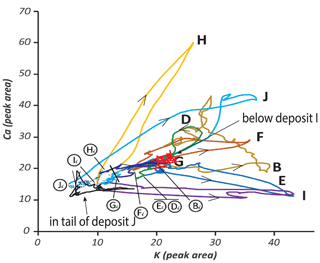
Figure 23A test of the methods. The use of XRF x–y plots demonstrates how flood deposits (red trace) can be differentiated from earthquake traces (black trace). Arrow heads indicate the direction of grading from the base to the top of each deposit.
In contrast, when evaluating the tail of event deposit J using XRF, a disturbance appears (shown by the black trace, Fig. 23). This sequence is very similar, but at a much smaller scale, to that of deposits H and I and is located at ∼43 cm in core SQB5 (Fig. 5). This suggests that another earthquake occurred soon after the 1700 CE earthquake (before the tail completely settled, which takes days to weeks; e.g., Van Daele et al., 2017; Wils et al., 2021). The southern Cascadia marine paleoseismic record also contains a Cascadia triggered turbidite with a likely northern San Andreas turbidite in the tail (Goldfinger, 2021), suggesting a San Andreas earthquake origin for this deposit as well. This seems plausible given that there is evidence that the 1906 CE San Andreas earthquake is present in lower Acorn Woman Lake (represented by deposit D).
These examples demonstrate the usefulness of the XRF scatterplots to identify deposit origins.
4.5 Summary of interpretations
Flood deposits have a mixed composition with some enrichment in K as compared to the background, reflecting the multiple watershed sources of these deposits. Enrichment in K appears to be associated with high water and slumping of sediment into the lake when undercut by fast-flowing water. Three types of flood deposits were described. The first type is represented by deposits A and B. They are thick turbidites with high magnetic susceptibility and radiodensity, but organic matter entrained in the base results in a brown color and lower magnetic susceptibility. The deposit bases show evidence of erosive flow. These deposits are interpreted to be the result of fast-flowing high water from the large floods of 1997 and 1964 CE. These floods may be influenced by land use changes (increasing runoff) because similar deposits are not found further downcore (see companion paper Morey and Goldfinger, 2024a). The second type of flood deposit is interpreted to be an interflow deposit, which is a simple graded silt unit exemplified by deposit F). The third type of flood deposit is represented by deposit G and the unlabeled deposit between deposit I and J. These deposits display reverse and then normal grading; this type of deposit is interpreted to be the result of pulsed floods lasting days to months and may reflect atmospheric river rain events. Because deposit G is attributed to a flood that occurred after an earthquake which caused subaerial landslides, it likely moved post-seismic terrestrial landslide sediment into the lake.
Three types of earthquake deposits are suggested by the data. The first type is represented by deposits J and H. These deposits are enriched in Ca-rich sediment sourced from the Slickear Creek watershed. Deposit J is interpreted to be the result of the 1700 CE Cascadia megathrust earthquake, and deposit H is suspected to be the result of a southern Cascadia megathrust earthquake in 1873 CE. The second type of earthquake deposit is represented by deposit I, which immediately precedes deposit H. Deposit I is a schist-derived subaerially sourced turbidite interpreted to be the result of a crustal fault. Deposits H and I are attributed to the 1873 CE earthquake, interpreted here to be a crustal earthquake followed by a subduction earthquake. A third possible type of earthquake deposit is represented by deposit D. It is a multipulsed graded deposit slightly enriched in Ca followed by silt of a mixed composition. Although a seismic source is uncertain, the preferred interpretation is that deposit D is the result of the 1906 San Andreas earthquake. These results suggest that the light-colored Ca-rich layers observed in the cores are the result of earthquakes with sustained, but not necessarily strong, ground motions, where the thickest of the units are the result of Cascadia megathrust earthquakes.
The setting at lower Acorn Woman Lake, Oregon (∼180 km inland of the deformation front in Cascadia), provided a unique opportunity to determine if it is possible to differentiate between event deposits resulting from floods and different types of earthquakes. The different rock types (K-rich schist and Ca-rich amphiboles) in the two watersheds (Acorn Woman Creek and Slickear Creek, respectively) provided the opportunity to evaluate the source of sediments and how deposits evolve during deposition using XRF, which provided clues to the mechanisms forming them.
We conclude that Cascadia megathrust earthquakes disturb sediments at lower Acorn Woman Lake and that it is possible to distinguish between plate boundary and other earthquakes. It was possible, as a result, to identify a deposit attributed to the 1700 CE Cascadia megathrust earthquake and to infer that the 1873 CE Brookings earthquake was actually two earthquakes: a crustal earthquake immediately followed by a southern Cascadia megathrust earthquake. XRF also allowed us to identify different types of flood deposits, including those suspected to be the result of extended periods of precipitation during atmospheric river events. We find that XRF is a particularly useful tool because it is a sensitive, high-resolution indicator of provenance and deposit evolution that has allowed for the identification of cryptic features, deposit boundaries and complex grading in the sediment cores, and it aids in the interpretation of mechanisms and processes controlling deposit formation. Although the XRF scatterplot approach to differentiating between deposit types for this study has been very useful, the successful application is likely site-specific, and methods used in this study may not be applicable in all settings. The results support the use of thicker (>1 cm) turbidites enriched in light-colored sediment sourced from the Slickear Creek watershed as a reliable indicator of Cascadia megathrust earthquakes when interpreting the downcore record.
There are several implications that arise from this study:
-
The possibility of crustal earthquakes in the region of Acorn Woman Lakes presents a new hazard to the region, not previously recognized.
-
The close proximity of deposit I (a crustal earthquake deposit) and deposit H (interpreted to be a Cascadia megathrust earthquake deposit) suggests a temporal association, possibly a triggering relationship, which would support the suggestion by Wells et al. (2017) that crustal faults in Cascadia may rupture in concert with Cascadia megathrust earthquakes.
-
If further investigation supports the interpretation that deposit H is the result of a southern Cascadia megathrust earthquake as suggested by the data, it will be the first example of a historical Cascadia megathrust earthquake.
-
The ability to identify atmospheric river events allows for the potential to investigate the frequency and timing of these events through time in Cascadia.
-
The identification of disturbed sediment allows for improved estimates from proxy climate and environmental data by informing where proxy data samples should be taken to avoid disturbed sediment.
-
This study underscores the importance of site selection when using sediment cores to interpret the record. This study benefitted from having proximal and deep-water cores, but interpretations were hampered because the deep-water cores were slightly off of the lake's depocenter.
These results suggest small lakes in Cascadia hold promise to improve our understanding of subduction and crustal earthquakes in the Cascadia forearc where there is a greater potential to impact people and infrastructure.
OxCal model code used to create the age–depth model can be found in Morey (2024d) (https://doi.org/10.5281/zenodo.13821040).
The following datasets are available: XRD data (https://doi.org/10.5281/zenodo.13891796, Morey, 2024a), computed tomography and XRF data (https://doi.org/10.5281/zenodo.13855178, Morey, 2024b), and Lower Acorn Woman Lake bathymetry data (https://doi.org/10.5281/zenodo.13821157, Morey, 2024c).
The supplement related to this article is available online at: https://doi.org/10.5194/nhess-24-4523-2024-supplement.
AEM conceptualized, designed and administered the project; supervised field operations during all three field seasons; acquired funding; managed field operations; acquired the data; developed the methodologies; analyzed and interpreted the data (including the use of all software for interpretation and modeling), and wrote the manuscript at all stages. MDS helped with core acquisition (2015 field season) and curation, as well as data acquisition, and participated in discussions of the data. DGG provided field gear and coring assistance for the 2013 and 2014 field seasons, and participated in discussions of the data, especially the comparisons with his previous work at upper Acorn Woman Lake. ARN participated in the 2013 and 2014 field seasons, provided expert guidance on radiocarbon sampling and funds for radiocarbon determinations, and helped acquire bathymetric data. CG participated in early discussions of project development and contributed funds for a radiocarbon age. MDS, DGG, ARN and CG also provided input on the manuscript draft.
The contact author has declared that none of the authors has any competing interests.
Publisher's note: Copernicus Publications remains neutral with regard to jurisdictional claims made in the text, published maps, institutional affiliations, or any other geographical representation in this paper. While Copernicus Publications makes every effort to include appropriate place names, the final responsibility lies with the authors.
This research was partially supported by the National Earthquake Hazards Reduction Program of the US Geological Survey (through a grant to Andrew Meigs and Simon Engelhart; USGS grant G17AP00028). The USGS Earthquake Hazards Program through Alan R. Nelson (USGS, Golden, Colorado) partially supported the collection of some Livingstone cores and CT scans of Livingstone and Kullenberg cores. Geological Society of America awards provided additional funding: a graduate student research grant and the Kerry Kelts Research Award. Coring in 2015 would not have been possible without contributions from Joseph Stoner and Roy Haggerty and a donation from Ruth Morey.
The US Forest Service granted permission for this study (special thanks go to Star Ranger Station employees and the regional office in Grants Pass, OR). We are extremely grateful for the assistance and knowledge provided by Ranger John McKelligott and for field assistance by Mark Anthony (US Forest Service employee who participated in coring in 2015). Thomas Brocher provided newspaper reports that reported shaking impacts from the 1873 Brookings earthquake. Bert Harr generously allowed access to his Slickear Creek property during this investigation and contributed significantly to this project through his vast knowledge of local extreme events and local and regional history since 1900. Peter Jones provided personal historical accounts of the more recent historical floods.
This project could not have happened without the generous assistance from numerous volunteers. Katie Alexander (Western Washington University) spent a few days canoeing in the cold to acquire bathymetric data. Maureen Walczak (Oregon State University, OSU) generously analyzed my first radiocarbon samples and provided guidance on how to use the radiocarbon production curve to select samples. Jamie Howarth (then at GNS Science, New Zealand) provided useful coring information and guidance, including sharing his approach to dating an earthquake event in lake sediments from about the same time as the 1700 CE Cascadia megathrust earthquake. Other volunteer field assistants included Randy Keller, Brendan Reilly, Katie Alexander and many others. Christy Briles (Colorado University, Denver) helped train me in the fine art of lake coring during a fateful summer week in 2010.
CSD and the University of Minnesota provided Kullenberg coring equipment and expertise. Thanks also go to the OSU core repository (especially Maziet Cheseby) for housing cores and providing the tools to process them. Carol Chin aided in core processing of the Kullenberg cores, for which we are extremely grateful. We would like to thank Anders Carlson for allowing me to be one of the first users of the Itrax. Finally, Ann E. Morey would also like to thank Joseph Stoner, Eric Kirby, Alan C. Mix, Jason R. Patton, Maarten Van Daele, Lonnie Leithold, Karl Wegmann, Joseph D. Ortiz and Nicklas G. Pisias for discussions and guidance.
The manuscript was significantly improved based on insightful comments by Maarten Van Daele and Shmuel Marco.
This research has been supported by the US Geological Survey (grant no. G17AP00028) and the Geological Society of America (graduate student research grant and Kerry Kelts Research Award).
This paper was edited by Oded Katz and reviewed by Shmuel Marco, Maarten Van Daele, and one anonymous referee.
Adams, J.: Paleoseismicity of the Cascadia subduction zone: Evidence from turbidites off the Oregon‐Washington margin, Tectonics, 9, 569–583, 1990.
Alexander, J. and Mulder, T.: Experimental quasi-steady density currents, Mar. Geol, 186, 195–210, 2002.
Bakun, W. H.: Seismicity of California's north coast, Bull. Seismol. Soc. Am., 90, 797–812, https://doi.org/10.1785/0119990138, 2000.
Beck, C.: Late quaternary lacustrine paleo-seismic archives in north-western Alps: Examples of earthquake-origin assessment of sedimentary disturbances, Earth-Sci. Rev., 96, 327–344, https://doi.org/10.1016/j.earscirev.2009.07.005, 2009.
Bennett, R. A., Wernicke, B. P., Niemi, N. A., Friedrich, A. M., and Davis, J. L.: Contemporary strain rates in the northern Basin and Range province from GPS data, Tectonics, 22, 1008, https://doi.org/10.1029/2001TC001355, 2003.
Bertrand, S., Tjallingii, R., Kylander, M. E., Wilhelm, B., Roberts, S. J., Arnaud, F., Brown, E., and Bindler, R.: Inorganic geochemistry of lake sediments: A review of analytical techniques and guidelines for data interpretation, Earth-Sci. Rev., 249, 104639, https://doi.org/10.1016/j.earscirev.2023.104639, 2023.
Boes,E., Van Daele, M., Moernaut, J., Schmidt, S., Jensen, B. J. L., Praet, N., Kaufman, D., Haeussler, P., Loso, M. G., and De Batist, M.: Varve formation during the past three centuries in three large proglacial lakes in south-central Alaska, GSA Bull., 130, 757–774, 2018.
Bouma, A. H.: Coarse-grained and fine-grained turbidite systems as end member models: applicability and dangers, Mar. Petrol. Geol., 17, 137–143, 2000.
Boyle, J. F., Chiverrell, R. C., and Schillereff, D.: Approaches to water content correction and calibration for μ XRF core scanning: Comparing X-ray scattering with simple regression of elemental concentrations, in: Micro-XRF studies of sediment cores, edited by: Croudace, I. W. and Rothwell, R. G., Springer, 373–390, ISBN 978-9401798488, 2015.
Bradbury, J. P.: Charcoal deposition and redeposition in Elk Lake, Minnesota, USA, Holocene, 6, 339–344, 1996.
Briles, C. E., Whitlock, C., and Bartlein, P. J.: Postglacial vegetation, fire and climate history of the Siskiyou Mountains, Oregon, USA. Quatern. Res., 64, 44–56, https://doi.org/10.1016/j.yqres.2005.03.001, 2005.
Bronk Ramsey, C.: OxCal Program (Version 4.3.2) [Computer software], Oxford University Research Lab for Archaeology, https://c14.arch.ox.ac.uk/oxcal.html (last access: October 2024), 2017.
Campbell, C.: Late Holocene lake sedimentology and climate change in southern Alberta, Canada, Quatern. Res., 49, 96–101, https://doi.org/10.1006/qres.1997.1946, 1998.
Coleman, R. G., Helper, M. D., and Donato, M. M.: Geologic map of the Condrey Mountain roadless area, Siskiyou County, California, US Geological Survey Miscellaneous Field Studies Map MF-1549A, US Geological Survey, https://doi.org/10.3133/mf1540A, 1983.
Colombaroli, D., Gavin, D. G., Morey, A. E., and Thorndycraft, V. R.: High resolution lake sediment record reveals self-organized criticality in erosion processes regulated by internal feedbacks, Earth Surf. Proc. Land., 43, 2181–2192, https://doi.org/10.1002/esp.4383, 2018.
Daxer, C., Wils, K., Ramisch, A., Strasser, M., and Moernaut, J.: Contrasting sedimentary and long-lasting geochemical imprints of seismic shaking in a small, groundwater-fed lake basin (Klopeiner See, Eastern European Alps), Sedimentologika, 2, 1296, https://doi.org/10.57035/journals/sdk.2024.e21.1296, 2024.
Dengler, L.: The 1906 earthquake on California's north coast, Bull. Seismol. Soc. Am., 98, 918–930, 2008.
Donato, M. M.: Preliminary geologic map of the Squaw Lakes quadrangle, Oregon and California (No. 93-703), United States Geological Survey, https://doi.org/10.3133/ofr93703, 1993.
Engstrom, W. N.: The California storm of January 1862, Quatern. Res., 46, 141–148, https://doi.org/10.1006/qres.1996.0054, 1996.
Furlong, K. P. and Herman, M.: Reconciling the deformational dichotomy of the 2016 Mw 7.8 Kaikoura New Zealand earthquake, Geophys. Res. Lett., 44, 6788–6791, 2017.
Gilli, A., Anselmetti, F. S., Glur, L., and Wirth, S. B.: Lake Sediments as Archives of Recurrence Rates and Intensities of Past Flood Events, in: Dating torrential processes on fans and cones, vol. 47, edited by: Schneuwly-Bollschweiler, M., Stoffel, M., and Rudolf-Miklau, F., Springer, 225–242, Print ISBN 978-94-007-4335-9, 2013.
Goldenson, N., Leung, L. R., Bitz, C. M., and Blanchard-Wrigglesworth, E.: Influence of Atmospheric Rivers on Mountain Snowpack in the Western United States, J. Climate, 31, 9921–9940, 2018.
Goldfinger, C.: Paleoseismic Record of Peninsula Segment Earthquakes on the San Andreas Fault near San Francisco, CA and possible NSAF linkage to Cascadia, https://ui.adsabs.harvard.edu/abs/2019AGUFMOS54A..03G/abstract (last access: 12 April 2024), 2021.
Goldfinger, C., Grijalva, K., Bürgmann, R., Morey, A. E., Johnson, J. E., Nelson, C. H., Gutiérrez-Pastor, J., Ericsson, A., Karabanov, E., Chaytor, J. D., Patton, J., and Gràcia, E.: Late Holocene rupture of the northern San Andreas fault and possible stress linkage to the Cascadia subduction zone, Bull. Seismol. Soc. Am., 98, 861–889, https://doi.org/10.1785/0120060411, 2008.
Goldfinger, C., Nelson, C. H., Morey, A. E., Johnson, J. E., Patton, J. R., Karabanov, E. B., Gutierrez-Pastor, J., Eriksson, A. T., Gràcia, E., Dunhill, G., Enkin, R. J., Dallimore, A., and Vallier, T.: Turbidite event history: Methods and implications for Holocene paleoseismicity of the Cascadia subduction zone, US Geological Survey Professional Paper 1661-F, US Geological Survey, https://doi.org/10.3133/pp1661F, 2012.
Goldfinger, C., Morey, A. E., Black, B., Beeson, J., Nelson, C. H., and Patton, J.: Spatially limited mud turbidites on the Cascadia margin: Segmented earthquake ruptures?, Nat. Hazards Earth Syst. Sci., 13, 2109–2146, https://doi.org/10.5194/nhess-13-2109-2013, 2013.
Goldfinger, C., Galer, S., Beeson, J., Hamilton, T., Black, B., Romsos, C., Patton, J., Nelson, C. H., Hausmann, R., and Morey, A.: The importance of site selection, sediment supply, and hydrodynamics: A case study of submarine paleoseismology on the northern Cascadia margin, Washington USA, Mar. Geol., 384, 25–46, https://doi.org/10.1016/j.margeo.2016.06.008, 2017.
Hennebelle, A., Aleman, J. C., Ali, A. A., Bergeron, Y., Carcaillet, C., Grondin, P., Landry, J., and Blarquez, O.: The reconstruction of burned area and fire severity using charcoal from boreal lake sediments, Holocene, 30, 1400–1409, 2020.
Herman, M. W., Furlong, K. P., and Benz, H. M.: Substantial upper plate faulting above a shallow subduction megathrust earthquake: Mechanics and implications of the surface faulting during the 2016 Kaikoura, New Zealand, earthquake, Tectonics, 42, e2022TC007645, https://doi.org/10.1029/2022TC007645, 2023.
Horton, D. E., Johnson, N. C., Singh, D., Swain, D. L., Rajaratnam, B., and Diffenbaugh, N. S.: Contribution of changes in atmospheric circulation patterns to extreme temperature trends, Nature, 522, 465–469, https://doi.org/10.1038/nature14550, 2015.
Hotz, P. E.: Regional metamorphism in the Condrey Mountain quadrangle, north-central Klamath Mountains, California, Geological Survey Professional Paper No. 1086, US Government Printing Office, https://doi.org/10.3133/pp1086, 1979.
Howarth, J. D., Fitzsimons, S. J., Norris, R. J., and Jacobsen, G. E.: Lake sediments record cycles of sediment flux driven by large earthquakes on the Alpine fault, New Zealand, Geology, 40, 1091–1094, https://doi.org/10.1130/G33486.1, 2012.
Howarth, J. D., Fitzsimons, S. J., Norris, R. J., and Jacobsen, G. E.: Lake sediments record high intensity shaking that provides insight into the location and rupture length of large earthquakes on the Alpine Fault, New Zealand, Earth Planet. Sc. Lett., 403, 340–351, 2014.
Inouchi, Y., Kinugasa, Y., Kumon, F., Nakano, S., Yasumatsu, S., and Shiki, T.: Turbidites as records of intense palaeoearthquakes in Lake Biwa, Japan, Sediment. Geol., 104, 117–125, https://doi.org/10.1016/0037-0738(95)00124-7, 1996.
Johnson, D. M.: Atlas of Oregon Lakes, https://oregonlakesatlas.org/map (last access: 6 Dcember 2024), 1996.
Karlin, R. and Seitz, G.: A basin wide record of earthquakes at Lake Tahoe: Validation of the earthquake induced turbidite model with sediment core analysis: Collaborative research with UNR and SDSU, Final Technical Report for 07HQGR0014 and 07HQGR0008, United States Geological Survey, 18 pp., https://earthquake.usgs.gov/cfusion/external_grants/reports/07HQGR0014.pdf (last access: 12 April 2024), 2007.
Karlin, R. E. and Abella, S. E.: Paleoearthquakes in the Puget Sound region recorded in sediments from Lake Washington, USA, Science, 258, 1617–1620, https://doi.org/10.1126/science.258.5088.1617, 1992.
Karlin, R. E. and Abella, S. E. B.: A history of Pacific Northwest earthquakes recorded in Holocene sediments from Lake Washington, J. Geophys. Res.-Solid, 101, 6137–6150, https://doi.org/10.1029/95JB01626, 1996.
Karlin, R. E., Holmes, M., Abella, S. E. B., and Sylwester, R.: Holocene landslides and a 3500-year record of Pacific Northwest earthquakes from sediments in Lake Washington, Geol. Soc. Am. Bull., 116, 94–108, 2004.
Kelts, K., Briegel, U., Ghilardi, K., and Hsu, K.: The limnogeology-ETH coring system, Swiss J. Hydrol., 48, 104–115, 1986.
Kirby, E., McKenzie, K. A., McKenzie, K. A., Furlong, K., and Hefner, W.: Geomorphic Fingerprints of Active Faults in the Southern Cascadia Forearc and heir Geodynamic Significance, GSA Connects 2021, Portland, Oregon, Paper No. 30-3, Abstr. Programs 53, Geol. Soc. America, https://doi.org/10.1130/abs/2021AM-370126, 2021.
Kneller, B. C. and McCaffrey, W. D.: The interpretation of vertical sequences in turbidite beds: The influence of longitudinal flow structure, J. Sediment. Res., 73, 706–713, https://doi.org/10.1306/031103730706, 2003.
LaLande, J.: An environmental history of the Little Applegate River watershed, USDA, Forest Service, Medford, OR, http://soda.sou.edu/awdata/020912c1.pdf (last access: 12 February 2014), 1995.
Lamoureux, S.: Temporal patterns of suspended sediment yield following moderate to extreme hydrological events recorded in varved lacustrine sediments, Earth Surf. Proc. Land., 27, 1107–1124, https://doi.org/10.1002/esp.399, 2002.
Larson, D. W.: Preliminary Investigation of Mercury in Squaw Lakes, Applegate River Basin, Oregon, US Army Corps of Engineers, Portland District, 1975.
Leithold, E. L., Wegmann, K. W., Bohnenstiehl, D. R., Smith, S. G., Noren, A., and O'Grady, R.: Slope failures within and upstream of Lake Quinault, Washington, as uneven responses to Holocene earthquakes along the Cascadia subduction zone, Quatern. Res., 89, 178–200, https://doi.org/10.1017/qua.2017.96, 2018.
Leithold, E. L., Wegmann, K. W., Bohnenstiehl, D. R., Joyner, C. N., and Pollen, A. F.: Repeated megaturbidite deposition in Lake Crescent, Washington, USA, triggered by Holocene ruptures of the Lake Creek-Boundary Creek fault system, GSA Bull., 131, 2039–2055, 2019.
Leonard, L. J., Currie, C. A., Mazzotti, S., and Hyndman, R. D.: Rupture area and displacement of past Cascadia great earthquakes from coastal coseismic subsidence, GSA Bull., 122, 2079–2096, 2010.
Long, C. J., Whitlock, C., Bartlein, P. J., and Millspaugh, S. H.: A 9000-year fire history from the Oregon Coast Range, based on a high-resolution charcoal study, Can. J. Forest Res., 28, 774–787, https://doi.org/10.1139/x98-051, 1998.
Löwemark, L., Chen, H. F., Yang, T. N., Kylander, M., Yu, E. F., Hsu, Y. W., Lee, T. Q., Song, S. R., and Jarvis, S.: Normalizing XRF-scanner data: A cautionary note on the interpretation of high-resolution records from organic-rich lakes, J. Asian Earth Sci., 40, 1250–1256, https://doi.org/10.1016/j.jseaes.2010.06.002, 2011.
Lu, Y., Moernaut, J., Bookman, R., Waldmann, N., Wetzler, N., Agnon, A., Marco, S., Alsop, G. I., Strasser, M., and Hubert‐Ferrari, A.: A new approach to constrain the seismic origin for prehistoric turbidites as applied to the Dead Sea Basin, Geophys. Res. Lett., 48, e2020GL090947, https://doi.org/10.1029/2020GL090947, 2021.
McCrory, P. A., Hyndman, R. D., and Blair, J. L.: Relationship between the Cascadia fore-arc mantle wedge, nonvolcanic tremor, and the downdip limit of seismogenic rupture, Geochem. Geophy. Geosy., 15, 1071–1095, https://doi.org/10.1002/2013GC005144, 2014.
McKenzie, K. A. and Furlong, K. P.: Isolating non-subduction-driven tectonic processes in Cascadia, Geosci. Lett., 8, 10, https://doi.org/10.1186/s40562-021-00181-z, 2021.
McKenzie, K. A., Furlong, K. P., and Kirby, E.: Mid-Miocene to present upper-plate deformation of the southern Cascadia forearc: Effects of the superposition of subduction and transform tectonics, Front. Earth Sci., 10, 832515, https://doi.org/10.3389/feart.2022.832515, 2022.
Moernaut, J., Daele, M. V., Heirman, K., Fontijn, K., Strasser, M., Pino, M., Urrutia, R., and De Batist, M.: Lacustrine turbidites as a tool for quantitative earthquake reconstruction: New evidence for a variable rupture mode in south central Chile, J. Geophys. Res.-Solid, 119, 1607–1633, 2014.
Moernaut, J., van Daele, M., Strasser, M., Clare, M. A., Heirman, K., Viel, M., Cardenas, J., Kilian, R., de Guevara, B. L., Pino, M., Urrutia, R., and De Batist, M.: Lacustrine turbidites produced by surficial slope sediment remobilization: A mechanism for continuous and sensitive turbidite paleoseismic records, Mar. Geol., 384, 159–176, https://doi.org/10.1016/j.margeo.2015.10.009, 2017.
Monecke, K., Anselmetti, F. S., Becker, A., Sturm, M., and Giardini, D.: The record of historic earthquakes in lake sediments of Central Switzerland, Tectonophysics, 394, 21–40, https://doi.org/10.1016/j.tecto.2004.07.053, 2004.
Monecke, K., McCarthy, F. G., Hubeny, J. B., Ebel, J. E., Brabander, D. J., Kielb, S., Howey, E., Janigian, G., and Pentesco, J.: The 1755 Cape Ann earthquake recorded in lake sediments of eastern New England: An interdisciplinary paleoseismic approach, Seismol. Res. Lett., 89, 1212–1222, 2018.
Morey, A. E.: XRD for provenance, Zenodo [data set], https://doi.org/10.5281/zenodo.13891796, 2024a.
Morey, A. E.: Computed Tomography and XRF data for core SQB5 (Lower Acorn Woman Lake), Zenodo [data set], https://doi.org/10.5281/zenodo.13855178, 2024b.
Morey, A. E.: Bathymetric data for upper and lower Acorn Woman Lakes, Zenodo [data set], https://doi.org/10.5281/zenodo.13821157, 2024c.
Morey, A. E.: Oxcal model code for “A 2700-year record of Cascadia megathrust and crustal/slab earthquakes from Acorn Woman Lakes, Oregon”, Zenodo [code], https://doi.org/10.5281/zenodo.13821040, 2024d.
Morey, A. E. and Goldfinger, C.: A 2700-year record of Cascadia megathrust and crustal/slab earthquakes from Acorn Woman Lakes, Oregon, Nat. Hazards Earth Syst. Sci., 24, 4563–4584, https://doi.org/10.5194/nhess-24-4563-2024, 2024a.
Morey, A. E. and Goldfinger, C.: A 2700-yr record of Cascadia megathrust and crustal/slab earthquakes from Upper and Lower Acorn Woman Lakes, Oregon, Research Square, https://doi.org/10.21203/rs.3.rs-2277419/v3, 2024b.
Morey, A. E., Goldfinger, C., Briles, C. E., Gavin, D. G., Colombaroli, D., and Kusler, J. E.: Are great Cascadia earthquakes recorded in the sedimentary records from small forearc lakes?, Nat. Hazards Earth Syst. Sci., 13, 2441–2463, https://doi.org/10.5194/nhess-13-2441-2013, 2013.
Mulder, T., Syvitski, J. P. M., Migeon, S., Faugeres, J. C., and Savoye, B.: Marine hyperpycnal flows; initiation, behavior and related deposits; a review: Turbidites; models and problems, Mar. Petrol. Geol., 20, 861–882, https://doi.org/10.1016/j.marpetgeo.2003.01.003, 2003.
Oldow, J. S., Aiken, C. L. V., Hare, J. L., Ferguson, J. F., and Hardyman, R. F.: Active displacement transfer and differential block motion within the central Walker Lane, western Great Basin, Geology, 29, 19–22, 2001.
Patton, J. R., Goldfinger, C., Morey, A. E., Ikehara, K., Romsos, C., Stoner, J., Djadjadihardja, Y., Ardhyastuti, S., Gaffar, E. Z., and Vizcaino, A.: A 6600 year earthquake history in the region of the 2004 Sumatra-Andaman subduction zone earthquake, Geosphere, 11, 2067–2129, https://doi.org/10.1130/GES01066.1, 2015.
Praet, N., Van Daele, M., Moernaut, J., Mestdagh, T., Vandorpe, T., Jensen, B. J., Witter, R. C., Haeussler, P. J., and De Batist, M.: Unravelling a 2300 year long sedimentary record of megathrust and intraslab earthquakes in proglacial Skilak Lake, south-central Alaska, Sedimentology, 69, 2151–2180, 2022.
Reimer, P. J., Bard, E., Bayliss, A., Beck, J. W., Blackwell, P. G., Ramsey, C. B., Buck, C. E., Cheng, H., Edwards, R. L., Friedrich, M., and Grootes, P. M.: IntCal13 and marine13 radiocarbon age calibration curves 0–50,000 years cal BP, Radiocarbon, 55, 1869–1887, https://doi.org/10.2458/azu_js_rc.55.16947, 2013.
Reimer, P. J., Austin, W. E., Bard, E., Bayliss, A., Blackwell, P. G., Ramsey, C. B., Butzin, M., Cheng, H., Edwards, R. L., Friedrich, M., Grootes, P. M., Guilderson, T. P., Hajdas, I., Heaton, T. J., Hogg, A. G., Hughen, K. A., Kromer, B., Manning, S. W., Muscheler, R., Palmer, J. G., Pearson, C., van der Plicht, J., Reimer, R. W., Richards, D. A., Scott, E. M., Southon, J. R., Turney, C. S. M., Wacker, L., Adolphi, F., Büntgen, U., Capano, M., Fahrni, S. M., Fogtmann-Schulz, A., Friedrich, R., Köhler, P., Kudsk, S., Miyake, F., Olsen, J., Reinig, F., Sakamoto, M., Sookdeo, A., and Talamo, S.: The IntCal20 Northern Hemisphere radiocarbon age calibration curve (0–55 cal kBP), Radiocarbon, 62, 725–757, 2020.
Rollinson, H. R.: Using geochemical data: Evaluation, presentation, interpretation, Longman Scientific & Technical, Singapore, https://doi.org/10.4324/9781315845548, 1993.
Safeeq, M., Grant, G. E., Lewis, S. L., and Staab, B.: Predicting landscape sensitivity to present and future floods in the Pacific Northwest, USA, Hydrol. Process., 29, 5337–5353, 2015.
Schillereff, D. N., Chiverrell, R. C., Macdonald, N., and Hooke, J. M.: Flood stratigraphies in lake sediments: A review, Earth-Sci. Rev., 135, 17–37, https://doi.org/10.1016/j.earscirev.2014.03.011, 2014.
Simonneau, A., Chapron, E., Vannière, B., Wirth, S. B., Gilli, A., Di Giovanni, C., Anselmetti, F. S., Desmet, M., and Magny, M.: Mass-movement and flood-induced deposits in Lake Ledro, southern Alps, Italy: Implications for Holocene palaeohydrology and natural hazards, Clim. Past, 9, 825–840, https://doi.org/10.5194/cp-9-825-2013, 2013.
Sleeter, B. M. and Calzia, J. P.: Klamath Mountains ecoregion, in: Status and trends of land change in the western United States—1973 to 2000, No. 1794-A-13, edited by: Sleeter, B. M., Wilson, T. S., and Acevedo, W., US Geological Survey, 141–149, https://doi.org/10.3133/pp1794A, 2012.
Song, S. G., Beroza, G. C., and Segall, P.: A unified source model for the 1906 San Francisco earthquake, Bull. Seismol. Soc. Am., 98, 823–831, 2008.
St-Onge, G., Mulder, T., Piper, D. J. W., Hillaire-Marcel, C., and Stoner, J. S.: Earthquake and flood-induced turbidites in the Saguenay Fjord (Québec): A Holocene paleoseismicity record, Quaternary Sci. Rev., 23, 283–294, https://doi.org/10.1016/j.quascirev.2003.03.001, 2004.
Strasser, M., Monecke, K., Schnellmann, M., and Anselmetti, F. S.: Lake sediments as natural seismographs: A compiled record of Late Quaternary earthquakes in Central Switzerland and its implication for Alpine deformation, Sedimentology, 60, 319–341, https://doi.org/10.1111/sed.12003, 2013.
Streig, A. R., Weldon, R. J., Biasi, G., Dawson, T. E., Gavin, D. G., and Guilderson, T. P.: New Insights into Paleoseismic Age Models on the Northern San Andreas Fault: Charcoal Inbuilt Ages and Updated Earthquake Correlations, Bull. Seismol. Soc. Am., 110, 1077–1089, 2020.
Swain, D. L., Langenbrunner, B., Neelin, J. D., and Hall, A.: Increasing precipitation volatility in twenty-first-century California, Nat. Clim. Change, 8, 427–433, 2018.
Thatcher, W., Foulger, G. R., Julian, B. R., Svarc, J., Quilty, E., and Bawden, G. W.: Present-day deformation acro–1718, 1999.
Thomson, J., Croudace, I. W., and Rothwell, R. G.: A geochemical application of the ITRAX scanner to a sediment core containing eastern Mediterranean sapropel units, Geol. Soc. Lond. Spec. Publ., 267, 65–77, https://doi.org/10.1144/GSL.SP.2006.267.01.05, 2006.
Toda, S. and Stein, R. S.: The 2011 M=9.0 Tohoku oki earthquake more than doubled the probability of large shocks beneath Tokyo, Geophys. Res. Lett., 40, 2562–2566, 2018.
Toonen, W. H., Winkels, T. G., Cohen, K. M., Prins, M. A., and Middelkoop, H.: Lower Rhine historical flood magnitudes of the last 450 years reproduced from grain-size measurements of flood deposits using End Member Modelling, Catena, 130, 69–81, 2015.
Toppozada, T. R., Real, C. R., Bezore, S. P., and Parke, D. L.: Preparation of isoseismal maps and summaries of reported effects for pre-1900 California earthquakes, Open-File Report No. 81-262, US Geological Survey, https://doi.org/10.3133/ofr81262, 1981.
Van Daele, M., Meyer, I., Moernaut, J., De Decker, S., Verschuren, D., and De Batist, M.: A revised classification and terminology for stacked and amalgamated turbidites in environments dominated by (hemi) pelagic sedimentation, Sediment. Geol., 357, 72–82, https://doi.org/10.1016/j.sedgeo.2017.06.007, 2017.
Van Daele, M., Araya-Cornejo, C., Pille, T., Vanneste, K., Moernaut, J., Schmidt, S., Kempf, P., Meyer, I., and Cisternas, M.: Distinguishing intraplate from megathrust earthquakes using lacustrine turbidites, Geology, 47, 127–130, 2019.
Vandekerkhove, E., van Daele, M., Praet, N., Cnudde, V., Haeussler, P. J., and De Batist, M.: Flood-triggered versus earthquake-triggered turbidites: A sedimentological study in clastic lake sediments (Eklutna Lake, Alaska), Sedimentology, 67, 364–389, https://doi.org/10.1111/sed.12646, 2020.
van der Weijden, C. H.: Pitfalls of normalization of marine geochemical data using a common divisor, Mar. Geol., 184, 167–187, https://doi.org/10.1016/S0025-3227(01)00297-3, 2002.
von Dassow, W. A. and Kirby, E.: Geomorphic Evidence for Differential Rock Uplift across the Southern Cascadia Forearc, GSA Annual Meeting 2017, Seattle, Washington, Paper No. 247-12, Abstr. Programs 49, Geol. Soc. America, https://doi.org/10.1130/abs/2017AM-307033, 2017.
Waldien, T. S., Meigs, A. J., and Madin, I. P.: Active dextral strike-slip faulting records termination of the Walker Lane belt at the southern Cascade arc in the Klamath graben, Oregon, USA, Geosphere, 15, 882–900, 2019.
Wall, S. A., Roering, J. J., and Rengers, F. K.: Runoff-ini–1661, 2020.
Wells, R. E., Blakely, R. J., Wech, A. G., McCrory, P. A., and Michael, A.: Cascadia subduction tremor muted by crustal faults, Geology, 45, 515–518, https://doi.org/10.1130/G38835.1, 2017.
Weltje, G. J., Bloemsma, M. R., Tjallingii, R., Heslop, D., Röhl, U., and Croudace, I. W.: Prediction of geochemical composition from XRF core scanner data: a new multivariate approach including automatic selection of calibration samples and quantification of uncertainties, in: Micro-XRF studies of sediment cores, edited by: Croudace, I. W. and Rothwell, R. G., Springer, 507–534, https://doi.org/10.1007/978-94-017-9849-5_21, 2015.
Wilhelm, B., Arnaud, F., Sabatier, P., Crouzet, C., Brisset, E., Chaumillon, E., Disnar, J. R., Guiter, F., Malet, E., Reyss, J. L., Tachikawa, K., Bard, E., and Delannoy, J. J.: 1400 years of extreme precipitation patterns over the Mediterranean French Alps and possible forcing mechanisms, Quatern. Res., 78, 1–12, 2012.
Wilhelm, B., Arnaud, F., Sabatier, P., Magand, O., Chapron, E., Courp, T., Tachikawa, K., Fanget, B., Malet, E., Pignol, C., Bard, E., and Delannoy, J. J.: Palaeoflood activity and climate change over the last 1400 years recorded by lake sediments in the north-west European Alps, J. Quaternary Sci., 28, 189–199, 2013.
Wilhelm, B., Nomade, J., Crouzet, C., Litty, C., Sabatier, P., Belle, S., Rolland, Y., Revel, M., Courboulex, F., Arnaud, F., and Anselmetti, F. S.: Quantified sensitivity of small lake sediments to record historic earthquakes: Implications for paleoseismology, J. Geophys. Res.-Earth, 121, 2–16, 2016.
Wilhelm, B., Canovas, J. A. B., Aznar, J. P. C., Kämpf, L., Swierczynski, T., Stoffel, M., Støren, E., and Toonen, W.: Recent advances in paleoflood hydrology: From new archives to data compilation and analysis, Water Secur., 3, 1–8, 2018.
Wils, K., Deprez, M., Kissel, C., Vervoort, M., Van Daele, M., Daryono, M. R., Cnudde, V., Natawidjaja, D. H., and De Batist, M.: Earthquake doublet revealed by multiple pulses in lacustrine seismo-turbidites, Geology, 49, 1301–1306, 2021.
Wirth, S. B., Girardclos, S., Rellstab, C., and Anselmetti, F. S.: The sedimentary response to a pioneer geo-engineering project: Tracking the Kander River deviation in the sediments of Lake Thun (Switzerland), Sedimentology, 58, 1737–1761, 2011.
Wirth, S. B.: The Holocene flood history of the Central Alps reconstructed from lacustrine sediments: Frequency, intensity and controlling climate factors, Doctoral dissertation, ETH Zurich, https://doi.org/10.3929/ethz-a-009775044, 2013.
Wong, I. G.: Low potential for large intraslab earthquakes in the central Cascadia subduction zone, Bull. Seismol. Soc. Am., 95, 1880–1902, https://doi.org/10.1785/0120040132, 2005.
Wong, I. G. and Bott, J. D.: A look back at Oregon's earthquake history, 1841–1994, Oregon, Geology, 57, 125–139, 1995.
Wright Jr., H. E.: A square-rod piston sampler for lake sediments, J. Sediment. Res., 37, 975, https://doi.org/10.1306/74D71807-2B21-11D7-8648000102C1865D, 1967.
Yeats, R. S.: Living with earthquakes in the Pacific Northwest, im: 2nd Edn., Oregon State University Press, ISBN 0870710249, 2004.
Zolitschka, B.: A 14,000 year sediment yield record from western Germany based on annually laminated lake sediments, Geomorphology, 22, 1–17, https://doi.org/10.1016/S0169-555X(97)00051-2, 1998.


