the Creative Commons Attribution 4.0 License.
the Creative Commons Attribution 4.0 License.
How well are hazards associated with derechos reproduced in regional climate simulations?
Frederick Letson
Rebecca J. Barthelmie
A 15-member ensemble of convection-permitting regional simulations of the fast-moving and destructive derecho of 29–30 June 2012 that impacted the northeastern urban corridor of the USA is presented. This event generated 1100 reports of damaging winds, generated significant wind gusts over an extensive area of up to 500 000 km2, caused several fatalities, and resulted in widespread loss of electrical power. Extreme events such as this are increasingly being used within pseudo-global-warming experiments to examine the sensitivity of historical, societally important events to global climate non-stationarity and how they may evolve as a result of changing thermodynamic and dynamic contexts. As such it is important to examine the fidelity with which such events are described in hindcast experiments. The regional simulations presented herein are performed using the Weather Research and Forecasting (WRF) model. The resulting ensemble is used to explore simulation fidelity relative to observations for wind gust magnitudes, spatial scales of convection (as is manifest in high composite reflectivity, cREF), and both rainfall and hail production as a function of model configuration (microphysics parameterization, lateral boundary conditions (LBCs), start date, use of nudging, compiler choice, damping, and number of vertical levels). We also examine the degree to which each ensemble member differs with respect to key mesoscale drivers of convective systems (e.g., convective available potential energy and vertical wind shear) and critical manifestations of deep convection, e.g., vertical velocities, cold-pool generation, and how those properties relate to the correct characterization of the associated atmospheric hazards (wind gusts and hail). Use of a double-moment, seven-class scheme with number concentrations for all species (including hail and graupel) results in the greatest fidelity of model-simulated wind gusts and convective structure to the observations of this event. All ensemble members, however, fail to capture the intensity of the event in terms of the spatial extent of convection and the production of high near-surface wind gusts. We further show very high sensitivity to the LBCs employed and specifically that simulation fidelity is higher for simulations nested within ERA-Interim compared to ERA5. Excess convective available potential energy (CAPE) in all ensemble members after the derecho passage leads to excess production of convective cells, wind gusts, cREF > 40 dBZ, and precipitation during a frontal passage on the subsequent day. This event proved very challenging to forecast in real time and to reproduce in the 15-member hindcast simulation ensemble presented here. Future work could examine if simulations with other initial and lateral boundary conditions can achieve greater fidelity.
- Article
(19575 KB) - Full-text XML
-
Supplement
(10933 KB) - BibTeX
- EndNote
1.1 Convective storms as a natural hazard
Mesoscale convective systems (MCSs) are dynamically and thermodynamically complex (Houze, 2004; Chen et al., 2015; Weisman and Rotunno, 2004) and are thus challenging to simulate accurately. Deep convection significantly contributes to atmospheric hazards (e.g., heavy and/or persistent precipitation and associated flooding – Hu et al., 2020; lightning – Yair, 2018; extreme winds – Schoen and Ashley, 2011, and Bedard et al., 1977) and uncertainty in climate-related risks under global climate non-stationarity (Trapp, 2021; Allen, 2018). This has led to an increased demand for use of convection-permitting model frameworks (Lucas-Picher et al., 2021; Prein et al., 2015) and simulations to examine whether the threats posed by MCSs are likely to be amplified under climate change.
Over the contiguous USA, hazards associated with deep convective systems, including derechos, are associated with substantial numbers of fatalities and injuries and infrastructure damage (Taszarek et al., 2020). Over both the USA and Europe, the highest single daily counts of severe wind reports were associated with derechos: widespread, long-lived windstorms (Taszarek et al., 2020; Corfidi et al., 2016). While derechos are most common in the southern Great Plains and Midwest, they have been observed in virtually all US states east of the Rocky Mountains (Ashley and Mote, 2005). One meta-analysis suggested derechos represent a hazard over the USA that is almost equal to that of tornadoes and hurricanes. They found that during 1986–2003 there were an average of 21 derecho events per year that, on average, caused 9 deaths and 145 injuries (Ashley and Mote, 2005). Indeed, in a region extending east from Wisconsin into Pennsylvania, New York, and northern West Virginia, derechos appear to be the dominant source of non-tornadic convective wind fatalities (Schoen and Ashley, 2011). Derechos also cause disruptions to socio-economic systems (e.g., energy provision and transportation; Bedard et al., 1977). An analysis of electric power delivery in the USA between 2003–2017 found that 50 % of disruptions were associated with weather events. Thunderstorms were responsible for 47 % of those disruptions, and three types of events caused more than 60 % of a utility customers' power outage: a derecho, an ice storm, and a hurricane (Shield et al., 2021). Further, a single derecho event during July 2009 resulted in the blowdown of 25 million trees in the US state of Minnesota and the Canadian provinces of Ontario and Quebec (Schumacher and Rasmussen, 2020). Derechos are also a major cause of economic losses in Europe (Gatzen et al., 2020). For example, a major derecho event was tracked over Belarus, Lithuania, Latvia, Estonia, and Finland on 8 August 2010. It was associated with near-surface wind gusts of 36.5 m s−1 and caused damage of over EUR 2 million in Estonia alone (Toll et al., 2015). Given the societal implications from deeply convective events – including derechos – there is interest in advanced understanding of simulation fidelity as a function of model configuration from both the short-term forecasting and the climate science communities (Tian et al., 2017; Mathias et al., 2019; Schumacher and Rasmussen, 2020).
1.2 Derecho 29–30 June 2012
Work presented herein focuses on a severe thunderstorm complex that became one of the most destructive and fast-moving derechos in US history. An area of organized deep convection formed south of Chicago, Illinois, on the morning of 29 June 2012 and subsequently intensified and propagated rapidly across northern Indiana, Ohio, and the Appalachian Mountains and into the Atlantic coast area (Halverson, 2014). It passed over Washington, DC, before moving out over the Atlantic Ocean. This event caused relatively little precipitation over the mid-Atlantic states but generated significant wind gusts over an extensive area of up to 500 000 km2. The National Weather Service received over 1100 reports of wind damage (Halverson, 2014) (Fig. 1), and wind gusts of 31.7 m s−1 were reported at Washington Dulles International Airport (hereafter Dulles Airport) during passage of the derecho (Fig. 2). This event thus fits the early definition of a derecho as being a widespread, convectively induced straight-line windstorm associated with downburst clusters produced by an extratropical mesoscale convective system (Johns and Hirt, 1987) and more recent detailed definitions such as an event that meets the following criteria: (1) convectively induced wind damage and/or gusts of >25.7 m s−1 over an area with a major axis of 400 km, (2) geographically consistent reports, and (3) three or more reports of convective gusts equal to (or greater than) 33.4 m s−1 within the affected areas (Corfidi et al., 2016).
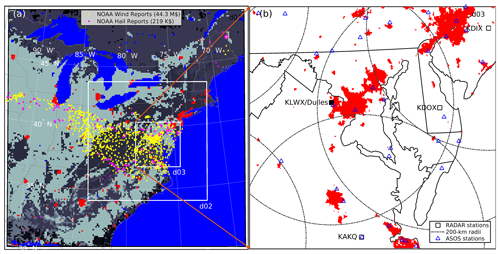
Figure 1(a) Map of the WRF simulation domains – d01, d02, and d03 – with land use classes shown, where blue indicates water and red indicates developed areas (shown in both panels) and different shades of gray denote different non-urban land use. The yellow markers indicate wind reports in the NOAA Storm Reports publication during 29 and 30 June 2012, and the magenta ones denote reports of hail. The total amounts of property damage in the NOAA Storm Reports publication from wind and hail within the study area in this 2 d period are given in the upper legend of (a) and are 2012 USD 44.3 million and 2012 USD 291 000, respectively. (b) Locations of radar (black squares; the black ellipses denote the 200 km radii from which data are presented here) and Automated Surface Observing System (ASOS) stations (blue triangles) in d03. Dulles Airport is within 3 km of KLWX (a station code), and both are denoted by the same filled black square.
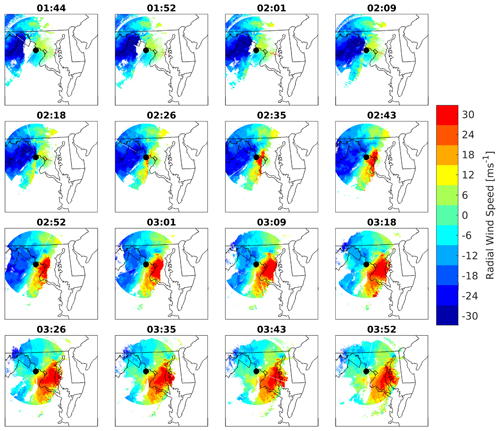
Figure 2Radial wind speeds from the NWS radar deployed at Sterling, Virginia (station code KLWX, shown as a black circle), the closest radar station to Dulles Airport, sampled for every second scan from the lowest elevation angle (0.5°) for about a 2 h period surrounding the period of highest recorded wind speeds at the airport. The time zone is UTC.
Over 20 deaths were reported during the 29–30 June 2012 derecho event. There was also widespread property damage and extensive power outages (Halverson, 2014). According to one report, power outages impacted over half of all homes within West Virginia and “approximately 600 000 citizens were still without power a week later” (Kearns et al., 2014). Many homes in West Virginia also lost access to clean water supply due to power failures at water treatment facilities (Kearns et al., 2014). During the evening of 29 June, over 1.4 million people in the Washington, DC, metro area lost power, some of them for almost a week during a period of relative high heat stress (Short, 2016). Virginia, Ohio, and West Virginia had the largest number of customers without power (Halverson, 2014), and an analysis in 2016 found this event was the single largest cause of power outages in the state of Maryland (Short, 2016). Analyses of data contained in the NOAA Storm Reports publication for 29 and 30 June 2012 indicate wind-related damage within the simulation domain used herein (Fig. 1a) of over USD 44 million (USD 2012) and hail damage of over USD 200 000 (USD 2012), over 1300 high-wind reports, and approximately 130 reports of hail.
Prior research has suggested that derecho events in the eastern USA are often preceded by large-scale troughing over western North America (Cordeira et al., 2017). This was also evident in the June 2012 event, where associated ridging over the eastern USA caused extreme near-surface air temperatures and humidity, leading to the issuance of heat-wave advisories (Cattiaux and Yiou, 2013). Rossby wave breaking led to the development of an intense elevated mixed layer (EML, 700–500 hPa) over the central USA that subsequently propagated eastwards (Shourd and Kaplan, 2021). The upper-level flow early on 29 June was dominated by ridging over the southeastern USA and a near-zonal jet stream extending from the middle of Wisconsin across the Great Lakes and into New York State, with an embedded jet streak over the northern Great Lakes (Shourd and Kaplan, 2021). Near-surface conditions were dominated by a complex frontal boundary extending approximately west–east across Iowa into Pennsylvania, with very high humidity and high near-surface temperatures just to the south (Fig. 3). It is noteworthy that the 12 h forecast from the North American Mesoscale Forecast System (NAM) model (grid spacing of 12 km) valid at 20:00 LT (local time) on 29 June 2012 indicated an extensive area of surface-based convective available potential energy (CAPE) in excess of 4000 J kg−1 over the Appalachian Mountains (covering almost all of the state of West Virginia) associated with the eastward propagation of the EML but projected very little precipitation, which contributed to uncertainty in forecasting the location and intensity of the derecho (NOAA, 2013).
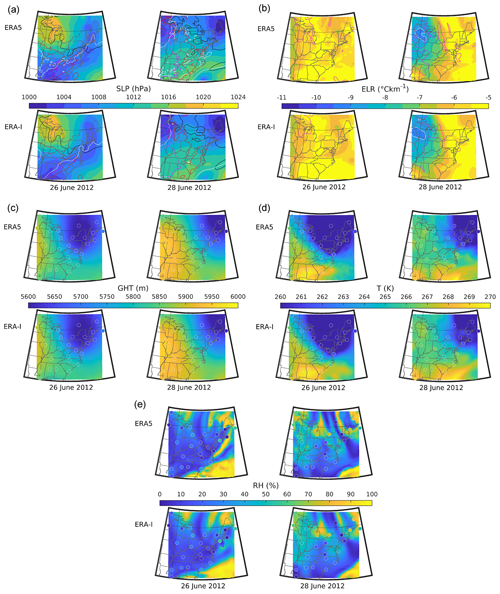
Figure 3(a) Spatial maps of sea-level pressure (SLP; colored surface) generated by WRF real output from the ERA5 and ERA-Interim (ERA-I) reanalysis products used to provide the model lateral boundary conditions (LBCs) and initial conditions. The black, red, and magenta lines are 2 m temperature of 295, 300, and 305 K, respectively. The white line represents specific humidity at 2 m of 12.5 g kg−1. (b) Filled contours of lapse rates (ELR; 700–500 hPa) with −9 °C km−1 highlighted by the white outline. Also shown by the magenta isoline is the area in which the RH increased by 20 % over this layer. (c) The 500 hPa geopotential height (GHT) in meters. (d) The 500 hPa temperature (T) in kelvins. (e) The 500 hPa relative humidity (RH) in percent. Plots in (c)–(e) contain rawinsonde observations (filled circles). In all the plots, WRF real output is used from all three domains.
Most forecast models operating in 2012 did not predict either extensive deep convection or a significant severe weather event (Schumacher and Rasmussen, 2020; Guastini and Bosart, 2016), although once it had been initiated, the Storm Prediction Center (SPC) commenced issuance of severe weather warnings (Halverson, 2014). A service assessment team from the National Weather Service (NWS) evaluated performance during this event and found that “Unlike many major tornado outbreaks in the recent past, this event was not forecast well in advance” (NOAA, 2013). In part due to the multi-scale forcing of warm-season derechos, this, like other (weaker) derechos proved difficult to forecast > 12–24 h ahead, and operational models including the North American Mesoscale Forecast System (NAM) and Global Forecast System (GFS) provided “little assistance in forecasting this event more than 24 hours ahead of time”. The day 3 and day 2 convective outlooks valid for 29 June showed only a 5 % probability of severe thunderstorms anywhere over the eastern USA, and even the Storm Prediction Center 1 d ahead convective outlook indicated only a 15 % probability over most of the region that was impacted by the derecho (NOAA, 2013). During the morning of 29 June, some high-resolution, convection-permitting simulations with the High-Resolution Rapid Refresh model indicated the potential for the development of intense thunderstorms, and only in the afternoon of 29 June was the potential for tracking into the mid-Atlantic coast area identified (NOAA, 2013). This event has subsequently been the subject of extensive research in terms of characterization of the environmental context (Bentley and Logsdon, 2016; Guastini and Bosart, 2016; Shourd and Kaplan, 2021). It has also formed the basis of several modeling studies designed, for example, to examine whether model fidelity is enhanced by data assimilation (Fierro et al., 2014) and to evaluate representation of multiple storm characteristics in regional and global climate models at cloud-system-resolving scales (Liu et al., 2023). Our research is focused not on methods to improve forecasts of such events but rather on evaluating the inherent ability of the Weather Research and Forecasting (WRF) model to reproduce key aspects of this event in the contemporary climate as a function of model configuration to lay the foundation for examining how such events may evolve in the future.
1.3 Synthesis of insights and outcomes from previous simulations of deep convection and derecho events
Past research has illustrated that use of nested domains with convection-permitting resolutions (i.e., dx<4 km), where the convective parameterization is deactivated and convective processes are partially resolved by explicit model physics, typically enhances simulation fidelity of deep convection (Prein et al., 2015). Emerging research has shown that using scale-aware convective parameterizations (i.e., those schemes where numerical descriptions include a parameter that modulates convective processes as a function of horizontal resolution) throughout the model gray-zone resolution helps to smooth the transition from the parameterized to resolved convective scale, leading to smaller errors in the timing and intensity of precipitation (Jeworrek et al., 2019; Mahoney et al., 2016; Wagner et al., 2018). However, model fidelity as a function of model configuration remains an ongoing open research question. As described below, model fidelity is a strong function of the precise cloud microphysics scheme applied, model grid spacing, lateral boundary conditions, compiler choice, and the degree/manner in which the model parameterizations interact (for example, feedback between the cumulus parameterizations/cloud microphysics and the radiation scheme) (Warner, 2010; Wang and Seaman, 1997).
Compute times for simulations with WRF and other atmospheric models exhibit a relatively high dependence on cloud microphysics schemes (Barrett et al., 2019). Single-moment schemes do not predict the particle size distribution for each species, which is instead derived from fixed parameters. These schemes are thus more computationally efficient. Double-moment schemes add a prediction equation for number concentration per species (cloud, water, ice, snow, hail, graupel). The trade-off between increased compute time – from more advanced microphysics – and meaningful forecast improvement is significant such that the additional compute expense may not always be warranted (Jeworrek et al., 2019). Nevertheless, as the model resolution transitions through the gray zone to kilometer-scale resolution, the microphysics begins to directly influence convective and cloud-scale motions through latent heating/cooling and the weight of condensate; thus a double-moment scheme should be used at such scales (Morrison et al., 2020). Spectral-bin schemes may offer an additional fidelity enhancement but are even more computationally demanding (Shpund et al., 2019). One analysis of hail prediction for an event that impacted Oklahoma City employed horizontal grid spacing of 500 m and compared three different bulk microphysics (MP) schemes: the Milbrandt–Yau double-moment scheme (MY2), the Milbrandt–Yau triple-moment scheme (MY3), and the NSSL variable density-rimed ice double-moment scheme (NSSL). The authors found all three schemes generated skillful predictions for the surface areal coverage of severe surface hail (hail diameter (D) ≥ 25 mm), but particularly the NSSL scheme exhibited less skill for significant severe hail (D≥50 mm) (Labriola et al., 2019a). Microphysics parameterizations are critical not only to the production of solid precipitation (hail and graupel) but also to the simulation of cold-pool development and production of downbursts and outflow boundaries (Adams-Selin et al., 2013). Squall lines are well suited to microphysics sensitivity studies because mature squall lines contain a range of ice hydrometeor types (Xue et al., 2017). Much of the prior research examining squall line sensitivity to microphysics has been conducted with bulk schemes due to the added computational demand of bin schemes (Morrison et al., 2015; Fovell and Ogura, 1989; McCumber et al., 1991; Fan et al., 2015, 2017). These studies have shown considerable spread to different microphysics, and this has been linked to varying representations of cold-pool dynamics (Morrison et al., 2012, 2015).
No optimal grid spacing has been found for simulation of MCSs including derechos. A previous analysis of 14 simulated MCSs found that finer grid spacing was associated with better reproduction of the cold pool (grid spacing of 1 km showed enhanced skill over 3 km) but that forward propagation speeds of the MCS better matched observation for the simulations at 3 km (Squitieri and Gallus, 2020). Further simulations of a derecho that impacted northern France, Belgium, the Netherlands, and northwestern Germany on 3 January 2014 also found more realistic representation of the derecho intensity in simulations at grid spacing of 1.1 km relative to simulations at 2.8 km (Mathias et al., 2019).
Other studies have examined the sensitivity to model initial and lateral boundary conditions (ICs and LBCs) (Hohenegger et al., 2006; Johnson, 2014). Modeling of the major derecho event tracked over Belarus, Lithuania, Latvia, Estonia, and Finland on 8 August 2010 with the HARMONE model applied at 2.5 km grid spacing found a strong dependence on ICs and LBCs and a time delay (of approximately 1 h) of the derecho passage approximately 15 h into the simulation (Toll et al., 2015). Nested simulations of a European derecho event using the COSMO regional model found significant improvement in the simulation fidelity with use of ERA5 for the LBCs over simulations using ERA-Interim (Mathias et al., 2019). Earlier work performed a 24 h hindcast of the June 2012 North American derecho in regional and global climate models at cloud-system-resolving scales and showed that both model types produce a delay of approximately 2 h in feature location and associated gust front timing with a negative bias compared to radar composite reflectivity (Liu et al., 2023).
Simulation reproducibility differences can also arise from round-off error in floating-point operations, which are handled differently by different compilers and machines (e.g., optimized math, double precision, rounding modes). Resulting error growth in atmospheric properties from the convective scale to mesoscale has been demonstrated (Zhang et al., 2007). While initial errors may be small, convective-scale errors can grow quickly in scale, magnitude, and spatial extent while contaminating the mesoscale (Judt, 2018). Compiler selection also influences simulation compute time, and past research has found WRF performance is often best when using the Intel Fortran Compiler (Moreno et al., 2020; Powers et al., 2021), although prior to 2021 Intel compilers were not freely available, which restricted their use to those platforms that held an Intel license. Earlier work has shown compiling WRF with Intel results in a performance gain of up to 26 % compared to the GNU Compiler Collection (GCC; Langkamp and Böhner, 2011), and other work has shown simulations with WRF compiled using Intel outperform GNU on a cloud computing architecture, leading to significant annual cost savings in computation costs (Siuta et al., 2016).
1.4 Objectives
It is important to emphasize that the research presented herein is cast within the framework of the use of short simulations with a convection-permitting regional climate model (CPRCM) to reproduce specific extreme events where a CPRCM is nested with LBCs from a reanalysis product (Lucas-Picher et al., 2021). By simulating only few days, this case study (or storyline) approach can permit many simulations to be performed and evaluated and model dependencies can be fully investigated (Lucas-Picher et al., 2021; Mathias et al., 2019). Accordingly, the objectives of this work are to build and evaluate an ensemble of WRF simulations performed in a hindcast mode (i.e., with reanalysis-derived LBCs) that differ in terms of the microphysics schemes applied, LBCs, start date, use of nudging, compiler choice, number of vertical levels, and use of damping and to use that ensemble to evaluate how simulation fidelity for a historically important high-wind mesoscale convective event varies in the following ways:
-
Variation across microphysics schemes. The five microphysics schemes applied range in sophistication, from cloud-scale single-moment (Goddard – Tao et al., 1989) to double-moment (Thompson – Thompson et al., 2008; Morrison – Morrison et al., 2009; Milbrandt–Yau – Milbrandt and Yau, 2005b) to double-moment schemes with particle shape and density prediction (NSSL; Mansell et al., 2010a).
-
Variation for different LBCs, for different start times, and with and without nudging. The two reanalysis products used to provide the initial and lateral boundary conditions are ERA-Interim (Dee et al., 2011a) and ERA5 (Hersbach et al., 2020).
-
Variation for different compiler selection. While the majority of simulations presented herein were performed with WRF compiled using GNU Fortran, two additional simulations that use WRF compiled with the Intel compiler are also presented.
-
Variation for different model vertical resolutions (41 vs. 65 vertical levels) and with and without upper-level Rayleigh damping.
For objectives 1–4, we evaluate fidelity with respect to peak radar reflectivity and the spatial extent of reflectivity at the time of maximum deep convection, cumulative precipitation, the presence/absence of hail, and peak wind gusts. We also provide context for the fidelity assessment during the derecho with conditions during a subsequent frontal passage. Additionally, we seek to address a fifth objective.
This objective is to evaluate the degree to which the processes involved in the generation of gust fronts from derechos are represented in the WRF ensemble simulations. In this part of the analysis, we are seeking to assess the differential fidelity levels of the ensemble members in terms of a range of diagnostic properties, the vertical structure of deep convection, the vertical velocities, and the metrics of cold-pool production.
This research is being performed as part of a project designed to examine how historically important extreme events may be modified in an evolving climate. Thus, while there is evidence that data assimilation can substantially enhance forecast and hindcast skill (Bachmann et al., 2020; Johnson et al., 2015; Johnson and Wang, 2016; Federico et al., 2019), no data assimilation is performed here.
2.1 WRF simulations
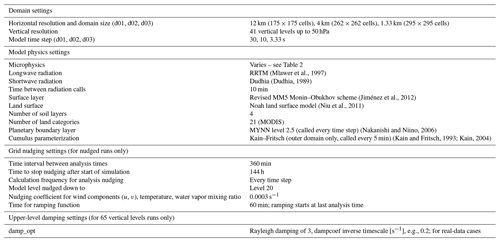
All the simulations presented herein were performed with WRF model version 3.8.1 (Skamarock et al., 2008). The simulations follow the standard steps used for the WRF simulation setup and execution – steps previously described by a simulation flowchart in other WRF studies (e.g., Kumar et al., 2024). The optimal domain size, number of nests, and parent-grid ratio to be used in convection-permitting simulations are open questions (Prein et al., 2015), but there is evidence of bulk convergence (i.e., diminishing change in the domain-wide properties as a function of grid spacing) at approximately 1 km (Panosetti et al., 2019), and past research has indicated improved simulation fidelity with finer horizontal grid spacing (Liu et al., 2023). Accordingly, all simulations performed herein use grid spacing of 1.33 km in the innermost domain (d03; see Fig. 1a for the simulation domains), which covers a domain of almost 400 km by 400 km (i.e., above the recommended target of 300 km by 300 km; Lucas-Picher et al., 2021). The same domain configuration (i.e., 12, 4, and 1.33 km) is used in all members of the ensemble. Prior research has generally found sensitivities related to cloud microphysical parameterizations are larger than those associated with mesh refinement at kilometer scales (Roh and Satoh, 2014). Model configuration settings that are consistent across all simulations are shown in Table 1, while the settings for which the 15 ensemble members differ (e.g., microphysics scheme, simulations that test sensitivity to initial conditions, use of nudging, model start time, compiler, vertical levels, and upper-level damping) are shown in Table 2. Here we use fixed outer WRF simulation domain grid spacing of 12 km with lateral boundary conditions (LBCs) from ERA5 (dx∼30 km) and, for the simulations testing sensitivity to initial conditions, ERA-Interim (dx∼80 km), which is consistent with recommendations that the maximum step in resolution at the domain boundary (Lucas-Picher et al., 2021). Note that the Kain–Fritsch scheme used in the 12 km domain runs shallow convection by default. Within the inner domain, no cumulus scheme is applied, which is consistent with previous research. Because the goal of this research is to establish whether WRF can generate a derecho of a given intensity when provided only the large-scale environmental context, in most simulations no nudging is applied and a relatively large simulation domain is selected. Two initialization dates are included in the ensemble: most simulations are initialized at 00:00 UTC on 26 June approximately 4 d before the peak of the event. These are type equivalent to true “climate mode” simulations (i.e., those initialized well ahead of the event genesis). Another two are initialized at 00:00 UTC on 28 June, approximately 2 d before the peak of the event but much closer to the event genesis, and thus they are closer to a “weather-wise mode” where the model initialization is a few hours before the event commences.
Table 2Overview of WRF ensemble simulation members. Note that single-moment schemes treat only the mass of the specified variables, while double-moment schemes also treat the number concentrations of some/all of the specified variables (if only some, they are denoted by *).
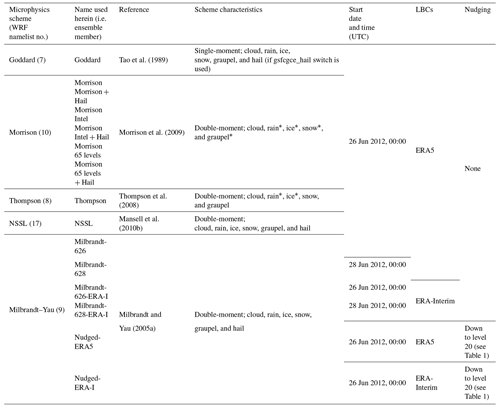
Additional WRF output diagnostics options are employed. The “output_diagnostics = 1” setting is used to output climate diagnostics to a separate history file (wrfxtrm) every hour for domain d01 and every 10 min for domains d02 and d03. Advanced settings for NSSL are not used here. The “hail_opt” switch for the Morrison scheme is used to run this scheme with hail. A Morrison simulation without hail is also run for comparison. The Goddard scheme does not include hail by default, but in this simulation “gsfcgce_hail = 1” is used to run the Goddard scheme with hail. The “do_radar_ref = 1” namelist setting is used to compute radar reflectivity using microphysics-scheme-specific parameters in the Goddard, Thompson, and Morrison ensemble simulations. This option is not available for the NSSL and Milbrandt–Yau schemes, but radar reflectivity is still calculated by the model for those schemes without using the microphysics parameters. Two radar reflectivity estimates are provided by WRF: REFL_10CM (i.e., radar reflectivity in each vertical grid cell at a wavelength of 10 cm) and REFD_MAX (maximum derived radar reflectivity). Composite reflectivity (cREF) is used here for comparison with radar estimates and is the maximum value for each WRF column and time step.
2.2 Model evaluation
The ensemble of WRF simulations is evaluated against observations from National Weather Service (NWS) dual-polarization radars (Seo et al., 2015; Crum et al., 1998) and the NWS Automated Surface Observing System (ASOS) (Schmitt and Chester, 2009). There are four radar stations within the innermost WRF simulation domain (d03) and nine in the second domain (d02). There are 34 ASOS stations in domain d03 and 149 in domain d02 (Fig. 1a).
2.2.1 ASOS data
The following parameters from the 5 min ASOS data set are used in the model evaluation and diagnostic interpretation:
-
Gust wind speeds (Ugust, m s−1) are sustained, and gust wind speeds within the ASOS network are measured using Vaisala 2-D sonic anemometers deployed at 10 m a.g.l. The data are sampled at 1 Hz and digitally output as 3 s moving average wind speed. The gust wind speeds reported here represent the maximum 3 s wind speed measured in each 5 min period when gust criteria are met. Gusts are reported in knots and are rounded up to the nearest whole knot. Wind gusts are reported when (Nadolski, 1998; NOAA, 2004)
-
Ugust is at least 3 kn (1.54 m s−1) above the current running 2 min mean wind speed,
-
Ugust exceeds the minimum 3 s average in the last 10 min by at least 10 kn (5.14 m s−1), and
-
the current 2 min average wind speed is at least 3 kn (1.54 m s−1).
-
-
Air temperature (T, °C) is measured at 2 m a.g.l. using a platinum-wire resistance thermometer.
-
Sea-level pressure (SLP, hPa) is derived from station pressure measured using a digital, capacitive pressure sensor with station altitude and ambient temperature.
-
Accumulated precipitation (PPT, mm) – the hourly precipitation – is measured by a heated, tipping-bucket rain gauge. The data are reported in hundredths of an inch and converted to metric units herein.
A light-emitting diode weather identifier instrument is used to differentiate rain and snow at ASOS stations (Wade, 2003), but hydrometeors such as hail are only reported at ASOS stations with human observers. Thus for ∼400 fully automated ASOS stations across the USA there are no hail reporting functions. Hence, hail occurrence reported by the ASOS network (including the portion within the current domain of interest) is likely to be negatively biased. ASOS facilities with a surface-based observer also augment the reports with flags to indicate the presence of thunderstorms. These data are presented herein to supplement evidence of high reflectivity from radar. We also employ data from all 28 rawinsondes within the simulation domain in the fidelity assessment of the initial conditions from each reanalysis product and start time. In these analyses the conditions on two geopotential surfaces (700 and 500 hPa) as derived using WRF real output from the ERA5 and ERA-Interim reanalysis products are interpolated to these pressure levels using the wrf_interp program (available at https://github.com/pick2510/wrf_interp, last access: 2 February 2022) and the rawinsonde observations for the closest release time.
2.2.2 Radar
Dual-polarization Doppler S-band WSR-88D radar form the basis of the NWS network (Crum et al., 1998; Seo et al., 2015). Scans are performed at between 9 and 14 elevation angles (0.5 to 19.5°) depending on precipitation conditions. Data are collected with a standard azimuthal resolution of 1° and range resolution of 0.25 km (NOAA, 2016, 2017). Data used herein are restricted to within 200 km of each radar station.
Five key radar-derived properties sampled at 10 min intervals are used in the WRF model evaluation:
-
Composite reflectivity (cREF, dBZ) is the maximum reflectivity in each vertical column.
-
The precipitation rate (mm h−1) is derived from reflectivity using Z–R relationships (NOAA, 2016).
-
Hail reports and maximum estimated size of hail (MESH) include the hail presence in cloud, which is derived from reflectivity, the aspect ratio of hydrometeors, vertically integrated liquid, and the altitude of the melting layer (NOAA, 2017; Witt et al., 1998). Hail reports include the geographic position and the 75th-percentile hailstone diameter (or MESH) (Johnson et al., 1998; Wallace et al., 2019). In the current work, a distinction is drawn between hail reports with MESH > 25 mm and those without. This is a diameter threshold that has been previously used for identifying “severe hail” (Labriola et al., 2019b).
-
The NCEP/EMC 4 km Gridded Data Stage IV precipitation product (Du, 2011), which is a blend of radar-derived precipitation and in situ measurements, is also used in the model fidelity assessment. The spatial fields of accumulated precipitation from the radar and the Stage IV product are very similar but the total domain-wide amounts during the derecho and frontal periods differ.
-
Radial wind speeds (m s−1) are presented herein (Fig. 2) from the 0.5° elevation angle and are computed from the Doppler shift (Alpert and Kumar, 2007).
All radar measurements are sampled at a 10 min interval to match the WRF output and are re-gridded onto the WRF grid used for domain d03 prior to their use in the model evaluation. Where two radar cover the same area, the data are averaged using inverse-distance weighting. Radar coverage of domain d03 is almost complete. Radar data are available for 86 436 total grid cells in d03, which is 99.4 % of the total number of WRF grid cells.
2.3 Assessing and attributing model fidelity
The WRF simulation period encompasses both the derecho that forms the focus of this research and a subsequent frontal passage. These two periods are each associated with high cREF in radar output and WRF ensemble members and are separated by a short period of lower reflectivity (zero d03 cells exceeding 40 dBZ) (Fig. 4a). The number of ASOS stations in d03 reporting thunderstorms also shows a clear distinction between these two events (Fig. 4a) and is used to delineate the following:
-
the derecho period – 29 June at 21:30:00 UTC to 30 June 2012 at 13:30:00 UTC,
-
the front period – 30 June at 15:20:00 UTC to 1 July 2012 at 14:50:00 UTC.
All 15 members of the WRF ensemble exhibit a time delay in simulating the derecho intensification and passage as represented by the period of the spatial extent of cREF > 40 dBZ in domain d03 relative to radar observations (Fig. 4a). This is consistent with previous research that indicates WRF simulations not subject to data assimilation exhibit timing offsets when simulating extreme precipitation events (Knist et al., 2020). For this reason and because the purpose of the current work is to examine whether a CPRCM simulation can generate atmospheric hazards associated with a derecho, the model evaluation is performed within a framework such that time synchronization is not required. The storm peak time (tp) is defined independently for each ensemble member and the radar observations as the time of maximum exceedance of 40 dBZ during the derecho period and the front period, respectively. WRF output at tp is used to characterize the intensity and characteristics of each event.
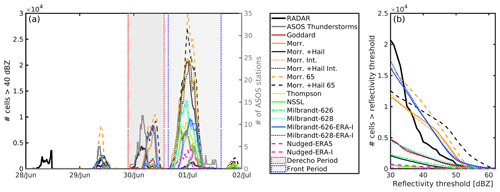
Figure 4(a) Time series of the number of grid cells in domain d03 with composite reflectivity (cREF) >40 dBZ from the radar and the 15 WRF ensemble members. The number of the 34 ASOS stations in domain d03 reporting thunderstorms is shown in gray (right axis). The timings of the derecho period (29 June at 21:30:00 UTC to 30 June 2012 at 13:30:00 UTC) and the frontal passage (30 June at 15:20:00 UTC to 1 July 2012 at 14:50:00 UTC) are denoted by the gray backgrounds. (b) The number of grid cells in domain d03 where output from each WRF ensemble member or the radars exceeded the specified threshold during the time step within the derecho period when the maximum number of grid cells exceeded the threshold. For example, in the radar observations there is a single 10 min period during which approximately 5000 grid cells exhibit a value above 40 dBZ.
The fidelity of each ensemble member with respect to storm severity and spatial extent during the derecho and front periods is assessed using geospatial maps of composite reflectivity, precipitation accumulation and type, and maximum wind speeds and is summarized using the following metrics:
-
cREF > 40 dBZ ratio. This metric is the ratio of the areal extent of WRF grid cells with composite reflectivity > 40 dBZ at tp divided by the radar-derived estimate. Use of cREF > 40 dBZ as the index of the spatial coverage of deep convection is based on past research (Schumacher and Johnson, 2005; Parker and Knievel, 2005). The spatial coverage for other thresholds is shown in Fig. 4b.
-
Max gust ratio. This metric is the ratio of the maximum overland 10 m wind speed in each time step from each WRF ensemble member divided by the maximum wind gust speed from any ASOS station. This is thus a basic metric of the degree to which each WRF ensemble member produces wind gusts that approach the most severe gusts observed by the ASOS network.
-
Total precipitation ratio. This metric is the ratio of precipitation accumulation in all d03 grid cells for which radar retrievals are available to the radar observations. Stage IV precipitation data are also included. Each ensemble member exhibits slightly higher agreement with the Stage IV precipitation product than with radar-only total accumulated precipitation during the derecho period (Table 3). Hail occurrence from the WRF ensemble members is also evaluated against radar and ASOS observations along with the presence of severe hail. Grid cells in d03 are classified as containing severe hail in the WRF simulations and radar observations when MESH > 25 mm. MESH for the WRF simulations is estimated using a weighted summation of hail kinetic energy flux for elevations above the melting layer. Hail kinetic energy fluxes are inferred as a function of reflectivity. This method was developed for use with radar data (Witt et al., 1998).
As described above and indicated by Fig. 4, the timing of the peak intensity and transit of the derecho across the innermost domain is not consistent across the WRF simulations and/or between the WRF simulations and observations. Given this research is being performed in the context of a project designed to improve the simulation of atmospheric hazards in the contemporary climate and possible future climates, we assess fidelity without requiring temporal synchronization. Thus, in the following we focus much of our evaluation of the simulations on their ability to reproduce the intensity and spatial extent of the derecho and thus define the time of peak intensity (tp) independently for each ensemble member. While we present some of the evaluation in terms of the degree of spatial agreement with in situ and remote sensing data using Spearman correlation of geospatial values at tp, we also include analyses that examine the absolute intensity of, for example, reflectivity and wind gusts without requiring geospatial coherence between the model and the observations. In these analyses we are addressing the following question: was the peak intensity of the event captured even if that peak was displaced in space and time? In considering these decisions it is worth reemphasizing that the purpose and concept of this analysis are to assess not deterministic (forecast) predictability but the representation of the convective system.
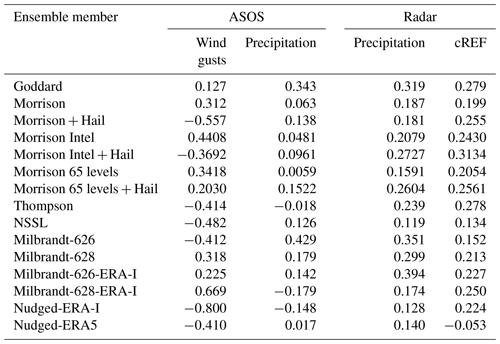
Table 3Spearman rank correlations for the spatial fields of maximum wind gusts in domain d03 during the derecho (29 June at 21:30:00 UTC to 30 June 2012 at 13:30:00 UTC) from WRF and ASOS observations. In this analysis WRF output for maximum time step wind speeds (dt=6 s) is sampled at the 34 ASOS locations and compared with the maximum 3 s ASOS wind gust measurements (see spatial fields in Fig. 11). Also shown are the Spearman rank correlations between spatial fields of total accumulated precipitation from WRF output relative to radar estimates and ASOS in situ measurements. In these analyses the correlations between WRF and the radar data are for all WRF grid cells sampled by the radar (99.4 % of d03), while the comparison with ASOS measurements is for the 34 ASOS stations. The final column shows the correlations between the spatial fields of maximum composite reflectivity (cREF; again in any time step during the derecho period) from the WRF ensemble members and radar.
The metrics of fidelity described above are considered here in the context of the environmental setting: the convective available potential energy and vertical wind shear, along with descriptors of the storm dynamics – vertical velocities, cloud depth, downburst intensity, and cold-pool generation/intensity during the derecho period. Many of these diagnostic analyses focus on the time of maximum coverage of high reflectivity (tp) during the derecho as assessed for each individual ensemble member and/or over a window of 3 h around that time. The metrics used are described in the following.
-
Convective available potential energy (CAPE) is a measure of the available vertically integrated buoyant energy. Multiple indices of convective potential have been proposed (Kunz, 2007). Derechos are frequently associated with CAPE values in excess of 2400 J kg−1 in the genesis region and can increase to 4500 J kg−1 during the propagation of the derecho, with later observational analyses indicating that the most unstable convective available potential energy (MU-CAPE) has a 75th-percentile value of nearly 4000 J kg−1 and a peak of 8500 J kg−1 (Evans and Doswell, 2001). MU-CAPE from a WRF simulation at 3 km of a super derecho in Kansas on 8 May 2009 was in excess of 3000 J kg−1 (Weisman et al., 2013). MU-CAPE for the 3 July 2003 derecho in the Midwest was ∼500 J kg−1 (Metz and Bosart, 2010). The June 2012 derecho that forms the focus of this research is remarkable not only for the number and intensity of its wind gusts but also in terms of the convective available potential energy (CAPE) in the genesis region and near Washington, DC. For example, CAPE estimates for the 00:00Z 30 June 2012 rawinsonde sounding from Sterling, Virginia (Dulles Airport, IAD), were ∼ 5500 J kg−1. Here we employ the maximum or most unstable CAPE (MU-CAPE) as our primary index of the ability of the atmosphere to support deep convection. MU-CAPE is computed for tp and tp±3 h from the three-dimensional fields of pressure, temperature, and the water vapor mixing ratio using the wrf-python algorithm (https://wrf-python.readthedocs.io/en/latest/user_api/generated/wrf.cape_2d.html, last access: 1 March 2021). This algorithm computes the MU-CAPE of 500 m depth within the lowest 3000 m of the atmosphere that has maximum equivalent potential temperature. The change in average (median) MU-CAPE from all grid cells in d03 between tp−3 h and tp is used as a metric of the degree to which MU-CAPE is exhausted during passage of the derecho.
-
Wind shear from the ground to 6 km (S6) is often used to differentiate environments associated with significant severe thunderstorms from less severe events (Brooks et al., 2003). In an analysis of observational data, average shear vectors in the ambient environment close to derechos ranged from 1 to 36 m s−1, values which were slightly lower than those that were manifest in idealized simulations of bow echoes (Evans and Doswell, 2001). Mid-level shear has also been shown to help maintain deep convective systems (Coniglio and Stensrud, 2001; Chen et al., 2015). S6 is presented based on output at tp for all ensemble members.
-
ZR20 is the model height at which the 90th-percentile base reflectivity falls below 20 dBZ. It is used as a proxy for cloud top height in areas of deep convection and thus is computed using only cells with cREF > 40 dBZ.
-
Two metrics of the intensity of vertical motions are presented. For each grid cell within 50 km of one where cREF > 40 dBZ, the layer with the highest standard deviation of vertical velocities (σ(w)) at tp is found. The magnitude of σ(w) is used to provide information about the intensity of vertical motions, which to the first order should be a function of MU-CAPE. The height of the maximum standard deviation of vertical velocities (σ(w)) is used to infer the intensity and vertical structure of convection. Since updrafts and downdrafts are of relatively short duration and small spatial extent, we use the spatial standard deviation σ(w) computed using vertical-velocity output from the time of maximum cREF > 40 dBZ (i.e., from the 10 min time step WRF output file at that time) considering all WRF grid cells within 50 km of cREF > 40 dBZ. This is a more descriptive metric than the mean velocity because the dispersion around the mean is reflective of the intensity of both downdrafts and updrafts in the column.
-
Cold pools are a key component contributing to the organization and propagation of MCSs (Engerer et al., 2008). They are generated by evaporative cooling, precipitation drag, and downdrafts and are key to triggering and organizing persistent convection (Knippertz et al., 2009; Schumacher, 2015). An analysis of cold pools associated with 39 MCSs in Oklahoma found that mean surface pressure perturbations associated with cold pools range from 3.2 to 4.5 hPa and mean temperature perturbations range from 9.5 to 5.4 K depending on the MCS stage (Engerer et al., 2008). To account for the presence of substantial topographic variability within d03, the intensity of cold pools at the surface associated with the derecho is quantified using anomalies from the simulation mean temperature or pressure in that grid cell over the entire simulation period. Both are computed for WRF grid cells within 50 km of all cells with cREF > 40 dBZ:
- a.
The 95 % temperature deviation. This metric is the lowest 5 % (coldest) 2 m air temperature anomalies close to the regions with the most active convection.
- b.
The 95 % SLP deviation. This metric is the highest (positive) perturbation in sea-level pressure (SLP) anomalies close to the regions with the most active convection.
- a.
Because the variables and metrics considered here are not Gaussian distributed, Spearman rank correlations (Wilks, 2011) are used to describe their co-variability. Rank correlation coefficients are computed between the model fidelity metrics and the diagnostic metrics across the 15 ensemble members to identify which model properties (wind speed, precipitation, etc.) exhibit the highest association with the diagnostic metrics used to examine model skill in simulating this event.
3.1 Model fidelity assessment
For the derecho period, model skill for this ensemble exhibits substantial sensitivity to variations in the microphysics schemes. These dependencies are not unexpected based on past research on deep convection (including squall lines), summarized in Sect. 1. The fidelity of the ensemble members also varies with LBCs, start time, use of nudging, compiler selection, number of vertical levels, and use of upper-level damping. The fidelity assessment results are described here and then are explored further below in terms of how they link to diagnostic metrics of convective intensity.
The maximum areal extent of composite reflectivity (cREF) > 40 dBZ during the derecho period (29 June at 21:30 UTC–30 June at 13:30 UTC) varies widely across the WRF ensemble members but is mostly negatively biased relative to the radar (Fig. 5), consistent with previous simulations of this event (Liu et al., 2023). This bias is least marked in the Morrison-XXXXXX and Milbrandt-XXXX simulations (where XXXXXX or XXXX indicates the ensemble member in terms of LBCs, start date, number of vertical levels, and compiler from simulations that employ the Morrison (XXXXXX, six ensemble members) and Milbrandt (XXXX, four ensemble members) microphysics schemes), especially those using ERA-Interim for initial and lateral boundary conditions. The areal extent of cREF > 40 dBZ at tp for the non-nudged simulations with Milbrandt and LBCs from ERA-Interim is 84 %–95 % as large as that from radar (Fig. 5). For these two simulations (Milbrandt-626-ERA-I and Milbrandt-628-ERA-I), which differ only in terms of the time of initialization, the shape and orientation of the derecho are broadly similar to those of the observations, although the timing of tp is greatly delayed (Fig. 5) and the precise locations of the regions of the highest radar reflectivity are incompletely reproduced (Table 3). The simulations with the smallest extent of high reflectivity are the nudged simulations with the Milbrandt microphysics scheme, followed by (in increasing order of coverage) Morrison, Thompson, NSSL, and Goddard (Figs. 5 and 6). Use of the hail flag in the Morrison scheme does not lead to increased precipitation accumulation, in contrast to past research on squall lines (Morrison et al., 2015). However, there is evidence that increasing the vertical model resolution does increase accumulated precipitation. Accumulated precipitation is higher in simulations with the Morrison scheme that use 65 levels irrespective of whether upper-level damping is applied (Fig. 7), and there is also a small increase in the extent of cREF > 40 dBZ (Fig. 5). During the subsequent front period (30 June at 15:20 UTC–1 July 2012 at 14:50 UTC), all schemes produce a cREF > 40 dBZ extent that covers a larger area than is indicated in the radar observations (Fig. 6). As described below, this appears to be linked to the weaker derechos, resulting in excess MU-CAPE being available during the frontal passage. The nudged simulations produce the smallest extent of cREF > 40 dBZ during the front period and thus show the closest accord with the radar observations. Further, the Morrison 65 levels + Hail simulation has higher spatial coverage of hail during the derecho period than the equivalent simulation with 41 levels (Table 4), but the highest spatial coverage of hail is in simulations with 41 vertical levels that use the Milbrandt scheme with ERA-Interim LBCs.
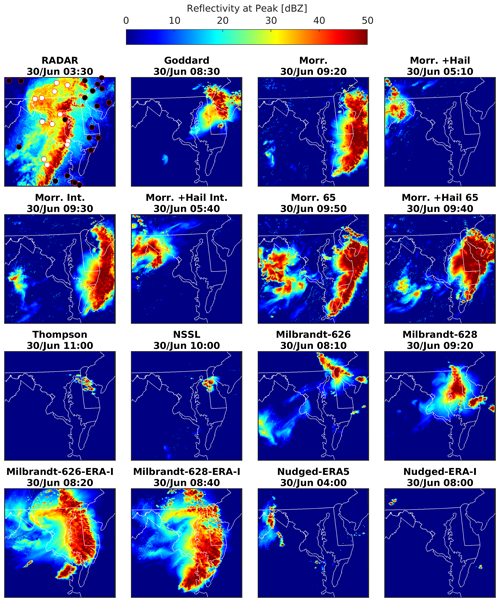
Figure 5Composite reflectivity (cREF) in domain d03 at tp (the time when values from the maximum number of grid cells exceeded 40 dBZ) during the derecho period from radar and each WRF ensemble member (times are noted in panel titles). The radar panel includes markers showing the presence (white) and absence (black) of thunderstorm reports from ASOS stations in domain d03 in the hour surrounding 03:30 UTC on 30 June 2012. cREF > 40 dBZ varies widely across the WRF ensemble members, but most members are negatively biased relative to the radar. This bias is least marked in the Morrison-XXXXXX and Milbrandt-XXXX simulations (where XXXXXX or XXXX indicates the ensemble member in terms of LBCs, start date, number of vertical levels, and compiler from simulations that employ the Morrison (XXXXXX, six ensemble members) and Milbrandt (XXXX, four ensemble members) microphysics schemes), especially those using ERA-Interim for initial and lateral boundary conditions.
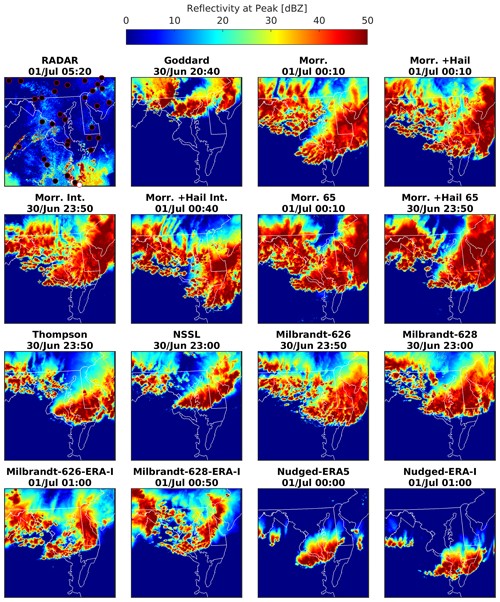
Figure 6Composite reflectivity (cREF) in domain d03 at tp (the time when values from the maximum number of grid cells exceeded 40 dBZ) during the front period from radar and each WRF ensemble member (times are noted in panel titles). The radar panel includes markers showing the presence (white) and absence (black) of thunderstorm reports from ASOS stations in domain d03 in the hour surrounding 05:20 UTC on 1 July 2012.
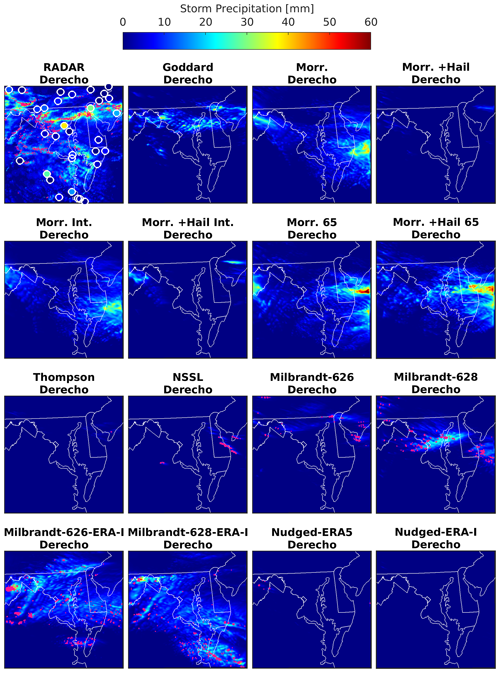
Figure 7Total accumulated precipitation (mm) from radar observations and each WRF ensemble member during the derecho period. Grid cells with MESH > 25 mm are marked in magenta. The radar indicates generally low precipitation, which is also reflected in the ASOS in situ observations (circles). Most WRF ensemble members exhibit a negative bias in terms of accumulated precipitation during the derecho period.
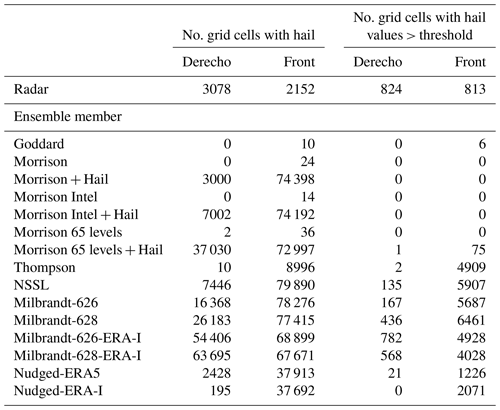
Table 4Number of grid cells in domain d03 where hail is indicated by the radars or present in the WRF simulations during the derecho (29 June at 21:30:00 UTC to 30 June 2012 at 13:30:00 UTC) and the frontal passage (30 June at 15:20:00 UTC to 1 July 2012 at 14:50:00 UTC). Also shown is the number of grid cells with the maximum estimated size of hail (MESH) above 25 mm from the radar or WRF. Recall that the radar detection of hail is re-gridded onto the WRF grid used for domain d03 prior to use in the model evaluation.
The radar data indicate localized heavy precipitation in an east–west line across the north of domain d03 during the derecho period, with total accumulations exceeding 38 mm over the 16 h period in a few locations. However, the radar indicates generally low precipitation, which is also reflected in the ASOS in situ observations (Fig. 7). Most WRF ensemble members exhibit a negative bias in terms of accumulated precipitation during the derecho period, although there are marked differences between the different parameterizations (Fig. 7). Ensemble members Morrison + Hail, Thompson, and NSSL exhibit very little precipitation anywhere in domain d03. The nudged simulations using ERA5 and ERA-Interim and the Milbrandt microphysics scheme also produce very little precipitation anywhere in the domain in this period. The ensemble members using Milbrandt and ERA-Interim LBCs (Milbrandt-626-ERA-I and Milbrandt-628-ERA-I) and Morrison Intel, Morrison 65 levels, and Morrison 65 levels + Hail show the highest precipitation totals. The closest agreement in terms of the spatial fields of accumulated precipitation are found for the simulations within ERA5 LBCs and the Milbrandt microphysics scheme (Table 3).
When remapped to the WRF grid, the radar data indicate that 824 of the almost 90 000 grid cells experienced severe hail during the derecho period (Table 4). These locations identified by the radar detection algorithm as exhibiting hail and MESH > 25 mm are distributed throughout domain d03 (Fig. 7). The WRF ensemble members – particularly those that employ the Milbrandt microphysics scheme (and the Morrison 65 levels + Hail simulation) – indicate much greater spatial coverage of hail (Table 4). When the threshold of MESH > 25 mm is applied to the WRF output, the occurrence of hail greatly decreases, and rather few grid cells show hail above this threshold (Table 4).
During the front period, the situation is reversed in that radar observations show limited areas with high precipitation totals over 40 mm and 2152 grid cells where hail was detected in clouds. Areas with substantial precipitation accumulation are only evident from radar in bands in the south of the domain, in regions where hail is also indicated by the radar detection algorithm (Fig. 8). Two-thirds of the domain shows little or no precipitation in either radar or ASOS data. All non-nudged WRF ensemble members indicate positive bias in domain-wide precipitation and overpredict the occurrence of hail (Table 4). All four non-nudged ensemble members with the Milbrandt microphysics scheme simulations also indicate multiple locations with hail accumulation above 1 mm. The number of grid cells with radar detection of hail (3078) shows the closest agreement with the Morrison + Hail simulation (3000) (Table 4). Using MESH > 25 mm and WRF hail accumulation of 1 mm as indicative of substantial hail, the closest accord for the front period is found for the Milbrandt-628 ensemble member (Table 4).
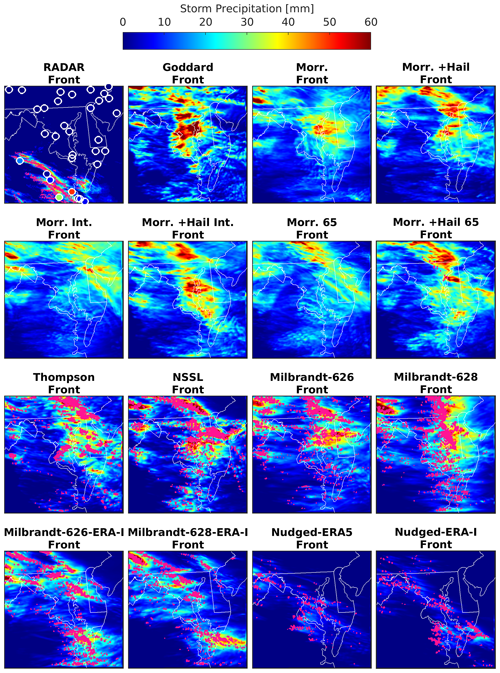
Figure 8Total accumulated precipitation (mm) from radar and each WRF ensemble member during the front period. Grid cells with MESH > 25 mm are marked in magenta. In situ ASOS observations are also shown (circles). Areas with substantial precipitation accumulation are only evident from radar in bands in the south of the domain, in regions where hail is also indicated by the radar detection algorithm. Two-thirds of the domain shows little or no precipitation in either radar or ASOS data. All non-nudged WRF ensemble members indicate positive bias in domain-wide precipitation and overpredict the occurrence of hail.
The vertical cross-sections of radar reflectivity at tp in the derecho period in grid cells with cREF > 40 dBZ show similar dependence on the microphysics scheme to those that are manifest in the cREF and the precipitation analyses (Fig. 9; see Fig. S1 in the Supplement for the same visualization for the front period). Vertical profiles of base reflectivity data from each 360° arc scan at each elevation angle from each radar at tp are also shown in Fig. 9. Though this observationally constrained vertical profile is based on considerably lower data volumes than those of the WRF output, it is noteworthy that the peak in reflectivity from the radar is located lower in the atmosphere than in most of the WRF ensemble members. Further, a greater fraction of the reflectivity values at 12 km (the highest height from which any radar data are available) from the radar observations are >20 dBZ compared to many, but not all, of the ensemble members. Analyses of output from the Morrison ensemble member indicate many grid cells with estimated base reflectivity > 35 dBZ over a deep layer (up to 10 km), while the Morrison + Hail ensemble member indicates fewer grid cells with cREF above 40 dBZ (Fig. 5), and fewer of those grid cells have a base reflectivity > 30 dBZ above 5 km (Fig. 9). Of the grid cells from the Thompson ensemble member that have cREF > 40 dBZ, 10 % also exhibit base reflectivity at a height of approximately 4 km that exceeds 55 dBZ, but the spatial variability in this metric of the cloud droplet number and size concentration at a height of approximately 4 km is the highest of all ensemble members and the relatively shallow nature of the convection (i.e., depth of high base reflectivity, Fig. 9) is consistent with the relatively low precipitation totals (Fig. 5). The simulations that use the Milbrandt microphysics scheme tend to have deep layers with base reflectivity above 35 dBZ and lower spatial variability (Fig. 9), consistent with the high production of hail (Table 4). In contrast to the other ensemble members, the nudged simulations with LBCs from both ERA5 and ERA-Interim indicate the region of highest inferred radar base reflectivity at tp that is displaced from the ground (Fig. 9). Increasing the number of vertical levels from 41 to 65 caused an increase in the derived radar reflectivity peak (Fig. 4) and total precipitation from simulations with the Morrison microphysics scheme during the derecho period (Fig. 7) and slightly increased model fidelity for those properties, but the differences relative to the simulation with coarser vertical resolution are comparatively minor (Table 5).
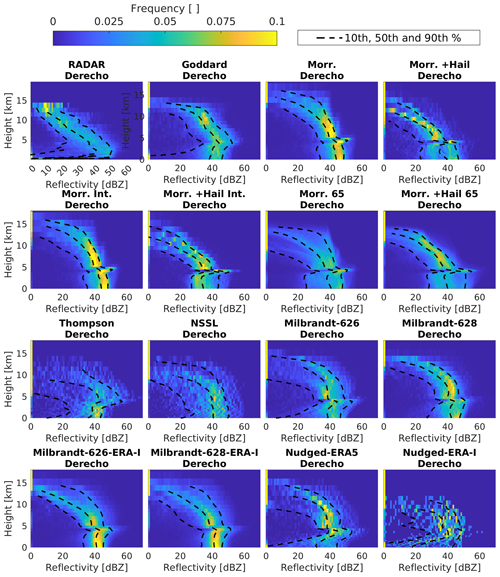
Figure 9Probability distributions of base reflectivity from radar and each WRF ensemble member at each model height at tp during the derecho period. The plot shows the frequency with which a given reflectivity is observed at a given height in output for all domain d03 grid cells where cREF > 40 dBZ. Dashed lines show the 10th-, 50th-, and 90th-percentile reflectivity at each height.
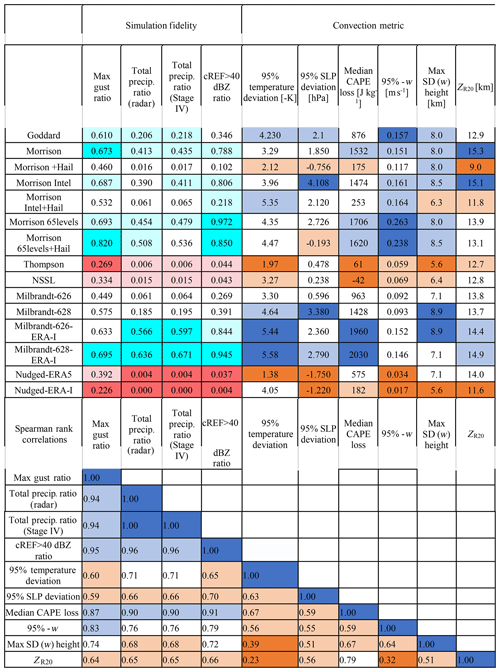
Table 5Metrics of simulation fidelity relative to observations and convection metrics derived from output from each WRF member during the period of the derecho passage (29 June at 21:30:00 UTC to 30 June 2012 at 13:30:00 UTC). The metrics of simulation fidelity are described in Sect. 2.2 and are as follows: the max gust ratio – the ratio of the maximum wind gust in any land grid cell from WRF output and observations at the ASOS stations; the total precip. ratio – the ratio of the spatial mean total accumulated precipitation from WRF to radar and Stage IV, respectively, for any grid cell with common coverage; and cREF > 40 dBZ – the ratio of the spatial extent of grid cells with cREF above 40 dBZ at the peak coverage in WRF and radar. The lower portion of the table shows the Spearman rank correlation coefficients for the 15 values of each metric (one for each ensemble member). This analysis thus shows the degree to which an ensemble member that exhibits high values of a given metric also generates high values of a second metric. The color-coding used in this table is as follows: for the measures of simulation fidelity, table cells colored red have low fidelity, and those indicated by cyan exhibit relatively high fidelity. For all other cells in the table, a background of orange indicates low values, while blue indicates comparatively high values. The saturation of the color indicates relative ordering of the values. The definitions of each convection metric are given in Sect. 2.3.
Links between deep convection, downdrafts, and near-surface wind gusts are highly complex (Brown and Dowdy, 2021b; Geerts, 2001; Kuchera and Parker, 2006), and this combined with observational limitations means very little previous research has quantified the skill in model simulations of wind gust generated by downdrafts from deep convection. Consistent with evidence presented above of spatial displacement of the regions of deepest convection, the spatial correlation coefficients of maximum wind speeds between the individual ensemble members and ASOS wind gust observations (see time series in Fig. 10a and spatial maps in Fig. 11) are also low (Table 3). As with precipitation and radar reflectivity, wind speeds are underestimated during the derecho period and overestimated during the front period. Some ensemble members (again, Milbrandt-XXXX and Morrison) produce wind gusts during the derecho period that are within a factor of 0.6 of the ASOS maximum observed wind gust, but only one of the ensemble members generates a wind gust anywhere in domain d03 that exceeds the NWS definition of “severe wind” (i.e., wind gusts at 10 m a.g.l. above 25.7 m s−1), while multiple time periods and ASOS stations reported wind gusts above this threshold (Fig. 10b). Indeed, the highest 2 % of modeled wind speeds are substantially lower than the equivalent near-surface gust observations (Fig. 10b). Only the Morrison, Milbrandt-626-ERA-I, and Milbrandt-628-ERA-I members exhibit 98th-percentile wind speeds (sampled at the model time step in both space and time over land grid cells) that lie within 50 % of the ASOS observations of wind gusts (Fig. 10b). While some of the offset between observed point measurements of 3 s duration wind gusts and grid-cell average wind speeds at the model time step of 3.33 s is expected due to the spectral truncation inherent in grid-cell average modeled wind speeds (Pryor et al., 2012), it is interesting to note that virtually all members of the model ensemble overestimate peak wind gusts during the frontal passage (Figs. 10a and 12). The two ensemble members that use ERA-Interim ICs and LBCs are associated with the highest wind speeds and greatest accord with near-surface measurements from ASOS during the derecho period (Figs. 10–12).
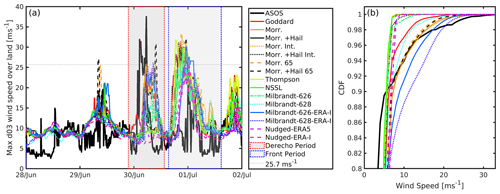
Figure 10(a) Time series of maximum wind gusts in each 10 min period at any ASOS station and any WRF land grid cell in domain d03, for each ensemble member (see maps in Figs. 11 and 12). The timings of the derecho period (29 June at 21:30:00 UTC to 30 June 2012 at 13:30:00 UTC) and the frontal passage (30 June at 15:20:00 UTC to 1 July 2012 at 14:50:00 UTC) are denoted by the gray backgrounds. The horizontal gray line denotes a wind speed of 25.7 m s−1, which is used by the NWS to define a damaging wind gust. (b) Spatiotemporal (every grid cell and all time steps) cumulative density functions (CDFs) of ASOS wind gusts and WRF wind speeds in d03 during the derecho period. To aid legibility, only the upper 20 % of values are shown. Goddard, Morrison, Milbrandt-626-ERA-I, and Milbrandt-628-ERA-I are the ensemble members with highest maximum near-surface wind speeds. Only the Morrison, Milbrandt-626-ERA-I, and Milbrandt-628-ERA-I members exhibit 98th-percentile wind speeds (sampled at the model time step in both space and time over land grid cells) that lie within 50 % of the ASOS observations of wind gusts.
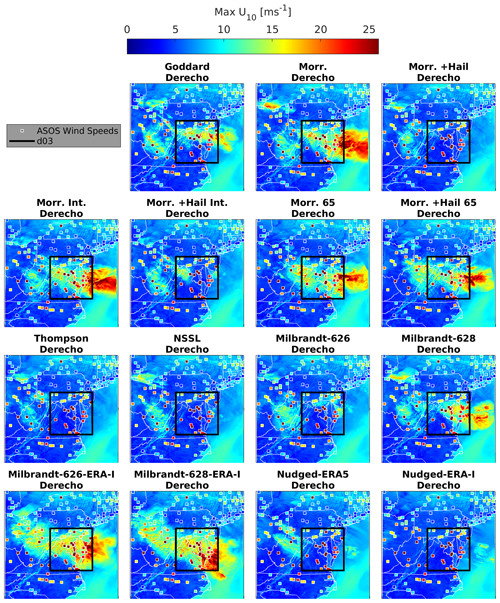
Figure 11Maximum wind speeds (m s−1) at the model time step of 3.33 s in d03 (outlined in black) and 10 s in d02 for each ensemble member during the derecho period. Maximum 3 s wind gusts (m s−1) at each ASOS station are shown by the square markers. The color bar is truncated to aid legibility at the maximum value from any WRF ensemble member. Multiple ASOS stations reported wind gusts above 25.7 m s−1.
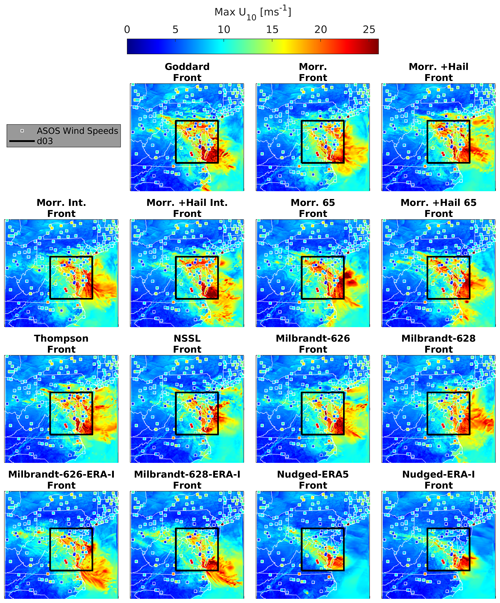
Figure 12Maximum wind speeds (m s−1) at the model time step of 3.33 s in d03 (outlined in black) and 10 s in d02 for each ensemble member during the front period. Maximum 3 s wind gusts (m s−1) at each ASOS station are shown by the square markers. The color bar is as used in Fig. 11 to aid comparisons.
The sensitivity to LBCs in simulations with Milbrandt (e.g., Figs. 5 and 11) is inconsistent with past research (Majewski, 1997). Despite the higher resolution and larger data assimilation volumes in ERA5, simulations within ERA-Interim produced better spatial agreement with observations from radar and ASOS. For simulations with the Milbrandt microphysics scheme that are initialized on 26 June at 00:00 UTC, the correlation coefficients are −0.412 vs. 0.225 for ERA5 vs. ERA-Interim, while for the simulations that started on 28 June at 00:00 UTC, the correlation coefficients are 0.318 vs. 0.669 (Table 3). The spatial correlation for peak cREF is also higher in simulations with ERA-Interim LBCs (Table 3). An examination of the ICs generated by WRF real output for 26 June at 00:00Z (Fig. 3) indicates higher pressure is prevalent and broader than in ERA-Interim, particularly across the derecho genesis region of the Midwest. The derecho event came at the end of an extended period of high near-surface temperatures. While the ERA-Interim and ERA5 fields at the model initialization time are superficially similar (on the two dates), some differences are evident (Fig. 3). For example, on 26 June, the region of elevated 2 m temperature extends further north and east in ERA-Interim and the SLP anomalies (and suppressed lower-tropospheric specific humidity) associated with the anticyclone over the Great Lakes are slightly more intense in ERA5. On 28 June, the region of elevated 2 m temperatures extends further east in ERA-Interim. Much larger differences are naturally evident in the initialization from each of the reanalyses across the two start dates (26 June vs. 28 June). The weaker, but evident, influence from model initialization time (e.g., Fig. 11) is consistent with information from the short-term forecasting community, although interestingly the spatial fields of precipitation accumulation exhibit higher agreement with observations in ensemble members initialized on 26 June. Evaluation of the initial conditions indicates a high degree of similarity between the two reanalysis products on 26 and 28 June for most properties (Fig. 3). However, as described above, development of an intense elevated mixed layer (EML, 700–500 hPa) over the central USA that subsequently propagated eastwards (Shourd and Kaplan, 2021) appears to have been a key ingredient in the development of this derecho. Earlier work (Banacos and Ekster, 2010) employed a definition of an EML as a layer of depth > 200 hPa with both a steep lapse rate (temperature declines of over 8 °C km−1) and an increase in the RH with height. Figure 3b shows the lapse rate in the four sets of ICs and indicates that while both data sets correctly (relative to output from the NOAA WRF Rapid Refresh model presented in Shourd and Kaplan, 2021) indicate relatively low lapse rates at 00:00Z on 26 June (when the region with the EML was displaced further west), using the combined definition of a strong lapse rate and a strong gradient of RH (a 20 % difference across the layer), the EML is, in both reanalysis products, displaced too far north at 00:00Z on 28 June relative to the NOAA WRF Rapid Refresh model simulations presented in Shourd and Kaplan (2021). The EML is, however, more consistent (across the two components) and more coherent in space in ERA-Interim. This may provide a partial explanation of why simulations with ERA-Interim initial and lateral boundary conditions exhibit higher fidelity with respect to aspects of the derecho.
The relatively poor simulation performance for each of the ensemble members is consistent with the literature summarized above regarding the specific challenge that this event presented. However, it also raised concerns regarding a possible issue with the stability of the cloud-based computational platform. Thus, simulations of two of the ensemble members were repeated on a separate computational platform (the US Department of Energy NERSC Cori Cray XC40) and with a different compiler (Intel). Bitwise reproducibility is not expected due to the previously documented system architecture and compiler dependence of WRF simulations (Hacker et al., 2017; Li et al., 2016). Thus, these simulations are designed to evaluate whether use of a different system architecture and compiler yields marked improvements in terms of the fidelity with which the derecho is simulated and to evaluate if the response to turning on the hail flag in the Morrison scheme is consistent. The results of these additional simulations are summarized in Fig. 4 in terms of the time series of the number of grid cells with high cREF and in Fig. 5 in terms of the cREF spatial patterns at tp. These and other diagnostics indicate a high degree of similarity between the output of these simulations and the original ensemble members. Our inference is that the ensemble members generated by WRF compiled using GNU Fortran are reliable.
3.2 Linking fidelity to metrics of CAPE, downbursts, and cold-pool generation
As described above, there is considerable spread among the ensemble members in terms of their fidelity relative to remote sensing and in situ observations. Here we seek to link model skill in reproducing aspects of derecho intensity (maximum wind gust, precipitation, and spatial coverage of cREF > 40 dBZ) to metrics of convective potential specifically – MU-CAPE and wind shear between the ground and 6 km – as well as metrics of convective intensity, specifically indices of cold-pool intensity, vertical velocity, and cloud top height. We begin by describing the magnitudes and spatial variability in the diagnostic metrics in each ensemble member.
MU-CAPE presented herein from rawinsonde observations is derived using the SHARPpy software (Blumberg et al., 2017) and is defined slightly differently than in codes available from the wrf-python GitHub page (https://doi.org/10.5065/D6W094P1, Ladwig, 2017) in that it is the parcel with the maximum equivalent potential temperature in the lowest 400 mb. Thus, the values are not directly comparable. Nevertheless, high values are indicative of the presence of significant CAPE. Consistent with past summaries of the environment in which the derecho was manifest, rawinsonde data from the two stations (KIAD (38.968° N, 77.369° W) and KWAL (38.018° N, 75.236° W)) within domain d03 indicate MU-CAPE values at tp−3 (from radar) (i.e., 00:00 UTC on 30 June) of 6871 and 4735 J kg−1 (Fig. S2). The surface and 6 km shear values at that time are 17.2 and 11.5 m s−1, respectively, which is consistent with the relatively weak shear evident in the WRF ensemble members (Fig. S3). MU-CAPE at KIAD and KWAL dropped to 51 and 60 J kg−1, respectively, in the sounding at 12:00 UTC on 30 June. This further emphasizes the profound underestimation of CAPE consumption in the WRF ensemble during the passage of the derecho.
Consistently with estimates of parcel CAPE from rawinsonde soundings for this event and modeling of other derechos (Gatzen, 2004; Coniglio et al., 2011; Celiñski-Mysław and Matuszko, 2014; Weisman et al., 2013), all of the ensemble members indicate substantial MU-CAPE leading up to and at tp (Fig. 13; see also enlarged panels and time series of MU-CAPE in Figs. S2 and S4–S6). All have MU-CAPE above 4000 J kg−1 over a substantial fraction of domain d03 at tp−3 (recall tp is defined independently for all ensemble members). In some ensemble members, the boundary of the region of deep convection is clearly visible in MU-CAPE < 1000 J kg−1 at tp over the western edge of domain d03.
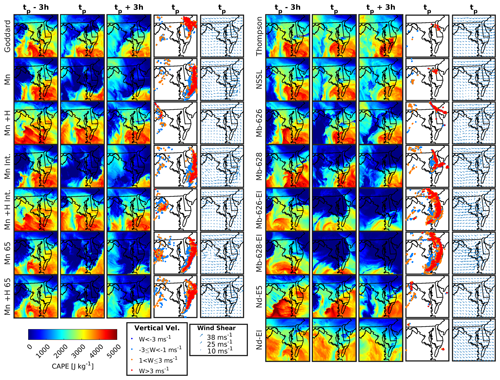
Figure 13MU-CAPE, vertical velocities, and wind shear within domain d03 for each WRF ensemble member. The left three columns show MU-CAPE for each member at tp−3 h, tp (i.e., the time of peak spatial extent of cREF > 40 dBZ during the derecho period), and tp+3 h. The fourth column shows the vertical wind speed (W) at 5000 m a.g.l. at tp. within individual grid cells greatly exceeds 3 m s−1 (values range from −10 +10 m s−1). These classes have been subjectively selected to capture the major regions of up- and downdrafts. The right column shows the total wind shear between the ground and 6000 m (S6; see definition in Sect. 2.3). Larger versions of these maps are provided in the Supplement (Figs. S2–S4, S5, and S7). Abbreviations: Mn denotes Morrison, H denotes Hail, Int. denotes Intel, Mb denotes Milbrandt, EI denotes ERA-Interim, E5 denotes ERA5, and Nd denotes Nudged.
There is also notable variability between ensemble members in terms of the magnitude of the vertical wind shear (0–6 km, S6; see definition in Sect. 2.3) at tp (Fig. 13; see also Fig. S3). The highest shear (of up to 38 m s−1 over this layer, or 0.006 s−1) is shown in the Milbrandt-628, Milbrandt-628, Milbrandt-626-ERA-I, and Milbrandt-628-ERA-I simulations. These values are at the upper end of observational estimates for derecho events over the contiguous USA between 1988–1993 (Evans and Doswell, 2001). The nudged ensemble members and Morrison + Hail and NSSL indicate relatively low shear.
The degree to which MU-CAPE decreases by tp+3 varies considerably across the ensemble members (Figs. S2, S4, and S5 and Table 5). The change in 50th-percentile MU-CAPE values across domain d03 ranges from ∼0 in the ensemble members NSSL and Thompson to ≥900 J kg−1 in ensemble members Morrison, Milbrandt-628, Milbrandt-628, Milbrandt-626-ERA-I, and Milbrandt-628-ERA-I. Indeed, the change in median MU-CAPE is ∼2000 J kg−1 in the Milbrandt-626-ERA-I and Milbrandt-628-ERA-I ensemble members, which also showed the highest agreement with observations of the spatial extent of high cREF, total precipitation accumulation, maximum wind gusts, and large hail (Table 5). Other metrics that describe convective intensity that are diagnosed at tp also indicate substantial variability across the ensemble members. Modeled vertical velocity at/close to 5 km height at tp is highest in the Goddard, Morrison, Milbrandt-626-ERA-I and Milbrandt-628-ERA-I ensemble members (Fig. 13; see also Fig. S7), which also show substantial coverage of upward velocities in excess of 3 m s−1 and proximal regions with substantial downdrafts of greater than 3 m s−1. This is manifested as high values of the standard deviation of vertical velocities within 50 km of grid cells with cREF > 40 dBZ (Table 5). Goddard, Morrison, Milbrandt-626-ERA-I, and Milbrandt-628-ERA-I are also the ensemble members with the highest maximum near-surface wind speeds (Fig. 10 and Table 5). The estimate of cloud top height derived using a threshold of base reflectivity from each model layer ranges from a low of 9 km (Morrison + Hail) to over 13.5 km in all ensemble members that employ the Milbrandt microphysics schemes and that were not subject to nudging (Table 5).
Cold-pool intensity as measured by the highest 5 % of sea-level pressure anomalies (95th-percentile SLP) and lowest 5 % of temperature anomalies (i.e., 95th-percentile negative temperature perturbations) also exhibits substantial variability between ensemble members. This is consistent with previous research that has examined the microphysics scheme spread and its associated impact on cold-pool properties and dynamics (Xue et al., 2017). The lowest 5 % temperature deviations vary from −1.38 to −5.58 K (Table 5 and example fields shown in Fig. 14 for the Morrison and Milbrandt-628-ERA-I ensemble members). The upper end of this range is thus consistent with the cold-pool intensities from the experiment study of derechos from Oklahoma that indicated maximum (point) temperature anomalies of 5.4 to 9.5 K (Engerer et al., 2008). Four ensemble members (Goddard, Milbrandt-628, and the two simulations within ERA-Interim LBCs) also exhibit 95th-percentile SLP deviations of above 2 hPa (Table 5 and example fields shown in Fig. 14). While it is challenging to evaluate the simulation of these cold pools due to the limited spatial coverage of the ASOS network, the ranges of SLP and near-surface temperature anomalies from these ensemble members are broadly consistent with those calculated from the ASOS observations. The estimate of cloud top height derived using a threshold of base reflectivity from each model layer ranges from a low of 9 km (Morrison + Hail) to over 13.5 km in all ensemble members that employ the Milbrandt microphysics schemes and that were not subject to nudging (Table 5).
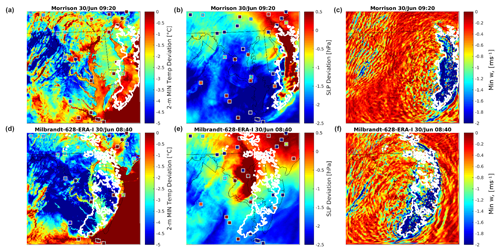
Figure 14WRF cold-pool diagnostics at tp from two of the more skillful model ensemble members: Morrison (a–c) and Milbrandt-628-ERA-I (d–f). The metrics shown are the 2 m temperature anomaly (a, d), sea-level pressure anomaly (b, e), and largest negative velocity (c, f) for the WRF ensemble members. The title indicates the time step associated with tp, i.e., when the maximum spatial coverage of cREF > 40 dBZ is simulated. Grid cells with cREF > 40 dB at tp are outlined by the white contours. Although these two ensemble members exhibit the highest fidelity with respect to the areal coverage of cREF and exhibit relatively high skill in reproducing precipitation and wind gusts, as illustrated by the figure, these simulations generate different morphologies of the derecho.
The Spearman correlation coefficients (r) between the three metrics of model fidelity from this 15 member ensemble are >0.9, indicating that a simulation that exhibits atypically high skill with respect to maximum wind speed is also likely to perform well in describing the spatial extent of high cREF and accumulated precipitation (Table 5). The storm intensity metrics all also exhibit positive r values, but they are of varying magnitude. For example, there is only a weak association between the rank correlation of cloud top height and vertical velocities (r<0.38).
Simulated wind gusts at the surface are a product of downdrafts or downbursts and resulting gust fronts. Accordingly, the highest 5 % of downward vertical velocities exhibit a Spearman correlation coefficient (r) with a ratio of modeled to observed maximum wind gusts of 0.90 (Table 5). All ensemble members that exhibit higher maximum wind gust ratios also exhibit stronger downdrafts (exhibit largest negative vertical velocity), stronger vertical wind shear, and higher median MU-CAPE change. Consistently with past research that examined the ensemble spread for simulated squall lines from the use of different microphysics schemes (Morrison et al., 2015; Xue et al., 2017), the two cold-pool metrics are also shown to be predictive of model fidelity for wind gusts associated with the derecho. That is, models that generate the strongest cold pools (as measured by either the near-surface temperature or pressure anomalies) tend to be those that perform best in terms of the associated near-surface wind gusts (r across the 15 members is 0.72–0.75; see Table 5). Metrics of cold-pool dynamics are also predictive of other aspects of simulation fidelity (e.g., extent of cREF), which is consistent with their importance for the triggering and organization of persistent convection.
Although the two ensemble members that exhibit the highest fidelity with respect to the areal coverage of cREF (Morrison and Milbrandt-628-ERA-I) also exhibit relatively high skill in reproducing precipitation and wind gusts (as shown previously), as illustrated by Fig. 14, these simulations generate different morphologies of the derecho. Specifically, the region of high cREF is much more spatially homogeneous in Morrison than Milbrandt-628-ERA-I. Further, the cold-pool intensity at tp exhibits important differences. The region of elevated SLP is much more marked in Morrison, but the associated temperature anomaly is much smaller than that from Milbrandt-628-ERA-I; this may be linked to the lower elevation of downdraft maximum intensity in the Morrison ensemble member (Table 5).
In those ensemble members that perform comparatively poorly in terms of reproducing key aspects of the derecho (e.g., Morrison + Hail, NSSL, Thompson, and both nudged simulations), MU-CAPE is not consumed in sufficient amounts, resulting in underproduction of deep convection during the derecho (Table 5). This leaves excess MU-CAPE for the subsequent frontal passage, resulting in excess production of convective cells, wind gusts, cREF > 40 dBZ, and precipitation (Figs. 6, 8, and 12). This may have implications for climate-scale (long-term) simulations from CPRCMs and specifically inference regarding temporal sequencing of deep convection and associated hazards such as flooding.
Severe wind gusts associated with derechos represent an important natural hazard resulting from MCSs. Efforts to improve simulations of deep convection in both weather forecasting and climate projections have been hampered by both conceptual gaps in our understanding of small-scale cloud processes, with a lack of observations of both the associated hazards and hydrometeor properties on the microscale (Morrison et al., 2020), and challenges in representing scale linkages in numerical models. Additionally, advanced schemes tend to be computationally expensive (Xue et al., 2017), which may limit their utility in CPRCM simulations. Accordingly, while a limited number of studies have sought to examine how severe convective wind environments might change in the future (Brown and Dowdy, 2021a), very few robust hindcast ensemble simulations exist for specific events that can be leveraged in a pseudo-global-warming framework. Evaluating the inherent ability of models to reproduce key aspects of historical, poorly forecasted severe events will facilitate the further development of model parameterization schemes, allow selection of optimal model configuration for simulating high-impact events (Dai et al., 2021), and provide context for examining how such events might change in the future.
Revisiting the main objectives of this work, we sought to evaluate an ensemble of simulations with WRF that differ in terms of the microphysics schemes applied, start date, lateral boundary conditions, Fortran compiler, and use of nudging. The main findings of this study are as follows.
This 15-member WRF ensemble tends to underestimate the spatial extent of high composite reflectivity, near-surface wind speed, and precipitation during the derecho period and overestimate cREF, wind speed, and precipitation during the subsequent frontal passage. The bias with respect to the subsequent front is linked to a negative bias in MU-CAPE depletion during the derecho. The use of a double-moment, seven-class scheme with number concentrations for all species (including hail and graupel) (Milbrandt–Yau) results in the greatest model fidelity for maximum wind speeds, hail, and precipitation accumulation. This is consistent with numerous studies that have shown increased fidelity when using double-moment, bulk microphysics schemes with number concentrations for ice, graupel, and hail (Morrison et al., 2015).
Model settings such as initialization time and LBCs exhibit a strong signal in driving different convective conditions and result in a large spread of the associated natural hazards: wind gusts and hail. The ensemble spread from changing the microphysics scheme and the resulting simulated dynamic and thermodynamic convective structures (Xue et al., 2017) is similar to that caused by changing the lateral boundary conditions. The higher fidelity associated with use of ERA-Interim reanalysis data as opposed to ERA5 is unexpected. Nested simulations of a European derecho event using the COSMO regional model found significant improvement in the simulation fidelity with use of ERA5 for the LBCs over simulations using ERA-Interim. Our finding has important implications for the construction of hindcast simulations for use in surrogate or pseudo-global-warming (PGW) numerical experiments to quantify the potential role of global warming in extreme weather events using regional models (Li et al., 2019; Kröner et al., 2017; Haberlie and Ashley, 2019; Liu et al., 2017). In such simulations, a historically important extreme event/period/season is first simulated using contemporary LBCs, and then the simulation is repeated using LBCs and ICs perturbed to represent the change in, for example, air temperatures and water vapor availability (Kröner et al., 2017). The difference in these two realizations is interpreted as the impact of global climate non-stationarity. A previous analysis over the contiguous USA (CONUS) used ERA-Interim LBCs and shifted the atmospheric profile by ±5 °C. The authors found increases in both CAPE and convective inhibition, which implies a shift in the convective population (Rasmussen et al., 2020). Our work indicates use of ERA5 for ICs and LBCs may not always result in high-fidelity baseline simulations of extreme convective events in the contemporary climate. These simulation deficiencies may render evaluation of the PGW response highly uncertain. Additional simulations using ERA5 and ERA-Interim are required before generalizable conclusions can be made about which data set provides better boundary conditions. The relatively low skill of the 15 WRF ensemble members for this derecho and the improvement in model skill for the simulations initialized at a later time stamp (28 June vs. 26 June) are consistent with past research that has indicated that forecast errors in the simulation of deep convection have a doubling time of only a few hours (Prein et al., 2015). This represents an important challenge for simulations of these atmospheric hazards.
The diagnostic metrics applied here to represent the pre-conditioning of the environment as well as key dynamic and thermodynamic aspects of the storm (development and propagation of squall lines, downbursts, and cold-pool development) are highly predictive of the relative skill of individual model ensemble members. This seems to imply that although the ensemble members incompletely resolve key outcomes of the derecho (e.g., the intensity of the wind gusts), their relative ability in terms of the associated dynamics appears to indicate the better-performing ensemble members are generating “the right answers for the right reasons”.
Due to its computational demand, a spectral-bin microphysics scheme was not used here, even though such schemes have been shown to outperform double-moment bulk schemes in a weather forecasting context (Xue et al., 2017; Fan et al., 2017). Future work in the field of model fidelity and scheme sensitivity that examines historically significant weather events would benefit from even larger ensembles and, as computing developments allow, the use of more conceptually realistic spectral-bin microphysics parameterization schemes.
The WRF code version used in this study (v3.8.1) is available at https://doi.org/10.5065/D68S4MVH (Skamarock et al., 2008).
For WRF releases beginning with version 4 and above, go to https://doi.org/10.5065/1dfh-6p97 (Skamarock et al., 2019).
ERA-Interim output is available for download at https://doi.org/10.24381/cds.f2f5241d (Dee et al., 2011b) The NOAA NCEP real-time global sea surface temperature analyses are available at http://www.nco.ncep.noaa.gov/pmb/products/sst/ (NOAA, 2024). ERA5 output is available for download at https://doi.org/10.24381/cds.adbb2d47 (Copernicus Climate Change Service and Climate Data Store, 2023). NEXRAD radar data, including all products used in the current study, are available from the National Centers for Environmental Information (https://www.ncei.noaa.gov/products/radar/next-generation-weather-radar, National Centers for Environmental Information, 2021a). NWS ASOS data are available at ftp://ftp.ncdc.noaa.gov/pub/data/asos-fivemin/ (National Centers for Environmental Information, 2021b). The NOAA Storm Events Database is available at https://www.ncdc.noaa.gov/stormevents/ (National Centers for Environmental Information, 2021c). NCEP/EMC 4 km Gridded Data Stage IV (precipitation data that combine radar and rain gauge measurements) (Du, 2011) were downloaded at https://doi.org/10.5065/D6PG1QDD (Du, 2011) in GRIB format and converted for processing to netCDF using the NCL command “ncl_convert2nc”. Hourly precipitation amounts were summed for the entire duration of the derecho period. All model output used in the analyses presented here, including a sample namelist, will be made available upon request (Sara C. Pryor, sp2279@cornell.edu).
The supplement related to this article is available online at: https://doi.org/10.5194/nhess-24-4473-2024-supplement.
SCP and TS conceived the research and developed the experimental design with input from RJB. TS performed the simulations. FL, TS, and SCP performed the analyses and prepared the figures and tables. SCP and TS developed the initial manuscript. All authors contributed to the final article.
The contact author has declared that none of the authors has any competing interests.
Publisher's note: Copernicus Publications remains neutral with regard to jurisdictional claims made in the text, published maps, institutional affiliations, or any other geographical representation in this paper. While Copernicus Publications makes every effort to include appropriate place names, the final responsibility lies with the authors.
The authors thank Hugh Morrison for his insightful comments regarding his microphysics scheme and the three anonymous reviewers for their detailed comments.
This research has been supported by the US Department of Energy (grant nos. DE-SC0016438 and DE-SC0016605), the Office of Advanced Cyberinfrastructure (grant no. TG-ATM170024), and the National Energy Research Scientific Computing Center (grant no. DE-AC02-05CH11231).
This paper was edited by Gregor C. Leckebusch and reviewed by three anonymous referees.
Adams-Selin, R. D., van den Heever, S. C., and Johnson, R. H.: Impact of graupel parameterization schemes on idealized bow echo simulations, Mon. Weather Rev., 141, 1241–1262, 2013.
Allen, J. T.: Climate change and severe thunderstorms, in: Oxford research encyclopedia of climate science, https://doi.org/10.1093/acrefore/9780190228620.013.62, 2018.
Alpert, J. C. and Kumar, V. K.: Radial wind super-obs from the WSR-88D radars in the NCEP operational assimilation system, Mon. Weather Rev., 135, 1090–1109, 2007.
Ashley, W. S. and Mote, T. L.: Derecho hazards in the United States, B. Am. Meteorol. Soc., 86, 1577–1592, 2005.
Bachmann, K., Keil, C., Craig, G. C., Weissmann, M., and Welzbacher, C. A.: Predictability of Deep Convection in Idealized and Operational Forecasts: Effects of Radar Data Assimilation, Orography, and Synoptic Weather Regime, Mon. Weather Rev., 148, 63–81, https://doi.org/10.1175/mwr-d-19-0045.1, 2020.
Banacos, P. C. and Ekster, M. L.: The Association of the Elevated Mixed Layer with Significant Severe Weather Events in the Northeastern United States, Weather Forecast., 25, 1082-1102, https://doi.org/10.1175/2010waf2222363.1, 2010.
Barrett, A. I., Wellmann, C., Seifert, A., Hoose, C., Vogel, B., and Kunz, M.: One Step at a Time: How Model Time Step Significantly Affects Convection-Permitting Simulations, J. Adv. Model. Earth Syst., 11, 641-658, https://doi.org/10.1029/2018MS001418, 2019.
Bedard, A., Hooke, W., and Beran, D.: The Dulles airport pressure jump detector array for gust front detection, B. Am. Meteorol. Soc., 58, 920–927, 1977.
Bentley, E. S. and Logsdon, J.: An Examination of the Mesoscale Environment and Evolution of the Northern Indiana/Northwest Ohio Derecho of 29 June 2012, Elect. J. Severe Storms Metereol., 11, 1–25, https://doi.org/10.55599/ejssm.v11i1.61, 2016.
Blumberg, W. G., Halbert, K. T., Supinie, T. A., Marsh, P. T., Thompson, R. L., and Hart, J. A.: SHARPpy: An Open-Source Sounding Analysis Toolkit for the Atmospheric Sciences, B. Am. Meteorol. Soc., 98, 1625–1636, https://doi.org/10.1175/bams-d-15-00309.1, 2017.
Brooks, H. E., Lee, J. W., and Craven, J. P.: The spatial distribution of severe thunderstorm and tornado environments from global reanalysis data, Atmos. Res., 67, 73–94, 2003.
Brown, A. and Dowdy, A.: Severe Convective Wind Environments and Future Projected Changes in Australia, J. Geophys. Res.-Atmos., 126, e2021JD034633, https://doi.org/10.1029/2021JD034633, 2021a.
Brown, A. and Dowdy, A.: Severe convection-related winds in Australia and their associated environments, J. South. Hemisph. Earth Syst. Sci., 71, 30–52, https://doi.org/10.1071/ES19052, 2021b.
Cattiaux, J. and Yiou, P.: U.S. Heat waves of spring and summer 2012 from the Flow-Analogue perspective [in “Explaining Extreme Events of 2012 from a Climate Perspective”], B. Am. Meteorol. Soc., 94, S10–S13, 2013.
Celiñski-Mysław, D. and Matuszko, D.: An analysis of selected cases of derecho in Poland, Atmos. Res., 149, 263–281, https://doi.org/10.1016/j.atmosres.2014.06.016, 2014.
Chen, Q., Fan, J., Hagos, S., Gustafson Jr., W. I., and Berg, L. K.: Roles of wind shear at different vertical levels: Cloud system organization and properties, J. Geophys. Res.-Atmos., 120, 6551–6574, https://doi.org/10.1002/2015JD023253, 2015.
Coniglio, M. C. and Stensrud, D. J.: Simulation of a Progressive Derecho Using Composite Initial Conditions, Mon. Weather Rev., 129, 1593–1616, https://doi.org/10.1175/1520-0493(2001)129<1593:Soapdu>2.0.Co;2, 2001.
Coniglio, M. C., Corfidi, S. F., and Kain, J. S.: Environment and Early Evolution of the 8 May 2009 Derecho-Producing Convective System, Mon. Weather Rev., 139, 1083–1102, 2011.
Copernicus Climate Change Service and Climate Data Store: ERA5 hourly data on single levels from 1940 to present, Copernicus Climate Change Service (C3S) Climate Data Store (CDS) [data set], https://doi.org/10.24381/cds.adbb2d47, 2023.
Cordeira, J. M., Metz, N. D., Howarth, M. E., and Galarneau, T. J.: Multiscale Upstream and In Situ Precursors to the Elevated Mixed Layer and High-Impact Weather over the Midwest United States, Weather Forecast., 32, 905–923, https://doi.org/10.1175/waf-d-16-0122.1, 2017.
Corfidi, S. F., Coniglio, M. C., Cohen, A. E., and Mead, C. M.: A proposed revision to the definition of “derecho”, B. Am. Meteorol. Soc., 97, 935–949, 2016.
Crum, T. D., Saffle, R. E., and Wilson, J. W.: An update on the NEXRAD program and future WSR-88D support to operations, Weather Forecast., 13, 253–262, 1998.
Dai, D., Chen, L., Ma, Z., and Xu, Z.: Evaluation of the WRF physics ensemble using a multivariable integrated evaluation approach over the Haihe river basin in northern China, Clim. Dynam., 57, 557–575, 2021.
Dee, D. P., Uppala, S., Simmons, A., Berrisford, P., Poli, P., Kobayashi, S., Andrae, U., Balmaseda, M., Balsamo, G., and Bauer, D. P.: The ERA-Interim reanalysis: Configuration and performance of the data assimilation system, Q. J. Roy. Meteorol. Soc., 137, 553–597, https://doi.org/10.1002/qj.828, 2011a.
Dee, D. P., Uppala, S. M., Simmons, A. J., Berrisford, P., Poli, P., Kobayashi, S., Andrae, U., Balmaseda, M. A., Balsamo, G., Bauer, P., Bechtold, P., Beljaars, A. C. M., van de Berg, L., Bidlot, J., Bormann, N., Delsol, C., Dragani, R., Fuentes, M., Geer, A.J., Haimberger, L., Healy, S. B., Hersbach, H., Hólm, E. V., Isaksen, L., Kållberg, P., Köhler, M., Matricardi, M., McNally, A. P., Monge-Sanz, B. M., Morcrette, J. J., Park, B. K., Peubey, C., de Rosnay, P., Tavolato, C., Thépaut, J. N., and Vitart, F.:: ERA-Interim global atmospheric reanalysis, Copernicus Climate Change Service (C3S) Climate Data Store (CDS) [data set], https://doi.org/10.24381/cds.f2f5241d, 2011b.
Du, J.: UCAR/NCAR – Earth Observing Laboratory, NCEP/EMC 4 KM Gridded Data (GRIB) Stage IV Data, Version 1.0, UCAR/NCAR – Earth Observing Laboratory [data set], https://doi.org/10.5065/D6PG1QDD, 2011.
Dudhia, J.: Numerical study of convection observed during the winter monsoon experiment using a mesoscale two-dimensional model, J. Atmos. Sci., 46, 3077–3107, 1989.
Engerer, N. A., Stensrud, D. J., and Coniglio, M. C.: Surface characteristics of observed cold pools, Mon. Weather Rev., 136, 4839–4849, 2008.
Evans, J. S. and Doswell, C. A.: Examination of derecho environments using proximity soundings, Weather Forecast., 16, 329–342, 2001.
Fan, J., Liu, Y.-C., Xu, K.-M., North, K., Collis, S., Dong, X., Zhang, G. J., Chen, Q., Kollias, P., and Ghan, S. J.: Improving representation of convective transport for scale-aware parameterization: 1. Convection and cloud properties simulated with spectral bin and bulk microphysics, J. Geophys. Res.-Atmos., 120, 3485–3509, https://doi.org/10.1002/2014JD022142, 2015.
Fan, J., Han, B., Varble, A., Morrison, H., North, K., Kollias, P., Chen, B., Dong, X., Giangrande, S. E., Khain, A., Lin, Y., Mansell, E., Milbrandt, J. A., Stenz, R., Thompson, G., and Wang, Y.: Cloud-resolving model intercomparison of an MC3E squall line case: Part I – Convective updrafts, J. Geophys. Res.-Atmos., 122, 9351–9378, https://doi.org/10.1002/2017JD026622, 2017.
Federico, S., Torcasio, R. C., Avolio, E., Caumont, O., Montopoli, M., Baldini, L., Vulpiani, G., and Dietrich, S.: The impact of lightning and radar reflectivity factor data assimilation on the very short-term rainfall forecasts of RAMS@ISAC: application to two case studies in Italy, Nat. Hazards Earth Syst. Sci., 19, 1839–1864, https://doi.org/10.5194/nhess-19-1839-2019, 2019.
Fierro, A. O., Gao, J., Ziegler, C. L., Mansell, E. R., MacGorman, D. R., and Dembek, S. R.: Evaluation of a cloud-scale lightning data assimilation technique and a 3DVAR method for the analysis and short-term forecast of the 29 June 2012 derecho event, Mon. Weather Rev., 142, 183–202, 2014.
Fovell, R. G. and Ogura, Y.: Effect of vertical wind shear on numerically simulated multicell storm structure, J. Atmos. Sci., 46, 3144–3176, https://doi.org/10.1175/1520-0469(1989)046<3144:Eovwso>2.0.Co;2, 1989.
Gatzen, C.: A Derecho in Europe: Berlin, 10 July 2002, Weather Forecast., 19, 639–645, 2004.
Gatzen, C. P., Fink, A. H., Schultz, D. M., and Pinto, J. G.: An 18-year climatology of derechos in Germany, Nat. Hazards Earth Syst. Sci., 20, 1335–1351, https://doi.org/10.5194/nhess-20-1335-2020, 2020.
Geerts, B. W. A. F.: Estimating Downburst-Related Maximum Surface Wind Speeds by Means of Proximity Soundings in New South Wales, Australia, Weather Forecast., 16, 261–269, https://doi.org/10.1175/1520-0434(2001)016<0261:EDRMSW>2.0.CO;2, 2001.
Guastini, C. T. and Bosart, L. F.: Analysis of a progressive derecho climatology and associated formation environments, Mon. Weather Rev., 144, 1363–1382, 2016.
Haberlie, A. M. and Ashley, W. S.: Climatological representation of mesoscale convective systems in a dynamically downscaled climate simulation, Int. J. Climatol., 39, 1144–1153, https://doi.org/10.1002/joc.5880, 2019.
Hacker, J. P., Exby, J., Gill, D., Jimenez, I., Maltzahn, C., See, T., Mullendore, G., and Fossell, K.: A Containerized Mesoscale Model and Analysis Toolkit to Accelerate Classroom Learning, Collaborative Research, and Uncertainty Quantification, B. Am. Meteorol. Soc., 98, 1129–1138, https://doi.org/10.1175/bams-d-15-00255.1, 2017.
Halverson, J. B.: A mighty wind: The derecho of June 29, 2012, Weatherwise, 67, 24–31, 2014.
Hersbach, H., Bell, B., Berrisford, P., Hirahara, S., Horányi, A., Muñoz-Sabater, J., Nicolas, J., Peubey, C., Radu, R., Schepers, D., Simmons, A., Soci, C., Abdalla, S., Abellan, X., Balsamo, G., Bechtold, P., Biavati, G., Bidlot, J., Bonavita, M., De Chiara, G., Dahlgren, P., Dee, D., Diamantakis, M., Dragani, R., Flemming, J., Forbes, R., Fuentes, M., Geer, A., Haimberger, L., Healy, S., Hogan, R. J., Hólm, E., Janisková, M., Keeley, S., Laloyaux, P., Lopez, P., Lupu, C., Radnoti, G., de Rosnay, P., Rozum, I., Vamborg, F., Villaume, S., and Thépaut, J.-N.: The ERA5 global reanalysis, Q. J. Roy. Meteorol. Soc., 146, 1999–2049, https://doi.org/10.1002/qj.3803, 2020.
Hohenegger, C., Lüthi, D., and Schär, C.: Predictability mysteries in cloud-resolving models, Mon. Weather Rev., 134, 2095–2107, 2006.
Houze Jr., R. A.: Mesoscale convective systems, Rev. Geophys., 42, RG4003, https://doi.org/10.1029/2004RG000150, 2004.
Hu, H., Leung, L. R., and Feng, Z.: Observed warm-season characteristics of MCS and non-MCS rainfall and their recent changes in the Central United States, Geophys. Res. Lett., 47, e2019GL086783, https://doi.org/10.1029/2019GL086783, 2020.
Jeworrek, J., West, G., and Stull, R.: Evaluation of cumulus and microphysics parameterizations in WRF across the convective gray zone, Weather Forecast., 34, 1097–1115, 2019.
Jiménez, P. A., Dudhia, J., González-Rouco, J. F., Navarro, J., Montávez, J. P., and García-Bustamante, E.: A revised scheme for the WRF surface layer formulation, Mon. Weather Rev., 140, 898–918, https://doi.org/10.1175/MWR-D-11-00056.1, 2012.
Johns, R. H. and Hirt, W. D.: Derechos: Widespread convectively induced windstorms, Weather Forecast., 2, 32–49, 1987.
Johnson, A.: Multiscale characteristics and evolution of perturbations for warm season convection-allowing precipitation forecasts: Dependence on background flow and method of perturbation, Mon. Weather Rev., 142, 1053–1073, 2014.
Johnson, A. and Wang, X.: A Study of Multiscale Initial Condition Perturbation Methods for Convection-Permitting Ensemble Forecasts, Mon. Weather Rev., 144, 2579–2604, https://doi.org/10.1175/mwr-d-16-0056.1, 2016.
Johnson, A., Wang, X., Carley, J. R., Wicker, L. J., and Karstens, C.: A comparison of multiscale GSI-based EnKF and 3DVar data assimilation for midlatitude convective-scale precipitation forecasts, Mon. Weather Rev., 143, 3087–3108, 2015.
Johnson, J., MacKeen, P. L., Witt, A., Mitchell, E. D. W., Stumpf, G. J., Eilts, M. D., and Thomas, K. W.: The storm cell identification and tracking algorithm: An enhanced WSR-88D algorithm, Weather Forecast., 13, 263–276, 1998.
Judt, F.: Insights into Atmospheric Predictability through Global Convection-Permitting Model Simulations, J. Atmos. Sci., 75, 1477–1497, https://doi.org/10.1175/JAS-D-17-0343.1, 2018.
Kain, J. S.: The Kain–Fritsch Convective Parameterization: An Update, J. Appl. Meteorol., 43, 170–181, https://doi.org/10.1175/1520-0450(2004)043<0170:Tkcpau>2.0.Co;2, 2004.
Kain, J. S. and Fritsch, J. M.: Convective parameterization for mesoscale models: The Kain–Fritsch scheme, in: The representation of cumulus convection in numerical models, Springer, 165–170, https://doi.org/10.1007/978-1-935704-13-3_16, 1993.
Kearns, R. D., Wigal, M. S., Fernandez, A., Tucker, M. A., Zuidgeest, G. R., Mills, M. R., Cairns, B. A., and Cairns, C. B.: The 2012 derecho: Emergency medical services and hospital response, Prehosp. Disast. Med., 29, 542–545, 2014.
Knippertz, P., Trentmann, J., and Seifert, A.: High-resolution simulations of convective cold pools over the northwestern Sahara, J. Geophys. Res.-Atmos., 114, D08110, https://doi.org/10.1029/2008JD011271, 2009.
Knist, S., Goergen, K., and Simmer, C.: Evaluation and projected changes of precipitation statistics in convection-permitting WRF climate simulations over Central Europe, Clim. Dynam., 55, 325–341, https://doi.org/10.1007/s00382-018-4147-x, 2020.
Kröner, N., Kotlarski, S., Fischer, E., Lüthi, D., Zubler, E., and Schär, C.: Separating climate change signals into thermodynamic, lapse-rate and circulation effects: theory and application to the European summer climate, Clim. Dynam., 48, 3425–3440, https://doi.org/10.1007/s00382-016-3276-3, 2017.
Kuchera, E. L. and Parker, M. D.: Severe Convective Wind Environments, Weather Forecast., 21, 595–612, https://doi.org/10.1175/WAF931.1, 2006.
Kumar, M., Kosoviæ, B., Nayak, H. P., Porter, W. C., Randerson, J. T., and Banerjee, T.: Evaluating the performance of WRF in simulating winds and surface meteorology during a Southern California wildfire event, Front. Earth Sci., 11, 1305124, https://doi.org/10.3389/feart.2023.1305124, 2024.
Kunz, M.: The skill of convective parameters and indices to predict isolated and severe thunderstorms, Nat. Hazards Earth Syst. Sci., 7, 327–342, https://doi.org/10.5194/nhess-7-327-2007, 2007.
Labriola, J., Snook, N., Jung, Y., and Xue, M.: Explicit ensemble prediction of hail in 19 May 2013 Oklahoma City thunderstorms and analysis of hail growth processes with several multimoment microphysics schemes, Mon. Weather Rev., 147, 1193–1213, 2019a.
Labriola, J., Snook, N., Xue, M., and Thomas, K. W.: Forecasting the 8 May 2017 Severe Hail Storm in Denver, Colorado, at a Convection-Allowing Resolution: Understanding Rimed Ice Treatments in Multimoment Microphysics Schemes and Their Effects on Hail Size Forecasts, Mon. Weather Rev., 147, 3045–3068, https://doi.org/10.1175/mwr-d-18-0319.1, 2019b.
Ladwig, W.: Visualization & Analysis Systems Technologies. Geoscience Community Analysis Toolkit: WRF-Python (Version v1.3.4.1), UCAR/NCAR [software], https://doi.org/10.5065/D6W094P1, 2017.
Langkamp, T. and Böhner, J.: Influence of the compiler on multi-CPU performance of WRFv3, Geosci. Model Dev., 4, 611–623, https://doi.org/10.5194/gmd-4-611-2011, 2011.
Li, R., Liu, L., Yang, G., Zhang, C., and Wang, B.: Bitwise identical compiling setup: prospective for reproducibility and reliability of Earth system modeling, Geosci. Model Dev., 9, 731–748, https://doi.org/10.5194/gmd-9-731-2016, 2016.
Li, Y., Li, Z., Zhang, Z., Chen, L., Kurkute, S., Scaff, L., and Pan, X.: High-resolution regional climate modeling and projection over western Canada using a weather research forecasting model with a pseudo-global warming approach, Hydrol. Earth Syst. Sci., 23, 4635–4659, https://doi.org/10.5194/hess-23-4635-2019, 2019.
Liu, C., Ikeda, K., Rasmussen, R., Barlage, M., Newman, A. J., Prein, A. F., Chen, F., Chen, L., Clark, M., Dai, A., Dudhia, J., Eidhammer, T., Gochis, D., Gutmann, E., Kurkute, S., Li, Y., Thompson, G., and Yates, D.: Continental-scale convection-permitting modeling of the current and future climate of North America, Clim. Dynam., 49, 71–95, https://doi.org/10.1007/s00382-016-3327-9, 2017.
Liu, W., Ullrich, P. A., Li, J., Zarzycki, C., Caldwell, P. M., Leung, L. R., and Qian, Y.: The June 2012 North American Derecho: A Testbed for Evaluating Regional and Global Climate Modeling Systems at Cloud-Resolving Scales, J. Adv. Model. Earth Syst., 15, e2022MS003358, https://doi.org/10.1029/2022MS003358, 2023.
Lucas-Picher, P., Argüeso, D., Brisson, E., Tramblay, Y., Berg, P., Lemonsu, A., Kotlarski, S., and Caillaud, C.: Convection-permitting modeling with regional climate models: Latest developments and next steps, Wiley Interdisciplin. Rev.: Clim. Change, 12, e731, https://doi.org/10.1002/wcc.731, 2021.
Mahoney, K. M., Grell, G. A., Freitas, S. R., Wagner, A., Heinzeller, D., Wagner, S., Rummler, T., and Kunstmann, H.: The representation of cumulus convection in high-resolution simulations of the 2013 Colorado Front Range flood A scale and aerosol aware stochastic convective parameterization for weather and air quality modeling Explicit convection and scale-aware cumulus parameterizations:High-resolution simulations over areas of different topography in Germany, Mon. Weather Rev., 144, 4265–4278, https://doi.org/10.1175/mwr-d-16-0211.1, 2016.
Majewski, D.: Operational regional prediction, Meteorol. Atmos. Phys., 63, 89–104, 1997.
Mansell, E. R., Ziegler, C. L., and Bruning, E. C.: Simulated Electrification of a Small Thunderstorm with Two-Moment Bulk Microphysics, J. Atmos. Sci., 67, 171–194, https://doi.org/10.1175/2009jas2965.1, 2010a.
Mansell, E. R., Ziegler, C. L., and Bruning, E. C.: Simulated electrification of a small thunderstorm with two-moment bulk microphysics, J. Atmos. Sci., 67, 171–194, 2010b.
Mathias, L., Ludwig, P., and Pinto, J. G.: Synoptic-scale conditions and convection-resolving hindcast experiments of a cold-season derecho on 3 January 2014 in western Europe, Nat. Hazards Earth Syst. Sci., 19, 1023–1040, https://doi.org/10.5194/nhess-19-1023-2019, 2019.
McCumber, M., Tao, W. K., Simpson, J., Penc, R., and Soong, S. T.: Comparison of ice-phase microphysical parameterization schemes using numerical simulations of tropical convection, J. Appl. Meteorol., 30, 985–1004, https://doi.org/10.1175/1520-0450-30.7.985, 1991.
Metz, N. D. and Bosart, L. F.: Derecho and MCS development, evolution, and multiscale interactions during 3–5 July 2003, Mon/ Weather Rev/, 138, 3048–3070, 2010.
Milbrandt, J. and Yau, M.: A multimoment bulk microphysics parameterization. Part I: Analysis of the role of the spectral shape parameter, J. Atmos. Sci., 62, 3051–3064, 2005a.
Milbrandt, J. A. and Yau, M. K.: A Multimoment Bulk Microphysics Parameterization. Part I: Analysis of the Role of the Spectral Shape Parameter, J. Atmos. Sci., 62, 3051–3064, https://doi.org/10.1175/JAS3534.1, 2005b.
Mlawer, E. J., Taubman, S. J., Brown, P. D., Iacono, M. J., and Clough, S. A.: Radiative transfer for inhomogeneous atmospheres: RRTM, a validated correlated-k model for the longwave, J. Geophys. Res.-Atmos., 102, 16663–16682, 1997.
Moreno, R., Arias, E., Cazorla, D., Pardo, J. J., Navarro, A., Rojo, T., and Tapiador, F. J.: Analysis of a New MPI Process Distribution for the Weather Research and Forecasting (WRF) Model, Scient. Program., 2020, 8148373, https://doi.org/10.1155/2020/8148373, 2020.
Morrison, H., Thompson, G., and Tatarskii, V.: Impact of Cloud Microphysics on the Development of Trailing Stratiform Precipitation in a Simulated Squall Line: Comparison of One- and Two-Moment Schemes, Mon. Weather Rev., 137, 991–1007, https://doi.org/10.1175/2008MWR2556.1, 2009.
Morrison, H., Tessendorf, S. A., Ikeda, K., and Thompson, G.: Sensitivity of a simulated midlatitude squall line to parameterization of raindrop breakup, Mon. Weather Rev., 140, 2437–2460, https://doi.org/10.1175/mwr-d-11-00283.1, 2012.
Morrison, H., Milbrandt, J. A., Bryan, G. H., Ikeda, K., Tessendorf, S. A., and Thompson, G.: Parameterization of Cloud Microphysics Based on the Prediction of Bulk Ice Particle Properties. Part II: Case Study Comparisons with Observations and Other Schemes, J. Atmos. Sci., 72, 312–339, https://doi.org/10.1175/jas-d-14-0066.1, 2015.
Morrison, H., van Lier-Walqui, M., Fridlind, A. M., Grabowski, W. W., Harrington, J. Y., Hoose, C., Korolev, A., Kumjian, M. R., Milbrandt, J. A., Pawlowska, H., Posselt, D. J., Prat, O. P., Reimel, K. J., Shima, S.-I., van Diedenhoven, B., and Xue, L.: Confronting the Challenge of Modeling Cloud and Precipitation Microphysics, J. Adv. Model. Earth Syst., 12, e2019MS001689, https://doi.org/10.1029/2019MS001689, 2020.
Nadolski, V.: Automated Surface Observing System (ASOS) user's guide, National Oceanic and Atmospheric Administration, Department of Defense, Federal Aviation Administration, United States Navy, https://www.weather.gov/media/asos/aum-toc.pdf (last access: 1 November 2021), 1998.
Nakanishi, M. and Niino, H.: An improved Mellor–Yamada level-3 model: Its numerical stability and application to a regional prediction of advection fog, Bound.-Lay. Meteorol., 119, 397–407, 2006.
National Centers for Environmental Information: Next Generation Weather Radar (NEXRAD), National Centers for Environmental Information [data set], https://www.ncei.noaa.gov/products/radar/next-generation-weather-radar (last access: 1 November 2021), 2021a.
National Centers for Environmental Information: ASOS five minute (temporal resolution) data, National Centers for Environmental Information [data set], https://www.ncei.noaa.gov/pub/data/asos-fivemin/Inventory/ (last access: 1 November 2021), 2021b.
National Centers for Environmental Information: Storm Events Database, National Centers for Environmental Information [data set], https://www.ncdc.noaa.gov/stormevents/ (last access: 1 November 2021), 2021c.
Niu, G.-Y., Yang, Z.-L., Mitchell, K. E., Chen, F., Ek, M. B., Barlage, M., Kumar, A., Manning, K., Niyogi, D., Rosero, E., Tewari, M., and Xia, Y.: The community Noah land surface model with multiparameterization options (Noah-MP): 1. Model description and evaluation with local-scale measurements, J. Geophys. Res.-Atmos., 116, D12109, https://doi.org/10.1029/2010JD015139, 2011.
NOAA: Automated Surface Observing System (ASOS) Release Note, Software Version 2.79, National Oceanic and Atmospheric Administration, Department of Defense, Federal Aviation Administration, United States Navy, https://www.weather.gov/media/asos/ASOS Implementation/release_notes.279_final.pdf (last access: 1 November 2021), 2004.
NOAA: The Historic Derecho of 29 June 2012; Service Assessment, National Oceanic and Atmospheric Administration, Department of Commerce, https://www.weather.gov/media/publications/assessments/derecho12.pdf (last access: 1 November 2021), 2013.
NOAA: Federal Meteorological Handbook, No. 11 WSR-88D Meteorologic Observations Part A, System concepts, responsibilities, and procedures, FCM-H11A-2016, https://www.icams-portal.gov/resources/ofcm/fmh/FMH11/2016FMH11PTA.pdf (last access: 1 November 2021, 2016.
NOAA: WSR-88D Meteorological Observations: Part C WSR-88D products and algorithms, FCM-H11C-2017, Silver Spring, MD, https://www.icams-portal.gov/resources/ofcm/fmh/FMH11/fmh11partC.pdf (last access: 1 November 2021), 2017.
NOAA: NCEP Products Inventory, http://www.nco.ncep.noaa.gov/pmb/products/sst/ (last access: 2 December 2024), 2024.
Panosetti, D., Schlemmer, L., and Schär, C.: Bulk and structural convergence at convection-resolving scales in real-case simulations of summertime moist convection over land, Q. J. Roy.Meteorol. Soc., 145, 1427–1443, 2019.
Parker, M. D. and Knievel, J. C.: Do meteorologists suppress thunderstorms: Radar-derived statistics and the behavior of moist convection, B. Am. Meteorol. Soc., 86, 341–358, 2005.
Powers, J. G., Werner, K. K., Gill, D. O., Lin, Y.-L., and Schumacher, R. S.: Cloud Computing Efforts for the Weather Research and Forecasting Model, B. Am. Meteorol. Soc., 102, E1261–E1274, https://doi.org/10.1175/BAMS-D-20-0219.1, 2021.
Prein, A. F., Langhans, W., Fosser, G., Ferrone, A., Ban, N., Goergen, K., Keller, M., Tölle, M., Gutjahr, O., and Feser, F.: A review on regional convection-permitting climate modeling: Demonstrations, prospects, and challenges, Rev. Geophys., 53, 323–361, 2015.
Pryor, S. C., Nikulin, G., and Jones, C.: Influence of spatial resolution on Regional Climate Model derived wind climates, J. Geophys. Res., 117, D03117, https://doi.org/10.1029/2011JD016822, 2012.
Rasmussen, K. L., Prein, A. F., Rasmussen, R. M., Ikeda, K., and Liu, C.: Changes in the convective population and thermodynamic environments in convection-permitting regional climate simulations over the United States, Clim. Dynam., 55, 383–408, https://doi.org/10.1007/s00382-017-4000-7, 2020.
Roh, W. and Satoh, M.: Evaluation of precipitating hydrometeor parameterizations in a single-moment bulk microphysics scheme for deep convective systems over the tropical central Pacific, J. Atmos. Sci., 71, 2654–2673, 2014.
Schmitt, I. V. and Chester, V.: A quality control algorithm for the ASOS ice free wind sensor, in: 13th Conference on Integrated Observing and Assimilation Systems for Atmosphere, Oceans, and Land Surface, 11–15 January 2009, Phoenix, AZ, USA, https://ams.confex.com/ams/89annual/techprogram/paper_145755.htm (last access: 3 December 2024), 2009.
Schoen, J. M. and Ashley, W. S.: A climatology of fatal convective wind events by storm type, Weather Forecast., 26, 109–121, 2011.
Schumacher, R. S.: Resolution dependence of initiation and upscale growth of deep convection in convection-allowing forecasts of the 31 May–1 June 2013 supercell and MCS, Mon. Weather Rev., 143, 4331–4354, 2015.
Schumacher, R. S. and Johnson, R. H.: Organization and environmental properties of extreme-rain-producing mesoscale convective systems, Mon. Weather Rev., 133, 961–976, 2005.
Schumacher, R. S. and Rasmussen, K. L.: The formation, character and changing nature of mesoscale convective systems, Nat. Rev. Earth Environ., 1, 300–314, 2020.
Seo, B.-C., Dolan, B., Krajewski, W. F., Rutledge, S. A., and Petersen, W.: Comparison of single-and dual-polarization-based rainfall estimates using NEXRAD data for the NASA Iowa Flood Studies project, J. Hydrometeorol., 16, 1658–1675, 2015.
Shield, S. A., Quiring, S. M., Pino, J. V., and Buckstaff, K.: Major impacts of weather events on the electrical power delivery system in the United States, Energy, 218, 119434, https://doi.org/10.1016/j.energy.2020.119434, 2021.
Short, J. R.: A perfect storm: climate change, the power grid, and regulatory regime change after network failure, Environ. Plan. C, 34, 244–261, 2016.
Shourd, K. N. and Kaplan, M. L.: The Multiscale Dynamics of the 29 June 2012 Super Derecho, Climate, 9, 155, https://doi.org/10.3390/cli9110155, 2021.
Shpund, J., Khain, A., Lynn, B., Fan, J., Han, B., Ryzhkov, A., Snyder, J., Dudhia, J., and Gill, D.: Simulating a Mesoscale Convective System Using WRF With a New Spectral Bin Microphysics: 1: Hail vs Graupel, J. Geophys. Res.-Atmos., 124, 14072–14101, https://doi.org/10.1029/2019JD030576, 2019.
Siuta, D., West, G., Modzelewski, H., Schigas, R., and Stull, A. R.: Viability of Cloud Computing for Real-Time Numerical Weather Prediction, Weather Forecast., 31, 1985–1996, https://doi.org/10.1175/WAF-D-16-0075.1, 2016.
Skamarock, W. C., Klemp, J. B., Dudhia, J., Gill, D. O., Barker, D. M., Duda, M. G., Huang, X.-Y., Wang, W., and Powers, J. G.: A Description of the Advanced Research WRF Version 3, NCAR Tech. Note NCAR/TN-475+STR, NCAR [code], https://doi.org/10.5065/D68S4MVH (code available at: https://www2.mmm.ucar.edu/wrf/users/download/get_sources.html, last access: 8 December 2024), 2008.
Skamarock, W. C., Klemp, J. B., Dudhia, J., Gill, D. O., Liu, Z., Berner, J., Wang, W., Powers, J. G., Duda, M. G., Barker, D. M., and Huang, X.-Y.: A Description of the Advanced Research WRF Version 4, NCAR Tech. Note NCAR/TN-556+STR, NCAR [code], https://doi.org/10.5065/1dfh-6p97 (code available at: https://www2.mmm.ucar.edu/wrf/users/download/get_sources_new.php, last access: 8 December 2024), 2019.
Squitieri, B. J. and Gallus Jr., W. A.: On the forecast sensitivity of MCS cold pools and related features to horizontal grid spacing in convection-allowing WRF simulations, Weather Forecast., 35, 325–346, 2020.
Tao, W.-K., Simpson, J., and McCumber, M.: An ice-water saturation adjustment, Mon. Weather Rev., 117, 231–235, 1989.
Taszarek, M., Allen, J. T., Groenemeijer, P., Edwards, R., Brooks, H. E., Chmielewski, V., and Enno, S.-E.: Severe convective storms across Europe and the United States. Part I: Climatology of lightning, large hail, severe wind, and tornadoes, J. Climate, 33, 10239–10261, 2020.
Thompson, G., Field, P. R., Rasmussen, R. M., and Hall, W. D.: Explicit Forecasts of Winter Precipitation Using an Improved Bulk Microphysics Scheme. Part II: Implementation of a New Snow Parameterization, Mon. Weather Rev., 136, 5095–5115, https://doi.org/10.1175/2008mwr2387.1, 2008.
Tian, J., Liu, J., Yan, D., Li, C., and Yu, F.: Numerical rainfall simulation with different spatial and temporal evenness by using a WRF multiphysics ensemble, Nat. Hazards Earth Syst. Sci., 17, 563–579, https://doi.org/10.5194/nhess-17-563-2017, 2017.
Toll, V., Männik, A., Luhamaa, A., and Rõõm, R.: Hindcast experiments of the derecho in Estonia on 08 August, 2010: Modelling derecho with NWP model HARMONIE, Atmos. Res., 158, 179–191, 2015.
Trapp, R. J.: Potential Effects of Anthropogenic Climate Change on Non-Synoptic Wind Storm Hazards, in: The Oxford Handbook of Non-Synoptic Wind Storms, Oxford University Press, 145–167, https://doi.org/10.1093/oxfordhb/9780190670252.013.4, 2021.
Wade, C. G.: A Multisensor Approach to Detecting Drizzle on ASOS, J. Atmos. Ocean. Tech., 20, 820–832, https://doi.org/10.1175/1520-0426(2003)020<0820:AMATDD>2.0.CO;2, 2003.
Wagner, A., Heinzeller, D., Wagner, S., Rummler, T., and Kunstmann, H.: Explicit convection and scale-aware cumulus parameterizations: High-resolution simulations over areas of different topography in Germany, Mon. Weather Rev., 146, 1925–1944, https://doi.org/10.1175/mwr-d-17-0238.1, 2018.
Wallace, R., Friedrich, K., Kalina, E. A., and Schlatter, P.: Using operational radar to identify deep hail accumulations from thunderstorms, Weather Forecast., 34, 133–150, 2019.
Wang, W. and Seaman, N. L.: A Comparison Study of Convective Parameterization Schemes in a Mesoscale Model, Mon. Weather Rev., 125, 252–278, https://doi.org/10.1175/1520-0493(1997)125<0252:ACSOCP>2.0.CO;2, 1997.
Warner, T.: Numerical Weather and Climate Prediction, Cambridge University Press, Cambridge, https://doi.org/10.1017/CBO9780511763243, 2010.
Weisman, M. L. and Rotunno, R.: “A theory for strong long-lived squall lines” revisited, J. Atmos. Sci., 61, 361–382, 2004.
Weisman, M. L., Evans, C., and Bosart, L.: The 8 May 2009 superderecho: Analysis of a real-time explicit convective forecast, Weather Forecast., 28, 863–892, 2013.
Wilks, D. S.: Statistical methods in the atmospheric sciences, International geophysics series, Academic Press, Oxford, UK, ISBN 9780123850225,2011.
Witt, A., Eilts, M. D., Stumpf, G. J., Johnson, J., Mitchell, E. D. W., and Thomas, K. W.: An enhanced hail detection algorithm for the WSR-88D, Weather Forecast., 13, 286–303, 1998.
Xue, L., Fan, J., Lebo, Z. J., Wu, W., Morrison, H., Grabowski, W. W., , and Rasmussen, R. M.: Idealized simulations of a squall line from the MC3E field campaign applying three bin microphysics schemes: Dynamic and thermodynamic structure, Mon. Weather Rev., 145, 4789–4812, https://doi.org/10.1175/MWR-D-16-0385.1, 2017.
Yair, Y.: Lightning hazards to human societies in a changing climate, Environ. Rese. Lett., 13, 123002, https://doi.org/10.1088/1748-9326/aaea86, 2018.
Zhang, F., Bei, N., Rotunno, R., Snyder, C., and Epifanio, C. C.: Mesoscale predictability of moist baroclinic waves: Convection-permitting experiments and multistage error growth dynamics, J. Atmos. Sci., 64, 3579–3594, https://doi.org/10.1175/JAS4028.1, 2007.


