the Creative Commons Attribution 4.0 License.
the Creative Commons Attribution 4.0 License.
The vulnerability of buildings to a large-scale debris flow and outburst flood hazard cascade that occurred on 30 August 2020 in Ganluo, southwest China
Shuang Liu
Lan Ning
Xiaopeng Zhang
Qiyuan Zhang
Md. Abdur Rahim
In mountainous areas, damage caused by debris flows is often aggravated by subsequent dam-burst floods within the main river confluence zone. On 30 August 2020, a catastrophic disaster chain occurred at the confluence of the Heixiluo Gully and Niri River in Ganluo County, southwest China, consisting of a debris flow, the formation of a barrier lake, and subsequent dam break that flooded the community. This study presents a comprehensive analysis of the characteristics of the two hazards and the resulting damage to buildings from the cascading hazards. The peak discharge of the debris flow in the gully mouth reached 1871 m3 s−1. Following the dam break, the flood with a peak discharge of 2737 m3 s−1 significantly altered the main river channel, causing a 4-fold increase in flood inundation compared to an ordinary flood. Three hazard zones were established based on the building damage patterns: (I) primary debris flow burial, (II) secondary dam-burst flood inundation, and (III) sequential debris flow burial and dam-burst inundation. Vulnerability curves were developed for Zone (II) and Zone (III) using impact pressures and inundation depths, and a vulnerability assessment chart is presented that contains the three damage categories. This research addresses a gap in the vulnerability assessments of debris flow hazard cascades and can support future disaster mitigation within confluence areas.
- Article
(17244 KB) - Full-text XML
- BibTeX
- EndNote
In mountainous areas, debris flows frequently block rivers and form temporary dammed lakes. The subsequent breach of these dammed lakes can result in a high-magnitude outburst flood (Yan et al., 2021). The hazard cascade consisting of debris flows and subsequent dam-burst floods usually devastates residential buildings in confluence zones. For instance, a large-scale debris flow occurred in the Wenjia Gully in Sichuan Province, southwest China, on 13 August 2010 and completely blocked the Mianyuan River, which formed a dammed lake 1650 m long, 420 m wide, and 12 m deep. Then, the dammed lake breached and caused seven fatalities and extensive damage to 479 houses (Yu et al., 2013).
Multi-hazard analyses that incorporate potential hazard interactions have gained significant attention in recent years (Liu et al., 2015; Gallina et al., 2016; Tilloy et al., 2019; Luo et al., 2023). However, vulnerability assessments in risk analysis rarely consider the effects of hazard interactions (Luo et al., 2023). Argyroudis et al. (2019) introduced a new methodology for evaluating the vulnerability of transport infrastructure to multiple hazards. This approach is comprised of six steps and includes numerical and fragility models. Progress has been made in assessing the risk of buildings exposed to multiple hazards by considering the interaction between an earthquake and other hazards, such as dam breaks, flash floods, and tsunamis. Korswagen et al. (2019) proposed a methodology for assessing structural damage resulting from coupled hazards and used it to assess the vulnerability of a masonry building subjected to an earthquake and an earthquake-triggered dam break. Furthermore, Park et al. (2012) developed collapse fragility curves for earthquake and tsunami effects using a numerical model. Gautam and Dong (2018) outlined the vulnerability of vernacular stone masonry buildings to the flash floods that occurred after the Gorkha earthquake. Residential buildings in Nepal were found to have up to 300 % damage resulting from the combined earthquake and subsequent flash flood. Petrone et al. (2020) simulated the response of reinforced concrete frames to earthquake and tsunami inundation, yielding fragility curves that showed a median decrease of less than 15 % in terms of tsunami resistance when exposed to cascading hazards as compared to tsunami-only fragility functions.
The evaluation and mitigation of the multiple risks posed by debris flows and dam-burst floods in a confluence zone require a multi-risk analysis that considers hazard interactions and their cumulative effects on building vulnerability. Most studies on debris flow and dam-burst floods mainly focus on numerical simulations and the evolving processes of hazard cascades (Cutter, 2018; Ning et al., 2022; Chen et al., 2022), but studies on the vulnerability of buildings to hazard cascades are scarce. The vulnerability of buildings to the cumulative impact of debris flow and flash flood may differ from the sum or sequence of vulnerability resulting from a single debris flow or flash flood (Kappes et al., 2012). The effect that simultaneous hazards have on building vulnerability remains inadequately addressed, with only a few studies available (Kappes et al., 2012). Luo et al. (2020) proposed a framework for developing physics-based vulnerability models for buildings exposed to multiple surges of debris flows. Cumulative damage effects resulting from sequentially occurring debris flows were quantified by assessing the physical damage from primary debris flows. However, this approach may not apply directly to the debris-flow–dam-burst-flood hazard cascade.
Field investigations have shown that the pattern of damage to buildings in the confluence area of debris flow and flood is not consistent with those from the debris fan or on the floodplain. Our field investigations have revealed that the pattern of damage to buildings in the confluence area of debris flow and flood is distinct from those observed in areas affected by debris flow alone or by flood alone. Debris flow usually causes devastating damage to settlements on the fan, and the subsequent dam-burst flood significantly increases the damage (Xu et al., 2014; Yu et al., 2013). The risk amplification and cumulative effect on building vulnerability resulting from successive debris flows and dam-burst floods are not entirely clear. Therefore, in-depth analysis is essential for assessing the risks posed by the debris flow hazard cascade to develop a successful emergency management plan.
On 30 August 2020, a catastrophic debris flow and dam-burst flood occurred in the Niri River, Ganluo County, Sichuan Province, southwest China. The debris-flow–flash-flood event killed three people and caused serious damage to local infrastructure, including the destruction of 110 buildings, the Chengdu–Kunming railway bridge near the gully mouth, 1.2 km national road, and five highway bridges along the main river. This study aims to comprehensively analyze the damage to buildings caused by the Heixiluo debris-flow–dam-burst-flood disaster chain. Firstly, we calculated the dynamic characteristics of the debris flow and outbreak flood damage. We then systematically investigated and summarized the building damage characteristics and compared the vulnerability of buildings considering different damage patterns. Finally, we discuss how the damage was amplified by the chain and offer suggestions for hazard mitigation.
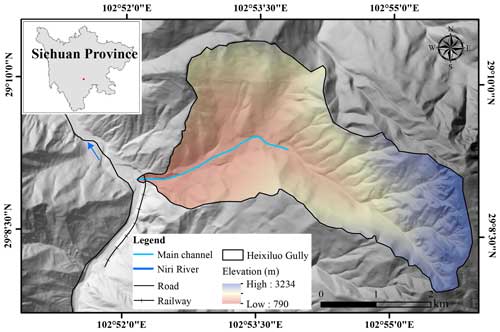
The study area is located in Ganluo County, Sichuan Province, southwest China, which includes the Heixiluo Gully and the confluence area along the Niri River. Ganluo County lies north of the Liangshan Yi Autonomous Prefecture, occupying the alpine canyon zone in the transitional region between the western margin of the Sichuan Basin and the Qinghai–Tibet Plateau (Fig. 1). The geographic boundaries of the study area span from 28°38′ to 29°18′ N latitude and from 102°27′ to 103°01′ E longitude. Ganluo County covers a total area of 2150.97 km2 and had a permanent population of 205 991 at the end of 2020.
Ganluo County consists of an erosional tectonic landform that is defined by two primary structures, namely the Sichuan–Yunnan north–south structure and the Qinghai–Tibet–Yunnan zeta-type structure. The mountain and river systems flow from south to north due to the folds, uplift, and fractures of the Hengduan Mountains and the strong disruptive effect that widely distributed rivers, undulating hills, ravines, and cliffs have on the study area. The valleys, which are characterized by a V-shaped cross-section, have considerable depths that typically exceed 1000 m.
The study area has many typical geological structures, such as the N–S-trending Teke fault, Suxiong anticline, and Maanshan anticline. These faults were active during the Early and Middle Pleistocene, and there is no discernible evidence that they were active during the late Quaternary period. The exposed strata in the study area are primarily composed of Quaternary strata, Suxiong Group, Lower Sinian, Ebian Group, and Pre-Sinian. The upstream area is mainly occupied by sandstone, whereas rhyolite and tuff dominate the main part of the catchment, with slate occupying the left downstream area. The study area is situated in a seismically active region. The peak ground acceleration in the study area is 0.15 g, and the peak period of the seismic response spectrum is 0.45 s. Between 1327 and 1975, 147 earthquakes of Ms≥ 2.5 happened, including 15 earthquakes of Ms≥ 5.0, with the highest magnitude of 7.5.
The Niri River is a first-order tributary in the middle reach of the Dadu River and flows from south to north and over an elevation range of 1800–2200 for most of the areas. The highest elevation in the river basin is 4700 , and the lowest elevation is 1170 The study area has a subtropical monsoon climate. The average annual temperature is 16.2°, and the average annual rainfall is 949 mm. The precipitation is distributed unevenly in a year. The rainfall is concentrated from April to October, with an average rainfall of 901.9 mm, accounting for 93.14 % of the average annual rainfall. The precipitation varies significantly with elevation; the maximum hourly rainfall and 10 min rainfall recorded are 40.3 and 14.8 mm, respectively.
The Heixiluo Gully is located on the right bank of the Niri River in Suxiong town, Ganluo County (Fig. 1). The coordinates of the gully mouth are 29°09′47′′ N and 102°52′53′′ E, and the gully extends from the east to the west. The gully covers an area of 13.36 km2 and is situated at a moderate elevation on the mountainous landform. The catchment elevation ranges from 3220 to 760 , with a relative height of 2460 m. The main channel of the gully stretches for 6.93 km, with an average gradient of 0.355.
The field investigation indicates that debris flow initiated in the area above an elevation of 1990 The gradient of the channel in this area is steep, with an average value of 0.6. The transportation zone is mainly located between 820 and 1990 in elevation and occupies an area of 5.96 km2. The length of the main gully is 4.65 km, and the average gradient of the main gully is 0.252. Two platforms were distributed at altitudes of 1160 and 1030 and divided the main channel of the transportation zone into three parts. A narrow channel developed between the platform and the deposition fan at 1023 The length and gradient of the channel are approximately 670 m and 0.243, respectively.
We conducted field investigations on the debris flow–flash floods that occurred on 31 August and 3 December 2020. The field survey mainly focused on the main transportation and deposition zones. Interviews, measurements, and aerial photography were conducted to investigate the formation and disaster mechanisms. The geomorphic settings of the Heixiluo Gully and adjacent Niri River were carefully measured and analyzed, including the channel width, deposition and erosion height, channel slope, and particle size distributions. The damage to buildings was also investigated by comparing the drone photos taken before and after the disaster.
3.1 Data collection
The digital elevation models (DEMs) collected before and after the event were used for hazard cascade analysis. The pre-event DEM was converted from a 1:10 000 topographic contour map provided by the Sichuan Bureau of Surveying, Mapping, and Geoinformation which had a spatial resolution of 10 m. The post-event DEM of the study area was produced by synthesizing high-resolution aerial images captured by a Dajiang unoccupied aerial vehicle (UAV) on 3 December 2020. To calibrate the post-event terrain, 10 image control points that were not affected by the disaster were selected, and their elevation values were sampled from the pre-DEM and assigned as input conditions. The mean RMSE of georeferencing of the post-event DEM was within the usable range with a value of 0.1 m.
3.2 Methodology
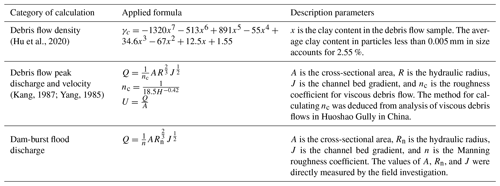
The dynamic parameters of the debris flow and discharge of the dam-burst flood were calculated by the formulas presented in Table 1.
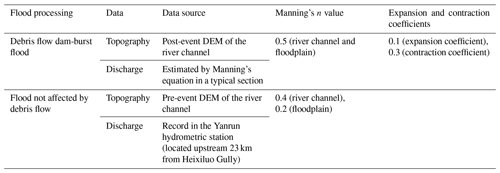
The debris flow depth and velocity were obtained by numerical simulations performed using FLO-2D software (O'Brien, 1986). FLO-2D is a simple volume conservation model that can simulate non-Newtonian flows and has been employed successfully to simulate debris flows by many researchers. The input parameters in FLO-2D include Manning's n coefficient, the laminar flow resistance parameter k, and empirical coefficients α and β. The estimated peak discharge at the gully mouth using Kang's equation (1987) was applied in the simulation. The data used in the debris flow simulation are presented in Table 2.
Dam-burst flood hydraulics were simulated by HEC-RAS 5.0.7 (Hydrologic Engineering Center, 2016) using the post-event DEM. The computation procedure employed a one-dimensional steady-flow simulation and assumed a subcritical flow regime. The boundary conditions are established at all the ends of the river nodes by entering the normal depth value. The initial conditions were set using the corresponding discharge of the dam-burst flood estimated at a typical river section using Manning's equation. Manning's n, expansion, and contraction coefficients account for flow energy losses in HEC-RAS. Due to the difficulty of acquiring terrain data for the initial stage of the dam break, it was assumed that the peak discharge of the dam-burst flood formed the post-event terrain, which was adopted to simulate the dam-burst flood.
To analyze the impact of debris flows on river dynamics, we also simulated an ordinary flood unaffected by debris flows using the pre-event DEM. The flood discharge was obtained from upstream hydrological observation stations located approximately 15 km from Heixiluo Gully.
Manning n values for the river channel and floodplain were 0.4 and 0.2, respectively. These values are the suggested values for main channels that are clean and winding, have some pools and shoals, have some weeds and stones, and have floodplains for cultivated areas but are free of crops (Hydrologic Engineering Center, 2016). The data applied to the flood calculations are presented in Table 3.
A vulnerability curve was developed to describe the relationship between the hazard intensity and the degree of damage to the buildings. Following the classification of the damage degrees proposed by Hu et al. (2012), the degree of damage to buildings caused by multi-hazards was determined through a comprehensive analysis of photographs taken on site and aerial images collected over the disaster scene. Hazard intensity parameters were applied, such as flow depth and average total impact pressure, with average total impact pressure calculated as (Zanchetta et al., 2004), where P is the average total impact pressure, ρ is the flow density, v is the velocity, and h is the flow depth. The deposition depth of the debris flow was obtained by field investigation, while the velocity was calculated using the method outlined in Table 1. The maximum flow depth and velocity of the flood were extracted from the HEC-RAS model. A nonlinear regression analysis was conducted using a logarithmic form expression to relate the vulnerability to the intensity parameters of the hazard.
4.1 Hazard cascade
The debris flow event was triggered by short-term heavy rainfall with a 100-year return period. According to the precipitation data from two automated stations located 10 km away, the 24 h cumulative rainfall from 08:00 (Beijing time) on 30 August was approximately 82.8 mm. The rainfall data extracted from the Global Precipitation Measurement (GPM) rainfall product in the Heixiluo Gully showed that the rainfall started on 29 August at 22:00 (Beijing time) and lasted until 06:00 (Beijing time) on 31 August, with a cumulative amount of 147.2 mm. The hourly rainfall increased to 5.18 mm at 19:30 (Beijing time) on 30 August, which triggered the debris flow due to the approximately accumulated 61.4 mm of rainfall. The debris flow lasted approximately 40 min, and the rainfall intensity reached 6.63 mm h−1 (Fig. 2). Heavy rainfall caused flooding in the Yanrun hydrometric station (located 15 km upstream from the study area), resulting in a peak discharge of 893 m3 s−1 (He et al., 2020), which was nearly 9 times the average discharge of the Niri River.
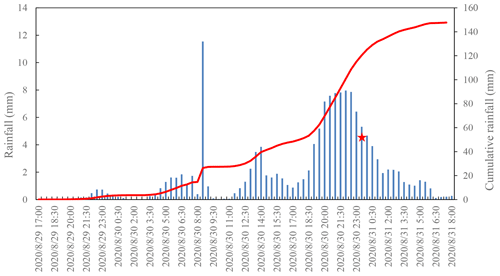
Figure 2Hourly and cumulative rainfall on 29, 30, and 31 August 2020 extracted from the Global Precipitation Measurement (GPM) rainfall product.
The debris flows firstly transported approximately 1 050 000 m3 of sediment to the Niri River, forming a temporary debris dam. The debris flow swept away the railway bridge that crossed the gully mouth and impacted the national road across the river. It also destroyed the buildings close to the gully mouth and those on the opposite bank of the main river. Approximately 40 min later, the debris flow dam was breached, triggering a high-magnitude flash flood that damaged the national road and buildings near the altered flooding path (Fig. 3).
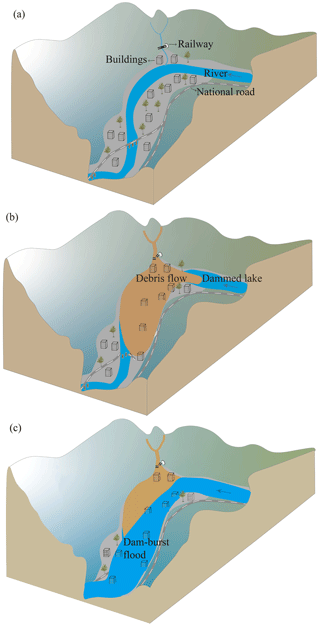
Figure 3Illustration of the hazard cascade process: (a) the normal flow of river flow before the occurrence of debris flow; (b) debris flow blocks the river, creating a dammed lake that destroys the railway, roads, and buildings; (c) the dammed lake bursts, causing a flood that damaged and the road and buildings.
4.2 Dynamic characteristics of the debris flow
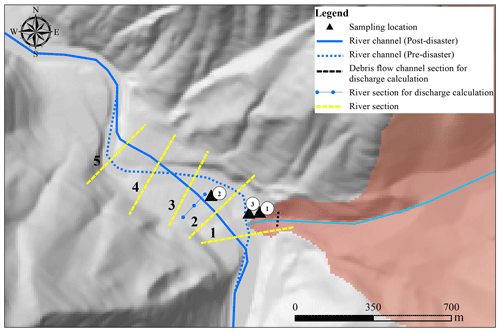
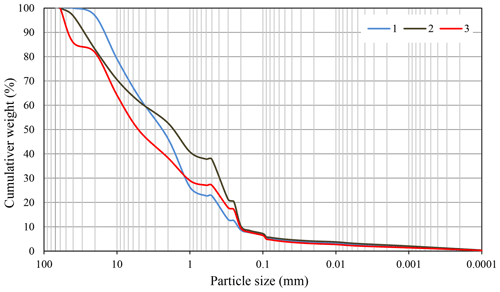
Samples of debris particles smaller than 10 cm were taken from three locations (see Fig. 4). The particle size distribution of the debris flow samples is presented in Fig. 5. The calculated bulk density of the debris flow is 1.825 g cm−3, which indicates a viscous debris flow (Kang et al., 2004).
The debris flow destroyed the Chengdu–Kunming railway bridge situated at the gully mouth and had a flow depth of approximately 4.7 m and a section area of approximately 188 m2. The estimated peak discharge at the gully mouth using Kang's equation (1987) was 1871 m3 s−1, which resulted in a high impact pressure of 223 kPa.
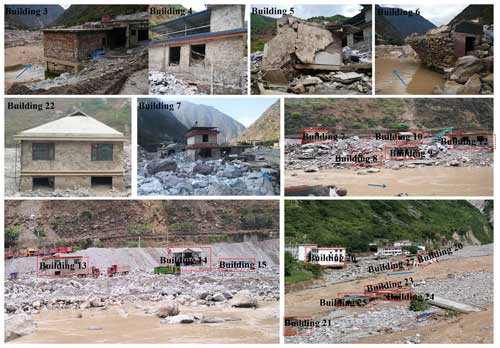
The temporal distributions of the maximum depth and velocity of the debris flow are presented in Fig. 6. The majority of buildings close to the river channel and debris flow channel were buried by the debris flow. The debris flow lasted approximately 40 min and transported a great volume of sediment downstream. The deposition zone extended from the gully mouth to the floodplain of the Niri River, covering a length of 320 m. The deposition area obtained from the simulation is 0.15 km2, which is close to the area measured from the UAV image, approximately 0.16 km2. The thickness of the sediment deposits ranged from 5 to 15 m, with an average value of 7 m. Figure 7 shows that the debris flow buried one floor of building 3 and nearly two floors of building 4 (locations indicated in Fig. 6). The simulated maximum depths at buildings 3 and 4 are 3.2 and 5.5 m, respectively, close to the actual deposition heights. The debris flow flushed into the main river and blocked the Niri River. The river channel was filled with sediment, which led to the formation of a dammed lake that raised the water level by 7–8 m. After 40 min, the unstable dammed lake breached, which resulted in a massive flash flood.
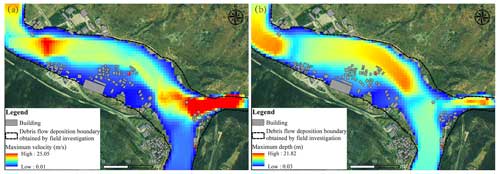
Figure 6Distribution of maximum depth and velocity of the debris flow. (Satellite image obtained from https://www.jl1mall.com, last access: 27 November 2024.)
4.3 Dynamic characteristics of the outbreak flood
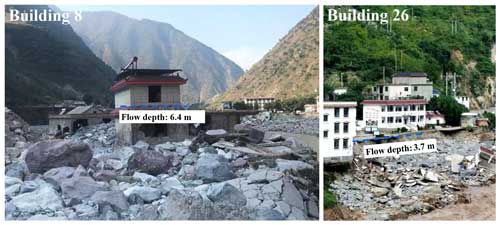
The outburst of the debris flow lake caused a sharp increase in flood peak discharge. To analyze the dynamic characteristics of the flood caused by the dam burst, we first used Manning's hydraulic formula for open-channel flow (presented in Table 1) to calculate the peak discharge. Then, we selected empirical formulas for dam-burst floods to verify the discharge. A typical section adjacent to buildings damaged by the flood was chosen for the calculation (Fig. 4). Based on flood traces on the outer walls of buildings and the damaged height of buildings, the flood depth was estimated to be 6 m. The cross-sectional area and hydraulic radius were calculated according to the section geometry and channel profile. The channel bed gradient was determined based on the longitudinal channel profile. The resulting peak discharge was 2737 m3 s−1. Field investigation revealed that the height of the debris flow dam was approximately 12 m. The volume of the barrier lake was calculated based on the terrain data collected before the disaster. The peak discharge was estimated using the empirical formula proposed by Costa (1985) (, where Vs is the barrier lake volume), resulting in a flow discharge of 2273 m3 s−1 with a relative error of 18 %, which is comparable to the result obtained by Manning's equation. The temporal distributions of flood depth, velocity, and shear stress in the two scenarios are presented in Fig. 8. The simulated inundation area of the outburst floor is 0.18 km2, which is consistent with the field investigation result with an error of 1.1 %. The flood completely submerged all buildings on the left bank near the middle of the river channel, and the buildings on the river terrace on the right bank were strongly eroded. The maximum water depth and velocity of the dam-burst flood were 13.96 m and 8.24 m s−1, respectively, which were 1.24 and 1.31 times higher than those of the ordinary flood, respectively. The maximum depth of the dam-burst flood at locations of buildings 8 and 26 were 6.4 and 3.7 m, respectively (Fig. 9) (building locations indicated in Fig. 8), which are close to the result obtained by field investigation. The maximum shear stress of the flood in the main channel increased sharply from 320 to 853 Pa, indicating a 2.67-fold increase compared to the ordinary flood. For the ordinary flood scenario, the water depth and velocity were high in the channel and decreased in the floodplain. In contrast, the high velocity and shear stress zones that resulted from the dam-burst flood were mainly distributed in the main channel and along the left bank, indicating that the material deposited by the debris flow and the original riverbank are highly susceptible to erosion.
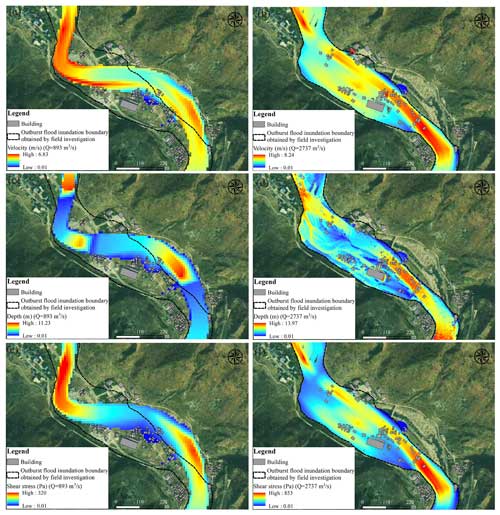
Figure 8Distribution of depth, velocity, and shear stress of ordinary flood and dam-burst flood: (a) maximum velocity distribution of ordinary flood; (b) maximum velocity distribution of dam-burst flood; (c) maximum depth distribution of ordinary flood; (d) maximum depth distribution of dam-burst flood; (e) maximum shear stress distribution of ordinary flood; (f) maximum shear stress distribution of dam-burst flood. (Satellite image obtained from https://www.jl1mall.com, last access: 27 November 2024.)
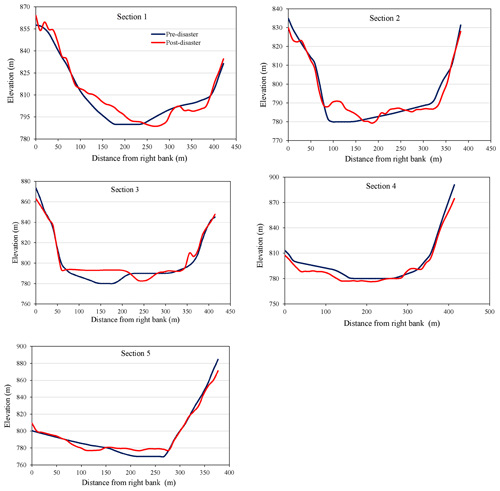
The critical shear stress for bedload transport in the gravel-bed river is determined by the equation = 0.04, where θ is the critical shear stress, τ is the bed shear stress, ρs is the soil mass density, ρ is the water mass density, g is the gravitational acceleration, and D is the sediment diameter (Petit et al., 2015). The dam-burst flood had the potential to transport large boulders up to 1.3 m in diameter, while an ordinary flood could only move gravel up to 0.49 m in diameter. Such high shear stress also demonstrated the strong erosional ability of the dam-burst flood, which seriously scoured the debris sediment deposit and original riverbank, transporting coarse gravel and forming a new straight river channel. The new channel is straighter and steeper than the original channel, raising the bed of the Niri River by 1–17 m and burying buildings up to 1 km downstream of Heixiluo Gully. The channel length shortened from 1010 to 842 m, and the channel gradient increased from 1.71 % to 2.72 %. The change in the river channel led to an inundation area that deflected to the left. Buildings built on the original left riverbank were first impacted by debris flow and subsequently destroyed by the flood. The river terrace on the original right bank was strongly eroded by the flood, leading to the collapse and demolition of buildings. Five river sections (sections 1 to 5) were selected to analyze the terrain changes (see Fig. 4). From sections 1 to 3, the main channel varied from the right bank to the left bank, with a distance between 40 and 100 m; the average width of the new river channel was 50 m; and the vertical distance between the new riverbed and floodplain was 11.23 m. In section 5, the channel migrated from the left bank to the right bank due to the severe erosion of the original river terrace and had a maximum depth of 10 m (Fig. 10). The channel width increased to approximately 100 m, and the channel depth decreased to less than 5 m.
4.4 Damage patterns of buildings
Nearly 70 % of buildings were destroyed by the hazard chain. The evolution of this hazard cascade occurred in two phases. First, the debris flow blocked the main river and formed a barrier dam and dammed lake, which was, second, followed by the outburst of the lake that led to the subsequent flooding and inundation. During the first phase, a significant amount of sediment was transported by the debris flow to the confluence area and deposited in the river channel, which formed a barrier lake with a volume of 857 504 m3. The barrier lake breached completely only approximately 40 min later, leading to a highly energetic flood that caused serious erosion of the riverbank and the formation of the outburst flood, as well as a new straight river channel.
Figure 11 illustrates the boundary of debris flow deposition and dam-burst flood inundation. The debris flow deposition boundary was determined by the simulation. Flooding boundary was obtained by combining the results of the HEC-RAS simulation with field survey data. The confluence area was heavily impacted by the debris flow, resulting in the transportation of a significant amount of solid materials over an area of 0.189 km2. As a result, the majority of the village's buildings were inundated by the debris flow. The dam-burst flood caused serious damage to buildings by flushing a large volume of debris flow sediment and riverbank material downstream.
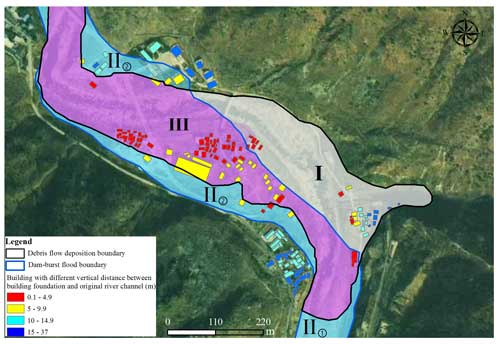
Figure 11Inundation boundary of debris flow and dam-burst flood and spatial division of the hazard zone based on building damage patterns: (I) buried by debris flow; (II) inundated by dam-burst flood; (III) buried by debris flow and then inundated by dam-burst flood. (Satellite image obtained from https://www.jl1mall.com, last access: 27 November 2024.)
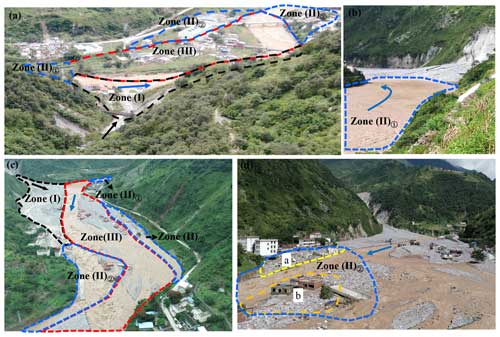
Figure 12Spatial distribution of the three hazard zones before and after the disaster: (a) before the disaster; (b–d) after the disaster.
Three hazard zones are identified based on the boundary of the debris flow and dam-burst flood, as shown in Figs. 11 and 12. The damage patterns of buildings in the different hazard zones can be classified into three categories, namely (I) buildings only buried by debris flow, (II) buildings only inundated by dam-burst flood, and (III) buildings sequentially buried by debris flow and inundated by dam-burst flood. Zone (I) is situated near the Heixiluo Gully mouth, where the debris flow transported a large volume of sediment and seriously eroded the sidewall and bed of the channel, expanding the channel's width from 10 to 40 m. All buildings were inundated by sediment to a depth of over 6 m.
Zone (II) is subdivided into two subzones, Zone (II) ➀ and Zone (II) ➁, based on the spatial location. Zone (II) ➀ is situated in the upstream reach of the Niri River, near the debris flow dam, and is mainly inundated by the static water of the dammed lake (Fig. 12b). Zone (II) ➁ lies on the right bank of the downstream reach of the Niri River, outside the debris flow fan. The original right riverbank in Zone (II) ➁ was a terrace 10 m high that was severely scoured by the highly energetic flood with a shear stress greater than 450 Pa. The entire terrace was cut off, and a new channel was formed across the middle area (Fig. 12c). The erosion area on the river terrace measures approximately 1800 m2, with a length of 300 m and a width of 60 m. Two buildings situated on the upper part of the river terrace collapsed and disintegrated due to the impact of the flood (part (a) in Fig. 12d). A three-story building was partially destroyed due to foundation erosion. The buildings on the lower part of Zone (II) ➁ were simultaneously buried by the sediment transported by floods and inundated by floodwater (part (b) in Fig. 12d).
Zone (III) is primarily located on the left bank of the original river and the lower part of the debris flow fan. The original river channel is filled with debris up to a depth of 10 m. The debris flow transported sediment across the raised riverbed into villages and formed a slope that was high on the right and low on the left in the confluence area. Then, the flood breached the debris flow dam and severely eroded the deposited debris and the original floodplain surface, resulting in a new straight channel. The buildings on the left bank of the river, which were buried by the debris flow, were sequentially impacted by the dam-breach flood. The flood heavily damaged buildings near the new river channel, and floodwater from the channel was observed to always inundate the buildings. Notably, the boundaries of the different damage zones are not static. The extent of the damage zone is not the same for other confluence areas; it is determined by the dynamic characteristics of hazards and is also influenced by the local terrain.
A total of 110 buildings in the village were impacted by the multi-hazards, accounting for 69.2 % of the total buildings. Among them, 70 buildings located in Zone (III) were impacted by the debris flow and flood in succession, which accounted for 44.0 % of the total buildings. In contrast, buildings destroyed by the debris flow in Zone (I) and dam-burst flood in Zone (II) accounted for only 18.2 % and 6.9 % of the total buildings, respectively (Table 4). Overall, the number of buildings within the debris flow deposition boundary and flood inundation boundary is 99 and 81, respectively, accounting for 62.2 % and 50.9 % of the total buildings in the village.
Table 5Statistics of the vertical distance between the damaged building foundation and the original river channel within the whole flooding boundary.

The impact force of fluvial sediment transport is greatly influenced by the relative distance of buildings to channels (Wei et al., 2022). Buildings that are close to the channel are always more vulnerable to damage than those located farther away from the river. During the hazard cascade, a total of 81 buildings in Zone (II) and Zone (III) were impacted by the dam-burst flood (Fig. 12). To assess the influence of building distance from the river channel, we analyzed the vertical distances between the damaged building foundation and the original river channel based on pre-event terrain (Table 5). We found that 51.8 % of all damaged buildings were within 5 m of the channel, while 18.2 % of all damaged buildings were between 5 and 10 m of the original channel. Buildings that were located at distances greater than 10 m only accounted for 6.3 % of the total damaged buildings. In contrast, the average vertical distance of undamaged buildings was 15.3 m, with a minimum value of 11.4 m.
4.5 Vulnerability analysis of the buildings
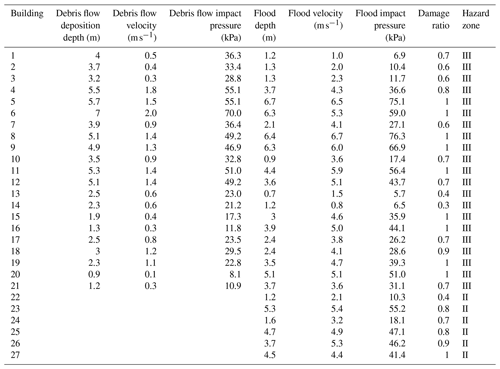
Most of the buildings in the village were completely buried by sediments or collapsed with no visible remains. To construct vulnerability curves, 27 damaged buildings with brick–concrete structures located in the three hazard zones were selected (Figs. 12c and 13). Of these, six buildings were located in Zone (II), and the rest were distributed throughout Zone (III).
The building characteristics and hazard intensity are presented in Table 6. In Zone (III), buildings located near the debris flow dam (such as buildings 1, 2, and 3) were first buried by the debris flow and then inundated by water from the dammed lake for 40 min. These buildings were then impacted by the dam-burst flood. Additionally, buildings near the new river channel suffered greater impact pressure than other buildings. For example, the residual broken structures of buildings 5 and 6 were heavily damaged by the direct impact of the flood in the vertical direction. The walls of the two buildings were severely abraded by impact pressures of 75.1 and 59 kPa, respectively. Additionally, the foundations of the two buildings were partially scoured by floods with high shear stresses of 562 and 553 Pa, respectively.
Buildings located in Zone (II) were only severely impacted by the dam-burst flood. For instance, the foundation of the three-story school building (building 26) was severely eroded by the flood to a scour depth of 1 m, and the floors on the right collapsed. There was no evidence on the walls of the building that the debris flow had abraded the structure. The velocity and shear stress of the flood in this location were 4.4 m s−1 and 463 Pa, respectively. Buildings 23–25, which were close to the new river channel, were thoroughly buried by the sediment transported by the flood and inundated by floodwater.
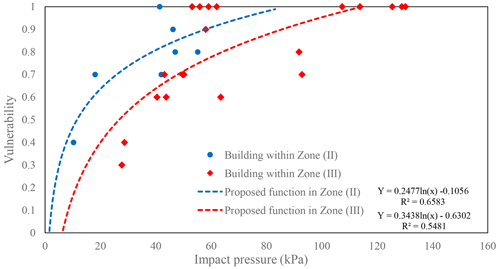
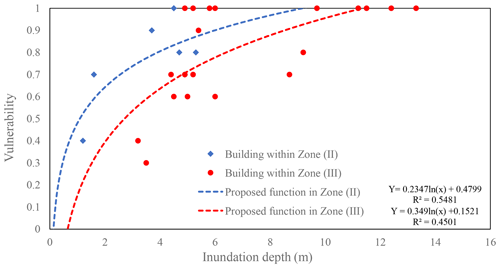
The vulnerability curve in Zone (II) and Zone (III) was developed by summing up the damage caused by the multiple hazards and impact pressure (Fig. 14). Logistic functions were proposed separately for the two hazard zones, and the corresponding determination coefficient (R2) and root mean square error (RMSE) were also obtained. The determination coefficients of the two regression curves in Zone (III) have a higher R2. The RMSEs of the curves in Zone (II) and Zone (III) are 0.66 and 0.55, respectively. The correlation between vulnerability and inundation depth in the two zones is shown in Fig. 15, with an R2 lower than impact pressure: R2 = 0.55 for Zone (II) and R2 = 0.45 for Zone (III). Building vulnerability increases with increasing hazard intensity, and the trend is similar in the two zones. The impact pressure thresholds for Zones (II) and (III), where vulnerability is equal to 1, are 84 and 116 kPa, respectively. For the same impact pressure and inundation depth, the damage to buildings in Zone (II) is greater than that in Zone (III).
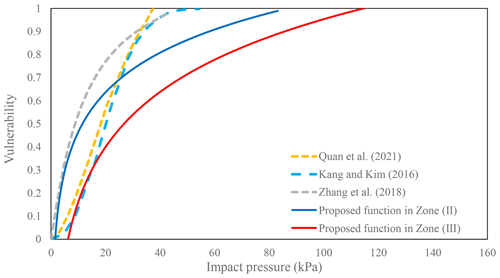
Figure 16Comparison of the building vulnerability functions with the impact pressure functions proposed by Quan et al. (2011), Kang and Kim (2016), and Zhang et al. (2018).
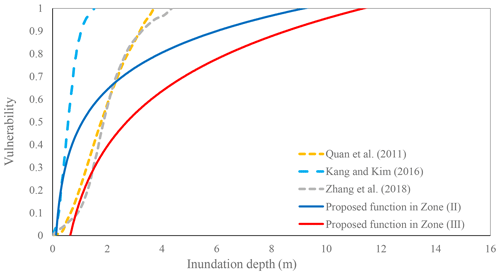
Figure 17Comparison of the building vulnerability functions with the inundation depth proposed by Quan et al. (2011), Kang and Kim (2016), and Zhang et al. (2018).
The vulnerability curves proposed for Zone (II) and Zone (III) were compared to the three functions used in debris flow risk assessment (Figs. 16 and 17). The functions developed by Quan et al. (2011) and Kang and Kim (2016) were calculated based on damage done to brick masonry and nonreinforced concrete structures that had been impacted by the debris flows in South Korea and Italy, respectively. The vulnerability curve proposed by Zhang et al. (2018) was developed for buildings with brick–concrete structures from the Zhouqu debris flow event in China. The slope of the two proposed vulnerability curves based on impact pressure is smaller than those of the three curves. When the impact pressure is less than 20 kPa, the proposed curves show a similar increasing trend compared to the three functions. However, when the impact pressure is greater than 20 kPa, the slope of the two proposed vulnerability curves is much smaller than those of the three curves. For the curves based on inundation depth, when the depth is less than 1.5 m, the slope is steeper than that of Quan et al. (2011) and Zhang et al. (2018) and slower than that of Kang and Kim (2016). When the depth is greater than 2 m, the damage increases more slowly than the curves of Quan et al. (2011) and Zhang et al. (2018). This disparity may be attributed to the different damage patterns and structures of the buildings in this study. The three vulnerability functions were generated for a single debris flow event, whereas the mechanisms by which buildings impacted by floods fail are not the same when those buildings are subjected to a debris flow. The structures of most buildings in the study area are tougher than those in the three events, and nearly half of the buildings had been recently built by a more professional construction team. For example, the newly built four-story building 7 was not completely damaged by hazard cascade under impact pressures greater than 63.5 kPa.
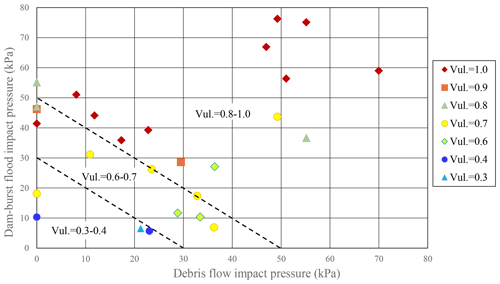
Figure 18Accumulation of building damage due to debris flow and dam-burst flood. The damage distribution is based on the debris flow and flood impact pressure (Vul. refers to vulnerability).
The building damage distribution chart shows building damage plotted as a function of debris flow and flood impact pressure (see Fig. 18). The figure includes aggregated damage to buildings impacted by the sequentially occurring hazards in Zone (III) and damage caused by a single hazard in Zone (II). Damage is divided into three categories based on the threshold impact pressure: slight damage (0.3–0.4), moderate damage (0.6–0.7), and heavy and complete damage (0.8–1.0). Heavy and complete damage mainly occurs at impact pressures greater than 50 kPa, while slight damage occurs below 30 kPa. Moderate damage mainly occurs at impact pressures between 30 and 50 kPa. The threshold impact pressure is compared with that proposed by Hu et al.(2012) and Zanchetta et al. (2004), which were derived from a single debris flow disaster in China and Italy, respectively. Although the detailed definition of the damage scales differs, the threshold of the impact pressure for buildings at the slight, heavy, and complete damage scales is generally larger than that for the brick–concrete structures presented in Hu et al. (2012) and smaller than that for the reinforced concrete frames also presented in Hu et al. (2012) and the masonry structures with basements presented in Zanchetta et al. (2004). A similar trend for the threshold of the impact pressure for buildings with a moderate damage scale can be observed.
The building damage distribution chart remains a valid tool for assessing the vulnerability of buildings affected by debris flows and flash floods, despite not incorporating all damage ratios. However, some limitations and uncertainties exist within the vulnerability functions. For instance, calculating a single average impact pressure value prebuilding for building clusters introduces uncertainty, as water depth and velocity differ significantly at different sides of the building due to the shielding effect (Hu et al., 2012; Arrighi et al., 2020). Furthermore, the building's geometry, direction, orientation, and maintenance condition are not considered in the vulnerability analysis. The amplification of debris flow damage is due to subsequent flooding in time and space. Aggregated damage (i.e., damage caused by both debris flows and floods) is applied in the vulnerability analysis for areas that are successively struck by debris flows and floods. However, the amplified damage effect of the dam-burst flood on debris flow was not accurately quantified because of the absence of a database containing information regarding the damage done by the debris flow before the dam burst. As a result, more detailed data are needed to assess the cumulative impact of hazard cascades on building vulnerability.
5.1 Damage aggravation due to hazard cascade
As a result of the confluence zone's location on a river bend, the dam-burst flood typically flows in a straight direction and creates a new straight channel when the river channel becomes completely blocked. This channel translocation leads to a larger flooded area and causes more severe damage to buildings on the floodplain. The flood inundation zones in the village expanded to 1105 m2, which is up to 4 times the area of an ordinary flood due to flood amplification (Fig. 19). In the expanded inundation zone, 41 buildings, a traffic road spanning 410 m, and farmland with an area of 10 × 104 m2 were submerged. The buildings located in the middle of the inundation zones suffered the most severe damage due to the floodwater's high scouring capability and sediment transport capacity. Many buildings near the flow collapsed, and most structures were carried away by the water current.
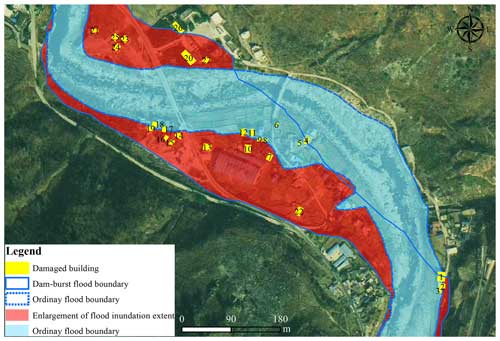
Figure 19The inundation extent of ordinary floods and dam-burst floods. (Satellite image obtained from https://www.jl1mall.com, last access: 27 November 2024.)
Table 7Comparison of dynamic characteristics and degree of damage between ordinary floods and dam-burst floods in different locations.
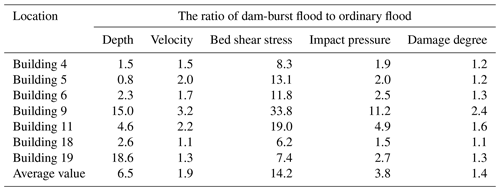
Table 7 presents a comparison of the dynamic characteristics and damage increments between ordinary and dam-burst floods in different locations. The damage increment is calculated based on the proposed function in Zone (II) and is the ratio of the damage caused by the two floods. Buildings 4, 5, 6, 9, 11, 18, and 19 were situated close to the new river channel, and the average bed shear stress and impact pressure increased up to 14.2 times and 3.8 times that of an ordinary flood, respectively, due to flood amplification. The average damage to the seven buildings located near the new channel increased by 140 % due to the lake created by the debris flow barrier.
5.2 The implication of hazard mitigation
In recent years, the hazard cascade of debris flows and outburst floods has become more frequent in high mountain regions due to the impact of climate change and earthquakes (Chen et al., 2022). The damage caused by the primary debris flow can be intensified and enlarged due to the successive dam-burst flood.
Risk assessment for debris-flow–outburst-flood hazard cascades is crucial to mitigate the damage posed to structures in the confluence zone. Risk analysis should incorporate both the debris flow initiation mechanism and the mechanism that generates the dam-burst flood (Chen et al., 2022). A detailed investigation should be conducted for the exposed elements in the confluence zone and both the upstream and downstream reaches of the river. Based on the disaster transformation process and the failure mechanisms of structures, hazard zones should be identified, and corresponding disaster reduction measures should be developed (Cui and Guo, 2021). Moreover, specific structural measures are urgently needed. First, engineering measures should be implemented in the watershed to mitigate debris flows (Cui and Lin, 2013). Second, buildings should not be constructed near debris flow gullies, and new buildings should be built on elevated ground or at certain elevations above the ground (Attems et al., 2019). Third, deflection walls should be considered and constructed in villages susceptible to debris flows to protect entire buildings (Wang et al., 2022), and flood protection walls should be built along the main river to protect the entire flood-prone village.
This study presents a comprehensive analysis of the damage to buildings resulting from a large-scale debris flow and outburst flood hazard cascade. The study develops building vulnerability in different areas of the confluence zone, which is useful for building risk assessment and management along the riverbank. However, some uncertainties and limitations are involved in vulnerability analysis. Firstly, the study did not consider the building's physical characteristics, such as shape, orientation, and maintenance condition. Secondly, in the area affected by the two hazards, the capacity of buildings first damaged by debris flow had declined, leading to a higher failure probability under the impact of sequential flood (Luo et al., 2020). The study analyzed the buildings' structural vulnerability based on debris flows and dam-break flood separately and did not consider the building response to the primary debris flow or quantify the cumulative effect of the debris flow and the dam-break flood (Luo et al., 2023). A physics-based vulnerability model is required to quantify the dynamic evolution of building vulnerability.
Buildings in the confluence zone of a debris-flow-prone catchment and along a main river channel are highly vulnerable to a debris-flow–dam-burst-flood hazard cascade. Assessing building damage is essential for risk mitigation and resilient construction. However, research concerning building damage mainly focuses on a single debris flow or flash flood and fails to consider the different damage characteristics of buildings exposed to both hazards simultaneously. Therefore, studying the characteristics and patterns of building damage in confluence areas can help to develop a reliable vulnerability assessment method. In this study, we investigate the dynamic characteristics of the hazards and damage patterns of the 2020 Heixiluo debris flow and dam-burst flood disaster. We draw the following conclusions.
-
The dam-burst flood, which had a peak discharge of 2737 m3 s−1, seriously eroded the debris flow fan and formed a new straighter and steeper channel. The maximum estimated velocity was 8.24 m s−1, and the bed shear stress reached 853 Pa. The flood's inundation extent in the confluence zone was expanded by a factor of 4, and the impact pressure increased up to 6.8 times due to flood amplification. The average damage to buildings near the new river channel was 1.4 times more intense due to the hazard cascade.
-
The damage patterns of the buildings were classified into three types: (I) buried by primary debris flow, (II) inundated by secondary dam-burst flood, and (III) buried by debris flow and inundated by dam-burst flood sequentially. The spatial division of hazard zones can be applied to the selection of building sites and the planning of structural measures in the confluence area.
-
The vulnerability curves show a similar increasing trend with impact pressure and inundation depth in Zones (II) and (III), and the threshold of the impact pressures in Zones (II) and (III) where vulnerability is equal to 1 is 84 and 116 kPa, respectively. A vulnerability assessment chart was developed, and three categories, namely slight damage (0.3–0.4), moderate damage (0.6–0.7), and heavy and complete damage (0.8–1.0), were identified. Heavy damage occurs at an impact pressure greater than 50 kPa, while slight damage occurs below 30 kPa. Moderate damage occurs at an impact pressure between 30 and 50 kPa.
-
Some uncertainties and limitations are involved in vulnerability analysis. The building's physical characteristics, such as shape, orientation, and maintenance condition, should be considered for the vulnerability analysis. Further investigation and research are recommended to explore the cumulative effect of multiple hazards on building vulnerability. Despite the deficiencies, vulnerability curves and assessment charts are valuable for analyzing the risk posed by debris flow hazard cascades within the confluence zone.
All raw data can be provided by the corresponding authors upon request.
KH contributed to the conception of the study; LW performed the data analyses and wrote the manuscript draft; SL performed the data analyses. LN, XZ, and QZ performed the field investigation; MAR reviewed and edited the manuscript.
The contact author has declared that none of the authors has any competing interests.
Publisher's note: Copernicus Publications remains neutral with regard to jurisdictional claims made in the text, published maps, institutional affiliations, or any other geographical representation in this paper. While Copernicus Publications makes every effort to include appropriate place names, the final responsibility lies with the authors.
This research has been supported by the National Natural Science Foundation of China (52409109), the Second Tibetan Plateau Scientific Expedition and Research Program (2019QZKK0902), and the National Natural Science Foundation of China (41790434).
This paper was edited by Daniele Giordan and reviewed by Andrew Mitchell, Joaquin Vicente Ferrer, and two anonymous referees.
Argyroudis, S. A., Mitoulis, S. A., Winter, M. G., and Kaynia, A. M.: Fragility of transport assets exposed to multiple hazards: State-of-the-art review toward infrastructural resilience, Reliab. Eng. Syst. Safe., 191, 106567, https://doi.org/10.1016/j.ress.2019.106567, 2019.
Arrighi, C., Mazzanti, B., Pistone, F., and Castelli, F.: Empirical flash flood vulnerability functions for residential buildings, SN Applied Sciences, 2, 904, https://doi.org/10.1007/s42452-020-2696-1, 2020.
Attems, M. S., Thaler, T., Genovese, E., and Fuchs, S.: Implementation of property-level flood risk adaptation (PLFRA) measures: Choices and decisions, WIREs Water, 7, e1404, https://doi.org/10.1002/wat2.1404, 2019.
Chen, H., Ruan, H., Chen, J., Li, X., and Yu, Y.: Review of investigations on hazard cascades triggered by river-blocking debris flows and dam-break floods, Front. Earth Sci., 10, 582, https://doi.org/10.3389/feart.2022.830044, 2022.
Costa, J. E.: Floods from Dam Failures, Open-File Rep. No. 85–560, U. S. Geological Survey, Denver, https://doi.org/10.3133/ofr85560, 1985.
Cui P. and Guo J.: Evolution models, risk prevention and control countermeasures of the valley disaster chain, Advanced Engineering Sciences, 53, 5–18, https://doi.org/10.15961/j.jsuese.202100285, 2021.
Cui, P. and Lin, Y. M.: Debris-flow treatment: The integration of botanical and geotechnical methods, Journal of Resources and Ecology, 4, 97–104, https://doi.org/10.5814/j.issn.1674-764x.2013.02.001, 2013.
Cutter, S. L.: Compound, cascading, or complex disasters: what's in a name?, Environment: Science and Policy for Sustainable Development, 60, 16–25, 2018.
Gallina, V., Torresan, S., Critto, A., Sperotto, A., Glade, T., and Marcomini, A.: A review of multi-risk methodologies for natural hazards: Consequences and challenges for a climate change impact assessment, J. Environ. Manage., 168, 123–132, https://doi.org/10.1016/j.jenvman.2015.11.011, 2016.
Gautam, D. and Dong, Y.: Multi-hazard vulnerability of structures and lifelines due to the 2015 Gorkha earthquake and 2017 central Nepal flash flood, Journal of Building Engineering, 17, 196–201, https://doi.org/10.1016/j.jobe.2018.02.016, 2018..
He, Y. B., Xu, Y. N., and Zhang, J.: Analysis of flood control effect of Pubugou Reservoir during “20 ⋅ 8” flood of Minjiang River, Yangtze River, 51, 149–154, https://doi.org/10.16232/j.cnki.1001-4179.2020.12.027, 2020.
Hu, G., Tian, S., Chen, N., Liu, M., and Somos-Valenzuela, M.: An effectiveness evaluation method for debris flow control engineering for cascading hydropower stations along the Jinsha River, China, Eng. Geol., 266, 105472, https://doi.org/10.1016/j.enggeo.2019.105472, 2020.
Hu, K. H., Cui, P., and Zhang, J. Q.: Characteristics of damage to buildings by debris flows on 7 August 2010 in Zhouqu, Western China, Nat. Hazards Earth Syst. Sci., 12, 2209–2217, https://doi.org/10.5194/nhess-12-2209-2012, 2012.
Hydrologic Engineering Center: HEC-RAS, River Analysis System, Hydraulics Reference Manual, Version 5.0, U. S. Army Corps of Engineers, Davis, California, 25, https://www.hec.usace.army.mil/ (last access: 27 November 2024), 2016.
Kang, H. S. and Kim, Y. T.: The physical vulnerability of different types of building structure to debris flow events, Nat. Hazards, 80, 1475–1493, https://doi.org/10.1007/s11069-015-2032-z, 2016.
Kang, Z. C.: A velocity research of debris flow and its calculating method in China, Mountain Research, 5, 247–259, 1987 (in Chinese).
Kang, Z. C., Li, Z. F., and Ma, A. N.: Debris flows in China, Science, Beijing, 2004 (in Chinese).
Kappes, M. S., Keiler, M., von Elverfeldt, K., and Glade, T.: Challenges of analyzing multi-hazard risk: a review, Nat. Hazards, 64, 1925–1958, https://doi.org/10.1007/s11069-012-0294-2, 2012.
Korswagen, P. A., Jonkman, S. N., and Terwel, K. C.: Probabilistic assessment of structural damage from coupled multi-hazards, Struct. Saf., 76, 135–148, https://doi.org/10.1016/j.strusafe.2018.08.001, 2019.
Liu, Z., Nadim, F., Garcia-Aristizabal, A., Mignan, A., Fleming, K., and Luna, B. Q.: A three-level framework for multi-risk assessment, Georisk: Assessment and management of risk for engineered systems and geohazards, 9, 59–74, https://doi.org/10.1080/17499518.2015.1041989, 2015.
Luo, H., Zhang, L., Wang, H., and He, J.: Multi-hazard vulnerability of buildings to debris flows, Eng. Geol., 279, 105859, https://doi.org/10.1016/j.enggeo.2020.105859, 2020.
Luo, H. Y., Zhang, L. M., Zhang, L. L., He, J., and Yin, K. S.: Vulnerability of buildings to landslides, The state of the art and future needs, Earth-Sci. Rev., 238, 104329, https://doi.org/10.1016/j.earscirev.2023.104329, 2023.
Ning, L., Hu, K., Wang, Z., Luo, H., Qin, H., Zhang, X., and Liu, S.: Multi-hazard cascade reaction initiated by the 2020 Meilong debris flow in the Dadu River, Southwest China, Front. Earth Sci., 10, 827438, https://doi.org/10.3389/feart.2022.827438, 2022.
O’Brien, J. S.: Physical process, rheology and modeling of mudflows, PhD thesis, Colorado State University, Fort Collins, Colorado, 172 pp., 1986.
Park, S., van de Lindt, J. W., Cox, D., Gupta, R., and Aguiniga, F.: Successive earthquake-tsunami analysis to develop collapse fragilities, J. Earthq. Eng., 16, 851–863, https://doi.org/10.1080/13632469.2012.685209, 2012.
Petit, F., Houbrechts, G., Peeters, A., Hallot, E., Van Campenhout, J., and Denis, A. C.: Dimensionless critical shear stress in gravel-bed rivers, Geomorphology, 250, 308–320, https://doi.org/10.1016/j.geomorph.2015.09.008, 2015.
Petrone, C., Rossetto, T., Baiguera, M., De la Barra Bustamante, C., and Ioannou, I.: Fragility functions for a reinforced concrete structure subjected to earthquake and tsunami in sequence, Eng. Struct., 205, 110120, https://doi.org/10.1016/j.engstruct.2019.110120, 2020.
Quan Luna, B., Blahut, J., van Westen, C. J., Sterlacchini, S., van Asch, T. W. J., and Akbas, S. O.: The application of numerical debris flow modelling for the generation of physical vulnerability curves, Nat. Hazards Earth Syst. Sci., 11, 2047–2060, https://doi.org/10.5194/nhess-11-2047-2011, 2011.
Tilloy, A., Malamud, B. D., Winter, H., and Joly-Laugel, A.: A review of quantification methodologies for multi-hazard interrelationships, Earth-Sci. Rev., 196, 102881, https://doi.org/10.1016/j.earscirev.2019.102881, 2019.
Wang, J., Hassan, M. A., Saletti, M., Yang, X., Zhou, H., and Zhou, J.: Experimental study on the mitigation effects of deflection walls on debris flow hazards at the confluence of tributary and main river, B. Eng. Geol. Environ., 81, 354, https://doi.org/10.1007/s10064-022-02850-5, 2022.
Wei, L., Hu, K., and Liu, J.: Automatic identification of buildings vulnerable to debris flows in Sichuan Province, China, by GIS analysis and Deep Encoding Network methods, J. Flood Risk Manag., 15, e12830, https://doi.org/10.1111/jfr3.12830, 2022.
Xu, L., Meng, X., and Xu, X.: Natural hazard cascade research in China: A review, Nat. Hazards 70, 1631–1659, https://doi.org/10.1007/s11069-013-0881-x, 2014.
Yan, Y., Cui, Y., Liu, D.,Tang, H., Li, Y., Tian, X., Zhang, L., and Hu, S.: Seismic signal characteristics and interpretation of the 2020 “6.17” Danba landslide dam failure hazard cascade process, Landslides, 18, 2175–2192, https://doi.org/10.1007/s10346-021-01657-x, 2021.
Yang, Z. N.: Preliminary study on the flowing velocity of viscous debris flows due to intense rainfall, Research of debris flows, Proceeding of the Lanzhou Institute of Glaciology and Cryopedology, Chinese Academy of Sciences, No. 4, Science Press, Beijing, ISBN 3842.13-13, 1985 (in Chinese).
Yu, B., Ma, Y., and Wu, Y.: Case study of a giant debris flow in the Wenjia Gully, Sichuan Province, China, Nat. Hazards, 65, 835–849, https://doi.org/10.1007/s11069-012-0395-y, 2013.
Zanchetta, G., Sulpizio, R., Pareschi, M. T., Leoni, F. M., and Santacroce, R.: Characteristics of May 5–6, 1998 volcaniclastic debris flows in the Sarno area (Campania, southern Italy): relationships to structural damage and hazard zonation, J. Volcanol. And Geoth. Res., 133, 377–393, https://doi.org/10.1016/S0377-0273(03)00409-8, 2004.
Zhang, S., Zhang, L., Li, X., and Xu, Q.: Physical vulnerability models for assessing building damage by debris flows, Eng. Geol., 247, 145–158 https://doi.org/10.1016/j.enggeo.2018.10.017, 2018.


