the Creative Commons Attribution 4.0 License.
the Creative Commons Attribution 4.0 License.
Correlation between seismic activity and acoustic emission on the basis of in situ monitoring
Zhiwen Zhu
Zihan Jiang
Federico Accornero
Alberto Carpinteri
Since April 2023 an in situ experimental campaign has been underway in a granite underground tunnel, which is a dedicated monitoring platform located in Southeast China. Acoustic emission (AE) signals and seismic sequences were recorded simultaneously by installing the AE device together with the seismometer in order to investigate, among other parameters, the b value and the natural-time variance, κ1, of AE time series. In addition, AE and related temporal correlation with incoming seismic events are analysed using an appropriate multi-modal statistical analysis. The results show that AE has a strong correlation with seismic swarms in surrounding areas. The changing trend in AE temporal distribution occurs before that of the earthquake and regularly anticipates a major seismic event by approximately 17 h. The AE bursts indicate that an earthquake is approaching. The dense clusters of AE are closely related to two major earthquakes with Richter magnitudes equal to 3.2 and 2.4. Approaching the earthquake occurrence, the b value shows a downward trend, reaching its minimum value prior to the earthquake, whereas the natural-time variance κ1 rapidly decreases from 0.07 to a minimum value close to zero. Moreover, κ1 occurs earlier than the minimum b value and the AE bursts. Therefore, trends in the b value and the natural-time variance derived from the AE time series can be used as effective earthquake precursors. It is also evident that there is widespread micro-seismic activity in the earthquake preparation zone before the earthquake occurrence. The micro-seismic activity represents the origin of microcracks in the nearby ground surface, resulting in the AE bursts. The results of this paper provide new experimental evidence for the application of fracto-emissions as seismic precursors.
- Article
(3767 KB) - Full-text XML
- BibTeX
- EndNote
Earthquake precursors are phenomena that take place in advance before the occurrence of an earthquake. These precursors are diverse, such as ground deformation and stress, changes in Earth tidal strain, geo-acoustic and geomagnetic fields, environmental radioactivity, and so on. In the time period before the earthquake occurrence, a very wide area of cracking rocks is active around the epicentre of the upcoming earthquake (Carpinteri and Borla, 2017). Solids that break in a brittle way are subjected to a rapid emission of mechanical energy, involving the generation of pressure waves that travel at a characteristic speed with an order of magnitude of 103 m s−1. Assuming a constant-pressure wave velocity, the correlation between the wavelength (forming crack) scale and the frequency scale is shown in Fig. 1. The frequency range of pressure waves is very wide, from nanoscale defects emitting at the frequency scale of terahertz (1012 Hz) to kilometre-scale fractures emitting at the scale of hertz (Carpinteri and Borla, 2017), which is a typical frequency of seismic oscillations and can be detected by sensors arranged on solid bodies. In the framework of fracture mechanics, acoustic emission (AE) represents a specific part of the strain energy released during the damage process, and it is emitted in the form of transient ultrasonic waves. Prior to an earthquake, AE bursts may result from widespread micro-seismic activity, which propagates through the ground.
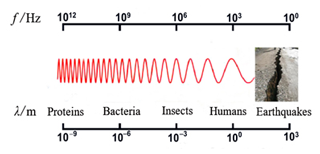
Figure 1Correlation between wavelength scale and frequency scale (modified from Carpinteri and Borla, 2017).
Moreover, according to recent interpretations (Lacidogna et al., 2019), the relationship between crack propagation and emitted energy is represented by the areas subtended by the snap-back instability branches in the load vs. displacement diagram (Fig. 2). In Fig. 2, the grey areas identify the dissipated energy, D, whereas the pink areas represent the emitted energy, E. The total energy released during the loading process, R, is equal to the sum of the dissipated energy, D, plus the emitted energy, E. When an earthquake occurs, AE comes from not only a single macrocrack, but also a wide network of microcracks generated by micro-seismic activity before the earthquake occurrence. In this way, AE can be effectively used as a seismic precursor.
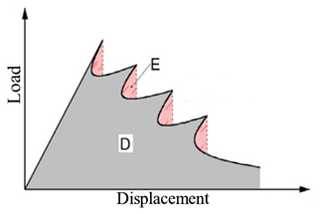
Figure 2Multiple local instabilities (snapback) caused by micro-seismic activity (modified from Carpinteri et al., 2016a).
An important aspect of earthquake prediction is the dimension and temporal evolution of the earthquake preparation zone. Dobrovolsky et al. (1979) assumed that the strain zone is a circle with the centre located at the epicentre of the impending earthquake. The radius R of the circle is called the strain radius and is assumed to be a function of the magnitude of the upcoming earthquake. As an example, for an earthquake with a Richter magnitude M equal to 6, the strain radius is about 1000 km. Carpinteri et al. (2019) proposed an innovative estimation of the earthquake preparation zone, which is proportional to the magnitude of the upcoming earthquake and depends on the average size of the cracks forming in the Earth's crust before the seismic event. Approaching the earthquake occurrence, this zone tends to shrink, and the pre-existing and external cracks close, forming a new and smaller preparation zone where the remaining open cracks coalesce to form larger cracks. Therefore, when the earthquake eventually occurs, the preparation zone will coincide with the earthquake epicentre (Carpinteri and Borla, 2019).
As shown in Fig. 3, in the earlier stages of a seismic event, the preparation zone develops from its maximum size, and, during the first stage, nano- and microcracks dominate. In the following stage, as the tectonic stresses tend to get closer to the earthquake epicentre, the preparation zone will shrink, and the average crack size will increase from the microscale to the millimetre scale. Approaching the earthquake occurrence, a further size reduction in the preparation zone is expected, characterised by larger cracks, from the millimetre scale to the metre scale, which are able to generate ultrasonic acoustic waves up to several hundreds of kilohertz. In the final stage, the macrocracks along the seismic fault will coalesce, and the earthquake will take place accompanied by audible acoustic emission. Figure 3 shows the evolution of the preparation zone proposed by Carpinteri and Borla (2019): each circle represents the evolution of the strain zone. The equivalent crack sizes in the subsequent areas are 10−9–10−6 m (purple), 10−6–10−3 m (blue) and 10−3–1 m (red), and the black dot is the epicentre of the final earthquake.
Nowadays, the AE technique is widely used in the field of structural monitoring for civil engineering (Manuello et al., 2019; Han et al., 2019; Dong et al., 2019). In addition, AE can be used as a diagnostic tool in geophysics (Lukovenkova et al., 2022; Moriya, 2018; Marapulets et al., 2023). There are crustal stresses and strains widely distributed within the preparation zone of seismic events (Gregori et al., 2010), and the AE bursts may be interpreted as a characteristic of the crustal stress redistribution (Lacidogna et al., 2011; Carpinteri et al., 2016b). AE can be regarded as an earthquake precursor. For example, before the Assisi earthquake, a large and almost-sudden burst in AE was observed about 400 km away from the epicentre (Gregori et al., 2005), confirming the fact that AE can be used for earthquake prediction. The correlation between AE activity in masonry structures and regional earthquakes has been studied through the AE technique (Carpinteri et al., 2013). One of the authors (Lacidogna et al., 2015) proposed a new procedure for earthquake risk assessment based on AE technology, developing statistical methods for space–time correlations between AE and seismic events. In order to evaluate the propagation of in situ stresses, Zimatore et al. (2017) used AE time series obtained from two monitoring stations located about 300 km apart in Italy. It was found that AE can identify anomalies in crustal stress trends, which may be related to earthquake occurrence. Carpinteri and Borla (2017, 2019) installed a monitoring station in a gypsum mine located in northern Italy, where experimental observations show that AE is strongly related to earthquakes occurring in the surrounding area.
In addition, the b value and natural-time variance of AE time series can be used as earthquake precursors. The importance of the b value for quantifying seismic activity (Allen et al., 1965) or earthquake prediction (Smith, 1981) has been widely recognised by seismologists. Sammonds et al. (1992) found that the b value shows a V-shaped curve with a significant decrement before a major earthquake, whereas most seismic activities occur near the minimum value of the b-value curve. Han et al. (2015) proposed a robust method for estimating the b value and found that, compared to two traditional methods, this method provides reliable b values and shows good sensitivity to large-magnitude earthquakes. In addition, the natural-time analysis was proposed only a few years ago, and few applications to earthquake prediction are currently presented in the scientific literature. Varotsos et al. (2001) found that, before the occurrence of an earthquake, the seismic activity located in the same tectonic zone enters a critical stage, whereas the natural-time variance κ1 fluctuates around the critical value 0.07, decreasing quickly to zero when the earthquake occurs. Sarlis et al. (2013) conducted a study in Japan (25–46° N, 125–148° E), considering all earthquakes with M ≥ 3.5 during the time interval of 1984–2011. The results show that for earthquakes with M ≥ 7.6, κ1 shows a minimum value before the earthquake occurrence.
Since April 2023, an in situ experimental campaign has been underway in a granite underground tunnel located in Southeast China. AE signals and seismic sequences were recorded simultaneously, and the AE temporal correlation with the incoming seismic events were analysed using multi-modal statistical analysis. In addition, the b value and the natural-time variance of AE time series were further investigated. Through the use of the seismometer installed together with the AE device, seismic signals from nearby areas were monitored to record micro-seismic events. Since the monitoring centre is located in a dedicated tunnel, the impact of environmental ultrasonic noise has been eliminated, such as that coming from traffic, human activities and wind.
An AE and earthquake monitoring system is arranged inside a dedicated tunnel of the seismic monitoring centre of Shantou. This centre is the backbone of comprehensive seismic observation in the eastern region of Guangdong Province, in the southeast of China. It is located at latitude 23.415° N and longitude 116.628° E (Fig. 4). This all-granite tunnel is excavated horizontally into the mountain up to 150 m and is mainly used to install seismic observation instruments for detecting seismic data such as crustal deformation and underground fluids. All the seismic station equipment is connected to the National Seismic Monitoring Network. This dedicated tunnel is far away from the noise sources of traffic, human activities and wind, minimising the interference of external environmental factors. In addition, the soil and tunnel structure provide sound-absorbing and sound-insulating effects, reducing external noise transmission.

Figure 5Setup of monitoring system. (a) Interior view of the tunnel, (b) AE acquisition device and (c) seismometer.
The AE equipment employed is the ÆMISSION system, as shown in Fig. 5. The eight-channel system stores signal parameters, including duration, rise time, energy, amplitude and ringing count, allowing for continuous AE monitoring for the desired time period. This monitoring device uses eight AE sensors (frequency range 10 kHz–1 MHz) fixed on the ground surface together with a seismometer to monitor the seismic activity. In order to ensure excellent accuracy in data collection, eight AE sensors are placed in the same location. This allows for the comparison and verification of the consistency of the monitoring results, thus ensuring the absence of errors or missed detections. As mentioned above, AE sources (microcracks coming from micro-seismic activity) are widespread in a very large area prior to the earthquake. Thus, AE event source localisation is not crucial in the framework of the multi-modal statistical analysis. On the contrary, with the current sensor setup, which has no source localisation capability due to the sensor positions, our recordings reflect the AE activity of all channels as a whole. In the post-processing stage, AE signals with a duration shorter than 3 µs and containing less than three oscillations across the detection threshold were discarded, filtering out electrical noise. The monitoring started at 12:21 Beijing time (UTC +8) on 24 April 2023 and ended at 11:10 Beijing time (UTC +8) on 29 May 2023, resulting in continuous monitoring for 35 d (839 h).
4.1 Regional seismic activity
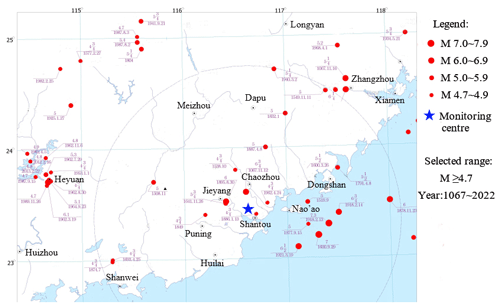
Shantou is a strong earthquake zone in China. The Taiwan Strait, located southeast of Shantou, is an area prone to strong earthquakes, with frequently observed moderate to strong earthquakes. The largest reported earthquake in Shantou history occurred in 1918, with a Richter magnitude of 7.9 and an epicentre in Nan'ao, an island close to the coast in the South China Sea. The historical seismic activity in the surrounding areas of Shantou is shown in Fig. 6. A total of 51 earthquakes with M ≥ 4.7 were recorded in the region, from the years 1067 to 2022, including 2 earthquakes with magnitudes 7.0–7.9, 10 earthquakes with magnitudes 6.0–6.9, 22 earthquakes with magnitudes 5.0–5.9 and 17 earthquakes with magnitudes 4.7–4.9. Since the establishment of the Guangdong Provincial Seismic Network in 1970, only one earthquake of M ≥ 4.0 has been recorded in the near-field region, i.e. within 25 km from Shantou, which is the earthquake of magnitude 4.2 in the Chenghai District that occurred on 16 January 2004. Historically, there have been three other strong far-field earthquakes near the area: the Quanzhou earthquake of magnitude 7.1 in 1604, the Haifeng earthquake of magnitude 6.0 in 1911 and the Taiwan Strait earthquake of magnitude 7.3 in 1994. In Fig. 6, the seismic intensity in this region is shown to be generally high. It is worth noting that the vast majority of destructive earthquakes is distributed in the coastal areas of the eastern continent.
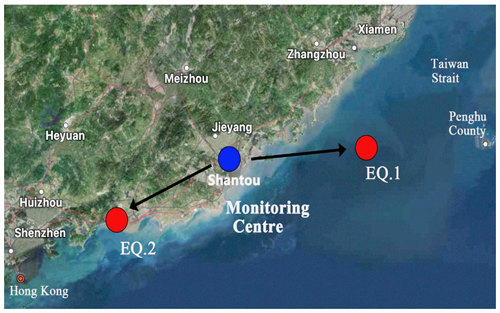
Considering the historical seismic activity in the surrounding area, as well as the scale (Dobrovolsky et al., 1979) and time evolution (Carpinteri and Borla, 2019) of the earthquake preparation zone in the pre-earthquake time period, regional earthquakes with epicentres within 200 km from the monitoring centre were selected. During the monitoring time period, small seismic events frequently took place in the area. Based on the magnitude and epicentre distance, two major regional earthquakes are selected: the Richter magnitude 3.2 earthquake in the Taiwan Strait at 23:50 Beijing time on 30 April 2023 (EQ 1 for short) and the Richter magnitude 2.4 earthquake in the Haifeng coastal area of Guangdong Province at 12:23 Beijing time on 17 May 2023 (EQ 2 for short). The satellite map showing the location of the two major earthquakes is shown in Fig. 7. EQ 1's (red dot) epicentre is 160.1 km from the monitoring centre (blue dot), whereas EQ 2's (red dot) epicentre is 132.4 km from the monitoring centre (blue dot). The earthquake information is shown in Table 1.
4.2 AE time series and seismic activity
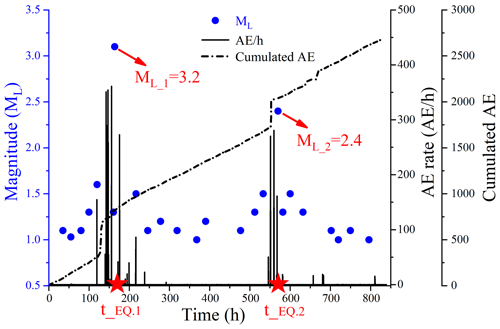
The seismic sequence and the AE time series, including the cumulated AE and the AE rate, are shown in Fig. 8. The AE rate represents the number of AE events per hour. The blue dots in Fig. 8 are the Richter magnitudes (ML) of the seismic events detected during the monitoring period. The time correlation between AE clusters and seismic events can be observed throughout the monitoring time period. The dense clusters of AE signals, especially around 142 and 566 h, show significant peaks in the AE rate, which appear to anticipate the earthquakes with Richter magnitudes equal to 3.2 (EQ 1) and 2.4 (EQ 2). The cumulated AE represents the total number of AE events that occurred during the monitoring period. The times marked by red stars in Fig. 8 are t_EQ 1 (30 April 2023) and t_EQ 2 (17 May 2023), which represent the occurrence times of the two major earthquakes. The seismic events are anticipated by large jumps in the cumulated AE and by significant peaks in the AE rate.
4.3 Multi-modal statistical analysis
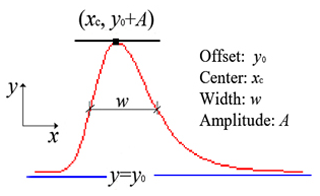
A multi-modal (Gaussian and multi-peak) statistical analysis is carried out with Microcal Origin, identifying the relative maxima of AE and seismic distributions by the best Gaussian fitting. The optimal Gaussian fitting reproduces all the peaks, minimising the gap between the predicted values and the actual data. In particular, starting from the discrete distribution of data and following an iterative procedure, in which the curve offset, y0; centre coordinate, xc; width, w; and amplitude, A are considered, the multi-modal curve that best approximates the discrete distribution of points is identified by the following equations (Fig. 9):
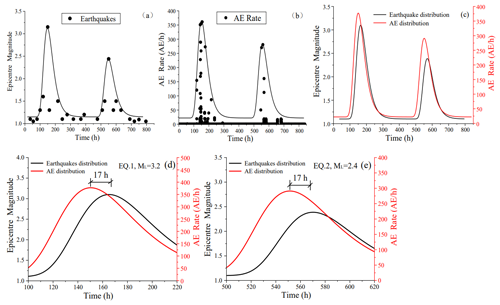
Figure 10Multi-modal Gaussian distribution of earthquakes (a) and AE (b), their superposition (c), and the predicted results (d, e).
This multi-modal approach is used for the statistical analysis of earthquakes and AE temporal distributions. Regarding the temporal distribution of the 24 earthquakes detected during the 35 d monitoring time period, two major seismic swarms are identified in Fig. 10a and b, together with the two AE Gaussian distributions.
The superposition of AE and earthquake distributions is shown in Fig. 10c, where the strong correlation between seismic swarms occurring in the monitored area and AE signals, as well as the precursor role played by AE with respect to imminent earthquakes, is evident. The Gaussian fitting parameters employed to plot Fig. 10c are the following: centre coordinates (xc) 148, 165, 556 and 573; curve offsets (y0) 22, 1.1, 22 and 1.1; amplitudes (A) 339.0, 2.0, 261.3 and 1.3; and widths (w) 32.8, 24.0, 32.8 and 19.0.
Figure 10d and e clearly show how AE anticipates each seismic event by approximately 17 h for both the events.
4.4 The b value and seismic sequences
Although seismic events exhibit complex space–time behaviour, reflecting the extreme disorder of the Earth's crust, universally valid scaling laws emerge. The b value is able to describe the evolution of seismic events by considering the statistical distribution of the AE signal magnitude following the Gutenberg–Richter (GR) law (Carpinteri et al., 2011). The GR law was first introduced in seismology and then extended to the statistics of AE signals (Colombo et al., 2003):
where M=log10(Amax), Amax is the signal peak amplitude and NAE is the number of AE events with magnitudes greater than M. The b value is the negative slope of the GR law straight line, which is fitted by the least squares method. In this study, the temporal variation in the b value is estimated by the moving event window method. A number of events, N, equal to 400, and a time window step of 200 events are adopted for the evaluation of the b-value temporal variation.
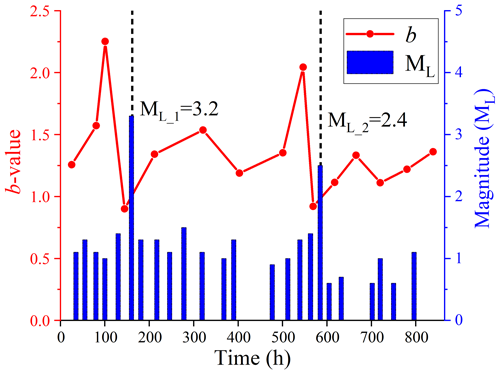
In Fig. 11, the AE b values and seismic magnitudes of EQ 1 and EQ 2 are reported. The occurrence of two major earthquakes resulted in a significant decrement in the b value, reaching a minimum below 1. When approaching the ML_1 = 3.2 earthquake, the b value drops from 2.3 to 0.9. Then, approaching the ML_2 = 2.4 earthquake, the b value drops from 2.1 to 0.9. On the other hand, when no major earthquakes occur, the b value tends to increase again. The downward trend in the b value can be used as an early warning sign of earthquakes, with the time of the minimum b value being just prior to the earthquake occurrence.
4.5 Natural-time analysis
Recently, natural-time analysis has been applied to identify the imminent failure of materials and structures (Loukidis et al., 2020; Ferreira et al., 2022a, b; Triantis et al., 2023). Natural-time time series transform time series into the natural-time domain, ignoring the time intervals of consecutive events and only considering the order and energy of occurrence. Based on the time-series analysis of N events read in a new time domain, namely the natural time, χ, a method to identify critical states was developed (Varotsos et al., 2011, 2013). The variance κ1 of the natural time is defined as
where is the normalised index of energy Qk (related AE energy), and is the probability distribution of the discrete variable χK. When κ1 converges to 0.07, the critical state is imminent.
In particular, two conditions have been defined to identify the change in the monitored structure to a true critical state (Vallianatos et al., 2013):
- I.
The parameter κ1 approaches the value 0.07 by descending from above.
- II.
The entropies S and Srev are lower than the entropy of the uniform noise, which is Su = 0.0966. The entropy S is defined as
Similarly, the entropy Srev is obtained by considering the time reversal .
Therefore, when critical conditions (I) and (II) are satisfied, the moment at which the critical state occurs can be justified (Hloupis et al., 2015, 2016).
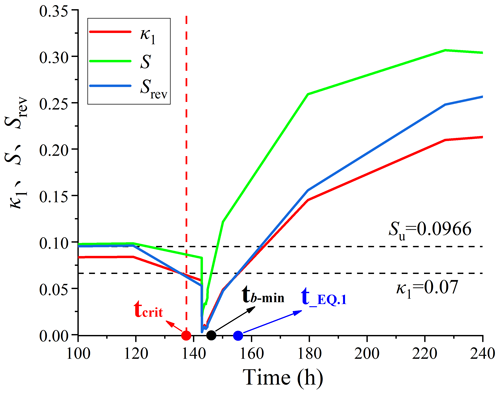
Hence, the evolution of variance κ1, entropy S and Srev of natural-time time series {χk} for the seismic event EQ 1 is reported in Fig. 12, showing the three variables (κ1, S, Srev) as functions of time t. The two horizontal dotted lines represent the variance limit κ1 = 0.07 and the entropy limit Su = 0.0966. The value of tcrit is shown in Fig. 12 according to the critical conditions (I) and (II). In particular, t_EQ 1 represents the occurrence time of EQ 1. When approaching the earthquake occurrence, the natural-time variance κ1 rapidly decreases from 0.07 to a minimum value close to zero.
In addition, a comparison between tcrit and tb−min, which is the time characterising the minimum b value, shows substantial agreement between the two indicators (see Table 2), with the critical time of the variance being earlier than the time of the minimum b value and the time of the AE cluster. Thus, the trends in the b value and natural-time variance can be used as seismic precursors.
4.6 AE parameters approaching a major earthquake
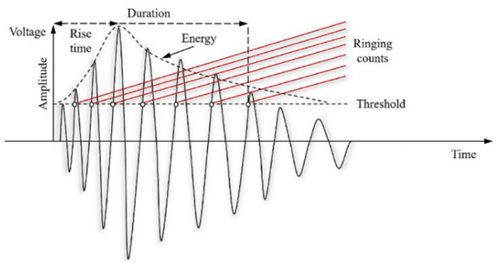
In order to analyse AE parameters before a major earthquake (EQ 1), the AE time series between 135 and 155 h are taken, focusing on the representative waveforms and b values during this time period. The AE parameters come from the acoustic waves, as shown in Fig. 13, where the ringing count is the number of signal oscillations greater than the AE threshold, the duration is the time elapsed between the first and the last signal oscillation above the AE threshold, the amplitude is the signal peak amplitude, and the average frequency is calculated as the ringing counts divided by the duration.
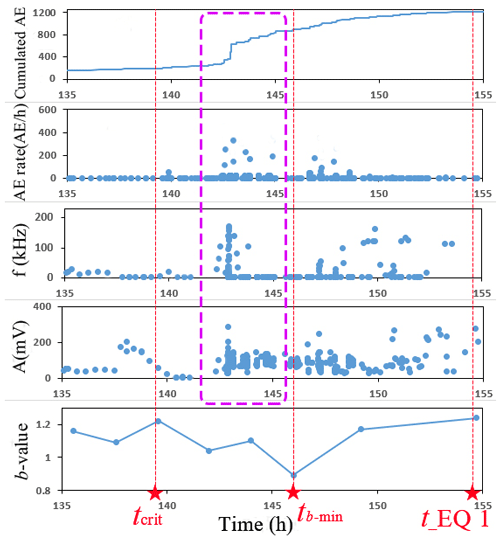
Figure 14AE parameters and b value when approaching a major earthquake occurrence. tcrit represents the critical time as predicted by the natural-time analysis, and t_EQ 1 depicts the occurrence time of Eq. (1).
The densest AE cluster approaching the earthquake occurrence is shown in Fig. 14, presenting the following characteristics: a large jump in the cumulated AE and significant peaks in the AE rate, frequency and amplitude. It is worth noting that this AE cluster is closely related to the Richter magnitude 3.2 earthquake (EQ 1), appearing about 13 h in advance. When approaching the earthquake occurrence, there is an AE burst. This can be explained by the fact that there was extensive micro-seismic activity in the earthquake preparation zone before the earthquake occurrence, which may have caused the generation of microcracks in the nearby ground surface.
In addition, as seen from the b-value analysis in Fig. 14, the temporal variation in the b value is estimated by the moving event window. A number of events, N, equal to 20, and a time window step of 10 events are adopted for the evaluation of the b-value temporal variation. The b value continuously decreases when approaching the earthquake and then reaches the minimum b value, which is 9 h earlier than the occurrence time of the earthquake. Moreover, the continuous downward trend in the b value can be used as an early warning sign of earthquakes.
Since April 2023, an in situ experimental campaign has been underway in a granite underground tunnel located in Southeast China, revealing the strong seismic forecasting potential of the AE peaks by means of a dedicated monitoring platform. The AE and its temporal correlation with incoming seismic events are analysed using an appropriate multi-modal statistical analysis. The conclusions are as follows:
-
The monitoring equipment is arranged in the granite underground tunnel with low noise, and ideal AE monitoring data and ground motion data are obtained, which indicates the reasonable feasibility of the monitoring system in this paper.
-
The dense clusters of AE, especially around 142 and 566 h, show large jumps in the cumulated AE and significant peaks in the AE rate, which appear to anticipate the earthquakes with Richter magnitude 3.2 (EQ 1) and Richter magnitude 2.4 (EQ 2). There was extensive micro-seismic activity before the earthquake occurrence, which may represent the origin of microcracks in the nearby ground surface, resulting in the AE bursts. Thus, AE can be used as a seismic precursor.
-
Multi-modal statistical analysis of earthquake and AE distributions shows that AE has a strong correlation with seismic swarms occurring in surrounding areas. The evaluation trend in the AE temporal distribution develops prior to that of the earthquake, and AE tends to anticipate the next seismic peak with an evident and chronologically ordered shifting, which regularly anticipates both considered seismic events by approximately 17 h.
-
The b-value analysis shows that, when approaching major seismic events, the b value decreases significantly and reaches a minimum value below 1, revealing that a larger-magnitude event is approaching. The downward trend in the b value can be used as an early warning sign of earthquakes, with the time of the minimum b value being just prior to the earthquake occurrence.
-
When approaching the earthquake occurrence, the natural-time variance κ1 rapidly decreases from 0.07 to a minimum value close to zero, with the critical time of the variance being earlier than the time of the minimum b value and the time of the AE cluster. Thus, the trends in the b value and natural-time variance can be used as seismic precursors.
Current research can only provide time predictions of AEs as earthquake precursors and cannot determine the epicentre and the magnitude of the earthquake. Future studies can identify seismic epicentre and magnitude through the networking of multiple AE devices in different locations. In addition, other precursory phenomena, such as electromagnetic and neutron emissions, can also be analysed at the dedicated monitoring platform to provide a more accurate basis for earthquake prediction (Carpinteri et al., 2015).
Data supporting the research are obtainable from the corresponding author upon reasonable request.
ZZ: writing (review and editing), methodology, investigation, data curation, conceptualisation. ZJ: writing (review and editing), writing (original draft), methodology, investigation, data curation, conceptualisation. FA: methodology, data curation, conceptualisation, visualisation. AC: methodology, supervision, writing (review and editing).
The contact author has declared that none of the authors has any competing interests.
Publisher's note: Copernicus Publications remains neutral with regard to jurisdictional claims made in the text, published maps, institutional affiliations, or any other geographical representation in this paper. While Copernicus Publications makes every effort to include appropriate place names, the final responsibility lies with the authors.
The seismic monitoring centre of Shantou provided the test site and seismic monitoring data for this study. We thank the editor and both reviewers for their constructive suggestions, which have greatly improved this paper.
Financial support. This research has been supported by the National Natural Science Foundation of China (grant no. 52278509) and the STU Outstanding Young Talents programme (grant no. 140-09423016).
This paper was edited by Filippos Vallianatos and reviewed by two anonymous referees.
Allen, C. R., Amand, P. S., Richter, C. F., and Nordquist, J. M.: Relationship between seismicity and geologic structure in the Southern California Region, B. Seismol. Soc. Am., 55, 753–797, 1965.
Carpinteri, A. and Borla, O.: Fracto-emissions as seismic precursors, Eng. Fract. Mech., 177, 239–50. https://doi.org/10.1016/j.engfracmech.2017.03.007, 2017.
Carpinteri, A. and Borla, O.: Acoustic, electromagnetic, and neutron emissions as seismic precursors: the lunar periodicity of low-magnitude seismic swarms, Eng. Fract. Mech., 210, 29–41, https://doi.org/10.1016/j.engfracmech.2018.04.021, 2019.
Carpinteri, A., Lacidogna, G., and Niccolini, G.: Damage analysis of reinforced concrete buildings by the acoustic emission technique, Struct. Control Hlth., 18,660–673, https://doi.org/10.1002/stc.393, 2011.
Carpinteri, A., Lacidogna, G., Invernizzi, S., and Accornero, F.: The sacred mountain of Varallo in Italy: Seismic risk assessment by acoustic emission and structural numerical models, Sci. World J., 2013, 1–10, https://doi.org/10.1155/2013/170291, 2013.
Carpinteri, A., Lacidogna, G., and Manuello, A.: Acoustic, electromagnetic, neutron emissions from fracture and earthquakes, Springer International Publishing Switzerland, Cham, Heidelberg, New York, Dordrecht, London, ISBN 978-3-319-16954-5, 2015.
Carpinteri, A., Lacidogna, G., Corrado, M., and Di Battista, E.: Cracking and crackling in concrete-like materials: A dynamic energy balance, Eng. Fract. Mech., 155, 130–134, https://doi.org/10.1016/j.engfracmech.2016.01.013, 2016a.
Carpinteri, A., Lacidogna, G., Manuello, A., and Niccolini, G.: A study on the structural stability of the Asinelli Tower in Bologna, Struct. Control. Hlth., 23, 659–667, https://doi.org/10.1002/stc.1804, 2016b.
Colombo, I. S., Main, I. G., and Forde, M. C.: Assessing damage of reinforced concrete beam using “b-value” analysis of acoustic emission signals, J. Mater. Civil Eng., 15, 280–286, https://doi.org/10.1061/(ASCE)0899-1561(2003)15:3(280), 2003.
Dobrovolsky, I. P., Zubkov, S. I., and Miachkin, V. I.: Estimation of the size of earthquake preparation zones, Pure Appl. Geophys., 117, 1025–1044, https://doi.org/10.1007/BF00876083, 1979.
Dong, S. F., Zhou, D. C., Ashour, A., Han, B. G., and Ou, J. P.: Flexural toughness and calculation model of super-fine stainless wire reinforced reaclive powder concrele, Cement Concrete Comp., 104, 103367, https://doi.org/10.1016/j.cemconcomp.2019.103367, 2019.
Ferreira, L. F., Rojo, N. B. T., Bordin, A. C., Sobczyk, M., Lacidogna, G., Niccolini, G., and Iturrioz, I.: Analysis of acoustic emission activity during progressive failure in heterogeneous materials: experimental and numerical investigation, Appl. Sci.-Basel, 12, 3918, https://doi.org/10.1016/j.physa.2019.123831, 2022a.
Ferreira, L. F., Silva, É. C., Bordin, A. C., Rojo, N. B. T., Sobczyk, M., Lacidogna, G., and Ignacio, I.: Long-range correlations and natural time series analyses from acoustic emission signals, Appl. Sci.-Basel, 12, 1980, https://doi.org/10.3390/app12041980, 2022b.
Gregori, G. P., Paparo, G., Poscolieri, M., and Zanini, A.: Acoustic emission and released seismic energy, Nat. Hazards Earth Syst. Sci., 5, 777–782, https://doi.org/10.5194/nhess-5-777-2005, 2005.
Gregori, G. P., Poscolieri, M., Paparo, G., De Simone, S., Rafanelli, C., and Ventrice, G.: “Storms of crustal stress” and AE earthquake precursors, Nat. Hazards Earth Syst. Sci., 10, 319–337, https://doi.org/10.5194/nhess-10-319-2010, 2010.
Han, Q. H., Wang, L. C., Xu, J., Carpinteri, A., and Laidogna, G.: A robust method to estimate the b-value of the magnitude–frequency distribution of earthquakes, Chaos Soliton. Fract., 81, 103–110, https://doi.org/10.1016/j.chaos.2015.09.004, 2015.
Han, Q. H., Yang, G., Xu, J., Fu, Z. W., Lacidogna, G., and Carpinteri, A.: Acoustic emission data analyses based on crumb rubber concrete beam bending tests, Eng. Fract. Mech., 210, 189–202, https://doi.org/10.1016/j.engfracmech.2018.05.016, 2019.
Hloupis, G., Stavrakas, I., Pasiou, E. D., Triantis, D., and Kourkoulis, S. K.: Natural time analysis of acoustic emissions in Double Edge Notched Tension (DENT) marble specimens, Procedia Engineer., 109, 248–256, https://doi.org/10.1016/j.proeng.2015.06.226, 2015.
Hloupis, G., Stavrakas, I., Vallianatos, F., and Triantis, D.: A preliminary study for prefailure indicators in acoustic emissions using wavelets and natural time analysis, Proc. Inst. Mech. Eng., 230, 780–788, https://doi.org/10.1177/1464420715575337, 2016.
Lacidogna, G., Carpinteri, A., Manuello, A., Durin, G., Schiavi, A., Niccolini, G., and Agosto, A.: Acoustic and electromagnetic emissions as precursor phenomena in failure processes, Strain, 47, 144–152, https://doi.org/10.1111/j.1475-1305.2010.00750.x, 2011.
Lacidogna, G., Cutugno, P., Niccolini, G., Invernizzi, S., and Carpinteri, A.: Correlation between earthquakes and AE monitoring of historical buildings in seismic areas, Appl. Sci.-Basel, 5, 1683–1698, https://doi.org/10.3390/app5041683, 2015.
Lacidogna, G., Accornero, F., and Carpinteri A.: Influence of snap-back instabilities on acoustic emission damage monitoring, Eng. Fract. Mech., 210, 3–12, https://doi.org/10.1016/j.engfracmech.2018.06.042, 2019.
Loukidis, A., Pasiou, E. D., Sarlis, N. V., and Triantis, D.: Fracture analysis of typical construction materials in natural time, Physica A, 547, 123831, https://doi.org/10.1016/j.physa.2019.123831, 2020.
Lukovenkova, O., Marapulets, Y., and Solodchuk, A.: Adaptive approach to time-frequency analysis of AE signals of rocks, Sensors, 22, 9798, https://doi.org/10.3390/s22249798, 2022.
Manuello, A., Niccolini, G., and Carpinteri, A.: AE monitoring of a concrete arch road tunnel: damage evolution and localization, Eng. Fract. Mech., 210, 279–287, https://doi.org/10.1016/j.engfracmech.2018.07.029, 2019.
Marapulets, Y., Solodchuk, A., Lukovenkova, O., Mishchenko, M., and Shcherbina, A.: Sound range AE as a tool for diagnostics of large technical and natural objects, Sensors, 23, 1269, https://doi.org/10.3390/s23031269, 2023.
Moriya, H.: Acoustic emission/seismicity at depth beneath an artificial lake after the 2011 Tohoku earthquake, Appl. Sci.-Basel, 8, 1407, https://doi.org/10.3390/app8081407, 2018.
Sammonds, P. R., Meredith, P. G., and Main, I. G.: Role of pore fluid in the generation of seismic precursors to shear fracture, Nature, 359, 228–230, https://doi.org/10.1038/359228a0, 1992.
Sarlis, N. V., Skordas, E. S., Varotsos, P. A., Nagao, T., Kamogawa, M., Tanaka, H., and Uyeda, S.: Minimum of the order parameter fluctuations of seismicity before major earthquakes in Japan, P. Natl. Acad. Sci. USA, 110, 13734–137348, https://doi.org/10.1073/pnas.1312740110, 2013.
Smith, W. D.: The b-value as an earthquake precursor, Nature, 289, 136–139, 1981.
Triantis, D., Stavrakas, I., Loukidis, A., Pasiou, E. D., and Kourkoulis, S. K.: A study on the fracture of cementitious materials in terms of the rate of acoustic emissions in the natural time domain, Appl. Sci.-Basel, 13, 6261, https://doi.org/10.3390/app13106261, 2023.
Vallianatos, F., Michas, G., Benson, P., and Sammonds, P.: Natural time analysis of critical phenomena: The case of acoustic emissions in triaxially deformed etna basalt, Physica A, 392, 5172–5178, https://doi.org/10.1016/j.physa.2013.06.051, 2013.
Varotsos, P. A., Sarlis, N. V., and Skordas, E. S.: Spatio-temporal complexity aspects on the interrelation between seismic electric signals and seismicity, Pract. Athens Acad. Greece, 76, 294–321. 2001.
Varotsos, P. A., Sarlis, N. V., and Skordas, E. S.: Natural time analysis: The new view of time, Springer, Berlin/Heidelberg, Germany, https://doi.org/10.1007/978-3-642-16449-1, 2011.
Varotsos, P. A., Sarlis, N. V., Skordas, E. S., and Lazaridou, M. S.: Seismic electric signals: An additional fact showing their physical interconnection with seismicity, Tectonophysics, 589, 116–125, https://doi.org/10.1016/j.tecto.2012.12.020, 2013.
Zimatore, G., Garilli, G., Poscolieri, M., Rafanelli, C., Gizzi, F. T., and Lazzari, M.: The remarkable coherence between two Italian far away recording stations points to a role of acoustic emissions from crustal rocks for earthquake analysis, Chaos, 27, 043101, https://doi.org/10.1063/1.4979351, 2017.
- Abstract
- Introduction
- AE as seismic precursor
- In situ monitoring of AE and earthquakes
- Correlation between seismic and AE activities
- Conclusions and future perspectives
- Data availability
- Author contributions
- Competing interests
- Disclaimer
- Acknowledgements
- Financial support
- Review statement
- References


