the Creative Commons Attribution 4.0 License.
the Creative Commons Attribution 4.0 License.
 | 17 Oct 2024
The Earthquake Risk Model of Switzerland, ERM-CH23
Athanasios N. Papadopoulos
Philippe Roth
Laurentiu Danciu
Paolo Bergamo
Francesco Panzera
Donat Fäh
Carlo Cauzzi
Blaise Duvernay
Alireza Khodaverdian
Pierino Lestuzzi
Ömer Odabaşi
Ettore Fagà
Paolo Bazzurro
Michèle Marti
Nadja Valenzuela
Irina Dallo
Nicolas Schmid
Philip Kästli
Florian Haslinger
Stefan Wiemer
Understanding seismic risk at both the national and sub-national level is essential for devising effective strategies and interventions aimed at its mitigation. The Earthquake Risk Model of Switzerland (ERM-CH23), released in early 2023, is the culmination of a multidisciplinary effort aiming to achieve for the first time a comprehensive assessment of the potential consequences of earthquakes on the Swiss building stock and population. Having been developed as a national model, ERM-CH23 relies on very high-resolution site-amplification and building exposure datasets, which distinguishes it from most regional models to date. Several loss types are evaluated, ranging from structural–nonstructural and content economic losses to human losses, such as deaths, injuries, and displaced population. In this paper, we offer a snapshot of ERM-CH23, summarize key details on the development of its components, highlight important results, and provide comparisons with other models.
- Article
(8887 KB) - Full-text XML
-
Supplement
(818 KB) - BibTeX
- EndNote


Natural hazards can cause widespread damage, loss of life, and disruption to critical services such as water, power, and transportation. Earthquake risk mitigation programmes are effective, and as cities and populations continue to expand, they become increasingly vital to safeguard lives, infrastructure, and economic stability. A study from the National Institute of Building Sciences in the USA estimated that federal mitigation grants for earthquake hazards save USD 3 per USD 1 spent (National Institute of Building Sciences, 2019). Catastrophe risk models in particular can aid governments and other stakeholders in determining the potential impact of different perils, identifying high-risk areas, and prioritizing resources and investments for preparedness and mitigation. They can further inform emergency response plans, helping increase the resilience of communities to catastrophic events. As such, the development and operation of national catastrophe risk models and related byproducts are increasingly seen as the basis for designing an effective data-driven disaster risk reduction strategy.
Strong earthquakes in particular, compared to other natural hazards, are characterized by rather infrequent occurrence and high potential for causing significant devastation. This low-probability, high-consequence feature of seismic risk hinders societal preparedness, as both public interest and actionable data are missing. In contrast, it makes modelling efforts all the more important for anticipating future scenarios and creating mitigation actions. The latter could involve reduction (e.g. retrofit of existing structures, update of design codes for new construction, educational campaigns), transfer (e.g. insurance), or planned retention (e.g. dedicated disaster funds) of the risk.
Seismic risk modelling initiatives at the national level have been undertaken to varying extents in different countries, such as Italy (Dolce et al., 2021), the USA (FEMA, 2010; Jaiswal et al., 2015), Canada (Hobbs et al., 2023), Germany (Tyagunov et al., 2006), Spain (Salgado-Gálvez et al., 2015), and Portugal (Marques et al., 2018). There have also been attempts to model risk at continental or global scales. In Europe, an open earthquake risk model (ESRM20; Crowley et al., 2021) has been released as an output of the European Union's Horizon 2020 SERA project (http://www.sera-eu.org, last access: 17 September 2024). ESRM20 is a uniform risk model that covers 45 European countries and is the result of a concerted effort among the research community in Europe. Lastly, global models have also been compiled, such as the United Nations International Strategy for Disaster Reduction (UNISDR) Global Assessment Report (GAR; Cardona et al., 2014) and, most notably, the 2018 Global Seismic Risk Map (Silva et al., 2020b) developed by the Global Earthquake Model (GEM) Foundation. The latter has allowed access to a uniform view of risk across the globe, a valuable resource, particularly for previously understudied regions.
In Switzerland in 2013, the Federal Council commissioned the Federal Office for the Environment (FOEN), in cooperation with the Swiss Seismological Service (SED) and the Federal Office for Civil Protection (FOCP), to prepare a feasibility study and project plan to develop a national earthquake risk model. Based on these documents, in 2017 the Federal Council commissioned the SED, in cooperation with FOEN and FOCP, to develop this model by 2023. In the following sections, we give an overview of ERM-CH23 and its subcomponents (seismic source, ground motion, site amplification, fragility, and consequence and exposure models) and then present primary results and insights such as comparison with other published models.
In Switzerland, earthquakes are considered to be the natural hazard with the potential for causing the greatest damage. The 2020 Risk Report (FOCP, 2020) published by the FOCP ranked earthquakes as the third-largest risk faced by Switzerland, after electricity shortages and pandemics. Overall, seismicity in the country is considered moderate, with three to four earthquakes a day recorded on average within the country and around its borders by the monitoring network of the Swiss Seismological Service (SED; http://www.seismo.ethz.ch, last access: 17 September 2024), the federal agency responsible for monitoring earthquakes in Switzerland and in its neighbouring regions. A destructive earthquake with moment magnitude (Mw) of 6.0 or above can be expected to occur on average every 50 to 150 years (Wiemer et al., 2016). The most seismically active regions are found in the Valais and Graubünden cantons, as well as in the southern Rhine Graben, a rift system located in the north-eastern part of the country. The 1356 Basel earthquake is the to date largest known earthquake to have struck Switzerland, with an estimated moment magnitude of 6.6. It caused widespread damage (Fäh et al., 2009) throughout Switzerland and neighbouring countries and was felt as far away as Paris. Other notable historical events in the last 200 years include the 1855 Mw 6.2 Visp earthquake (Fritsche et al., 2006) and the 1946 Mw 5.8 Sierre earthquake (Fritsche and Fäh, 2009). Figure 1 shows the spatial and temporal pattern of known earthquakes of magnitude above 5.0 in Switzerland.
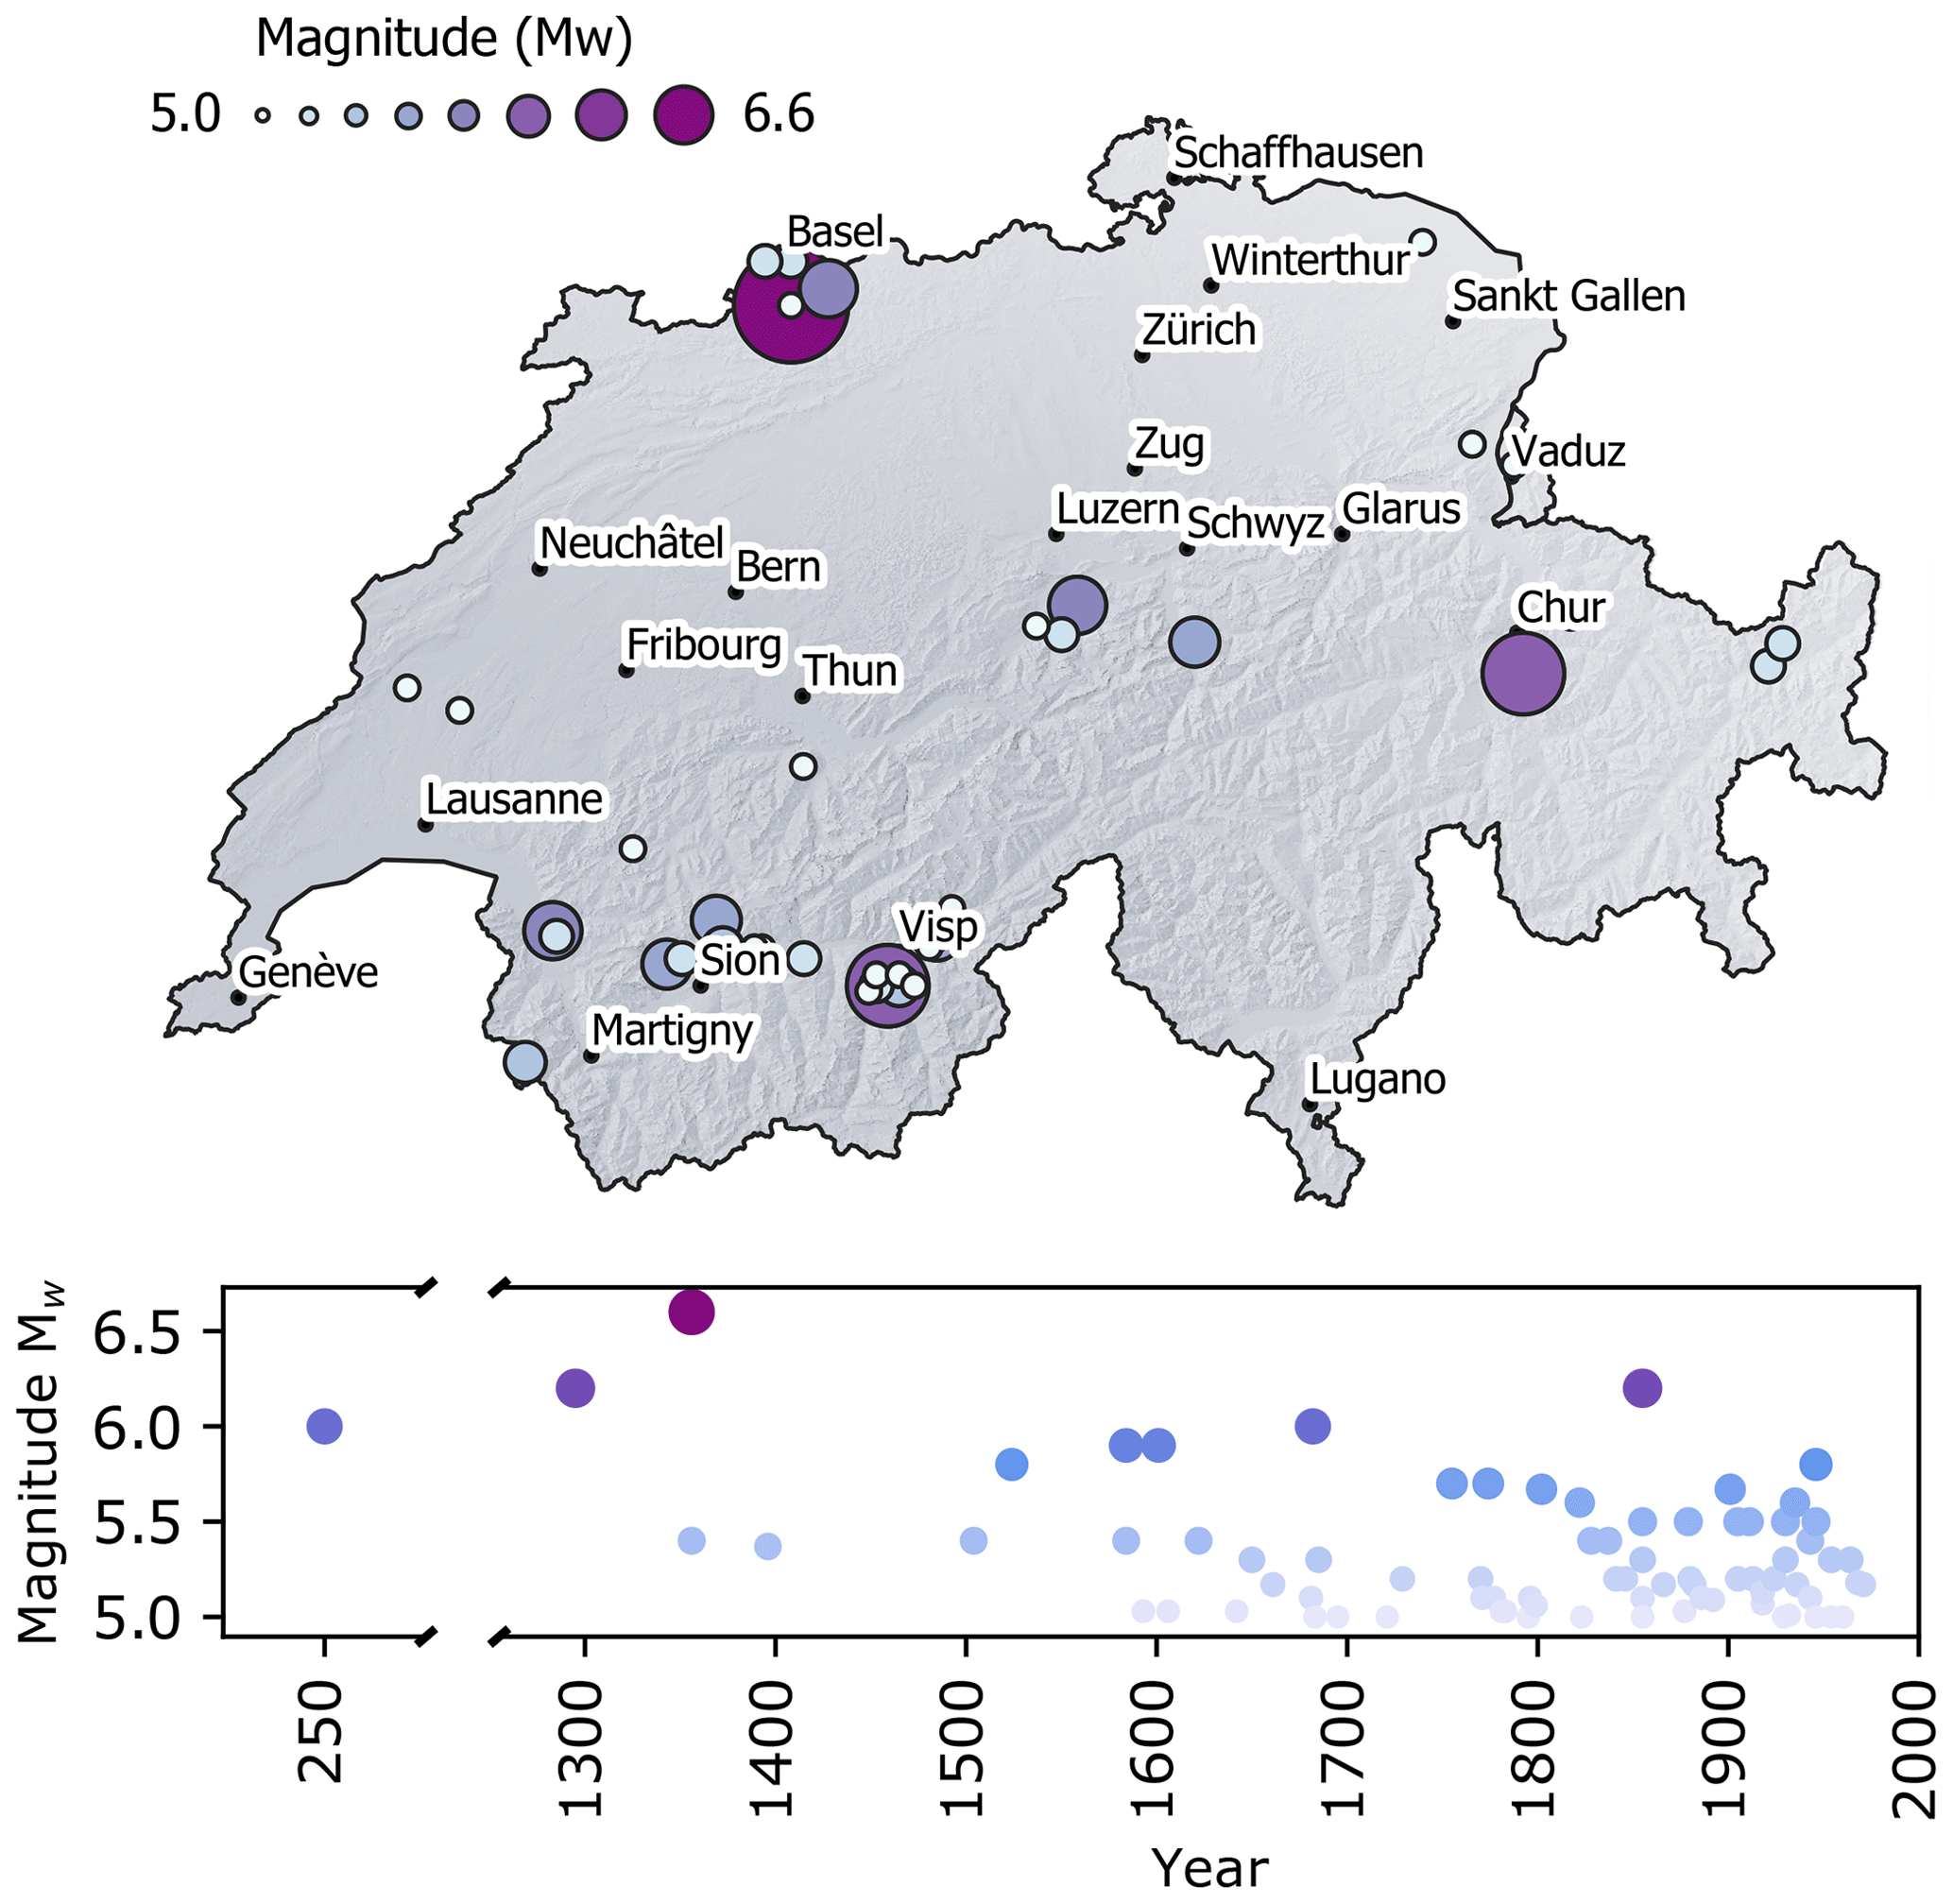
Figure 1Locations, dates, and sizes of known historical earthquakes with magnitude Mw>5.0 in Switzerland (ECOS-09 catalogue; Fäh et al., 2011).
3.1 Seismic hazard
ERM-CH23 primarily relies on the 2015 seismic hazard model (SUIhaz2015; Wiemer et al., 2016), which is the authoritative national seismic hazard model of Switzerland. While SUIhaz2015 serves as the basis, a number of adjustments were made to tailor it for use within the context of ERM-CH23 and are succinctly detailed in the sections to follow and in more detail in Wiemer et al. (2023).
3.1.1 Source model
The seismogenic source model of SUIhaz2015 results from a weighted ensemble of four individual source models. The latter includes an area source model (SEIS-15) and a smoothed seismicity model (CH14), developed specifically for SUIhaz2015. The other two models are sourced from past seismic hazard models, i.e. SEIS04 (Wiemer et al., 2009) and ESHM13 (SHARE Project; Woessner et al., 2015). From the ensemble earthquake rate model, the activity rates corresponding to the 2.5 %, 16 %, 50 %, 84 %, and 97.5 % quantiles were obtained and assigned as five alternative logic tree branches with weights corresponding to the associated area that they represent under a normal distribution. For further details on the source model of SUIhaz2015, the reader is referred to Wiemer et al. (2016).
In ERM-CH23, the five original logic tree branches are collapsed into a single branch with weighted average rates. The motivation behind this choice was (1) to reduce the significant computational cost associated with risk analyses and (2) to also avoid the synchronous assignment of improbable rates in all sources (e.g. in the 2.5th or 97.5th quantile rate branches) across the country. The bias from the latter would invalidate any estimation of epistemic quantiles (although an argument exists that it could be advantageous for the evaluation of mean estimates). Similar reasoning for using a single collapsed branch has been made for other models (e.g. Crowley et al., 2021).
The maximum magnitude is spatially variable and in the range of Mw 6.5 to 7.3 (Wiemer et al., 2016). The minimum magnitude, originally set to Mw 4.0 in SUIhaz2015, was increased to Mw 4.5 for ERM-CH23, on the rationale that smaller events are not of particular engineering significance (Bommer and Crowley, 2017).
3.1.2 Ground shaking
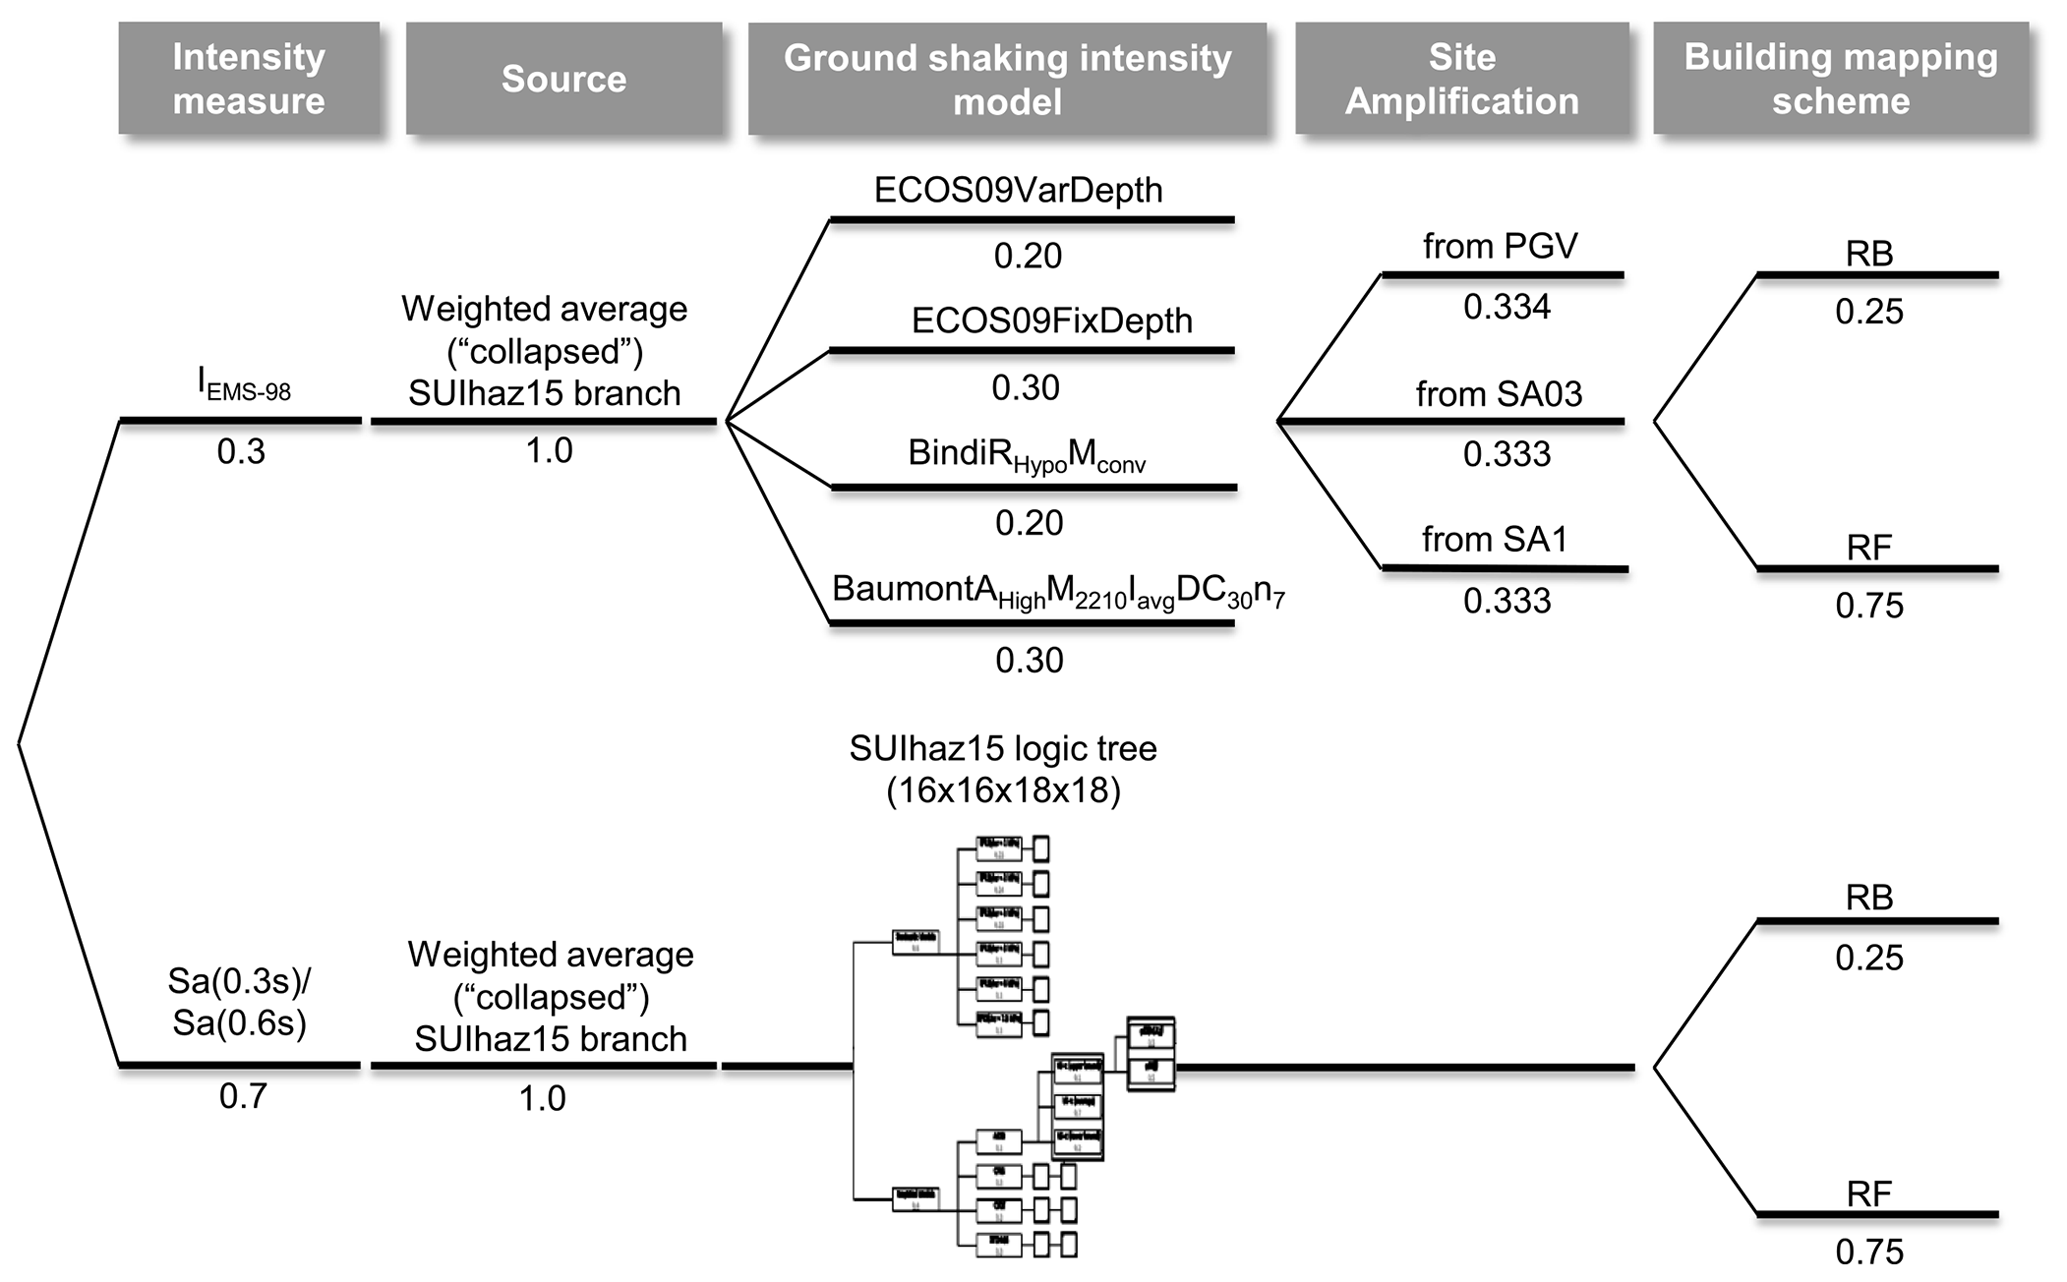
ERM-CH23 is built upon two main sub-models: one that uses spectral acceleration (henceforth referred to as SAM) that was given a weight of 0.7 in the overall logic tree (Fig. 6) and one that uses EMS-98 (Grünthal, 1998) macroseismic intensity (henceforth referred to as MIM) that was given a weight of 0.3. The ground shaking in SAM is modelled with the same set of ground motion models (GMMs) used in SUIhaz2015 (Wiemer et al., 2016; Edwards et al., 2016). These include empirical models based on datasets in Europe and worldwide, such as those of Zhao (2006) Chiou and Youngs (2008), Cauzzi and Faccioli (2008), and Akkar and Bommer (2010), adjusted to match the amplification and attenuation levels typical of the Swiss reference rock (Edwards et al., 2016; Wiemer et al., 2016; Poggi et al., 2011). They also include the Swiss-specific stochastic models of Edwards and Fäh (2013) and Cauzzi et al. (2015), obtained by simulating ground shaking for various source-, path-, and site-specific parameterizations. Different GMMs and weights are set for each of four identified tectonic regimes, namely Alpine shallow, Alpine deep, foreland shallow, and foreland deep. Each tectonic regime represents a different branching set in the logic tree, with 18, 16, 18, and 16 GMMs, respectively. The total number of GMM logic tree branch combinations reaches 82 944 (18 × 16 × 18 × 16). The full GMM logic tree is reported in the Supplement. Further details on the selection, weighting, and statistical performance of these models in Switzerland can be found in Edwards et al. (2016).
Concerning MIM, a selection of intensity prediction equations (IPEs) was carried out for ERM-CH23. A residual analysis was conducted on the macroseismic dataset for the region in order to compare a collection of candidate IPEs. The latter were ranked and four of the best-performing ones were then selected (Table 1) to represent the body, centre, and range of intensity data. Besides the residual analysis, considerations were made to compile a set that encompasses different epistemic views (e.g. amplitude and attenuation trends) with members calibrated on different datasets (the two ECOS-09 models are fit to Swiss macroseismic observations, whereas the other two are fit to wider datasets).
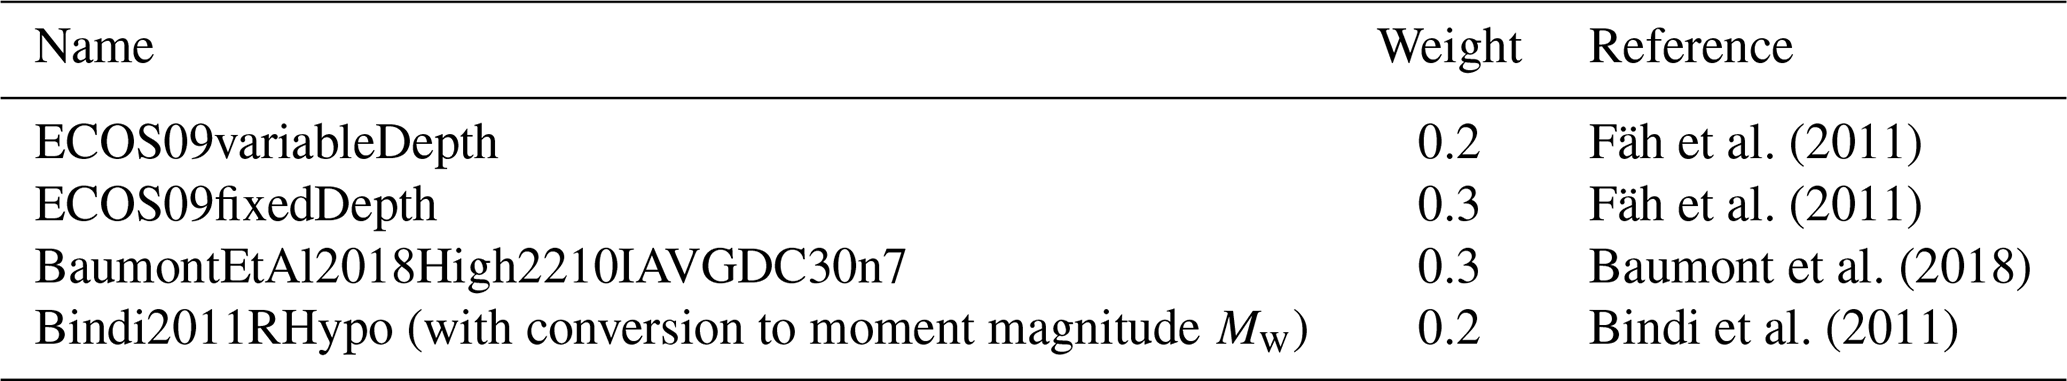
Finally, some adjustments were carried out in the aleatory uncertainty modelling of the IPEs and GMMs. For the former, it was decided to use the intra- and inter-event sigma of the Baumont et al. (2018) model since the other functions do not distinguish intra- and inter-event components, which is important for risk analyses. On the GMM side, the inter-event sigma of the original functions is maintained, while the intra-event sigma is modelled as a site-specific value and derived together with the site amplification model (see the following section) to ensure compatibility.
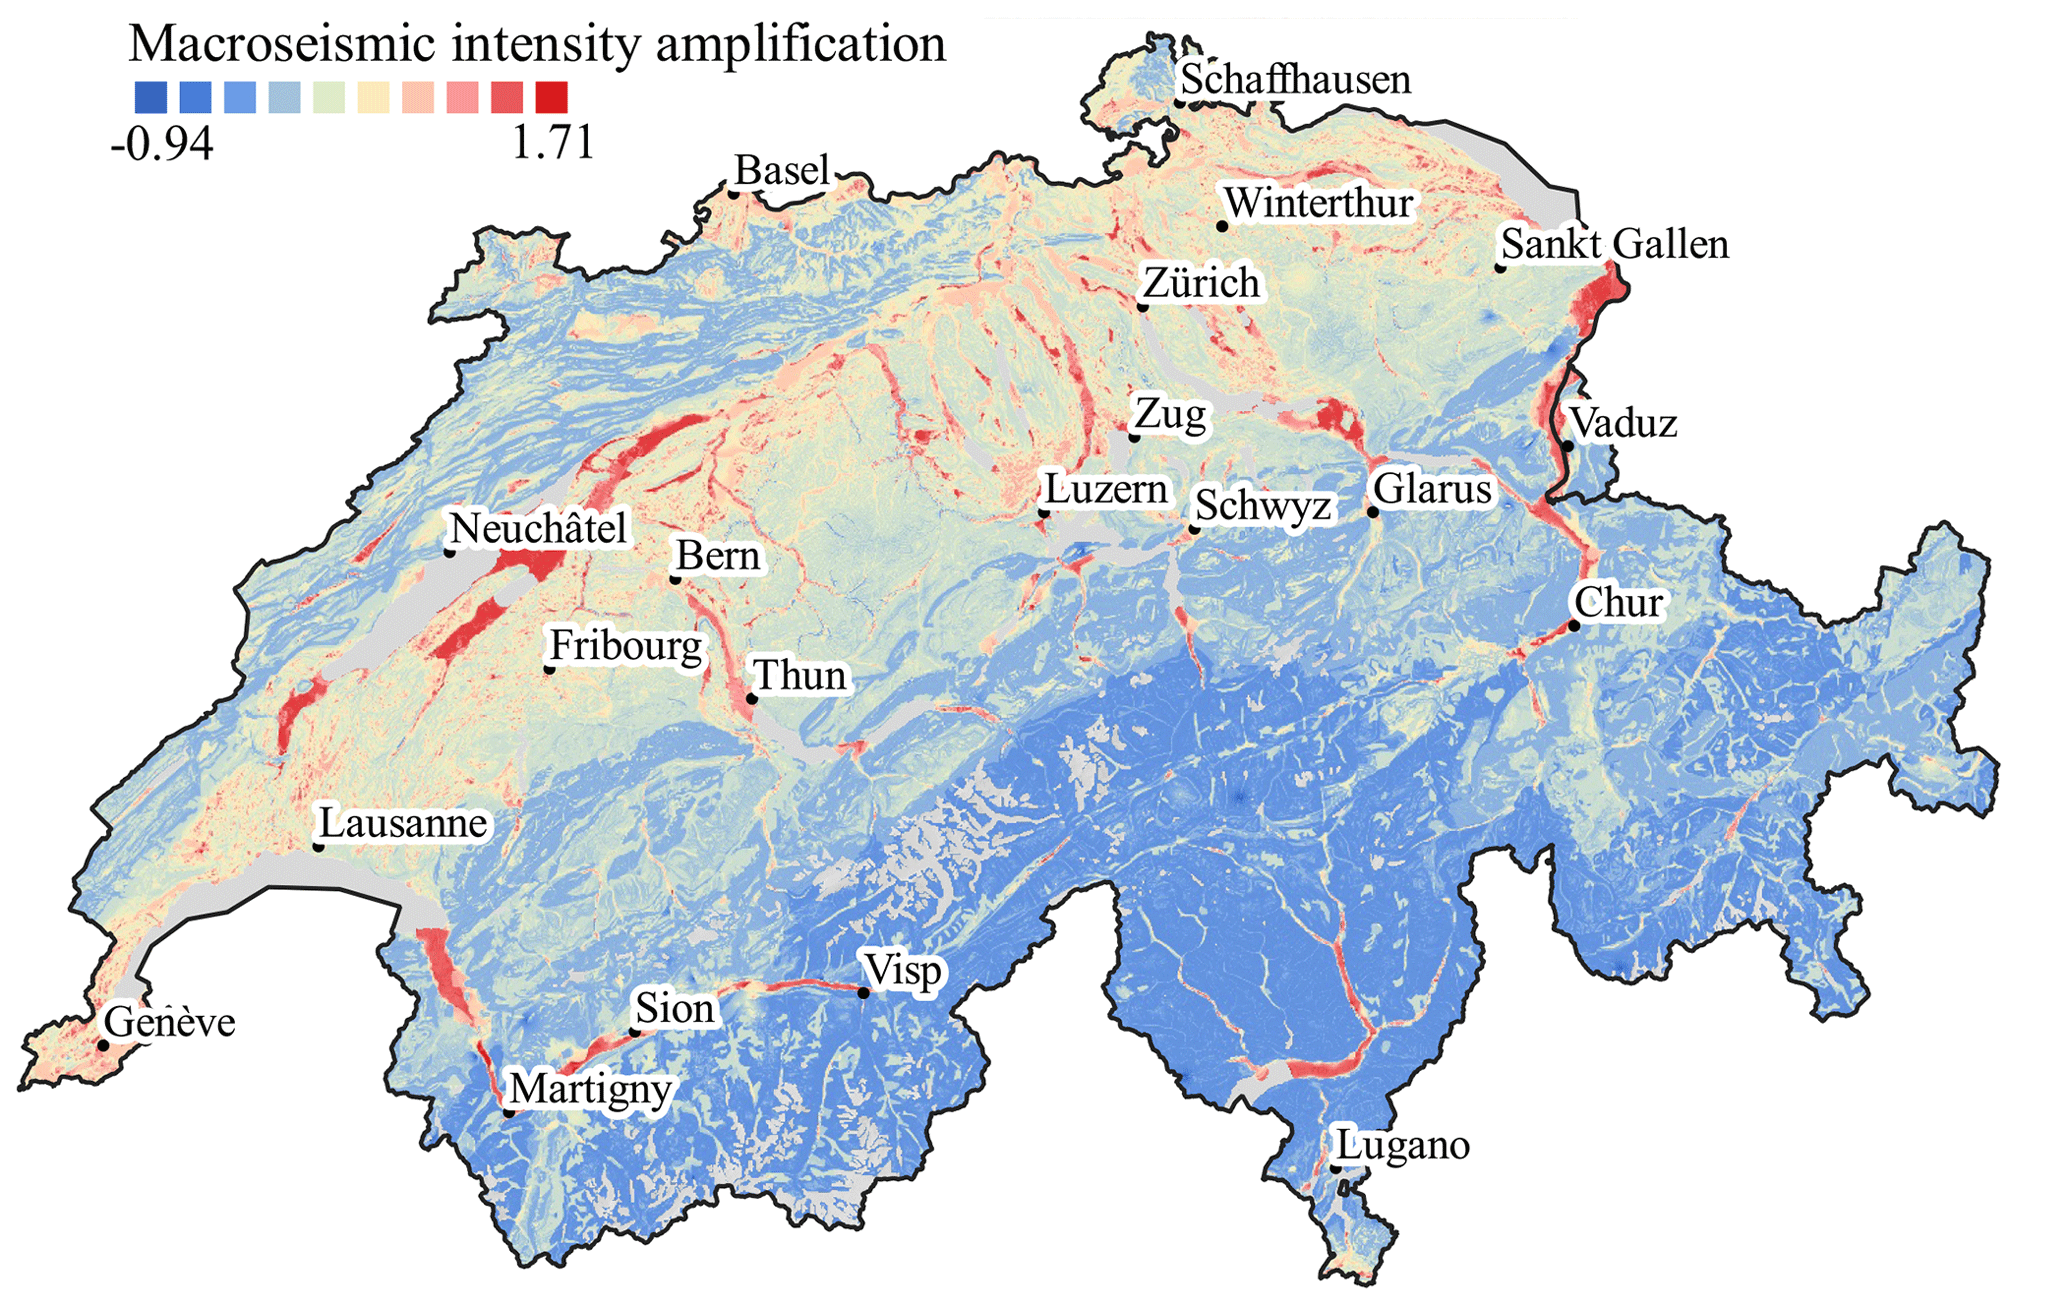
Figure 2Example of a macroseismic intensity aggravation map, derived from a Sa(0.3 s) proxy.
3.1.3 Site amplification
As a component of ERM-CH23, a new ground motion site amplification model was developed (Bergamo et al., 2023; Wiemer et al., 2023), covering the entirety of Switzerland in a homogeneous manner. This model is based on two datasets. The first one comprises site amplification factors that were measured at seismic stations across Switzerland, while the second one is composed of site condition indicators that are known to be correlated with local seismic response. The empirical spectral modelling technique (ESM; Edwards et al., 2013) was used to compute Fourier amplification functions at instrumented sites, using earthquake recordings from 2000 to 2021; the amplification was then translated from the Fourier to the pseudo-spectral acceleration (Sa) domain, resorting to random vibration theory (Liu and Pezeshk, 1999). The selected site condition indicators (lithological classification of Switzerland, multiscale topographic slope, and depth-to-bedrock) were combined with the empirical amplification factors using the regression-kriging algorithm (Hengl et al., 2007). To allow coherent integration of the ground motion and site amplification modules, corresponding maps of the site-to-site variability (φS2S) and the single-site, within-event variability (φSS) were also produced and used to define the overall intra-event variability. The latter site-specific estimate was used to replace the intra-event uncertainty term of the employed GMMs. The site model is derived for four intensity measures, namely the geometric mean (of the two horizontal components) peak ground velocity (PGV), and pseudo-spectral acceleration at 3 periods (0.3, 0.6, and 1.0 s). The Sa(0.3 s) and Sa(0.6 s) models are employed in SAM, whereas the site amplification maps for PGV, Sa(0.3 s), and Sa(1.0 s) were further translated into macroseismic intensity aggravation layers (e.g. Fig. 2) for use with the IPEs and associated macroseismic-intensity-based vulnerability functions. The conversion to macroseismic intensity aggravation was performed using the Faenza and Michelini (2011, 2010) relations and the correction factors estimated by Panzera et al. (2021), the latter taking into account the shift from the reference soil condition of the GMMs to that of the IPEs.
3.2 Seismic vulnerability
3.2.1 Taxonomy
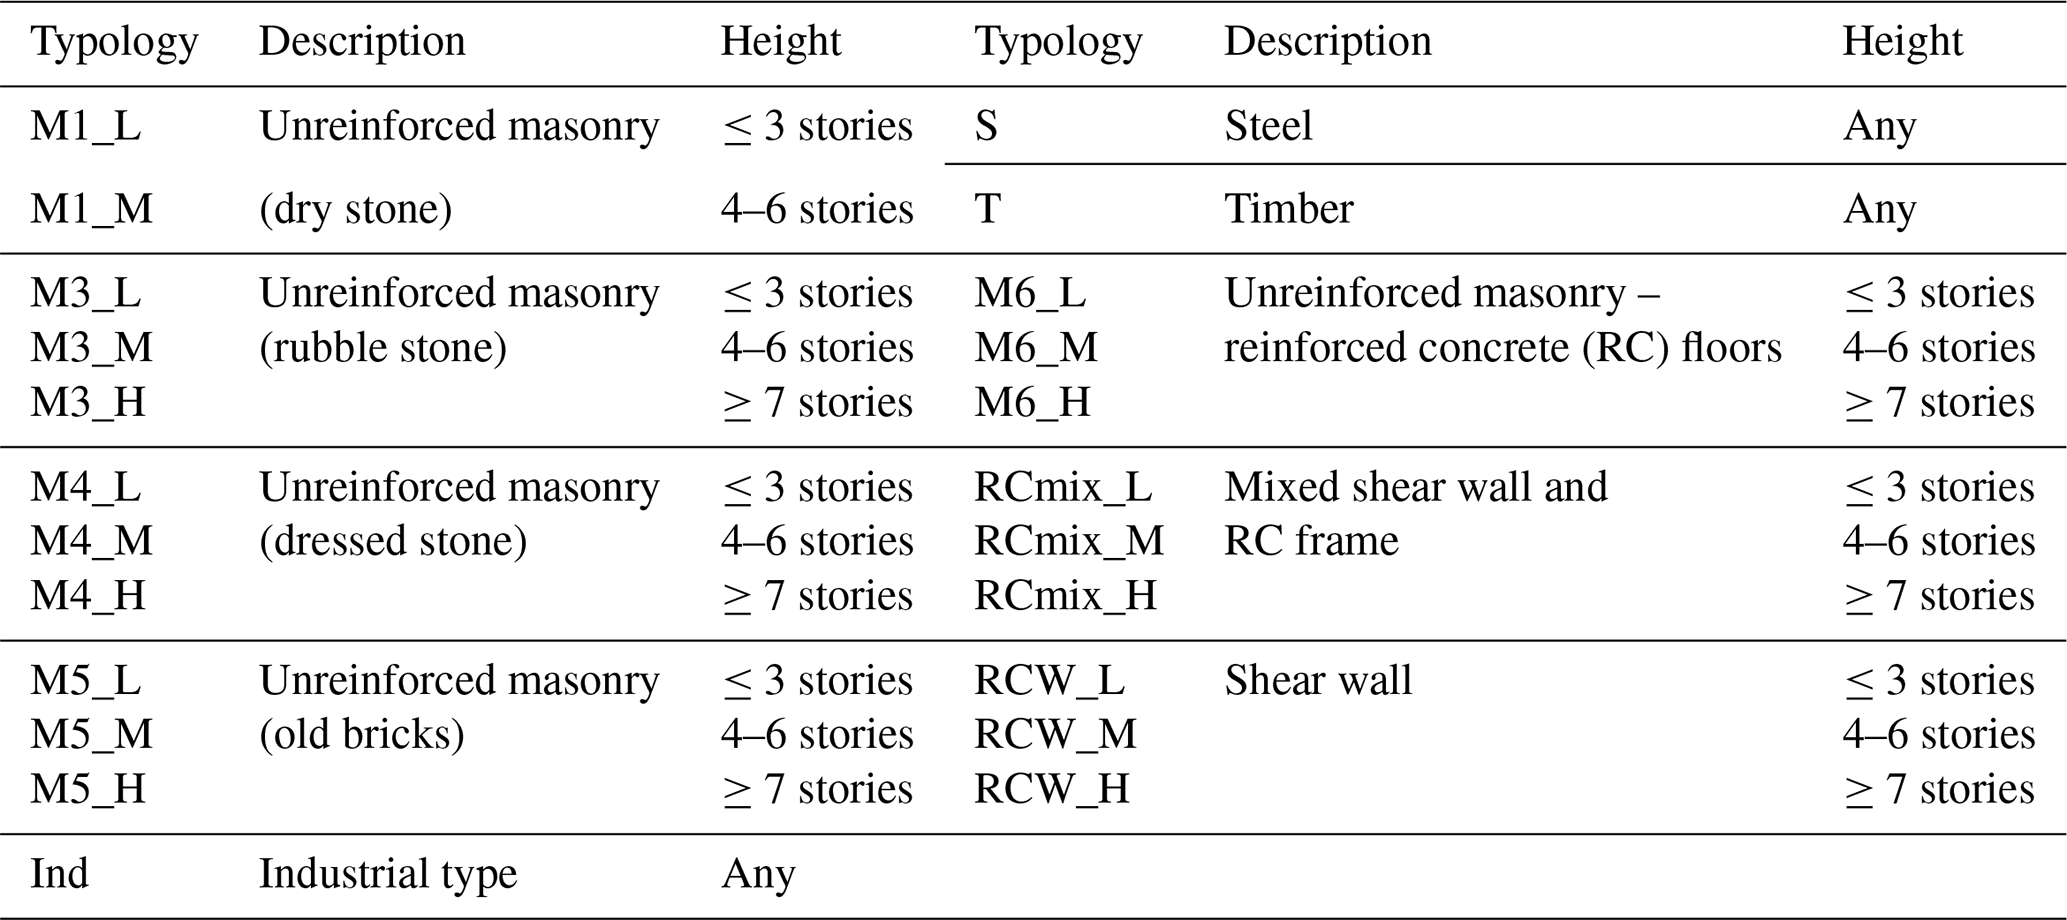
According to several surveys carried out in Switzerland (e.g. Lestuzzi et al., 2016), the building taxonomy proposed in Lagomarsino and Giovinazzi (2006) is suitable for application to Switzerland with minor modifications (Table 2).
3.2.2 Fragility functions
Two different sets of fragility curves were derived, one in terms of macroseismic intensity for the MIM logic tree branches of the overall model and one in terms of spectral acceleration (at 0.3 or 0.6 s) for the SAM branches (Wiemer et al., 2023). The MIM fragility model relies on the methodology described in Lagomarsino and Giovinazzi (2006), Lagomarsino et al. (2021), and Bernardini et al. (2010), together with engineering judgement about Swiss practice.
For the development of the SAM fragility functions, a statistical investigation of building blueprints was first exploited to identify average geometric characteristics of various building types. Capacity curves, idealized in bilinear form, were then obtained from numerical models (Lestuzzi et al., 2017). For most typologies, 1000 capacity curves were then generated using the statistical model, covering material uncertainties. The method detailed in Michel et al. (2018) was followed to derive analytical fragility curves in terms of EMS-98 (Grünthal, 1998) damage states ranging from slight damage to collapse. Further details on the definition of capacity curves and the methodology followed to derive fragility curves can be found in (Wiemer et al., 2023).
3.2.3 Consequence model
A consequence model that relates damage to loss has been compiled for application to Switzerland (Wiemer et al., 2023). Different approaches were used for each of the five loss types of interest, depending on the availability of data. In brief, injuries and deaths were modelled based on the estimates given by Hazus (FEMA, 2010), the Italian National Civil Protection Department (NCPD, 2018), and Spence et al. (2007). Estimates of displaced population were instead adopted from the empirical data harmonized by the Italian National Civil Protection Department (NCPD, 2018). Displaced population in ERM-CH23 refers to households that have been displaced in either the short or long term. Content damage-to-loss estimates have also been adopted from the literature and more precisely from Hazus (FEMA, 2010).
On the other hand, the structural–nonstructural damage-to-loss functions have been derived analytically, adopting the loss estimation methodology of FEMA P-58 (FEMA, 2018). For each building typology, the prescriptive damage states as per the EMS-98 scale were matched to associated structural demand thresholds sourced from the literature (Wiemer et al., 2023). Archetype blueprints were used to infer quantities and features of structural elements such as load-bearing masonry walls, spandrels, and slabs. The quantity estimator tool of FEMA P-58 was also used to determine the nonstructural component quantities with uncertainty. Fragility and consequence functions for damageable structural and nonstructural components present in Swiss buildings that were not available in FEMA P-58 were gathered and collated from other sources (Mouyiannou et al., 2014; Ottonelli et al., 2020; Rossi et al., 2021; Cardone, 2016; Cardone and Perrone, 2015; Magenes and Calvi, 1997; Avila et al., 2012). The repair and replacement costs were adjusted using a macroeconomic model in view of the construction dynamics between the reference country (from which cost functions were available, i.e. Italy or the USA) and Switzerland.
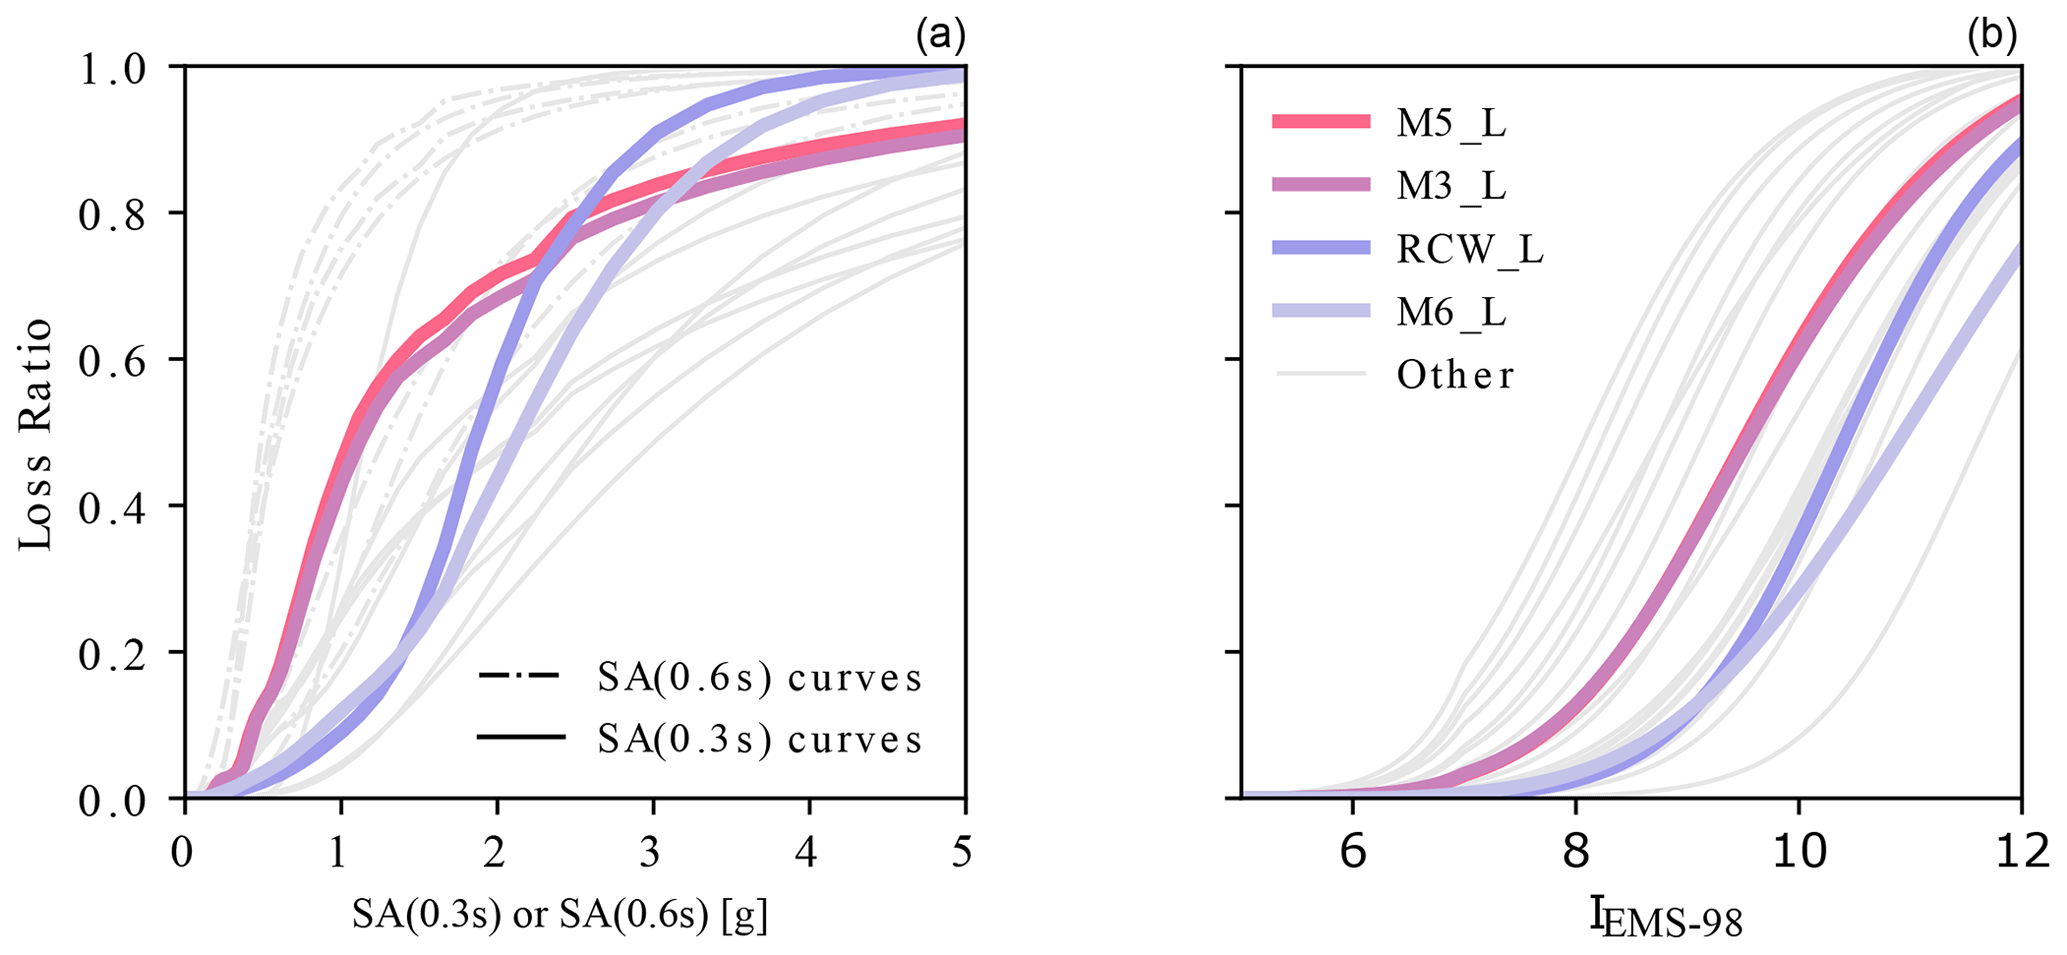

Figure 4(a) Spatial distribution of buildings across Switzerland, (b) distribution of buildings by number of stories, (c) cantonal distributions of buildings by occupancy, and (d) distribution of buildings by construction period.
The repair cost conversion factor (RCCF) to be multiplied by the original (reference country) cost estimates was obtained as per Eq. (1), building upon previous suggestions by Porter et al. (2015), Papadopoulos et al. (2019) and Silva et al. (2020a):
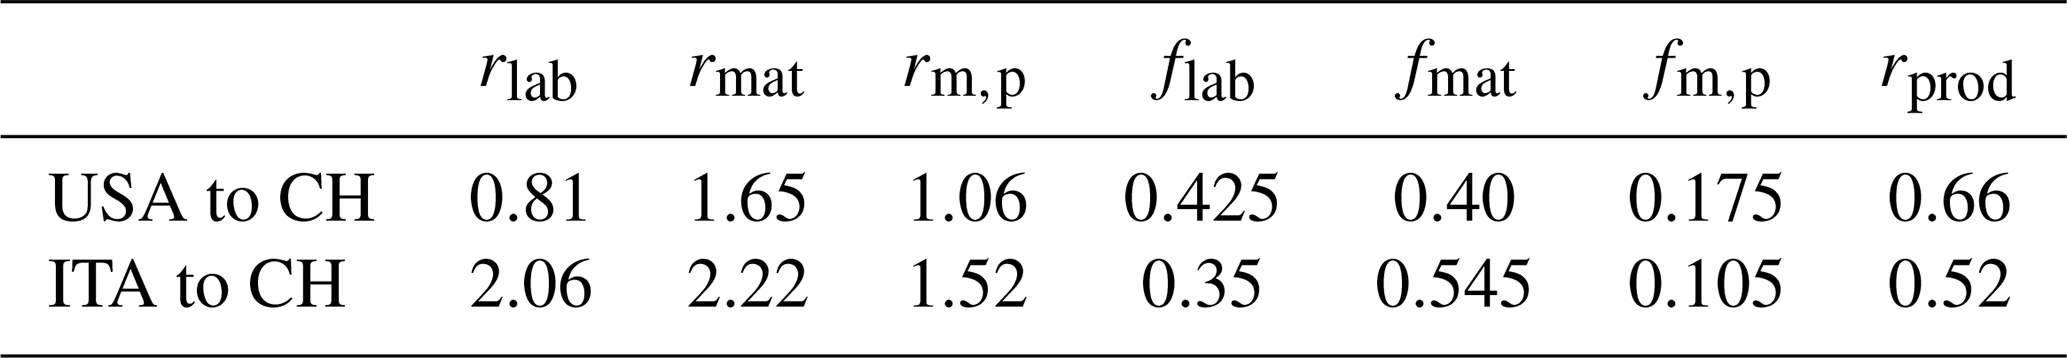
Here, flab, fmat, and fm,p represent the proportion of the total repair cost associated with labour, materials, and margins and preliminaries, respectively, in the reference country (from which the cost is being adapted). On the other hand, rlab, rmat and rm,p denote estimated ratios of the costs of labour, material, and margins and preliminaries between Switzerland (numerator) and the reference country (denominator). These parameters were determined following an extensive survey of both national and international sources, including the statistics bureaus of Italy, Switzerland, and the USA, as well as Turner and Townsend (2019), ARCADIS (2019), Comune di Milano and Regione Lombardia (2021), and Raetz et al. (2020). Equation (1) also requires the difference in labour productivity between the target and reference countries , where cprod represents labour productivity and is computed as
where GVA denotes the gross value added to the construction sector, while the denominator is the product of the number of persons employed in the construction sector multiplied by the hourly associated worker compensation. Simply put, it represents value added per dollar spent on labour. These inputs were collected from the public databases of Eurostat, the Organisation for Economic Cooperation and Development (OECD), and the Federal Statistical Office of Switzerland. Table 3 reports the inputs to Eq. (1) that were used, while the resulting conversion factors were 1.4 for adjusting the US cost data and 2.73 for adjusting the Italian cost data.

Figure 5Share of different building typologies in the entire Swiss building stock (a), in large municipalities (b), and in small municipalities (c).
Adjustments were also made to account for inflation (e.g. the FEMA P-58 was representative of prices in 2012). Furthermore, technical/professional fees that arise on top of the operational costs of repairs are not accounted for in FEMA P-58. Previous research has shown that they can constitute up to 14 % of the operational expenses (Di Ludovico et al., 2017a, b). As such, the percentage cost of technical fees added on top of our estimated repair costs was determined to be 5 % for DS1 and DS2 and 13 % for the rest, in recognition of relevant national data on such fees. Further details on the development of the consequence model can be found in Wiemer et al. (2023).
3.2.4 Vulnerability functions
Vulnerability functions were derived by a combination of the fragility and consequence models. Figure 3 shows a comparison of the structural–nonstructural vulnerability curves for the four most prevalent typologies in Switzerland (see Fig. 5). As expected, the pure masonry typologies (M3, M5) are more vulnerable, with damage onset expected from rather low intensity levels. The reinforced concrete wall (RCW) buildings and the M6 typology that combines concrete and masonry elements are thought to be less vulnerable, with damage expected at higher intensity values.
3.3 Building exposure
The exposure model describes the location, value, occupants, and typological characteristics of the buildings at risk. At the base of the ERM-CH23 exposure model lies an extensive georeferenced database of all building objects in Switzerland, assembled by the Federal Office for the Environment (FOEN). Further details on the building database can be found in FOEN (2021) and Hügli et al. (2021), as well as in Wiemer et al. (2023). ERM-CH23 makes use of over 2.25 million building entries in the database, after excluding close to 900 000 objects with an unclassified function or a volume above ground smaller than 200 m3 (typically bungalows, storage sheds, bus shelters, etc.).
Among other data, the building database includes information such as the period of construction, building function, footprint area, volume, and height (which is then used to define the number of stories) as obtained from digital surface and digital terrain elevation models. The reconstruction (replacement) cost is determined for each building according to Röthlisberger et al. (2018), using the building volume, the building function, and the building zone category as predictor variables. The replacement value of building contents is computed as a fraction of the building reconstruction value and varies from 0.19 to 0.65 depending on the building function. The modelled values were further validated using data from the cantonal building insurance companies. The number of occupants in each building is defined through de-aggregation of georeferenced housing and employment statistics. For the estimation of human losses, ERM-CH23 uses a static (time-agnostic) equivalent number of occupants in each building that is obtained as a weighted average of residents, employees, students (in school buildings), and patients (in hospitals) and allows for a share of the population being outdoors at the time of the earthquake. For further details, the reader is referred to Wiemer et al. (2023).
Most of the exposure is concentrated on the Swiss plateau north of the Alps (Fig. 4a), especially around urban centres such as Zurich, Geneva, Basel, and Bern. The vast majority of the Swiss building stock consists of low-rise buildings of one to three stories (Fig. 4b). High-rise buildings (> seven stories) are quite rare and are concentrated in the major urban centres such as Geneva, Zurich, and Basel. Figure 4d shows the distribution of buildings constructed in different time periods. It appears that only a small fraction of the total was built after the introduction of seismic codes in 2003, with a significant amount of construction having taken place within the 1971–1990, 1946–1970, and <1919 periods. The total value of the modelled building stock and contents amounts to CHF 2.9 trillion and CHF 0.8 trillion, respectively. About 70 % (structural–nonstructural) and 54 % (contents) of this value comes from residential buildings. Commercial and public buildings add up to about 18 % and 23 % of the total structural–nonstructural and content values, while industrial buildings add up to about 10 % and 20 %, respectively. Agricultural buildings make up about 3 % of the total value. The share of buildings of different occupancies by canton is illustrated in Fig. 4c.
The prevalence of different structural typologies in the Swiss building stock was assessed by means of field surveys carried out in the cities of Basel, Solothurn, Sion, Yverdon-les-Bains, Neuchâtel, and Martigny (e.g. see Diana et al., 2019). Subsets of the building stock at these locations were visually assessed and assigned to a structural typology as per the taxonomy given in Table 2. The survey outcomes were used in two alternative ways within ERM-CH23 (Wiemer et al., 2023). In the first one, the statistics of structural systems were obtained based on two attributes: the construction period and the height of the building (one to three stories, four to six stories, > seven stories). Subsequently, a structural typology was assigned to each database entry by random sampling from the aforementioned conditional statistics. The second approach involved training a random forest algorithm (Tin Kam Ho, 1998) on the attributes of the database matched to the results of the field surveys. The random forest algorithm was then executed to predict the typologies of the remaining database entries. The two approaches constitute two alternative logic tree branches of the ERM-CH23 framework. The rate-based (RB) approach was given a weight of 0.25 and the random-forest-based (RF-based) procedure was given a weight of 0.75. Figure 5 shows the share of the main typologies in Switzerland, as well as shares in the large municipalities of the main urban centres and in the smaller municipalities comprising the rest of the country. In general, masonry is the predominant construction material, with M3 (unreinforced rubble stone masonry), M5 (unreinforced old brick masonry), and M6 (unreinforced masonry with RC floors) being the most common. Reinforced concrete wall (RCW) buildings also make up a significant, albeit lower, fraction of the building stock.

Figure 7Average annual loss (AAL) epistemic distributions for four loss types. The contributions of the MIM and SAM models are stacked, i.e. at each x-axis bin, the relative heights of the SAM and MIM bars indicate the contributions of the two models to the particular loss value.
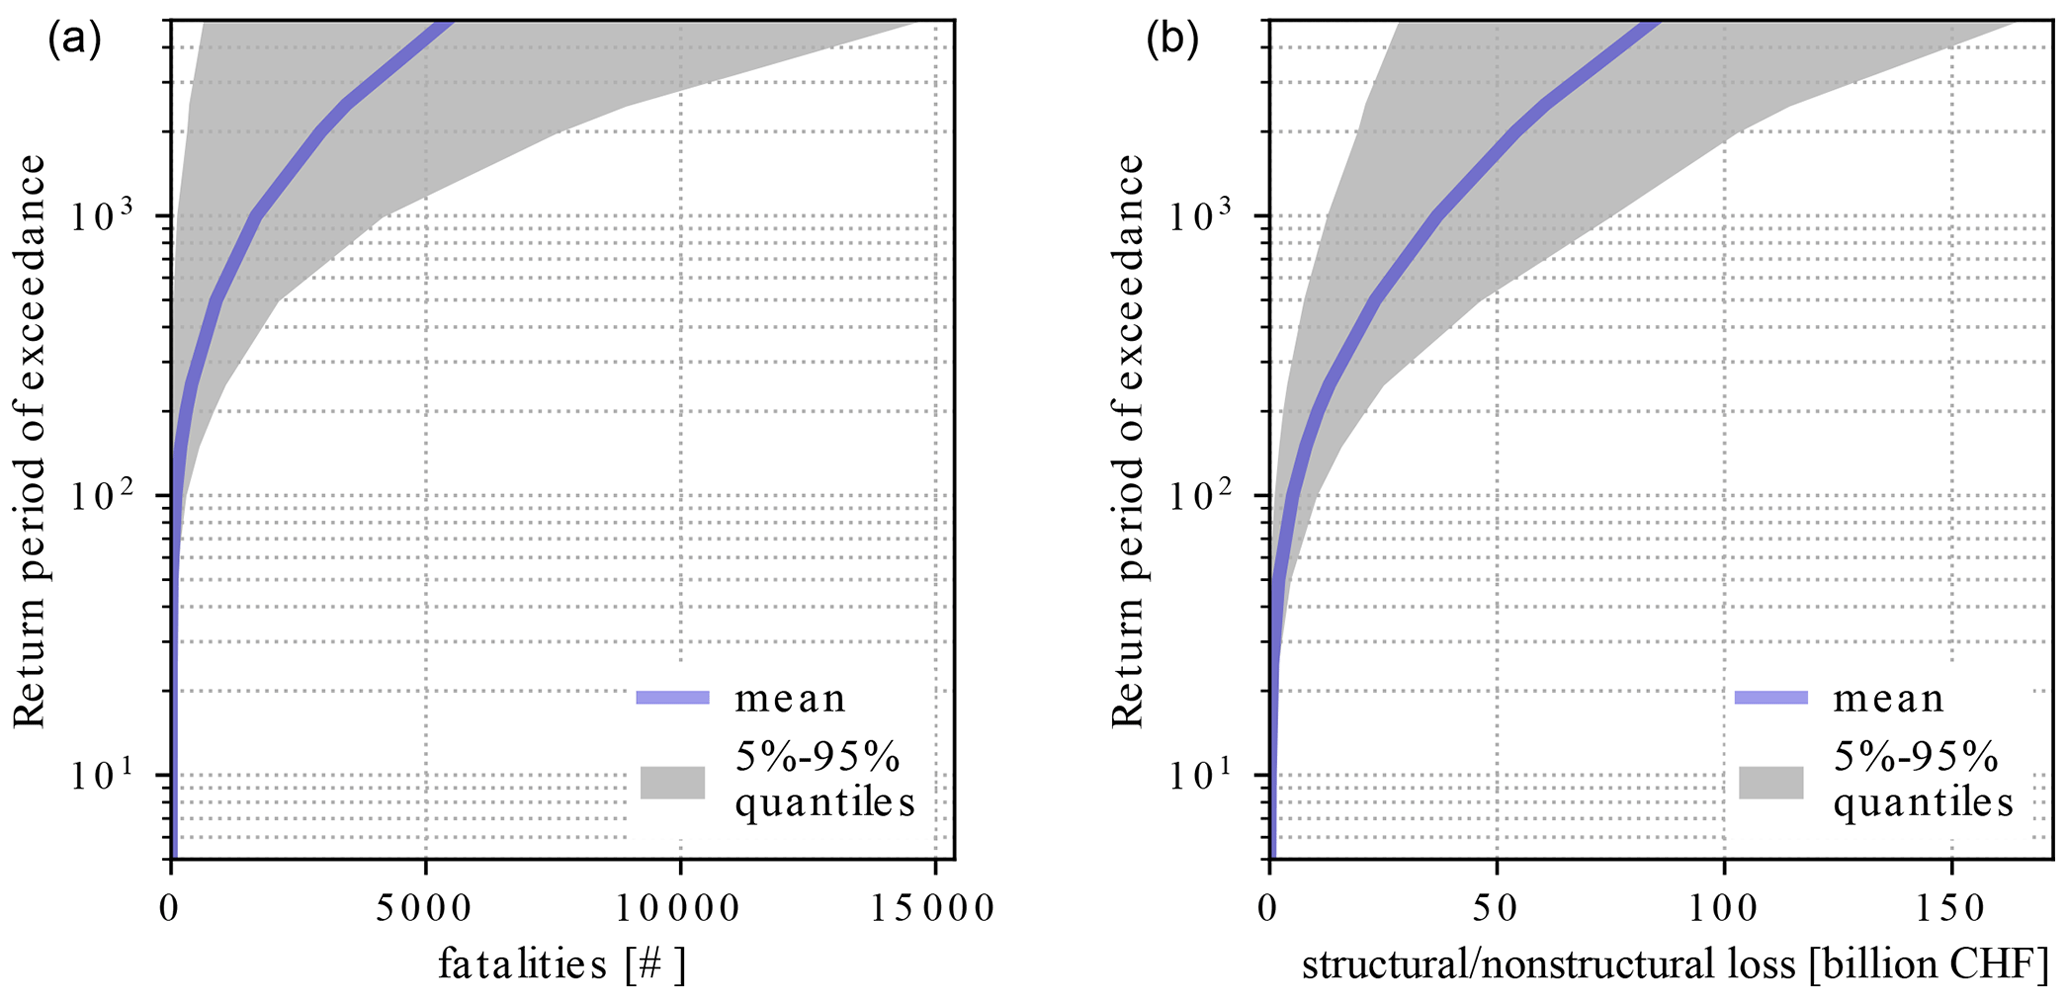
Figure 8Probable maximum loss curves for fatalities (a) and structural–nonstructural economic loss (b).
Since the ERM-CH23 exposure covered more than 2 million individual buildings, it had to be aggregated on a spatial grid to facilitate the risk computation. After investigating different options (Wiemer et al., 2023; Papadopoulos et al., 2024), the aggregation was performed on a 2 km × 2 km regular grid, along with some further considerations for minimizing any resulting errors. More precisely, the site parameters at the locations of buildings within each cells were first clustered using the k-means (MacQueen, 1967) approach. Buildings (of the same typology and postal code) belonging to each of five (SAM) or three (MIM) grid cell clusters were placed in adjacent locations near the cell centroid and merged into one macro-asset. At each cluster location, the associated cluster centroid site parameters were assigned. Moreover, the merging of buildings into macro-assets (i.e. single assets with replacement values equal to the sum of the values of the buildings being aggregated) implies a perfect correlation of the ground motion and loss residuals (given ground motion) across the buildings being aggregated. To remove the effect of this implicit correlation of the loss ratios, vulnerability curves for macro-assets of n buildings (where n was taken equal to 1, 5, 20, and 85) were estimated and used for macro-assets of different sizes. This was done by sampling the single-building loss ratio multiple times for each of the n buildings comprising it, summing it up to obtain the total macro-asset loss and then building the updated loss ratio distribution given each ground motion level (Wiemer et al., 2023; Papadopoulos et al., 2024).
3.4 Modelling of uncertainty
Undoubtedly, there are large uncertainties involved in earthquake risk modelling. As usual, aleatory uncertainties are considered in the modelling of earthquake occurrence (modelled as a Poisson process), in the modelling of ground motion (modelled with a lognormal distribution for ground motion or a normal distribution for intensity) and in the modelling of loss given ground motion (modelled with a beta distribution). Epistemic uncertainties in ERM-CH23 are captured via a logic tree approach, as was already alluded to earlier on. Figure 6 illustrates the logic tree set-up that was adopted. A primary branching distinguishes the MIM and SAM sub-models, with further branching levels for ground shaking modelling, site amplification, and building mapping. The logic tree numbers 24 MIM-specific end-to-end branches and 165 888 SAM-specific end-to-end branches. For the risk calculations, all MIM branches were considered, whereas 400 SAM branches were randomly (based on their weights) selected and analysed.
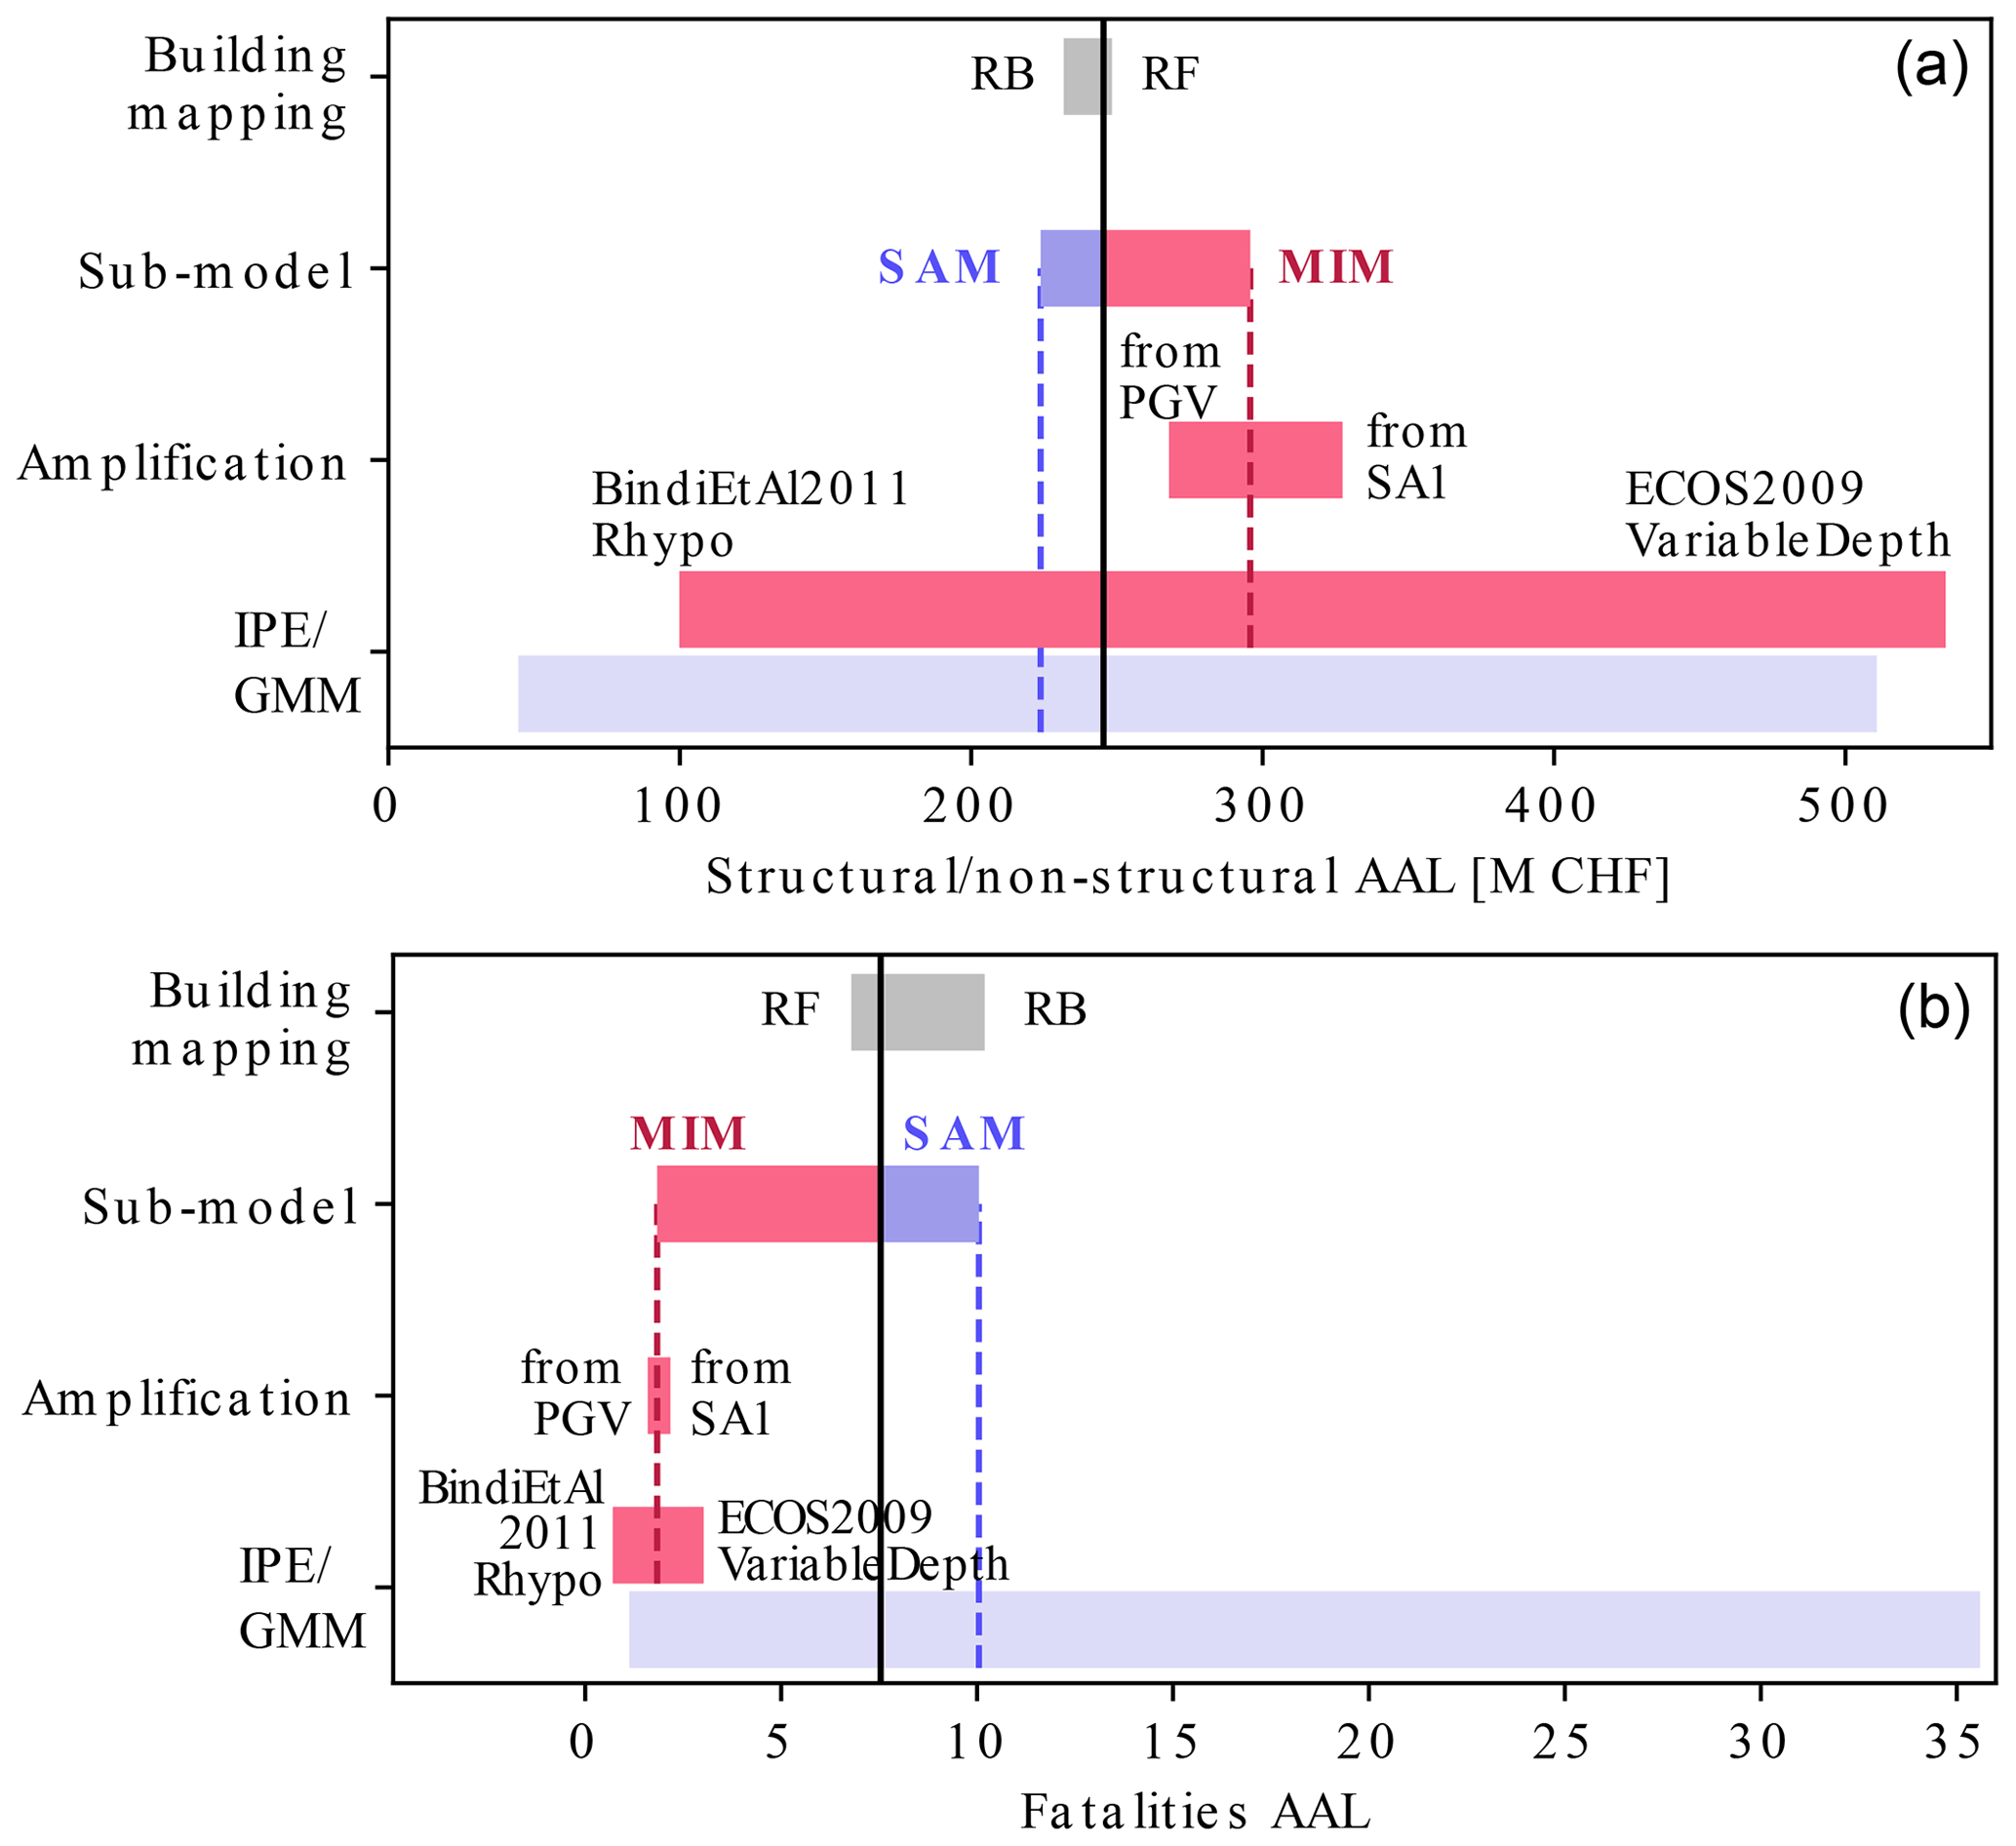
Figure 9Epistemic uncertainty tornado diagrams for structural–nonstructural (a) and fatality (b) AAL. The bars for each branching level show the minimum and maximum AAL estimate obtained by varying only the input at that level (e.g. only the amplification branch) while keeping the rest of the logic tree unchanged. The MIM- and SAM-specific bars refer to estimates of those sub-models rather than of the entire model. Finally, in the case of GMMs since enumeration is not possible and 400 branches are sampled, the bars simply refer to the minimum and maximum values obtained across these 400 samples.
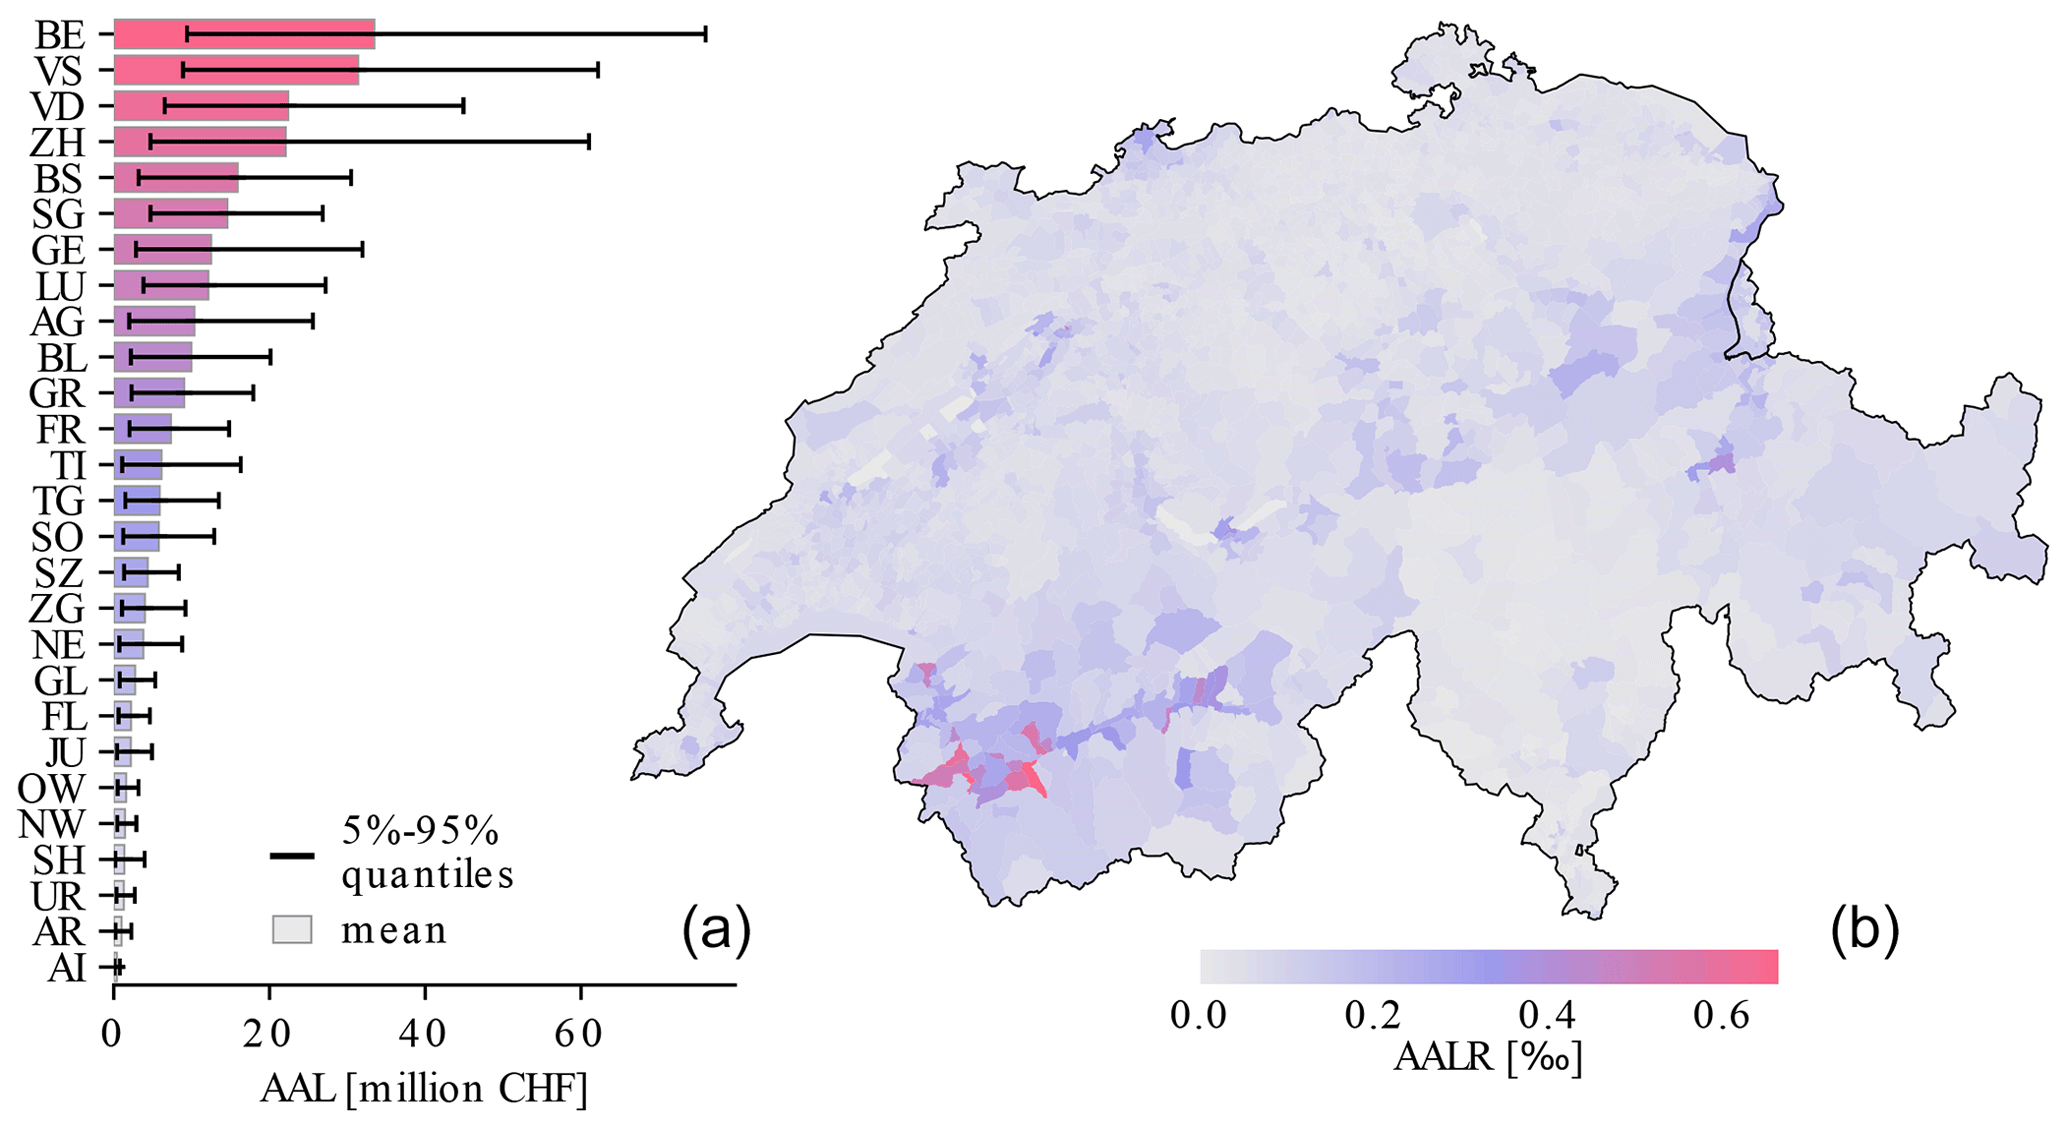
Figure 10Structural–nonstructural AAL by canton (a) and AALR by municipality (b).
To assess the earthquake risk over a spatially distributed exposure, a so-called event-based approach is required that starts with the generation of stochastic earthquake catalogues. Usually this is followed by the simulation of associated random ground motion fields for each generated earthquake rupture. The simulated ground motion intensity values at each site are then passed on to the vulnerability functions associated with the building typologies at each site. The asset-specific losses are then sampled and added to compute the total loss for the given earthquake. Finally, the sample of loss estimates is then used to obtain standard risk metrics, such as average annual losses (AAL) and probable maximum loss (PML; herein defined as loss versus the return period of exceedance) curves.
All calculations are carried out using the open-source OpenQuake Engine v3.14 (Pagani et al., 2014) developed by the GEM foundation. For each of the 24 MIM logic tree branches, 20 000 1-year-long stochastic earthquake catalogues were generated, while 10 000 1-year-long catalogues were simulated for each of the 400 SAM logic tree sampled branches. In total, this resulted in 4.48 million 1-year-long stochastic catalogues, a number that was deemed sufficient to achieve acceptable convergence for the quantities of interest.
Table 4Comparison of ERM-CH23 AAL estimates with those of other models.
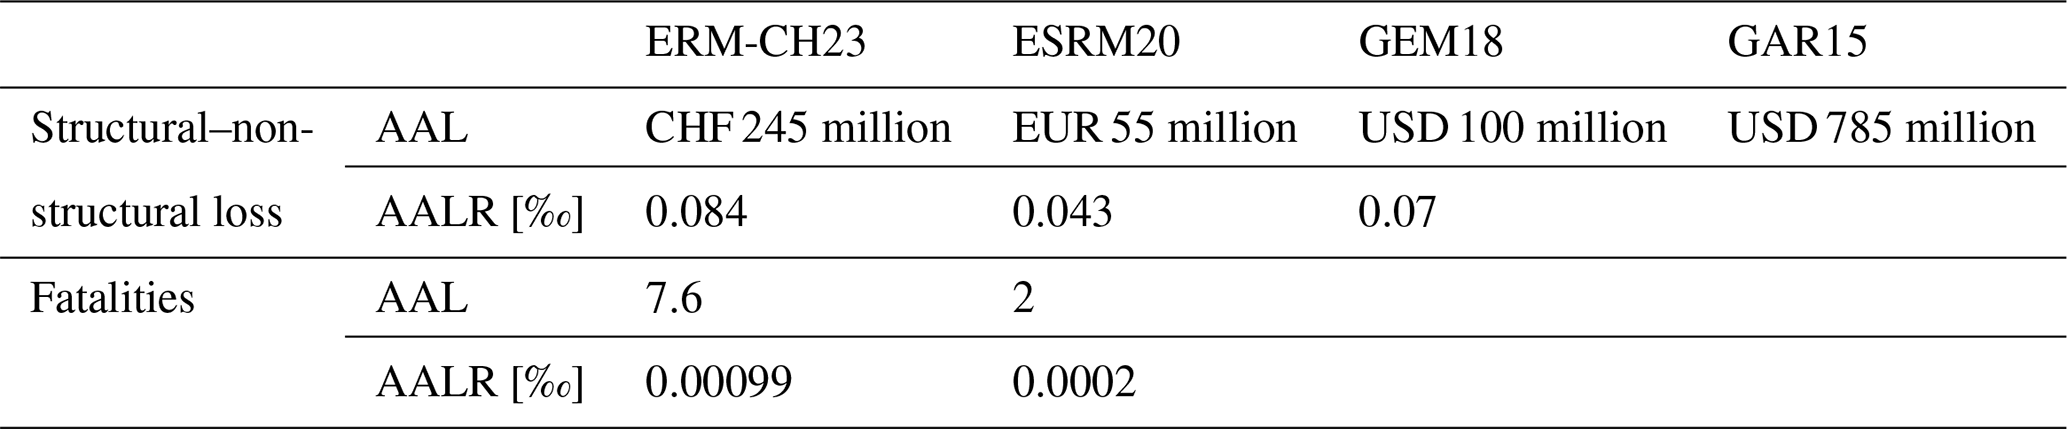
Figure 7 presents the obtained AAL (epistemic) distributions for four of the five loss types that were considered, while Fig. 8 shows the obtained PML curves for structural–nonstructural economic loss and fatalities. ERM-CH23 predicts a direct economic AAL of CHF 245 million (or 0.084 ‰ of the total value) from structural–nonstructural components, plus another CHF 28 million (or 0.033 ‰ of the total value) from contents. This annual economic loss amounts to about 0.03 %–0.04 % of Switzerland's gross domestic product (GDP). The AAL for fatalities, injuries, and displaced population is estimated to be 7.6, 59.5, and 1079.7, respectively. Structural–nonstructural losses of around CHF 10 billion and about 300 fatalities are expected to be exceeded every 200 years on average. Likewise, for a 1000 year return period of exceedance, the loss estimates are assessed at around CHF 37 billion and close to 1700 fatalities.
Of course, as shown in both Figs. 7 and 8, there is non-negligible dispersion around the mean estimates reported above, which reflects the large uncertainties in many parts of the model. The main driver of the epistemic uncertainty is the modelling of ground shaking as indicated by the tornado diagrams (Porter et al., 2002) in Fig. 9, an observation that is in line with previous studies (e.g. Field et al., 2020). For structural–nonstructural AAL, the choice of IPE/GMM leads to a ∼ 5-fold difference, whereas for fatality AAL the difference is ∼ 4-fold for IPEs and 35-fold for GMMs. Important differences are also observed between the two submodels, MIM and SAM, especially for fatalities, as also seen in Fig. 7. These large differences in estimated fatalities are attributed to a combination of factors. Fatalities are primarily driven by structural collapses, therefore differences in the least-well-constrained parts of the ground motion and fragility models (i.e. ground motion and intensity amplitudes at short source-to-site distances, collapse fragility functions) manifest in divergent estimates, which reflect the large uncertainty in the estimation of human losses. Lastly, the building mapping scheme and site amplification uncertainties explain a smaller part of the total uncertainty around the country-wide AAL. That said, note that even the latter two sources of epistemic uncertainty might lead to significant differences at local scales (see Wiemer et al., 2023), making their inclusion in the model very important.
Across the country, the highest AAL estimates are naturally found in areas that combine a high concentration of exposure with elevated seismic hazard. The first panel in Fig. 10 shows the breakdown of structural–nonstructural AAL across the Swiss cantons. Overall, populous cantons such as those of Bern (BE), Zurich (ZH), and Vaud (VD) feature some of the highest AAL estimates (largely) due to their large building stock. High AAL estimates are also found for cantons such as Basel (BS) and Valais (VS) that combine higher seismic hazard with decently sized exposure. The second panel of Fig. 10 presents the spatial distribution of the AAL ratio (AALR) by municipality. Here, we see that when losses are normalized by the total replacement cost, the spatial pattern tracks the pattern of seismic hazard (on soil conditions). Indeed, municipalities in the south-western canton of Valais stand out, as a result of the increased seismicity rates and high site amplification along the valley where most cities are located.
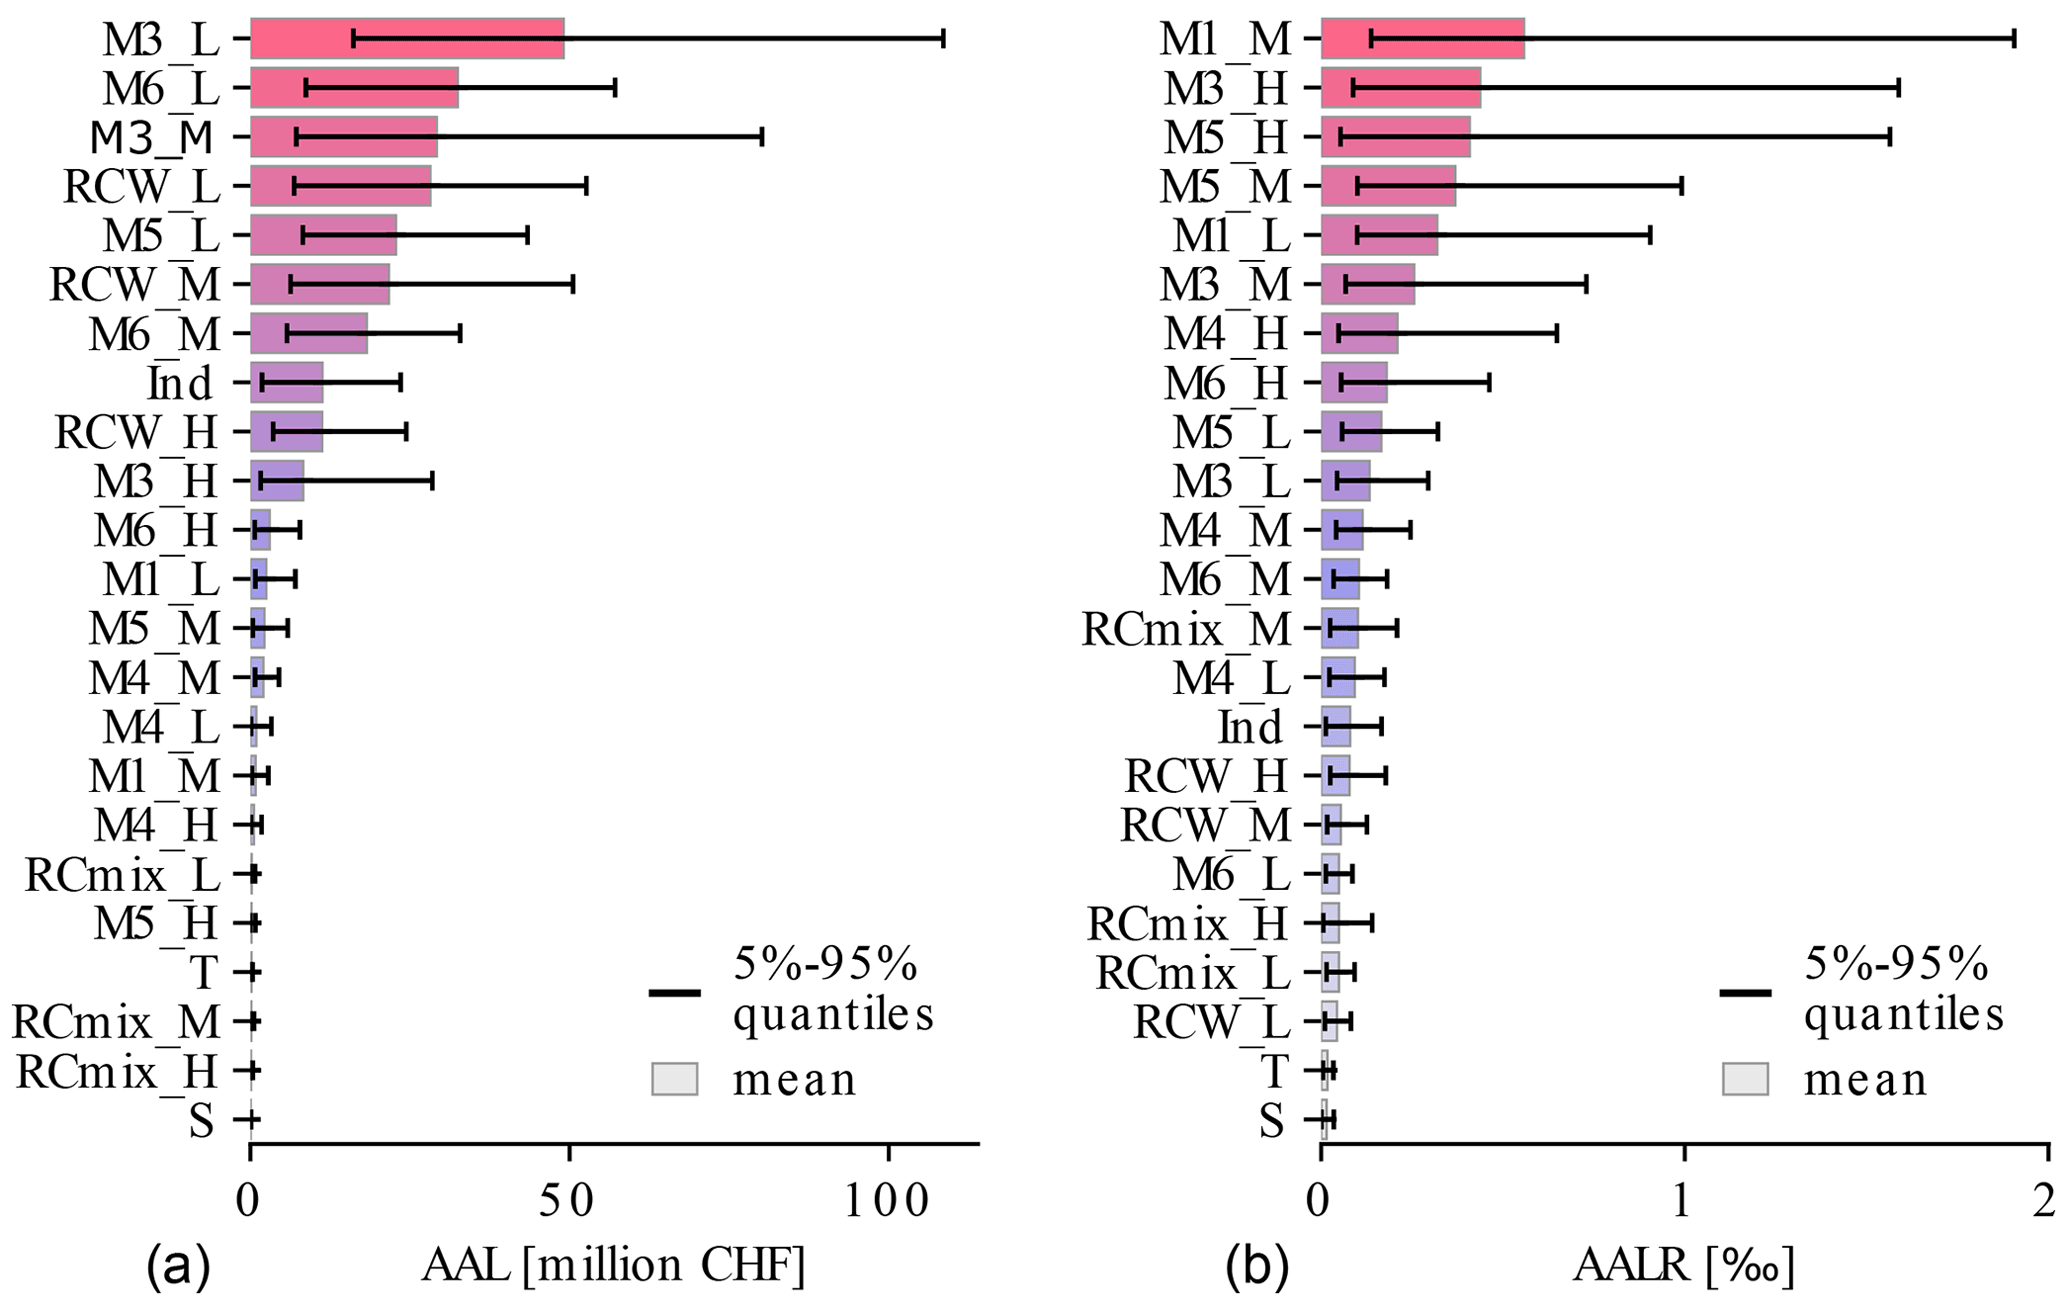
Figure 11 compares the structural–nonstructural AAL and AALR obtained for different structural typologies. Overall, M1, M3, and M5 typologies and especially the mid- and high-rise variations display the largest AALR. However, the largest contributions towards the total country-wide AAL come from the M3_L, M6_L, M3_M, and RCW_L classes. This reflects the combination of their frequency within the exposure model and their relative vulnerability.
The risk view provided by ERM-CH23 offers a basis for earthquake risk management in Switzerland. That said, there are several dimensions of earthquake risk that ERM-CH23 does not cover in its first iteration. Earthquake losses quantified by the model refer solely to building stock loss induced by direct physical damage caused by ground shaking. Damage to infrastructure services (water, wastewater, energy, telecommunications, transport, etc.) and secondary effects (Daniell et al., 2017) from soil liquefaction, landslides, lake tsunamis, fire following the event, or triggered technological accidents (Na-Tech) are not modelled. Indirect losses such as those incurred from business interruption are also not estimated nor are possible demand surge effects due to scarcity of human and material resources and overall disruption of supply chains.
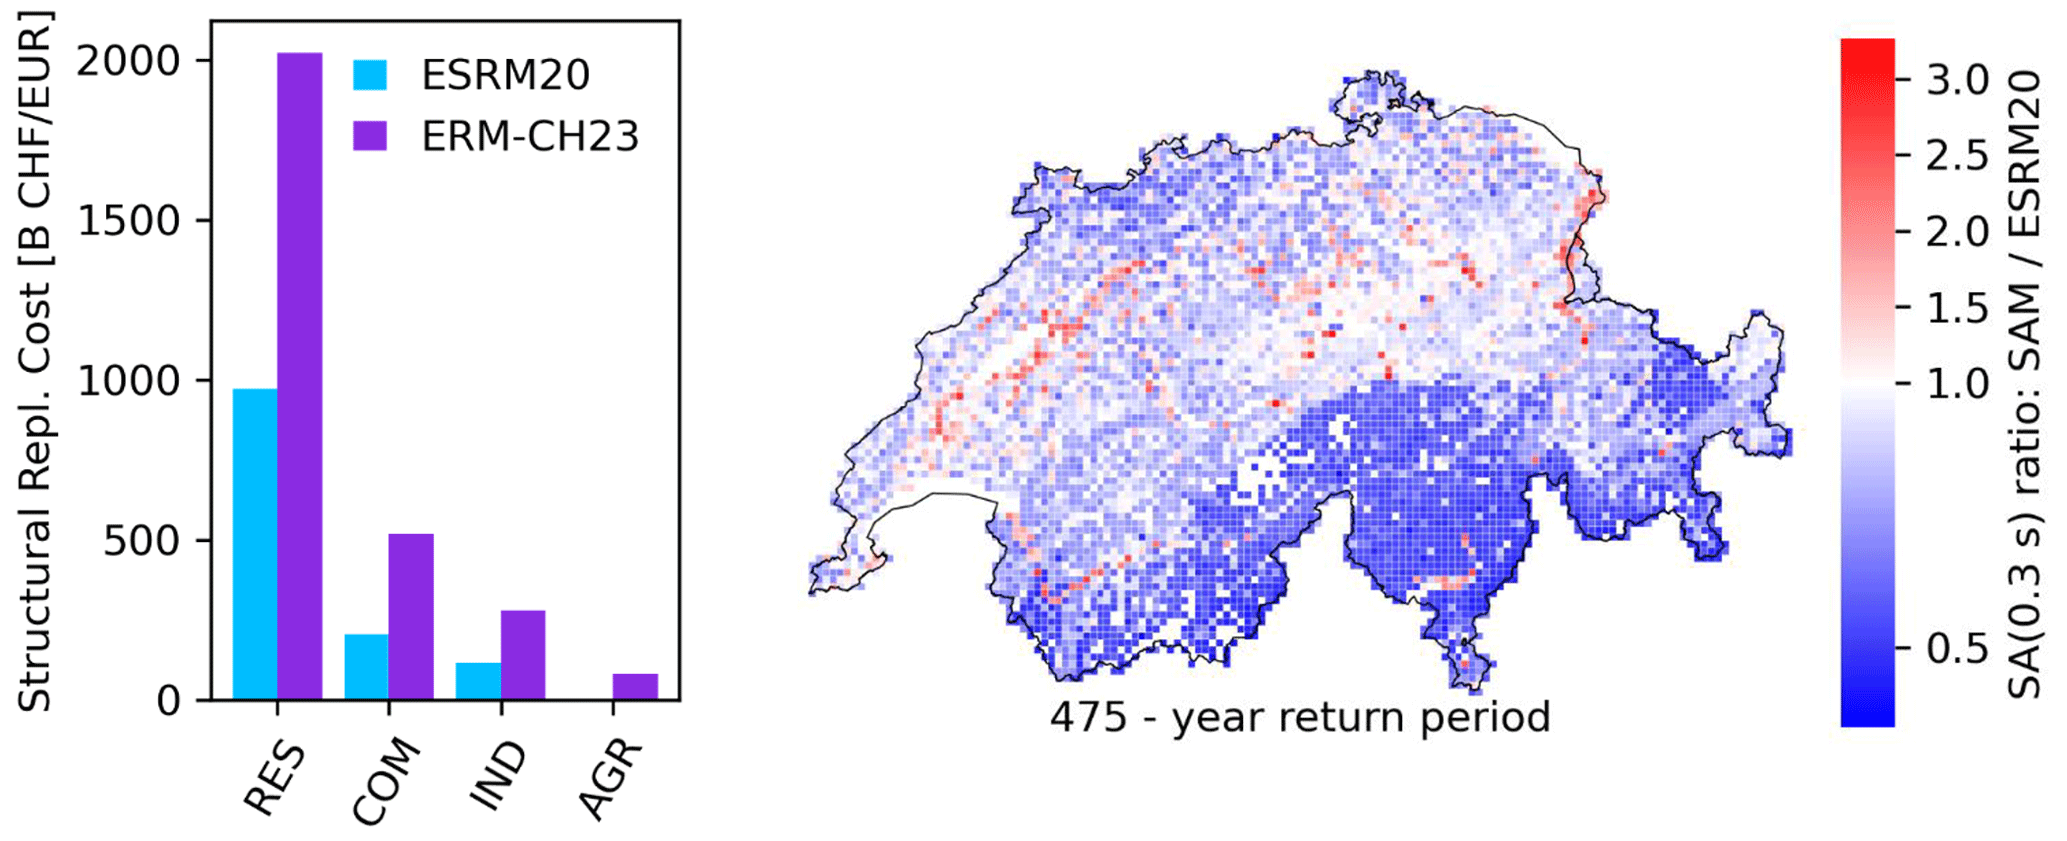
Figure 13Comparison of total structural replacement cost between ESRM20 and ERM-CH23 (left) and the ratio of 475-year Sa(0.3 s) values on soil predicted by the SAM component of ERM-CH23 and ESRM20 across Switzerland.
An important hurdle for modelling risk in areas of low and moderate seismicity is the lack of historical data for model calibration and validation. Lacking past damage observations, validation was based on subjecting the individual components, as well as the overall model, to sanity checks and verification exercises. Damage and loss analyses were carried out for a wide range of earthquake scenarios. The spatial pattern of modelled ground motion and damage from small and large earthquakes was qualitatively assessed and contrasted with other models and observations. The relative vulnerability of the considered building classes was also subjected to scrutiny, and we made sure that it matches engineering expectations reasonably well. The development of the model was followed by a panel of independent experts to ensure that it conforms with current state-of-the-art practices, while the finalized model was presented and received peer-review by a second independent-expert panel.
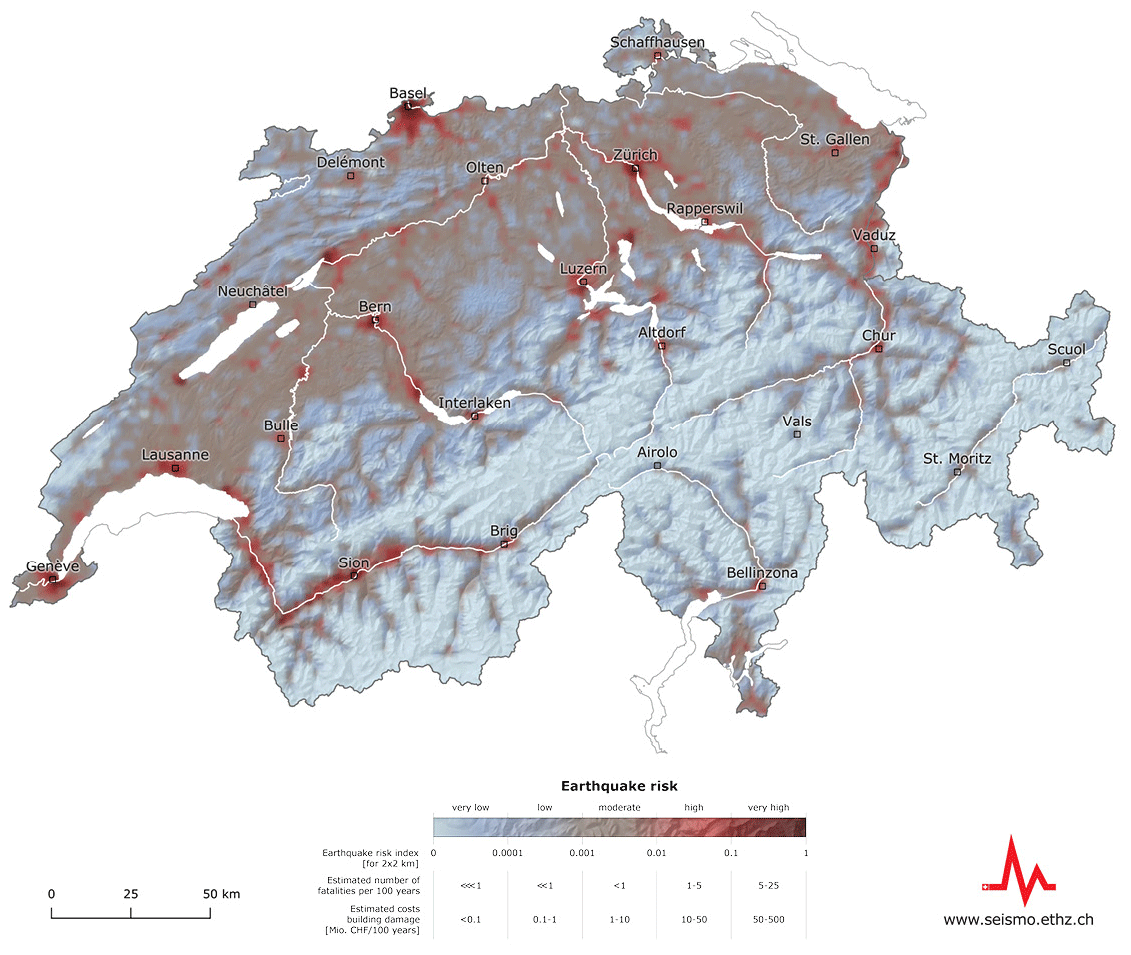
Figure 14The earthquake risk map of Switzerland. Mio. CHF/100 years in the legend indicates millions of Swiss francs per 100 years.
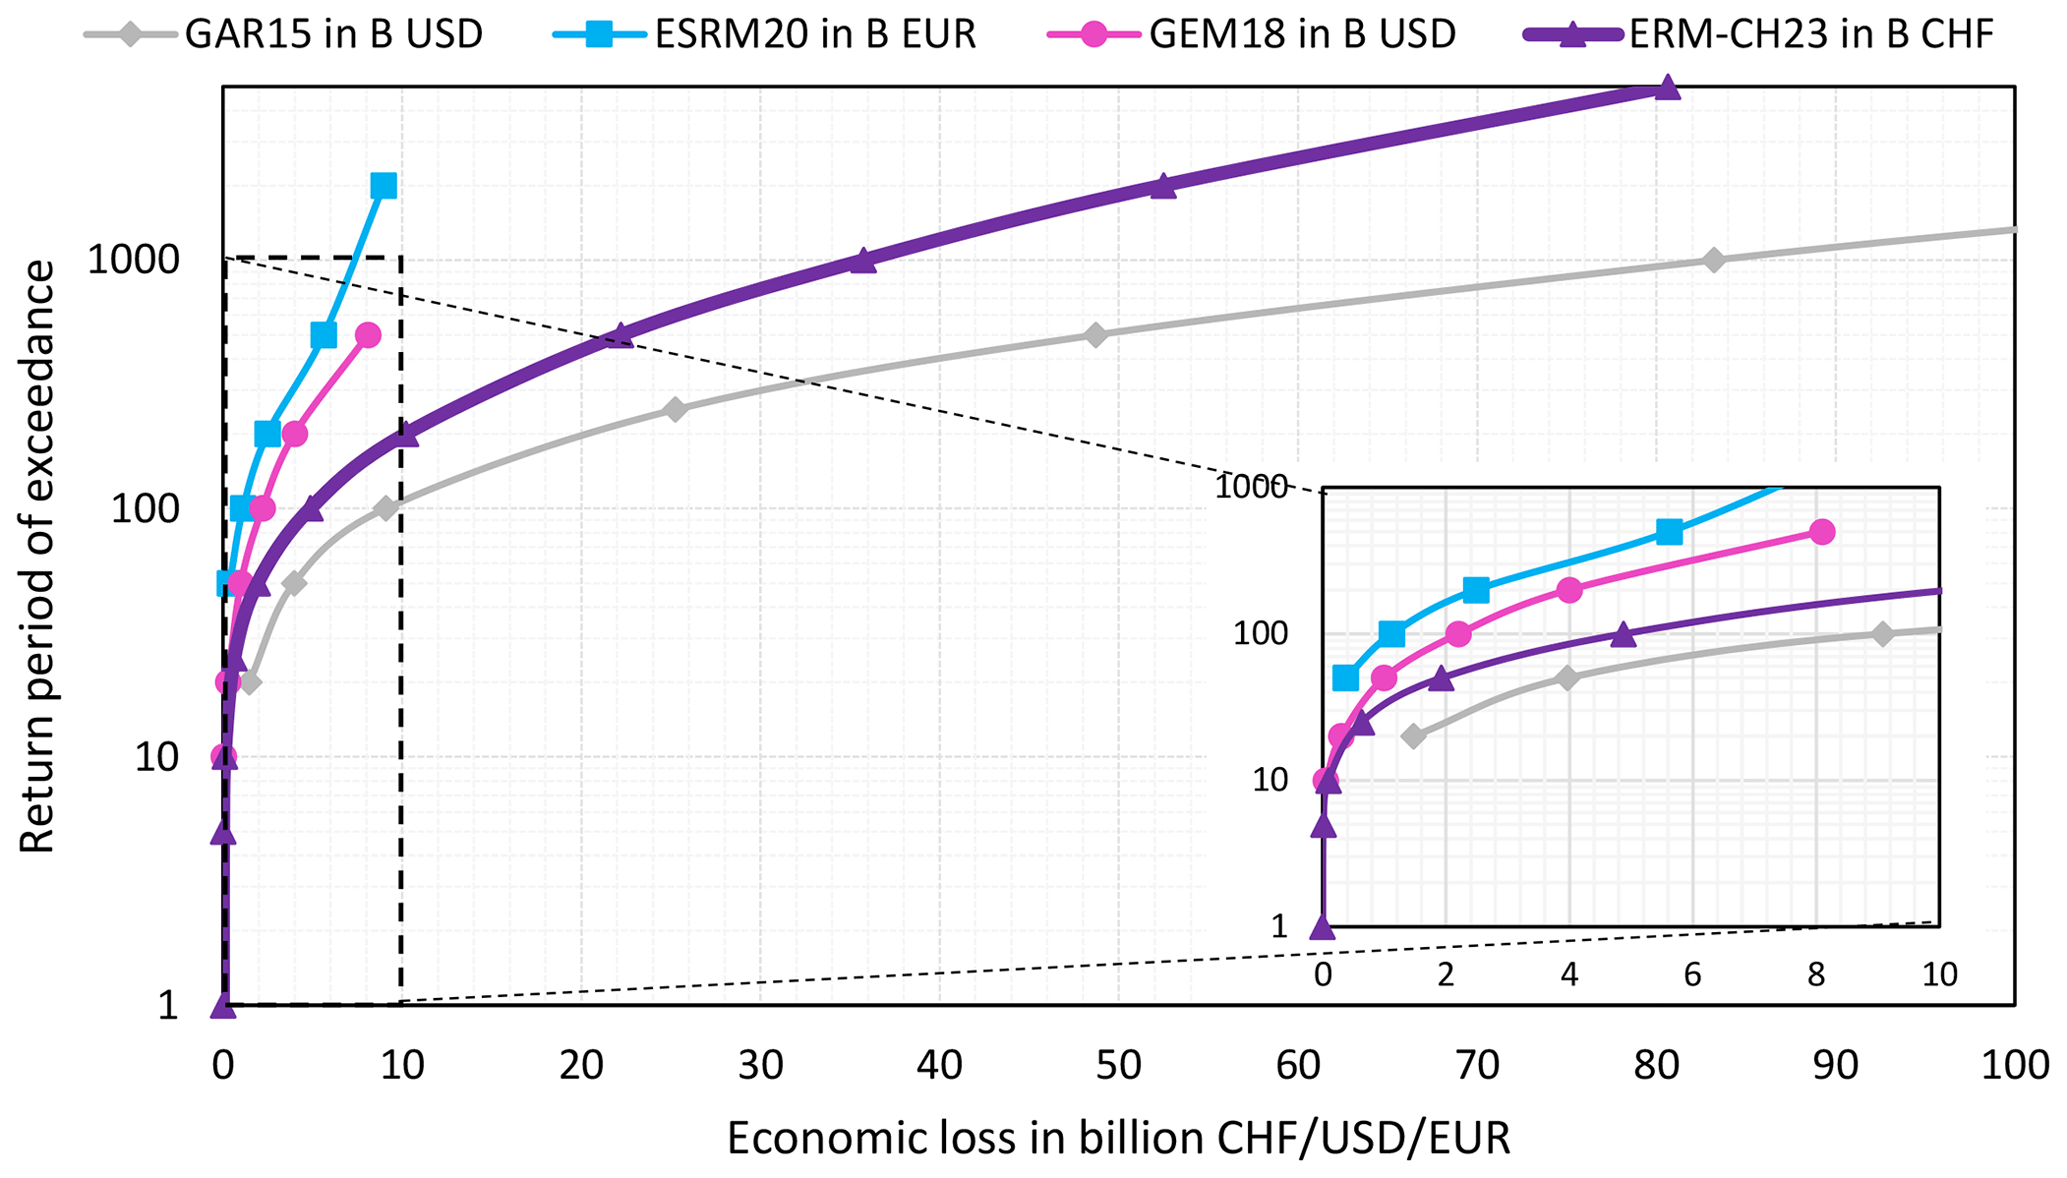
Lastly, comparisons with the recent European Seismic Risk Model (ESRM20; Crowley et al., 2021), GEM's 2018 Global Risk Model (Silva et al., 2020b), and the 2015 Global Assessment Report (GAR; Cardona et al., 2014) were conducted to place our results among other estimates and understand the reasons for any deviations. Table 4 compares AAL estimates between the aforementioned models and ERM-CH23, while Fig. 12 contrasts their reported PML curves. GAR15, which is the least detailed model of the four, yields the higher loss estimates with a frequency that seems generally on the high side. ESRM20 and GEM18 on the other hand predict significantly lower losses compared to ERM-CH23. The difference is smaller when looking at AALR, which indicates a large difference in the total exposure value considered between the models. This was found to indeed be the case, as illustrated in Fig. 13. This difference can explain about half the discrepancy in ESRM20 and the most part of the discrepancy in GEM18. ERM-CH23 uses a near-complete database of building objects within the country, whereas the assessment of replacement costs is informed by cantonal insurance sources, which lends credibility to the modelling.
A second noteworthy observation is the increased granularity of the site amplification modelling in ERM-CH23. Comparisons with ESRM20 indicated a higher range of site amplification factors in ERM-CH23. This meant higher site amplification in several areas with soft-soil deposits (usually around lakes and rivers, where many cities and settlements are located) and lower in mountainous areas with scarce exposure (Fig. 13). This can explain further differences between ESRM20 and ERM-CH23. Of course, pinpointing the exact factors behind model differences is challenging, since all these models employ very different ground motion, exposure, and vulnerability components.
A dedicated communication concept was needed to bring the insights of the first publicly available earthquake risk model to our different target audiences (Bentele and Nothhaft, 2007). This communication concept consisted of (Wiemer et al., 2023): (i) a SWOT (strengths, weaknesses, opportunities, and threats) analysis to identify the strengths, weaknesses, opportunities, and threats; (ii) a definition of the target audiences; iii) a list of the communication goals and key messages; (iv) a description of the communication products; (v) planning of the (release) events; and (vi) a strategy for user testing.
Based on the target audience's needs, we developed various products. Some of them support decision-making for earthquake preparedness and response (e.g. scenarios and rapid impact assessments) and others inform us about the seismic risk model and its results (e.g. flyers, posters, explainer videos, technical reports). A key product is the earthquake risk map depicting an index that combines the expected number of fatalities with the estimated financial losses due to building damage (Fig. 14). Further, we developed an earthquake risk tool that allows interested people to determine by approximation their personal earthquake risk. The assessment of the personal earthquake risk is based on three factors at the indicated location: the earthquake hazard, the local amplification, and the vulnerability of a building depending on the number of storeys and construction period. All products are available on the SED website in the three national languages of Switzerland and in English (see http://seismo.ethz.ch, last access: 17 September 2024).
To design these user-centred products, testing was indispensable (Dallo et al., 2022; Marti et al., 2019). We thus followed a transdisciplinary approach since we – an interdisciplinary group consisting of model developers, IT specialists, and communication experts – co-developed the products and tested them with the target audiences. We first conducted interviews with international experts to learn from best practices and already-operational seismic risk services (e.g. Pager; Dryhurst et al., 2021). Second, we organized workshops with professional stakeholders (e.g. cantonal authorities, civil protection) to assess their information and application needs and to further develop the prototypes based on their feedback (Marti et al., 2023). Third, we conducted two public surveys to evaluate which rapid impact assessments, scenarios, and risk maps are correctly interpreted, perceived as useful, and preferred (Dallo et al., 2023; Marti et al., 2023; Dallo et al., 2024a). For the product design, we further benefitted from our experiences of the release of the first European Seismic Risk Model (ESRM2020; Dallo et al., 2024b).
This study summarized the development of the first Earthquake Risk Model of Switzerland, ERM-CH23, and provided key results. ERM-CH23 represents an important milestone in advancing the understanding of earthquake risk in the country. Estimates of the size and spatial pattern of earthquake risk in Switzerland were previously lacking in the public domain and inferences had to be made, relying solely on hazard information. By filling this gap, our hope is that ERM-CH23 will encourage evidence-based decision-making by public authorities and other stakeholders, in efforts towards risk mitigation and disaster resilience. Further downstream products of the ERM-CH23 project are also expected to underpin disaster preparedness and response. A rapid impact assessment service has also been devised, using the ERM-CH23 framework to produce near-real-time estimates of damage and loss after the occurrence of earthquakes. This system will use ground motion footprints updated with station recordings, as implemented in the Swiss ShakeMap service (Cauzzi et al., 2015). In the future, the National Earthquake Risk Model of Switzerland should be periodically updated and improved, incorporating the latest science and datasets. Extensions to cover secondary perils, indirect losses, and infrastructure should also be planned to enable a holistic view of earthquake risk.
The probabilistic seismic risk analysis for ERM-CH23 was carried out using the OpenQuake Engine (https://www.globalquakemodel.org/product/openquake-engine, Silva et al., 2014; Pagani et al., 2014). The code repository is the following: https://github.com/gem/oq-engine/ (Global Earthquake Model Foundation, 2024).
The results, background information, various maps, and most of the underlying data of the earthquake risk model of Switzerland are publicly available and may be used in accordance with the copyright information and licence agreements. The CC BY licence applies to all data and materials relating to the earthquake risk model of Switzerland. Further information can be found at http://www.seismo.ethz.ch/en/knowledge/earthquake-hazard-and-risk/earthquake-risk-switzerland/Earthquake-Risk-Model/ (last access: 19 September 2024).
The supplement related to this article is available online at: https://doi.org/10.5194/nhess-24-3561-2024-supplement.
Conceptualization: ANP, DF, MM, LD, BD, PL, and SW. Data curation: ANP, FP, BD, LD, and AK. Formal analysis: ANP, FP, PB, DF, OO, LD, BD, and AK,. Funding acquisition: SW, DF, PR, FH, and BD. Methodology: ANP, FP, PB, DF, MM, ID, OO, EF, CC, AK, PL, LD, and BD. Project administration: PR, DF, NV, MM, FH, and SW. Resources: SW, MM, ID, PR, NS, PK, and LD. Software: ANP, CC, NS, PK, and LD. Supervision: SW, ANP, DF, PB, PR, LD, and PL. Validation: ANP, DF, CC, PR, LD, and BD. Visualization: ANP. Writing: ANP, NV, and ID. Writing – review and editing: ANP, FP, PB, DF, CC, and PR.
The contact author has declared that none of the authors has any competing interests.
Publisher’s note: Copernicus Publications remains neutral with regard to jurisdictional claims made in the text, published maps, institutional affiliations, or any other geographical representation in this paper. While Copernicus Publications makes every effort to include appropriate place names, the final responsibility lies with the authors.
This article is part of the special issue “Harmonized seismic hazard and risk assessment for Europe”. It is not associated with a conference.
The development of the ERM-CH23 model was co-funded by ETH Zurich (contract ID 19203), the Federal Office for Civil Protection (FOCP; contract no. 353007634), and the Federal Office for the Environment (FOEN; contract no. 16.0115.PJ/Q114–1464). The development of communication products also benefitted from partial funding from the European Union Horizon 2020 research and innovation programme “Real-time earthquake rIsk reduction for a reSilient Europe (RISE)” (http://www.rise-eu.org, last access: 17 September 2024), grant no. 821115.
This research has been supported by the Bundesamt für Umwelt (grant no. 16.0115.PJ/Q114-1464) and the Horizon 2020 (“Real-time earthquake rIsk reduction for a reSilient Europe (RISE)”, project no. 821115).
This paper was edited by Paolo Tarolli and reviewed by two anonymous referees.
Akkar, S. and Bommer, J. J.: Empirical equations for the prediction of PGA, PGV, and spectral accelerations in Europe, the mediterranean region, and the Middle East, Seismol. Res. Lett., 81, 195–206, https://doi.org/10.1785/gssrl.81.2.195, 2010.
ARCADIS: International Construction Costs, https://www.arcadis.com/-/media/project/arcadiscom/com/perspectives/asia/publications/other-research-and-publications/international-construction-cost-2019.pdf (last access: 19 September 2024), 2019.
Avila, L., Vasconcelos, G., Lourenço, P. B., Mendes, N., and Alves, P.: Seismic response analysis of concrete block masonry buildings: An experimental study using shaking table, 15th World Conf. Earthq. Eng., 2012.
Baumont, D., Manchuel, K., Traversa, P., Durouchoux, C., Nayman, E., and Ameri, G.: Intensity predictive attenuation models calibrated in Mw for metropolitan France, Bull. Earthq. Eng., 16, 2285–2310, https://doi.org/10.1007/s10518-018-0344-6, 2018.
Bentele, G. and Nothhaft, H.: Konzeption von Kommunikationsprogrammen, in: Handbuch Unternehmenskommunikation, Gabler Verlag, Wiesbaden, 357–380, https://doi.org/10.1007/978-3-8349-9164-5_18, 2007.
Bergamo, P., Fäh, D., Panzera, F., Cauzzi, C. V., Glueer, F., Perron, V., and Wiemer, S.: A site amplification model for Switzerland based on site condition indicators and incorporating local response as measured at seismic stations, Bull Earthq. Eng., 21, 5831–5865, https://doi.org/10.1007/s10518-023-01766-z, 2023.
Bernardini, A., Lagomarsino, S., Mannella, A., Martinelli, A., Milano, L., Parodi, S., and Troffaes, M.: Forecasting seismic damage scenarios of residential buildings from rough inventories: a case study in the Abruzzo Region (Italy), Proc. Inst. Mech. Eng., 4, 279–296, https://doi.org/10.1243/1748006XJRR305, 2010.
Bindi, D., Parolai, S., Oth, A., Abdrakhmatov, K., Muraliev, A., and Zschau, J.: Intensity prediction equations for Central Asia, Geophys. J. Int., 187, 327–337, https://doi.org/10.1111/j.1365-246X.2011.05142.x, 2011.
Bommer, J. J. and Crowley, H.: The Purpose and Definition of the Minimum Magnitude Limit in PSHA Calculations, Seismol. Res. Lett., 88, 1097–1106, https://doi.org/10.1785/0220170015, 2017.
Cardona, O. D., Ordaz, M. G., Mora, M. G., Salgado-Gálvez, M. A., Bernal, G. A., Zuloaga-Romero, D., Marulanda Fraume, M. C., Yamín, L., and González, D.: Global risk assessment: A fully probabilistic seismic and tropical cyclone wind risk assessment, Int. J. Disaster Risk Reduct., 10, 461–476, https://doi.org/10.1016/j.ijdrr.2014.05.006, 2014.
Cardone, D.: Fragility curves and loss functions for RC structural components with smooth rebars, Earthq. Struct., 10, 1181–1212, https://doi.org/10.12989/eas.2016.10.5.1181, 2016.
Cardone, D. and Perrone, G.: Developing fragility curves and loss functions for masonry infill walls, Earthquakes Struct., 9, 257–279, https://doi.org/10.12989/eas.2015.9.1.000, 2015.
Cauzzi, C. and Faccioli, E.: Broadband (0.05 to 20 s) prediction of displacement response spectra based on worldwide digital records, J. Seismol., 12, 453–475, https://doi.org/10.1007/s10950-008-9098-y, 2008.
Cauzzi, C., Edwards, B., Fäh, D., Clinton, J., Wiemer, S., Kästli, P., Cua, G., and Giardini, D.: New predictive equations and site amplification estimates for the next-generation Swiss ShakeMaps, Geophys. J. Int., 200, 421–438, https://doi.org/10.1093/gji/ggu404, 2015.
Chiou, B.-J. and Youngs, R. R.: An NGA Model for the Average Horizontal Component of Peak Ground Motion and Response Spectra, Earthq. Spectra, 24, 173–215, https://doi.org/10.1193/1.2894832, 2008.
Comune di Milano and Regione Lombardia: Public Works Pricelist, Prezzario regionale delle opere pubbliche, edizione 2021, Volume 1.1, Milano, https://www.regione.lombardia.it/wps/wcm/connect/27c2798c-b12b-490a-8499-1bdbb8e6e76b/Prezzario+2021.zip?MOD=AJP ERES&CACHEID=ROOTWORKSPACE-27c2798c-b12b-490a-8499-1bdbb8e6e76b-oUug6Ea (last access: 19 September 2024), 2021.
Crowley, H., Dabbeek, J., Despotaki, V., Rodrigues, D., Martins, L., Silva, V., Romao, X., Pereira, N., Weatherill, G., and Danciu, L.: European Seismic Risk Model (ESRM20), https://doi.org/10.7414/EUC-EFEHR-TR002-ESRM20, 2021.
Dallo, I., Stauffacher, M., and Marti, M.: Actionable and understandable? Evidence-based recommendations for the design of (multi-)hazard warning messages, Int. J. Disaster Risk Reduct., 74, https://doi.org/10.1016/j.ijdrr.2022.102917, 2022.
Dallo, I., Schnegg, L. N., and Marti, M.: The design of user-centred seismic risk maps – the Swiss case, EGU General Assembly 2023, Vienna, Austria, 24–28 April 2023, EGU23-3241, https://doi.org/10.5194/egusphere-egu23-3241, 2023.
Dallo, I., Schnegg, L. N., and Marti, M, Fulda, D., Papadopoulos, A. N., Roth, P., Danciu, L., Valenzuela, N., Wenk, S. R., Bergamo, P., Haslinger, F., Fäh, D., Kästli, P., and Wiemer, S.: Designing understandable, action-oriented, and well-perceived earthquake risk maps – The Swiss case study, Front. Commun., 8, 1306104, https://doi.org/10.3389/fcomm.2023.1306104, 2024a.
Dallo, I., Marti, M., Valenzuela, N., Crowley, H., Dabbeek, J., Danciu, L., Zaugg, S., Cotton, F., Giardini, D., Pinho, R., Schneider, J. F., Beauval, C., Correia, A. A., Ktenidou, O.-J., Mäntyniemi, P., Pagani, M., Silva, V., Weatherill, G., and Wiemer, S.: The communication strategy for the release of the first European Seismic Risk Model and the updated European Seismic Hazard Model, Nat. Hazards Earth Syst. Sci., 24, 291–307, https://doi.org/10.5194/nhess-24-291-2024, 2024b.
Daniell, J. E., Schaefer, A. M., and Wenzel, F.: Losses associated with secondary effects in earthquakes, Front. Built Environ., 3, 1–14, https://doi.org/10.3389/fbuil.2017.00030, 2017.
Diana, L., Thiriot, J., Reuland, Y., and Lestuzzi, P.: Application of Association Rules to Determine Building Typological Classes for Seismic Damage Predictions at Regional Scale: The Case Study of Basel, Front. Built Environ., 19, 2999–3032, https://doi.org/10.3389/fbuil.2019.00051, 2019.
Di Ludovico, M., Prota, A., Moroni, C., Manfredi, G., and Dolce, M.: Reconstruction process of damaged residential buildings outside historical centres after the L’Aquila earthquake: part I-“light damage” reconstruction, Bull. Earthq. Eng., 15, 667–692, https://doi.org/10.1007/s10518-016-9877-8, 2017a.
Di Ludovico, M., Prota, A., Moroni, C., Manfredi, G., and Dolce, M.: Reconstruction process of damaged residential buildings outside historical centres after the L’Aquila earthquake: part II—“heavy damage” reconstruction, Bull. Earthq. Eng., 15, 693–729, https://doi.org/10.1007/s10518-016-9979-3, 2017b.
Dolce, M., Prota, A., Borzi, B., da Porto, F., Lagomarsino, S., Magenes, G., Moroni, C., Penna, A., Polese, M., Speranza, E., Verderame, G. M., and Zuccaro, G.: Seismic risk assessment of residential buildings in Italy, Springer Netherlands, 2999–3032, https://doi.org/10.1007/s10518-020-01009-5, 2021.
Dryhurst, S., Luoni, G., Dallo, I., Freeman, A. L. J., and Marti, M.: Designing & implementing the seismic portion of dynamic risk communication for long-term risks, variable short-term risks, early warnings (Society: Data Gathering and Information Sharing with the Public and Policy-Makers) [Deliverable], European Horizon-2020 project RISE, http://static.seismo.ethz.ch/rise/deliverables/Deliverable_5.3.pdf (last access: 17 September 2024), 92, 948, 2021.
Edwards, B. and Fäh, D.: A Stochastic ground-motion model for Switzerland, Bull. Seismol. Soc. Am., 103, 78–98, https://doi.org/10.1785/0120110331, 2013.
Edwards, B., Michel, C., Poggi, V., and Fäh, D.: Determination of site amplification from regional seismicity: Application to the Swiss national seismic networks, Seismol. Res. Lett., 84, 611–621, https://doi.org/10.1785/0220120176, 2013.
Edwards, B., Cauzzi, C., Danciu, L., and Fäh, D.: Region-Specific Assessment, Adjustment, and Weighting of Ground-Motion Prediction Models: Application to the 2015 Swiss Seismic-Hazard Maps, Bull. Seismol. Soc. Am., 106, 1840–1857, https://doi.org/10.1785/0120150367, 2016.
Faenza, L. and Michelini, A.: Regression analysis of MCS intensity and ground motion parameters in Italy and its application in ShakeMap, Geophys. J. Int., 180, 1138–1152, https://doi.org/10.1111/j.1365-246X.2009.04467.x, 2010.
Faenza, L. and Michelini, A.: Regression analysis of MCS intensity and ground motion spectral accelerations (SAs) in Italy, Geophys. J. Int., 186, 1415–1430, https://doi.org/10.1111/j.1365-246X.2011.05125.x, 2011.
Fäh, D., Gisler, M., Jaggi, B., Kästli, P., Lutz, T., Masciadri, V., Matt, C., Mayer-Rosa, D., Rippmann, D., Schwarz-Zanetti, G., Tauber, J., and Wenk, T.: The 1356 Basel earthquake: An interdisciplinary revision, Geophys. J. Int., 178, 351–374, https://doi.org/10.1111/j.1365-246X.2009.04130.x, 2009.
Fäh, D., Giardini, D., Kästli, P., Deichmann, N., Gisler, M., Schwarz-Zanetti, G., Alvarez-Rubio, S., Sellami, S., Edwards, B., and Allmann, B.: ECOS-09 earthquake catalogue of Switzerland release 2011 report and database, Public catalogue, http://ecos09.seismo.ethz.ch/index.html (last access: 19 September 2024), 17 April 2011, 1–42, 2011.
Federal Emergency Management Agency (FEMA): Seismic Performance Assessment of Buildings, Washington, D.C., https://www.atcouncil.org/files/FEMAP-58-1_Volume 1_Methodology.pdf (last access: 19 September 2024), 2018.
FEMA: Multi-hazard Loss Estimation Methodology Earthquake Model Hazus®-MH MR5: Technical Manual, Washington, D.C., 2010.
Field, E. H., Milner, K. R., and Porter, K. A.: Assessing the value of removing earthquake-hazard-related epistemic uncertainties, exemplified using average annual loss in California, Earthq. Spectra, 36, 1912–1929, https://doi.org/10.1177/8755293020926185, 2020.
FOCP: National risk analysis report. Disasters and Emergencies in Switzerland 2020, Bern, 60 pp., Federal Office for Civil Protection (FOCP), Guisanplatz 1B, 3003 Bern, https://backend.babs.admin.ch/fileservice/sdweb-docs-prod-babsch-files/files/2023/12/12/d52f064d-45d9-423a-9138-7c9a9b50df2d.pdf (last access: 19 September 2024), 2020.
FOEN: Earthquake Risk Model Switzerland (ERM-CH) – Subproject F, Database of building objects – Deliverable DB4, report. SPG-SPD-0015, 2021.
Fritsche, S. and Fäh, D.: The 1946 magnitude 6.1 earthquake in the Valais: site-effects as contributor to the damage, Swiss J. Geosci., 102, 423, https://doi.org/10.1007/s00015-009-1340-2, 2009.
Fritsche, S., Fäh, D., Gisler, M., and Giardini, D.: Reconstructing the damage field of the 1855 earthquake in Switzerland: Historical investigations on a well-documented event, Geophys. J. Int., 166, 719–731, https://doi.org/10.1111/j.1365-246X.2006.02994.x, 2006.
Global Earthquake Model Foundation: OpenQuake Engine, GitHub [code], https://github.com/gem/oq-engine/, last access: 13 October 2024.
Grünthal, G.: European Macroseismic Scale 1998 (EMS-98), Luxembourg, Centre Européen de Géodynamique et de Séismologie, ISBN 2-87977-008-4, 1998.
Hengl, T., Heuvelink, G. B. M., and Rossiter, D. G.: About regression-kriging: From equations to case studies, Comput. Geosci., 33, 1301–1315, https://doi.org/10.1016/j.cageo.2007.05.001, 2007.
Hobbs, T. E., Journeay, J. M., Rao, A. S., Kolaj, M., Martins, L., LeSueur, P., Simionato, M., Silva, V., Pagani, M., Johnson, K., Rotheram, D., and Chow, W.: A national seismic risk model for Canada: Methodology and scientific basis, Earthq. Spectra, 39, 1410–1434, https://doi.org/10.1177/87552930231173446, 2023.
Ho, T. K.: The random subspace method for constructing decision forests, IEEE Trans. Pattern Anal. Mach. Intell., 20, 832–844, https://doi.org/10.1109/34.709601, 1998.
Hügli, M., Zischg, A., and Keiler, M.: Modellierung von Gebäudeattributen im Rahmen des Projektes Erdbeben- risikomodell Schweiz – dritte Arbeitsphase, Bericht im Auftrag vom Bundesamt für Umwelt, EXT-TR-0017, 2021.
Jaiswal, K. S., Bausch, D., Chen, R., Bouabid, J., and Seligson, H.: Estimating annualized earthquake losses for the conterminous United States, Earthq. Spectra, 31, S221–S243, https://doi.org/10.1193/010915EQS005M, 2015.
Lagomarsino, S. and Giovinazzi, S.: Macroseismic and mechanical models for the vulnerability and damage assessment of current buildings, Bull. Earthq. Eng., 4, 415–443, https://doi.org/10.1007/s10518-006-9024-z, 2006.
Lagomarsino, S., Cattari, S., and Ottonelli, D.: The heuristic vulnerability model: fragility curves for masonry buildings, Bull. Earthq. Eng., 19, 3129–3163, https://doi.org/10.1007/s10518-021-01063-7, 2021.
Lestuzzi, P., Podestà, S., Luchini, C., Garofano, A., Kazantzidou-Firtinidou, D., Bozzano, C., Bischof, P., Haffter, A., and Rouiller, J. D.: Seismic vulnerability assessment at urban scale for two typical Swiss cities using Risk-UE methodology, Nat. Hazards, 84, 249–269, https://doi.org/10.1007/s11069-016-2420-z, 2016.
Lestuzzi, P., Podestà, S., Luchini, C., Garofano, A., Kazantzidou-Firtinidou, D., and Bozzano, C.: Validation and improvement of Risk-UE LM2 capacity curves for URM buildings with stiff floors and RC shear walls buildings, Bull. Earthq. Eng., 15, 1111–1134, https://doi.org/10.1007/s10518-016-9981-9, 2017.
Liu, L. and Pezeshk, S.: An improvement on the estimation of pseudoresponse spectral velocity using RVT method, Bull. Seismol. Soc. Am., 89, 1384–1389, https://doi.org/10.1785/BSSA0890051384, 1999.
MacQueen, J.: Some methods for classification and analysis of multivariate observations, in: Proceedings of the Fifth Berkeley Symposium on Mathematical Statistics and Probability, Volume 1: Statistics, 1967.
Magenes, G. and Calvi, G. M.: In-plane seismic response of brick masonry walls, Earthq. Eng. Struct. Dyn., 26, 1091–1112, https://doi.org/10.1002/(SICI)1096-9845(199711)26:11<1091::AID-EQE693>3.0.CO;2-6, 1997.
Marques, M., Monteiro, R., and Delgado, R.: An improved model for seismic risk assessment in Portugal, Int. J. Disaster Resil. Built Environ., 9, 70–83, https://doi.org/10.1108/IJDRBE-10-2016-0040, 2018.
Marti, M., Stauffacher, M., and Wiemer, S.: Difficulties in explaining complex issues with maps: Evaluating seismic hazard communication - The Swiss case, Nat. Hazards Earth Syst. Sci., 19, 2677–2700, https://doi.org/10.5194/nhess-19-2677-2019, 2019.
Marti, M., Dallo, I., Roth, P., Papadopoulos, A. N., and Zaugg, S.: Illustrating the impact of earthquakes: Evidence-based and user-centered recommendations on how to design earthquake scenarios and rapid impact assessments, Int. J. Disaster Risk Reduct., 90, 103674, https://doi.org/10.1016/j.ijdrr.2023.103674, 2023.
Michel, C., Crowley, H., Hannewald, P., Lestuzzi, P., and Fäh, D.: Deriving fragility functions from bilinearized capacity curves for earthquake scenario modelling using the conditional spectrum, Bull. Earthq. Eng., 16, 4639–4660, https://doi.org/10.1007/s10518-018-0371-3, 2018.
Mouyiannou, A., Rota, M., Penna, A., and Magenes, G.: Identification of suitable limit states from nonlinear dynamic analyses of masonry structures, J. Earthq. Eng., 18, 231–263, https://doi.org/10.1080/13632469.2013.842190, 2014.
National Institute of Building Sciences: Natural Hazard Mitigation Saves 2019 Report, 658, https://www.nibs.org/projects/natural-hazard-mitigation-saves-2019-report (last access: 24 September 2024), 2019.
NCPD: National risk assessment: Overview of the potential major disasters in Italy: seismic, volcanic, tsunami, hydro-geological/hydraulic and extreme weather, droughts and forest fire risks, Presidency of the Council of Ministers Italian Civil Protection Department, https://www.protezionecivile.gov.it/static/5cffeb32c9803b0bddce533947555cf1/Documento_sulla_Valutazione_nazionale_dei_rischi.pdf (last access: 19 September 2024), 2018.
Ottonelli, D., Cattari, S., and Lagomarsino, S.: Displacement-Based Simplified Seismic Loss Assessment of Masonry Buildings, J. Earthq. Eng., 24, 23–59, https://doi.org/10.1080/13632469.2020.1755747, 2020.
Pagani, M., Monelli, D., Weatherill, G., Danciu, L., Crowley, H., Silva, V., Henshaw, P., Butler, L., Nastasi, M., Panzeri, L., Simionato, M., and Vigano, D.: OpenQuake Engine: An Open Hazard (and Risk) Software for the Global Earthquake Model, Seismol. Res. Lett., 85, 692–702, https://doi.org/10.1785/0220130087, 2014.
Panzera, F., Bergamo, P., and Fäh, D.: Reference soil condition for intensity prediction equations derived from seismological and geophysical data at seismic stations, J. Seismol., 25, 163–179, https://doi.org/10.1007/s10950-020-09962-z, 2021.
Papadopoulos, A. N., Vamvatsikos, D., and Kazantzi, A. K.: Development and Application of FEMA P-58 Compatible Story Loss Functions, Earthq. Spectra, 35, 95–112, https://doi.org/10.1193/102417EQS222M, 2019.
Papadopoulos, A. N., Roth, P., and Danciu, L.: Exposure manipulation strategies for optimizing computational efficiency in seismic risk analysis, Bull. Earthq. Eng., 22, 4779–4795, https://doi.org/10.1007/s10518-024-01929-6, 2024
Poggi, V., Edwards, B., and Fah, D.: Derivation of a Reference Shear-Wave Velocity Model from Empirical Site Amplification, Bull. Seismol. Soc. Am., 101, 258–274, https://doi.org/10.1785/0120100060, 2011.
Porter, K. A., Beck, J. L., and Shaikhutdinov, R. V.: Sensitivity of building loss estimates to major uncertain variables, Earthq. Spectra, 18, 719–743, https://doi.org/10.1193/1.1516201, 2002.
Porter, K. A., Farokhnia, K., Vamvatsikos, D., and Cho, I. H.: Guidelines for component- based analytical vulnerability assessment of buildings and nonstructural elements, Tech. Rep. 2014-12, GEM Foundation, Pavia, Italy, https://doi.org/10.13117/GEM.VULN-MOD.TR2014.13, 2015.
Raetz, H., Forscher, T., Kneebone, E., and Reid, C.: The Hard Costs of Construction: Recent Trends in Labor and Materials Costs for Apartment Buildings in California, California, https://ternercenter.berkeley.edu/wp-content/uploads/pdfs/Hard_Construction_Costs_March_2020.pdf (last access: 19 September 2024), 2020.
Rossi, A., Morandi, P., and Magenes, G.: A novel approach for the evaluation of the economical losses due to seismic actions on RC buildings with masonry infills, Soil Dyn. Earthq. Eng., 145, 106722, https://doi.org/10.1016/j.soildyn.2021.106722, 2021.
Röthlisberger, V., Zischg, A. P., and Keiler, M.: A comparison of building value models for flood risk analysis, Nat. Hazards Earth Syst. Sci., 18, 2431–2453, https://doi.org/10.5194/nhess-18-2431-2018, 2018.
Salgado-Gálvez, M. A., Cardona, O. D., Carreño, M. L., and Barbat, A. H.: Probabilistic seismic hazard and risk assessment in Spain: national and local level case studies, centro internacional de métodos numéricos en ingeniería, 1–215, ISBN 978-84-943307-7-3, 2015.
Silva, V., Crowley, H., Pagani, M. et al.: Development of the OpenQuake engine, the Global Earthquake Model's open-source software for seismic risk assessment, Nat. Hazards, 72, 1409–1427, https://doi.org/10.1007/s11069-013-0618-x, 2014.
Silva, A., Castro, J. M., and Monteiro, R.: A rational approach to the conversion of FEMA P-58 seismic repair costs to Europe, Earthq. Spectra, 36, 1607–1618, https://doi.org/10.1177/8755293019899964, 2020a.
Silva, V., Amo-Oduro, D., Calderon, A., Costa, C., Dabbeek, J., Despotaki, V., Martins, L., Pagani, M., Rao, A., Simionato, M., Viganò, D., Yepes-Estrada, C., Acevedo, A., Crowley, H., Horspool, N., Jaiswal, K., Journeay, M., and Pittore, M.: Development of a global seismic risk model, Earthq. Spectra, 36, 372–394, https://doi.org/10.1177/8755293019899953, 2020b.
Spence, R., So, E., Ameri, G., Akinci, A., Cocco, M., Cultrera, G., Franceschina, G., Pacor, F., Pessina, V., Lombardi, A. M., Zonno, G., Carvalho, A., Campos Costa, A., Coelho, E., Pitilakis, K., Anastasiadis, A., Kakderi, K., Alexoudi, M., Ansal, A., Erdic, M., Tonuk, G., and Demircioglu, M.: Earthquake Disaster Scenario Prediction and Loss Modelling for Urban Areas, IUSS Press, Pavia, ISBN 978-88-6198-011-2, 2007.
Turner and Townsend: International construction market survey – 2019, https://www.turnerandtownsend.com/en/perspectives/international-construction-market-survey-2019 (last access: 14 May 2020), 2019.
Tyagunov, S., Grünthal, G., Wahlström, R., Stempniewski, L., and Zschau, J.: Seismic risk mapping for Germany, Nat. Hazards Earth Syst. Sci., 6, 573–586, https://doi.org/10.5194/nhess-6-573-2006, 2006.
Wiemer, S., Giardini, D., Fäh, D., Deichmann, N., and Sellami, S.: Probabilistic seismic hazard assessment of Switzerland: Best estimates and uncertainties, J. Seismol., 13, 449–478, https://doi.org/10.1007/s10950-008-9138-7, 2009.
Wiemer, S., Danciu, L., Edwards, B., Marti, M., Fäh, D., Hiemer, S., Wössner, J., Cauzzi, C., Kästli, P., and Kremer, K.: Seismic Hazard Model 2015 for Switzerland (SUIhaz2015), Swiss Seismological Service (SED) at ETH Zurich, 164 pp., https://doi.org/10.12686/a2, 2016.
Wiemer, S., Papadopoulos, A., Roth, P., Danciu, L., Bergamo, P., Fäh, D., Duvernay, B., Khodaverdian, A., Lestuzzi, P., Odabaşı, O., Fagà, E., Bazzurro, P., Cauzzi, C., Hammer, C., Panzera, F., Perron, V., Marti, M., Valenzuela, N., Dallo, I., Zaugg, S., Fulda, D., Kästli, P., Schmid, N., and Haslinger, F.: Earthquake Risk Model of Switzerland ERM-CH23, Swiss Seismological Service (SED), https://doi.org/10.12686/a20, 2023.
Woessner, J., Danciu, L., Giardini, D., Crowley, H., Cotton, F., Grünthal, G., Valensise, G., Arvidsson, R., Basili, R., Demircioglu, M. B., Hiemer, S., Meletti, C., Musson, R. W., Rovida, A. N., Sesetyan, K., and Stucchi, M.: The 2013 European Seismic Hazard Model: key components and results, Bull. Earthq. Eng., 13, 3553–3596, https://doi.org/10.1007/s10518-015-9795-1, 2015.
Zhao, J. X.: Attenuation Relations of Strong Ground Motion in Japan Using Site Classification Based on Predominant Period, Bull. Seismol. Soc. Am., 96, 898–913, https://doi.org/10.1785/0120050122, 2006.
- Abstract
- Introduction
- Seismicity in Switzerland
- The Earthquake Risk Model of Switzerland (ERM-CH23)
- Earthquake risk assessment
- Discussion
- Communication products and user testing
- Conclusions
- Code availability
- Data availability
- Author contributions
- Competing interests
- Disclaimer
- Special issue statement
- Acknowledgements
- Financial support
- Review statement
- References
- Supplement