the Creative Commons Attribution 4.0 License.
the Creative Commons Attribution 4.0 License.
 | 05 Feb 2024
A regional-scale approach to assessing non-residential building, transportation and cropland exposure in Central Asia
Alberto Tamaro
Baurzhan Adilkhan
Satbek Sarzhanov
Zukhritdin Ergashev
Ruslan Umaraliev
Mustafo Safarov
Vladimir Belikov
Japar Karayev
Ettore Fagà
Critical infrastructure has a paramount role in socio-economic development, and its disruption can have dramatic consequences for human communities, including cascading impacts. Assessing critical-infrastructure exposure to multiple hazard is therefore of utmost importance for disaster risk reduction purposes. However, past efforts in exposure assessment have predominantly concentrated on residential buildings, often overlooking the unique characteristics of critical infrastructure. Knowing the location, type and characteristics of critical infrastructure is particularly challenging due to the overall scarcity of data and difficulty of interacting with local stakeholders. We propose a method to assess exposure of selected critical infrastructure and demonstrate it for Central Asia, a region prone to multiple hazards (e.g., floods, earthquakes, landslides). We develop the first regionally consistent exposure database for selected critical infrastructure and asset types (namely, non-residential buildings, transportation and croplands), assembling the available global and regional datasets together with country-based information provided by local authorities and research groups, including reconstruction costs. The method addresses the main known challenges related to exposure assessment of critical infrastructure (i.e., data scarcity, difficulties in interacting with local stakeholders) by collecting national-scale data with the help of local research groups. The analysis also includes country-based reconstruction costs, supporting regional-scale disaster risk reduction strategies that include the financial aspect.
- Article
(12170 KB) - Full-text XML
- BibTeX
- EndNote


Exposure assessment is the process of collecting information on the type, characteristics and spatial distribution of assets potentially damageable by natural or human-made hazards. Exposure layers are therefore paramount for disaster risk reduction (DRR) as they allow developing strategies to cope with disasters (Nirandjan et al., 2022). Critical infrastructure plays a paramount role in the risk management cycle, as its failures can exacerbate the impact of disasters (Forzieri et al., 2018; Koks et al., 2022).
Assessing exposure of critical infrastructure is particularly challenging because of its inherent complexity and the difficulty of modeling related mutual interactions (Pant et al., 2018). Many existing global and regional disaster risk models focus on residential buildings or populations, with fewer examples for critical infrastructures, mainly focused on transportation and supply networks (Koks et al., 2019; Argyroudis et al., 2020; Karatzetzou et al., 2022; Mukherjee et al., 2023). Very few works (e.g., Crowley et al., 2020; Yepes-Estrada et al., 2023) include commercial and industrial buildings, despite their socio-economic relevance for national and global economies and their role in the generation of cascading impacts (e.g., Krausmann and Cruz, 2021). This is partially justified by the incompleteness and inconsistency of existing geospatial information related to critical infrastructure with respect to residential buildings and population data (Batista e Silva et al., 2019). This is one of the reasons why critical infrastructure is often modeled through assumptions about infrastructure density rather than by detailed asset mapping (Koks et al., 2019). Also, once collected, spatial and non-spatial data must be combined to assess exposure of critical infrastructures to single hazards, e.g., for floods (e.g., Fekete et al., 2017; Pant et al., 2018). Such studies often happen at the local scale, but, in order to be combined into regional- and global-scale assessments, there is a strong need for harmonization (Batista e Silva et al., 2019).
The lack of data is not always fulfilled by remote sensing due to the difficulty of identifying some infrastructures (e.g., buried supply networks), as discussed by Taubenbock and Geiß (2014). To tackle this, it is paramount to access data from national authorities and research institutes who have access to more detailed and reliable information. According to Rathnayaka et al. (2022), establishing a dialogue between stakeholders and the scientific community is a challenge in the development of critical-infrastructure exposure databases and is strongly connected with the difficulty of gathering data, in particular in data-scarce regions. They also highlight the need for establishing standardized exposure data collection, which is particularly relevant when assessing exposure to multiple hazards. Multi-hazard exposure taxonomies have been proposed to classify critical infrastructure based on its characteristics (Murnane et al., 2019; Silva et al., 2022) and are particularly relevant in the case of critical infrastructure which is often exposed to multiple hazards that can potentially overlap and interact in space and time (Tilloy et al., 2019). Another limitation of exposure datasets is that they often do not include country-based reconstruction costs, which are difficult to retrieve in particular for critical infrastructure, limiting the reliability of financial risk assessment associated with disasters. This is particularly relevant for cropland exposure assessment, whose exposure to floods (Zhang et al., 2023) and drought (Venkatappa et al., 2021) is increasing together with potential financial losses.
In this study, we present a novel approach to assessing exposure of critical infrastructure and supporting multi-hazard risk assessment. Our method tackles two interrelated challenges identified by the current literature: the difficulty of gathering country-based data and the lack of dialogue between the scientific community and local stakeholders. Exposure data collection was achieved by establishing a dialogue between stakeholders at the regional scale in collaboration with local representatives in the five countries of Central Asia, including through dedicated workshops (Peresan et al., 2023). In particular, we gathered country-based reconstruction costs, which are commonly difficult to estimate but are paramount to assessing the financial consequences of disasters and increasing financial resilience. The method is demonstrated by assembling the first regionally consistent exposure database of critical infrastructure for Central Asia based on regional-scale datasets and spatial and non-spatial country-based data for selected critical infrastructure. The exposure dataset inherently deals with multi-hazards as it includes the characteristics that are deemed relevant for floods, earthquakes and landslides, and it is potentially useful to assess the impact of other phenomena and/or cascading effects. It also includes assets such as commercial and industrial buildings for which no information was available at the time. Data are structured according to the GED4ALL multi-hazard taxonomy (Silva et al., 2022), which is here used for the first time in Central Asia to encompass multiple building and infrastructure typologies in a multi-hazard context.
The paper describes the study area and all the steps of the exposure assessment methodology including data collection, the development of exposure layers and the estimation of the reconstruction costs of each asset type considered. Finally, we discuss the limitations of the method, its suggested usage and potential improvements.
The Central Asian region (Fig. 1) includes five countries (Kazakhstan, the Kyrgyz Republic, Tajikistan, Turkmenistan, Uzbekistan) which are diverse in terms of language, currency and socio-economic conditions. Central Asia encompasses a wide variety of climatic areas and geological settings. It is therefore prone to multiple hazards which can affect different parts of the region, including trans-boundary areas (e.g., the Fergana Valley, where many residential and agricultural activities are located). In particular, floods are increasingly frequent, and, in the past, their impacts have often been exacerbated by difficulties related to trans-boundary cooperation, for example in water management (UNECE, 2011; Libert and Trombitcaia, 2015). Central Asia is also prone to earthquakes as demonstrated by several regional-scale studies carried out in the last few decades (Ulomov and the GSHAP Region 7 Working Group, 1999; Bindi et al., 2012; Ullah et al., 2015). Landslides, together with earthquakes and floods, are very frequent in Central Asia, and, in the past, have often been triggered by natural events such as earthquakes, floods, rainfall and snowmelt (Saponaro et al., 2014; Strom and Abdrakhmatov, 2017). The type and spatial distribution of floods and landslides are also expected to vary due to climate change, which is strongly affecting the region. Another emerging hazard in Central Asia is drought (Zhang et al., 2019), which might affect the region by disrupting productive activities and exacerbating water management conflicts.
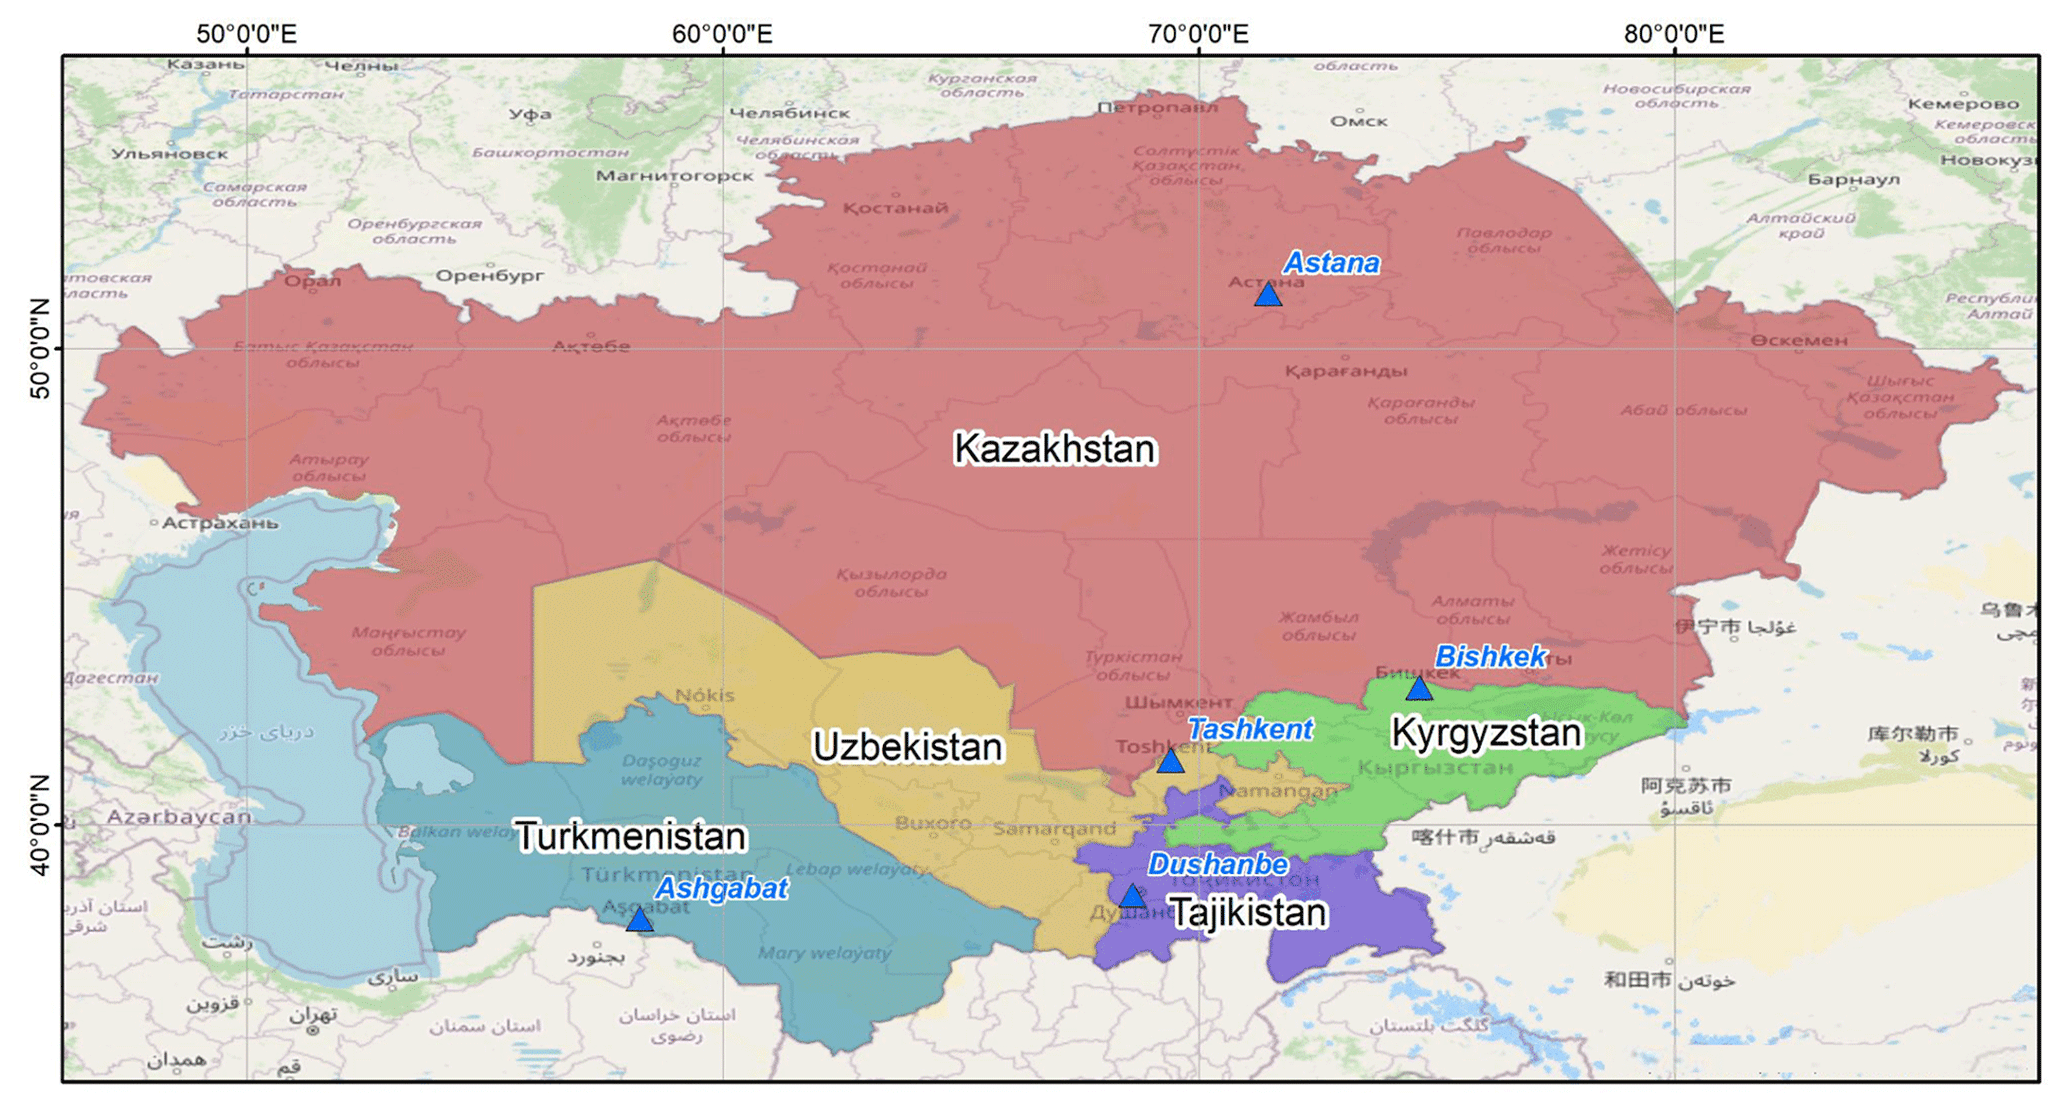
Figure 1Map of the five Central Asian countries – Kazakhstan (KAZ), the Kyrgyz Republic (KGZ), Tajikistan (TJK), Uzbekistan (UZB) and Turkmenistan (TKM) – and the corresponding capitals (Astana, Bishkek, Dushanbe, Tashkent and Ashgabat, respectively). Map data from OpenStreetMap are available from https://www.openstreetmap.org (last access: 20 November 2023) (© OpenStreetMap contributors 2023, distributed under the Open Data Commons Open Database License (ODbL) v1.0).
Past exposure assessments in the region have mostly been focused on residential buildings (Pittore et al., 2020). However, critical infrastructure is also relevant in the context of Central Asia and should not be overlooked when performing a comprehensive damage/risk assessment for the region. An effort is therefore required in order to assemble national- and regional-scale exposure layers and integrate the available data sources and knowledge, which are currently scattered across different sources including global databases (e.g., OpenStreetMap) and national-scale aggregated statistics (e.g., national census).
The exposure dataset developed here includes three types of critical infrastructure: non-residential buildings of different types (e.g., commercial, industrial), transportation and croplands. Non-residential buildings comprise workplaces (e.g., industrial sites, commercial buildings), services (e.g., public offices, schools) and other facilities that are extremely relevant in emergencies (e.g., hospitals) and can suffer both physical consequences (e.g., building structural damage) and damage, such as production disruption due to power blackouts and its related financial consequences. The transportation system is a paramount asset as it enables both the movement of people and the transportation of goods across the Central Asian region. Due to its strategic regional and global importance, it has undergone strong changes in the last few decades, including in the context of the Silk Road initiative (Shaikova et al., 2023). Croplands are extremely relevant for the Central Asian economies as they guarantee both food security and economic development. The primary sector (agriculture, forestry and fishing) accounts for 26 % and 24 % of Uzbekistan and Tajikistan GDP, respectively (World Bank, 2020). The share of national GDP in the Kyrgyz Republic and Turkmenistan is 14 % and 11 %, while the lowest value is associated with Kazakhstan (5 %). Cotton and cereals (in particular, wheat) are the dominating cropping system in all Central Asian countries (Kienzler et al., 2012). Cotton and wheat, in particular, account for a fraction of cropland area that varies between 30 % in Turkmenistan and 80 % in the Kyrgyz Republic (FAO, 2019). However, they are threatened by a number of hazardous phenomena, including floods and drought, often exacerbated by climate change and water management issues (Punkari et al., 2014; Li et al., 2020).
The Central Asian region is therefore characterized by the presence of critical infrastructure exposed to multiple hazards, which can cause multiple impacts that are yet to be assessed. Despite the relevance of critical infrastructure for the region socio-economic system and its importance for disaster risk reduction, at the time of the analysis, regional-scale exposure datasets were not available in Central Asia for non-residential buildings, transportation and croplands, and information was scattered across multiple sources. Developing a regional-scale exposure model was therefore required as a first step towards an assessment of the potential consequences of floods, earthquakes and landslides that go beyond national boundaries.
The available information on non-residential buildings, transportation system and croplands was collected across the five Central Asian countries. The data collection phase was carried out in collaboration with representatives of each country. Data were collected at two different spatial scales, global/regional and national/sub-national, and comprised both official sources and personal communications provided by the paper's authors and their institutions. Most interaction happened in virtual mode due to the travel restrictions during the COVID-19 pandemic. The first interactions with participants were carried out via emails and allowed for the identification of the type of data that they could provide or gather to develop exposure assessment. After that, dedicated online meetings were periodically organized for each country to discuss specific issues and data requirements, and data were collected through shared folders and tables where each group of partners could contribute. For each country, local partners provided one contact person responsible for data collection who participated in one initial meeting with all country representatives and one or two country-based meetings, for a total of seven online meetings held between February and May 2021. The process was also supported by country-based workshops, whose organization involved the exposure contact person participating in two additional meetings per country, for a total of 10 meetings held between April and December 2021. Exposure workshops provided participants with an overview of the exposure assessment methods to be applied (Peresan et al., 2023), covering all the steps of assembling an exposure development layer for selected study areas using data provided by local partners. This facilitated both data collection and the demonstration of the approaches in a context familiar to participants. More details are provided by Peresan et al. (2023).
The general method adopted to assemble regional-scale exposure databases relies on two main procedures:
-
Spatial disaggregation. Exposure information is often available in an aggregated form (e.g., total value over a region). In such cases, a common method is to spatially distribute the total value using proxies such as population or land use maps. This operation is called spatial disaggregation and is usually performed using a geographical information system (GIS) or spatial analysis library (e.g., GDAL; https://gdal.org/, last access: 1 February 2024).
-
Definition of typologies for exposed assets. Exposure assessment requires the definition of asset typologies based on their characteristics (buildings are classified by material, age, etc.). However, this information might not be available for some exposed assets. In this case, broad typologies can be defined based on information available for parts of the study area and/or for countries outside the study region with similar characteristics. Typologies are then described using the GED4ALL taxonomy (Silva et al., 2022), specifically developed for multi-hazard and risk assessment purposes.
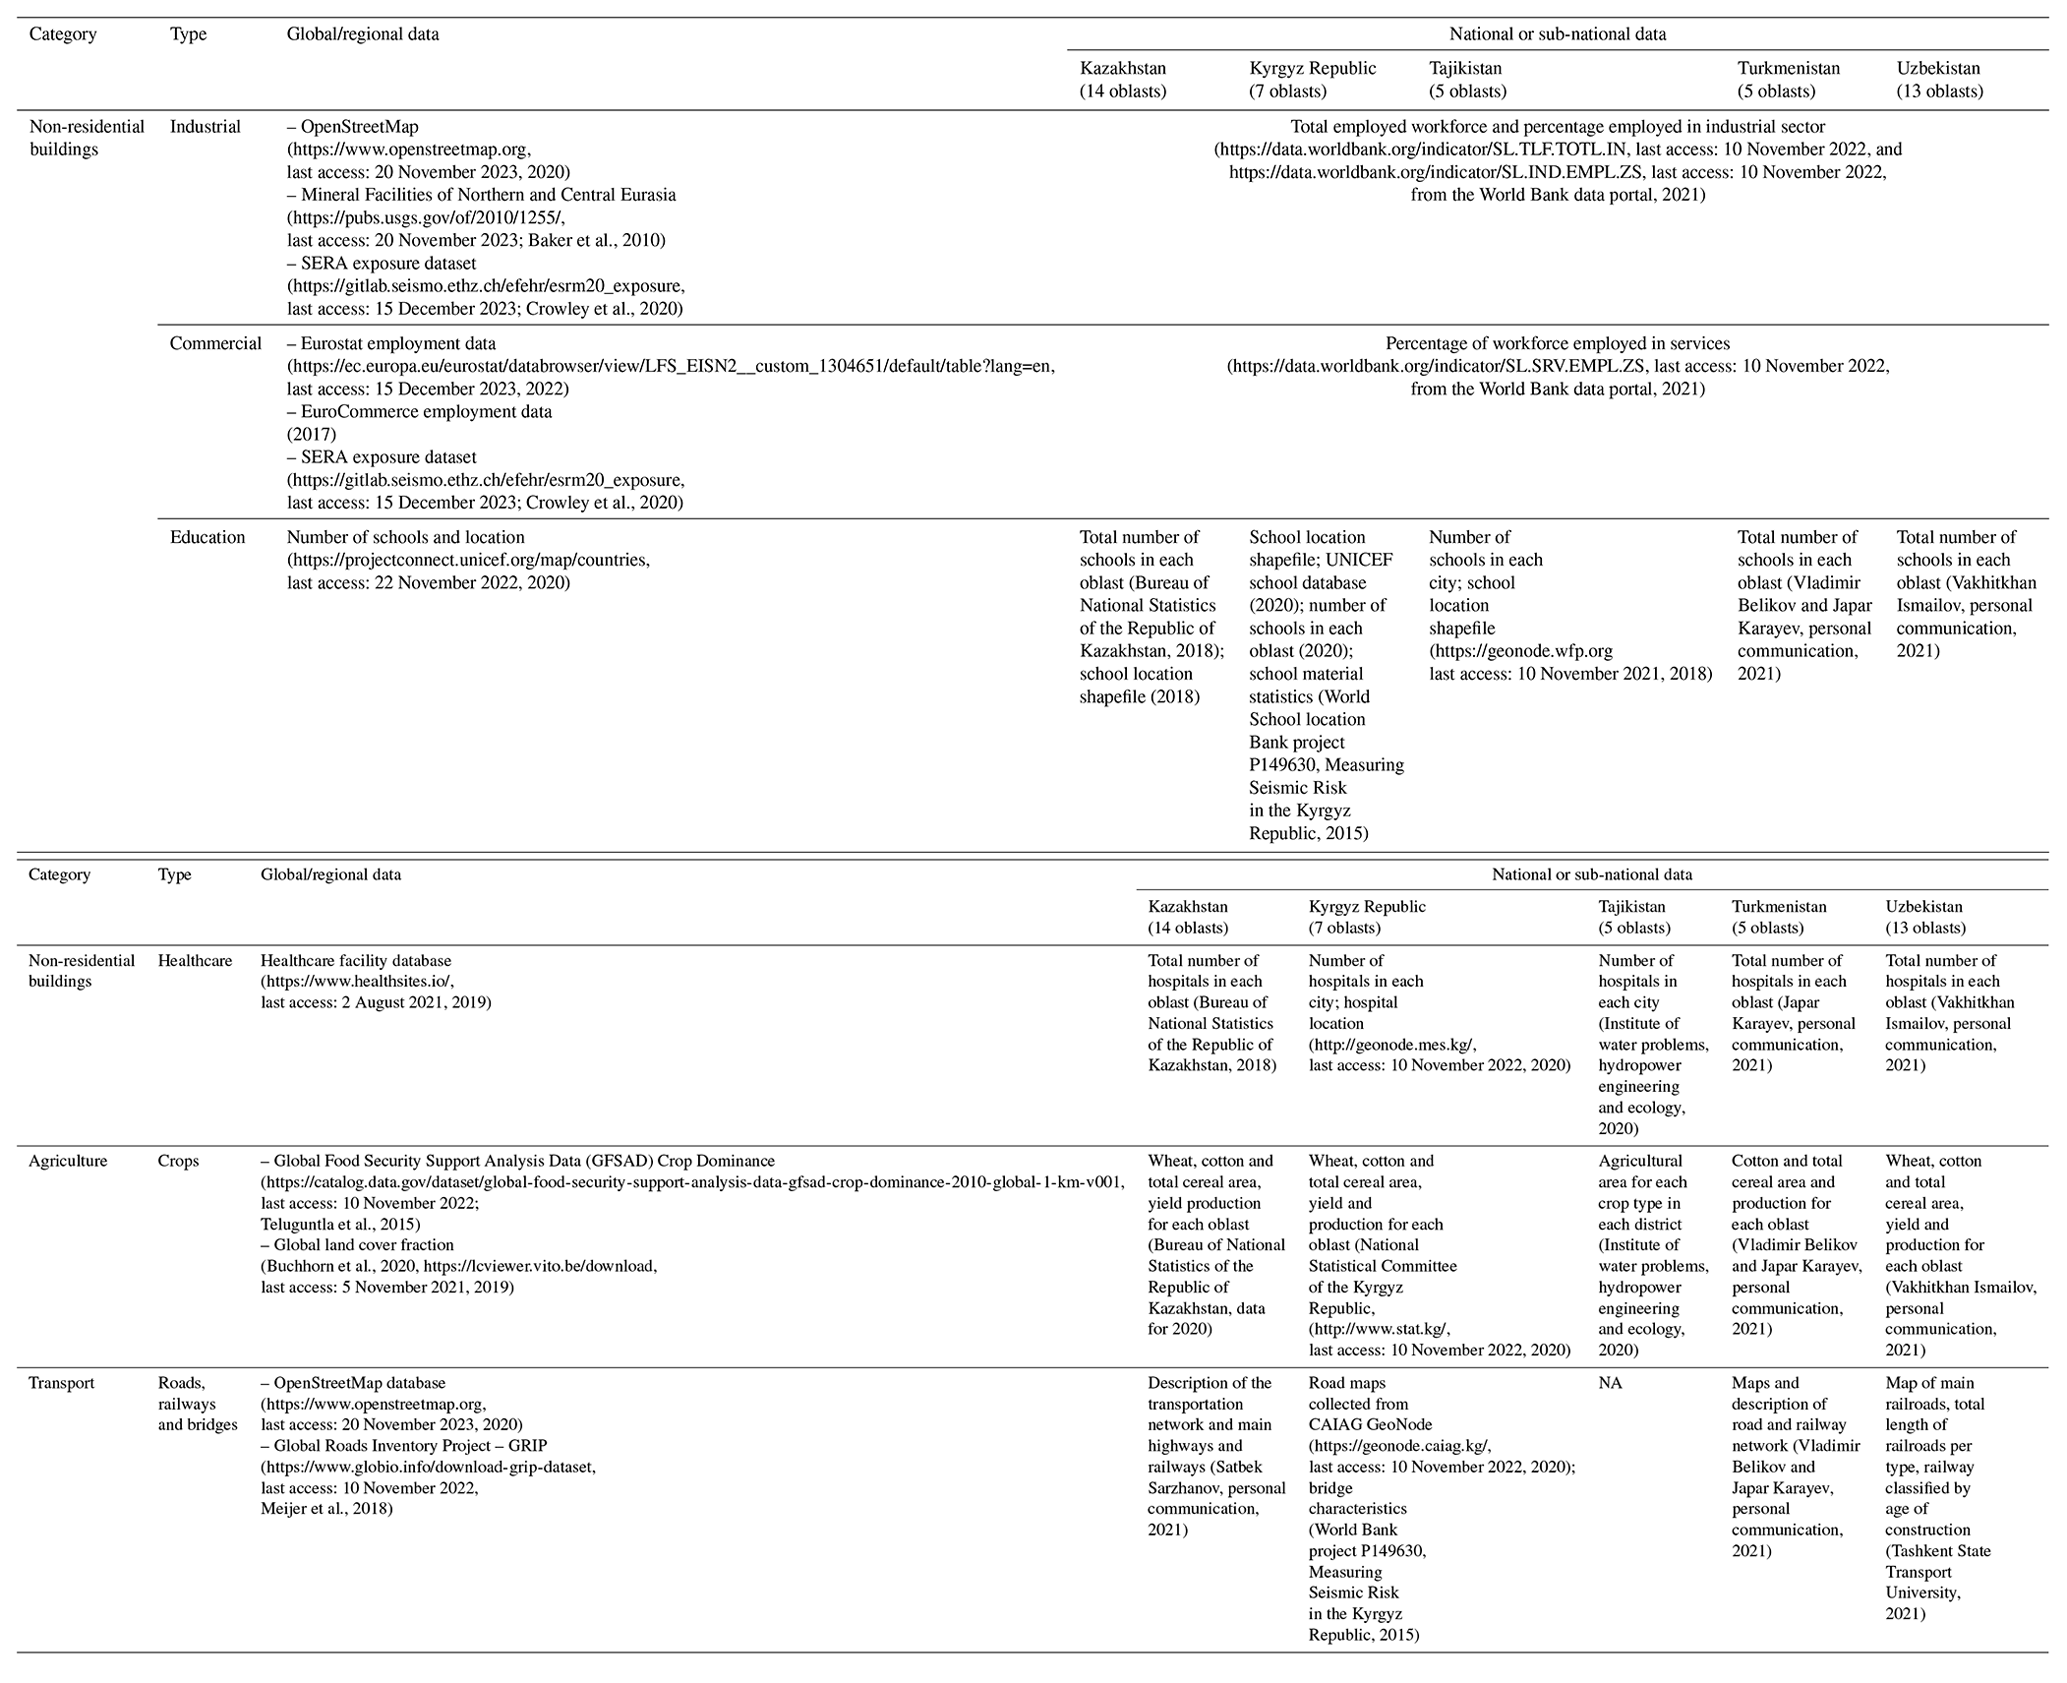
Following these two principles, we combined the information collected for each exposed asset type (Table 1) to develop exposure layers for non-residential buildings, transportation and croplands. A strong harmonization effort was performed in order to combine all collected exposure data and support regionally consistent risk assessment activities.
Table 1Exposure data collected at the regional scale and for each country for the considered exposed assets (non-residential buildings, agriculture and transport). Data are collected from global/regional databases or national official sources (e.g., governmental agencies) or are provided directly by local partners and contributors who collected official sources and conveyed the data together with their personal communications. The year for which data were extracted, or up to which the datasets are updated, is also included in the table. NA stands for not available.
4.1 Non-residential buildings
Exposure layers were developed separately for each non-residential asset type considered (schools, healthcare facilities, commercial and industrial) based on the data collected in Table 1. For non-residential buildings, few exposure layers were available and there was scarce information on building typologies. The definition of typologies therefore aimed at identifying the main characteristics of non-residential buildings based on two main assumptions:
-
The main building typologies in Central Asia defined in the EMCA project (Earthquake Model Central Asia; Wieland et al., 2015; Pittore et al., 2020) are considered valid for non-residential buildings. Note that these typologies were also adopted for the development of the residential exposure layer (Scaini et al., 2023).
-
In the absence of specific country-based information, we used data sources from post-Soviet countries, assumed to be similar in terms of their past socio-economic context and technical background with regards to construction methods. In particular, data from the SERA non-residential buildings' exposure layers (Crowley et al., 2020) for the available post-Soviet countries (Estonia, Latvia, Lithuania and Moldova) were used, while for the others (Belarus, Ukraine and Russia), data were not available.
Specific methods adopted for each non-residential asset type are described in the following subsections.
4.1.1 Schools
School typologies were extracted from a previous UNICEF project in the Kyrgyz Republic that collected the main exposure characteristics for 1260 schools constituting 8380 building units surveyed separately. Statistics were performed on the UNICEF layer assuming that each building block is a separate school sample. According to the dataset, all surveyed schools consist of load-bearing masonry or precast concrete (80 % and 20 %, respectively), and the vast majority are found in rural areas (88 %). This is similar to the overall distribution of residential buildings in the Kyrgyz Republic, which, according to Pittore et al. (2020), has more than 90 % of load-bearing masonry buildings. We assumed that, in the absence of specific data for schools in other countries, all Central Asian schools have the same characteristics as those surveyed in the Kyrgyz Republic. Construction material was therefore defined as a weighted combination of the most common school materials in the Kyrgyz Republic. Two school typologies were defined (rural and urban) and associated with the most frequent age, area and occupancy value obtained from the UNICEF database for the Kyrgyz Republic.
-
Urban schools. This typology is defined as follows: material, weighted combination of the most common school typologies in the Kyrgyz Republic (59 % EMCA1 (masonry), 10 % EMCA3 (steel), 31 % EMCA4 (adobe)); year of construction, 1960–1990; area, 500–1000 m2 (average: 750 m2); occupancy, 300 students; taxonomy, UNK (i.e., unknown) + YBET (i.e., year-of-construction range) – 1960, 1990.
-
Rural schools. This typology is defined as follows: material, weighted sum of the most common school typologies in the Kyrgyz Republic (56 % EMCA1, 22 % EMCA3 and 22 % EMCA4); year of construction, 1960–1990; area, 50–500 m2 (average: 275 m2); occupancy, 50–200 students (125); taxonomy, UNK (i.e., unknown) + YBET (i.e., year-of-construction range) – 1960, 1990.
School structural costs were provided by local partners in each country. The value of USD 550 per square meter was adopted in agreement with most data provided, but high discrepancies were found between the cost in Turkmenistan and Kazakhstan (who provided the highest values, ranging between USD 2000 and 4500 per square meter) and the Kyrgyz Republic (the lowest, USD 470 per square meter).
Digital maps of schools were available for the Kyrgyz Republic, Kazakhstan and Tajikistan (UNICEF, 2022; see Table 1). Each point in the spatial dataset was associated with urban or rural school typologies. Urban schools were identified by intersecting them with the urban polygons available from the GRUMP dataset (CIESIN, 2021), while all other schools were considered rural. The location of schools in Uzbekistan and Turkmenistan was not available, but local partners provided the total number of schools in each oblast, which were distributed in the GRUMP urban areas (CIESIN, 2021); rural schools were associated with polygons with an area smaller than 20 km2.
4.1.2 Healthcare facilities
The location of healthcare facilities by type (clinics, hospitals, polyclinic, dentists, doctors, laboratories and pharmacies), last updated in 2019, is available from the Global Healthsites Mapping Project database (Weiss et al., 2020). No information was available on the main characteristics (age, material, floor area) of hospitals in Central Asia. Based on the SERA (Seismology and Earthquake Engineering Research Infrastructure Alliance for Europe) project (Crowley et al., 2020), which provides non-residential-building exposure data for European countries, we extracted the characteristics of hospitals in post-Soviet countries for which the information is available (Estonia, Latvia, Lithuania and Moldova). The average hospital area is 10 000 m2, which was assumed valid for all hospitals of Central Asia. Similarly, for clinics, the average area from the SERA dataset of post-Soviet countries was 1000 m2. As for the material, we assume that the majority of hospitals are reinforced-concrete buildings, which correspond to the EMCA2 (reinforced concrete) or EMCA3 typologies of the residential-building classification introduced by Pittore et al. (2020) and refined by Scaini et al. (2023).
Clinics and other healthcare businesses (dentists, doctors, pharmacies) were assumed to have a material similar to the residential buildings in each country. Their typology was defined as the weighted combination of the residential-building typologies in each country, based on their fraction, discarding those whose presence was lower than 5 %. Other healthcare facilities (dentists, doctors and pharmacies) were assumed to have the same building typologies and reconstruction costs as retail commercial buildings. Their area was estimated as the weighted sum of the areas of the most common residential-building typologies in each country. In particular, the floor area was considered for single-family building typologies, while the dwelling area was used for multi-family building typologies, following the same approach as that used for medium to small retail buildings.
Hospital structural reconstruction costs were estimated based on the country-based costs (USD per square meter) provided by local partners in each country: an average value of USD 1500 per square meter was assumed. The replacement cost of hospital contents is assumed to be 150 % of the structural costs following the approach of Hazus (FEMA, 2021). The other healthcare facilities' (clinics, dentists, doctors and pharmacies) construction and content costs were assumed to be equal to the construction and content cost of the commercial retail building typologies most common in each country.
4.1.3 Commercial buildings
Commercial and service buildings, named here as “commercial”, are broadly distinguished into two categories:
-
Wholesale and services. Given the lack of specific data for commercial buildings in Central Asia, we assumed that wholesale and service industrial buildings in Central Asia are similar to the post-Soviet ones in European countries, obtained from the SERA database (Crowley et al., 2020). A single wholesale and service building typology was defined as the combination of the most common EMCA typologies in the post-Soviet countries (namely, EMCA1, EMCA2 and EMCA5 (wood), which represent 26 %, 37 % and 36 % of the commercial building stock, respectively). The average area and occupancy are calculated as the weighed combination of the area and occupancy of the typologies present in the SERA commercial-building dataset. The so-defined wholesale and service building typology has an average area of 476 m2, and the occupancy is 243 people. This is consistent with existing statistics which estimate that wholesale employers have between 10 and 249 employees, but large wholesale firms can employ up to 700 people (OXIRM, 2014).
-
Retail buildings. These are assumed to be distributed along residential areas and to have characteristics similar to residential buildings. A single commercial retail typology was defined, in each country, as the combination of the most common residential-building typologies in the national building stock. The most common residential-building typologies are EMCA1 (masonry) and EMCA4 (adobe) for the Kyrgyz Republic, Tajikistan and Turkmenistan, with the additional presence of EMCA5 (wood) and EMCA6 (steel) for Kazakhstan. These typologies are low-rise to mid-rise and encompass a wide range of construction decades, from the 1930s to today. Typologies which account for less than 5 % of the residential buildings were discarded. The average retail building area was estimated as the weighted combination of the story/dwelling area for each building typology. In particular, the floor area was considered for single-family building typologies, while the dwelling area was used for multi-family building typologies. As for the occupancy, in Europe the large majority of retail businesses are micro-businesses employing fewer than 10 people (but there are large retail companies that employ few thousand people; OXIRM, 2014). In this work, we assumed that retail companies accommodate on average five people, and we did not account for large retail companies. The structural cost for retail building typologies was computed as the average of structural costs of each EMCA typology weighted by their relative presence in each country obtained from the residential exposure layer developed in Scaini et al. (2023). The content cost is assumed to be equal to the structural cost following the Hazus inventory technical manual (FEMA, 2021).
Given that no prior information was available on the number of commercial buildings in Central Asia, their number was estimated based on labor market data based on the following indicators:
-
the total number of employees in the commercial sector, derived as a percentage of the total labor force for each country (Table 1);
-
total employees in the wholesale and retail sector calculated as a percentage over the total employees in the commercial sector activities, using values for Europe (Eurostat, 1980, https://ec.europa.eu/eurostat/databrowser/view/LFSQ_EISN2__custom_1304651/default/table?lang=en, last access: 15 December 2022);
-
number of retail employees, calculated as a fraction of the total employees in the wholesale and retail sector, whereby, according to EuroCommerce (2017), the fraction of employees in the retail sector in 2015 in Europe was 72 %, while in post-Soviet countries that belong to the EU (Estonia, Latvia, Lithuania) it was 75 % (EuroCommerce, 2017), with the remaining fraction being associated with wholesale and services;
-
average occupancy of wholesale and service buildings, obtained from the SERA dataset for post-Soviet countries, and for retail buildings inferred from European statistics (EuroCommerce, 2017).
The number of commercial buildings was finally estimated by dividing the total employees in the two categories (services–wholesale and retail) by the average occupancy of each category.
Wholesale and services and retail buildings were spatially distributed in urbanized areas extracted from the GRUMP dataset (CIESIN, 2021). In the absence of additional information on their spatial distribution, they were disaggregated based on population density so that a higher fraction of buildings was distributed in highly populated areas. This approach is similar to the one adopted in the SERA project (Crowley et al., 2020). Commercial areas identified in OpenStreetMap (OSM) were also inspected, but their coverage was deemed insufficient, so the OSM polygons were not used to locate commercial buildings.
4.1.4 Industrial buildings
No prior information was available on the number of industrial buildings in Central Asia (Table 1). The number of industrial buildings was thus estimated by dividing the employed workforce by the average building occupancy. The total employed workforce and the percentage employed in the industrial sector of each country were obtained from the World Bank data portal (Table 1). In the absence of country-based or regional-based information, the average occupancy in industrial buildings was inferred from the SERA non-residential buildings' exposure layers (Crowley et al., 2020) for post-Soviet EU countries.
Industrial buildings can belong to more than one EMCA typology. According to the SERA dataset (Crowley et al., 2020), industrial buildings in post-Soviet countries are composed of 31 % load-bearing masonry (EMCA1), 25 % reinforced concrete (EMCA2) and 33 % steel (EMCA6). Other typologies are present in lower fractions (less than 10 %). In the absence of specific information, one broad typology was defined as a combination of the three EMCA typologies. Characteristics such as the average area and the structural cost were computed as the average value of the EMCA typologies weighted by their relative fraction in the building stock. An average area of 2013 m2 and an occupancy of 35 were obtained. The structural cost for industrial buildings was computed as the weighted average of the costs retrieved for each EMCA typology considered (see Scaini et al., 2023). As for the content, its value is estimated as 150 % of the construction cost, following the Hazus inventory technical manual (FEMA, 2021).
The location of industrial buildings was associated with industrial areas extracted from the OSM database. Areas devoted to mining and other primary sector activities, available from the Mineral Facilities of Northern and Central Eurasia dataset (Baker et al., 2010), were removed from the industrial areas. In order to account for the industrial built-up area only, we assumed that half of the industrial area accommodates buildings. The estimated number of buildings in each country was distributed among the industrial areas identified by OSM, in a number proportional to the polygons' area. The distribution was made so that there was at least one industrial building for each industrial area.
4.2 Transportation assets
For each country, roads and railways were extracted from OSM, which was found to be more reliable for the identification of the primary road network compared to the Global Roads Inventory Project – GRIP (Meijer et al., 2018; GloBio, 2022). The total length of transportation networks (roads and railway) obtained from OSM was compared with data available at the national scale for Uzbekistan and Turkmenistan, showing some discrepancies. However, the spatial location of the main transportation lines was also compared with non-digital maps of railway lines provided by local partners (e.g., for Turkmenistan), showing an overall good agreement. Roads and railways were then extracted from OSM and classified based on the GED4ALL taxonomy (Silva et al., 2022) which in its turn is based on the OSM classification. Roads were classified into four classes: motorway and trunk, primary, secondary, and tertiary. Railways were distinguished between high speed and conventional. Roads classified as “residential”, “service” and “unclassified” as well as railways tagged as “subway”, “tram” and “unknown” were not included in the analysis.
Bridges were extracted from the OSM layer, and additional ones were identified by intersecting the primary road layer with other potential obstacles (rivers, motorways and trunks, primary and secondary roads, and railways). The bridge typologies were defined based on the data provided by past projects in the region (e.g., “Measuring Seismic Risk in the Kyrgyz Republic”, implemented by the World Bank) and those provided by one of the Uzbekistan local partners (Tashkent State Transport University), which has deep expertise in the construction of railways and bridges in the region. Since GED4ALL does not provide a taxonomy for bridges but uses OSM taxonomy for roads, we classified bridges based on a custom taxonomy. Two types of bridge were identified:
-
Road bridges. In Uzbekistan, 86 % of bridges were constructed between 1960 and 1990. Information on bridge material is not available from local partners, but the project Measuring Seismic Risk in the Kyrgyz Republic (World Bank project P149630) identified 150 bridges in the Kyrgyz Republic, most of them made of reinforced concrete and steel. We therefore assume that most road bridges (>80 %) were constructed between 1960 and 1990 in reinforced concrete or steel.
-
Railway bridges. These are mostly made of reinforced concrete (95 % of the total), and they are multi-span; the average length of span ranges between 12 and 24 m, but most bridges are less than 25 m long. We assume that these characteristics are common to all railway bridges in Central Asia.
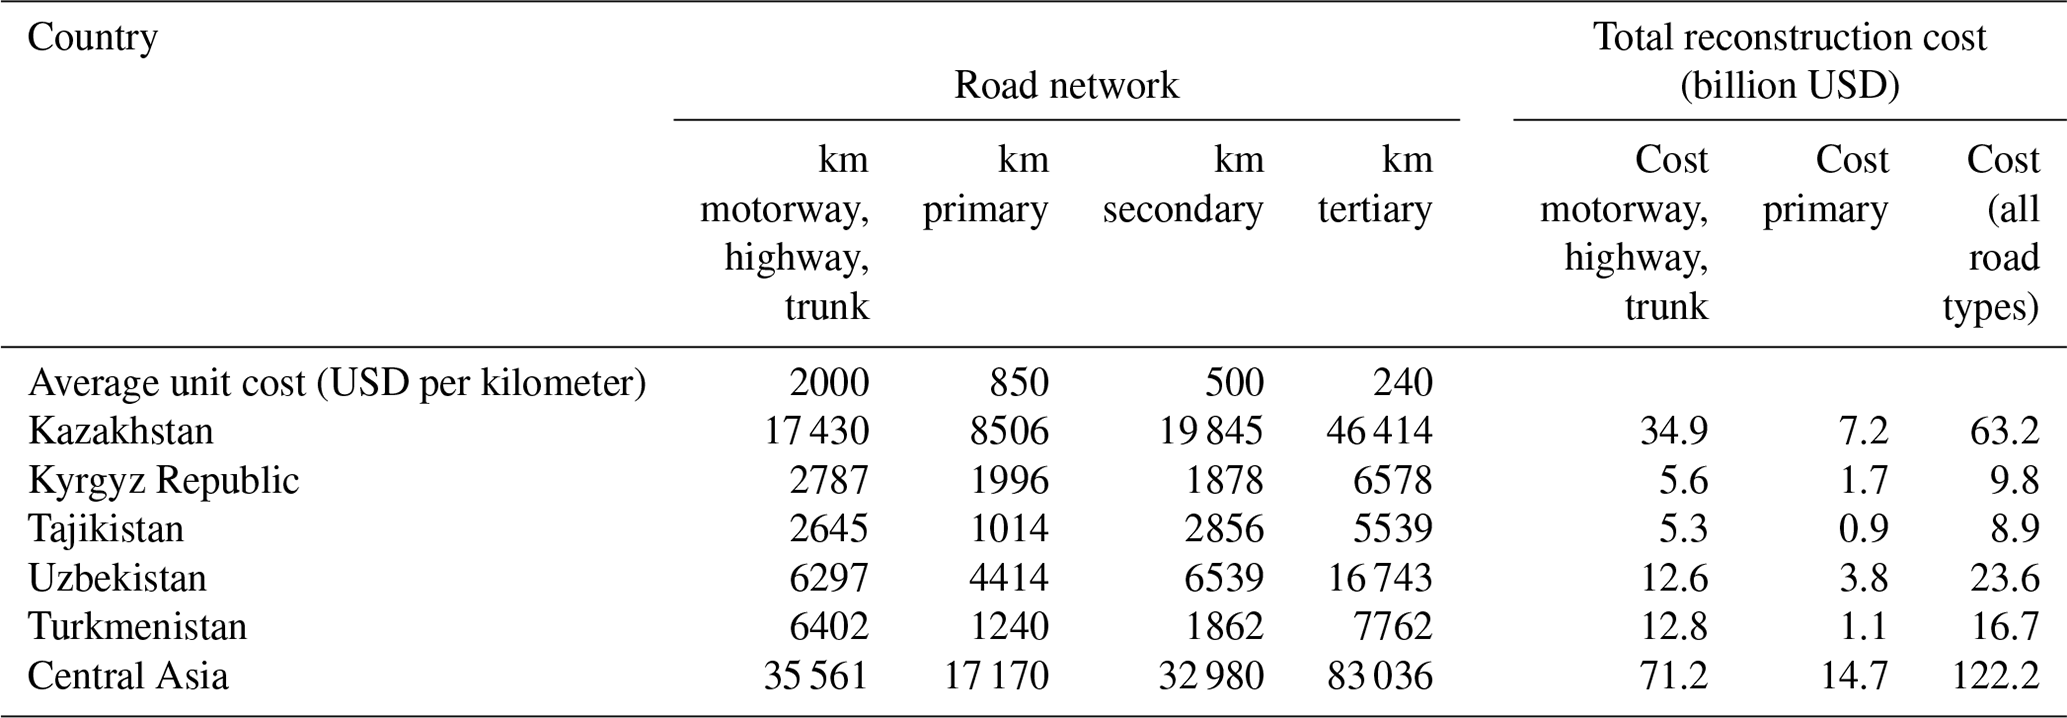
As for costs, no prior official information on transportation assets' reconstruction costs was available. We defined the costs based on country-based information provided by local partners. Given the variability in costs collected, also due to the different soil and construction conditions, we provide both ranges and average values (Table 3 in the Results section).
4.3 Croplands
The cotton area and yield in each Central Asian country and each sub-national administrative unit (oblast) were provided by local partners. Such values were used as a starting point for the definition of the exposure layers. The spatial distribution of different croplands was inferred in two steps:
-
First, the areas where cotton and wheat are cultivated were inferred from the Global Food Security Support Analysis Data (GFSAD) Crop Dominance dataset (Teluguntla et al., 2015; NASA, 2021), available at 1 km resolution. Cotton is associated with class 3 (“irrigated mixed crops”), together with wheat, rice and orchards. Wheat is also found in other classes (1, 2, 4, 5, 7), while class 8 was not considered since the wheat fractions is considered negligible with respect to the other crop dominance classes.
-
Second, the land cover cropland fraction (Table 1), which has higher resolution (100 m), allowed for discarding cells with a low fraction of cropland coverage.
Having identified the areas where cotton and wheat crops are present, the country-based information obtained for each country and oblast was distributed spatially. The total cultivated area of cotton and wheat in each oblast was disaggregated in each 100 m cell proportionally to the cropland fraction. The taxonomy for croplands corresponds to the one proposed by GED4ALL taxonomy (Silva et al., 2022). In order to assess the expected exposed value, country-based values of yield and price were used (Table 4 in the Results section). Based on the collected information on production and cost, we calculated the exposed value of cotton and wheat croplands in each 100 m cell and the total values per oblast and country.
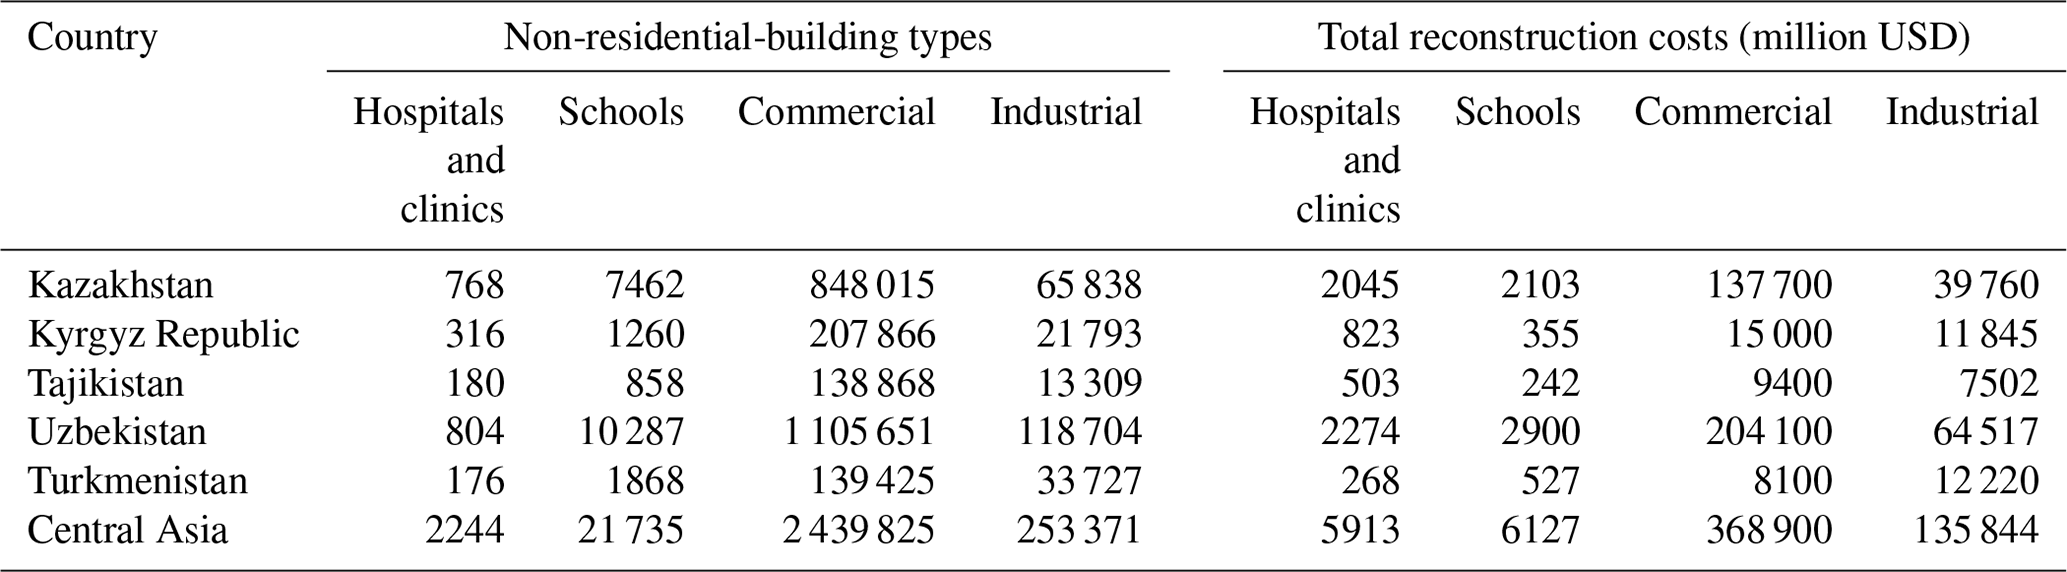
Table 2Number of healthcare (hospitals and clinics), school, commercial and industrial buildings and their corresponding total reconstruction cost in each Central Asian country and for the entire region (in million USD).
5.1 Non-residential buildings
Results of the exposure assessment provide the total number of buildings and exposed value for each country and for the non-residential-building types considered (Table 2).
Higher total non-residential-building reconstruction costs are found in Kazakhstan and Uzbekistan. The larger reconstruction costs are associated with commercial buildings, followed by industrial buildings. Both are present in larger number compared to healthcare and school facilities but have a lower reconstruction cost per building unit. On average, non-residential buildings account for 40 % of the total building reconstruction costs estimated in Central Asia, with larger values (up to 50 %) in Turkmenistan and values lower than 30 % in Tajikistan.
Non-residential-building assets were collected in a geospatial database. Figure 2 shows the distribution of education and healthcare facilities in Central Asia. Similar maps can be produced based on the geospatial database developed for other non-residential-building types considered during the project.
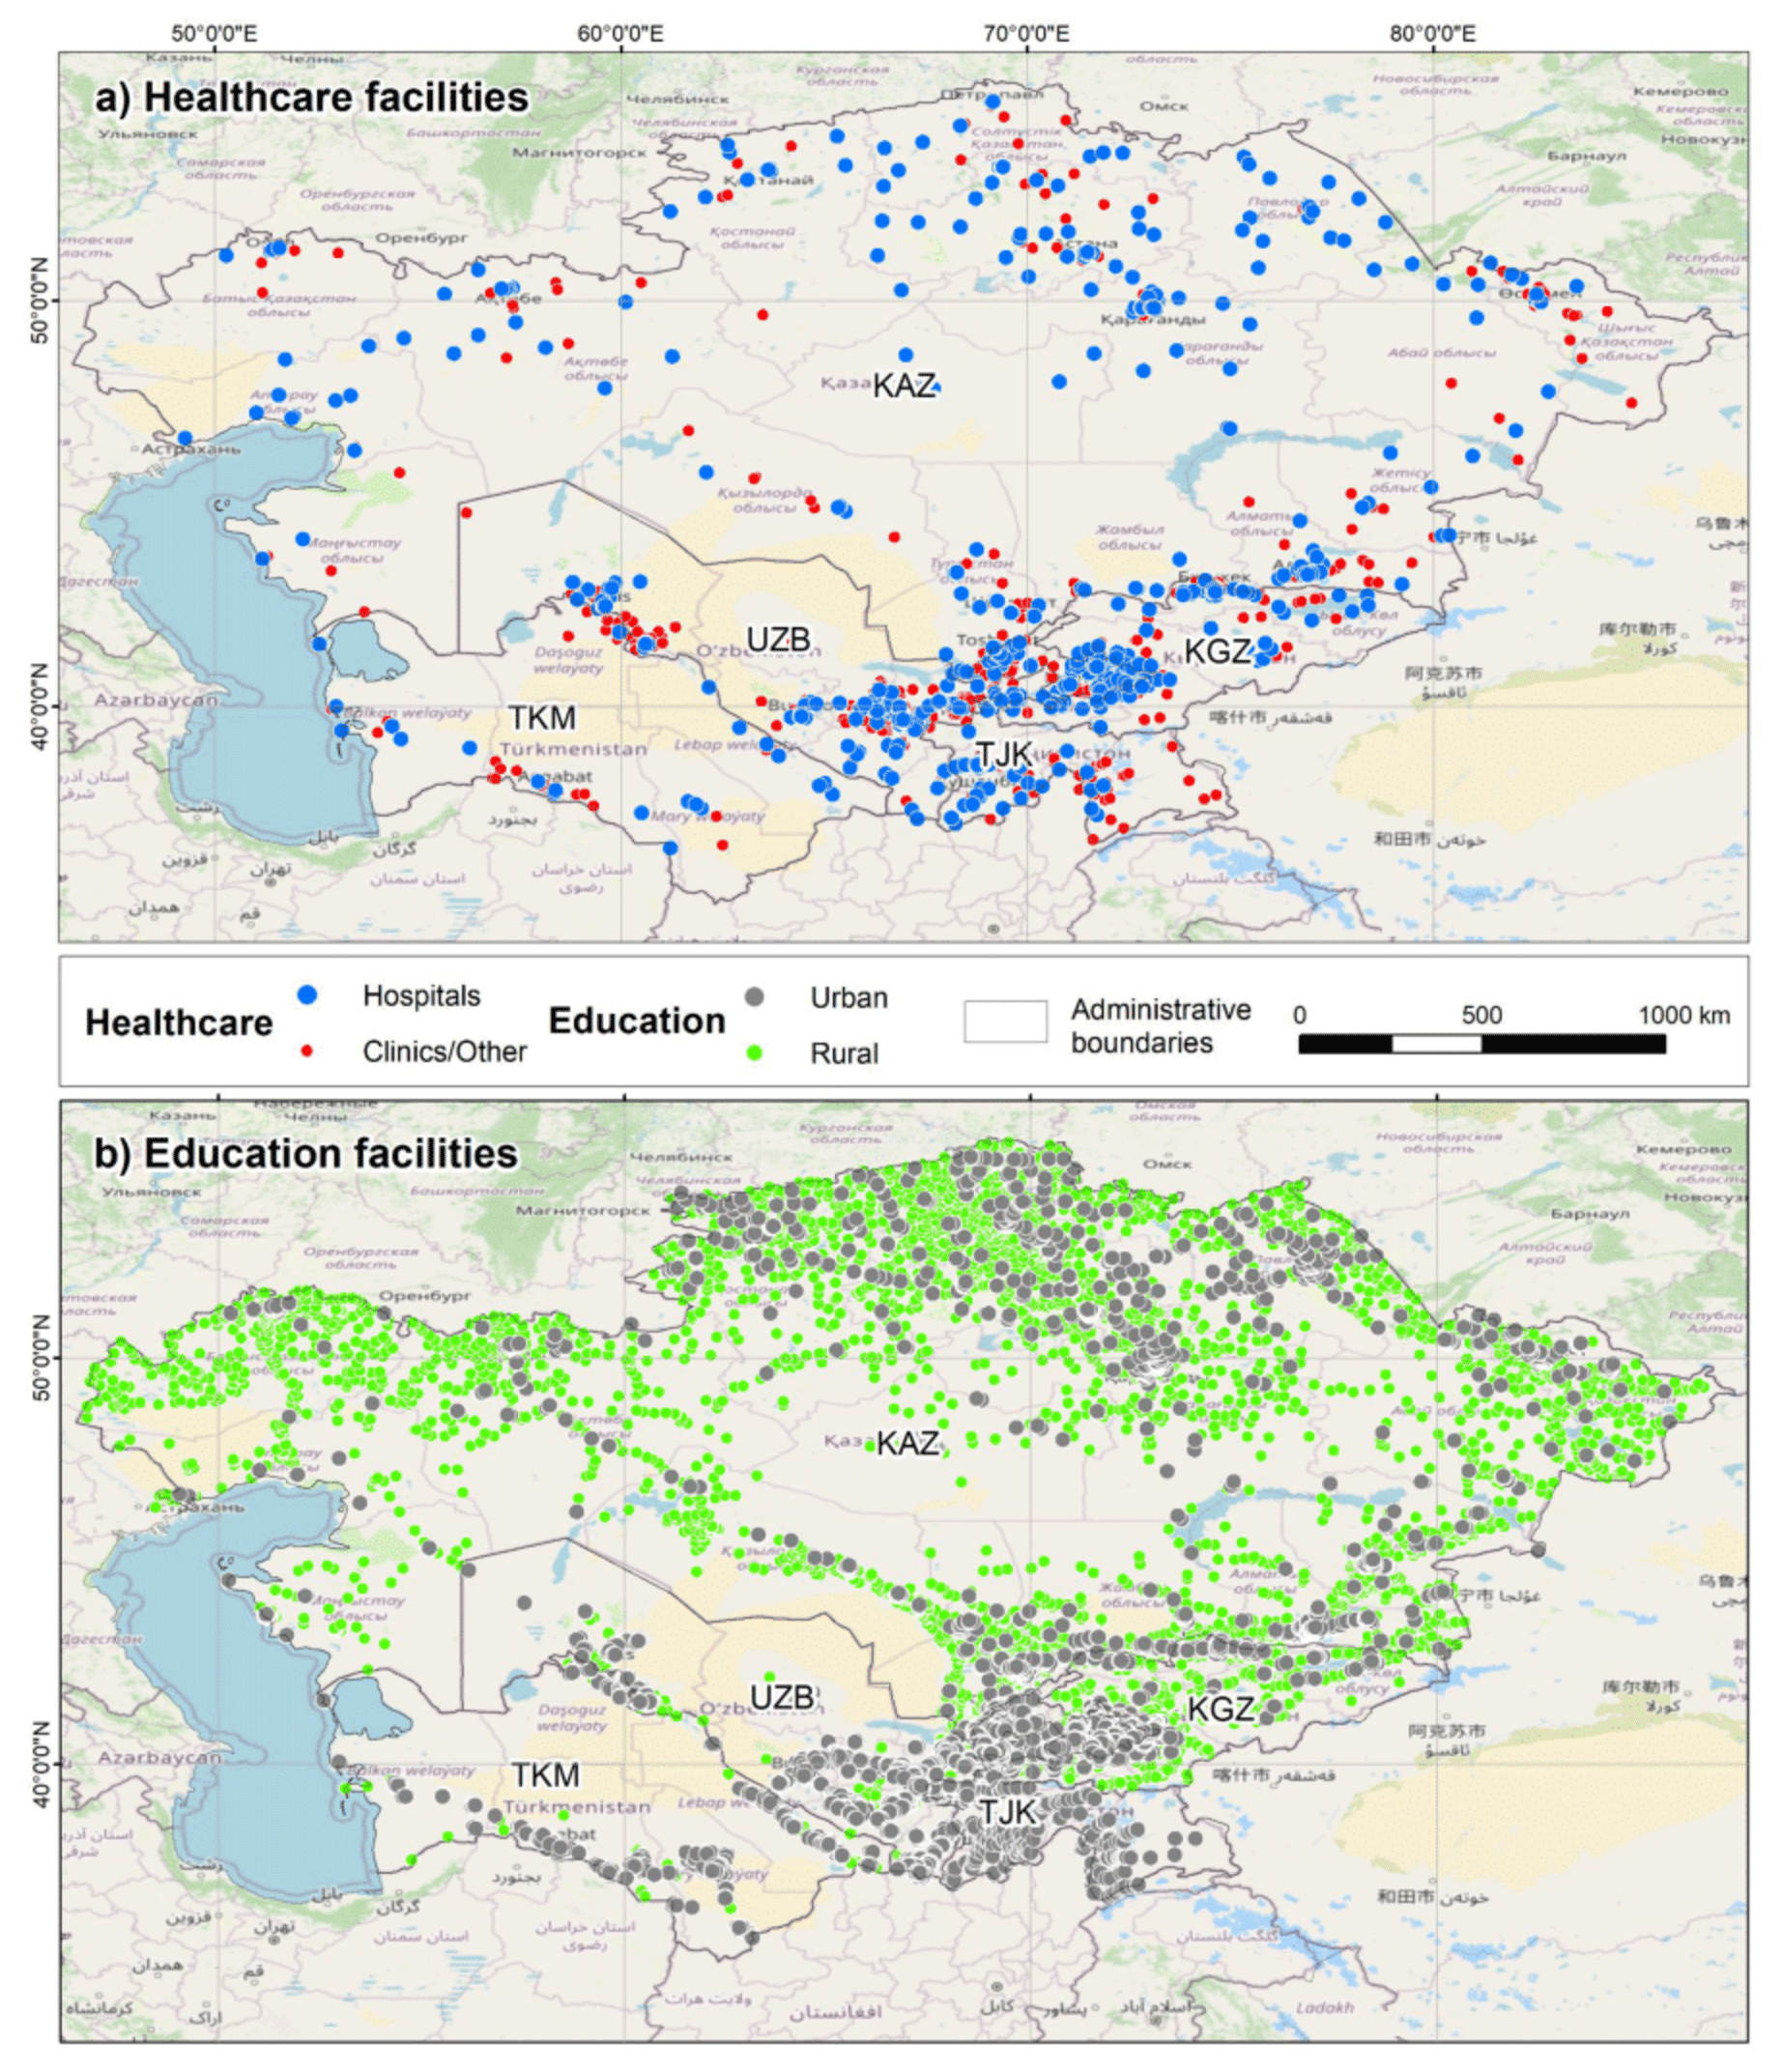
Figure 2Map of healthcare facilities in the five Central Asian countries – Kazakhstan (KAZ), the Kyrgyz Republic (KGZ), Tajikistan (TJK), Uzbekistan (UZB) and Turkmenistan (TKM) – classified into hospitals and clinics and other facilities (a). Map of education facilities classified into rural and urban (b). Map data from OpenStreetMap are available from https://www.openstreetmap.org (last access: 20 November 2023) (© OpenStreetMap contributors, 2023, distributed under the Open Data Commons Open Database License – OdbL v1.0).
5.2 Transportation
Results of the analysis comprise a geospatial database of the main transportation assets (roads, railways and bridges) in Central Asia and the estimation of the associated reconstruction costs. Figure 3 shows a map of transportation assets in Central Asia. Table 3 provides the total length of each type of road in each country of Central Asia and for the entire region, together with the total estimated reconstruction costs. Average unit costs for each road type are also provided in the table. The larger reconstruction costs are associated with Kazakhstan, followed by Uzbekistan, and are mostly associated with motorways and highways which have the larger unit cost and a wide coverage in the two aforementioned countries, in particular in Kazakhstan (Fig. 3 and Table 3).
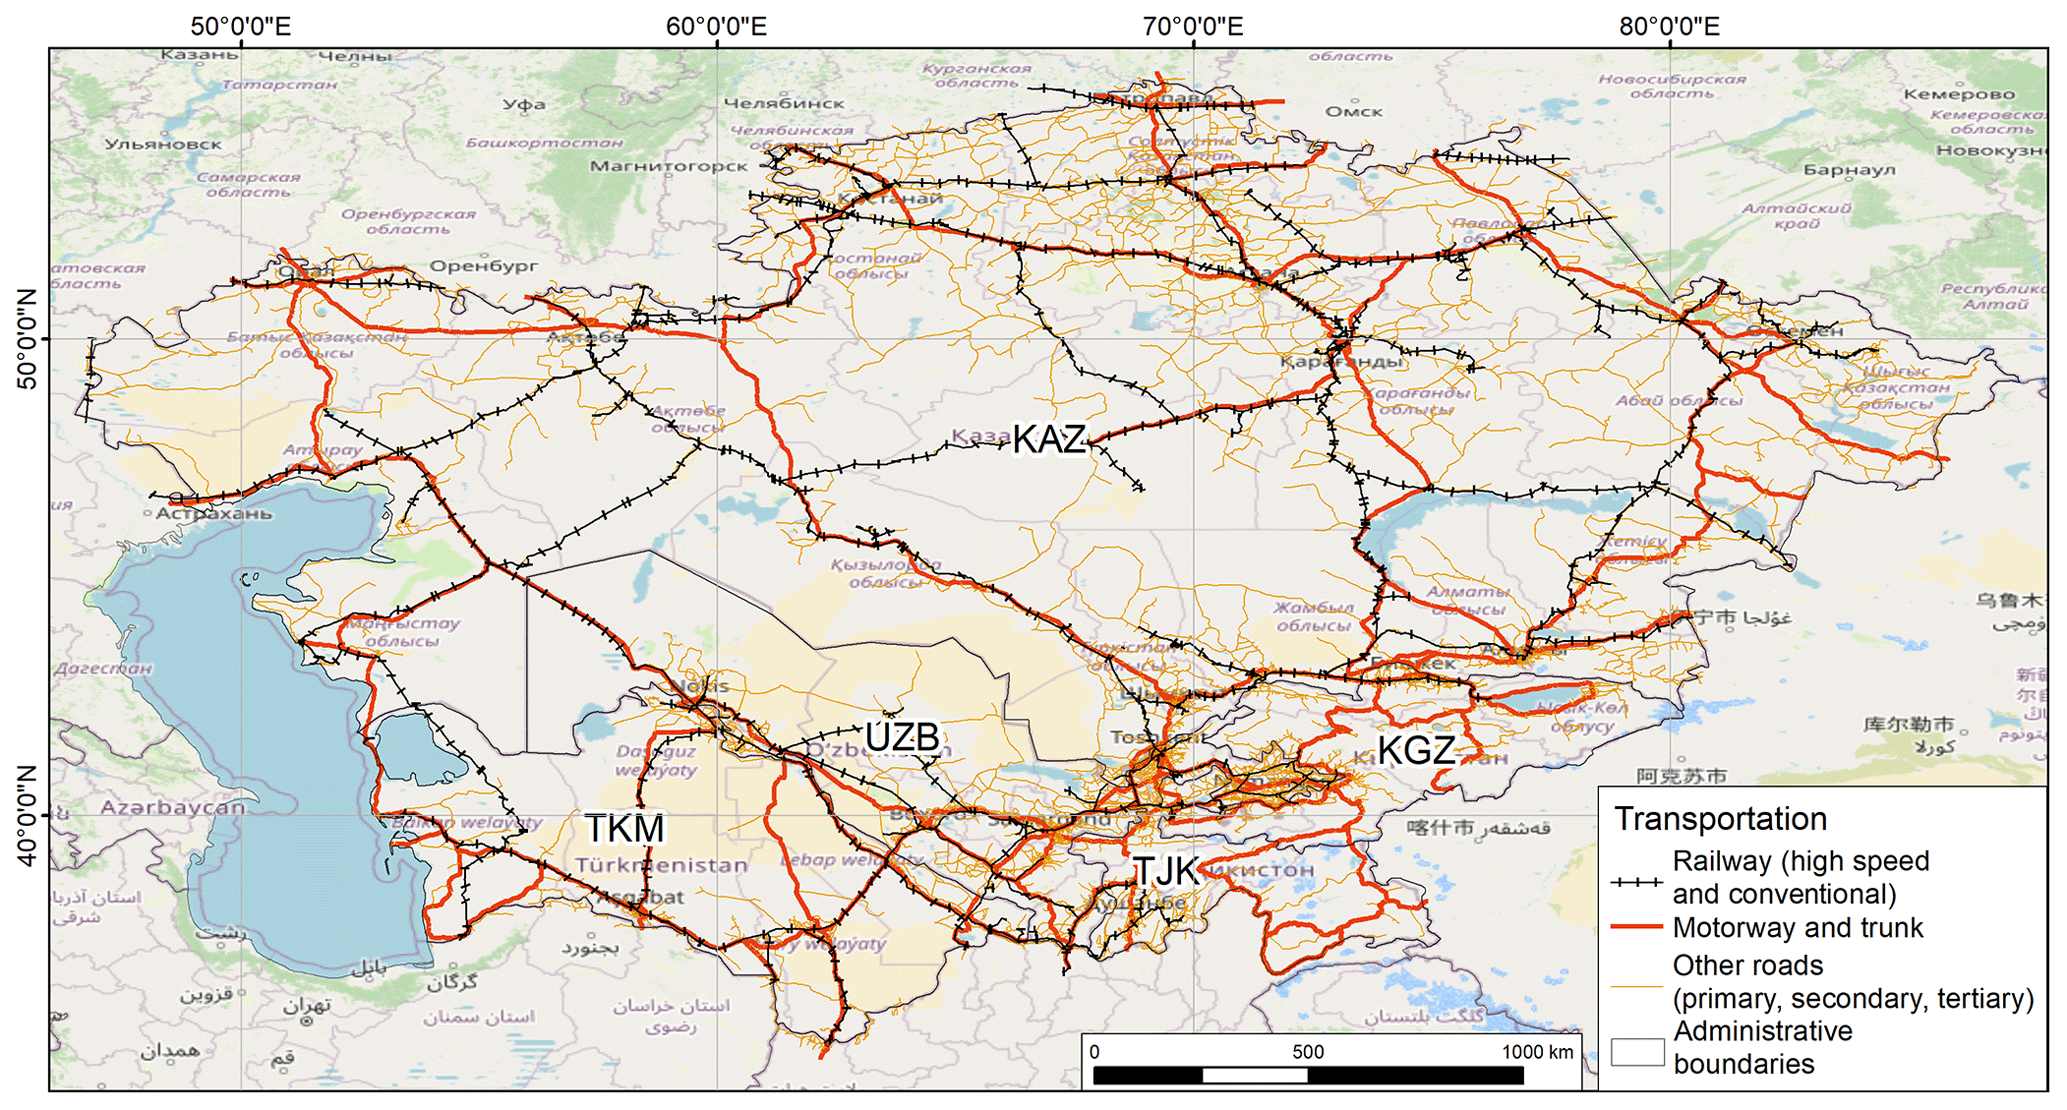
Figure 3Map of the road and railway network in the five Central Asian countries – Kazakhstan (KAZ), the Kyrgyz Republic (KGZ), Tajikistan (TJK), Uzbekistan (UZB) and Turkmenistan (TKM) – included in the exposure database, classified into different types (motorway, trunk, primary, secondary and tertiary). Map data from OpenStreetMap are available from https://www.openstreetmap.org (last access: 20 November 2023) (© OpenStreetMap contributors, 2023, distributed under the Open Data Commons Open Database License – OdbL v1.0).
Table 3Total length of road network types and total reconstruction costs estimated for each Central Asian country and for the entire region. Average unit costs for each road type are also provided (first row under header).
5.3 Croplands
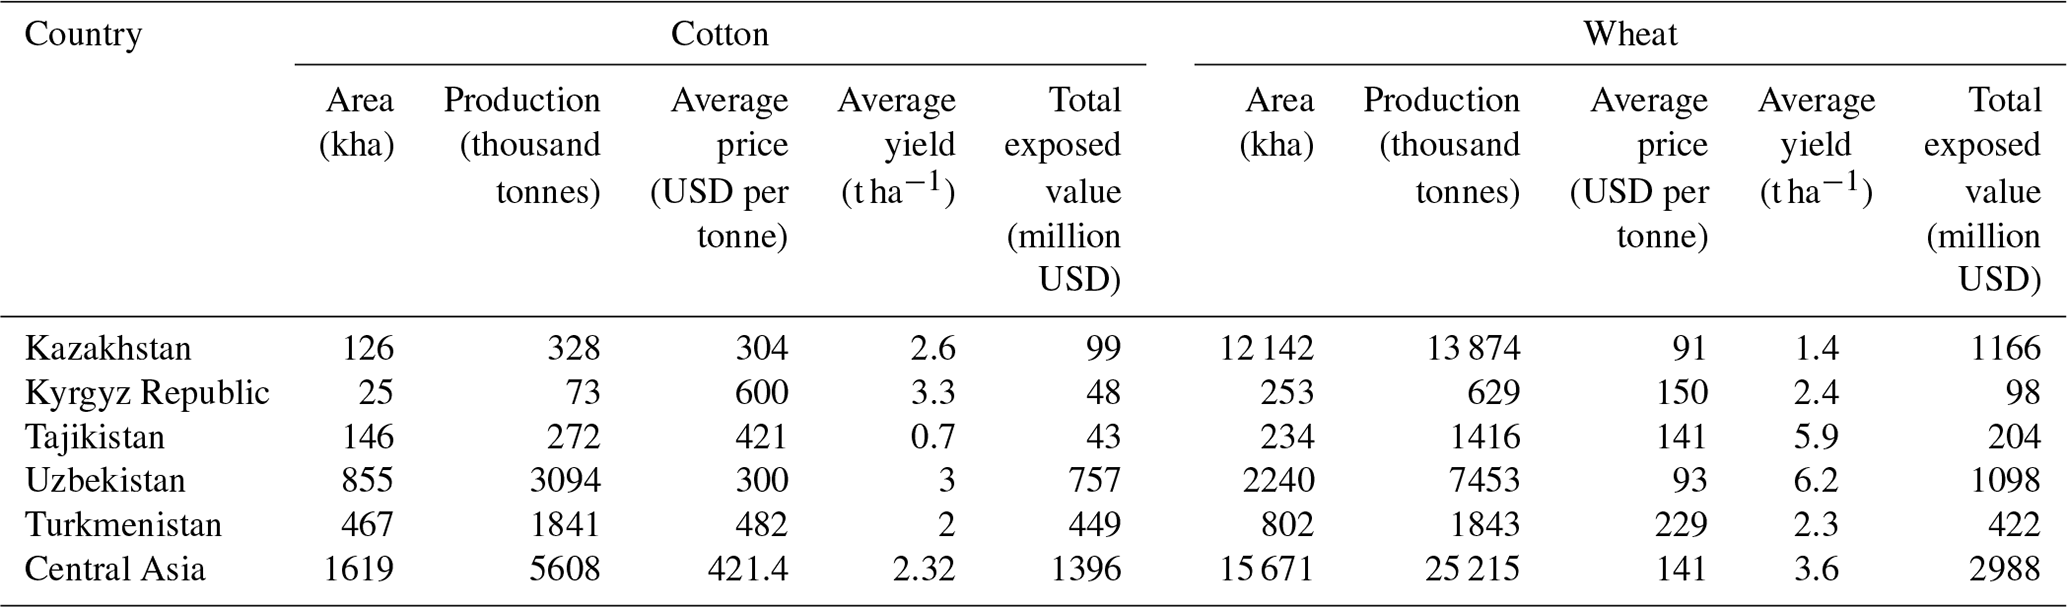
Figure 4 shows the exposure maps produced at the regional scale for cotton and wheat croplands at 100 m resolution. Table 4 provides the total wheat and cotton production in each Central Asian country and oblast, together with country-based average yield and price. The total exposed value of cotton and wheat croplands for the entire Central Asian region is approximately USD 3000 million. The largest production of cotton is found in Uzbekistan and Turkmenistan. The greatest production of wheat is found in Kazakhstan, followed by Uzbekistan.
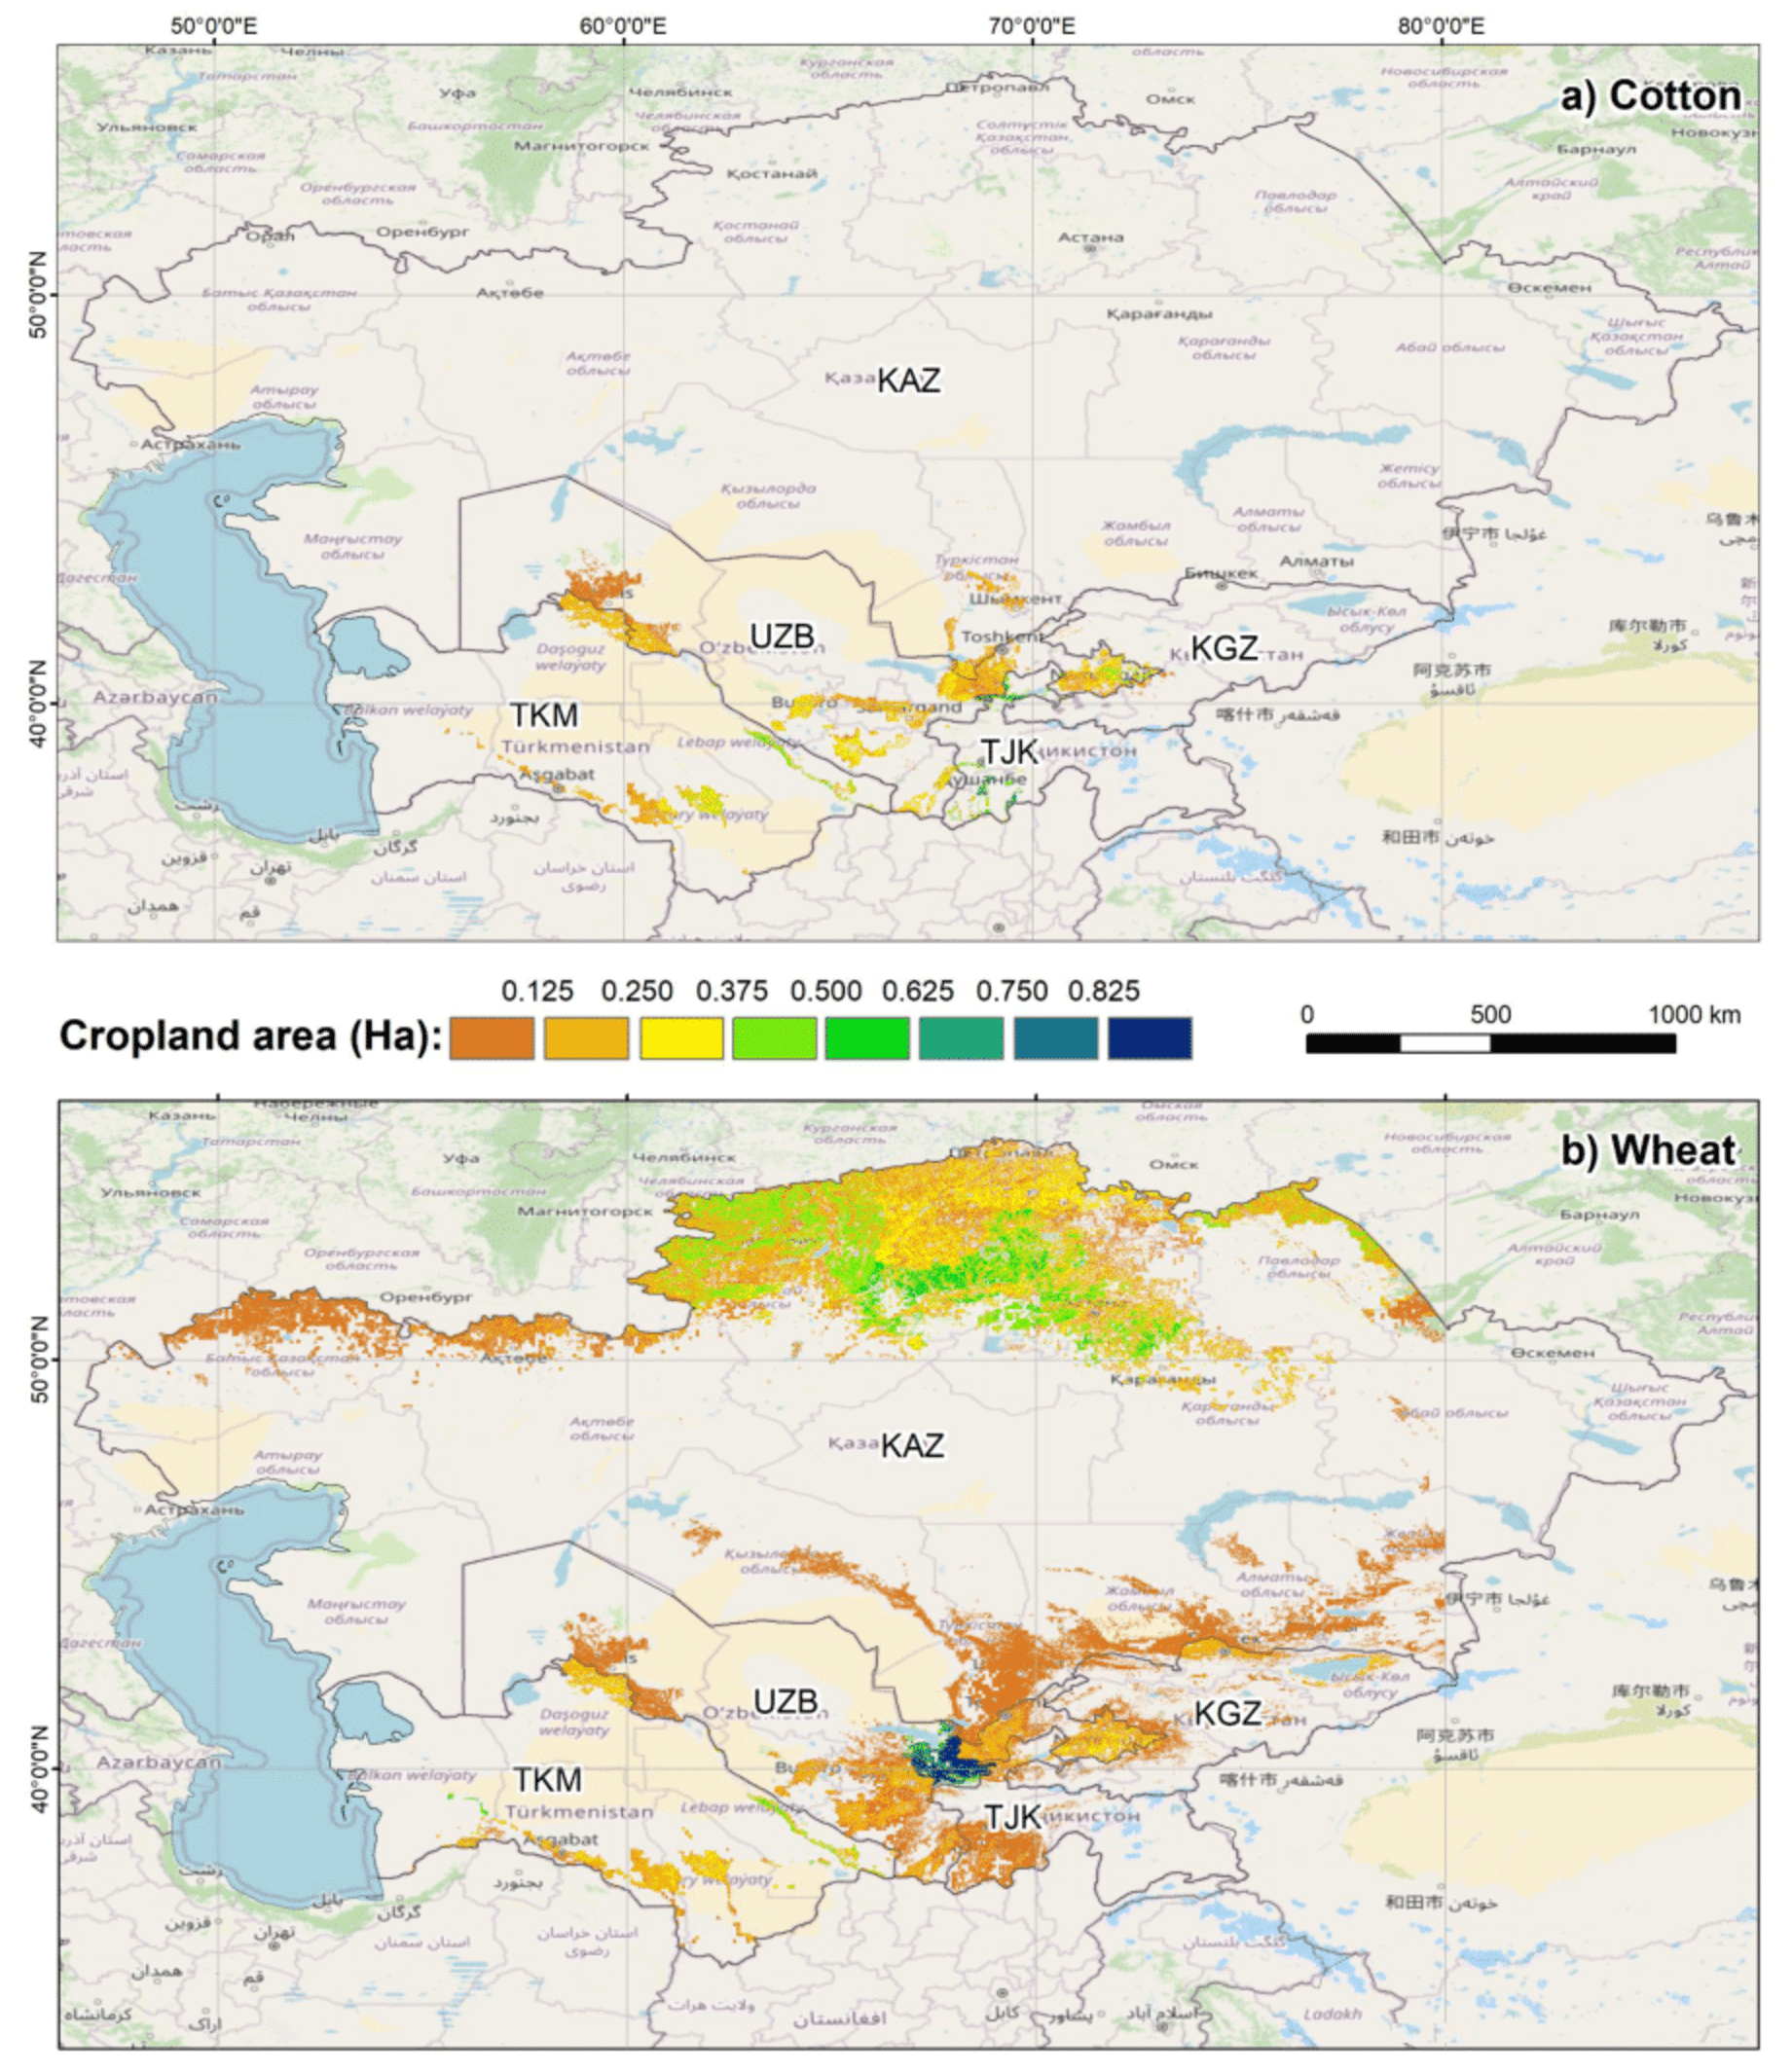
Figure 4Exposure maps produced for cotton (a) and wheat (b) croplands in the five Central Asian countries – Kazakhstan (KAZ), the Kyrgyz Republic (KGZ), Tajikistan (TJK), Uzbekistan (UZB) and Turkmenistan (TKM) – at 100 m resolution. Map data from OpenStreetMap are available from https://www.openstreetmap.org (last access: 20 November 2023) (© OpenStreetMap contributors, 2023, distributed under the Open Data Commons Open Database License – OdbL v1.0).
Table 4Total area, production and exposed value of cotton and wheat production in each country and for the entire Central Asian region. Average price and yield are also provided for each country.
The work presented here develops the first regional-scale exposure layers for selected critical-infrastructure assets (namely, non-residential building, transportation and croplands). The process of collecting the available information, which is scattered across sources, is particularly challenging for critical-infrastructure exposure layers, as also pointed out by Batista e Silva et al. (2019). Here, we tackled this problem by integrating country-based data into the global and regional datasets used to develop critical-infrastructure exposure layers (e.g., OSM; Nirandjan et al., 2022), We collected country-based data for each of the five Central Asian countries, thanks to a strong interaction with national research groups and stakeholders (Peresan et al., 2023). The developed approach shows how relevant the contribution of local partners is in developing exposure datasets. It also highlights the importance and difficulties of the data integration process and shows how country-based data can provide added value to regional-scale exposure datasets of this kind. Country-based data were aggregated and harmonized at the regional scale using an existing multi-hazard taxonomy (GED4ALL). The method developed here, and exemplified for Central Asia, demonstrates that the GED4ALL taxonomy is suitable for the development of regional-scale exposure datasets for critical infrastructure. A similar approach can be applied to other regions but needs to be adapted to the specific conditions (e.g., degree of involvement of national institutions, presence of mobility limitations).
The work is based on several assumptions which are required in order to assemble the first regional-scale layers of their kind. In particular, we relied on the socio-economic data (e.g., percentage of employees in different sectors) to infer the number of commercial and industrial buildings, as also done by Crowley et al. (2020) for commercial buildings. In our case, due to the absence of specific data on the commercial, industrial and healthcare typologies, we used data from Europe or post-Soviet countries assuming that they apply to Central Asia. However, the relative importance of retail and wholesale varies across EU member states and might vary as well across Central Asia. Hence, further analysis might be required in the future in order to achieve a higher accuracy. Also, we defined broad typologies that comprise multiple building types (e.g., EMCA typologies), as previously done by other authors for buildings (e.g., Wieland et al., 2015, and Pittore et al., 2020, for Central Asia; Calderón et al., 2022, for Central America; Yepes-Estrada et al., 2017, for South America; Yepes-Estrada et al., 2023, at the global scale). These typologies can be associated with multiple vulnerability or fragility curves, combined under general assumptions. For example, retail commercial buildings in Central Asia were assumed to be similar to residential buildings, as also confirmed by local partners during the interaction with them. Hence, the characteristics of retail buildings were defined based on each country's residential building stock. Different assumptions were performed by Crowley et al. (2020), who developed the first exposure dataset of non-residential buildings for Europe using multiple categories (e.g., classifying commercial buildings into wholesale, retail, offices, hotels and restaurants). The different approaches are mostly due to the larger amount of information available in Europe (e.g., details on building typologies and employment statistics by line of business). Finally, while some non-residential buildings have been mapped by global projects (e.g., schools), information on the spatial distribution of commercial and industrial buildings is usually scarce, as underlined by Batista e Silva et al. (2019) for the European context. Here, they were mapped using a simplified approach based on proxies (e.g., population or land use), as commonly done in data-scarce regions (De Bono and Mora, 2014; Gomez-Zapata et al., 2021).
Thanks to the high resolution of the population layer adopted in the analysis (Scaini et al., 2023), the exposure dataset for non-residential buildings and croplands was developed at a considerably high resolution (500 and 100 m, respectively). This supports the assessment of risk related to floods and potentially landslides, for which a much higher resolution is needed in order to provide reliable results with respect to earthquakes. Nonetheless, regional-scale datasets such as the one presented here can only support simplified damage/risk assessment that should be calibrated and validated carefully based on past events, when possible, and more specific information on the performance of building typologies considered. This is relevant not only for floods and landslides but also for earthquakes (Wald, 2023 ) to prevent over- or under-estimation of potential risks. For this reason, the suggested usage of the exposure layers provided here (non-residential buildings, transportation and croplands) is limited to the regional or national scale. However, depending on the type, coverage and quality of data used as input, we can associate them with different reliability levels. In particular, the transportation database was developed based on OSM, which is considered a reliable source in terms of both the location and the classification of roads and railways and is consistent with the available country-based data. Similarly, the cropland dataset is developed based on recognized products which undergo specific validation processes and on national-scale official data (e.g., wheat/cotton production for each oblast). Both datasets are therefore considered reliable for regional-scale damage and risk assessment purposes. Non-residential buildings were developed under stronger assumptions and are therefore deemed less reliable. The schools and hospitals layers, despite the availability of location and type for some countries (e.g., from the Global Healthsites Mapping Project database, Table 1), rely on scarce information on their characteristics. For this reason, they are considered of medium reliability. Exposure layers for commercial and industrial buildings are developed based on strong assumptions on both the type and the distribution of assets, and data integration is required in order to validate the layer. For the time being, their use is suggested as a starting point for further exposure development efforts rather than proper damage/risk assessment. Finally, the dataset of bridges extracted from OSM and identified based on spatial analysis is likely to be incomplete and should not be used to perform a specific risk assessment but can act as a starting point for the collection of additional information based on complementary surveys and the analysis of remote sensing images.
Future work might be required in order to resolve these critical aspects using country-based specific information. In particular, a strong effort should be devoted to validating the dataset based on additional data that might be available to local public and private stakeholders. This is particularly valid in areas with low data coverage and/or undergoing land use changes. The layers provided here are nonetheless a first step towards disaster risk reduction (DRR) as they provide risk-related information to a broad community of researchers, stakeholders and practitioners, allowing the first-level assessment of expected damage and risks in the region. However, the selection of assets at stake is not limited to the ones considered here, and others might be potentially relevant (e.g., energy production sites and infrastructure). Also, classifications such as GED4ALL (Silva et al., 2022), adopted here, and the one proposed by Murnane et al. (2019) allow for cross-hazard comparisons of risk but do not account for dynamics and feedback loops between the different components of risk (Ward et al., 2022). Future work in this direction might include the estimation of expected risk in the region for one or multiple hazardous phenomena and accounting for potential cascading effects (e.g., flood and drought impacts on croplands and food industry disruption). The time coverage of critical-infrastructure exposure data is also dishomogeneous and often incomplete: further efforts should be made in order to update the database in the future, for example using data provided by citizens, not only for buildings (Schorlemmer et al., 2020; Scaini et al., 2022) but also for other assets such as croplands.
This work describes an exposure assessment methodology to develop exposure layers for critical infrastructure. This method circumvents the challenges related to the lack of exposure data by collecting country-based information provided by local authorities and research groups that are successfully engaged in fruitful interactions through meetings and workshops. The method is employed to develop the first high-resolution, regional-scale exposure layers for critical infrastructure in Central Asia for non-residential buildings (healthcare, educational, commercial and industrial), transportation and croplands. The working team collected the characteristics deemed relevant for multiple hazards (earthquakes, floods, landslides) by assembling the available global and regional datasets made available to the scientific community. Reconstruction costs, which are particularly difficult to retrieve, were derived from country-based information for the asset types considered. Results are geospatial layers containing the exposed assets classified using a standardized multi-hazard exposure taxonomy that supports future multi-hazard and multi-risk assessment. The total exposed value for the different asset types shows that the potential losses associated with non-residential buildings, croplands and transportation are not negligible for financial risk assessment. Exposure databases of this kind support further analysis to integrate data from national and sub-national projects into critical-infrastructure datasets and enrich risk-related knowledge to inform regional-scale disaster risk reduction strategies.
The data used to develop the input layer are available at the links provided in Table 1 and in the references. In particular, the road and railway network was extracted from the OpenStreetMap database (OpenStreetMap contributors, 2023) and from the Global Roads Inventory Project (Meijer et al., 2018; https://www.globio.info/download-grip-dataset, GloBio, 2022) and, for the Kyrgyz Republic, from the Central Asian Institute for Applied Geosciences GeoNode-Based Geodata Repository (https://geonode.caiag.kg/, CAIAG, 2022). The Mineral Facilities of Northern and Central Eurasia dataset is available at https://pubs.usgs.gov/of/2010/1255/ (Baker et al., 2010). Employee statistics and economic indicators were retrieved from the World Bank data portal (https://data.worldbank.org/indicator/NV.AGR.TOTL.ZS, World Bank, 2020) and the Eurostat database (https://ec.europa.eu/eurostat/databrowser/view/LFSQ_EISN2__custom_1304651/default/table?lang=en, Eurostat, 1980). The global healthcare facility dataset can be downloaded from the Healthcare facility database website (Weiss et al., 2020; https://www.healthsites.io/, Global Healthsites Mapping Project, 2023). The global school dataset was retrieved from the Unicef Project Connect website (https://projectconnect.unicef.org/map/countries, UNICEF, 2022). School maps for Tajikistan were retrieved from the Tajikistan Geonode (2023, https://geonode.wfp.org/). The Global Food Security Support Analysis Data (GFSAD) Crop Dominance dataset (Teluguntla et al., 2015) was retrieved at the following link: https://lpdaac.usgs.gov/products/gfsad1kcdv001/, NASA, 2021). The global land cover fraction was downloaded from https://doi.org/10.5281/zenodo.3939050 (Buchhorn et al., 2020). The exposure datasets for each of the five Central Asian countries developed as part of the Strengthening Financial Resilience and Accelerating Risk Reduction in Central Asia program (https://www.gfdrr.org/en/program/SFRARR-Central-Asia, GFDRR, 2024) are available at the World Bank data portal under the Creative Commons Attribution 4.0 license. The non-residential-building datasets are available at https://datacatalog.worldbank.org/search/dataset/0064288/Central-Asia-exposure-dataset—Non-residential-buildings (World Bank, 2023a) and are titled “Central Asia exposure dataset – Non-residential buildings (education, healthcare, industrial, commercial)” followed by the country abbreviation (KAZ for Kazakhstan, KGZ for the Kyrgyz Republic, TJK for Tajikistan, TKM for Turkmenistan, UZB for Uzbekistan). The transportation datasets are available at https://datacatalog.worldbank.org/search/dataset/0064252/Central-Asia-exposure-dataset---Transport (World Bank, 2023b) and are titled “Central Asia exposure dataset – Transport- Roads and rail” followed by the country abbreviation (KAZ for Kazakhstan, KGZ for the Kyrgyz Republic, TJK for Tajikistan, TKM for Turkmenistan, UZB for Uzbekistan). The croplands dataset is available at https://datacatalog.worldbank.org/search/dataset/0064248/Central-Asia-exposure-dataset---agricultural-crops (World Bank, 2023c) and is titled “Central Asia exposure layers – cotton and wheat cropland” followed by the country abbreviation (KAZ for Kazakhstan, KGZ for the Kyrgyz Republic, TJK for Tajikistan, TKM for Turkmenistan, UZB for Uzbekistan).
CS, AT and EF developed the exposure assessment methodology, and CS and AT carried out the analyses. All co-authors contributed to the data collection and to the discussion of results. CS prepared the manuscript with contributions from all co-authors.
The contact author has declared that none of the authors has any competing interests.
The authors of this document are part of an international consortium of experts that has been hired by the World Bank to implement many of the work under the SFRARR Central Asia program. This model has been produced with the assistance of the European Union, the World Bank and GFDRR. The sole responsibility of this publication lies with the author and can in no way be taken to reflect the views of the three institutions. The European Union, the World Bank or GFDRR is not responsible for any use that may be made of the information contained therein.
Publisher's note: Copernicus Publications remains neutral with regard to jurisdictional claims made in the text, published maps, institutional affiliations, or any other geographical representation in this paper. While Copernicus Publications makes every effort to include appropriate place names, the final responsibility lies with the authors.
This article is part of the special issue “Regionally consistent risk assessment for earthquakes and floods and selective landslide scenario analysis in Central Asia”. It is not associated with a conference.
The project was developed within the project Strengthening Financial Resilience and Accelerating Risk Reduction in Central Asia (SFRARR), funded by the European Union, managed by the Global Facility for Disaster Reduction and Recovery (GFDRR), and implemented by the World Bank. We sincerely thank all the project team members, in particular Sergey Tyagunov, Paola Ceresa, Antonella Peresan, Gabriele Coccia, Denis Sandron and Stefano Parolai, and the World Bank specialists, in particular Stuart Alexander Fraser and Madina Nizamitdin, for their constructive contributions to the project. We are grateful for the suggestions and feedback from the editor and the two reviewers, which substantially improved the manuscript. In particular, the input of reviewer 2 played a pivotal role in enhancing the paper, ultimately shaping it into its current state.
This research has been supported by the World Bank Group (consulting services contract no. 8006611 – Regionally consistent risk assessment for earthquakes and floods and selective landslide scenario analysis for strengthening financial resilience and accelerating risk reduction in Central Asia).
This paper was edited by Brunella Bonaccorso and reviewed by Filippo Gatti and Charles Rougé.
Argyroudis, S. A., Mitoulis, S. A., Hofer, L., Zanini, M. A., Tubaldi, E., and Frangopol, D. M.: Resilience assessment framework for critical infrastructure in a multi-hazard environment: Case study on transport assets, Sci. Total Environ., 714, 136854, https://doi.org/10.1016/j.scitotenv.2020.136854, 2020.
Baker, M. S., Nurudeen, E., Guzmán, E., and Soto-Viruet, Y.: Mineral Facilities of Northern and Central Eurasia, USGS [data set], https://pubs.usgs.gov/of/2010/1255/ (last access: 20 October 2021), 2010.
Batista e Silva, F., Forzieri, G., Marin Herrera, M. A., Bianchi, A., Lavalle, C., and Feyen, L.: HARCI-EU, a harmonized gridded dataset of critical infrastructures in Europe for large-scale risk assessments, Sci. Data, 6, 126, https://doi.org/10.1038/s41597-019-0135-1, 2019.
Bindi, D., Abdrakhmatov, K., Parolai, S., Mucciarelli, M., Grünthal, G., Ischuk, A., Mikhailova, N., and Zschau, J.: Seismic hazard assessment in Central Asia: Outcomes from a site approach, Soil Dynam. Earthq. Eng., 37, 84–91, 2012.
Buchhorn, M., Smets, B., Bertels, L., Lesiv, M., Tsendbazar, N.-E., Masiliunas, D., Linlin, L., Herold, M., and Fritz, S.: Copernicus Global Land Service: Land Cover 100 m: Collection 3: epoch 2019: Globe (Version V3.0.1) [Data set], Zenodo [data set], https://doi.org/10.5281/zenodo.3939050, 2020.
Calderón, A., Silva, V., Avilés, M., Castillo, R., Gil, J. C., and Lopez, M. A.: Toward a uniform earthquake loss model across Central America, Earthq. Spectra, 38, 178–199, https://doi.org/10.1177/87552930211043894, 2022.
CIESIN – Center for International Earth Science Information Network: Global Rural-Urban Mapping Project (GRUMP), Columbia University, CUNY Institute for Demographic Research (CIDR), City University of New York, https://sedac.ciesin.columbia.edu/data/collection/grump-v1 (last access: 10 December 2021), 2021.
CAIAG – Central Asian Institute for Applied Geosciences: GeoNode-Based Geodata Repository, https://geonode.caiag.kg/ (last access: 10 November 2022), 2022.
Crowley, H., Despotaki, V., Rodrigues, S., Silva, V., Toma-Danila, D., Riga, E., Karatzetzou, A., Fotopoulou, S., Zugic, A., Sousa, L., Ozcebe, S., and Gamba, P.: Exposure model for European seismic risk assessment, Earthq. Spectra, 36, 875529302091942, https://doi.org/10.1177/8755293020919429, 2020.
De Bono, A. and Mora, M. G.: A global exposure model for disaster risk assessment, Int. J. Disast. Risk Reduct., 10, 442–451, https://doi.org/10.1016/j.ijdrr.2014.05.008, 2014.
EuroCommerce: Analysis Of The Labour Market In Retail And Wholesale, 232 pp., https://www.bollettinoadapt.it/wp-content/uploads/2018/10/Ricerca-Eurocommerce-Analysis-of-the-labour-market-in-retail (last access: 20 October 2021), 2017.
Eurostat: Data on employment by sex, age, occupation and economic activity, Statistical Office of the European Communities, Luxembourg-Kirchberg, Eurostat [data set], https://ec.europa.eu/eurostat/databrowser/view/LFSQ_EISN2__custom_1304651/default/table?lang=en (last access: 31 January 2022), 1980.
FAO – Food and Agriculture Organization of the United Nations: Statistical Database, https://www.fao.org/faostat/en/#data (last access: 20 October 2021), 2019.
Fekete, A., Tzavella, K., and Baumhauer, R.: Spatial exposure aspects contributing to vulnerability and resilience assessments of urban critical infrastructure in a flood and blackout context, Nat. Hazards, 86, 151–176, https://doi.org/10.1007/s11069-016-2720-3, 2017.
FEMA – United States Federal Emergency Management Agency: HAZUS inventory technical manual, 185 pp., https://www.fema.gov/sites/default/files/documents/fema_hazus-inventory-technical-manual-4.2.3.pdf (last access: 20 October 2021), 2021.
Forzieri, G., Bianchi, A., Batista e Silva, F., Marin Herrera, M. A., Leblois, A., Lavalle, C., Aerts, J. C. J. H., and Feyen, L.: Escalating impacts of climate extremes on critical infrastructures in Europe, Global Environ. Change, 48, 97–107, https://doi.org/10.1016/j.gloenvcha.2017.11.007, 2018.
GFDRR: Strengthening Financial Resilience and Accelerating Risk Reduction in Central Asia, https://www.gfdrr.org/en/program/SFRARR-Central-Asia (last access: 1 February 2024), 2024.
Global Healthsites Mapping Project: https://www.healthsites.io/ (last access: 10 November 2023), 2023.
GloBio: GRIP global roads database, https://www.globio.info/download-grip-dataset (last access: 10 November 2022), 2022.
Gomez-Zapata, J. C., Brinckmann, N., Harig, S., Zafrir, R., Pittore, M., Cotton, F., and Babeyko, A.: Variable-resolution building exposure modelling for earthquake and tsunami scenario-based risk assessment: an application case in Lima, Peru, Nat. Hazards Earth Syst. Sci., 21, 3599–3628, https://doi.org/10.5194/nhess-21-3599-2021, 2021.
Karatzetzou, A., Stefanidis, S., Stefanidou, S., Tsinidis, G., and Pitilakis, D.: Unified hazard models for risk assessment of transportation networks in a multi-hazard environment, Int. J. Disast. Risk Reduct., 75, 102960, https://doi.org/10.1016/j.ijdrr.2022.102960, 2022.
Kienzler, K. M., Lamers, J. P. A., McDonald, A., Mirzabaev, A., Ibragimov, N., Egamberdiev, O., Ruzibaev, E., and Akramkhanov, A.: Conservation agriculture in Central Asia – What do we know and where do we go from here?, Field Crops Res., 132, 95–105, 2012.
Koks, E. E., Rozenberg, J., Zorn, C., Tariverdi, M., Vousdoukas, M., Fraser, S. A., Hall, J. W., and Hallegatte, S.: A global multi-hazard risk analysis of road and railway infrastructure assets, Nat. Commun., 10, 2677, https://doi.org/10.1038/s41467-019-10442-3, 2019.
Koks, E. E., van Ginkel, K. C. H., van Marle, M. J. E., and Lemnitzer, A.: Brief communication: Critical infrastructure impacts of the 2021 mid-July western European flood event, Nat. Hazards Earth Syst. Sci., 22, 3831–3838, https://doi.org/10.5194/nhess-22-3831-2022, 2022.
Krausmann, E. and Cruz, A. M.: Natech risk management in Japan after Fukushima – What have we learned?, Loss Prevention Bulletin 277, © Institution of Chemical Engineers, https://www.icheme.org/media/15301/krausmannnew.pdf (last access: 10 December 2021), 2021.
Li, Z., Fang, G., Yaning, C., Duan, W., and Mukanov. Y.: Agricultural Water Demands in CentralAsia Under 1.5 and 2.0 ∘C Global Warming, Agr. Water Manage., 231, 106020, https://doi.org/10.1016/j.agwat.2020.106020, 2020.
Libert, B., and Trombitcaia, I.: Advancing Dam Safety in Central Asia: The Contribution of the UNECE Water Convention, in: The UNECE Convention on the Protection and Use of Transboundary Watercourses and International Lakes – Its Contribution to International Water Cooperation, edited by: Tanzi, A., McIntyre, O., Kolliopoulos, A., Rieu-Clarke, A., and Kinna, R., Brill|Nijhoff, Leiden, the Netherlands, 394–407, https://doi.org/10.1163/9789004291584_028, 2015
Meijer, J. R., Huijbregts, M. A. J., Schotten, C. G. J., and Schipper, A. M.: Global patterns of current and future road infrastructure, Environ. Res. Lett., 13, 064006, https://doi.org/10.1088/1748-9326/aabd42, 2018.
Mukherjee, M., Abhinay, K., Rahman, M. M., Yangdhen, S., Sen, S., Adhikari, B. R., Nianthi, R., Sachdev, S., and Shaw, R.: Extent and evaluation of critical infrastructure, the status of resilience and its future dimensions in South Asia, Prog. Disast. Sci., 17, 100275, https://doi.org/10.1016/j.pdisas.2023.100275, 2023.
Murnane, R. J., Allegri, G., Bushi, A., Dabbeek, J., de Moel, H., Duncan, M., Fraser, S., Galasso, C., Giovando, C., Henshaw, P., Horsburgh, K., Huyck, C., Jenkins, S., Johnson, C., Kamihanda, G., Kijazi, J., Kikwasi, W., Kombe, W., Loughlin, S., Løvholt, F., Masanja, A., Mbongoni, G., Minas, S., Msabi, M., Msechu, M., Mtongori, H., Nadim, F., O'Hara, M., Pagani, M., Phillips, E., Rossetto, T., Rudari, R., Sangana, P., Silva, V., Twigg, J., Uhinga, G., and Verrucci, E.: Data schemas for multiple hazards, exposure and vulnerability, Disast. Prev. Manage., 28, 752–763, https://doi.org/10.1108/DPM-09-2019-0293, 2019.
NASA: Global Food Security Support Analysis Data (GFSAD) Crop Dominance 2010 Global 1 km V001, NASA [data set], https://lpdaac.usgs.gov/products/gfsad1kcdv001/ (last access: 5 November 2021), 2021.
Nirandjan, S., Koks, E. E., Ward, P. J., and Aerts, J. C. J. H.: A spatially-explicit harmonized global dataset of critical infrastructure, Sci. Data, 9, 150, https://doi.org/10.1038/s41597-022-01218-4, 2022.
OpenStreetMap contributors: Planet dump, Data licensed under the Open Data Commons Open Database License (ODbL) by the OpenStreetMap Foundation (OSMF), https://planet.openstreetmap.org (last access: 20 November 2023), 2023.
OXIRM – Oxford Institute of Retail Management, Saïd Business School, University of Oxford: Retail & Wholesale: Key Sectors For The European Economy, Understanding The Role Of Retailing And Wholesaling Within The European Union, https://www.eurocommerce.eu/media/87967/eurocommerce_study_v2_hd.pdf (last access: 20 October 202), 2014.
Pant, R., Thacker, S., Hall, J. W., Alderson, D., and Barr, S.: Critical infrastructure impact assessment due to flood exposure, J. Flood Risk Manage., 11, 22–33, https://doi.org/10.1111/jfr3.12288, 2018.
Peresan, A., Scaini, C., Tyagunov, S., and Ceresa, P.: Capacity Building Experience for Disaster Risk Reduction in Central Asia, Nat. Hazards Earth Syst. Sci. Discuss. [preprint], https://doi.org/10.5194/nhess-2023-156, in review, 2023.
Pittore, M., Haas, M., and Silva, V.: Variable resolution probabilistic modeling of residential exposure and vulnerability for risk applications', Earthq. Spectra, 36, 321–344, https://doi.org/10.1177/8755293020951582, 2020.
Punkari, M., Droogers, P., Immerzeel, W., Korhonen, N., Lutz, A., and Venäläinen, A.: Climate Change and Sustainable Water Management in Central Asia, Asian Development Bank (ADB), https://www.carecinstitute.org/wp-content/uploads/2014/05/2014-PUBL-climate-change-and-sustainable-water-management.pdf (last access: 10 December 2023), 2014.
Rathnayaka, B., Siriwardana, C., Robert, D., Amaratunga, D., and Setunge, S.: Improving the resilience of critical infrastructures: Evidence-based insights from a systematic literature review, Int. J. Disast. Risk Reduct., 78, 103123, https://doi.org/10.1016/j.ijdrr.2022.103123, 2022.
Saponaro, A., Pilz, M., Wieland, M., Bindi, D., Moldobekov, B., and Parolai, S.: Landslide susceptibility analysis in data-scarce regions: the case of Kyrgyzstan, Bull. Eng. Geol. Environ., 74, 1117–1136, https://doi.org/10.1007/s10064-014-0709-2, 2014.
Scaini, C., Peresan, A., Tamaro, A., Poggi, V., and Barnaba, C.: Can high-school students contribute to seismic risk mitigation? Lessons learned from the development of a crowd-sourced exposure database, Int. J. Disast. Risk Reduct., 69, 102755, https://doi.org/10.1016/j.ijdrr.2021.102755, 2022.
Scaini, C., Tamaro, A., Adilkhan, B., Sarzhanov, S., Ismailov, V., Umaraliev, R., Safarov, M., Belikov, V., Karayev, J., and Fagà, E.: A new regionally consistent exposure database for Central Asia: population and residential buildings, Nat. Hazards Earth Syst. Sci. Discuss. [preprint], https://doi.org/10.5194/nhess-2023-94, in review, 2023.
Schorlemmer, D., Beutin, T., Cotton, F., Garcia Ospina, N., Hirata, N., Ma, K.-F., Nievas, C., Prehn, K., and Wyss, M.: Global Dynamic Exposure and the OpenBuildingMap – A Big-Data and Crowd-Sourcing Approach to Exposure Modeling, in: EGU General Assembly 2020, Online, 4–8 May 2020, EGU2020-18920, https://doi.org/10.5194/egusphere-egu2020-18920, 2020.
Shaikova, A. Y., Dronzina, T. A., and Zholdasbekova, A. N.: “One Belt, One Road” initiative: a comparative analysis of the project implementation in the Central Asian countries, Dspace repository, https://rep.enu.kz/handle/enu/4526 (last access: 30 January 2023), 2023.
Silva, V., Brzev, S., Scawthorn, C., Yepes, C., Dabbeek, J., Crowley, H.: A Building Classification System for Multi-hazard Risk Assessment, Int. J. Disast. Risk Sci., 13, 161–177, https://doi.org/10.1007/s13753-022-00400-x, 2022.
Strom, A. and Abdrakhmatov, K.: Large-Scale Rockslide Inventories: From the Kokomeren River Basin to the Entire Central Asia Region, WCoE 2014–2017, IPL-106-2, in: Workshop on World Landslide Forum, Springer, Cham, 339–346, https://doi.org/10.1007/978-3-319-59469-9_28, 2017.
Tajikistan Geonode: https://geonode.wfp.org/ (last access: 2 August 2021), site inactive since December 2023.
Taubenbock, H. and Geiß, C.: Vulnerability and resilience research: a critical perspective, Int. J. Disast. Risk Sci., 5, 86–87, 2014.
Teluguntla, P., Thenkabail, P. S., Xiong, J., Gumma, M. K., Chandra, G., Milesi, C., Ozdogan, M., Congalton, R. G., Tilton, J., Sankey, T. T., Massey, R., Phalke, A., Yadav, K., and Massey, K.: Global Food Security Support Analysis Data (GFSAD) at Nominal 1-km (GCAD) derived from Remote Sensing in Support of Food Security in the Twenty-first Century: Current Achievements and Future Possibilities, in: Remote Sensing Handbook: Land Resources: Monitoring, Modelling, and Mapping, Volume II, Chapter 6, CRC Press, Boca Raton, FL, https://oar.icrisat.org/9181/1/05_K22130_C006_Glo.pdf (last access: 15 December 2022), 2015.
Tilloy, A., Malamud, B. D., Winter, H., and Laugel, A. J.: A review of quantification methodologies for multi-hazard interrelationships, Earth Sci. Rev., 196, 102881, https://doi.org/10.1016/j.earscirev.2019.102881, 2019.
Ullah, S., Bindi, D., Pilz, M., Danciu, L., Weatherill, G., Zuccolo, E., Ischuk, A., Mikhailova, N. N., Abdrakhmatov, K., and Parolai, S.: Probabilistic seismic hazard assessment for Central Asia, Ann. Geophys., 58, S0103, https://doi.org/10.4401/ag-6687, 2015.
Ulomov, V. I. and the GSHAP Region 7 Working Group: Seismic hazard of Northern Eurasia, Ann. Geophys., 42, 1023–1038, 1999.
UNECE – United Nations Economic Commission for Europe: Strengthening Water ManageMent and tranSboundary Water Cooperation in Central aSia: the role of unEcE Environmental conventions, Printed at United Nations, Geneva, ECE/MP.WAT/35, https://unece.org/DAM/env/water/publications/documents/Water_Management_En.pdf (last access: 20 November 2022), 2011.
UNICEF: Project Connect website, https://projectconnect.unicef.org/map/countries (last access: 22 November 2022), 2022.
Venkatappa, M., Sasaki, N., Han, P., and Abe, I.: Impacts of droughts and floods on croplands and crop production in Southeast Asia – An application of Google Earth Engine, Sci. Total Environ., 795, 2021, 148829, https://doi.org/10.1016/j.scitotenv.2021.148829, 2021.
Wald, D. J.: Alerting the globe of consequential earthquakes, Perspect. Earth Space Scient., 4, e2022CN000200, https://doi.org/10.1029/2022CN000200, 2023.
Ward, P. J., Daniell, J., Duncan, M., Dunne, A., Hananel, C., Hochrainer-Stigler, S., Tijssen, A., Torresan, S., Ciurean, R., Gill, J. C., Sillmann, J., Couasnon, A., Koks, E., Padrón-Fumero, N., Tatman, S., Tronstad Lund, M., Adesiyun, A., Aerts, J. C. J. H., Alabaster, A., Bulder, B., Campillo Torres, C., Critto, A., Hernández-Martín, R., Machado, M., Mysiak, J., Orth, R., Palomino Antolín, I., Petrescu, E.-C., Reichstein, M., Tiggeloven, T., Van Loon, A. F., Vuong Pham, H., and de Ruiter, M. C.: Invited perspectives: A research agenda towards disaster risk management pathways in multi-(hazard-)risk assessment, Nat. Hazards Earth Syst. Sci., 22, 1487–1497, https://doi.org/10.5194/nhess-22-1487-2022, 2022.
Weiss, D. J., Nelson, A., Vargas-Ruiz, C. A., Gligorić, K., Bavadekar, S., Gabrilovich, E., Bertozzi-Villa, A., Rozier, J., Gibson, H. S., Shekel, T., Kamath, C., Lieber, A., Schulman, K., Shao, Y., Qarkaxhija, V., Nandi, A. K., Keddie, S. H., Rumisha, S., Amratia, P., Arambepola, R., Chestnutt, E. G., Millar, J. J., Symons, T. L., Cameron, E., Battle, K. E., Bhatt, S., and Gething, P. W.: Global maps of travel time to healthcare facilities, Nat. Med., 26, 1835–1838, https://doi.org/10.1038/s41591-020-1059-1, 2020.
Wieland, M., Pittore, M., Parolai, S., Begaliev, U., Yasunov, P., Niyazov, J., Tyagunov, S., Moldobekov, B., Saidiy, S., Ilyasov, I., and Abakanov, T.: Towards a cross-border exposure model for the Earthquake Model Central Asia, Ann. Geophys., 58, S0106, https://doi.org/10.4401/ag-6663, 2015.
World Bank: Agriculture, forestry, and fishing, value added (% of GDP), World Bank [data set], https://data.worldbank.org/indicator/NV.AGR.TOTL.ZS (last access: 1 November 2023), 2020.
World Bank: Central Asia exposure dataset – Non-residential buildings (education, healthcare, industrial, commercial), https://datacatalog.worldbank.org/search/dataset/0064288/Central-Asia-exposure-dataset—Non-residential-buildings (last access: December 2023), 2023a.
World Bank: Central Asia exposure dataset – Transport, https://datacatalog.worldbank.org/search/dataset/0064252/Central-Asia-exposure-dataset---Transport (last access: December 2023), 2023b.
World Bank: Central Asia exposure dataset – agricultural crops, https://datacatalog.worldbank.org/search/dataset/0064248/Central-Asia-exposure-dataset---agricultural-crops (last access: December 2023), 2023c.
Yepes-Estrada, C., Silva, V., Valcárcel, J., Acevedo, A. B., Tarque, N., Hube, M. A., Coronel, G., and Santa María, H.: Modeling the Residential Building Inventory in South America for Seismic Risk Assessment, Earthq. Spectra, 33, 299–322, https://doi.org/10.1193/101915eqs155dp, 2017.
Yepes-Estrada, C., Calderon, A., Costa, C., Crowley, H., Dabbeek, J., Hoyos, M. C., Martins, L., Paul, N., Rao, A., and Silva, V.: Global building exposure model for earthquake risk assessment, Earthq. Spectra, 39, 2212–2235, https://doi.org/10.1177/87552930231194048, 2023.
Zhang, M., Zhai, G., He, T., and Wu, C.: A growing global threat: Long-term trends show cropland exposure to flooding on the rise, Sci. Total Environ., 899, 165675, https://doi.org/10.1016/j.scitotenv.2023.165675, 2023.
Zhang, R., Zhao, C., Ma, X., Brindha, K., Han, Q., Li, C., and Zhao, X.: Projected spatiotemporal dynamics of drought under global warming in Central Asia, Sustainability, 11, 4421, https://doi.org/10.3390/su11164421, 2019.