the Creative Commons Attribution 4.0 License.
the Creative Commons Attribution 4.0 License.
 | 07 Oct 2024
Floods in the Pyrenees: a global view through a regional database
Montserrat Llasat-Botija
Erika Pardo
Raül Marcos-Matamoros
Marc Lemus-Canovas
This paper shows the first systematic dataset of flood episodes referring to the entire Pyrenees massif, named PIRAGUA_flood, which covers the period 1981–2015 (available at http://hdl.handle.net/10261/270351, last access: 21 July 2024). First, the structure of the database is detailed so that it can be reproduced anywhere else in the world, adapting to the specific nature of each situation. Subsequently, the paper addresses the spatial and temporal distribution of flood episodes and events (including trends) that affected the Pyrenees regions of Spain (Catalonia, Aragon, Navarre, the Basque Country), France (Nouvelle-Aquitaine, Occitanie) and Andorra, as well as the massif as a whole, for a given period of time. In the case of the Spanish regions, it was also possible to analyse the compensation payments by the Spanish Insurance Compensation Consortium and the number of deceased. The weather types associated with flood episodes were also classified based on sea level pressure and 500 hPa geopotential height from ERA5. The results show 181 flood events and 154 fatalities, some of which affected more than one region. In the Spanish part of the Pyrenees, between 1996 and 2015, there was a total compensation payout amounting to EUR 142.5 million (2015). The eastern part of the area records more flood events than the western one, with Catalonia being the community that registered the highest number of events, followed by Andorra and Occitanie. Associated weather types are dominated by the southern component flow over the Pyrenees region, with a talweg on the Iberian Peninsula and a depression in the vicinity, either in the Atlantic or in the Mediterranean. In terms of the entire massif, there is a slight positive trend of 0.84 events per decade, driven by the evolution of ordinary and extraordinary floods but not significant at 95 %. At a regional level, flood behaviour is more heterogeneous, although not significant for the most part. Nouvelle-Aquitaine is the only region that shows a positive and significant trend of 0.34 events per decade.
- Article
(8909 KB) - Full-text XML
- BibTeX
- EndNote


It is well known that floods in the Mediterranean area are usually flash floods (Gaume et al., 2009; Braud et al., 2014; Llasat et al., 2016), associated with very heavy rains with a short duration. In general, they cause local damage in coastal populations or mountainous regions, which can sometimes be very serious. Other times they can affect large regions, as happened with the Gard floods (France) in 2002 (Braud et al., 2010). Most of these episodes do not appear in the best-known flood databases such as EM-DAT (https://www.emdat.be/, last access: 21 July 2024) or Munich Re's NatCatSERVICE (https://www.munichre.com/en/solutions/for-industry-clients/natcatservice.html, last access: 21 July 2024), because these databases are often based on indirect information (i.e. from the insurers that Munich Reinsurance reinsures), so many events are not included, either because the insurers are not aware of the events or because they are not considered to have had sufficient impact (Llasat et al., 2013a; Wirtz et al., 2014). For example, there are very few such episodes that have affected the Pyrenees mountain region in these databases. More systematic and precise studies are therefore necessary, but the high workload required to elaborate these studies means that they are only available for few regions. This is the case of INUNGAMA (Llasat et al., 2014), which includes all the flood events that have affected Catalonia (NE Spain) between 1900 and 2020 (partial information available in the Flood Observatory of Catalonia, https://experience.arcgis.com/experience/484172e12fae4cbb934441203ee04e36/, last access: 21 July 2024), and FloodHYMEX (Llasat et al., 2013b, 2020), which currently includes all the catastrophic flood episodes (following the criteria of “catastrophic” introduced in Barriendos et al., 2003) that have affected Catalonia, the Valencian Community and the Balearic Islands, in Spain; the former Languedoc-Roussillon region, Midi-Pyrénées and PACA (Provence-Alpes-Côte d'Azur) in France; Calabria, in Italy; and all of Greece (available at https://mistrals.sedoo.fr/catalogue/, last access: 21 July 2024).
On the other hand, concern about the impact of climate change in mountainous regions, including natural hazards, has grown significantly in recent decades. Proof of this is the increase in publications on this topic (i.e. Beniston, 2003; Beniston and Stoffel, 2014; Zimmermann and Keiler, 2015; Steiger et al., 2022) including a cross-chapter devoted to mountains in the Sixth Assessment Report of the IPCC (2022). There are, however, few studies that address mountain massifs in their entirety from a climatic or meteorological perspective. This is the case of the Pyrenees, a cross-border mountainous region between Spain, France and Andorra. To facilitate the international management of a massif distributed between three countries, the Pyrenees Working Community (CTP) was created, which in turn founded the Pyrenean Climate Change Observatory (OPCC, https://www.opcc-ctp.org/en, last access: 21 July 2024), which promotes the observation and research on climate change from a multidisciplinary approach. Given that the Pyrenees are key in the generation of water resources in the surrounding regions, where more than 20 million people live, as well as in the production of hydroelectric energy, the OPCC promoted the PIRAGUA project financed by the European call for projects POCTEFA (https://www.opcc-ctp.org/en/piragua, last access: 21 July 2024) and whose results are available to the public in the OPCC Geoportal (https://www.opcc-ctp.org/en/geoportal, last access: 21 July 2024) and the publications of Beguería et al. (2023a, b). Among these results, noteworthy are those obtained from trend analysis. Clavera-Gispert et al. (2023) show that in autumn there is a predominance of significant negative trends throughout the mountain range, mainly in September, for low (P10) average (P50) and high flows (P90), for the period 1980–2013. A similar predominance is observed in summer, while only a relevant significant positive trend is observed in the western part (Basque Country, Spain), in the month of March. The decrease in flow throughout the mountain range is more clearly manifested when the period is reduced to 1990–2013. This negative trend becomes more pronounced, even on an annual scale, when analysing projections of annual precipitation for the middle and end of the century, especially in the western part of the Pyrenees, while in the eastern part, especially in Catalonia (Spain), an increase is observed, which will also be reflected in the average annual flows (Beguería et al., 2023a). CLIMPY, another project from the OPCC, concluded that the projections for the next 70 years do not show a significant trend in the heavy precipitation index (CP95) at the mountain range scale; only a certain decrease could be detected in the south-eastern slope (Catalonia, Spain) and a certain increase in the northern and western parts (French basins and Navarre and the Basque Country in Spain) (Amblar-Francés et al., 2020). In this context the question arises about extremes, specifically, about floods.
One of the objectives of PIRAGUA was the analysis of floods in the entire Pyrenean region, where flash floods can have a great direct impact on both the fixed and floating population, as well as on water services and energy resources. Some examples are the catastrophe at the Las Nieves campsite, in Biescas (Aragon, Spain), on 7 August 1996, in which 87 people drowned (García-Ruiz et al., 1996); the June 2013 floods with catastrophic damage in Spain and France (https://hepex.org.au/flash-floods-in-the-french-western-and-central-pyrenees-17-19-june-2013/, last access: 21 July 2024); and the floods produced on 7 November 1982 (Trapero et al., 2013) that affected the three Pyrenean countries. The recent death of two people who were canyoning in the Pyrenees of Aragon (Spain) on 2 September 2023, when a flash flood event occurred, is another example of this type of event that most people are unaware of. However, until now there has been no database or flood catalogue that specifically covers the Pyrenean regions, no less the Pyrenees massif as a whole. For this reason, in the same way that the final objective of FloodHYMEX (Llasat et al., 2013a, b) was to cover the entire Mediterranean region, it was decided to create a similar database for the Pyrenees but one that includes all types of flood episodes. The aim of this article is to present the first systematic database of flood episodes covering the entire Pyrenees massif, for the period 1981–2015, analyse the trends in light of the most recent articles (Clavera-Gispert et al., 2023) and characterise the weather types favourable to these flood events. This database is available at http://hdl.handle.net/10261/270351 (last access: 21 July 2024) (Llasat et al., 2022). Following the introduction of the study area, the structure of the base, the criteria followed for its construction and the sources of information used are shown. The spatial and temporal distributions of flood episodes, both in the massif and the administrative regions, as well as the weather types, are then analysed. The paper ends with conclusions and discussion, where some adaptation measures are also commented.
2.1 Area of study
The Pyrenees mountain range has an area of 49 850 km2 (W–E: 520 km; S–N: 150 km) and a maximum altitude of 3404 (Aneto), extending from the Atlantic Ocean to the Mediterranean Sea (Fig. 1). A total of 43 % of the Pyrenees is covered by forest, making it one of the richest regions in biodiversity in Europe. The number of inhabitants in the Pyrenean region is fewer than 1 200 000 people, but this figure can be doubled in summer. Although there is still notable agricultural and livestock activity, the service sector is the main source of income. Thus, in Andorra, the tourism sector constitutes more than 80 % of the GDP.
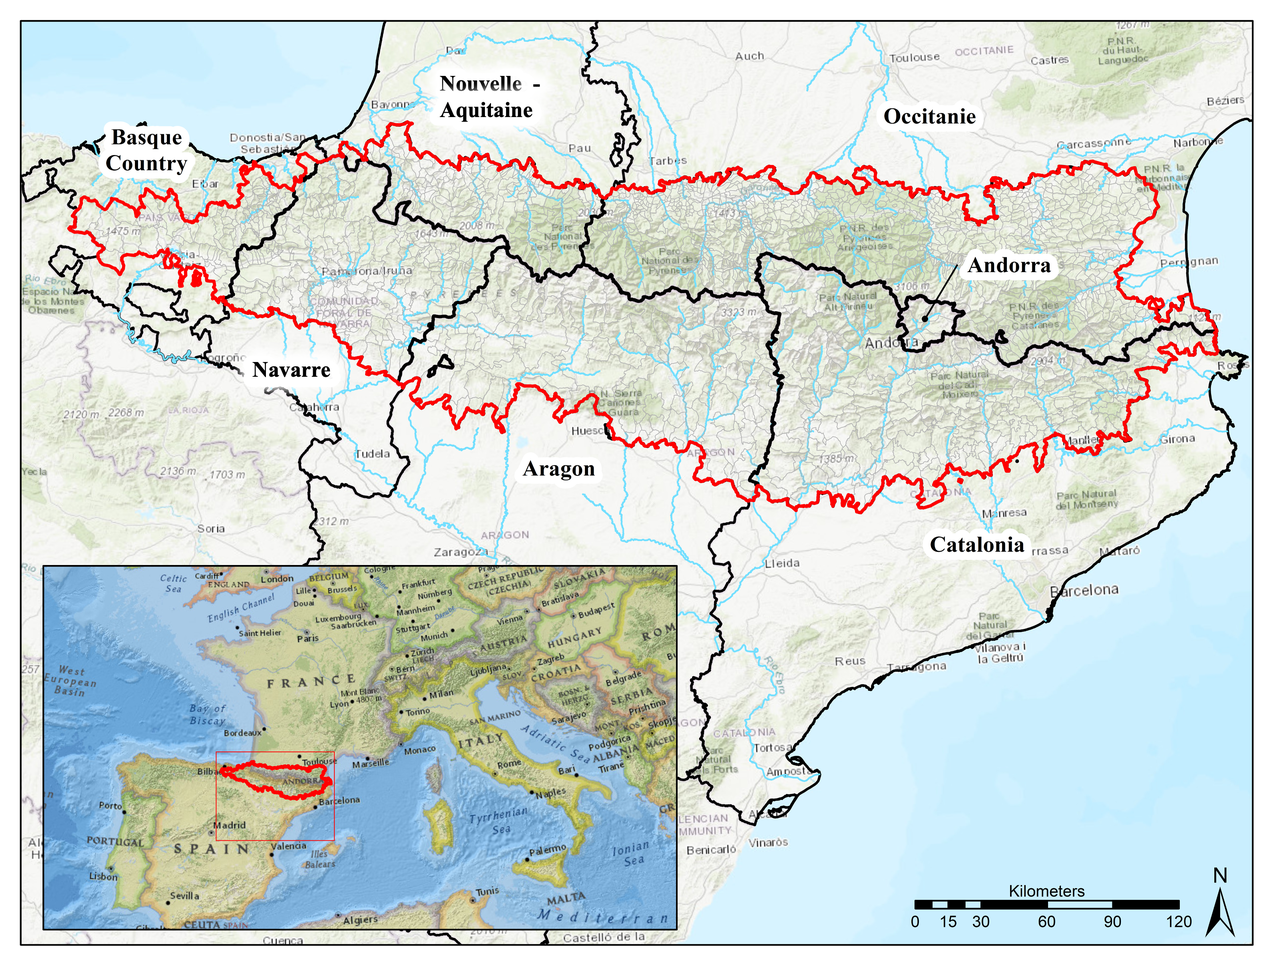
Figure 1Map of the Pyrenean municipalities located within the area defined as the Pyrenees by the OPCC. The frontiers and names of the Pyrenean regions are also included (basemap: ESRI).
Table 1Main characteristics of the study area. GDP: mean gross domestic product for the region for the year indicated in the table; asterisks denote values relative to the part of the region that belongs to the Pyrenees. CNIH: Catálogo Nacional de Inundaciones Históricas (National Catalogue of Historical Floods); INE: Instituto Nacional de Estadística (National Institute of Statistics); PERICFN: Plan de Emergencia ante el Riesgo de Inundaciones en la Comunidad Foral de Navarra (Emergency Plan for the Risk of Floods in the Foral Community of Navarre) (https://gobiernoabierto.navarra.es/es/gobernanza/planes-y-programas-accion-gobierno/plan-emergencia-ante-riesgo-inundaciones-comunidad, last access: 21 July 2024); EPRI: Evaluación Preliminar del Riesgo de Inundación (Preliminary Flood Risk Assessment of the 2nd Cycle of the Eastern Cantabrian Hydrographic Area); CCR: Caisse Centrale de Réassurance (Central Reinsurance Company) (https://catastrophes-naturelles.ccr.fr/, last access: 21 July 2024); ONRN: Observatoire National des Risques Naturels (National Observatory of Natural Risks) (https://www.georisques.gouv.fr/articles-risques/onrn/acceder-aux-indicateurs-sinistralite#summary-target-1, last access: 21 July 2024); INSEE: Institut national de la statistique et des études économiques (National Institute of Statistics and Economic Studies) (https://www.insee.fr, last access: 21 July 2024); CENMA-IEA (https://www.iea.ad/cenma, last access: 12 September 2024): Centre d'Estudis de la Neu i de la Muntanya d'Andorra–Institut d'Estudis Andorrans (Andorra Centre of Snow and Mountain Studies–Andorra Studies Institute). GDP data were obtained from https://Datosmacro.Expansion.Com/Pib/Espana-Comunidades-Autonomas (last access: 20 November 2023) (Spanish regions), https://fr.statista.com/statistiques/479490/pib-par-habitant-selon-regions-france/ (last access: 20 November 2023) (French regions) and https://datosmacro.expansion.com/pib/andorra (last access: 20 November 2023) (Andorra).
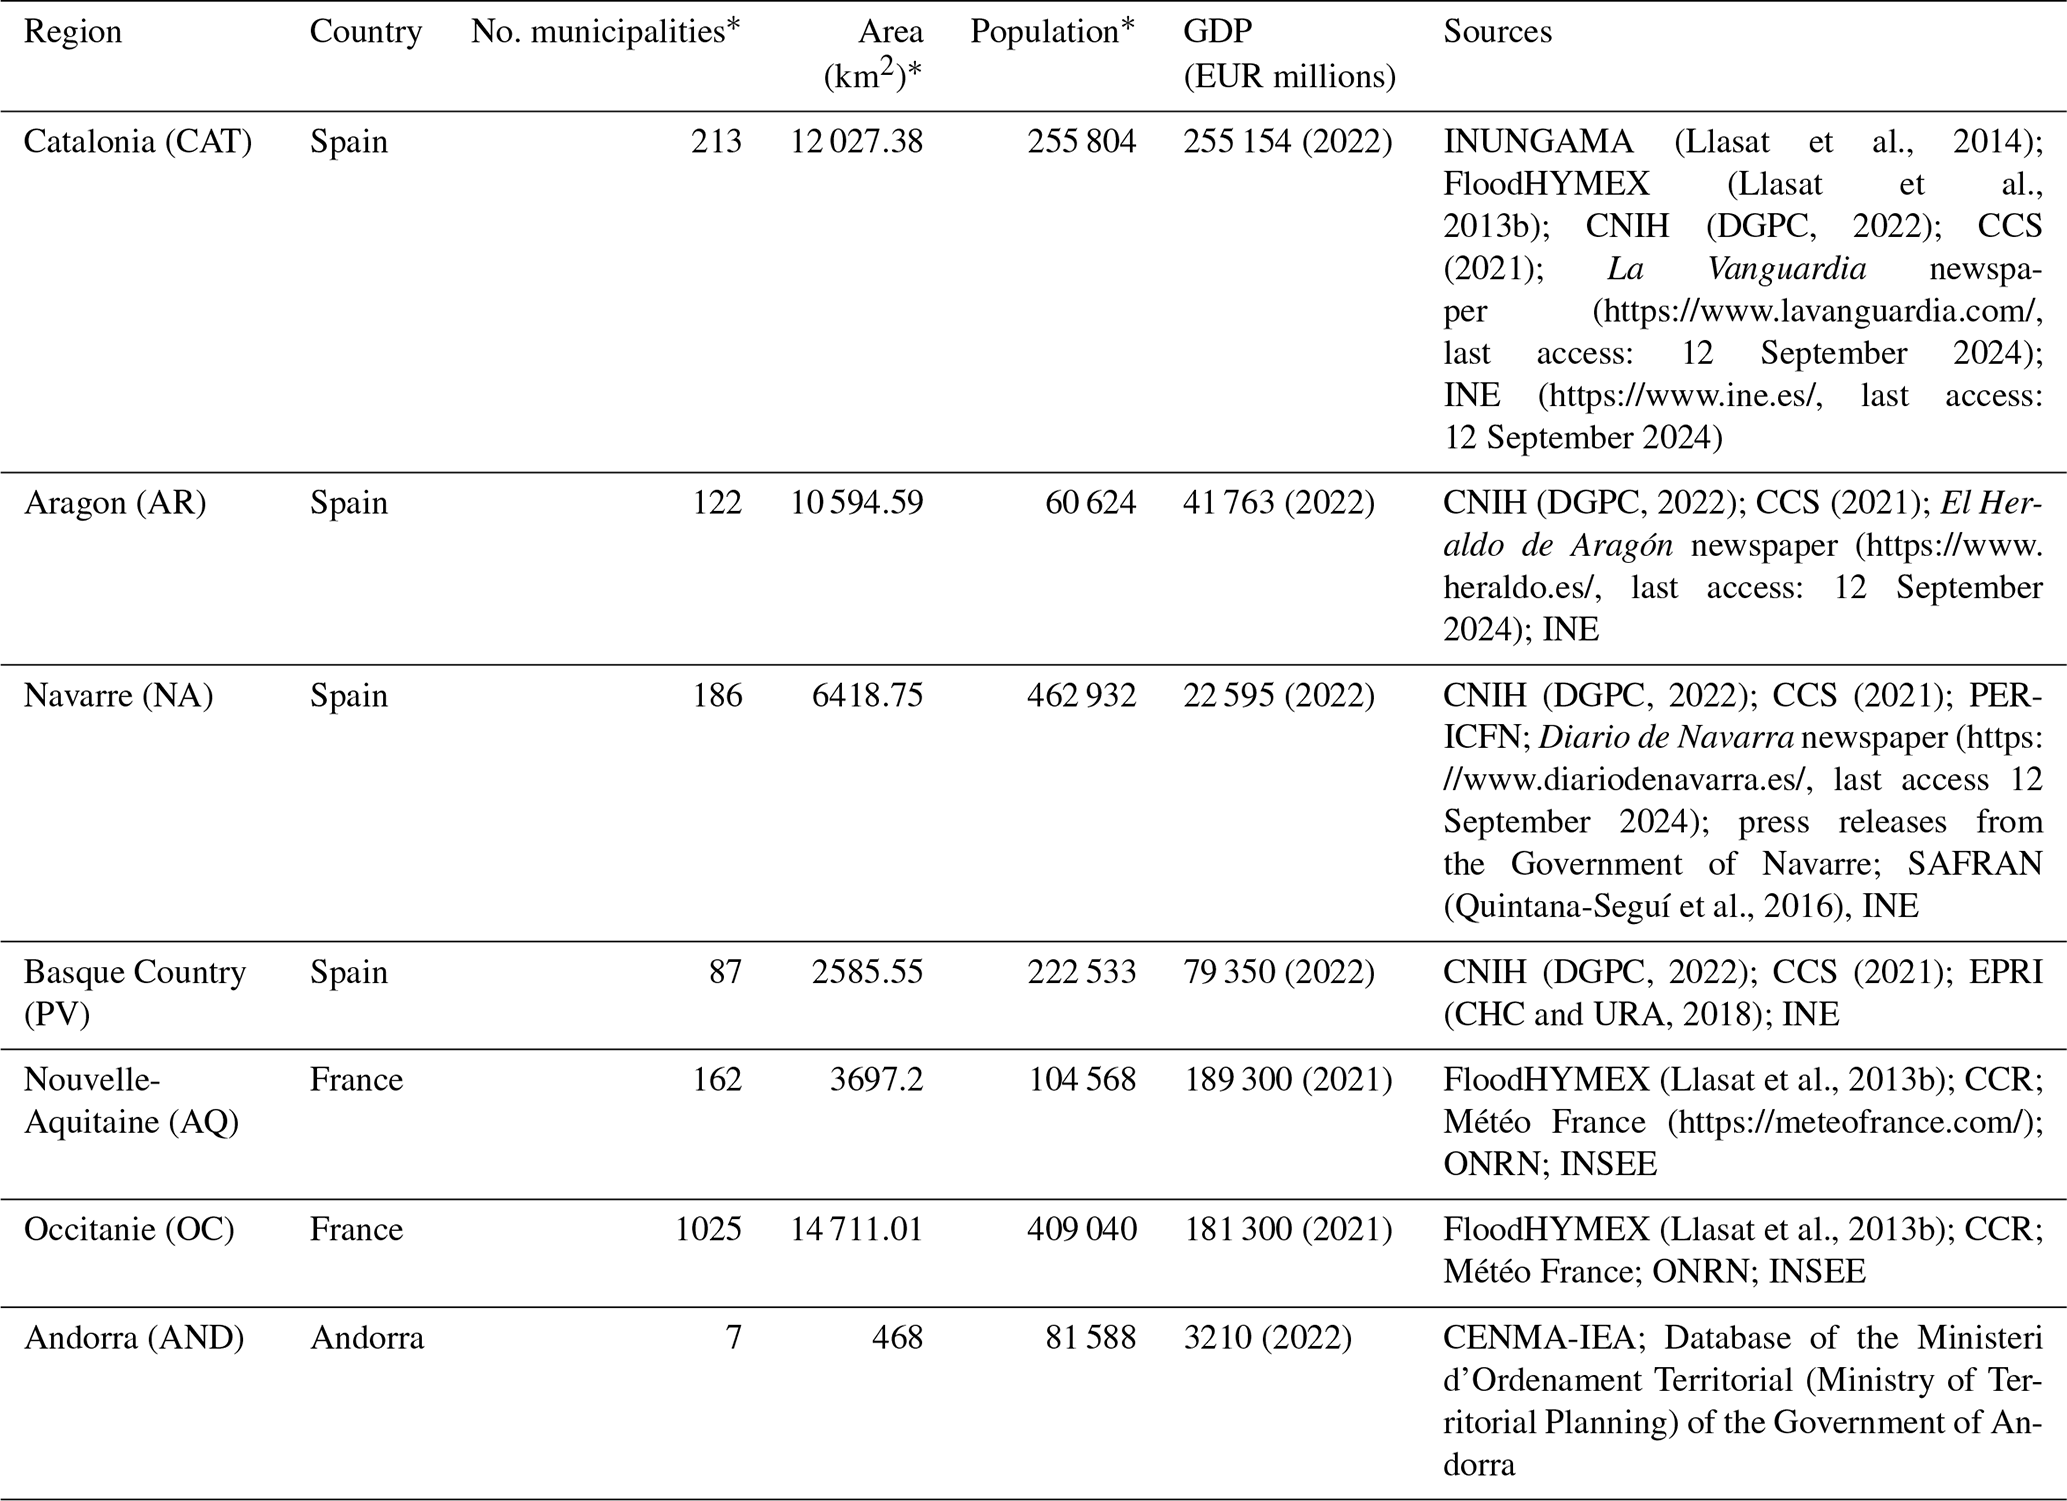
The study area (Fig. 1) is exclusively comprised of the municipalities within the limits of the Pyrenees, as defined by the Pyrenees Climate Change Observatory (Observatorio Pirenaico del Cambio Climático – OPCC), a subsection of the Pyrenees Working Community (Comunidad de Trabajo de los Pirineos – CTP), which includes part of the Nouvelle-Aquitaine and Occitanie regions of France; part of the Basque Country, Navarre, Aragon and Catalonia in Spain; and Andorra as a whole. In total, 1803 municipalities are included, of which 609 are in Spain, 1187 are in France and 7 are in Andorra (Table 1).
2.2 Sources of information and identification of flood events
Table 1 shows the main physical and socioeconomic characteristics of the study area as well as the sources of information used to identify all the flood events that have affected the Pyrenean region. FloodHYMEX (Llasat et al., 2013a, b) was used to recover the catastrophic events that have affected the Pyrenees in Catalonia and the part of Occitanie corresponding to the Languedoc-Roussillon. For the Spanish part of the Pyrenees, the National Catalogue of Historical Floods (Catálogo Nacional de Inundaciones Históricas – CNIH) and the information from the Spanish Insurance Compensation Consortium (CCS, 2021) were also used. The CNIH catalogue was published by the General Directorate of Civil Protection in Spain and contains the most important flood events (DGPC, 2022). It is made up of reports made for the different river demarcations into which Spain is divided, observing some heterogeneities, such as the fact that the same event can be in two reports associated with different dates, which requires careful contrast with other sources. The CCS provided, for the period 1996–2015, the compensation paid to municipalities in the Pyrenees, organised by postal code and date of the “claim”, which may be different from the date of the flood. In order to resolve this, the postcode data were transformed to municipality data (a municipality may have more than one postcode), and the damage caused by a flood event was considered to be the sum of the compensation payments due to floods between the initial day of the event and the final day, with an additional 7 d, as in Cortès et al. (2019). Data from CCS have been also useful to identify some minor flood events that have not been found in the other sources of information. Finally, in the case of Catalonia, Aragon and Navarre, the information was completed based on news from La Vanguardia, El Heraldo de Aragón and Diario de Navarra newspapers, respectively. La Vanguardia had already been systematically consulted, day by day, for the construction of the INUNGAMA database (Llasat et al., 2014), part of which was included in FloodHYMEX (Llasat et al., 2013a, b) and PIRAGUA_flood (Llasat et al., 2022). Given that day-to-day consultation of newspapers is extremely slow, in the case of Aragon and Navarre only the cases identified from the rest of the sources cited above were consulted plus the government press releases and the days of rain that exceeded 40 mm (threshold fixed following the criteria of Cortés et al., 2019). This information was obtained from the precipitation field provided by the SAFRAN analysis (Quintana-Seguí et al., 2016). In the case of the Basque Country and Andorra, the project partners, through whom we obtained the information, confirmed that it was complete, so it was not necessary to consult the newspapers, since the creators of the respective episode lists had done so.
For Nouvelle-Aquitaine (AQ) and Occitanie (OC), the databases of the Central Reinsurance Company (Caisse Centrale de Réassurance – CCR) and the National Observatory of Natural Risks (Observatoire National des Risques Naturels – ONRN) were used to create PIRAGUA_flood. In this case the information was completed with the extreme rainfall records of Météo France. This ensured that all episodes that produced notable damage were included, although it is possible that some minor flood events with little damage have gone unnoticed.
3.1 Development of the database
The database was built in Microsoft Access, but to facilitate its use by any person interested in it, the public version is in Excel. It is made up of two tables: (a) events and (b) affected municipalities that are linked throughout the event code (Fig. 2). Tables 2 and 3 show the information and criteria used to create each one of these tables, which follow the example of FloodHYMEX and INUNGAMA databases.
Table 2Information and criteria used to fill out the event table.
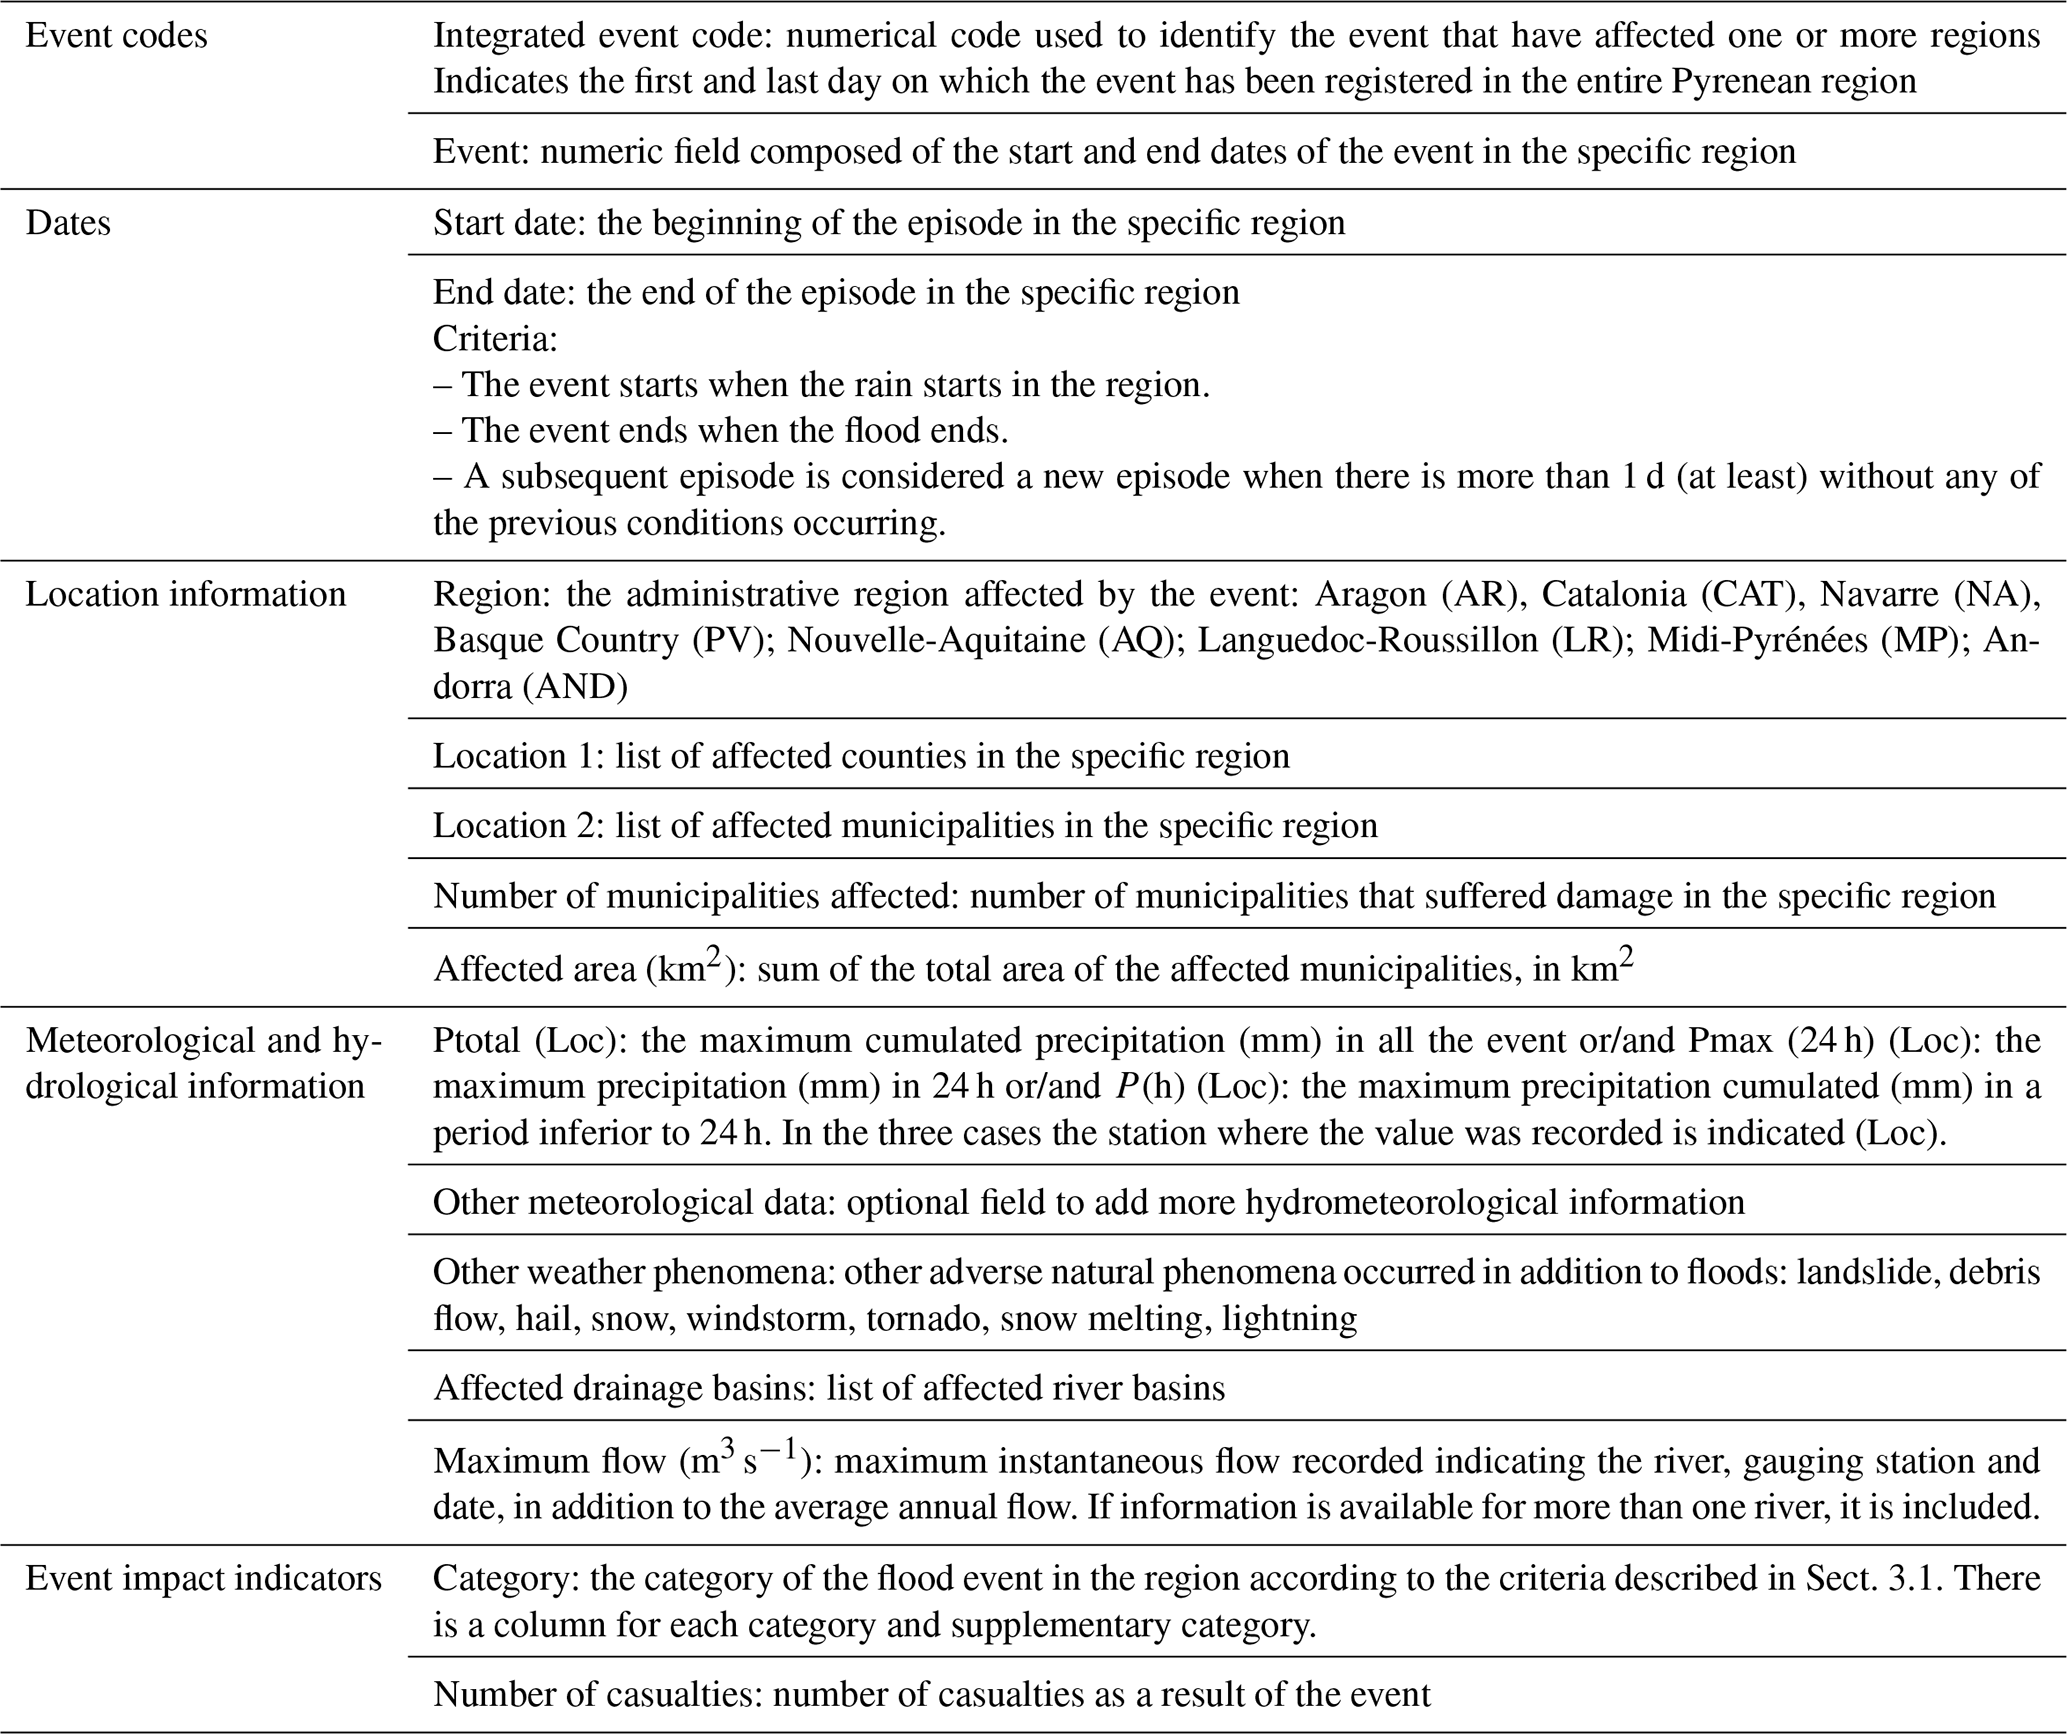
Table 3Information and criteria used to fill out the municipality table.
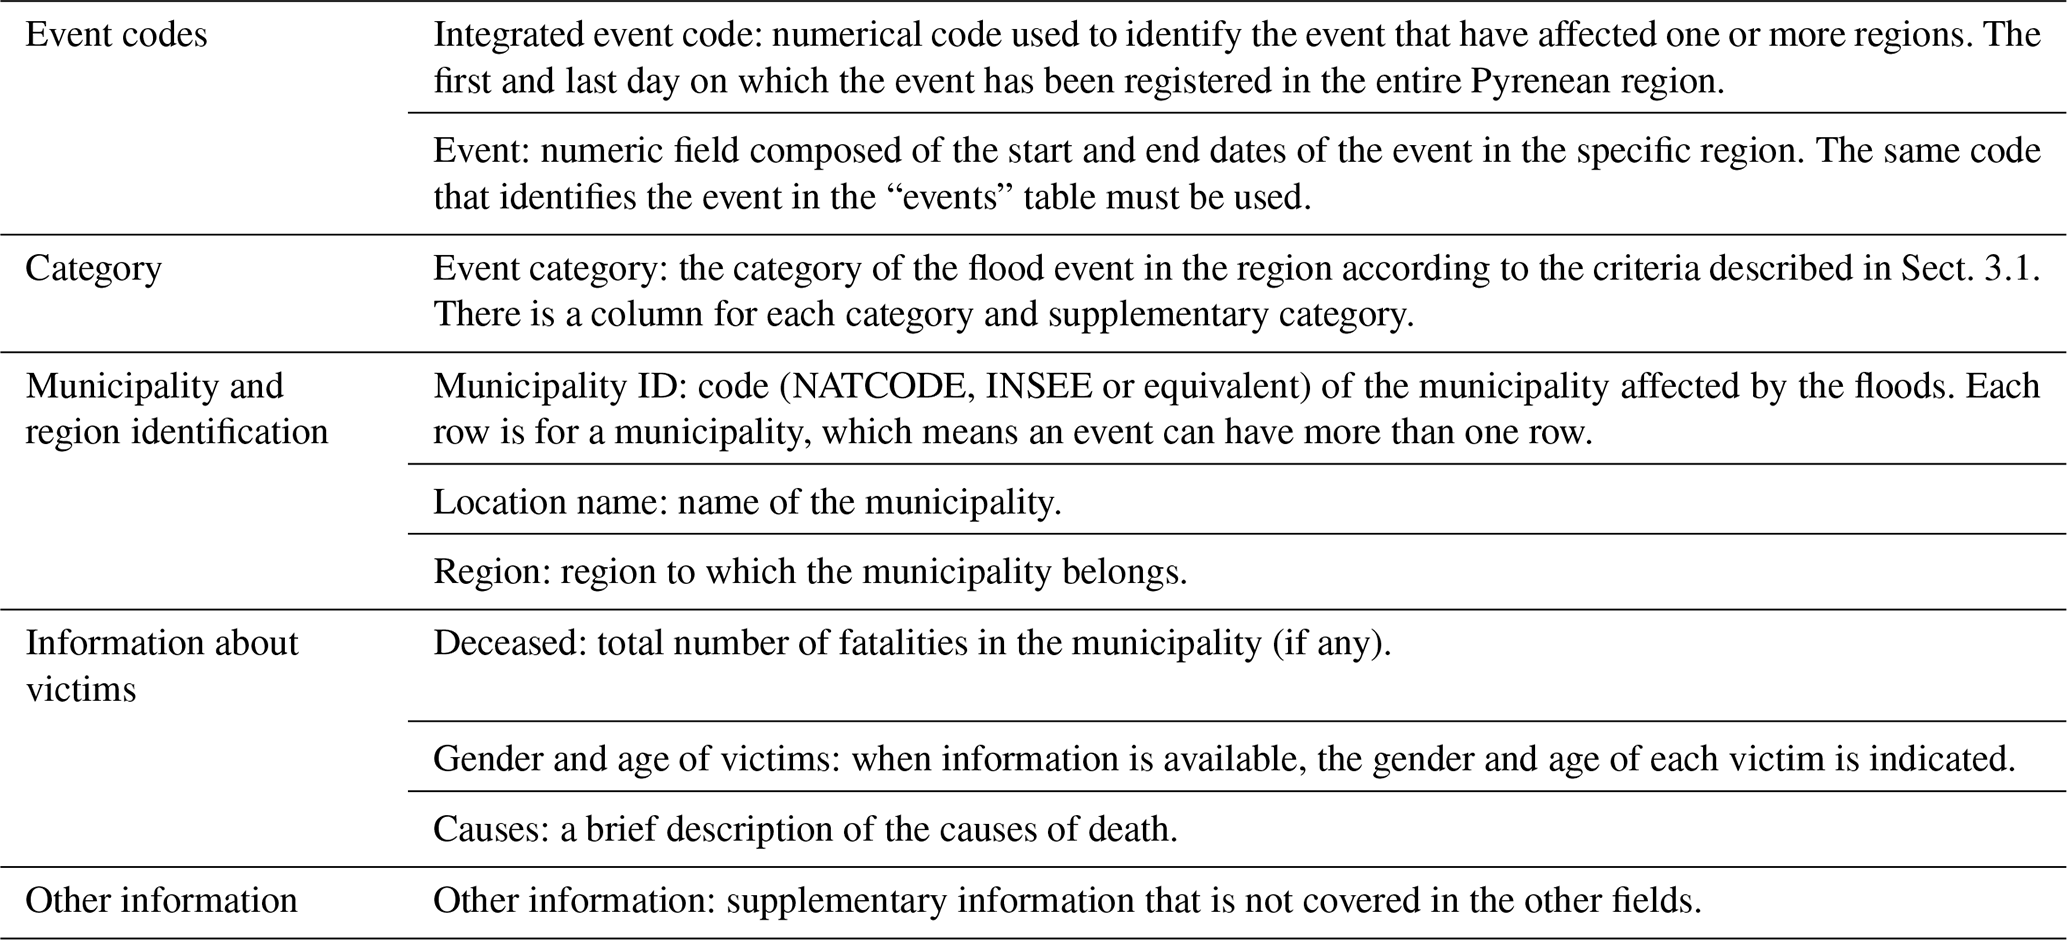
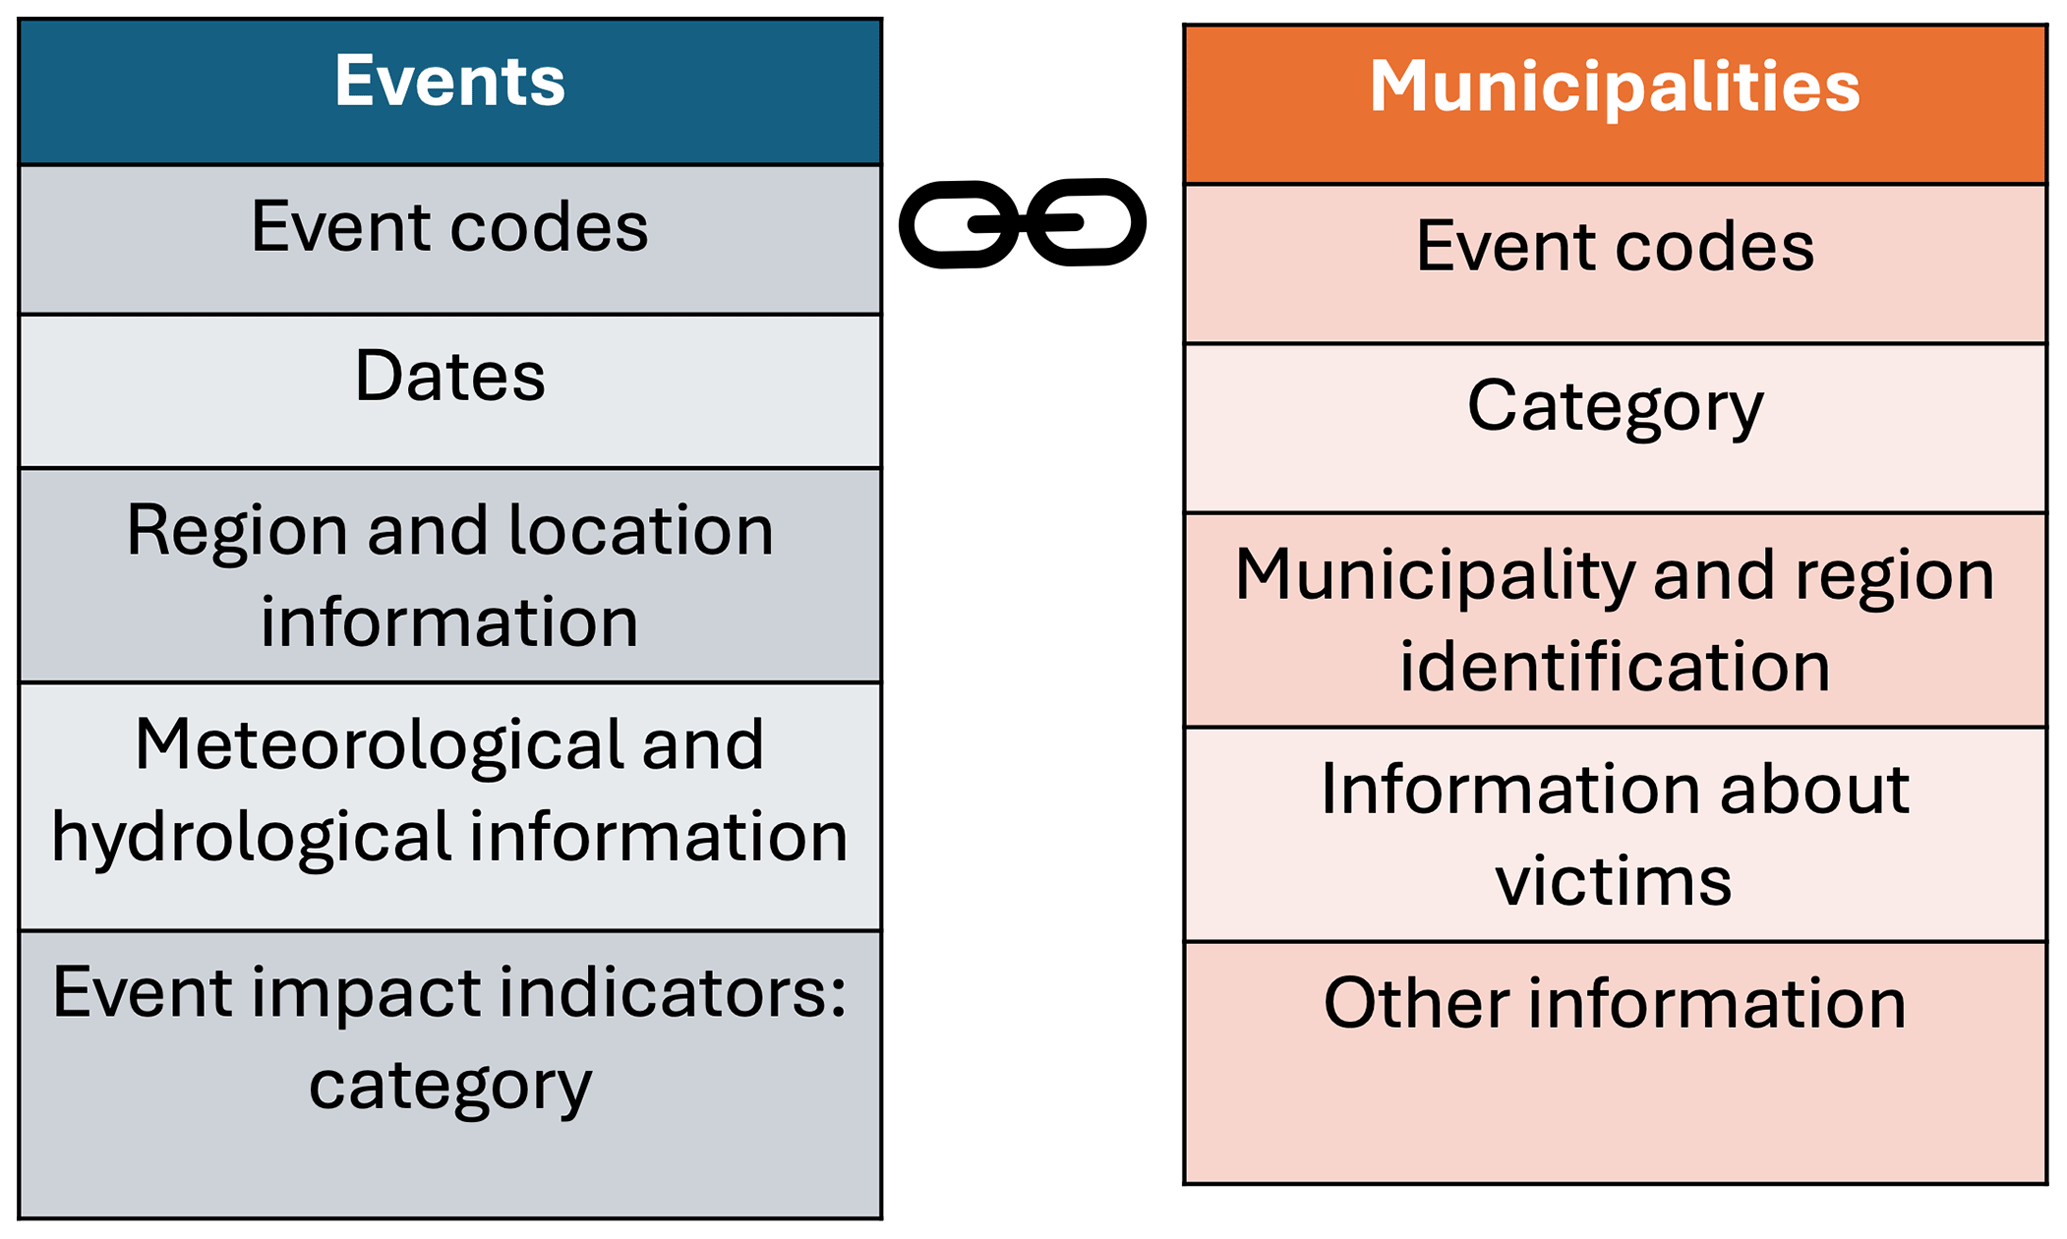
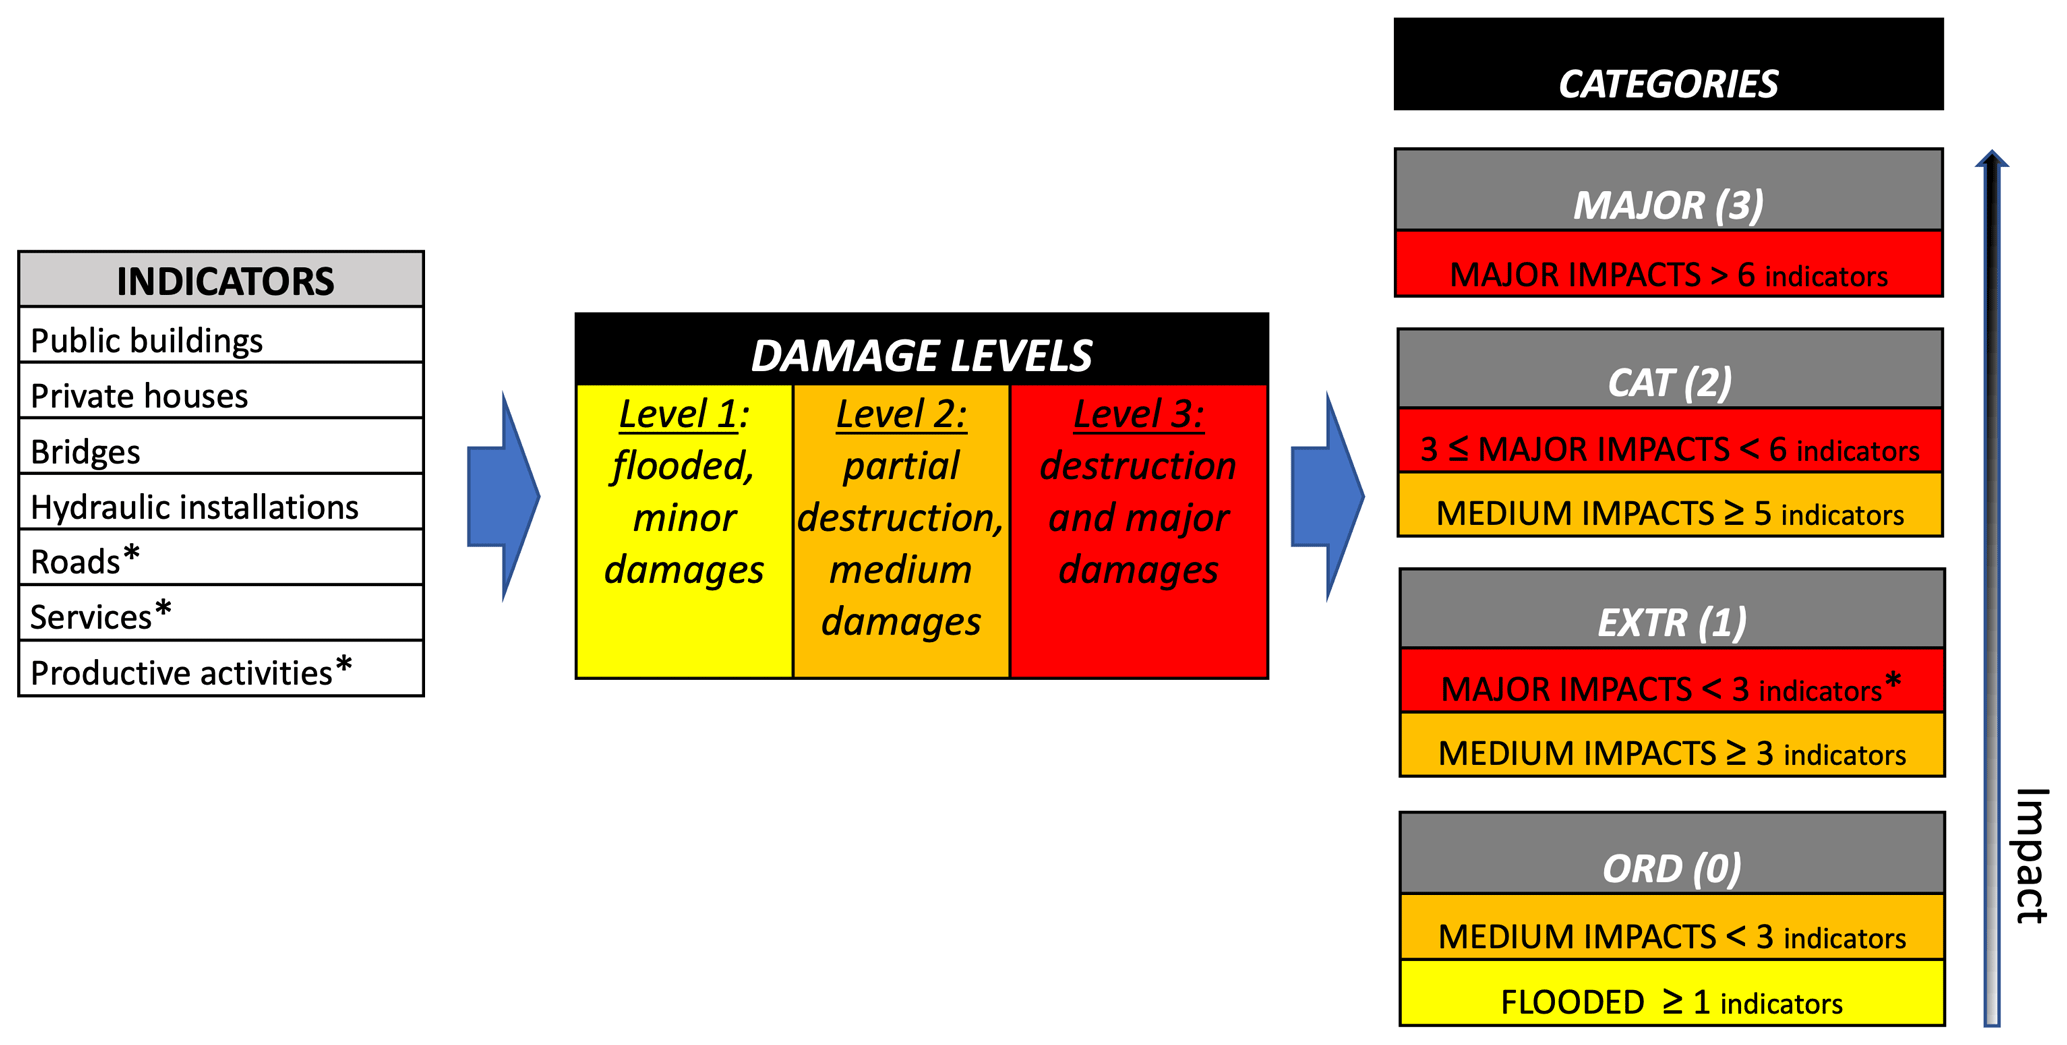
Figure 3Criteria for categorising flood events based on impacts. ORD (0): ordinary flood event; EXTR (1): extraordinary flood event; CAT (2): catastrophic flood event; MAJOR (3): major catastrophic event. The level of damage is estimated from the direct impacts experienced, and a colour scale is used (level 1: yellow; level 2: orange; level 3: red).
The category of flood events is based on the level of impacts and is divided into categories: 0 (ordinary), 1 (extraordinary), 2 (catastrophic) and 3 (major catastrophic), according to Fig. 3, inspired by the criteria presented in previous publications (Barriendos et al., 2003; Llasat et al., 2013b, 2016; Barrera-Escoda and Llasat, 2015). However, in these publications, the distinction between categories was purely subjective. In order to facilitate its reproduction by other authors, a table has been designed to help decide in which category an event can be classified. Firstly, the “damage indicators” have been selected based on literature (Petrucci, 2013; Boudou et al., 2016; Vinet et al., 2016). For each one of the indicators, the “damage level” has been analysed, where level 1 refers to possible minor damage (small floods in basements, breakdowns in traffic lights, etc.), level 2 refers to medium damage (it includes floods inside buildings and on communication routes which can cause traffic interruptions, partial damage to infrastructure, etc.) and level 3 refers to major impacts in the indicator (partial or total destruction of buildings, roads, bridges, long lasting supply cuts, etc.). To classify flood episodes into categories, the level of damage in each of the seven indicators is taken into account, as shown in Fig. 3. Fatalities are not included in Fig. 3 as they can occur in any flood event category, although they are more likely to occur in catastrophic floods. The same applies to vehicles, as they can be swept away if they are parked on a creek where there is normally little water flow, without the river breaking its banks. This is why additional information has been included in the database, with the code of “0.5” if the episode swept away cars and “5” if there were fatalities. Since the category of the episode may be different for each affected Pyrenees municipality, the highest occurring level determines the category of the episode.
3.2 Spatial analysis
The number of flood events was represented at a municipal level using geographic information systems (GISs), ArcGIS 10.4 and QGIS 3.10. Spatial analysis was carried out for all categories of flood episodes. To do this, for Catalonia the database of municipalities in shapefile format provided by the Cartographic and Geological Institute of Catalonia (ICGC) (https://www.icgc.cat/es/Geoinformacion-y-mapas/Mapas/Mapas-municipales, last access: 21 July 2024) has been used. For the other regions, the database of municipalities and regions in the Geographic Information System of the European Commission (GISCO) has been used, which is part of Eurostat (Eurostat, https://ec.europa.eu/eurostat/web/gisco/geodata/administrative-units/countries, last access: 12 September 2024). Regarding the study area, the defined delimitation in PIRAGUA (OPCC) in shapefile format (https://www.opcc-ctp.org/en/geoportal, last access: 21 July 2024) has been used.
3.3 Temporal analysis
The temporal analysis includes the monthly evolution of the events, on average, and the study of the possible annual trends. These analyses were carried out for the Pyrenees as a whole, as well as for the regions of Catalonia, Andorra, Aragon, the Basque Country, Navarre, Nouvelle-Aquitaine and Occitanie. Likewise, for the severity of flood events, their evolution was studied considering the total number of events of each category per year (0, ordinary; 1, extraordinary; 2, catastrophic; notable, that includes the extraordinary and catastrophic events).
A linear regression was used to obtain the trend, while Mann–Kendall test was implemented to check its significance (Mann, 1945; Kendall, 1975). The Mann–Kendall test states as a null hypothesis (H0) that there is no monotonic tendency in the series, while the alternative hypothesis (Ha) is that there is trend (positive or negative). This is a non-parametric test, and it can therefore be applied to all types of data regardless of the underlying probability density function. In the present study, it was established that a trend is significant when the p value of the Mann–Kendall statistic is below 0.05 (p < 0.05).
3.4 Weather types
The weather types associated with each flood episode have been classified using the mean sea level pressure (mslp) and the geopotential height at 500 hPa (z500), obtained from the ERA-5 reanalysis (Hersbach et al., 2020) in its native resolution (0.25°) for the geographical domain 30–60° N, 20° W–20° E. The original hourly data spanning from 1981 to 2015 were averaged on a daily scale to compute the synoptic classification described below.
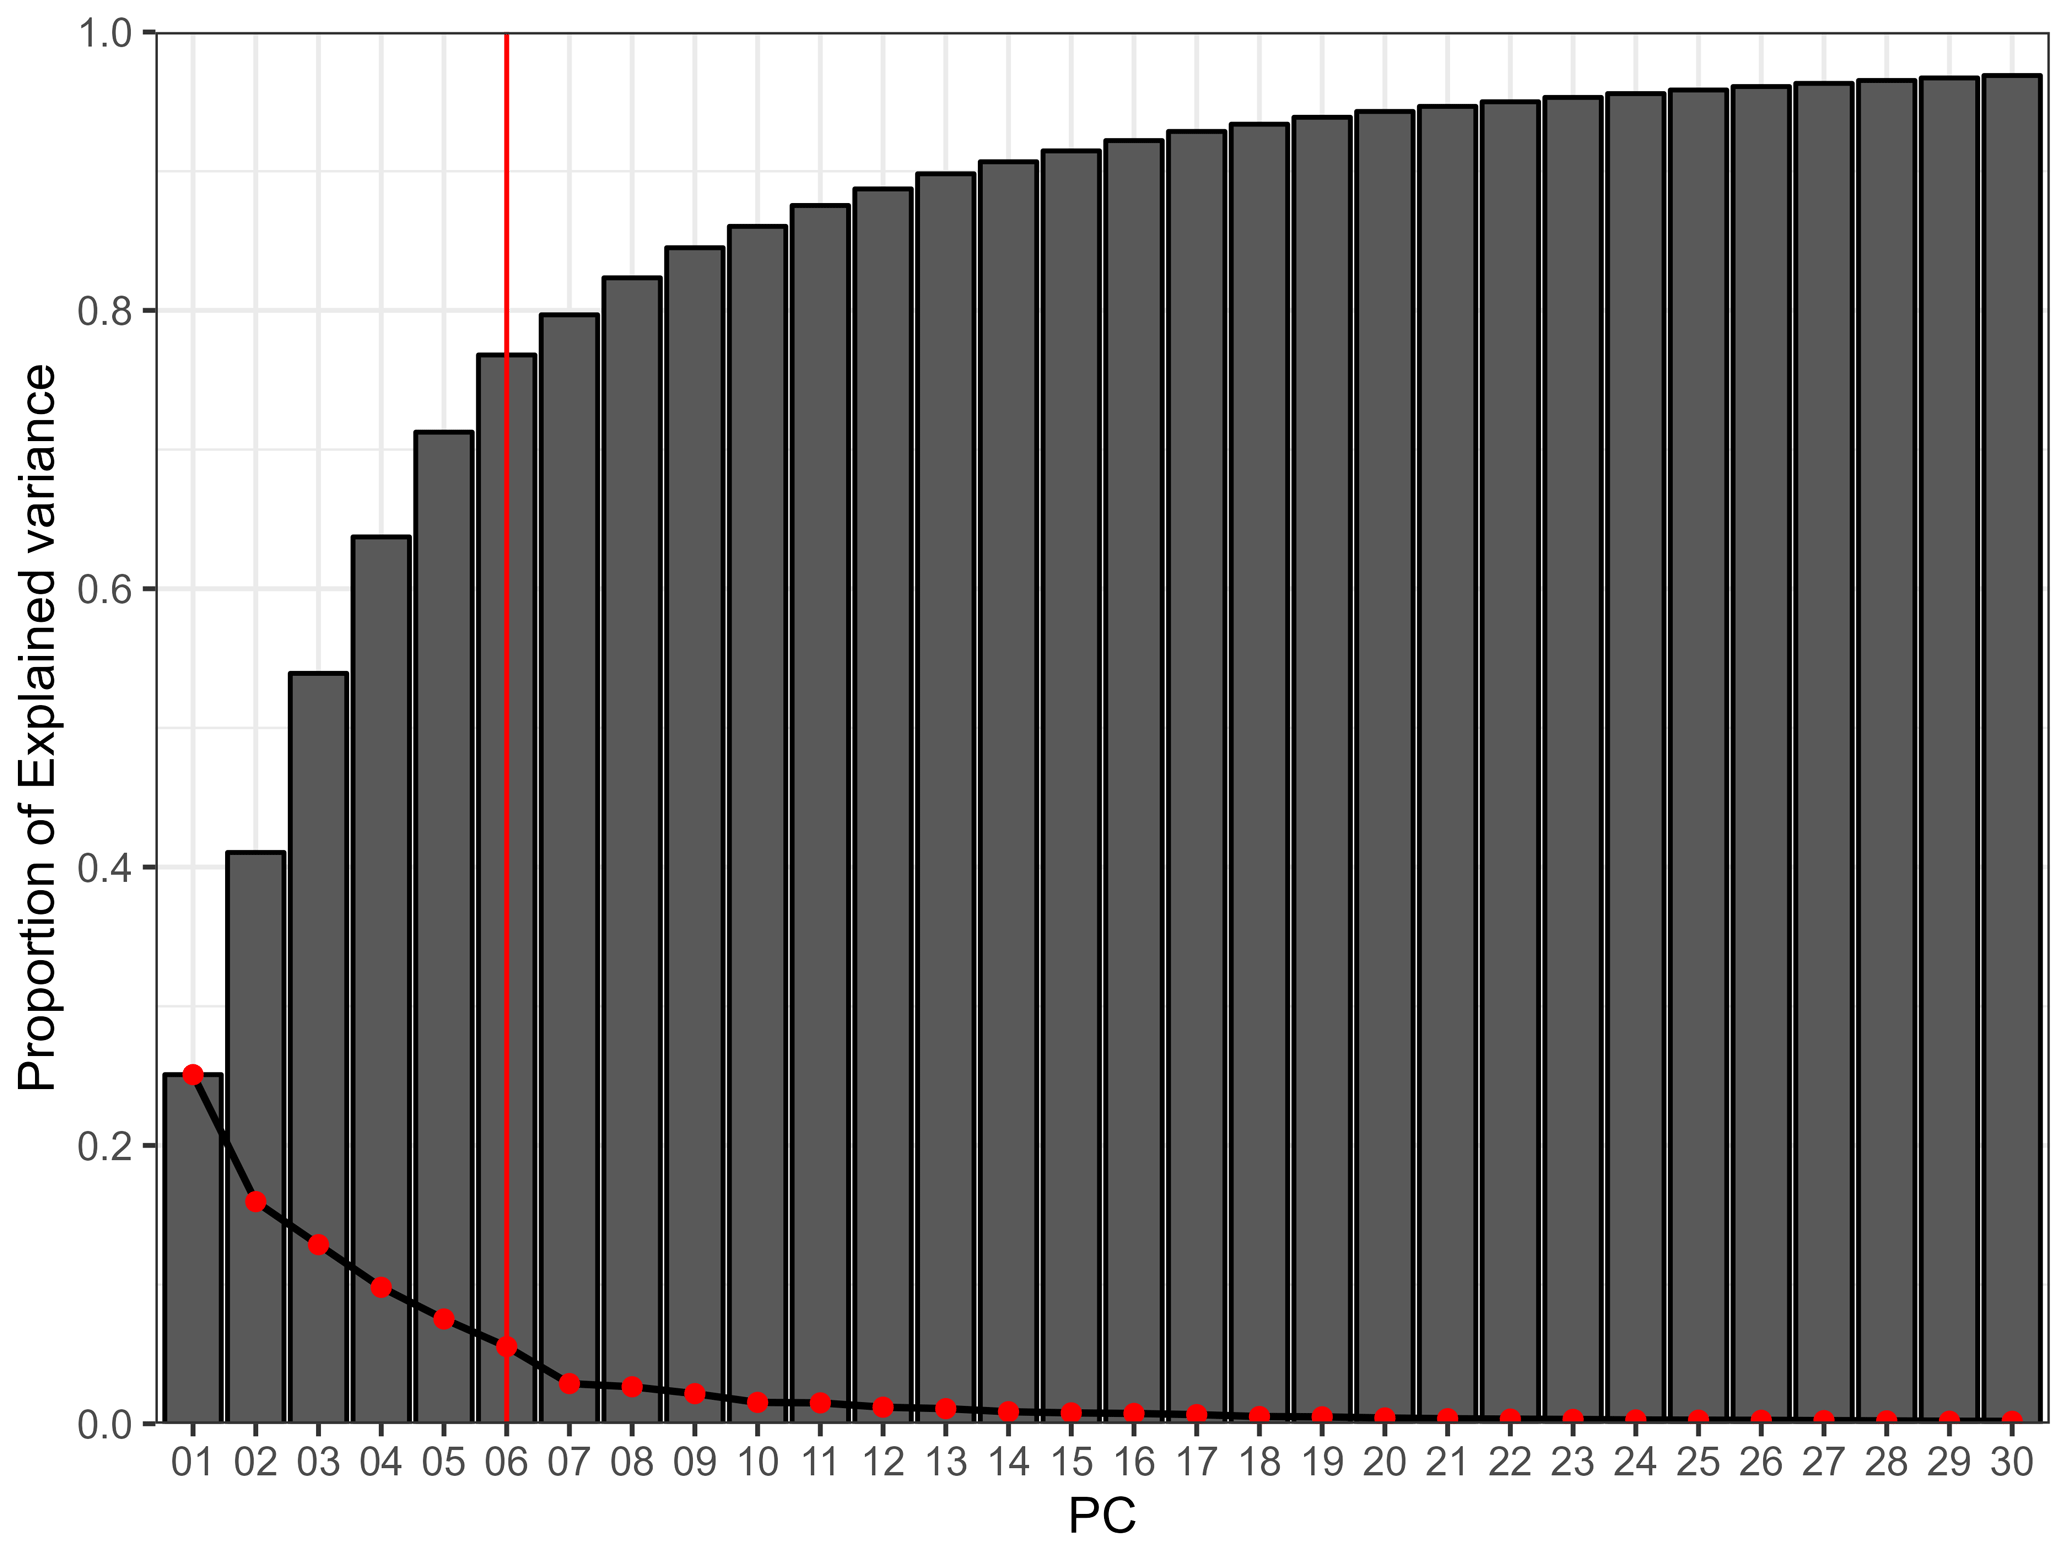
Figure 4Scree test for the first 30 principal components (PCs). The red dots show the explained variance (%) for each principal component, while the grey bars show the cumulative explained variance. The red vertical line indicates the cut off PC. Thus, six PCs were retained, accounting for the 78 % of the total variance.
To synthesise all the dates that comprise the flood episodes, a principal component analysis (PCA) was applied to the mslp and z500 matrices in mode T. Mode T configures the data matrix to which the PCA is applied as follows: the variables (columns) of such matrices are the days in which flooding occurs, while the cases (rows) are the grid points of ERA-5. Once the PCA had been applied to the standardised data matrix, new variables were obtained: the principal components (PCs), which are linear combinations of the original variables. Subsequently, the PCs that explain a greater variance of the original data were identified using the scree test plot (Cattell, 1966), shown in Fig. 4.
Once the most explanatory PCs had been retained, a Varimax rotation was applied to them to readjust the orthogonal combination of each PC and obtain a greater variance explained by the initially less-explanatory PCs (Richman, 1986). Using the rotated PCs, the factor loads (i.e. the correlation matrix) were obtained, indicating the degree of correlation of each day with respect to each PC. In this sense, the allocation of each day to each of the PCs is based on the value of the maximum positive correlation and the minimum negative correlation. For example, day 1 is assigned to the absolute maximum correlation but subsequently retains the correlation symbol. As a result, PC1 can be divided into two groups: one for days with the maximum positive correlation (PC1+) and another for days with the lowest negative correlation (PC1−). This means that, if 6 PCs are retained, up to 12 weather types can be obtained. This type of classification has already been widely used to classify extreme events (with few samples), such as tornadic events (Rodriguez and Lemus-Canovas, 2023), torrential precipitation events (Martin-Vide et al., 2008; Lemus-Canovas et al., 2021), and heat waves and cold waves (Serrano-Notivoli et al., 2022). To calculate the classification, the synoptReg R package was used (Lemus-Canovas et al., 2019a). This package is available at https://github.com/lemuscanovas/synoptReg (last access: 21 July 2024).
4.1 Distribution of floods on a scale of the entire Pyrenean massif
Table 4 has been provided in order to summarise the information that will be analysed in this section. It should be noted that the same event can affect more than two regions. This is why we have calculated the total number of times that the different Pyrenees regions have been affected by floods, total, and the total number of episodes that have affected the massif, total episodes (considering that an episode that affects more than one region is counted only once). In this article, it is considered that those floods that occur on the same day are related to the same meteorological synoptic situation, and, therefore, it is the same episode that has produced floods in different places. This clarification is necessary because in other articles (i.e. Barriendos et al., 2019; Gil-Guirado et al., 2019) the criterion used is based on the sum of all the locations where flooding has occurred. If the number of times the regions have been affected by flood events were considered, the figure of 242 would be obtained. However if the criteria just explained were taken into account, it would be concluded that the Pyrenees massif was affected by 181 flood episodes between 1981 and 2015. Of these events, 128 affected the Spanish part, 43 affected the French part and 46 affected Andorra. Some of the events were common to two or all three countries, or they affected different regions from the same country, with a total of 41 “transregional” episodes. One example was the flood event that occurred between 17 and 19 June 2013 that affected Spain and France. In Catalonia, the municipalities with the greatest damage due to the 2013 event were Salardú, Arties, Escunhau, Vielha, Bossòst and Les; in Aragon, it was Cerler, Castejón de Sos and Benasque; in Nouvelle-Aquitaine, there was catastrophic damage in Lourdes and Arreau (Hautes-Pyrénées), Nay (Pyrénées-Atlantiques) and Saint-Béat (Haute-Garonne). Some towns were isolated due to road damage, landslides or rockfalls. Numerous bridges, some buildings and campsites were totally or partially destroyed by the violent floods that carried rocks and the remains of vegetation. Numerous houses and crop lands were flooded, causing cuts in all types of supplies. It was, therefore, a flood event of category 3 (major).
Table 4Synthesis of information on flood events that have affected the POCTEFA Pyrenees region in the period 1981–2015. Information includes total number of events (N.total); number of catastrophic episodes (N.cat.); number of extraordinary episodes (N.ext.); number of ordinary episodes (N.ord); the municipality most affected (munic. max) and the number of cases it recorded (N.total munic. max); the total number of fatalities (N.vict.), the compensation paid by the CCS to the municipalities in the Spanish Pyrenees for floods that took place between 1996 and 2015, adjusted to 2015 (CCS total); the municipality that received the most amount (munic. max CCS) and the amount (CCS munic. max); the three months that recorded the greatest number of events; and the trend of the number of events per decade (∗ means a significant trend at 95 %). The sum of episodes that affected the various study regions (total) and the number of episodes that affected the Pyrenees region (total ep) is indicated. In the latter addition, events common to two or more regions have been included only once.
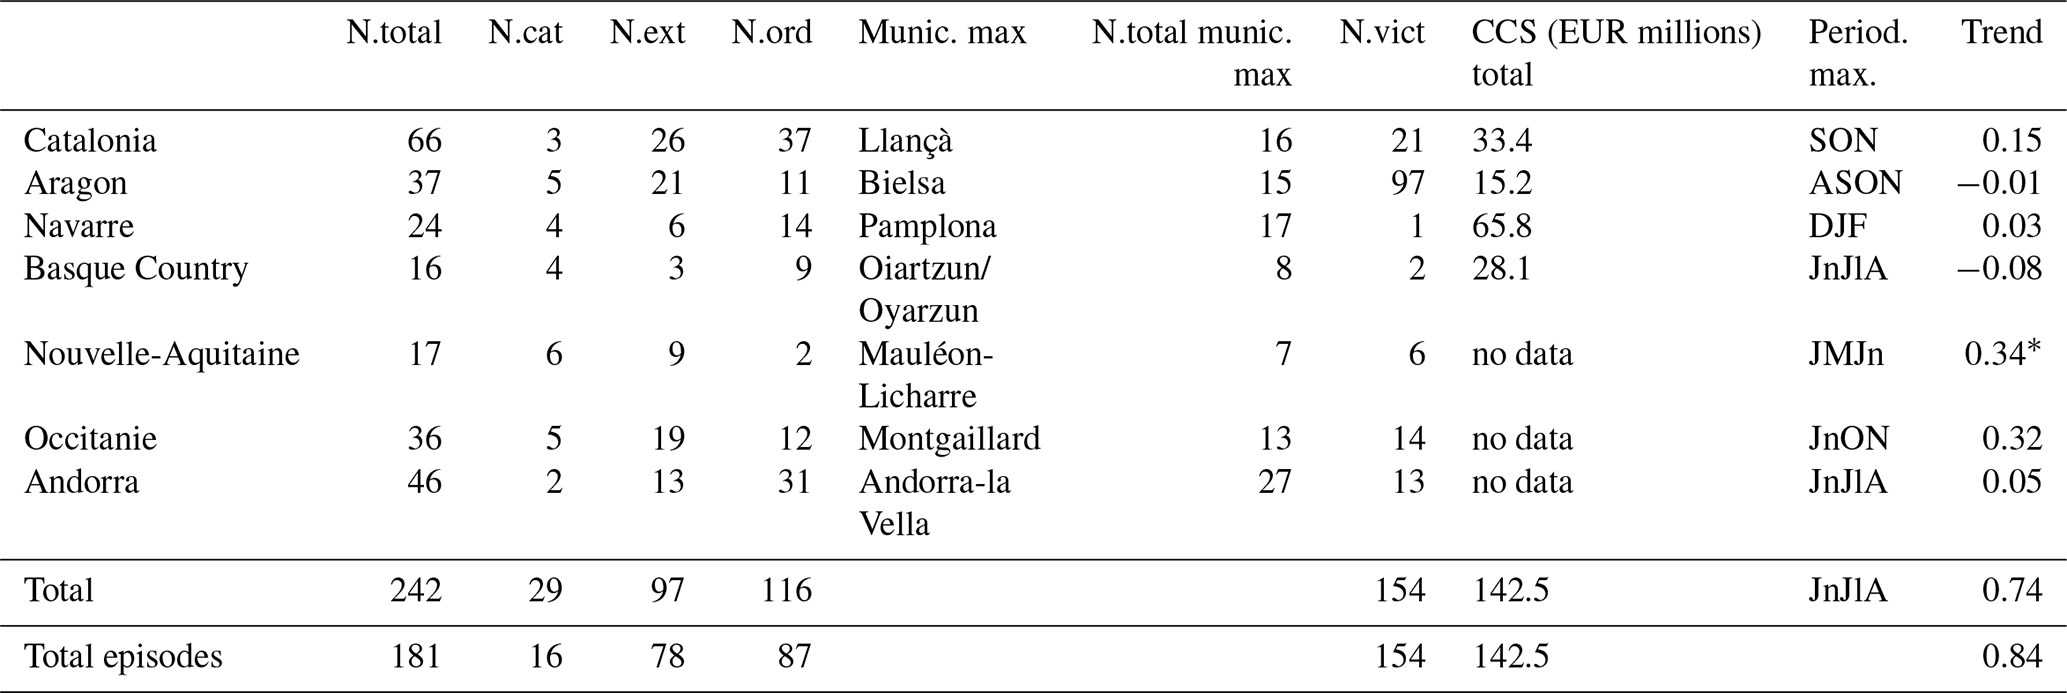
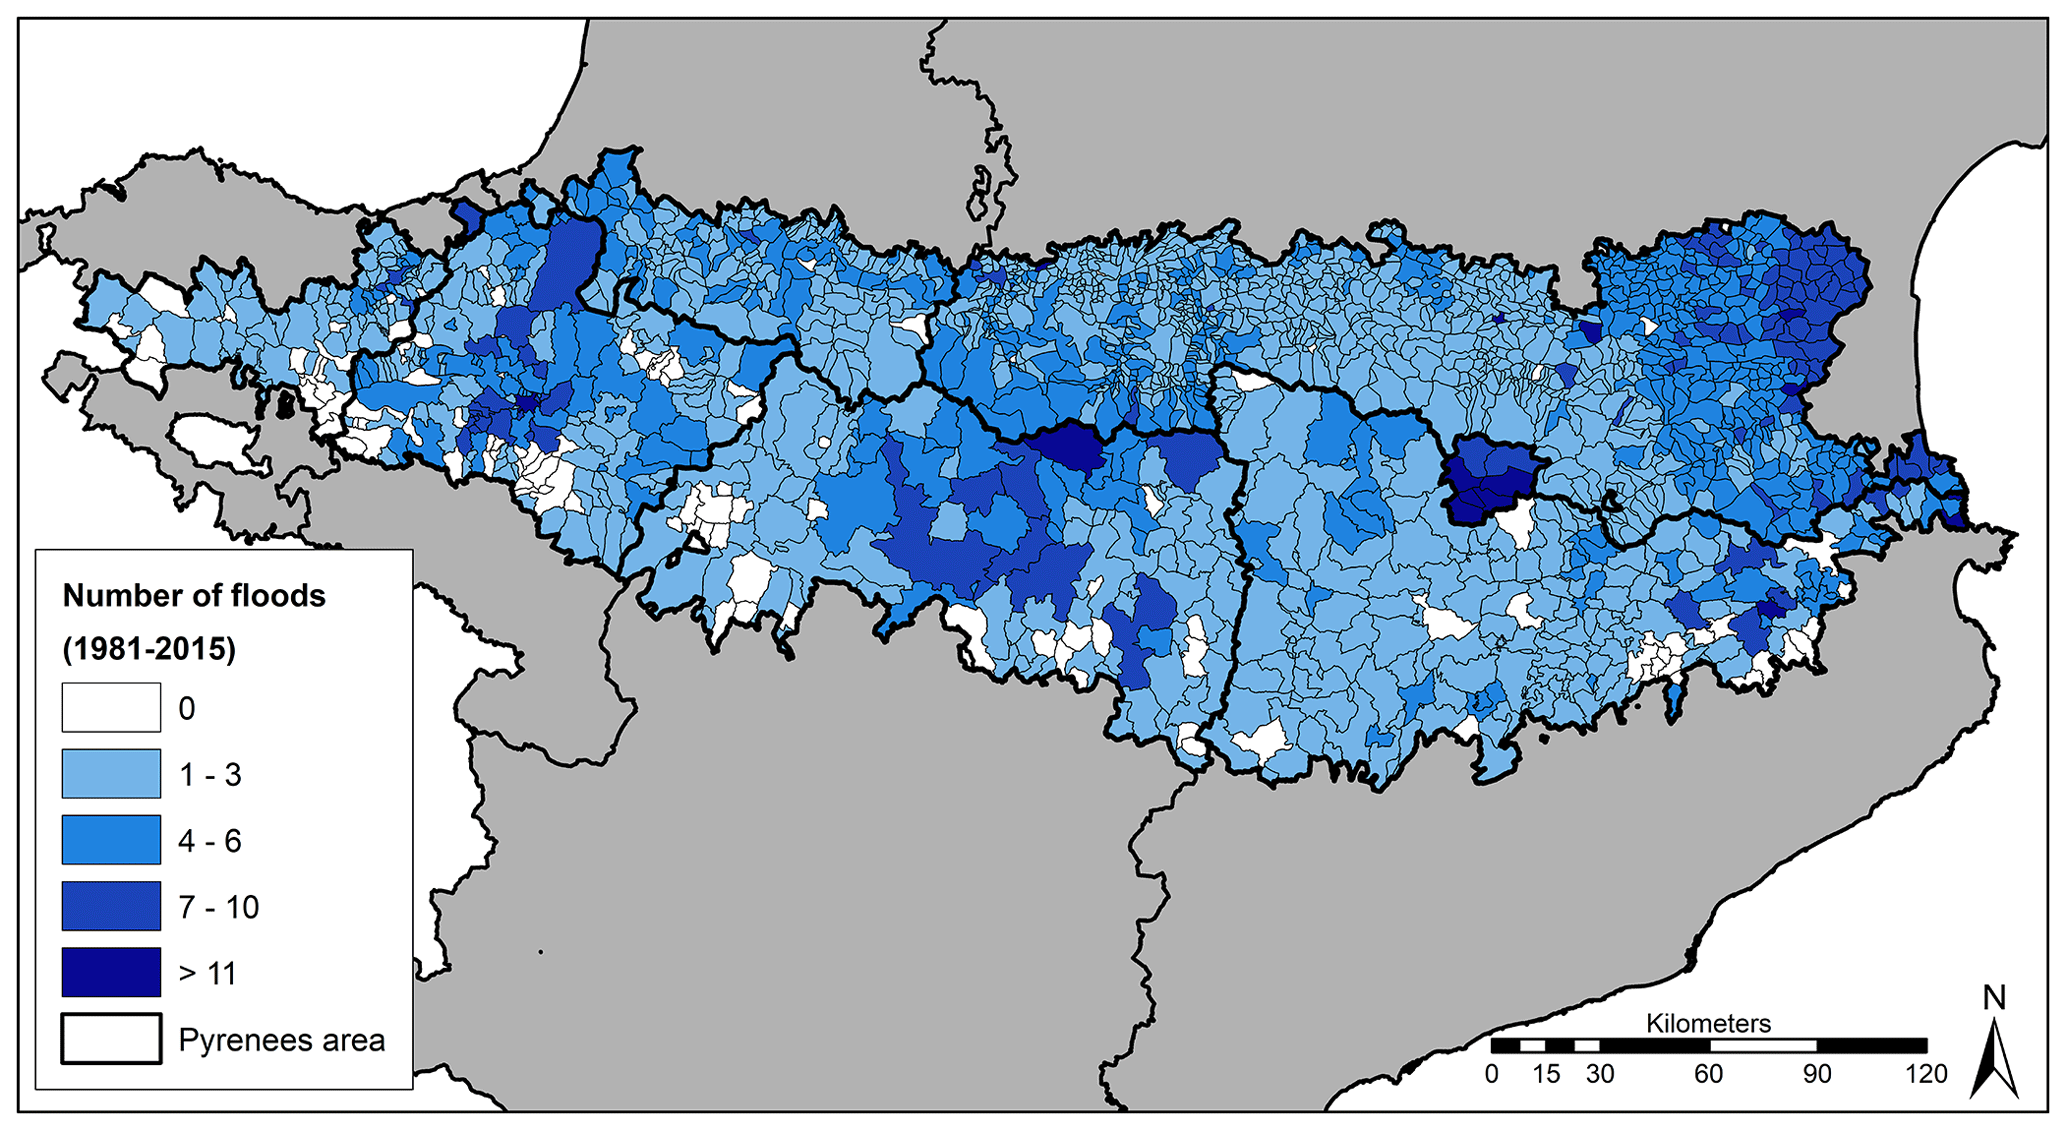
Figure 5Number of flood events that affected each municipality in the Pyrenees between 1981 and 2015.
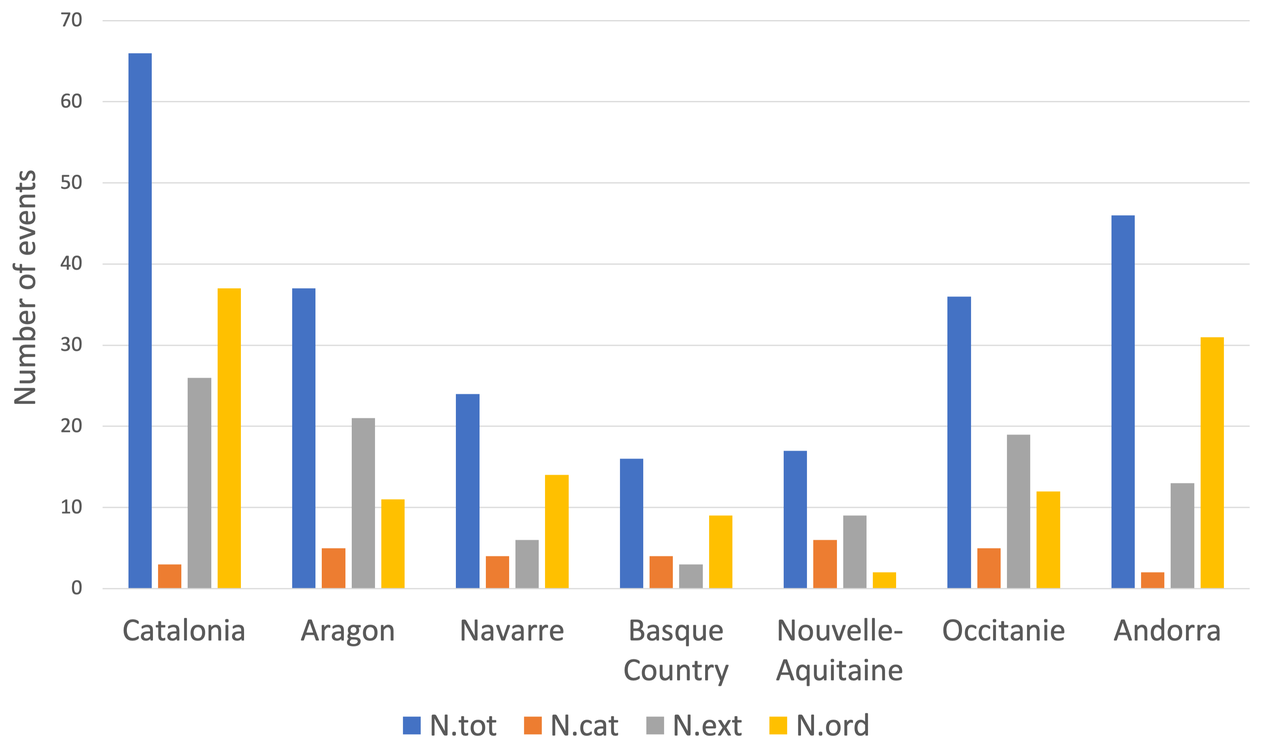
Figure 6Distribution of the total number of flood events (blue) and the number of flood events by categories (catastrophic, orange; extraordinary, grey; and ordinary, yellow) in the different communities that make up the POCTEFA Pyrenees region, for the period 1981–2015.
Figure 5 shows that the highest concentration of flood episodes occurs in Andorran municipalities and in the easternmost area of Occitanie and Catalonia. Some municipalities in Aragon and Navarre also stand out, while in the Basque Country and Nouvelle-Aquitaine, no municipality has recorded more than seven episodes of flooding. The region with the highest total number of flood events was Catalonia (66), followed by Andorra (46), while the lowest number was recorded in the Basque Country (16) (Fig. 6). Andorra is the region that records the highest percentage of ordinary floods (67.4 %), although the absolute maximum corresponds to Catalonia. This regional difference may be related to both the orography and the meteorological disturbances causing intense rains, which will be discussed later. The highest number of catastrophic flood events was recorded in Nouvelle-Aquitaine, followed by Occitanie and Aragon.
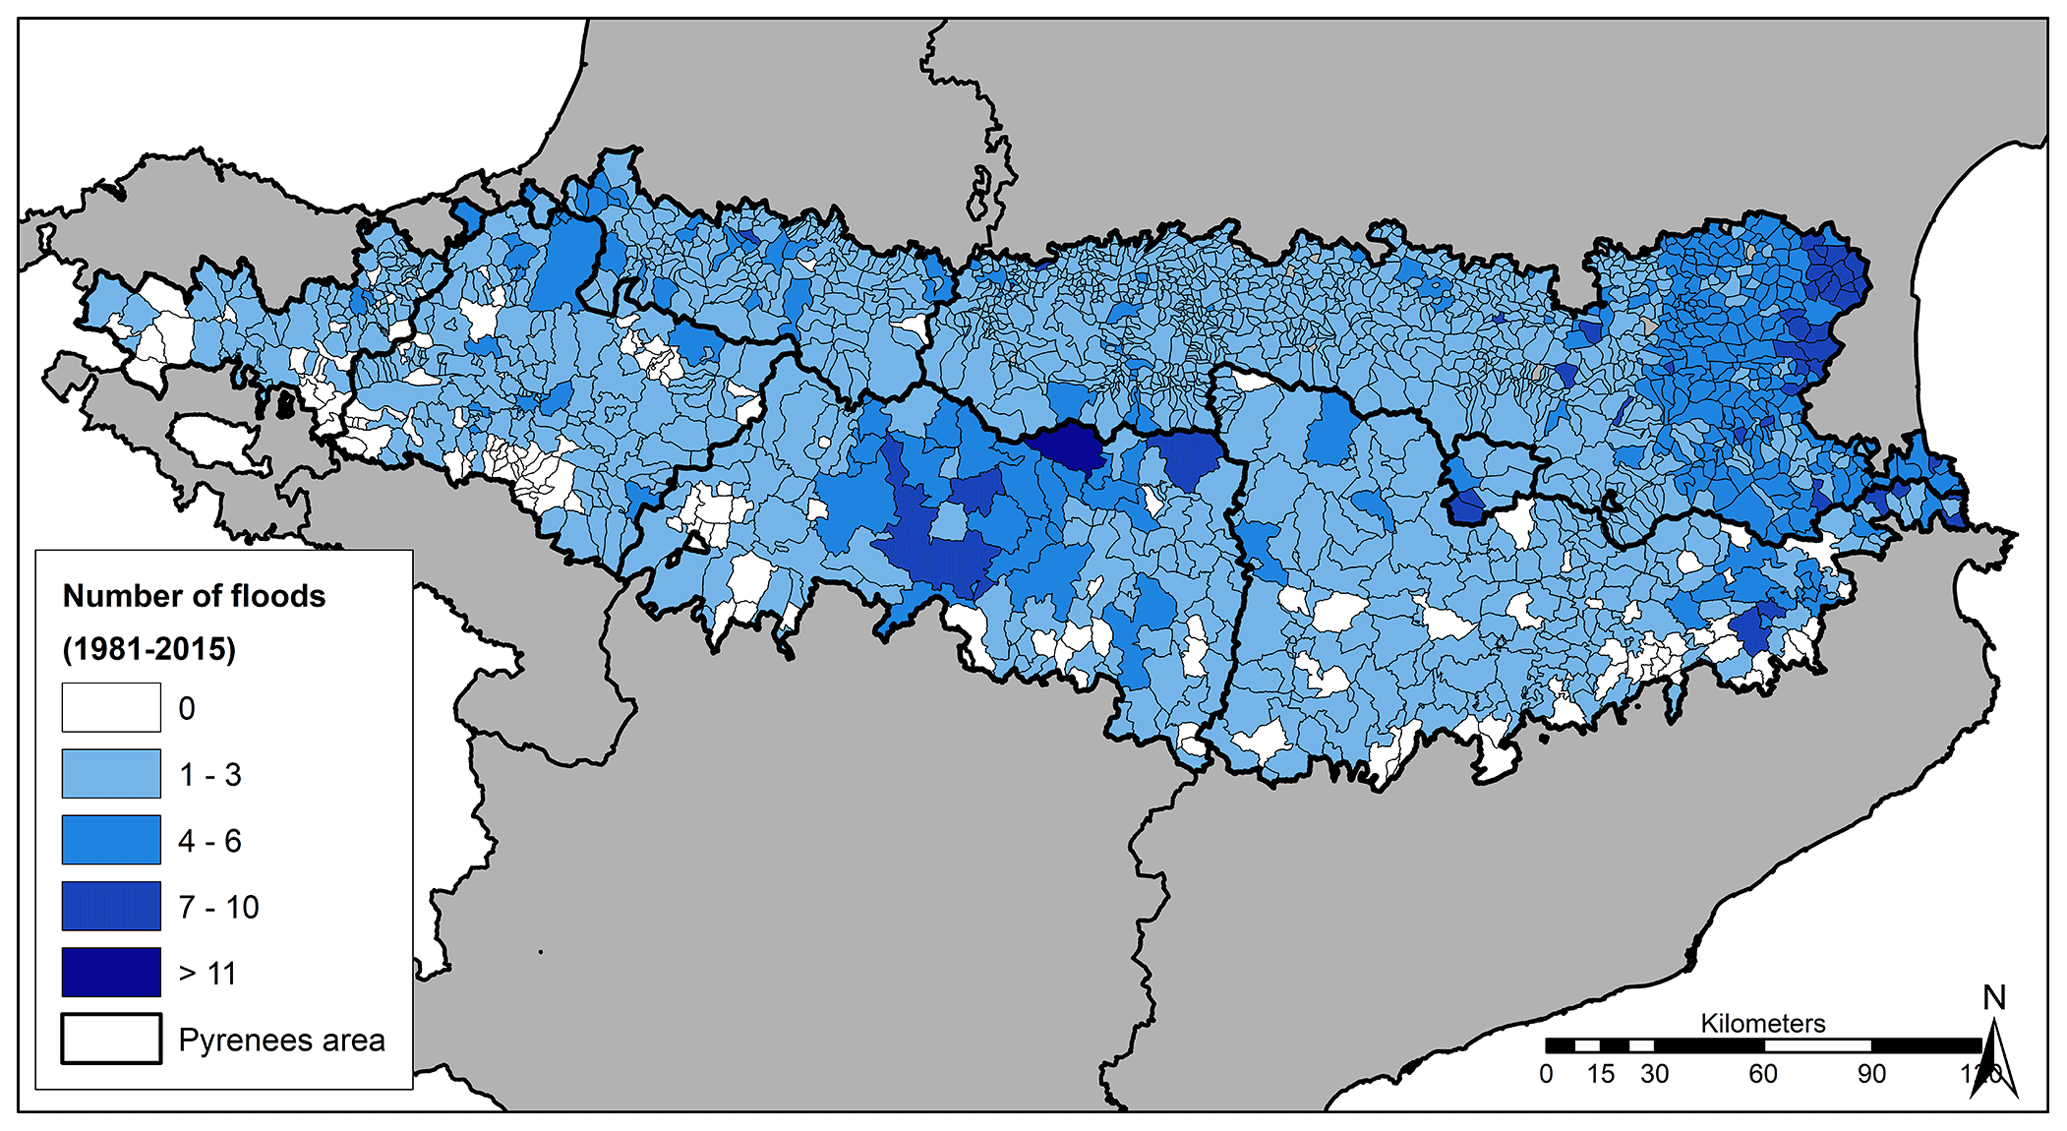
Figure 7Number of notable flood events (catastrophic and extraordinary floods) that affected each municipality in the Pyrenees.
We cannot forget, however, that it is possible that some ordinary floods in France have gone unnoticed, as we have explained in Sect. 2.2. This is why Fig. 7 has been constructed. It shows the distribution by municipality of flood events with notable damage (i.e. they were extraordinary or catastrophic). The distribution hardly changes with respect to Fig. 5, and only the maxima of some municipalities are smoothed out. Of the 181 flood events, 52 % produced notable damage in one or more of the Pyrenean regions. It is observed that notable flooding events are concentrated above all in the municipalities of the Pyrenees closest to the Mediterranean, both on the Spanish and French sides. The central part of the Spanish Pyrenees also stands out, located at the foot of the highest mountains. Pamplona (Aragon) and Llançà (Catalonia) have been the municipalities with the largest number of flood events (17 and 16, respectively). For the period 1996–2015, the number of flood episodes in both regions becomes 9 and 11, respectively, with compensation paid by the CCS that amounts to EUR 18 million (2015) and EUR 1.1 million (2015), respectively. In the same period, Vielha (Catalonia), which after Pamplona is the municipality to which the CCS has paid the most, collected EUR 9.9 million (2015) in compensation for one episode. This difference is the consequence of the major exposure of Pamplona, with a population of 195 853 inhabitants, in comparison to the 5450 inhabitants in Vielha and 4985 inhabitants in Llançà (year 2015). In the case of Vielha, the GDP is EUR 170.2 million (2015), practically double the GDP of Llançà, with EUR 91.9 million (2015), which partially explains the different impacts between both Catalan villages, in addition to the fact that the 2013 flood in the Garonne River was catastrophic in Catalonia and Occitanie.
Table 4 also shows the number of fatalities per region. Of the 154 victims, 97 died in floods in August, 87 of which correspond to the flash flood that destroyed the Las Nieves campsite of Biescas on 7 August 1996. This makes Aragon the region with the highest number of deaths, with a total of 97. The remaining 10 deaths, as well as the other victims, were recorded in July or September and are associated with mountain sports or ravine crossings. In contrast, the 39 victims recorded in November were mostly a result of more organised and extensive episodes of heavy rainfall (i.e. 6–8 November 1982), and a major part of them died at home or they were in a car that was swept away by the flood.
4.2 Regional flood events distribution
In the study period (1981–2015) there were 66 episodes in the Catalan Pyrenees in which the number of victims amounted to 21. Three episodes were catastrophic and 26 were extraordinary (Table 4). Figure 5 shows that the highest number of floods took place in the coastal foothills of the Pyrenees (16 episodes in the coastal municipality of Llançà, of which 62 % were extraordinary), which confirms the strong role played by the entrance of Mediterranean air masses. In Aragon there were a total of 37 flood events, of which 13.5 % were catastrophic. In four of them there were flash floods that led to the evacuation or death of several people who were canyoning. The number of victims amounts to 97, 87 of whom died at the Las Nieves campsite (Biescas) in August 1996 (Ayala Carcedo, 2002). Aragon has the county with the highest number of flash floods in the Pyrenees: Sobrarbe, where 26 events have taken place in 35 years. These are mainly events associated with thunderstorms in which the orography forces the rise and hinders the advance of convective systems, which can remain stationary in the same place (i.e. the Biescas case). The large number of torrents and dejection cones favours the production of flash floods. Given that these are very attractive mountain areas, it is possible that there are campsites, hikers or high-risk athletes, which increases vulnerability and exposure. The Navarre Pyrenees were affected by 24 events (17 %, catastrophic), in which there was 1 victim. In this case, the damage is usually due to urban and peri-urban flooding, affecting its capital, Pamplona (203 418 inhabitants), which is the Pyrenean city with the largest number of recorded events (17). However, the most catastrophic episodes in Navarre have occurred in the Baztan Valley, where numerous villages and small industries extend around the river. During the period 1981–2015 only six episodes of flooding (25 % catastrophic) affected the Basque Pyrenees, with two victims. Most of them were concentrated in the eastern part of the region, near the Baztan Valley. Although it is true that the costliest flood event recorded in Spain in that period took place in the Basque Country, in August 1983, the greatest damage occurred around the coastal estuaries, outside the Pyrenean region. Precisely, if the economic costs are taken into account, the CCS paid a total of EUR 33.4 million (2015) in flood compensation in the Catalan Pyrenean region in the period 1996–2015, with Val d'Aran being the most compensated region (a recreation and ski area with luxurious urbanisation near the river), mainly due to the June 2013 event that also affected Aragon and the French Pyrenees (Table 5). For the same period, the CCS paid a total of EUR 15.2 million (2015) in flood compensation in Aragon, mainly due to the flood events of August 1996 (the Biescas case), which also affected Andorra, and the flood event of June 2013. The CCS paid a total of EUR 65.8 million (2015) in flood compensation in Navarre, of which about EUR 18 million (2015) went to Pamplona and EUR 5.5 million (2015) went to Baztan. The CCS paid a total of EUR 28.1 million (2015) in flood compensation in the Basque Pyrenees, of which the largest amount went to Tolosa (19 525 inhabitants, the most important city in the region).
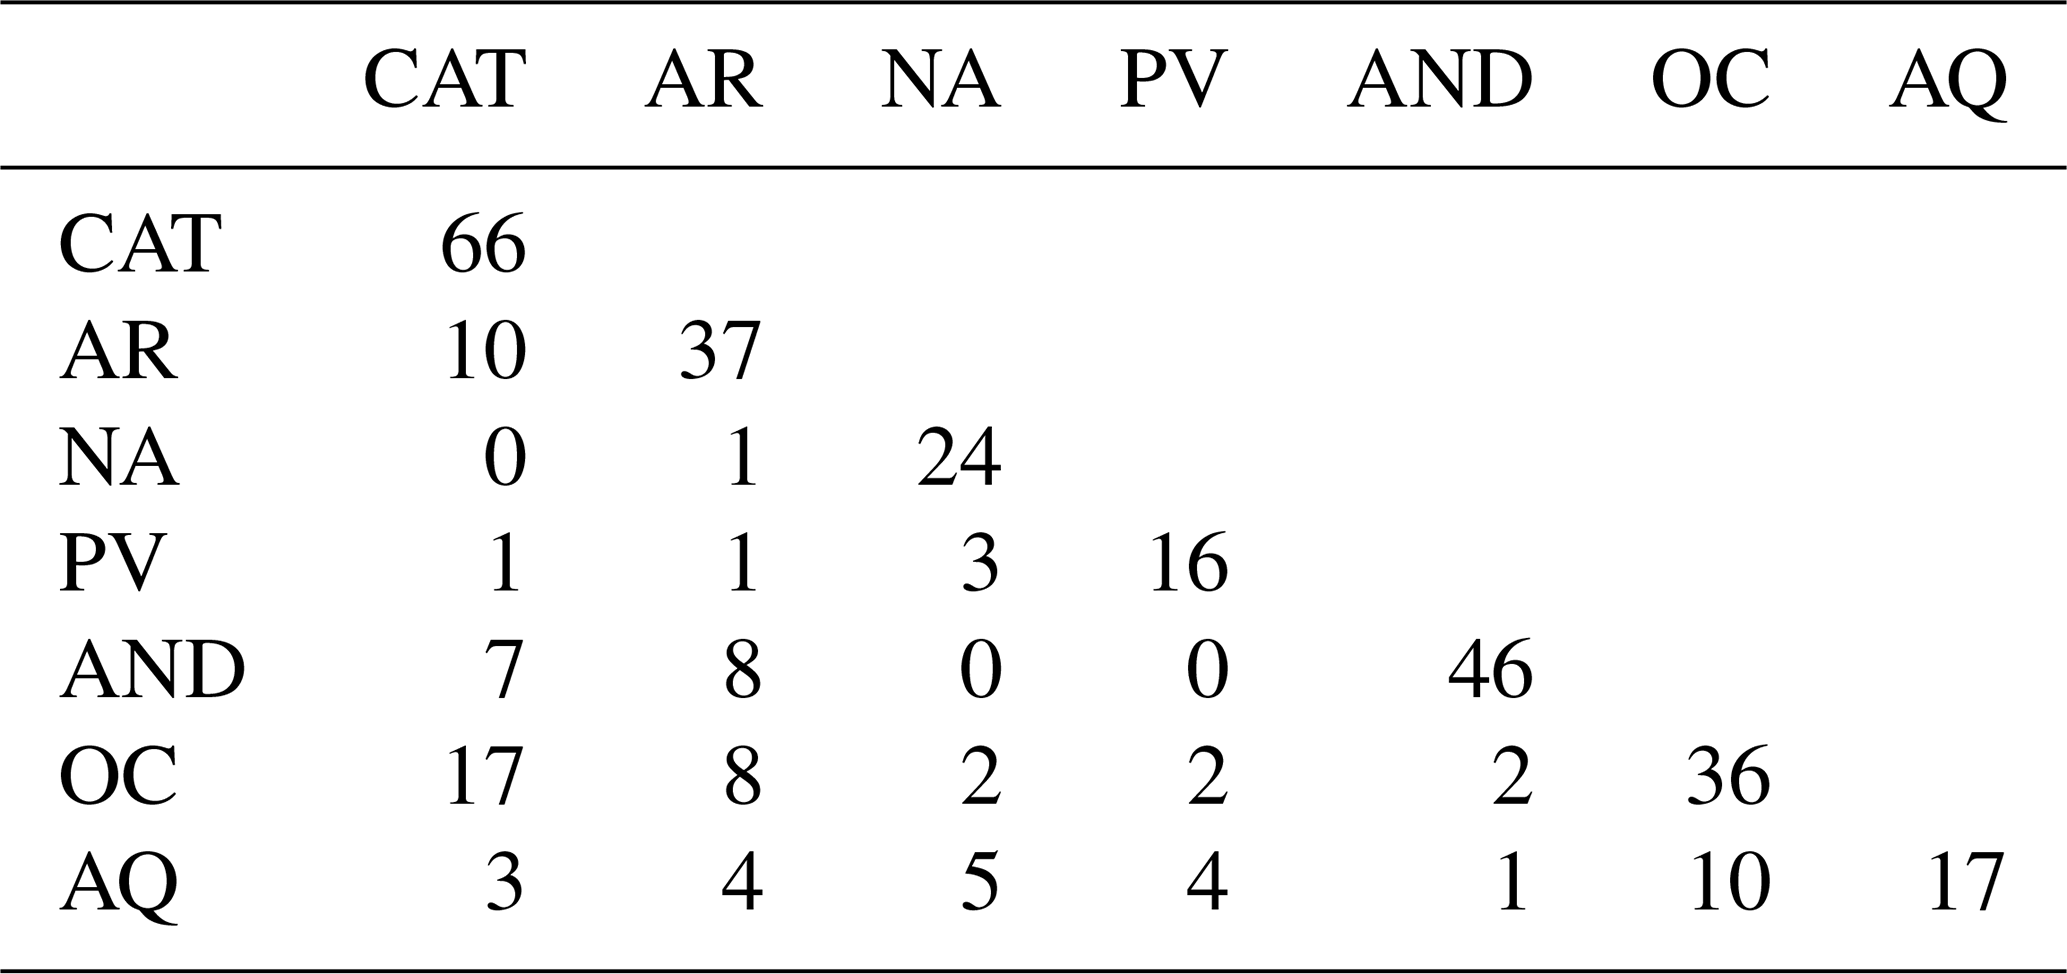
Table 5Number of events that have affected each Pyrenean region and number of events that have affected each pair of regions indicated by the intersection by them. The diagonal shows the total number of events in each region.
A total of 46 flood events were recorded in Andorra in the period 1981–2015, of which only 4.55 % were catastrophic. It is a country of 79 824 inhabitants with a very high risk of flooding, especially because the most important towns and villages are surrounding the Valira River in a very narrow valley. The most important heavy rainfall events are usually due to Mediterranean perturbations that also affect Catalonia and Aragon (Table 5). The maximum number of flood events occurred in the municipality of Andorra la Vella (27), followed by Sant Julià de Lòria (18). In total, 43 episodes of floods affected the French side of the Pyrenees, of which Nouvelle-Aquitaine recorded 17 events and Occitanie recorded a total of 36 events, with a percentage of catastrophic episodes of 35.3 % and 13.9 %, respectively. Ten of these episodes were common to the two regions. In Occitanie, the municipality with the most flood episodes was Montgaillard, with 13, while in Nouvelle-Aquitaine the maximum was lower, with 7 events in Mauléon-Licharre. Both populations are located closer to the Atlantic than the Mediterranean, being exposed above all to disturbances from the west and northwest. As a whole, however, the municipalities located further east in Occitanie stand out, where floods are mainly associated with disturbances such as those affecting Catalonia and Andorra. It is noteworthy that all the municipalities in the French Pyrenees have recorded at least one catastrophic flood event, with the maximum recorded in the northeastern part, close to the Mediterranean.
Figure 8 summarises the monthly distribution of the number of flood events for each of the regions. In the case of the Catalan Pyrenees, most events are concentrated between September and November, while in Occitanie the October–November period stands out. In the Aragon Pyrenees, the August maximum stands out, extending the flood period until November. The summer season is also very significant in Andorra, with maxima in July and August. In Navarre, the events are distributed throughout the October–July period, with no remarkable month. This distribution differs from that of Nouvelle-Aquitaine, with a greater concentration from May to June, and from that of the Basque Country, with two different periods: June–August and January–March. This distribution leads us to believe that the regions with maxima in autumn are due to Mediterranean disturbances, while the maxima in spring and winter are associated with cold fronts, and summer encompasses convective events. In the same figure the solid line shows how the monthly evolution in the total number of episodes (an episode that affects several regions is considered as a single episode) is unimodal, with a maximum in summer (42 % of the total number of annual events) that would be associated with flooding by very intense and local convective rains. This is confirmed by the intra-annual evolution of the number of flood episodes, excluding ordinary ones (see the dashed line in Fig. 8), in which the summer maximum disappears to give way to a bimodal distribution with maxima in June and October. The unimodal distribution bears a considerable resemblance to the distribution of the percentage of convective precipitation throughout the year obtained for the Spanish Mediterranean region (Llasat, 2001; Llasat et al., 2021). In these 36 years, the highest number of victims occurred in August. Generally, these are individuals who engage in risky sports, although the high number of deaths is due to the Biescas disaster. The number is also relatively high in November and is associated with longer-duration events.
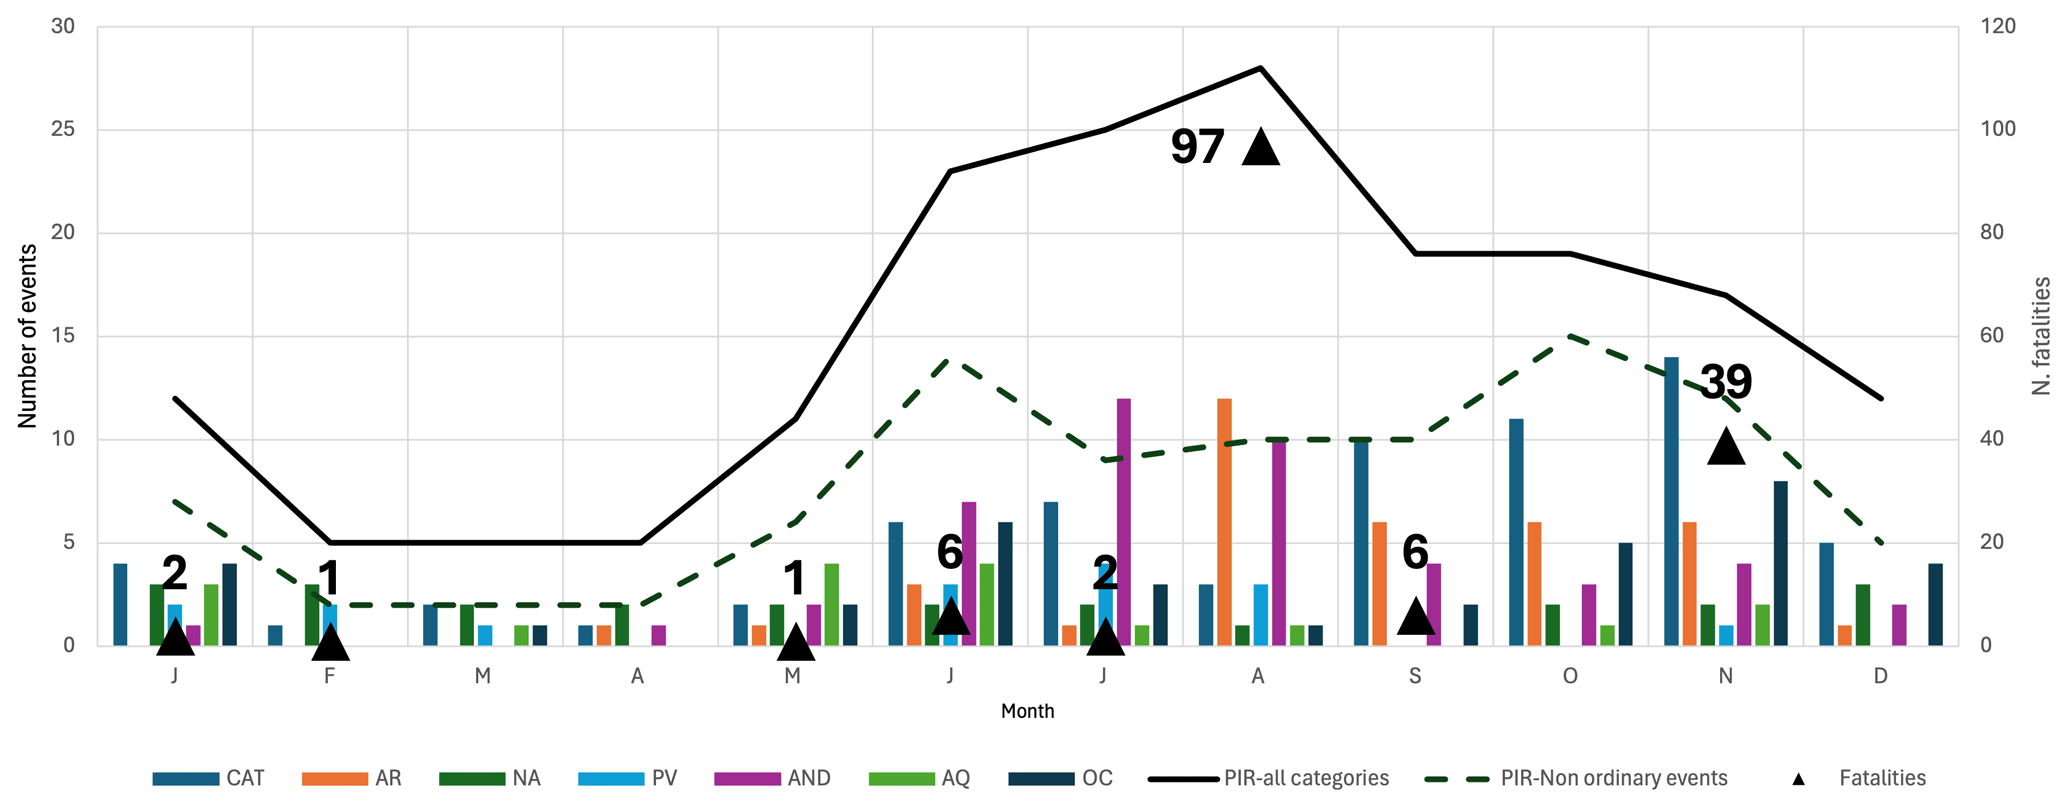
Figure 8Monthly distribution of the total number of flood cases for the different regions. The solid line shows the entire POCTEFA Pyrenees region, and the dashed line shows the number of notable events (period 1981–2015). The triangles indicate the total number of casualties in the entire study area for each month; the value is included next to the symbol.
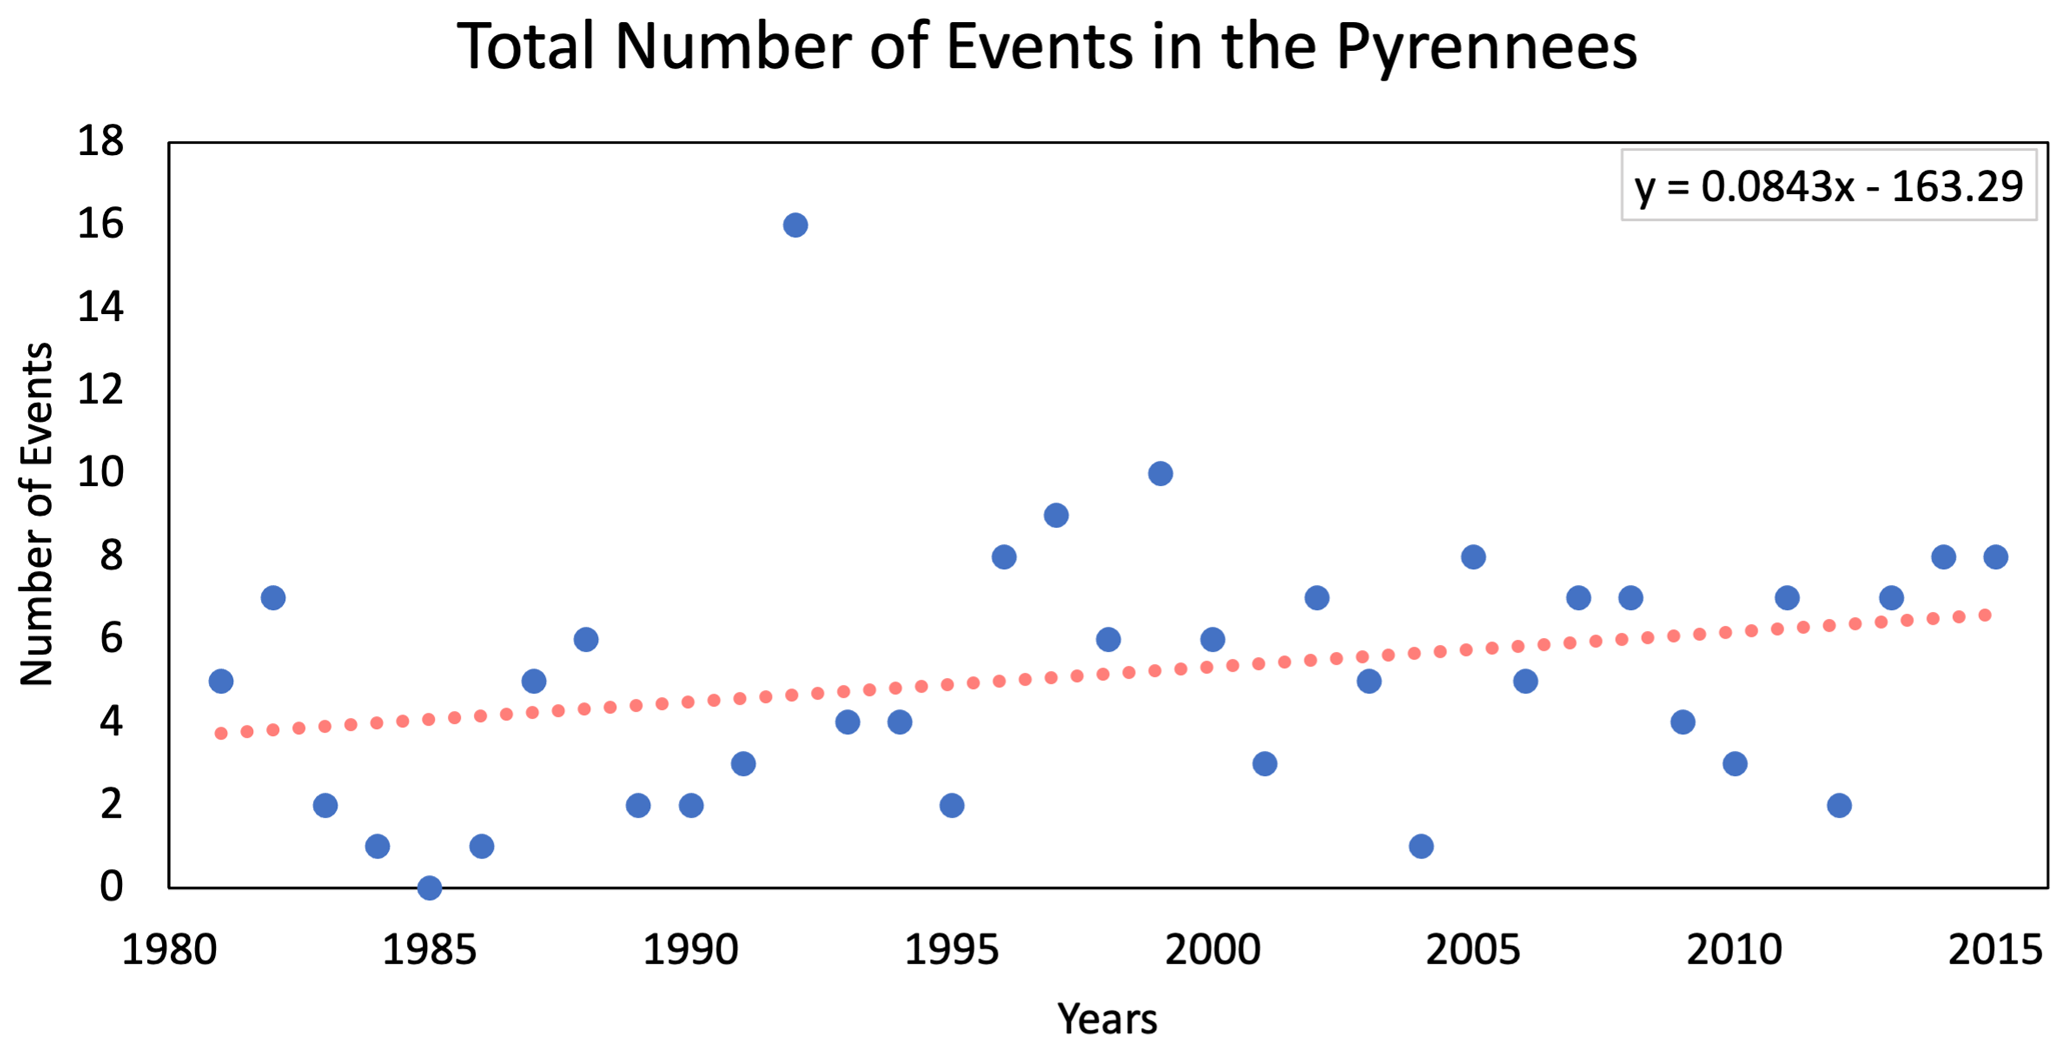
Figure 9Evolution of the total number of flood events (including ordinary and non-repeated events in the different regions) for the period 1981–2015.
The evolution of the flood events that have produced notable damage (extraordinary and catastrophic ones) in the different regions of the Pyrenees shows high variability. The trend analysis on a regional scale is only significant at 95 % according to the Mann–Kendall test for Nouvelle-Aquitaine, which shows an increase of 0.34 events per decade that is due to the increase of extraordinary events. For informational purposes, although they are not significant at 95 %, positive trends were also observed in Catalonia, Navarre, Occitanie and Andorra, although 0.1 events per decade is only exceeded in Catalonia and Occitanie. On the contrary, in Aragon and the Basque Country, the trend is negative, but it does not reach −0.1 events per decade. Taking the Pyrenees massif in its entirety, the trend of notable flood events is positive and equal to 0.5 events per decade, but it is not significant at 95 %. On the other hand, if ordinary episodes are also considered, the trend of flood events for the entire Pyrenees increases until 0.84 events per decade, but it is only significant at 90 % (Fig. 9).
Table 6Flood events that affected more than one of the countries of the POCTEFA Pyrenees region in the period 1981–2015. Affected countries are marked with an “X”.
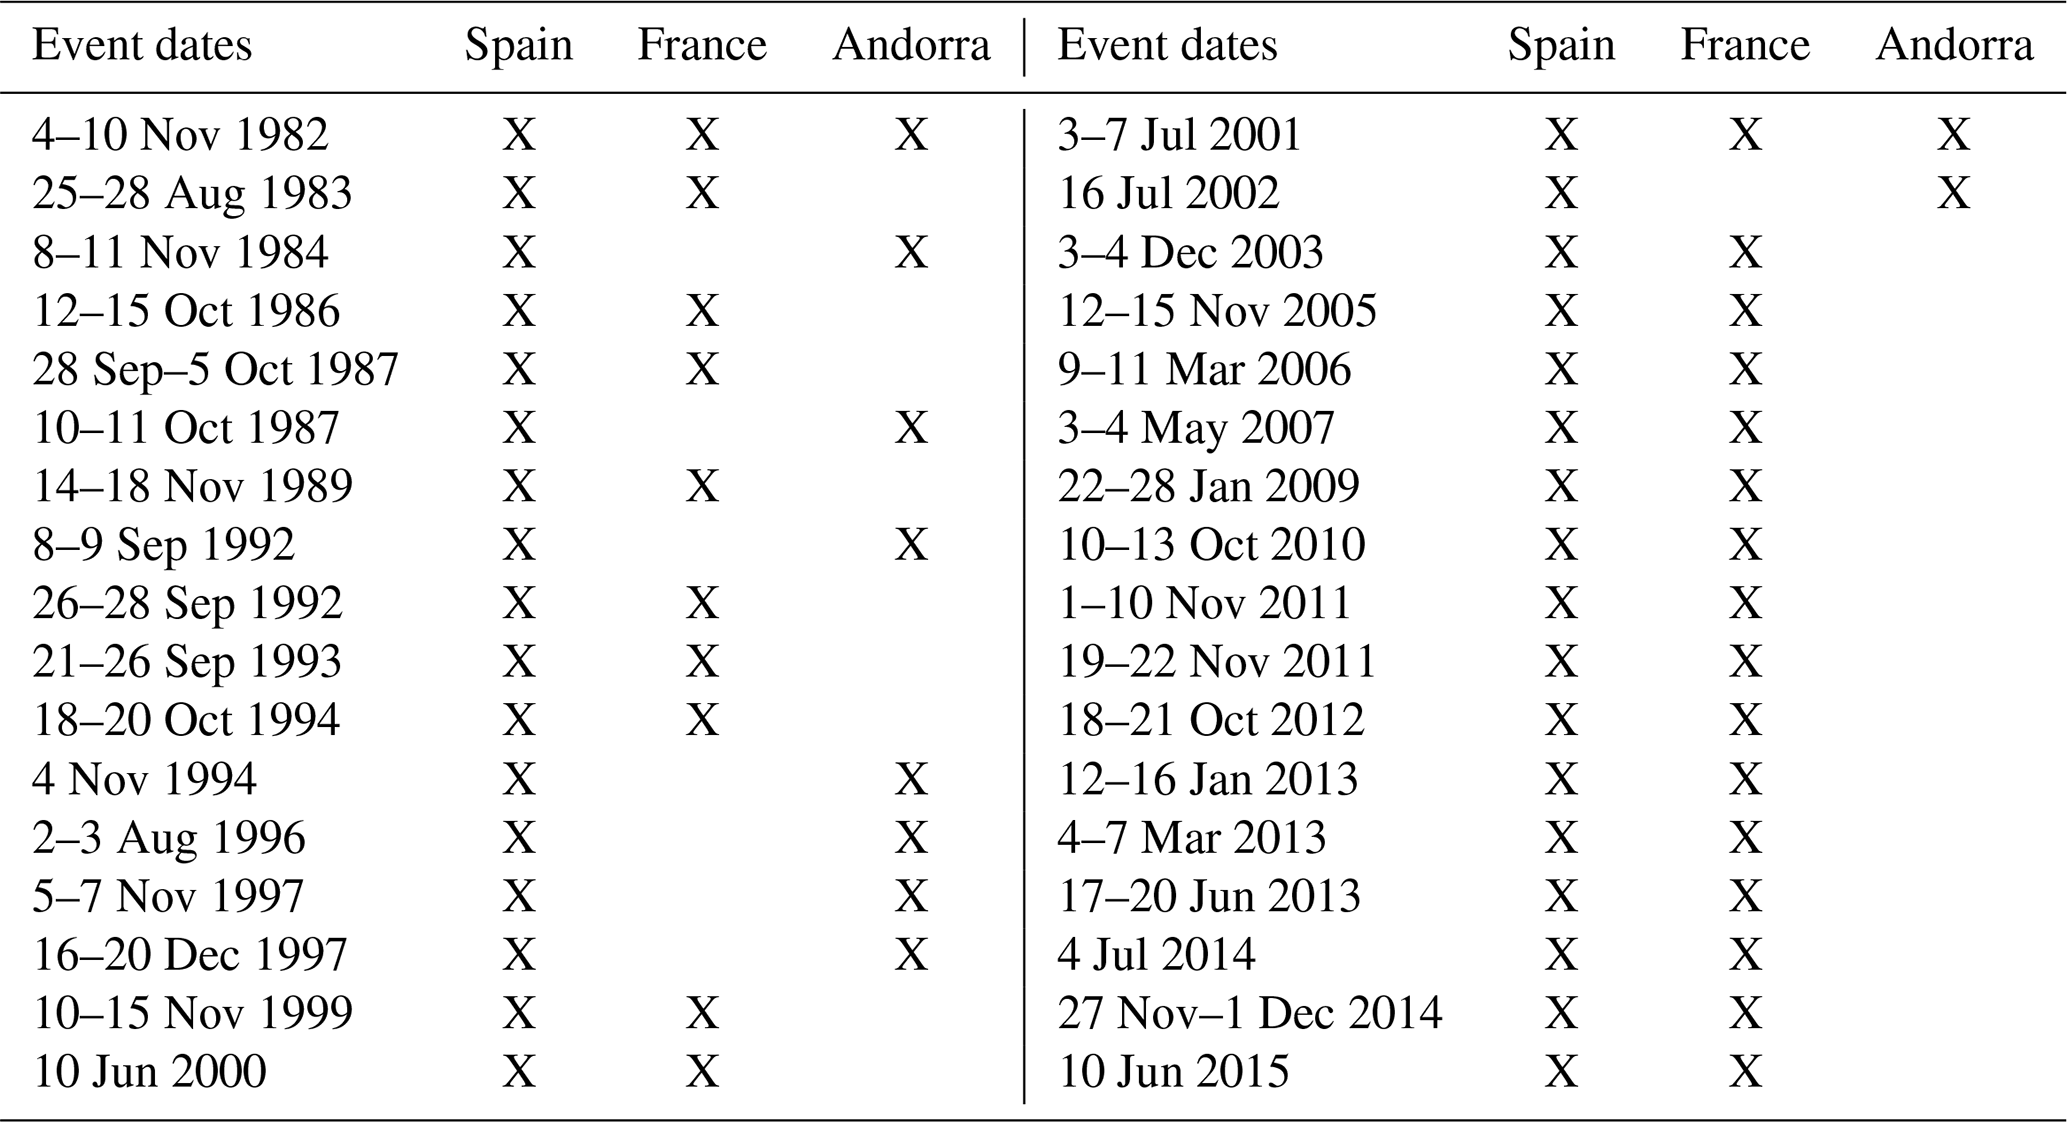
Of all the recorded flood events, 41 affected two or more Pyrenean regions (Table 5). Of these, 34 were international cross-border, highlighting the episodes that affected Spain and France (71 %), while 24 % affected Spain and Andorra simultaneously, and 5 % affected all three countries (Table 6). The most frequent are episodes that simultaneously affect two or more of the regions of Catalonia, Aragon, Occitanie and Andorra: 41 % of the transregional episodes took place between Catalonia and Occitanie, while 24 % were between Catalonia and Aragon and another equal percentage between Occitanie and Nouvelle-Aquitaine (Table 5). They occur mainly in autumn (Fig. 10), which is consistent with the fact that it is in this season when the entry of organised Mediterranean disturbances is produced, usually associated with the presence of a depression in the Mediterranean and favoured by a warm sea (Llasat, 2009). On the contrary, between January and April practically no transnational episodes are recorded, and none has been recorded in February, which points to more localised events.
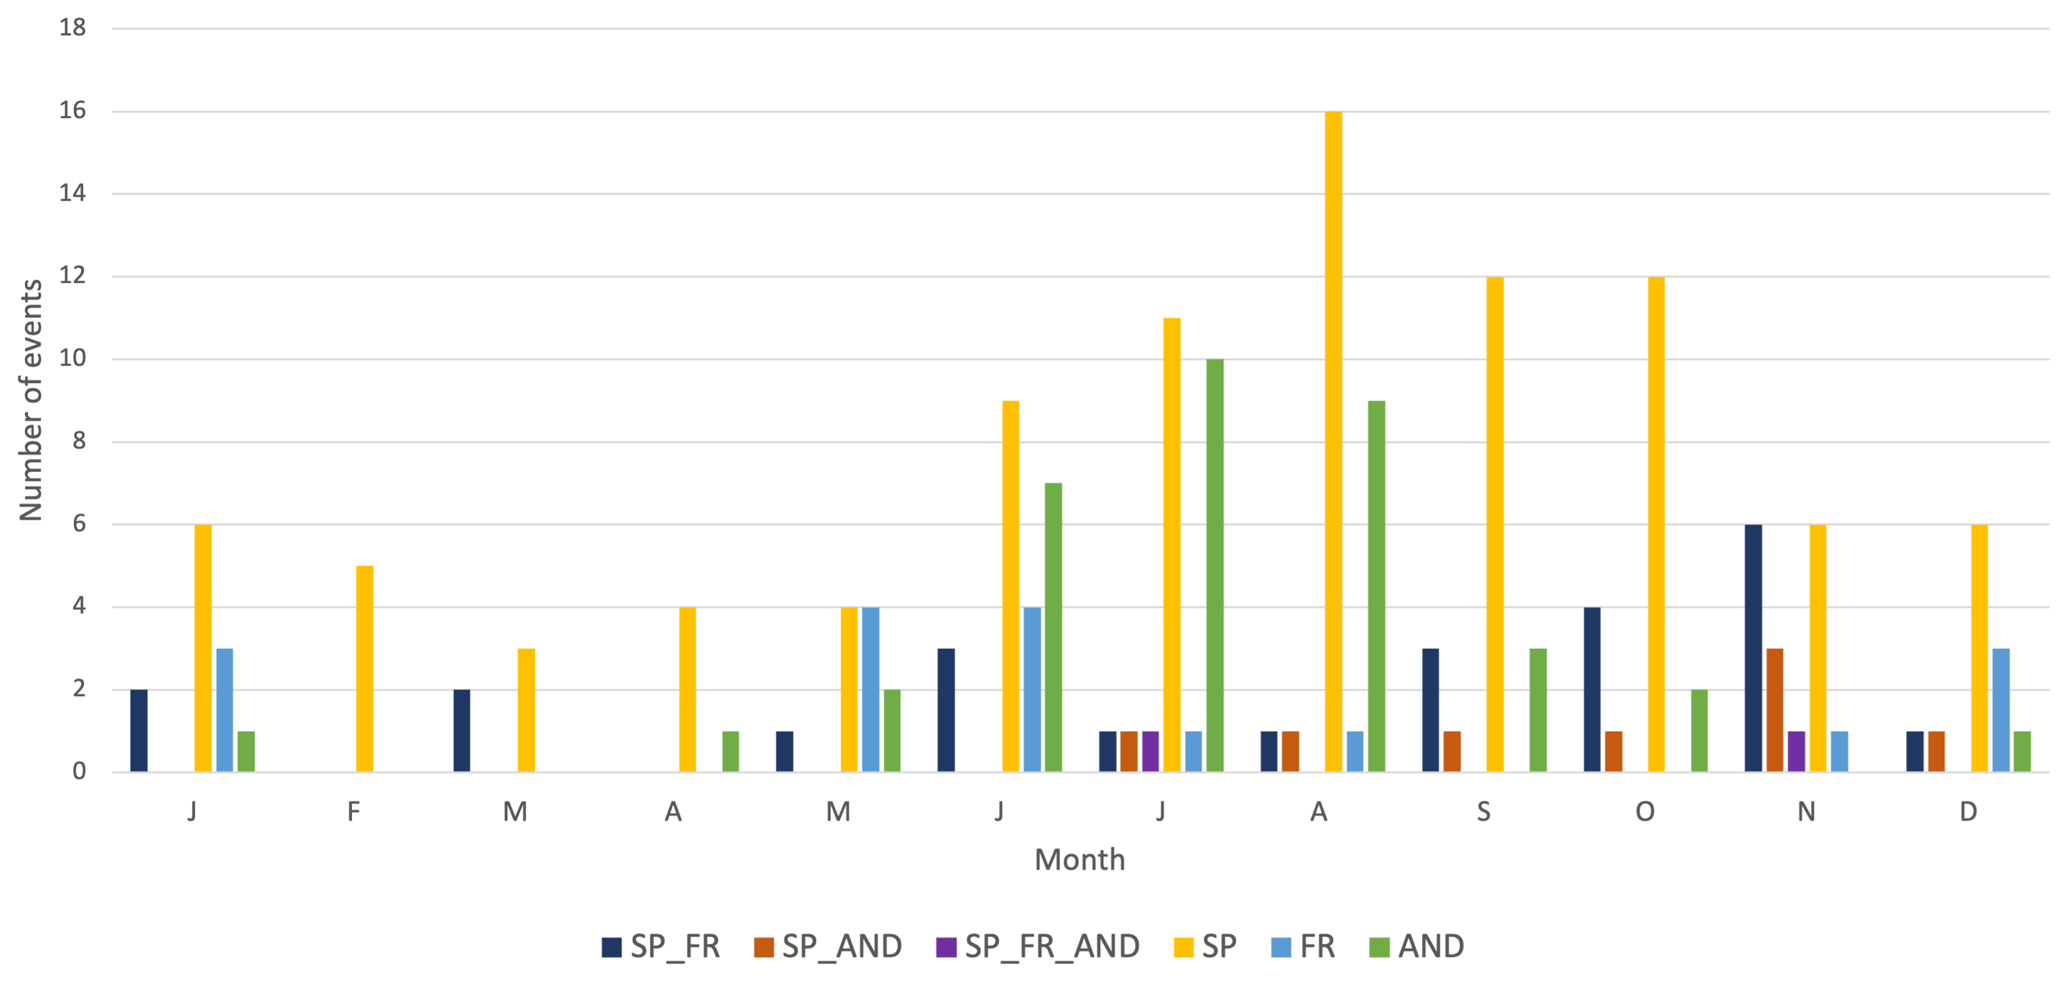
Figure 10Monthly total number of flood events recorded in the Pyrenean Region (1981–2015), for each country (SP: Spain; FR: France; AND: Andorra) and for cross-border events.
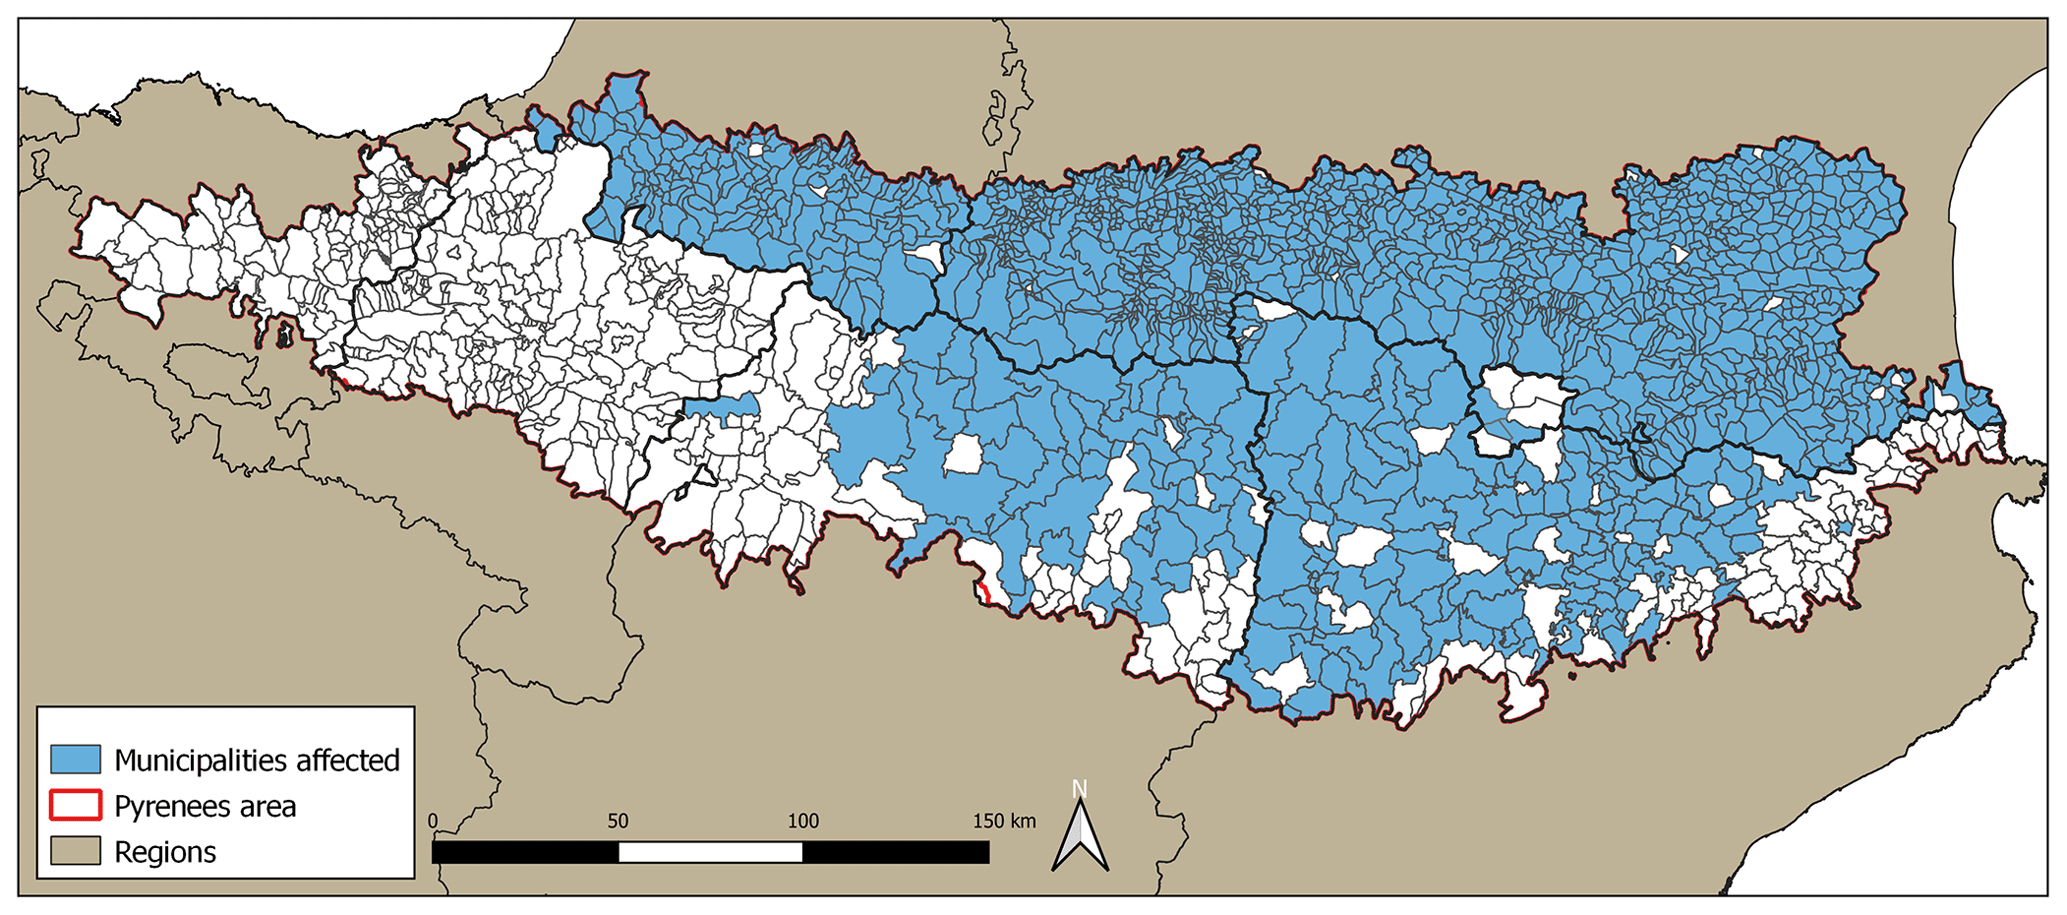
Figure 11Municipalities of the Pyrenees affected by the floods of 6–8 November 1982.
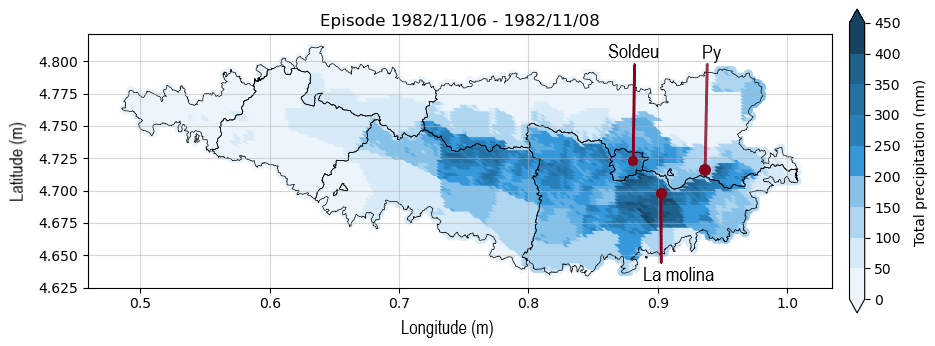
Figure 12Precipitation collected between 6 November at 06:00 UTC and 9 November 1982 at 06:00 UTC from the SAFRAN reanalysis.
Table 6 shows the list of cross-border flood events. As an example, Fig. 11 shows the municipalities that were affected by the floods of November 1982. The heavy rains began on 6 November in Spain and extended to Andorra and France on 7 November, ending the following day. They had a particular impact on the Eastern Pyrenees. The maximum total rainfall was 610 mm in Py (France), 556 mm in La Molina (Spain) and 203 mm in Soldeu (Andorra) (Fig. 12). As a result of the floods, 14 fatalities were recorded in Catalonia, with damage valued at EUR 994 million (2015) (Catalonia), EUR 88 million (2015) (Aragon) and EUR 132 million (2015) (Andorra). This flood event is one of the most extensive and intense of the 20th century in southwestern Europe. In it, the mountains played a very relevant role, favouring the orographic ascent and the release of instability (Trapero et al., 2013). The large amount of precipitation that occurred was due to the feeding of water vapour from remote sources, such as the subtropical Atlantic (Insua-Costa et al., 2019).
Figure 13 shows the 12 weather types (WTs) obtained from the combination of mslp and z500 and explaining practically 80 % of the variance, corresponding to the flood episodes that affected the Pyrenees between 1981 and 2015. First of all, it should be noted that there is no significant trend in any of the WTs. The WT 1−, characterised by a marked depression to the northwest of the Iberian Peninsula and a talweg, is the most characteristic of the episodes affecting the Eastern and central Pyrenees (Fig. 14a) in autumn (Fig. 14b). This favours the advection of warm and humid air from the Mediterranean in low levels and feeds humidity from remote sources. This was the case during the November 1982 episode (Llasat, 1987) and is the case in a large number of the episodes of intense rainfall that take place in the western Mediterranean (Insua-Costa et al., 2022; Miró et al., 2022). Note in Fig. 13b that this type of weather shows its maximum frequency in the month of October, the month with the most episodes of flooding in the Pyrenees. The WT 1+ favours the entry of Atlantic air over the western Pyrenees and, like the WT 1−, can lead to the passage of highly organised disturbances typical of winter and autumn (Fig. 14b), with notable rainfall accumulations in the western and northern part of the Pyrenees (Lemus-Canovas et al., 2019b) where most of the floods are recorded (Fig. 14a). In fact, the highest frequency is recorded in January (Fig. 14b). On the other hand, the dominant weather type in summer is WT 2− (Fig. 14b), which shows in the slight wave over the Iberian Peninsula, while on the surface the situation is relatively unclear. It would therefore be a situation favourable to isolated convection or poorly organised weather systems, typical of that time of year but which can also result in some episodes of very intense rainfall, as also described in Lemus-Canovas et al. (2021). This is the situation that characterised the episode of Biescas (Aragon), which occurred on 7 August 1996, and the floods that affected the Basque Country and Nouvelle-Aquitaine in August 1983, mainly concentrated in the southern half of the Pyrenees (Fig. 14a). The WT 3+ shows the formation of a mesoscale depression off the coast of Catalonia that results in instability and the E–SE air flow over the Eastern Pyrenees (Fig. 14a). The highest frequency is recorded in spring, specifically in June, a month that, as we have already seen, comes after October in terms of flood frequency (Fig. 14b). An example of this would be the floods of June 2013. These northern movements are usually associated with summer floods and can affect any area in the Pyrenees. Finally, it can be observed that in November the WT 4+ and WT 5+ dominate (Fig. 14b), both with a very marked groove over the Iberian Peninsula that will favour the vorticity to the east and the contribution of air flow from the Atlantic that feeds intense rainfall, especially in the easternmost sector of the mountain range (Lemus-Canovas et al., 2019c). These WTs are mainly associated with floods in the eastern part of the Pyrenees (Fig. 14a). An example is the episode of November 2005, which had a serious impact on Catalonia.
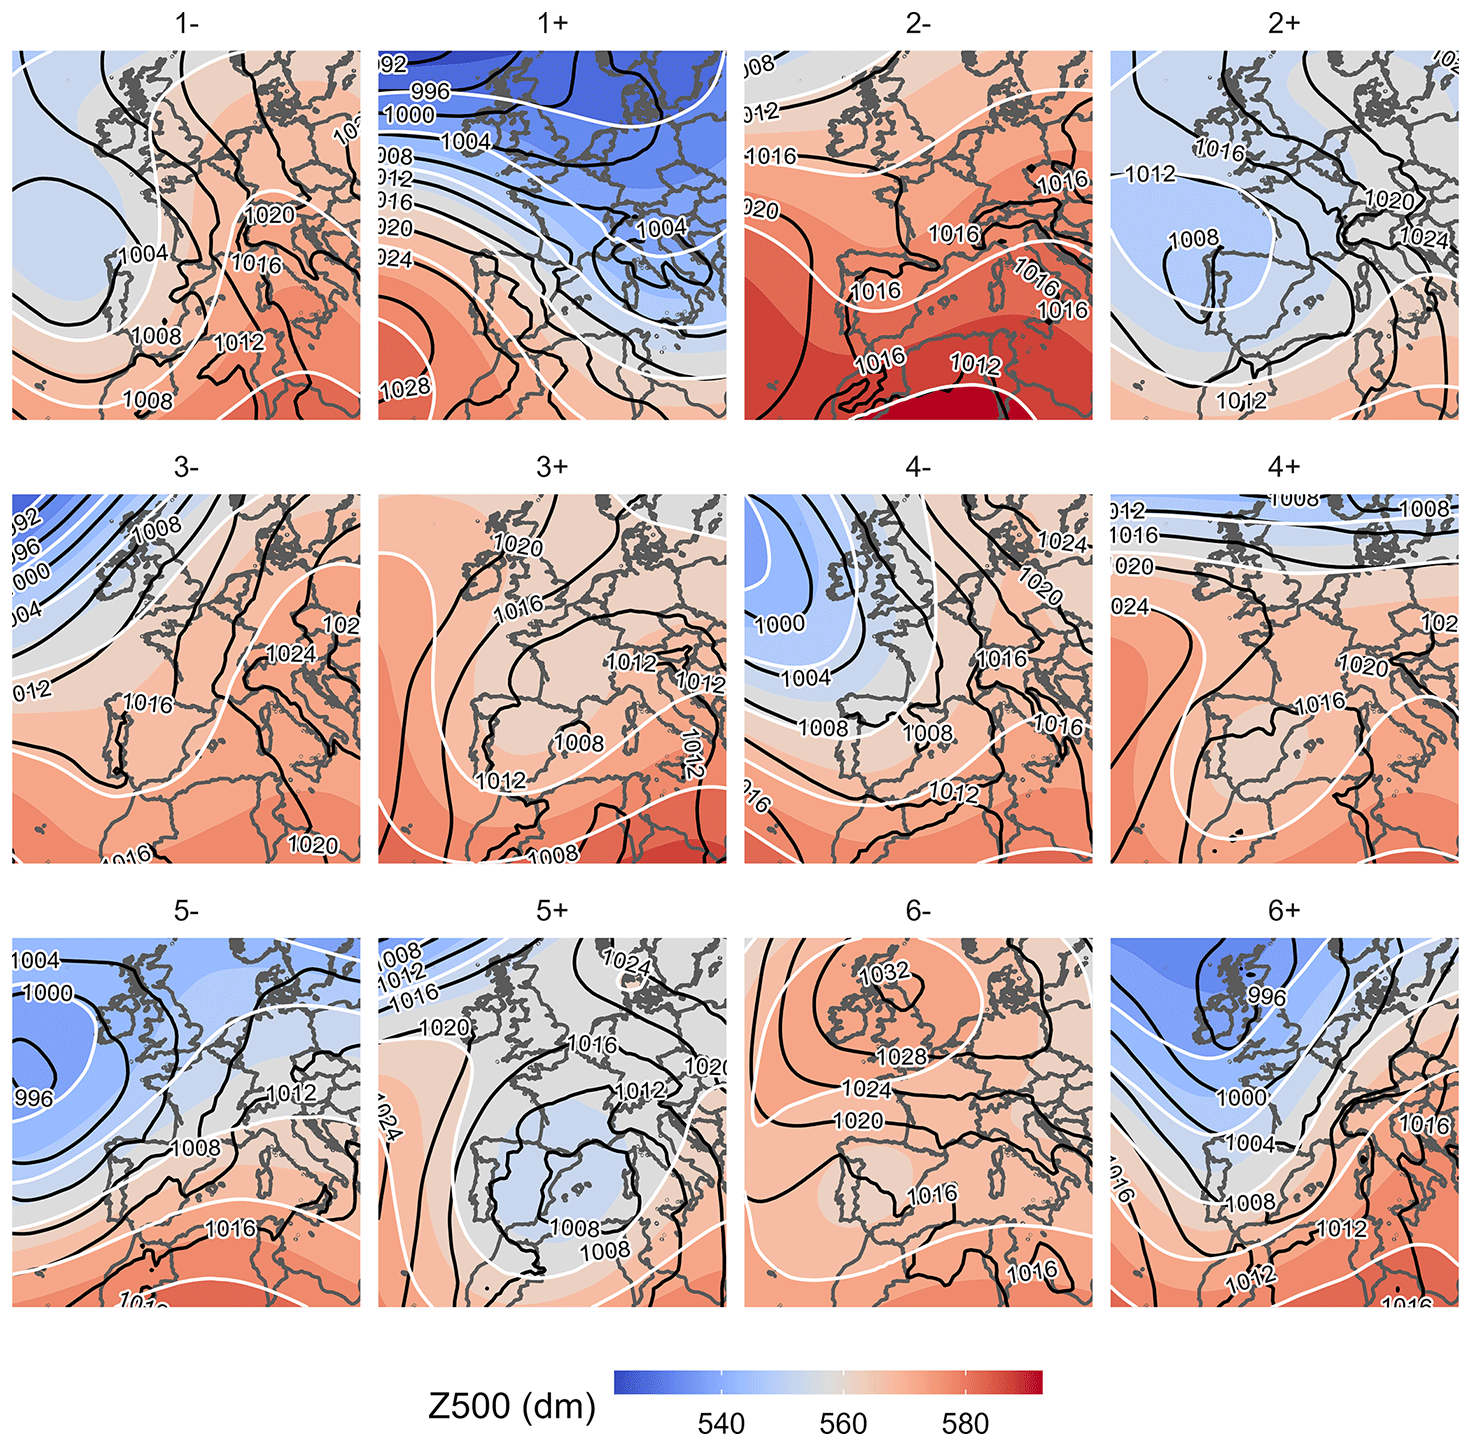
Figure 13Weather types that characterise flood episodes in the Pyrenees.
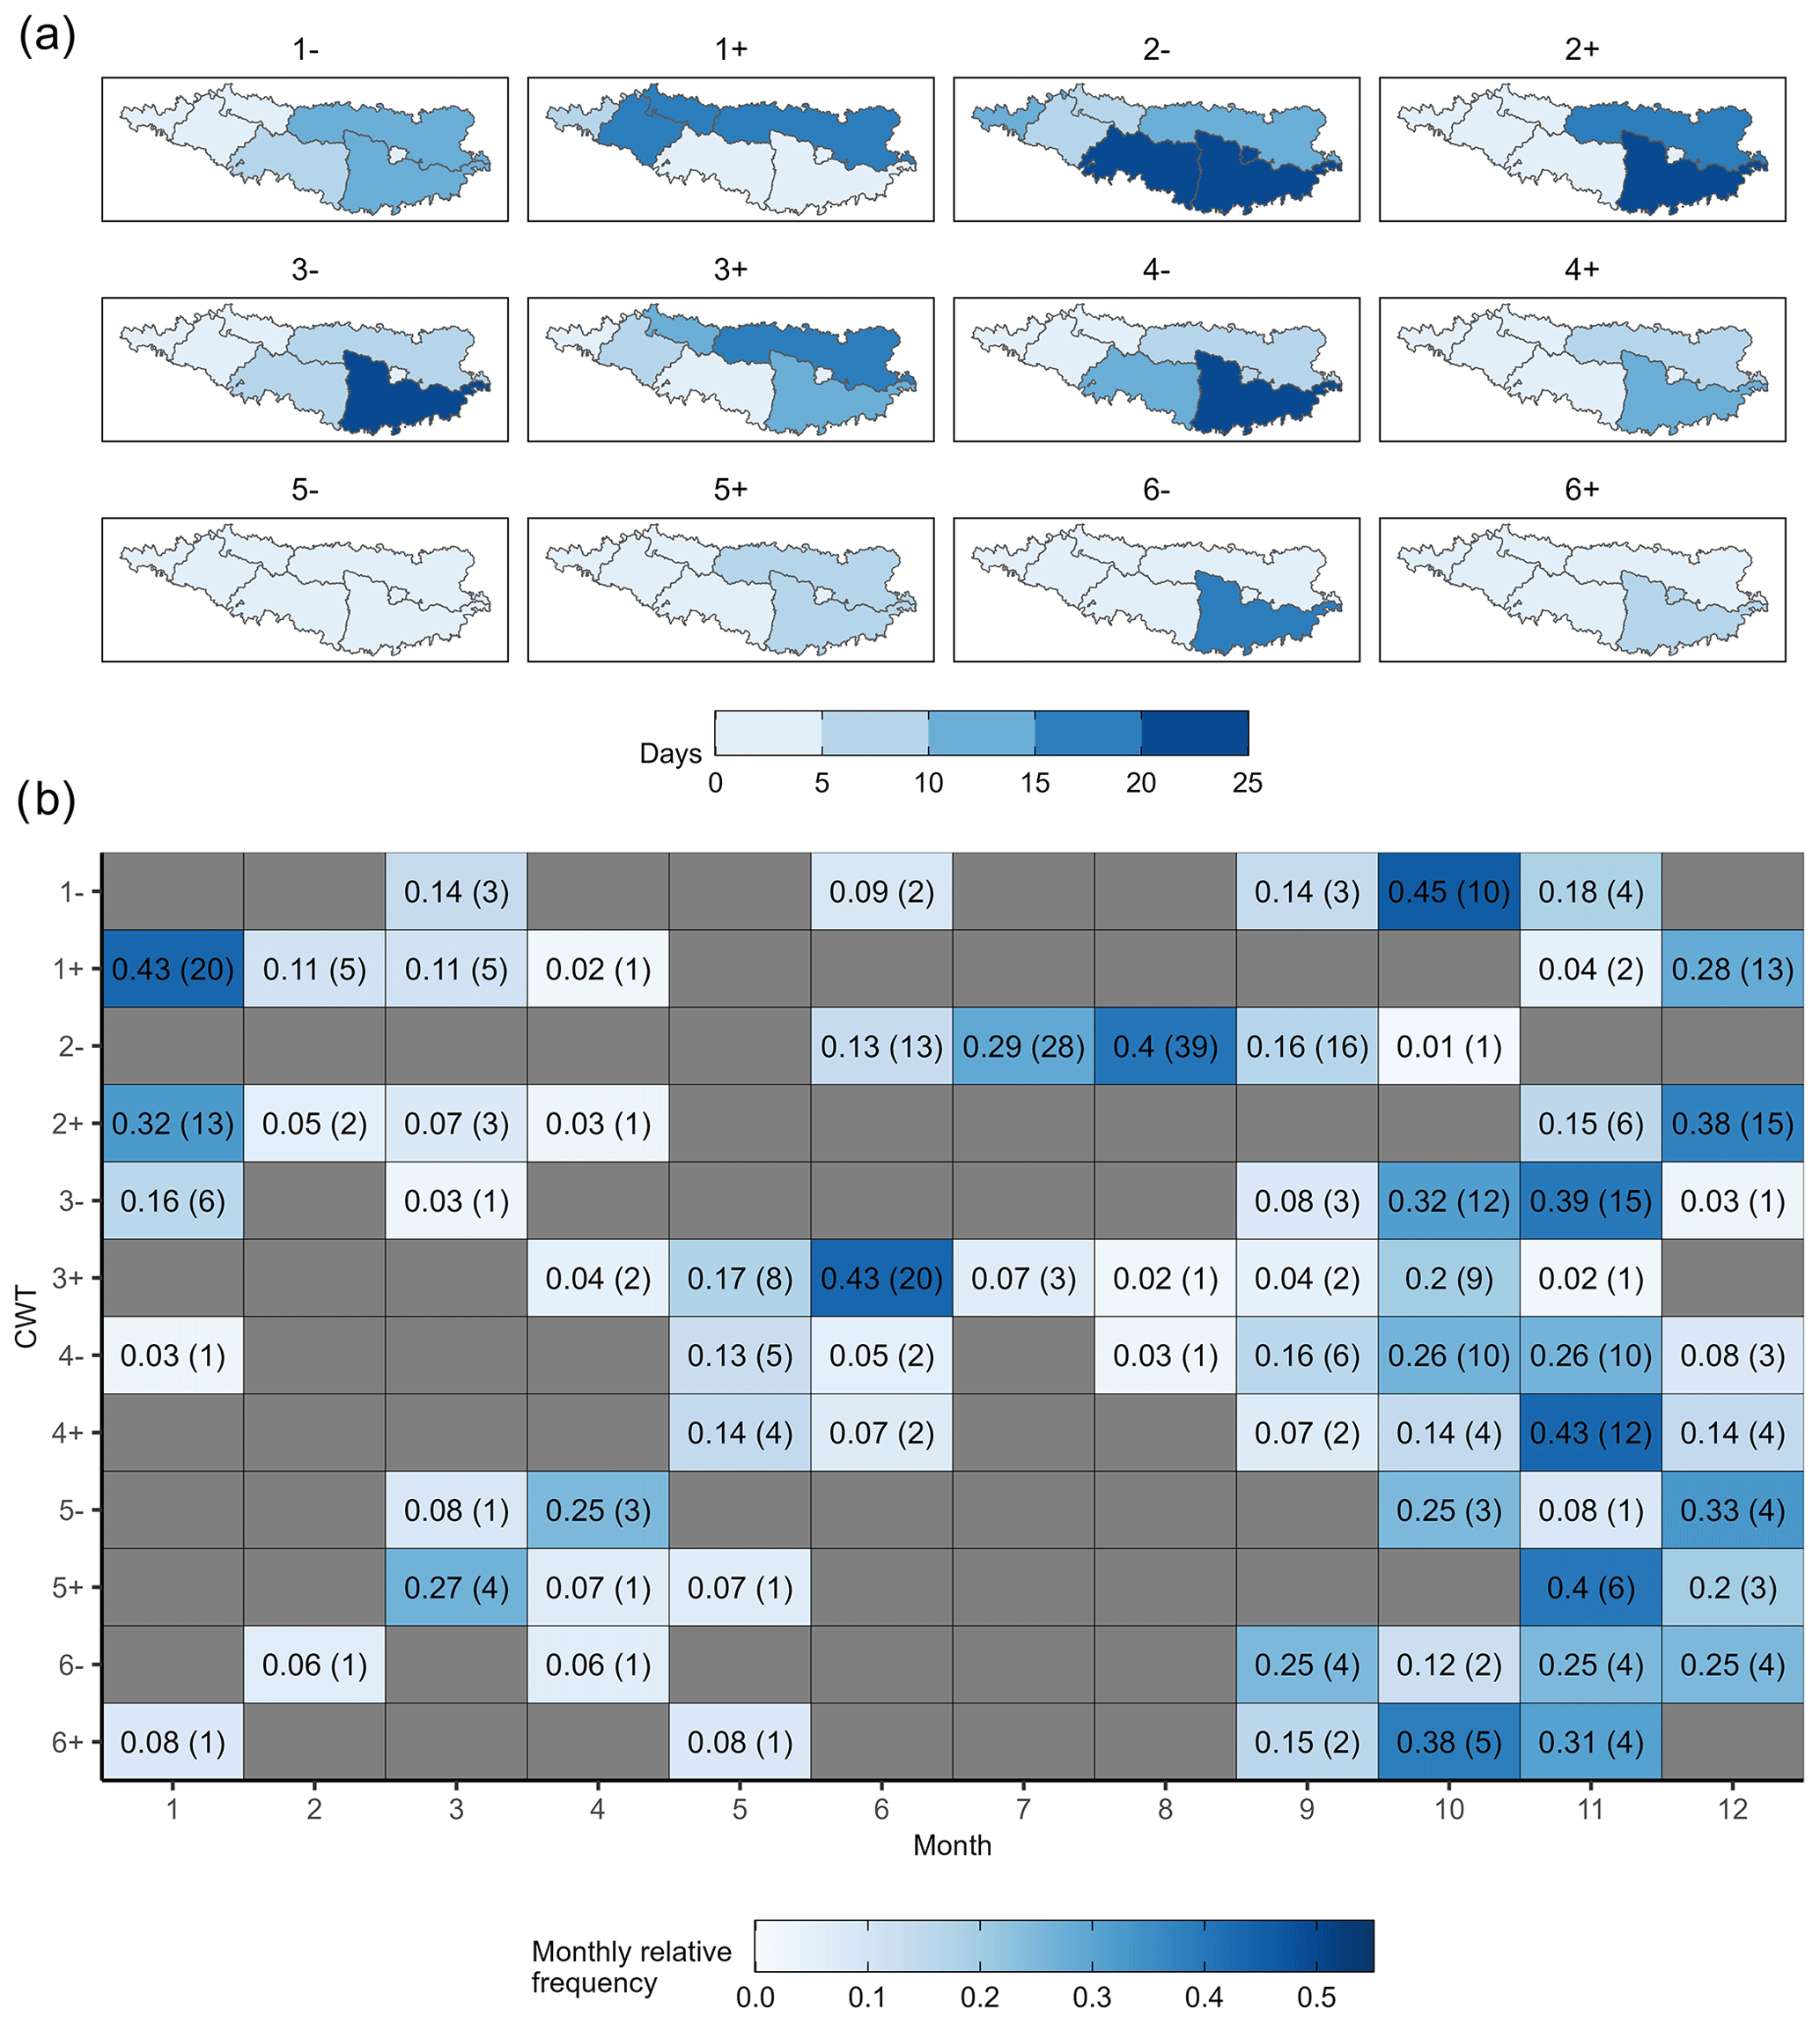
Figure 14(a) Number of flood days by weather type (WT) and Pyrenean region. (b) Monthly relative frequencies of flood days by weather type and month. Between parentheses absolute values are shown in flood days per month.
The types of weather associated with cross-border episodes depend on the time of year in which they occur. Of the eight cases recorded between June and August (Fig. 10), seven have been characterised by WT 2−. In September, types WT 2− and WT 3− dominate. In October and November, which have recorded 16 common episodes, there is no dominant type of weather, and it is even the case that unusual types appear, such as WT 4−, characterised by a deep depression to the west of the British Isles that extends up to 500 hPa and even more, with a talweg that crosses the Iberian Peninsula from northwest to southeast.
In this article, the first flood database integrating the entire Pyrenees massif and available to the public has been presented (http://hdl.handle.net/10261/270351, last access: 21 July 2024). This database, PIRAGUA_flood, includes, at a municipal scale, all flood events that have affected each of the 1803 municipalities comprising this cross-border region between 1981 and 2015, of which 609 are Spanish, 1187 are French and 7 are Andorran. Each event is characterised based on a scale that considers the impacts, providing information on these, including the number of victims, and in the Spanish case compensation paid by the Insurance Compensation Consortium. Hydrometeorological information is also included. The database has been constructed using information from press sources, official lists provided by various public agencies, scientific studies and rainfall analyses. In the case of Catalonia and Andorra, systematic daily-scale information on all types of flood events, including those with lesser impact, has been available. For other regions, it is possible that some of these minor events may have gone unnoticed. However, since this information is typically difficult to obtain from any other source, it has been decided to maintain it. Additionally, these types of floods are becoming more common due to urbanisation of the territory.
If we take into account that some events can affect more than one region, the number of events that have produced floods in the Pyrenees between 1981 and 2015 has been 181, of which 128 affected Spain, 43 affected France and 46 affected Andorra. Of these, 34 were cross-border. The November 1982 catastrophic flood event was the most extensive and affected the three countries. The other very extensive episode took place in June 2013 and affected Spain and France. The region with the greatest number of flood events has been Catalonia (66 episodes), although only 4.5 % produced catastrophic damage to the massif. Andorra follows, with a total of 46 events, of which 4.3 % were catastrophic. However, the one that records the most serious events in terms of percentage is Nouvelle-Aquitaine, since, of the 17 events recorded, 35 % were catastrophic. Note that, if the ordinary events are not taken into account, Catalonia is still the one with the most events (29), followed by Aragon (26) and Occitanie (24). It follows that the eastern part of the Pyrenees was the most affected by flood episodes, some which had catastrophic impacts.
The economic impacts are not available in France and Andorra, and in the case of Spain, only the compensation payments by the Insurance Compensation Consortium between 1996 and 2015 are known. In total, the CCS paid EUR 142.5 million (2015) for flood damage in the Spanish Pyrenees. For this period, and despite being in the third position in terms of the number of events, Navarre is the region that received the most compensation in terms of damage for events, with a total of EUR 65.8 million (2015). This high amount compared to Catalonia, which recorded more than twice as many events, is explained as Pamplona (the capital of Navarre) is within the Pyrenees region and received payments worth EUR 18 million (2015) in 2015. In this case, the risk of flooding is greater due to the high exposure, despite a moderate hazard compared to other Pyrenees regions. Something similar could take place in Catalonia on a regional and municipal scale. Although Val d'Aran was not as affected by floods as other Catalan regions, it is a very rich region, with a municipality, Vielha, to which the CCS paid more than EUR 5 million (2015) for damage caused by floods from 17–20 June 2013. The latter was the most expensive episode since 1996, with an amount worth EUR 27 million (2015) claimed in the Spanish Pyrenees. However, including the non-Pyrenees part of Aragon and Catalonia, this amount rose to EUR 31 million (2015), and in France (mainly Occitanie) it rose to EUR 240 million (2015) in insurance compensation alone (public works are considered to have exceeded this amount). The most expensive episode in Spain since 1981, however, if we take into account all of the autonomous communities affected, was 25–28 August 1983, which resulted in a total of EUR 2.9 billion (2015) in compensation paid out in the Basque Country, Navarre and Cantabria. This high amount is a consequence of the serious damage suffered in the Basque Country, mainly in industrial areas.
The number of victims is closely linked to specific cases, such as the floods of August 1996 in Biescas and the flooding of November 1982, in which the majority of the deceased were swept away by water in their home or summer residence. The Biescas case is an example where all components contributing to the risk were high. It involved a camping site located in a debris cone at the foot of a dam in an area prone to storms (high hazard), with numerous people (high exposure) who took shelter in tents or trailers, and there was no early warning system (high vulnerability). Apart from these cases, fatalities are normally people who tried to cross a river, usually in a vehicle, or people doing adventure sports. The total number of victims in the Spanish Pyrenees was 121, with 13 in Andorra and 20 in the French Pyrenees.
The flood season starts in May in the Atlantic region and progresses to reach a maximum in autumn in the Mediterranean regions. Catalonia, Aragon, Navarre and Occitanie all share the month of October among the months that record the highest number of events. The Basque Country and Nouvelle-Aquitaine share the month of June in common, while in Andorra is summer. If we only take into account events that caused notable damage (extraordinary and catastrophic episodes according to the nomenclature agreed here), a positive trend can be observed across the entire massif of 0.5 events per decade, although it is not significant. However, if the ordinary episodes are included, the trend becomes 0.84 events per decade, and it is significant at 90 %. When analysing in terms of communities, Nouvelle-Aquitaine is the only region with a significant positive trend at 95 % (0.34 events per decade). This positive trend in Nouvelle-Aquitaine cannot be justified by the trend in the 90th percentile discharge, nor the lower percentiles, as shown in the study by Clavera-Gispert et al. (2023). To attribute this trend accurately, it would be necessary to conduct a study on more extreme discharge events and land use to associate it with an increase in vulnerability, exposure, or hazard. On average, projections also do not indicate an increase in intense precipitation in the Pyrenees (Amblar-Francés et al., 2020), but a recent study (Poncet et al., 2024) including the Mediterranean part of Occitanie shows that the magnitude of the most intense floods will intensify.
From the classification of weather types, it can be concluded that most are dominated by southern component flow over the Pyrenees region, with a talweg on the Iberian Peninsula. There is a frequent depression in the vicinity, either in the Atlantic or in the Mediterranean, which is in line with the studies carried out on intense rains in the Mediterranean region (according to the IPCC classification (2022), the Pyrenees massif would be included in the region) (Jansa et al., 2014). This type of configuration favours vorticity advection at the medium and upper part of the troposphere and the consequent instability at low levels, the advection of warm and humid air, and, occasionally, the contribution of humidity from remote sources. No specific weather type is observed for cross-border episodes.
This study also has an important social objective. The aim is to make the population living in the Pyrenees and who practise hiking or any other mountain sport aware that floods are also very important in this region and cause serious damage and even fatalities. As has been shown in this paper, many flood episodes are transnational, which calls for cooperation in the prevention and mitigation of flood risk between regions and countries. This is more relevant considering the United Nations call for an “Early Warning for All” to ensure that everyone on Earth is protected from natural hazards, including flood events through life-saving early warning systems by the end of 2027. Furthermore, in Europe there is a strong collaboration framework, thanks to the ESA Copernicus observation programme, MeteoAlarm from EUMETNET (European Network of National Meteorological Services) and Euromed regional Programme for Prevention, Preparedness and Response to Natural and Man-made Disasters (PPRD), in which all European civil protection agencies participate. However, to achieve the full potential of these efforts, it is important to enhance their implementation in specific cross-border areas, such as the Pyrenees. The Life PYRENEES4CLIMA Project (https://www.pirineos-pyrenees.eu/en/pyrenees4clima-projet-life/, last access: 12 September 2024) is designed to meet this challenge.
The dataset of flood episodes in the Pyrenees massif shown and analysed in this paper is available at https://doi.org/10.20350/digitalCSIC/14650 (Llasat et al., 2022).
MCL contributed with the funding acquisition and the conceptualisation of the study, conducted the research and prepared the manuscript with contributions from all co-authors, including the revised versions. MLB was responsible of data curation. RMM and MLC did the formal analysis and software. EP was responsible of the map visualisation.
At least one of the (co-)authors is a member of the editorial board of Natural Hazards and Earth System Sciences. The peer-review process was guided by an independent editor, and the authors also have no other competing interests to declare.
Publisher's note: Copernicus Publications remains neutral with regard to jurisdictional claims made in the text, published maps, institutional affiliations, or any other geographical representation in this paper. While Copernicus Publications makes every effort to include appropriate place names, the final responsibility lies with the authors.
We acknowledge the Work Community of the Pyrenees (CTP) and the Pyrenean Observatory of Climate Change (OPCC) for their support. Raül Marcos-Matamoros has been supported by the Serra Húnter Programme of the Generalitat de Catalunya. Many thanks go to all the PIRAGUA partners who provided us with data, especially Iñaki Antigüedad for the information on the Basque Country and Navarre and Oriol Travesset for the information on Andorra. We also acknowledge Pere Quintana for the SAFRAN rainfall data.
This research has been supported by Interreg (grant no. EFA210/16), international cooperation project PIRAGUA and the projects funded by the Spanish Ministry of Science and Innovation, C3RiskMed (grant nos. PID2020-113638RB-C22 and AEI/10.13039/501100011033) and Flood2Now (Improvement of early warning systems for flood risk with past information and citizen data; PLEC2022-009403, MCIN/AEI/10.13039/501100011033) and by the European Union NextGenerationEU/PRTR.
This paper was edited by Paolo Tarolli and reviewed by two anonymous referees.
Amblar-Francés, M. P., Ramos-Calzado, P., Sanchis-Lladó, J., Hernanz-Lázaro, A., Peral-García, M. C., Navascués, B., Dominguez-Alonso, M., Pastor-Saavedra, M. A., and Rodríguez-Camino, E.: High resolution climate change projections for the Pyrenees region, Adv. Sci. Res., 17, 191–208, https://doi.org/10.5194/asr-17-191-2020, 2020.
Ayala Carcedo, F. J.: La inundación torrencial catastrófica del camping Las Nieves del 7 de agosto de 1996 en el cono de deyección del Arás (Biescas Pirineo Aragonés), in: Riesgos Naturales, coordinated by: Ayala Carcedo, F. J. and Olcina Cantos, J., Ariel, Barcelona, Spain, ISBN 84-344-8034-4, 889–912, 2002.
Barrera-Escoda, A. and Llasat, M. C.: Evolving flood patterns in a Mediterranean region (1301–2012) and climatic factors – the case of Catalonia, Hydrol. Earth Syst. Sci., 19, 465–483, https://doi.org/10.5194/hess-19-465-2015, 2015.
Barnolas, M. and Llasat, M. C.: A flood geodatabase and its climatological applications: the case of Catalonia for the last century, Nat. Hazards Earth Syst. Sci., 7, 271–281, https://doi.org/10.5194/nhess-7-271-2007, 2007.
Barriendos, M., Coeur, D., Lang, M., Llasat, M. C., Naulet, R., Lemaitre, F., and Barrera, A.: Stationarity analysis of historical flood series in France and Spain (14th–20th centuries), Nat. Hazards Earth Syst. Sci., 3, 583–592, https://doi.org/10.5194/nhess-3-583-2003, 2003.
Barriendos, M., Gil-Guirado, S., Pino, D., Tuset, J., Pérez-Morales, A., Alberola, A., Costa, J., Balasch, J. C., Castelltort, X., Mazón, J., and Ruiz-Bellet, J. L.: Climatic and social factors behind the Spanish Mediterranean flood event chronologies from documentary sources (14th–20th centuries), Global Planet. Change, 182, 102997, https://doi.org/10.1016/j.gloplacha.2019.102997, 2019.
Beguería, S. (Coord.): Caracterización de los recursos hídricos de los Pirineos en la actualidad, y escenarios futuros. Memorias científicas del proyecto PIRAGUA, vol. 1, Estación Experimental de Aula Dei, Consejo Superior de Investigaciones Científicas (EEADCSIC), Zaragoza, España, 124, https://doi.org/10.20350/digitalCSIC/14683, 2023a.
Beguería, S. (Ed.): Adaptación al cambio climático en la gestión de los recursos hídricos de los Pirineos. Memorias científicas del proyecto PIRAGUA, vol. 2, Estación Experimental de Aula Dei, Consejo Superior de Investigaciones Científicas (EEADCSIC), Zaragoza, España, 220 pp., https://doi.org/10.20350/digitalCSIC/14684, 2023b.
Beniston, M.: Climatic change in mountain regions: a review of possible impacts, Climatic Change, 59, 5–31, https://doi.org/10.1023/A:1024458411589, 2003.
Beniston, M. and Stoffel, M.: Assessing the impacts of climatic change on mountain water resources, Sci. Total Environ., 493, 1129–1137, https://doi.org/10.1016/j.scitotenv.2013.11.122, 2014.
Boudou, M., Lang, M., Vinet, F., and Cœur, D.: Comparative hazard analysis of processes leading to remarkable flash floods (France, 1930–1999), J. Hydrol., 541, 533–552, https://doi.org/10.1016/j.jhydrol.2016.05.032, 2016.
Braud, I., Roux, H., Anquetin, S., Maubourguet, M. M., Manus, C., Viallet, P., and Dartus, D.: The use of distributed hydrological models for the Gard 2002 flash flood event: analysis of associated hydrological processes, J. Hydrol., 394, 162–181, 2010.
Braud, I., Ayral, P.-A., Bouvier, C., Branger, F., Delrieu, G., Le Coz, J., Nord, G., Vandervaere, J.-P., Anquetin, S., Adamovic, M., Andrieu, J., Batiot, C., Boudevillain, B., Brunet, P., Carreau, J., Confoland, A., Didon-Lescot, J.-F., Domergue, J.-M., Douvinet, J., Dramais, G., Freydier, R., Gérard, S., Huza, J., Leblois, E., Le Bourgeois, O., Le Boursicaud, R., Marchand, P., Martin, P., Nottale, L., Patris, N., Renard, B., Seidel, J.-L., Taupin, J.-D., Vannier, O., Vincendon, B., and Wijbrans, A.: Multi-scale hydrometeorological observation and modelling for flash flood understanding, Hydrol. Earth Syst. Sci., 18, 3733–3761, https://doi.org/10.5194/hess-18-3733-2014, 2014.
Cattell, R. B.: The scree test for the number of factors, Multivar. Behav. Res., 1, 245–276, 1966.
CCS (Consorcio de Compensación de Seguros): Estadística riesgos extraordinarios, Serie 1971–2020, https://www.consorseguros.es/web/documents/10184/44193/Estadistica_Riesgos_Extraordinarios_1971_2014/14ca6778-2081-4060-a86d-728d9a17c522 (last access: 1 October 2022), 2021.
Clavera-Gispert, R., Quintana-Seguí, P., Palazón, L., Zabaleta, A., Cenobio, O., Barella-Ortiz, A., and Beguería, S.: Streamflow trends of the Pyrenees using observations and multi-model approach (1980–2013). Journal of Hydrology-Regional Studies, 46, 101322, https://doi.org/10.1016/j.ejrh.2023.101322, 2023.
Confederación Hidrográfica del Cantábrico (CHC) and Agencia Vasca del Agua (URA): Parte española de la Demarcación Hidrográfica del Cantábrico Oriental, Revisión y actualización de la evaluación preliminar del riesgo de inundación (EPRI), 2° ciclo, Anexo 1: Registro de eventos de inundación, https://www.chcantabrico.es/documents/20143/299434/epri_2ciclo_dhc_ori_anexo1_registro_inundaciones.pdf/a6203b3d-e2ca-58e9-f148-ca0be5eb063f (last access: 17 February 2023), 2018.
Cortès, M., Llasat, M. C., Gilabert, J., Llasat-Botija, M., Turco, M., Marcos, R., Martín Vide, J. P., and Falcón, Ll.: Towards a better understanding of the evolution of the flood risk in Mediterranean urban areas: the case of Barcelona, Nat. Hazards, https://doi.org/10.1007/s11069-017-3014-0, 2017.
Cortès, M., Turco, M., Ward, P., Sánchez-Espigares, J. A., Alfieri, L., and Llasat, M. C.: Changes in flood damage with global warming on the eastern coast of Spain, Nat. Hazards Earth Syst. Sci., 19, 2855–2877, https://doi.org/10.5194/nhess-19-2855-2019, 2019.
DGPC (Dirección General de Protección Civil): Catálogo Nacional de Inundaciones Históricas, , http://www.proteccioncivil.es/ (last access: 1 October 2022), 2022.
García Ruiz, J. M., White, S. M., Martí, C., Valero, B., Errea, M. P., and Gómez Villar, A.: La catástrofe del barranco de Arás (Biescas, Pirineo Aragonés) y su contexto espacio-temporal, IPE-CSIC, Zaragoza, España, ISBN 84-921 842-1-3, 1996.
Gaume, E., Bain, V., Bernardara, P., Newinger, O., Barbuc, M., Bateman, A., Blaškovičová, L., Blösch, G., Borga, M., and Dumitrescu, A.: A compilation of data on European flash floods, J. Hydrol., 367, 70–78, https://doi.org/10.1016/j.jhydrol.2008.12.028, 2009.
Gil-Guirado, S., Pérez-Morales, A., and Lopez-Martinez, F.: SMC-Flood database: a high-resolution press database on flood cases for the Spanish Mediterranean coast (1960–2015), Nat. Hazards Earth Syst. Sci., 19, 1955–1971, https://doi.org/10.5194/nhess-19-1955-2019, 2019.
Hersbach, H., Bell, B., Berrisford, P., Hirahara, S., Horányi, A., Muñoz-Sabater, J., Nicolas, J., Peubey, C., Radu, R., Schepers, D., Simmons, A., Soci, C., Abdalla, S., Abellan, X., Balsamo, G., Bechtold, P., Biavati, G., Bidlot, J., Bonavita, M., De Chiara, G., Dahlgren, P., Dee, D., Diamantakis, M., Dragani, R., Flemming, J., Forbes, R., Fuentes, M., Geer, A., Haimberger, L., Healy, S., Hogan, R. J., Hólm, E., Janisková, M., Keeley, S., Laloyaux, P., Lopez, P., Lupu, C., Radnoti, G., de Rosnay, P., Rozum, I., Vamborg, F., Villaume, S., and Thépaut, J.-N.: The ERA5 global reanalysis, Q. J. Roy. Meteor. Soc., 146, 1999–2049, 2020.
Insua-Costa, D., Miguez-Macho, G., and Llasat, M. C.: Local and remote moisture sources for extreme precipitation: a study of the two catastrophic 1982 western Mediterranean episodes, Hydrol. Earth Syst. Sci., 23, 3885–3900, https://doi.org/10.5194/hess-23-3885-2019, 2019.
Insua-Costa, D., Senande-Rivera, M., Llasat, M. C., and Miguez-Macho, G.: A global perspective on western Mediterranean precipitation extremes, npj Clim. Atmos. Sci., 5, 9, https://doi.org/10.1038/s41612-022-00234-w, 2022.
IPCC: Climate Change 2022: Impacts, Adaptation, and Vulnerability. Contribution of Working Group II to the Sixth Assessment Report of the Intergovernmental Panel on Climate Change, edited by: Pörtner, H.-O., Roberts, D. C., Tignor, M., Poloczanska, E. S., Mintenbeck, K., Alegría, A., Craig, M., Langsdorf, S., Löschke, S., Möller, V., Okem, A., and Rama, B., Cambridge University Press, Cambridge, UK and New York, NY, USA, 3056 pp., https://doi.org/10.1017/9781009325844, 2022.
Jansa, A., Alpert, P., Arbogast, P., Buzzi, A., Ivancan-Picek, B., Kotroni, V., Llasat, M. C., Ramis, C., Richard, E., Romero, R., and Speranza, A.: MEDEX: a general overview, Nat. Hazards Earth Syst. Sci., 14, 1965–1984, https://doi.org/10.5194/nhess-14-1965-2014, 2014.
Kendall, M. G.: Rank Correlation Measures, Charles Griffin, London, ISBN 9780852641996, 1975.
Lemus-Canovas, M., Lopez-Bustins, J. A., Martin-Vide, J., and Royé, D.: synoptReg: An R package for computing a synoptic climate classification and a spatial regionalization of environmental data, Environ. Modell. Softw., 118, 114–119, 2019a.
Lemus-Canovas, M., Lopez-Bustins, J. A., Trapero, L., and Martin-Vide, J.: Combining circulation weather types and daily precipitation modelling to derive climatic precipitation regions in the Pyrenees, Atmos. Res., 220, 181–193, 2019b.
Lemus‐Canovas, M., Ninyerola, M., Lopez‐Bustins, J. A., Manguan, S., and Garcia‐Sellés, C.: A mixed application of an objective synoptic classification and spatial regression models for deriving winter precipitation regimes in the Eastern Pyrenees, Int. J. Climatol., 39, 2244–2259, https://doi.org/10.1002/joc.5948, 2019c.
Lemus-Canovas, M., Lopez-Bustins, J. A., Martín-Vide, J., Halifa-Marin, A., Insua-Costa, D., Martinez-Artigas, J., Trapero, L., Serrano-Notivoli, R., and Cuadrat, J. M.: Characterisation of extreme precipitation events in the Pyrenees: From the local to the synoptic scale, Atmosphere, 12, 665, https://doi.org/10.3390/atmos12060665, 2021.
Llasat, M. C.: Episodios de lluvias copiosas en Cataluña: génesis, evolución y factores coadyuvantes, Tesis Doctoral, Publicacions de la Universitat de Barcelona, Barcelona, Spain, 2, 448 pp., ISBN 9788469333365, 1987.
Llasat, M. C.: An objective classification of rainfall events on the basis of their convective features. Application to rainfall intensity in the north-east of Spain, Int. J. Climatol., 21, 1385–1400, 2001.
Llasat, M. C.: Chapter 18: Storms and floods. In The Physical Geography of the Mediterranean basin. Edited by Jamie Woodward, Oxford University Press, Oxford, United Kingdom, 504–531, ISBN 978-0-19-926803-0, 2009.
Llasat, M. C., M. Llasat-Botija, O. Petrucci, A. A. Pasqua, J. Rosselló, F.Vinet, and L. Boissier: Floods in the North-Western Meditrerranean Region: presentation of the HYMEX database and comparison with pre-existing global databases, Houille Blanche, 1, 5–9, https://doi.org/10.1051/lhb/2013001, 2013a.
Llasat, M. C., Llasat-Botija, M., Petrucci, O., Pasqua, A. A., Rosselló, J., Vinet, F., and Boissier, L.: Towards a database on societal impact of Mediterranean floods within the framework of the HYMEX project, Nat. Hazards Earth Syst. Sci., 13, 1337–1350, https://doi.org/10.5194/nhess-13-1337-2013, 2013b.
Llasat, M. C., Marcos, R., Llasat-Botija, M., Gilabert, J., Turco, M., and Quintana-Seguí, P.: Flash flood evolution in North-Western Mediterranean, Atmos. Res., 149, 230–243, https://doi.org/10.1016/j.atmosres.2014.05.024, 2014.
Llasat, M. C., Marcos, R., Turco, M., Gilabert J., and Llasat-Botija, M.: Trends in flash flood events versus convective precipitation in the Mediterranean region: The case of Catalonia, J. Hydrol., 541, 24–37, https://doi.org/10.1016/j.jhydrol.2016.05.040, 2016.
Llasat, M. C., Llasat-Botija, M., Petrucci, O., Pasqua, A. A., Rossello, J., Papagiannaki, K., Kotroni, V., Lagouvardos, K., and Vinet, F.: FloodHYMEX, MISTRALS Catalogue [data set], https://mistrals.sedoo.fr/catalogue/?uuid=8bfd637b-4cd1-1cd9-9579-59ec59035d8d (last access: 21 July 2024), 2020.
Llasat, M. C., del Moral, A., Cortès, M., and Rigo, T.: Convective precipitation trends in the Spanish Mediterranean region, Atmos. Res., 257, 105581, https://doi.org/10.1016/j.atmosres.2021.105581, 2021.
Llasat, M. C., Pardo, E., and Llasat-Botija, M.: PIRAGUA_flood, Estación Experimental de Aula Dei, Consejo Superior de Investigaciones Científicas (EEAD-CSIC) [data set], https://doi.org/10.20350/digitalCSIC/14650, 2022.
Mann, H. B.: Nonparametric tests against trend, Econometrica, 13, 245–259, 1945.
Martin-Vide, J., Sanchez-Lorenzo, A., Lopez-Bustins, J. A., Cordobilla, M. J., Garcia-Manuel, A., and Raso, J. M.: Torrential rainfall in northeast of the Iberian Peninsula: synoptic patterns and WeMO influence, Adv. Sci. Res., 2, 99–105, 2008.
Miró, J. J., Lemus-Canovas, M., Serrano-Notivoli, R., Olcina Cantos, J., Estrela, M. J., Martin-Vide, J., Sarricolea, P., and Meseguer-Ruiz, O.: A component-based approximation for trend detection of intense rainfall in the Spanish Mediterranean coast, Weather Clim. Extremes, 38, 100513, https://doi.org/10.1002/qj.3803, 2022.
Petrucci, O.: Brief communication “The assessment of damage caused by historical landslide events”, Nat. Hazards Earth Syst. Sci., 13, 755–761, https://doi.org/10.5194/nhess-13-755-2013, 2013.
Poncet, N., Lucas-Picher, P., Tramblay, Y., Thirel, G., Vergara, H., Gourley, J., and Alias, A.: Does a convection-permitting regional climate model bring new perspectives on the projection of Mediterranean floods?, Nat. Hazards Earth Syst. Sci., 24, 1163–1183, https://doi.org/10.5194/nhess-24-1163-2024, 2024.
Quintana-Seguí, P., Peral, C., Turco, M., Llasat, M. C., and Martin, E.: Meteorological Analysis Systems in North-East Spain: Validation of SAFRAN and SPAN, J. Environ. Inform., 27, 116–130, https://doi.org/10.3808/jei.201600335, 2016.
Richman, M. B.: Rotation of principal components, J. Climatol., 6, 293–335, 1986.
Rodríguez, O. and Lemus-Canovas, M.: Synoptic patterns triggering tornadic storms on the Iberian Peninsula and the Balearic Islands, Atmos. Res., 285, 106634, https://doi.org/10.1016/j.atmosres.2023.106634, 2023.
Serrano-Notivoli, R., Lemus-Canovas, M., Barrao, S., Sarricolea, P., Meseguer-Ruiz, O., and Tejedor, E.: Heat and cold waves in mainland Spain: Origins, characteristics, and trends, Weather Clim. Extremes, 37, 100471, https://doi.org/10.1016/j.wace.2022.100471, 2022.
Steiger, R., Knowles, N., Pöll, K., and Rutty, M.: Impacts of climate change on mountain tourism: A review, J. Sust. Tour., 32, 1984–2017, https://doi.org/10.1080/09669582.2022.2112204, 2022.
Trapero, L., Bech, J., Duffourg, F., Esteban, P., and Lorente, J.: Mesoscale numerical analysis of the historical November 1982 heavy precipitation event over Andorra (Eastern Pyrenees), Nat. Hazards Earth Syst. Sci., 13, 2969–2990, https://doi.org/10.5194/nhess-13-2969-2013, 2013.
Vinet, F., Bigot, V., Petrucci, O., Papagiannaki, K., Llasat, M. C., Kotroni, V., Boissier, L., Aceto, L., Grimalt, M., Llasat-Botija, M., Pasqua, A. A., Rossello, J., Kılıç, Ö., Kahraman, A., and Tramblay, Y.: Mapping flood-related mortality in the mediterranean basin. Results from the MEFF v2.0 DB, Water-Switzerland, 11, 2196, https://doi.org/10.3390/w11102196, 2016.
Wirtz, A., Kron, W., Löw, P., and Steuer, M.: The need for data: Natural disasters and the challenges of database management, Nat. Hazards, 70, 135–157, https://doi.org/10.1007/s11069-012-0312-4, 2014.
Zimmermann, M. and Keiler, M.: International frameworks for disaster risk reduction: useful guidance for sustainable mountain development?, Mt. Res. Dev., 35, 195–202, https://doi.org/10.1659/MRD-JOURNAL-D-15-00006.1, 2015.
- Abstract
- Introduction
- Area of study and sources of information
- Database structure and methodology
- Regional distribution of flood events and impacts
- Temporal analysis
- Cross-border flood episodes
- Weather types
- Discussion and conclusions
- Data availability
- Author contributions
- Competing interests
- Disclaimer
- Acknowledgements
- Financial support
- Review statement
- References