the Creative Commons Attribution 4.0 License.
the Creative Commons Attribution 4.0 License.
 | 26 Sep 2024
Tsunami inundation and vulnerability analysis on the Makran coast, Pakistan
Rashid Haider
Sajid Ali
Gösta Hoffmann
Klaus Reicherter
The coastal cities of Gwadar and Pasni, situated along the Arabian Sea in the northwestern region of the Indian Ocean, are subjected to thorough investigation for inundation and vulnerability analysis. The estimation of maximum tsunami wave potential in the Arabian Sea involves evaluating paleomorphodynamic records of tsunamites found along its coastlines, with a focus on the most severe case for modeling to determine the maximum wave potential. Subsequently, based on this assessment, three distinct wave scenarios (7, 10, and 15 m) are projected onto Pasni and Gwadar and their surrounding coastal areas. The results reveal the high vulnerability of both cities to wave heights ≥7 m and wavelengths ≥15 km, with the 15 m scenario posing a near-complete disaster for both cities and adjoining towns. Furthermore, simulation results demonstrate that the coastal orientation and morphology contribute to the devastating impact of reflection, integration, and amplification phenomena in the region, with their intensity escalating with larger approaching waveforms. The reflection-amplification phenomenon notably and variably impacts inundation extents and depths. The installed tsunami early warning system's effectiveness is also evaluated based on the modeling and simulated results and the recent practices of early warning alerts issued.
- Article
(7672 KB) - Full-text XML
-
Supplement
(438 KB) - BibTeX
- EndNote


Tsunamis are rare events but have high damage potential for coastal communities. Over the past 27 years, 64 tsunamis with a run-up higher than 3 m have been documented globally (Tarbotton et al., 2015). In the most recent 2 decades, there has been a substantial advancement in the understanding of tsunami generation, propagation, and inundation. This progress has enabled planners, administrators, and engineers to calibrate building design codes to mitigate disaster risk (Park et al., 2013; Macintosh, 2013). In this context, inundation analysis plays a crucial role in vulnerability and risk assessment. The assessment involves integrating infrastructure fragility curves (damage probability curves) with various tsunami flow magnitudes (Rehman and Cho, 2016). These fragility curves are generated using various techniques based on deterministic and probabilistic approaches, while tsunami flow magnitude is determined by calculating flow depth and flow velocity through dynamic inundation modeling.
In this paper, two aspects have been investigated: primarily the inundation analysis and secondarily a vulnerability estimation for the coastal cities of Pasni and Gwadar and surrounding areas. These cities were severely affected by the 1945 earthquake-entailing (Mw 8.1) tsunami (∼12 m at Pasni) which resulted in hundreds of casualties (Pendse, 1946; Hoffmann et al., 2013b). In 2013, a small tsunami (<1 m) associated with an earthquake (Mw 7.7) struck the same area once more but caused no damage (Heidarzadeh and Satake, 2014). Both cities had grown many times over as compared to their size in 1945, and in the event of a similar disaster, substantial loss of life and property is anticipated.
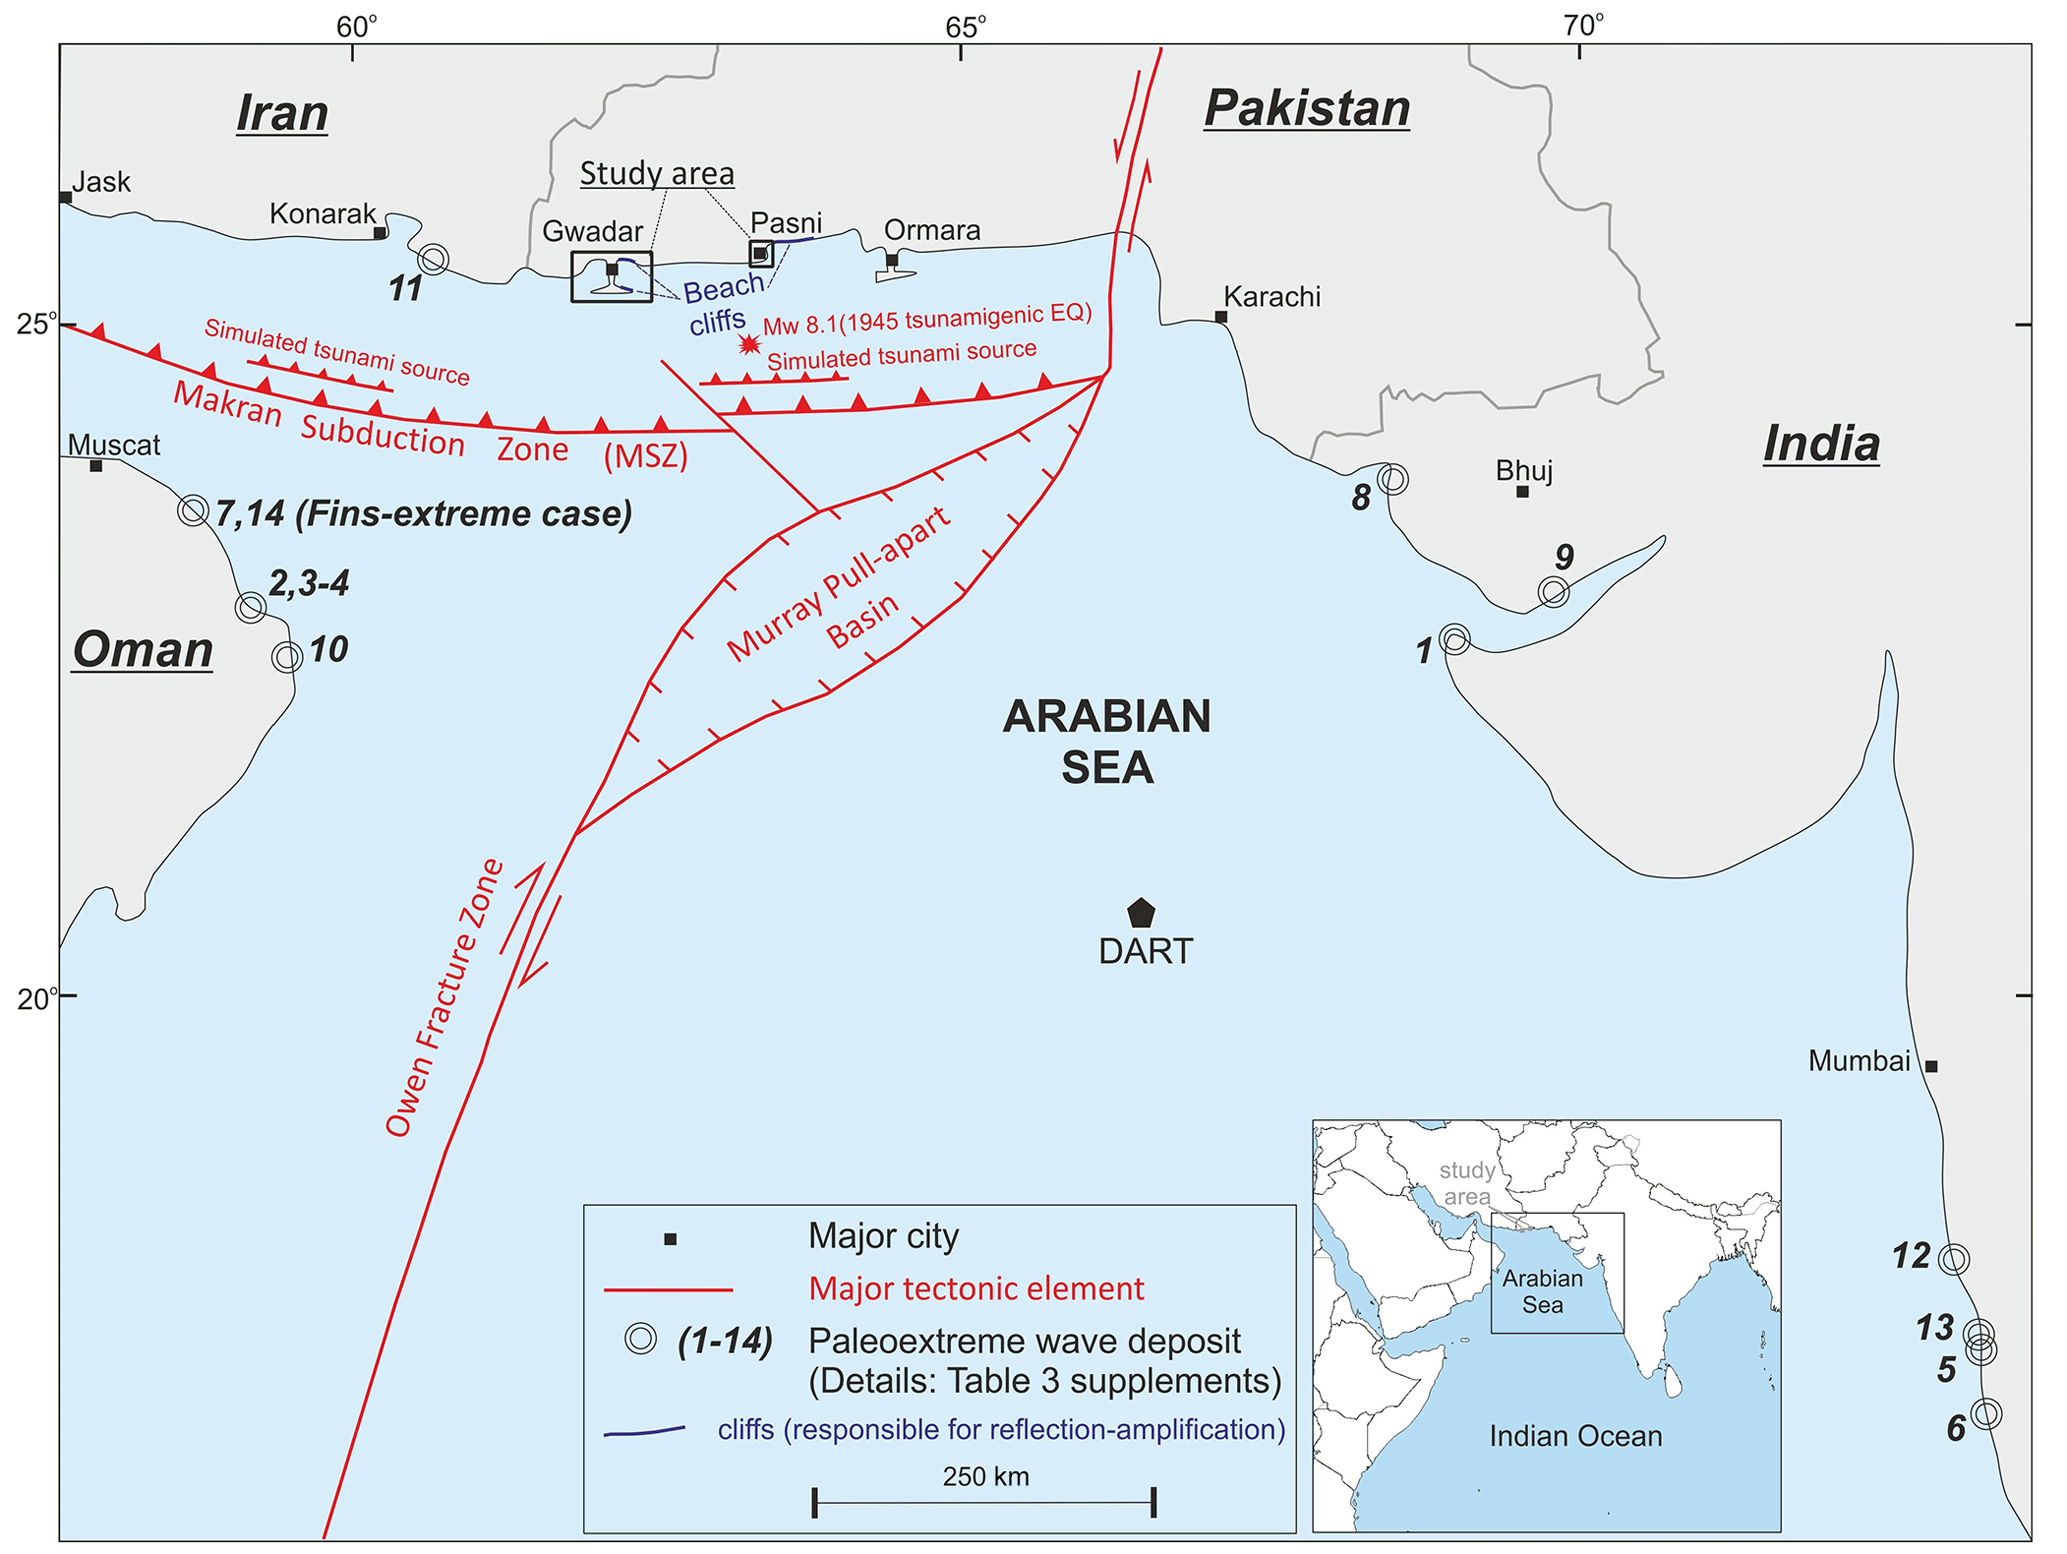
Figure 1A location and tectonic map of the study areas (Gwadar, Pasni). The circles with numbers show the reported paleoextreme wave deposits; details are in Table S1 in the Supplement. DART: Deep-ocean Assessment and Reporting of Tsunamis. EQ: earthquake.
The majority (80 %) of tsunamis globally are triggered by underwater earthquakes (Harbitz et al., 2014; Løvholt, 2017), while the remaining 20 % are caused by other sources such as landslides, volcanoes, and meteoric impacts in the ocean water (Behrens et al., 2021). In the Arabian Sea, seismic activity is primarily attributed to the Makran subduction zone (MSZ) (see Fig. 1). The MSZ accommodates the crustal shortening between the Arabian plate in the south and the Eurasian plate in the north, converging at a rate of 0.5–20 mm yr−1 (Vernant et al., 2004; Khan et al., 2008; Jade et al., 2017). Most of the seismicity along the eastern MSZ, south of Pasni, is associated with the Sonne fault (Kukowski et al., 2000). Additionally, the high seismic velocities (4.4 km s−1) indicate a brittle decollement at the eastern MSZ, contributing to high seismicity (Smith et al., 2012). This brittle nature is attributed to the lack of soft sediments along the decollement in comparison to the western portion of the MSZ. Thermal modeling of the MSZ suggests a potential earthquake magnitude comparable to the December 2004 Sumatra rupture, possibly reaching up to Mw 9.2 (Smith et al., 2012). Estimates from other thermal modeling research estimates a potential magnitude of Mw 8.65±0.26 in western Makran (Iran) and 8.75±0.26 in eastern Makran, Pakistan (Khaledzadeh and Ghods, 2022). El-Hussain et al. (2016) inversely calculated the maximum moment of earthquake potential as Mw 8.8 using the geodetic slip rate based on a simplified relation by Brune (1968) and Hanks and Kanamori (1979).
The focal mechanism of the 1945 tsunamigenic earthquake indicates a thrust event (Byrne et al., 1992). Dislocation models, body waveform inversion, and moment estimations suggest ruptured lengths ranging from 100 to 200 km, with an average crustal slip of 7 m along the MSZ. The Arabian plate, while subducting its northern edge, also slides past the Indian plate in the east at a rate of about 3±1 mm yr−1 (Reilinger et al., 2006; Rodriguez et al., 2011), making an active transform plate boundary. Murray Ridge (MR) and the Owen fracture zone (OFZ) are two major tectonic features along this transform plate boundary. The former is a pull-apart basin, while the latter is a transform boundary (see Fig. 1). Minor earthquakes, resulting from right-lateral strike-slip and normal faulting occur in the Murray Ridge (Banghar and Syke, 1981). Seismic activity along the remaining OFZ is mild to moderate, with the largest observed magnitude being Mw 5.8 (Rodriguez et al., 2011), posing no significant tsunami threat.
Table 1Table showing the earthquake source parameters used to model each scenario with the respective initial wave height.
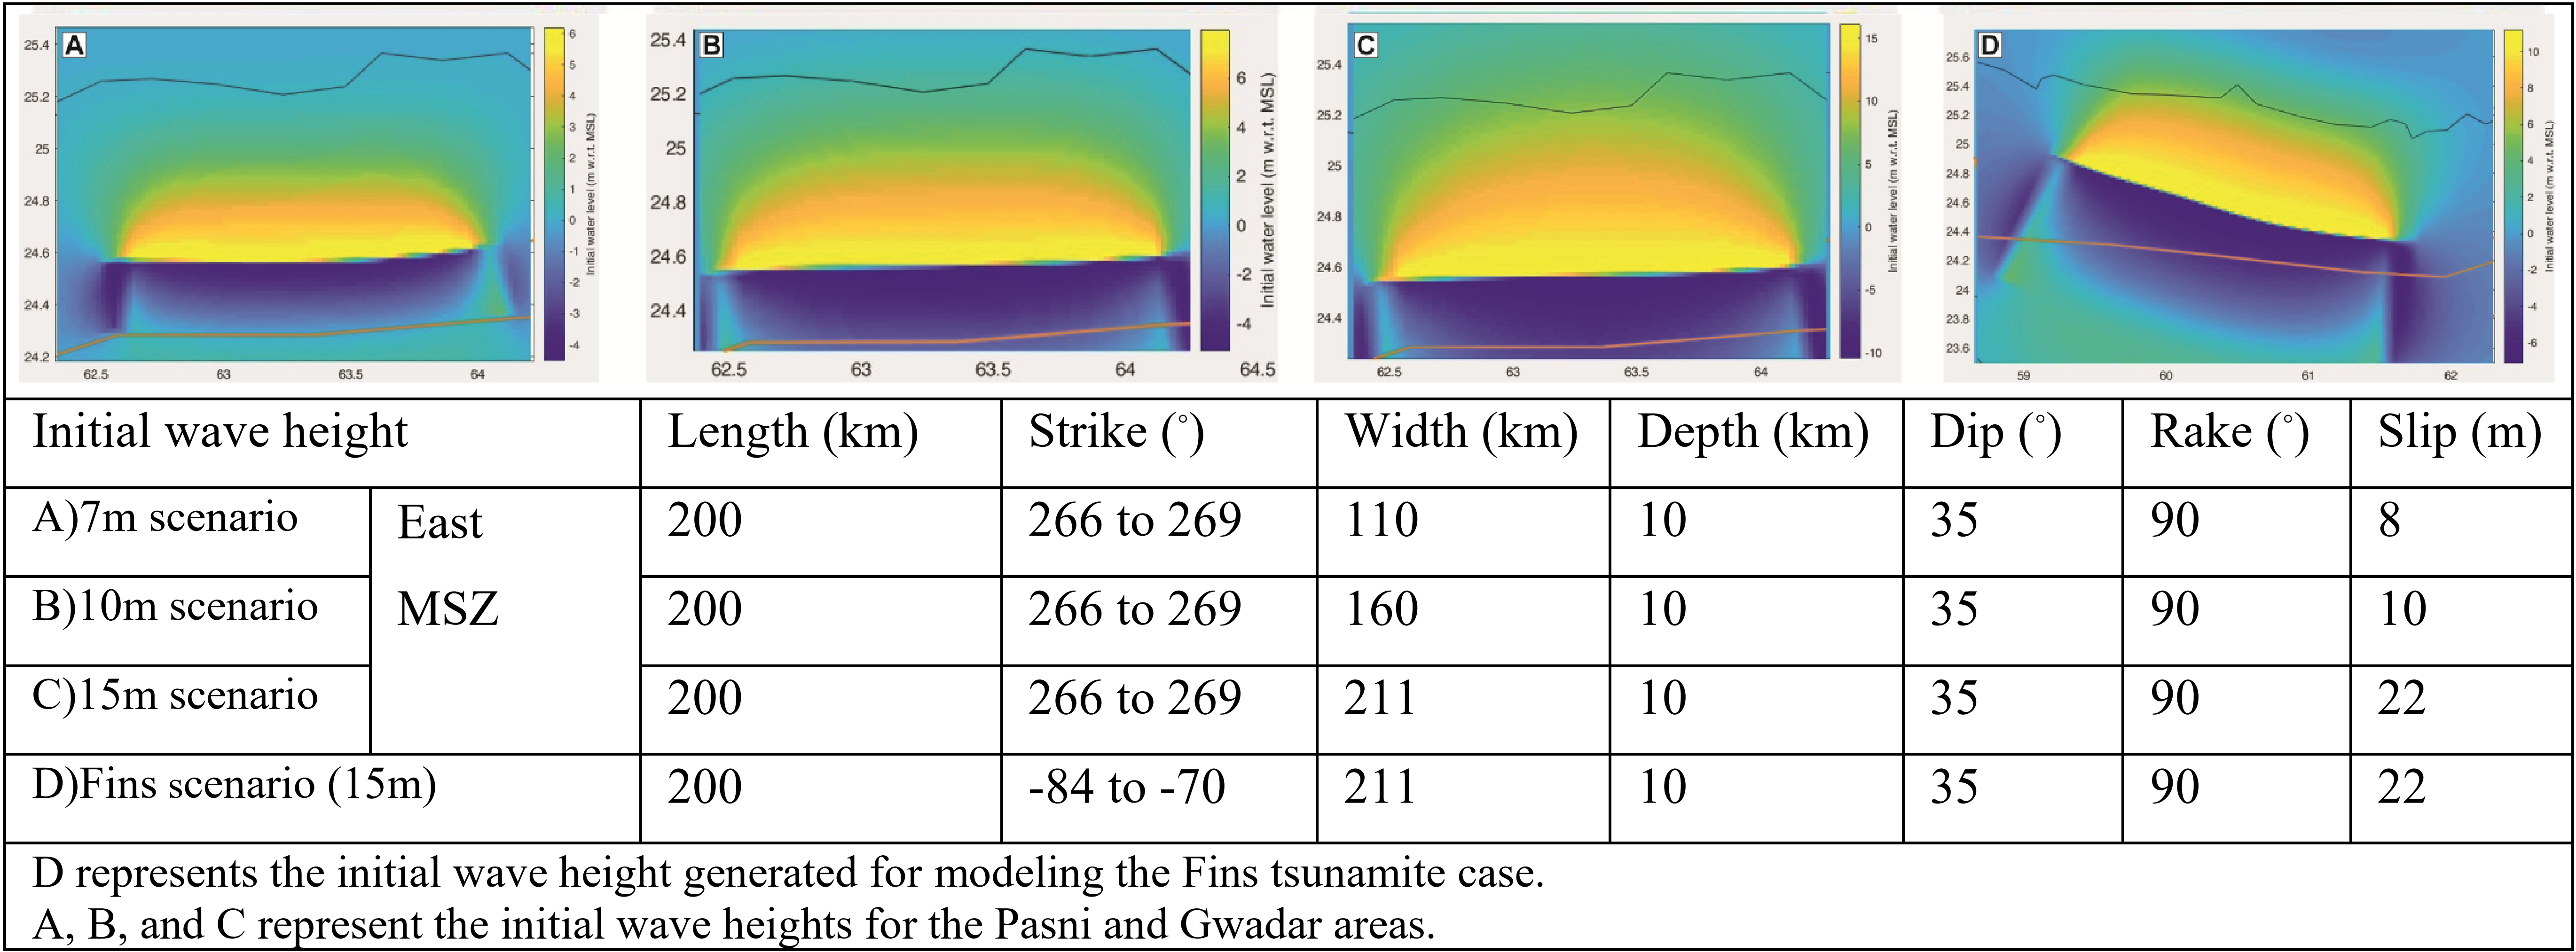
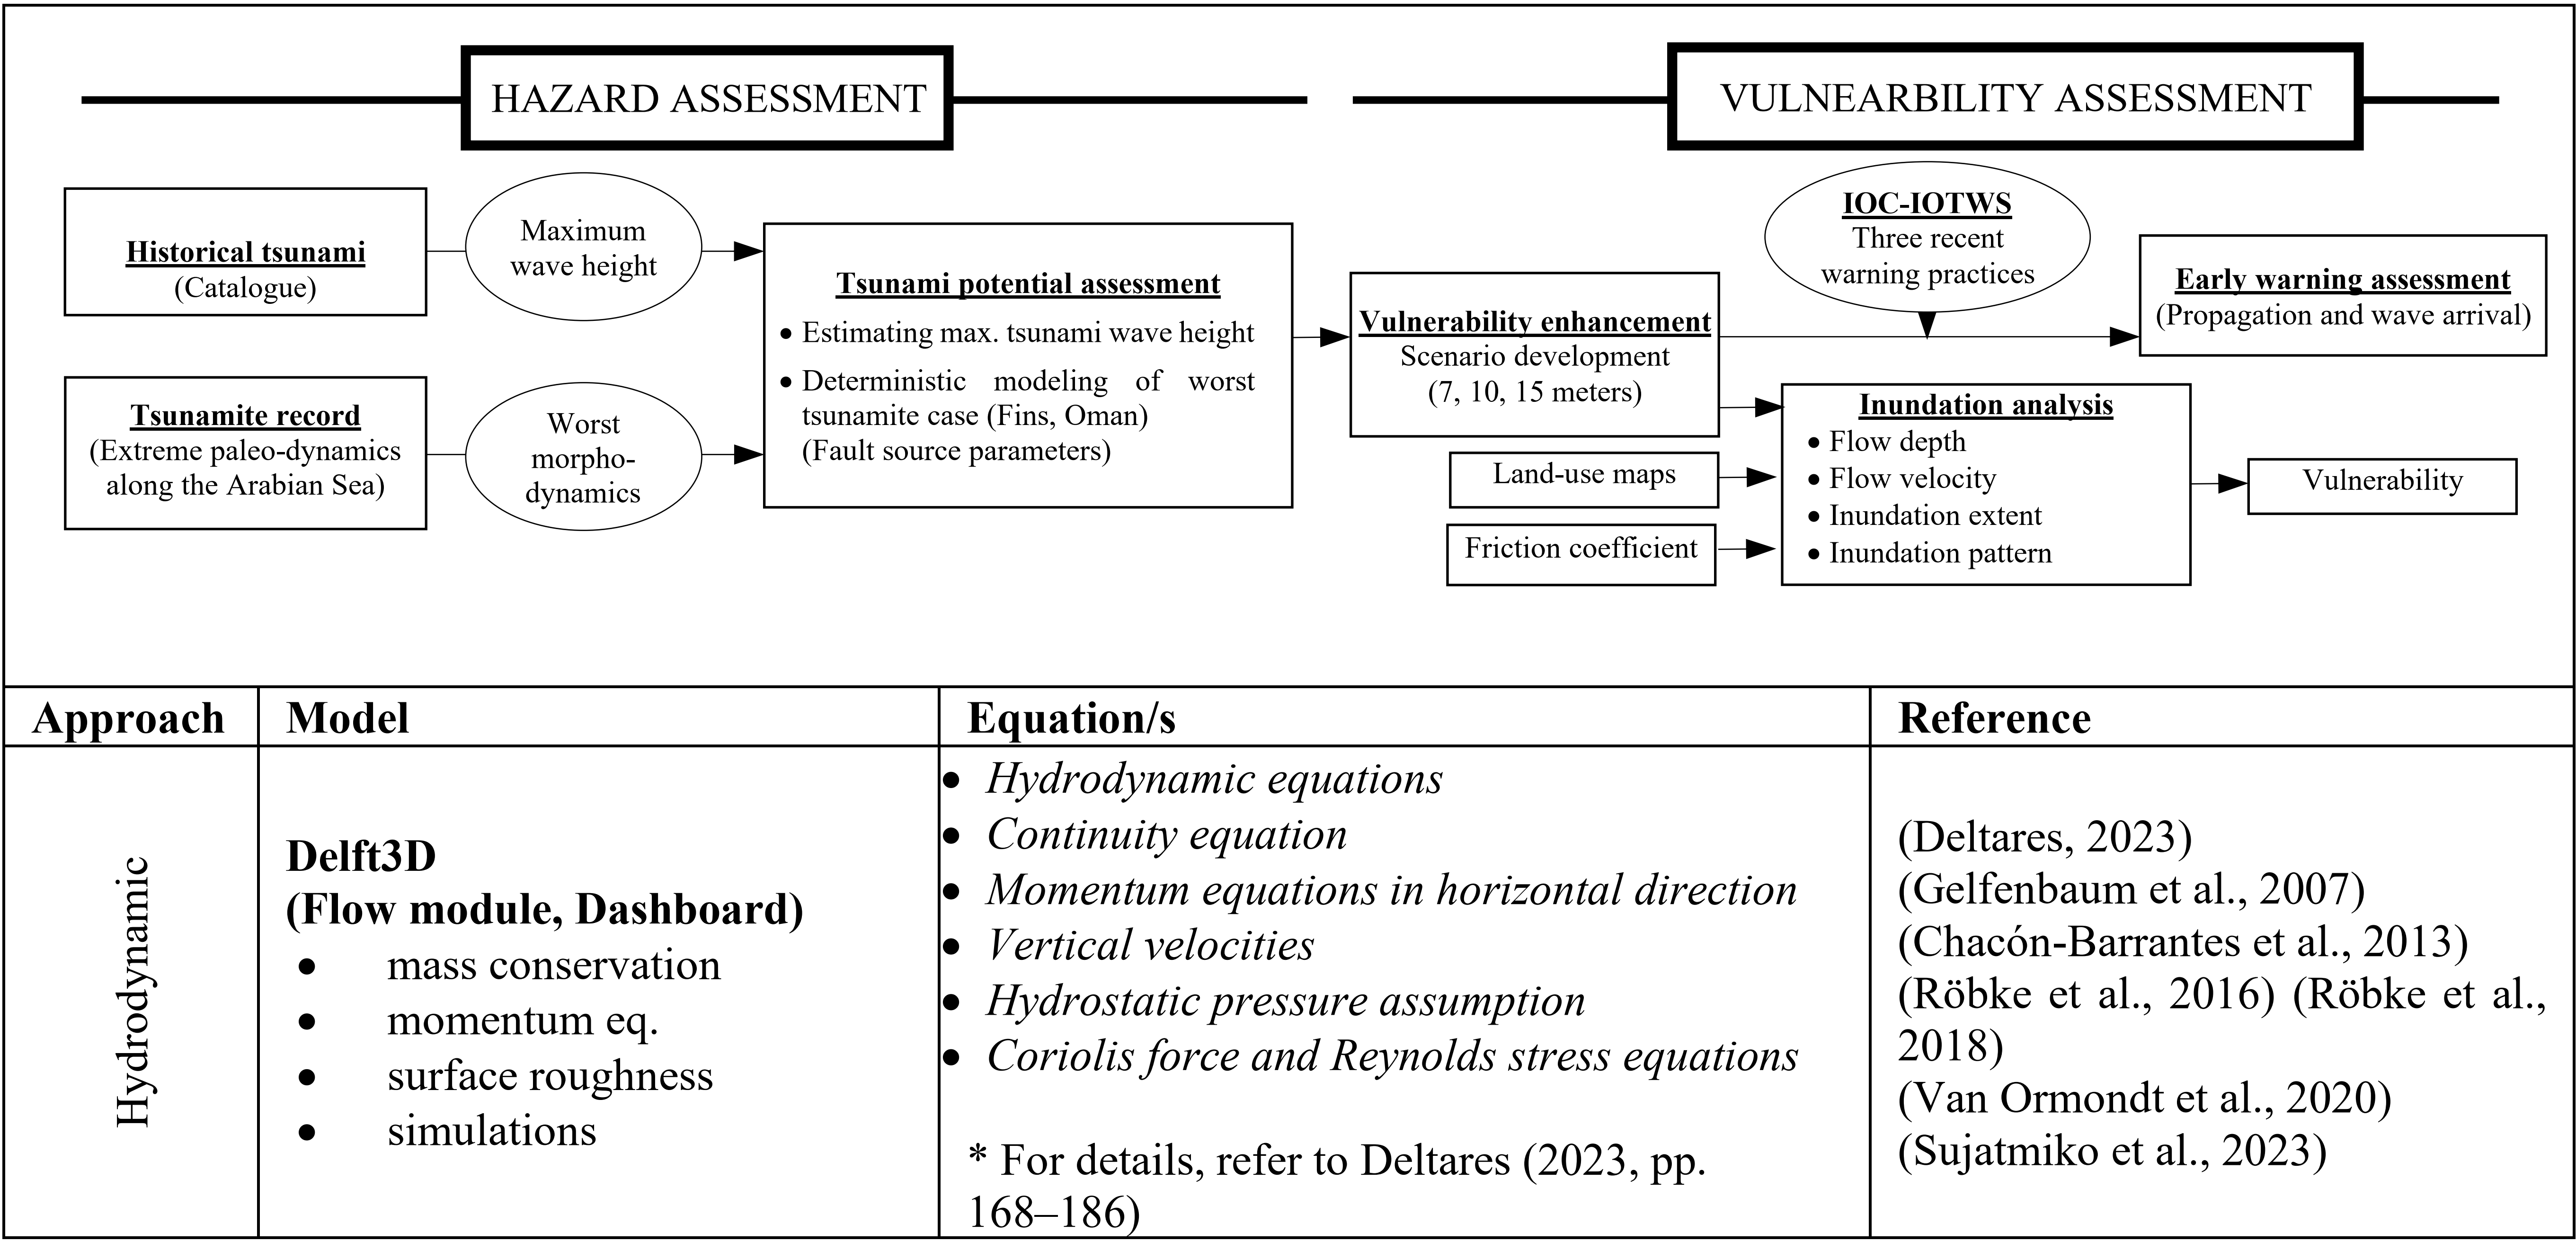
Table 2Summarized methodology with a flowchart showing the sequential order of various processes used for hazard and vulnerability assessment.
3.1 Tsunami wave potential assessment
The potential for tsunami waves in the Arabian Sea is also assessed by utilizing the tsunamite proxy. We compiled the reported tsunamite cases around the Arabian Sea and specifically examined the case at Fins, Oman, exhibiting extreme morphodynamics (Table S1 in the Supplement). At Fins, the tsunamites are represented by block and boulder deposits up to 40 t lying at a maximum height of 10 m above mean sea level (a.m.s.l.) showing a landward transportation up to 50 m from their intact sites. Further, laboratory tests on a scaled model (t-LiDAR) of the largest block-estimated wave velocities for dislodging, elevating, and transporting these boulders recorded measurements of between 4.5 and 6.6 m s−1 (Hoffmann et al., 2013a). The marine shells (C14, n=4) attached to these blocks and boulders gave a wide age range of between 250±160 and 4595±185 cal BP (Hoffmann et al., 2020). At the same site, loose tsunami sediments fining and wedging landward with a minimum elevation of ≥17 m are dated 5840 cal BP (C14, n=6) (Koster et al., 2014). These studies also applied corrections for tectonic uplift and subsidence and absolute sea level change and estimated a 14 m wave run-up. The long-axis rose plot of blocks and boulders indicates that the wave source azimuth (N30E) originates from the MSZ (Hoffmann et al., 2013a). We modeled this case study (Fins scenario) to estimate the wave size capable of demonstrating the above dynamics. The tsunamis are generated using Okada's (1985) earthquake parameters at the MSZ given in Table 1. The other tsunami sources such as landslides, volcanoes, and meteoric impacts in the ocean water have not yet been considered and therefore cannot be negated at this stage.
The 1945 tsunami at Pasni is also a severe event compared to others in the known history of tsunamis in the Arabian Sea, with a reported wave height of 12–15 m (Pendse, 1946). The 1945 tsunami event at Pasni and case of tsunamites at Fins serves as a reference, providing empirical evidence of tsunami potential and its impacts within the region. The recurrence interval for a tsunami event of such a magnitude (≥10 m) estimated through multiproxy analysis is between 500 and 1000 years (Haider et al., 2023). Based on the above assessment, we establish a range of scenarios (7, 10, and 15 m) to thoroughly assess the vulnerability landscape of the cities of Gwadar and Pasni and their surrounding areas.
3.2 Source type and parameters
Tsunami propagation and inundation scenarios are modeled using the earthquake parameters on a hypothetical splay fault close to the MSZ. We applied Okada's (1985) mathematical model to estimate the seabed deformation induced by earthquakes, employing uniform parameters for a four-segmented fault rupture. The most severe source parameters were replicated based on those investigated in the Fins scenario. To enhance the vulnerability assessment, we conducted two additional case studies with scenarios featuring relatively low-intensity parameters (Table 1). These scenarios are likely to encompass varying degrees of seismic hazard and tsunami risk, thereby facilitating a more comprehensive evaluation of potential impacts and the formulation of effective mitigation strategies. The relationship between earthquake magnitude and its associated parameters is inherently intricate, primarily owing to complex geological processes, such as fault geometry and heterogeneous stress distribution, and uncertainties in earthquake rupture mechanisms (Zaccagnino et al., 2022). As already mentioned, the analysis suggests a return period of between 500–1000 years for a tsunami ≥10 m in the Arabian Sea (Haider et al., 2023). This minimum recurrence interval of 500 years (475 in actuality) corresponds to the life safety and infrastructure collapse performance levels (Ahmed et al., 2019). In total three different scenarios have been modeled for an enhanced vulnerability assessment in the study area.
3.3 Tsunami modeling and data used
Numerical modeling is performed using the Delft3D 4.04.01 software, developed by the Dutch institute Deltares (Deltares, 2023). Table 2 shows the flowchart and sequential order of various processes used for hazard and vulnerability assessment. The hydrodynamic program module Delft3D-FLOW is used for simulation, which solves non-linear 2D and 3D shallow-water equations (SWEs) for unsteady flow phenomena. The equations of the Boussinesq approximation for incompressible fluids are derived from the 3D hydrodynamic Navier–Stokes equations. For further details about the software and governing equations, please see Deltares (2023, pp. 168–186). We employed a nested computational grid for both cities, with a grid resolution of 0.0004×0.0004 (44 m × 44 m) for the nested models and 0.01×0.01 (∼1 km × 1 km) for the regional model. A schematic nesting model is provided in the Supplement (simulation 10). In the regional model, Riemann boundary conditions are utilized to minimize the reflection effect, and time-series boundaries are applied for the nested models. For tsunami propagation and inundation analysis, we integrated bathymetric data from the General Bathymetric Chart of the Oceans (GEBCO) at 15 arcsec resolution and topographic data from the German Aerospace Center (DLR) at 0.4 arcsec (∼12 m) resolution in a GIS (geographic information system) environment. The DLR's topography digital elevation model (DEM) is derived from bistatic X-band interferometric synthetic-aperture radar (SAR) data, utilizing the patented TanDEM-X and TerraSAR-X systems. The post-data-acquisition developments, including the addition of the East Bay Expressway and jetty (each 4 m high), are manually incorporated in the fused DEM, which is particularly crucial for Gwadar. Furthermore, the terrain roughness is assigned using Manning's coefficient, with values of 0.015 for the sea floor and open land, 0.03 for thinly populated areas, 0.05 moderately populated areas, and 0.08 for densely populated areas. The coefficient value assignment is based on fieldwork, photographs, and Google Earth satellite images. The GIS data are analyzed and processed using the Quantum GIS (QGIS 3.28.1) software, providing a robust environment for spatial analysis and visualization. QGIS is an official project of the Open Source Geospatial Foundation (OSGeo).
3.4 Vulnerability analysis
Damage probability refers to the likelihood or probability of damage that a particular type of property will sustain because of tsunami impact. The vulnerability analysis is carried out with the fragility curves expressed as damage probabilities versus the drag force of individual houses and structures for structural damage as developed by Koshimura et al. (2009) and Rehman and Cho (2016). They computed fragility curves for tsunami damage through the statistical approach synergized with GIS and numerical modeling results of pre- and post-tsunami (2004 Indian Ocean tsunami) data from Banda Aceh, Indonesia. These curves are developed for low-rise, lightly reinforced, non-engineered reinforced concrete (RC) (see Fig. 4). The major structural types in our study area and Banda Aceh, Indonesia, are comparable; they are mostly one- or two-story structures with conventional masonry and lightly engineered RC. The assessment of structural and building material types in Gwadar and Pasni is based on visual estimates carried out during the fieldwork and needs to be analyzed in detail for improved results.
In the Koshimura et al. (2009) fragility curves calculated for Banda Aceh, Indonesia, the drag force (hydrodynamic) per unit width of a structure is mathematically expressed as follows:
where CD is the drag coefficient equal to 0.99 (1.0 for simplicity), mainly depending on the shape of the structure of buildings in our case and the angle of incidence of the floodwater flow; ρ is water density (1000 kg m−3); u is the wave velocity (m s−1); and D is the inundation or flow depth (m). The drag force for each scenario is calculated using the hydrodynamics at each monitoring point in Gwadar and Pasni. For example, in Pasni, the drag force (F) for the 15 m scenario at monitoring point M2 is calculated using the modeled flow depth and velocity as follows:
4.1 Pasni scenarios
In the 7 m scenario, the first wave reaches the Pasni coast 20 min after the earthquake. From the coastline (shoreline) it further takes 20 min to reach its maximum inundation limit, partly affecting the localities of Wadsar and Main Bazar. In this inundation course, only one monitoring point (M5) situated in an inhabited locality experiences inundation. M5 records a maximum flow depth of 1 m and flow velocity of 0.5 m s−1. However, areas like Shol, Parhag, and a significant part of the main town of Pasni remain relatively unaffected (see Fig. 2, 7 m scenario).
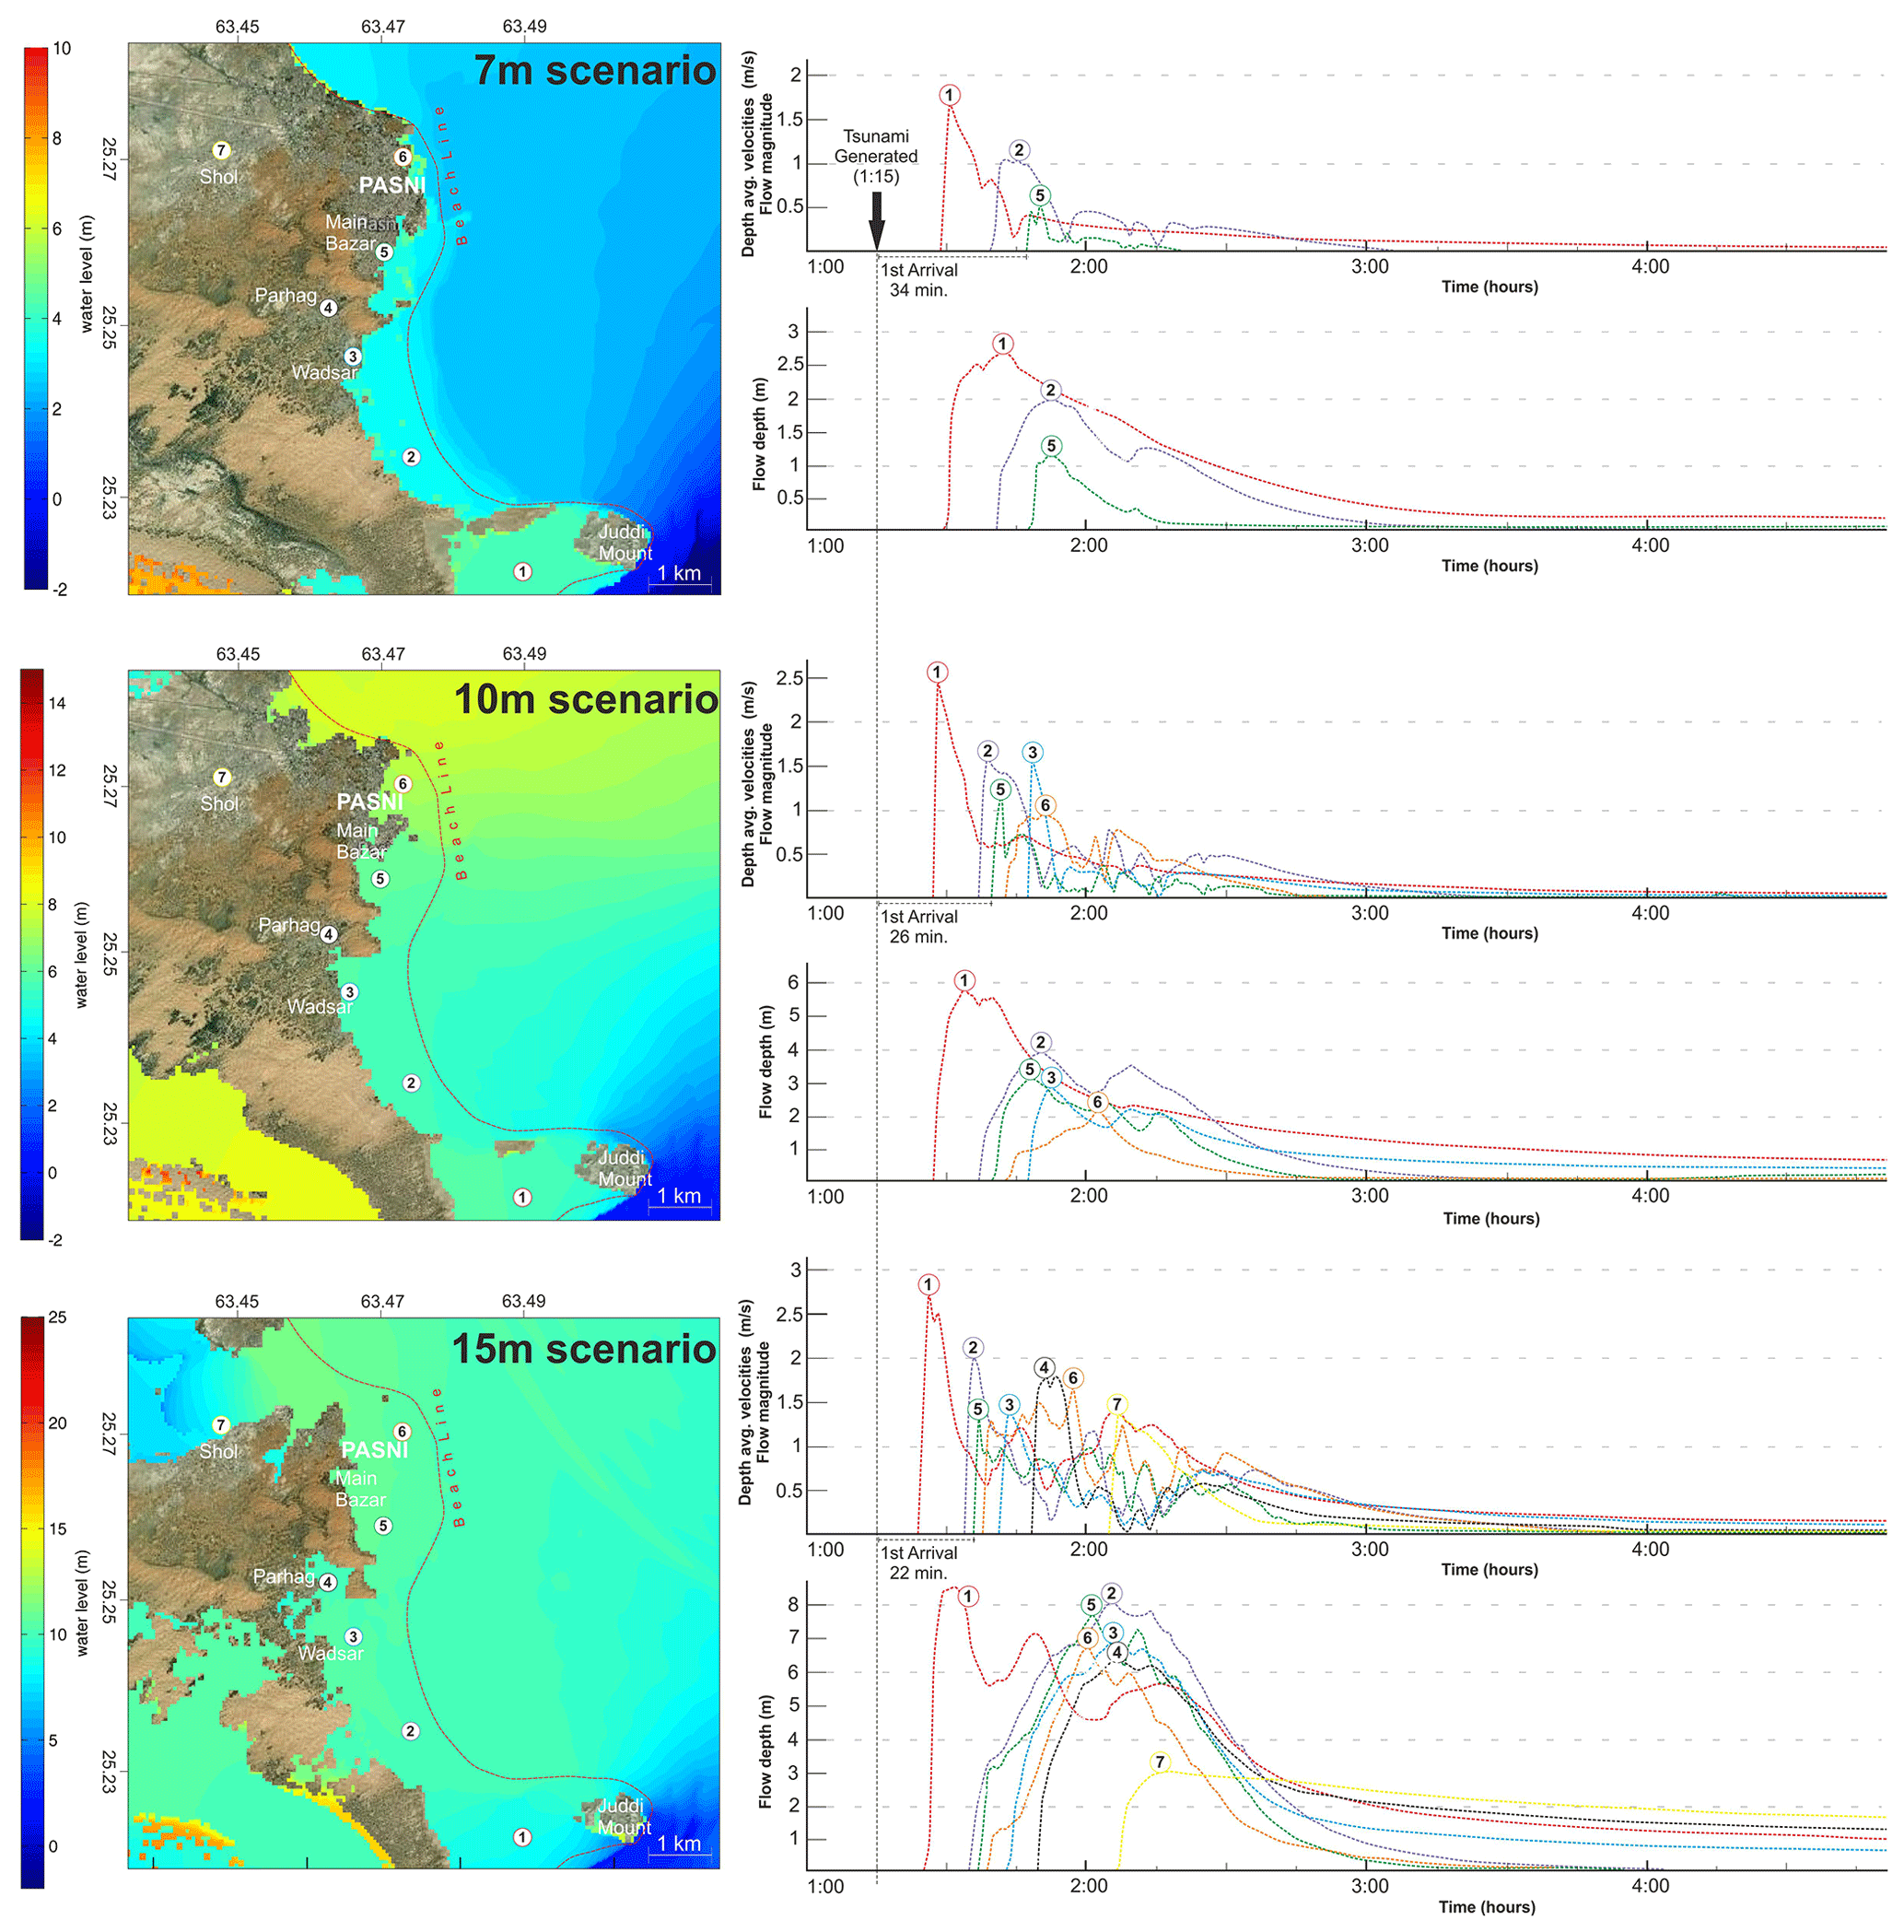
Figure 2Hydrodynamic-modeling results of each scenario with maximum inundation limits and depths at Pasni and surrounding areas. The graphs illustrate the flow depth and magnitude at monitoring points M1 to M7. Simulation for each scenario is provided in the Supplement.
In the 10 m scenario, along with first wave, a secondary wave with a height of 8 m is generated due to reflection from the cliffs northeast of Pasni (simulation 3 of the Pasni 10 m scenario in the Supplement). These two waveforms reach the Pasni coast at intervals of 20 and 45 min, respectively, following the earthquake (see Fig. 2, M6 10 m scenario). In both cases, the direction of the inundation pattern shifts based on the wave propagation direction: initially, northward propagation inundates the southeast of the area, while the southward propagation due to reflection causes inundation from the northeast. Initially, the approaching wave inundates the study area from the south and inundation extent decreases significantly northward, primarily due to the adjacent river (Shadi Kaur) consuming a significant portion of the inundating wave, resulting in lower water levels in the populated area. Nonetheless, the inundation dynamics pose a significant threat to the loss of life and property. Spatially, the inundation gradually decreases from south to north, from a maximum flow depth and flow velocity of 6 m and 2.5 m s−1 at M1 to 2 m and 1 m s−1 at M6.
In the 15 m scenario, the inundation impact is approximately double in terms of flow depth as compared to that in the 10 m scenario due to the heightened wave characteristics and enhanced reflection phenomenon. The approaching and reflecting waves interact for a duration of 30 min, generating a series of wavelets that gradually increase in intensity and contributing to the formation of a larger and more complex waveform. Consequently, a significant accumulation of water along the shoreline in the study area results in a far deeper inundation (simulation 4 of the Pasni 15 m scenario in the Supplement). The spectral characteristics of the flow velocity exhibit a higher degree of complexity and variability in comparison to the corresponding flow depth. In populated areas, such as Pasni, Main Bazar, Parhag, and Wadsar, peak flow depths range between 6 and 8 m, alongside maximum flow velocities reaching 1.5 m s−1. The intense backwash process in this scenario poses a significant hazard too, as evidenced by the consistent recording of flow depths exceeding 1 m at all monitoring points until the 5 h simulation duration (see Fig. 2, M6 15 m scenario).
In general, for all three scenarios, the maximum flow velocity is recorded through the first wave and maximum flow depth is recorded at quasi-stillstand. Quasi-stillstand refers to a temporary pause or a halt at the maximum inundation limit, after which the backwash process initiates. The backwash tsunami phenomenon persists for more than 4 h.
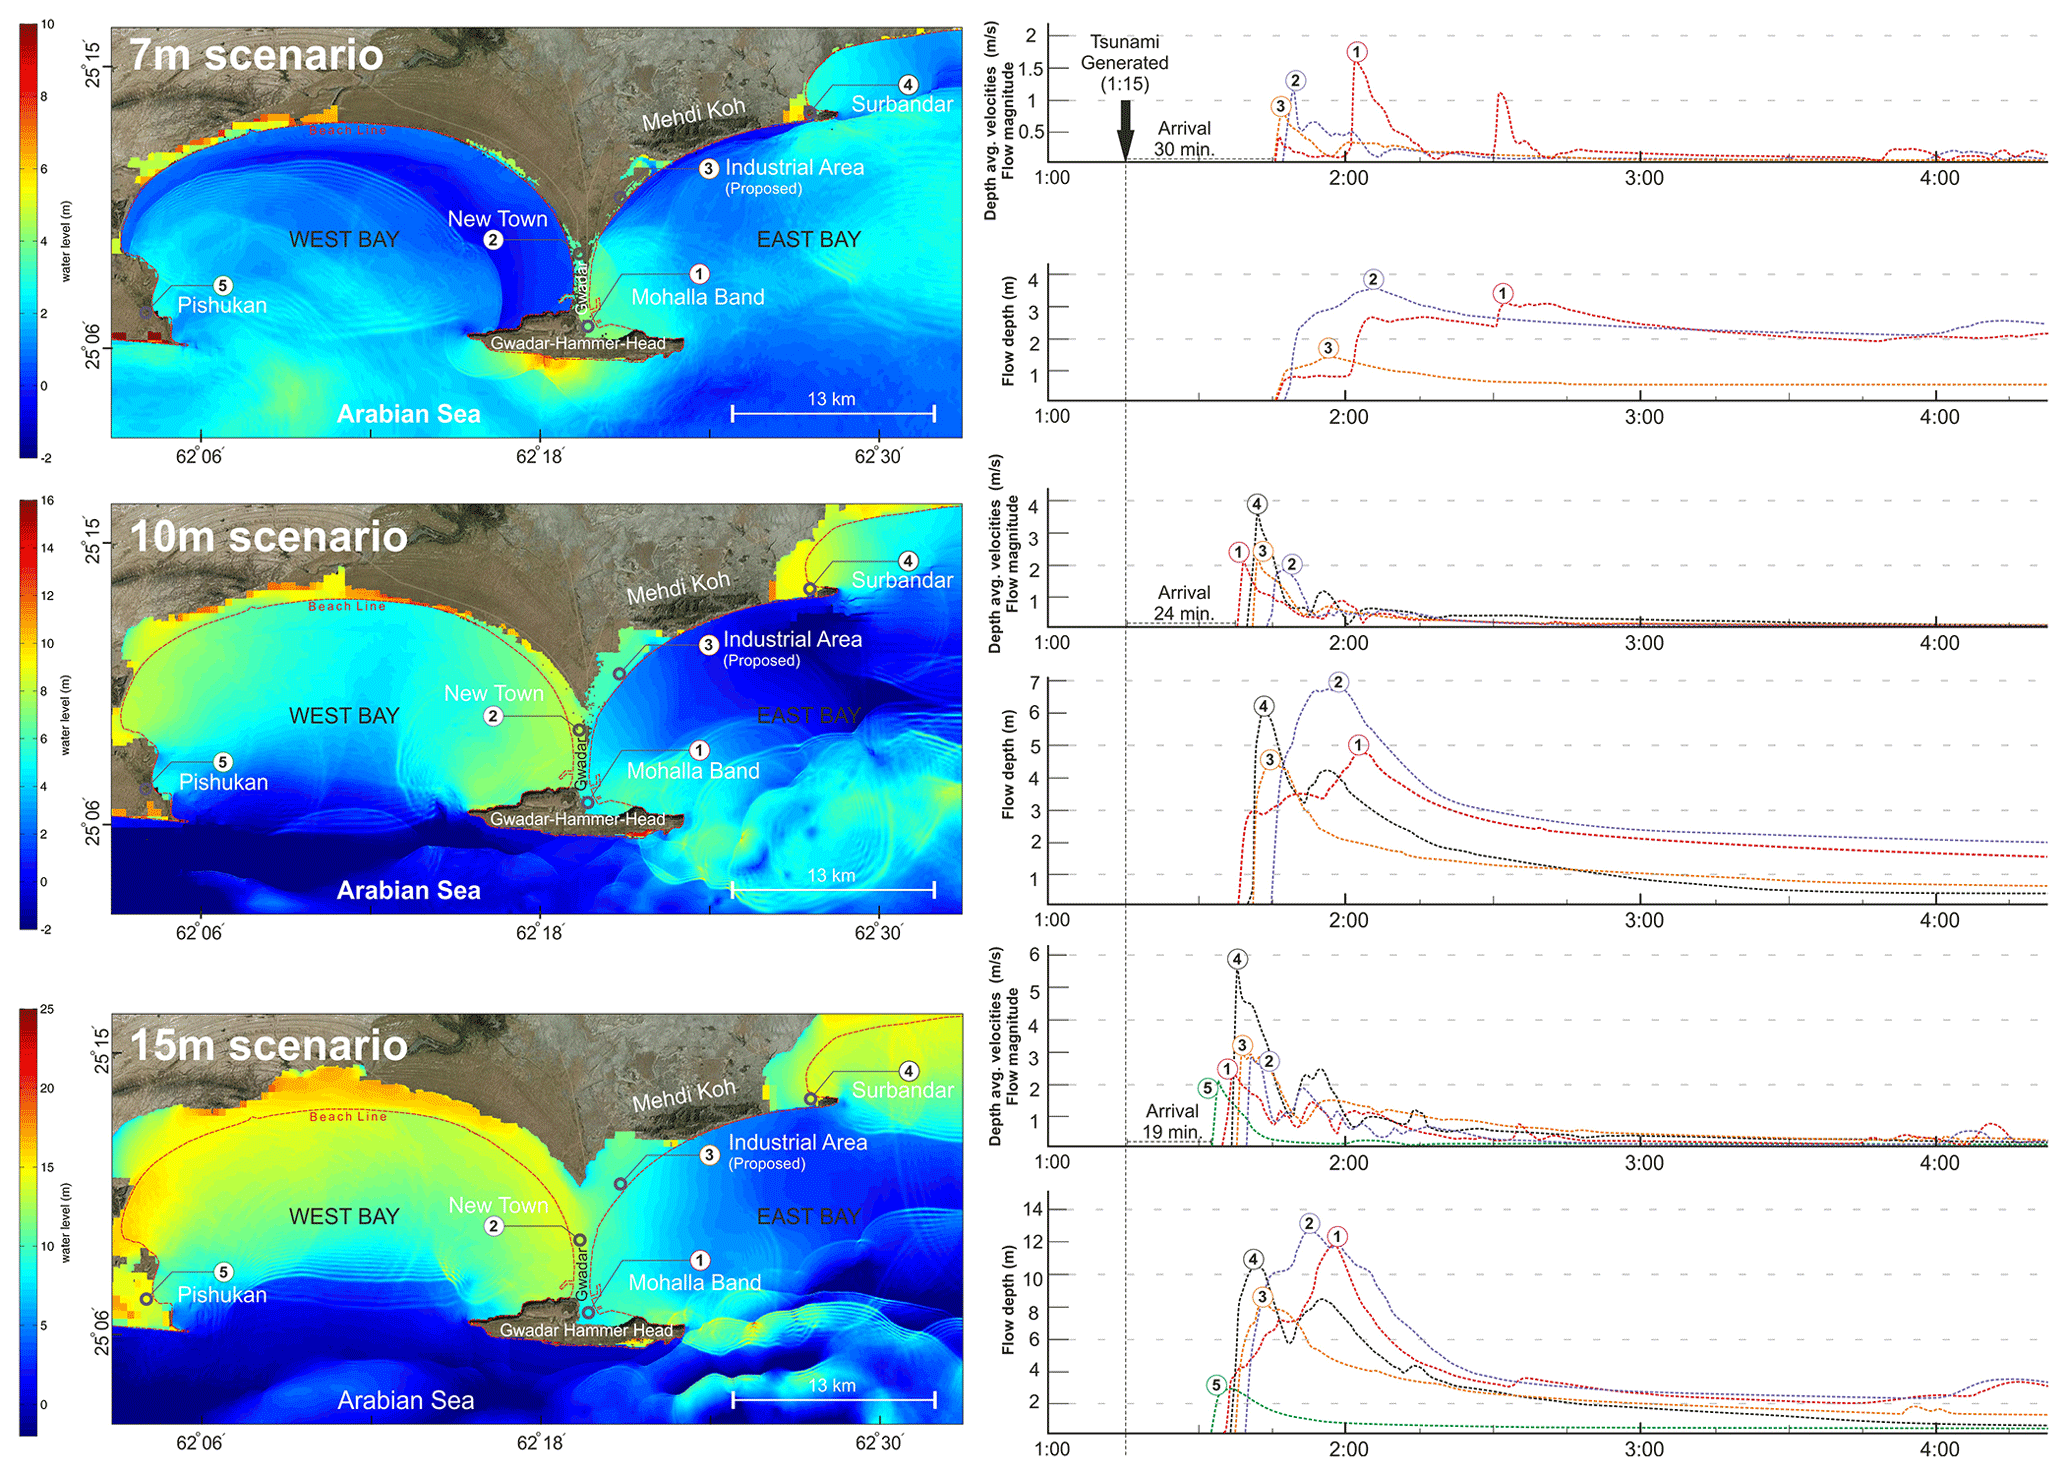
Figure 3Hydrodynamic-modeling results of each scenario with maximum inundation limits and depths at Gwadar and surrounding areas. The graphs illustrate the flow depth and magnitude at monitoring points M1 to M5. Simulation for each scenario is provided in the Supplement.
4.2 Gwadar scenarios
The Gwadar East Bay or simply the east bay is characterized by two prominent coastal wave reflectors: coastal mountains to the north, namely Mehdi-Koh, and the Gwadar Hammer Head to the south (see Fig. 3). The Gwadar Hammer Head is a geological formation characterized by a protruding landmass extending into the sea. The subsequent reflection phenomena and the ingress of regular tsunami waves (≤4 m) contribute to wave integration and amplification along with delayed wave arrivals. For instance, in the 7 m scenario at M1 (locality of Mohalla Band), the first wave arrives 30 min after the earthquake, with a flow depth of 1 m. Further, with a lapse of 15 min, the second wave inundates the area, increasing the flow depth to 2.6 m. This is succeeded by a third wave after a lapse of an additional 30 min, further increasing the flow depth to 3 m. After the third and final wave the quasi-stillstand or temporary water stabilization prevails for 15 min. Hence, with the reflection mechanism in place, the water level exhibits a continuous increase over a span of 60 min. However, if we eliminate the influence of reflection from the first tsunami wave, this duration would be reduced to merely 15 min with only 1 m flow depth at M1. The wave spectral analysis shows an inverse relation of flow depth and flow velocity because of the loss of kinetic energy during the reflection-amplification phenomenon.
The locality of Surbandar (M4) remains unaffected in the 7 m scenario; however in the 10 and 15 m scenarios the locality is severely affected. It is positioned at a lower elevation compared to the beach banks in the south, from where the tsunami propagates and experiences wave overflow. Being situated on low-lying topography as compared to the beach banks and by directly facing the tsunami propagation, the torrential force achieves a flow velocity of 4 and 6 m s−1 in the 10 and 15 m scenarios, respectively. Similar phenomenon is also observed for the locality of Pishukan (M5). The cliffs, averaging a height of 12 m, situated to the south of Pishukan, provide protection against inundation in the 7 and 10 m scenarios. However, in the 15 m scenario, waves spill over these natural defenses, resulting in flow depths and velocities of 3 m and 2.1 m s−1, respectively, at M5. The locality of New Town (M2) exhibits the highest flow depth in each scenario, reflecting its heightened vulnerability to tsunami inundation. Analysis reveals that this high vulnerability arises from inundation originating from both the east and west bays, where wave interactions lead to amplification of the inundating waves.
In the town of Gwadar (M1 to M2), both sides of the bay are elevated to a height of 5 m a.m.s.l. to accommodate road construction. This elevated terrain, coupled with an inadequate and low-capacity drainage infrastructure, significantly impedes the backwash process of tsunamis (see Fig. 3, flow depths for all scenarios). Modeling results indicate a flow depth exceeding 2 m in the town of Gwadar even after 3 h.
4.3 Vulnerability analysis
The damage probability for each scenario is assessed through hydrodynamic analysis conducted at each monitoring point in both cities. Consequently, damage intensity is expected to escalate towards the shoreline from these monitoring locations. However, exceptions are noted in the cases of Surbandar and Pishukan in the Gwadar area, which are elaborated on later.
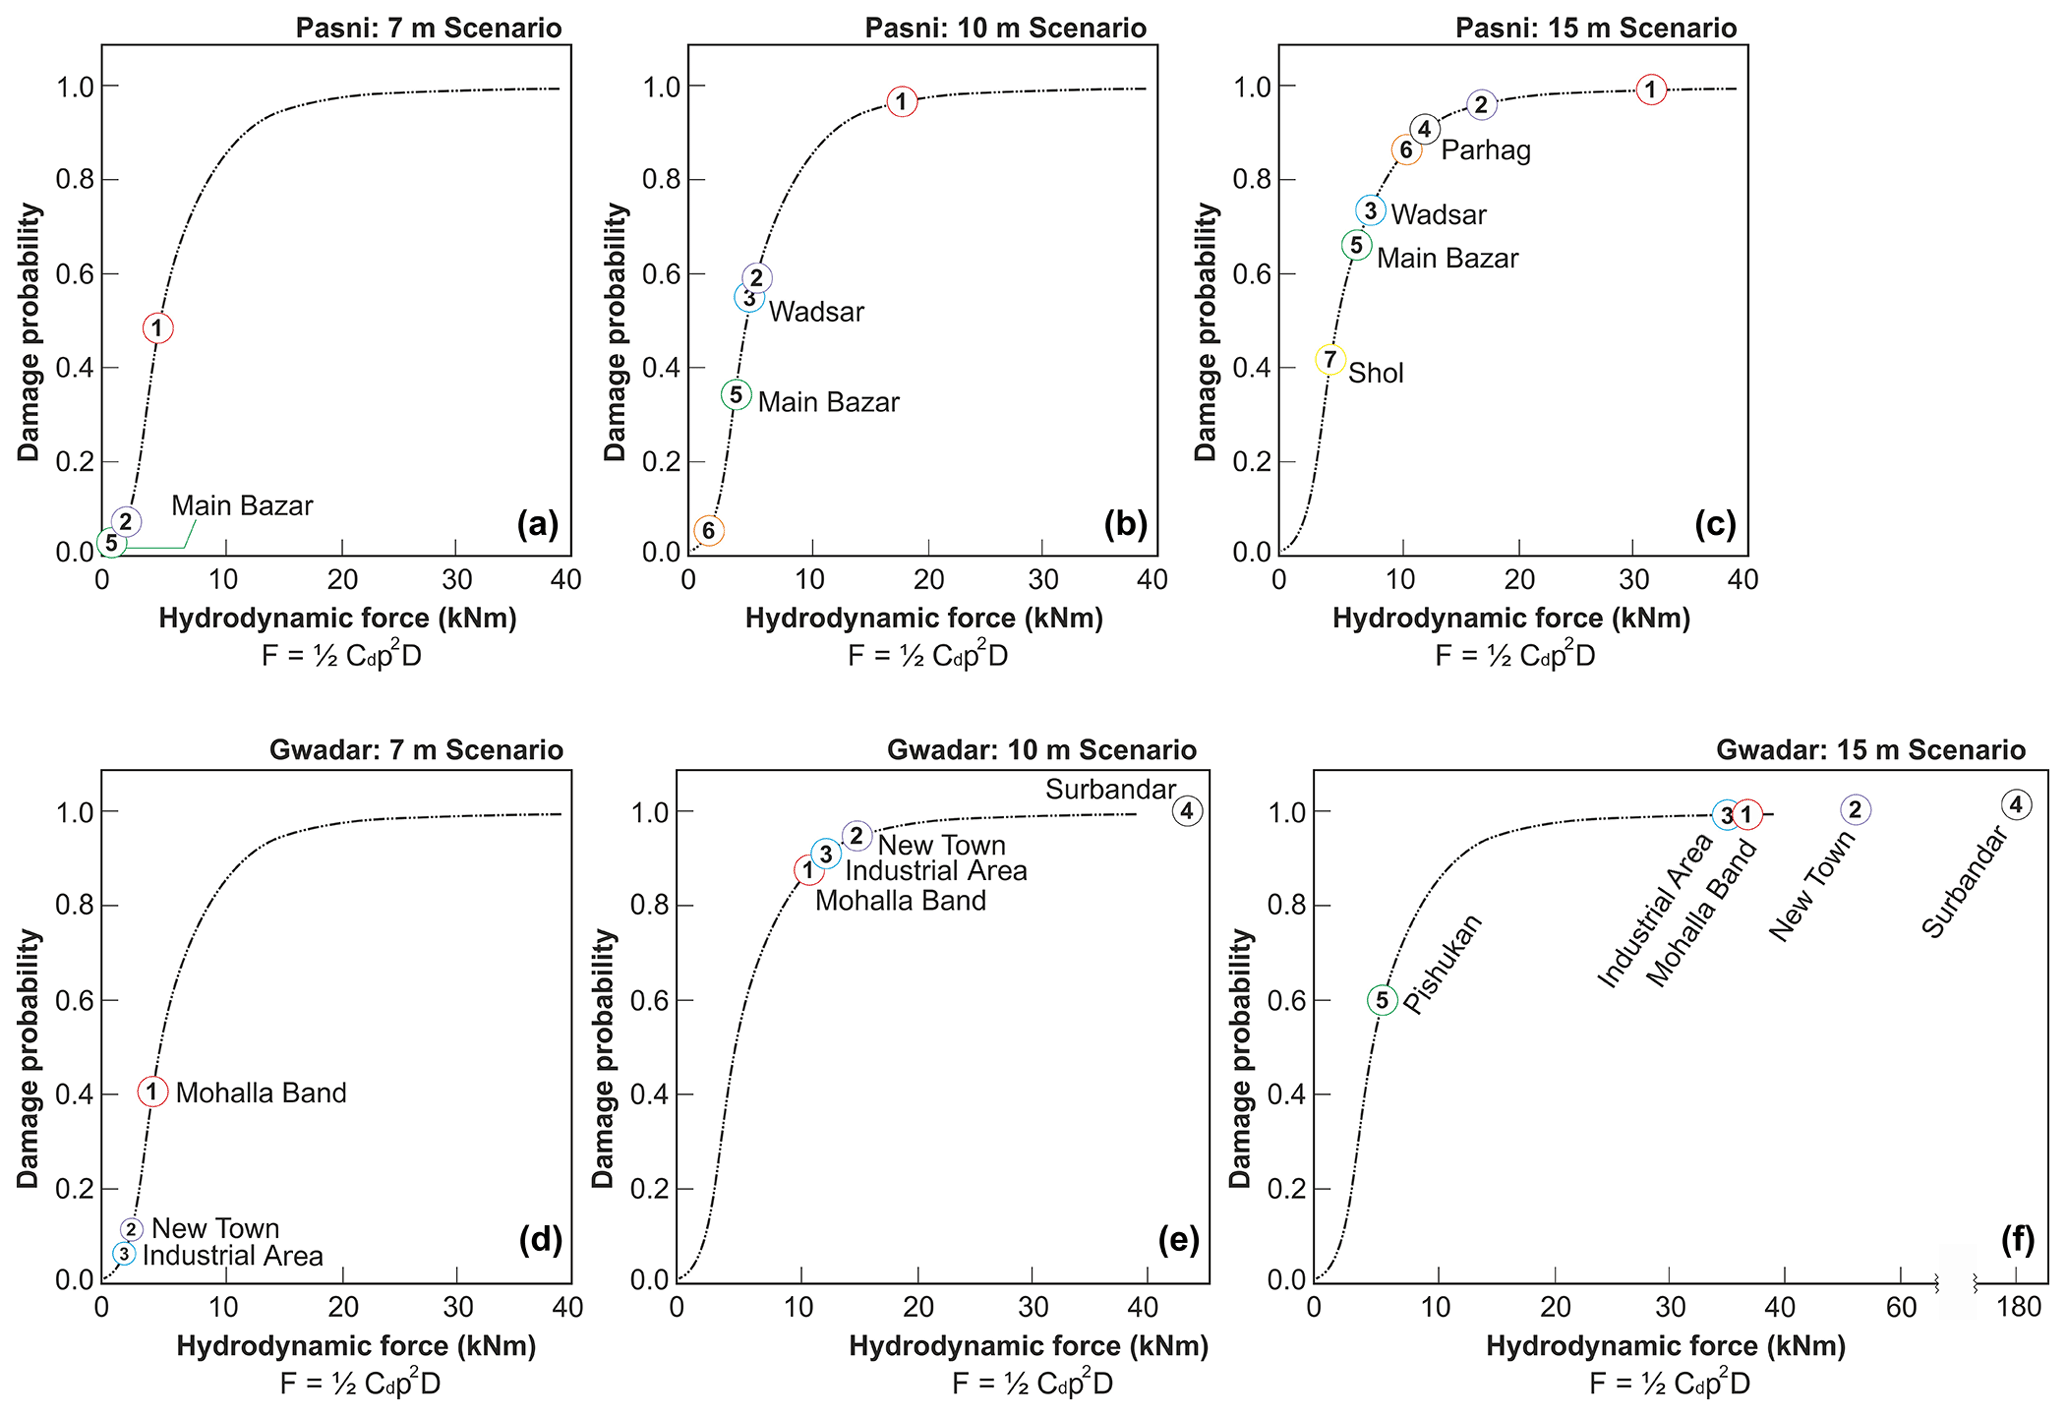
Figure 4Probability of structural damage plotted against the hydrodynamic force at each monitoring point: (a–c) Pasni and (d–f) Gwadar. The results plotted on fragility curves were developed by Koshimura et al. (2009).
At Pasni, monitoring points M1 and M2 exhibit the most severe flow dynamics, indicating the highest vulnerability to tsunami inundation in each scenario (see Fig. 4, Pasni scenarios). For M1, the damage probabilities are 0.50, 0.95, and 1.0 for the 7, 10, and 15 m scenarios, respectively. Similarly, for M2, the corresponding probabilities are 0.05, 0.6, and 0.95. Despite being uninhabited, any development should undergo feasibility studies concerning extreme wave events, particularly tsunamis. Regarding the inhabited part, the 7 m scenario minorly affects the locality of Main Bazar (M5) and surrounding areas with an estimated damage probability close to 0. However, it should be noted that infrastructure or communities residing in close proximity to the shoreline may still possess some degree of damage potential. In the 10 m scenario, the locality of Wadsar (M3) poses the maximum damage potential with a probability of 0.57, followed by Main Bazar (M5) with 0.37, and then the locality of Pasni (M6) with 0.05. In the 15 m scenario, no locality remains unaffected; all localities exhibit a probability of damage exceeding 0.6, except for Shol (M7), which registers a value of 0.4.
The results indicate that the level of vulnerability and probability of damage are higher in the Gwadar area compared to the Pasni area. In the 7 m scenario, three localities, two of which are inhabited, are inundated (see Fig. 4, Gwadar scenarios). The locality of Mohalla Band (M1) exhibits a damage probability of 0.4, followed by the locality of New Town (M2) with 0.1. Additionally, the proposed site for industrial development (M3) is also inundated, with a damage probability of less than 0.1. The 10 and 15 m scenarios pose significant challenges for the area. In the 10 m scenario, only Pishukan remains unimpacted, while all other localities are anticipated to experience a damage probability exceeding 0.8. The findings indicate that the locality of Surbandar (M4) encounters a hydrodynamic force exceeding 40 kN m. This heightened level is attributed to tsunami overtopping the beach banks followed by a torrential downslope runoff effect, as discussed earlier in the section (Sect. 4.2). All localities, except Pishukan, have a damage probability of 1.0, with the hydrodynamic force exceeding 35 kN m. The locality of Pishukan (M5) indicates a probability of 0.6 only in the case of a 15 m tsunami.
The process of tsunami modeling comprises three distinct phases: generation, propagation, and inundation. The generation phase involves calculation of sea floor deformation during an earthquake causing initial disturbance in the oceanic water. Subsequently, a hydrodynamic model utilizes this initial wave to model and simulate the propagation and inundation of the tsunami waves. For tsunami generation and potential estimation, utilizing Okada's (1985) model for the initial sea floor deformation is a valuable asset in seismic and tsunami hazard assessment. However, it is imperative to refer to the model's inherent limitations and their potential impact on our findings. Primarily, the model's static nature and its reliance on a single linear fault plane geometry, coupled with its exclusion of material properties considerations, pose notable constraints. These constraints may result in an underestimation or overestimation of tsunami hazard levels, emphasizing the need for caution and further investigation when interpreting our results. To have better results for generation and potential estimation, we compiled and analyzed the tsunamites discovered along the Arabian Sea shorelines and took the case exhibiting the worst morphodynamics for modeling purposes. Subsequently, utilizing Okada's (1985) fault parameters, various tsunami wave scenarios are generated along the MSZ to find the capable one aligning with both field and laboratory readings of the tsunamite case taken up. As a result, our study provides a better tsunami wave potential estimation and an indirect approximation of potential fault parameters and earthquake potential, offering valuable insights into tsunami hazard assessment.
In tsunami hazard assessment, wave height is considered a yardstick, while wavelength tends to be overlooked. We assessed that for vulnerability and risk assessment, along with wave height, the wavelength must be taken into consideration. To illustrate this point, we conducted simulations involving two scenarios with identical wave heights of 5 m but differing wavelengths () of 15 and 3 km impacting the Pasni coast (see simulation 9 in the Supplement). The wave with the shorter wavelength dissipated faster without causing any inundation, whereas the longer wavelength resulted in considerable inundation, with a run-up height of 2 m and an inundation extent of 0.7 km. This disparity can be attributed to a smaller quantity of displaced water and wave dispersion phenomenon that disperses rapidly and diminishes in magnitude during propagation, confining the hazards to local areas only. Vertical seafloor deformation or coseismic displacement tends to result in tsunamis characterized by longer wavelengths and longer periods when compared to those generated by landslide failures, mainly because of the broader source area associated with coseismic displacement events (Hammack, 1973; Watts, 1998; Heidarzadeh et al., 2014).
The bare-ground elevation model represents a digital topography with no building infrastructure, plants, poles, etc. It is formally known as the digital terrain model (DTM). For inundation analysis, the deflection of DEM from DTM hampers the results in two aspects: (i) the porous infrastructure, such as houses and mangroves, does not account for water balance adjustments. These features in DEM act as solid bodies, occupying the volume and deflecting the inundating water further ahead, resulting in higher inundation extents. (ii) A low-resolution DEM, which could not resolve the streets or passages, results in water damming. It, consequently, results in higher flow depths downstream than the actual value, and it also affects the backwash computations. Along with improving the spatial resolution, a water absorption and permeability value may be incorporated into each feature in the land use map. It could account for volumetric crossflow though the structure adjustment of inundating water.
The effectiveness of the tsunami early warning system is assessed in terms of far-field and near-field sources particularly for the study area. An integrated Indian Ocean Tsunami Warning System (IOTWS) is developed within the framework of Intergovernmental Oceanographic Commission (IOC) under the UNESCO umbrella in response to the tragic tsunami on 26 December 2004. The near-field tsunami warning is issued based on the location, size, and initial evaluation of earthquake fault parameters through seismic spectral signatures. The Pakistan Meteorological Department (PMD) in collaboration with IOC IOTWS is responsible for keeping track of coastal hazards and issuance of tsunami notifications and warning alerts. For earthquakes of Mw≥6.5 in the Arabian Sea, a near-shore early warning system puts the coastal community immediately under an alert and watch status until confirmation of tsunami generation. The tsunami confirmation warning is issued once the tsunami wave is detected on any sensor or tide gauge which is installed either on the coast or at the DART station (Deep-ocean Assessment and Reporting of Tsunamis). In the study areas the tide gauges are installed at the Gwadar and Pasni ports and the nearest DART station 450 km from the MSZ. The numerical models show that the first tsunami wave generated at the eastern MSZ arrives at the Pasni coast (Pasni tide gauge) and the nearest DART station in 15 and 45 min, respectively. Heidarzadeh et al. (2007) calculated these timings as 15 and 60 min, respectively. If the tsunami had generated at the eastern MSZ, it would reach the Makran coast before its instrumental detection and confirmation warning. So, the coastal community will surpass the confirmation warning and therefore had to rely on the advisory (alert and watch) warning only. On the other hand, the confirmation warning system works very well for the far-source tsunamis as a number of gauges installed in the eastern Indian coast, in the Maldives, and at the multiple DART stations detect the propagating tsunami several hours before reaching the Makran coast (Srinivasa Kumar and Manneela, 2021). Further, three case studies from the Indian Ocean are presented for the assessment of general practices and timelines in terms of detection, warning, and confirmation. The timeline for the chain of events during each tsunami case is given in Table S2 in the Supplement.
Since the installation of IOTWS, the 2013 tsunami has been the only near-field tsunami generated in the Arabian Sea. It was triggered remotely by a terrestrial earthquake located near the city of Khuzdar, Pakistan. The tsunami waves remained almost unnoticed by the community due to the low wave heights and its occurrence at low tide. As it is thought to be triggered by an underwater landslide, the exact trigger time and location are not known. However, through reverse modeling the source position off the shore of Pakistan is estimated in between Gwadar and the MSZ (Hoffmann et al., 2014). Form this tsunami source, the waves would have reached the Gwadar coast within 5–20 min. The first advisory warning was issued 11 min after the earthquake, followed by a second warning confirming that there was no tsunami 16 min after the earthquake. The advisory warning confirmation was particularly issued on the basis of the epicenter being on the terrestrial (inland) part. The tsunami was first detected instrumentally 39 min after the earthquake at the Al Qurayyat tide gauge in Oman. Various other tide gauges also recorded the tsunami afterward. The DART station detected the tsunami wave 72 min after the earthquake. The fact that no further warning was issued may be due to the small scale of the tsunami. Regarding the far-field tsunami, we analyzed two cases: the 17 July 2006 Java and 25 October 2010 Mentawai, Indonesia, tsunamis. In both cases, the system worked very well in warning the far-field communities. However, in both cases the waves arrived on the nearest Indonesian coast before the issuance of the (first) advisory warning (details in Table S2). The tsunami confirmation warnings in both cases were issued 19 min after the earthquake at was registered by the international early warning system, where all local and regional warning systems are connected. These tsunamis took around 8 h to reach the Makran coast, providing enough time to inform and evacuate the community. Here, we emphasize the importance of alerts and watch awareness and preparedness for the communities residing close to the tsunami source. In some tsunami cases, natural signs such as receding water after an earthquake and a strong and unusual roaring sound may help serve as an early warning for coastal communities. Technically, the initial recording of coastline or the drawdown is due to the development of an initial wave trough along the coast. However, this may not always be the case because the trough development is subjected to source characteristics and the position of the tsunami source. The awareness coupled with training, route evacuation, and reaction during such disasters is also very important. The PMD also has a well-established cyclone early warning system which as been operating since the 1960s. Despite multiple early warnings issued to coastal communities (a couple of days earlier), the high number of fatalities and amount of property loss from the cyclones in 1998, 1999, 2007, 2010, and 2021 demonstrate dismal levels in terms of resilience and preparedness. Additionally, in case of a tsunami, the impact appears to be far worse.
Delft3D (Deltares, 2023) is an open-source software suite that facilitates hydrodynamic modeling, with its Delft3D-FLOW module being especially useful for tsunami modeling and sediment transport.
All historical documents and newspaper accounts that the paper refers to can be found at https://iotic.ioc-unesco.org/ (last access: 22 September 2021; UNESCO, 2021). The 12 m digital elevation model data is owned and protected by the German Aerospace Center. A terrain model of the global oceans and land is available at https://doi.org/10.5285/f98b053b-0cbc-6c23-e053-6c86abc0af7b (GEBCO Bathymetric Compilation Group 2023, 2023).
The supplement related to this article is available online at: https://doi.org/10.5194/nhess-24-3279-2024-supplement.
RH developed the idea, planned the methodology, interpreted the results, and then reached conclusions. KR supervised the whole process and provided technical, environmental, financial, and personal support for the research work. GH co-supervised the process. SA reviewed the literature.
The contact author has declared that none of the authors has any competing interests.
Publisher's note: Copernicus Publications remains neutral with regard to jurisdictional claims made in the text, published maps, institutional affiliations, or any other geographical representation in this paper. While Copernicus Publications makes every effort to include appropriate place names, the final responsibility lies with the authors.
This article is part of the special issue “Reducing the impacts of natural hazards through forecast-based action: from early warning to early action”. It is not associated with a conference.
We are grateful to the German Aerospace Center for providing the unprocessed digital elevation model data (TanDEM-X, 12 m DEM) for the inundation analysis.
This research has been supported by the Deutscher Akademischer Austauschdienst (Research Grants – Doctoral Programme, no. 57507871).
This open-access publication was funded by the RWTH Aachen University.
This paper was edited by Marc van den Homberg and reviewed by two anonymous referees.
Ahmed, M., Lodi, S. H., and Rafi, M. M.: Probabilistic seismic hazard analysis based zoning map of Pakistan, J. Earthq. Eng., 26, 271–306, https://doi.org/10.1080/13632469.2019.1684401, 2019.
Banghar, A. and Syke, L. R.: Focal mechanism of an earthquake from the Southern Ocean, Tectonophysics, 79, 37–41, 1981.
Behrens, J., Løvholt, F., Jalayer, F., Lorito, S., Salgado-Gálvez, M. A., Sørensen, M., Abadie, S., Aguirre-Ayerbe, I., Aniel-Quiroga, I., Babeyko, A., Baiguera, M., Basili, R., Belliazzi, S., Grezio, A., Johnson, K., Murphy, S., Paris, R., Rafliana, I., De Risi, R., Rossetto, T., Selva, J., Taroni, M., Del Zoppo, M., Armigliato, A., Bureš, V., Cech, P., Cecioni, C., Christodoulides, P., Davies, G., Dias, F., Bayraktar, H. B., González, M., Gritsevich, M., Guillas, S., Harbitz, C. B., Kânoglu, U., Macías, J., Papadopoulos, G. A., Polet, J., Romano, F., Salamon, A., Scala, A., Stepinac, M., Tappin, D. R., Thio, H. K., Tonini, R., Triantafyllou, I., Ulrich, T., Varini, E., Volpe, M., and Vyhmeister, E.: Probabilistic Tsunami Hazard and Risk Analysis: A Review of Research Gaps, Front. Earth Sci., 9, 1–28, https://doi.org/10.3389/feart.2021.628772, 2021.
Brune, J. N.: Seismic moment, seismicity, and rate of slip along Major fault zones, J. Geophys. Res., 73, 777–784, 1968.
Byrne, D. E., Sykes, L. R., and Davis, D. M.: Great thrust earthquakes and aseismic slip along the plate boundary of the Makran Subduction Zone, J. Geophys. Res., 97, 449–478, https://doi.org/10.1029/91JB02165, 1992.
Chacón-Barrantes, S., Narayanan, R. R. A., and Mayerle, R.: Several Tsunami scenarios at the North Sea and their consequences at the German Bight, Science of tsunami hazards, 32, 8–28, https://oceanrep.geomar.de/id/eprint/35280/ (last access: 22 June 2022), 2013.
Deltares: Delft3d-Flow; simulation of multi-dimensional hydrodynamic flows and transport phenomena, including sediments, 1–725, https://content.oss.deltares.nl/delft3d4/Delft3D-FLOW_User_Manual.pdf (last access: 11 August 2023), 2023.
El-Hussain, I., Omira, R., Deif, A., Al-Habsi, Z., Al-Rawas, G., Mohamad, A., Al-Jabri, K., and Baptista, M. A.: Probabilistic tsunami hazard assessment along Oman coast from submarine earthquakes in the Makran subduction zone, Arab. J. Geosci., 9, 668, https://doi.org/10.1007/s12517-016-2687-0, 2016.
GEBCO Bathymetric Compilation Group 2023: The GEBCO_2023 Grid – a continuous terrain model of the global oceans and land, NERC EDS British Oceanographic Data Centre NOC [data set], https://doi.org/10.5285/f98b053b-0cbc-6c23-e053-6c86abc0af7b, 2023.
Gelfenbaum, G., Vatvani, D., Jaffe, B., and Dekker, F.: Tsunami inundation and sediment transport in vicinity of coastal mangrove forest, Coast. Sediments '07 – Proc. 6th Int. Symp. Coast. Eng. Sci. Coast. Sediment Process., 1–12, https://doi.org/10.1061/40926(239)86, 2007.
Haider, R., Ali, S., Hoffmann, G., and Reicherter, K.: A multi-proxy approach to assess tsunami hazard with a preliminary risk assessment: A case study of the Makran Coast, Pakistan, Mar. Geol., 459, 107032, https://doi.org/10.1016/j.margeo.2023.107032, 2023.
Hammack, J. L.: A note on tsunamis: Their generation and propagation in an ocean of uniform depth, J. Fluid Mech., 60, 769–799, https://doi.org/10.1017/S0022112073000479, 1973.
Hanks, T. C. and Kanamori, H.: A moment magnitude scale, J. Geophys. Res.-Sol. Ea., 84, 2348–2350, https://doi.org/10.1029/JB084iB05p02348, 1979.
Harbitz, C. B., Løvholt, F., and Bungum, H.: Submarine landslide tsunamis: How extreme and how likely?, Nat. Hazards, 72, 1341–1374, https://doi.org/10.1007/s11069-013-0681-3, 2014.
Heidarzadeh, M. and Satake, K.: Possible sources of the tsunami observed in the northwestern Indian ocean following the 2013 September 24 Mw 7.7 Pakistan inland earthquake, Geophys. J. Int., 199, 752–766, https://doi.org/10.1093/gji/ggu297, 2014.
Heidarzadeh, M., Pirooz, M. D., Zaker, N. H., and Mokhtari, M.: Modeling of tsunami propagation in the vicinity of the southern coasts of Iran, Int. J. Civ. Eng., 5, 223–234, https://doi.org/10.1115/OMAE2007-29082, 2007.
Heidarzadeh, M., Krastel, S., and Yalciner, A. C.: The state-of-the-art numerical tools for modeling landslide tsunamis: a short review, in Submarine mass movements and their consequences, 6th international symposium, pp. 483–495, Springer, 2014.
Hoffmann, G., Reicherter, K., Wiatr, T., Grützner, C., and Rausch, T.: Block and boulder accumulations along the coastline between Fins and Sur (Sultanate of Oman): Tsunamigenic remains?, Nat. Hazards, 65, 851–873, https://doi.org/10.1007/s11069-012-0399-7, 2013a.
Hoffmann, G., Rupprechter, M., Balushi, N. Al, Grützner, C., and Reicherter, K.: The impact of the 1945 Makran tsunami along the coastlines of the Arabian Sea (Northern Indian Ocean) – a review, Zeitschrift für Geomorphol. Suppl. Issues, 57, 257–277, https://doi.org/10.1127/0372-8854/2013/s-00134, 2013b.
Hoffmann, G., Al-Yahyai, S., Naeem, G., Kociok, M., and Grützner, C.: An Indian Ocean tsunami triggered remotely by an onshore earthquake in Balochistan, Pakistan, Geology, 42, 883–886, https://doi.org/10.1130/G35756.1, 2014.
Hoffmann, G., Grützner, C., Schneider, B., Preusser, F., and Reicherter, K.: Large Holocene tsunamis in the northern Arabian Sea, Mar. Geol., 419, 106068, https://doi.org/10.1016/j.margeo.2019.106068, 2020.
Jade, S., Shrungeshwara, T. S., Kumar, K., Choudhury, P., Dumka, R. K., and Bhu, H.: India plate angular velocity and contemporary deformation rates from continuous GPS measurements from 1996 to 2015, Sci. Rep., 7, 1–16, https://doi.org/10.1038/s41598-017-11697-w, 2017.
Khaledzadeh, M. and Ghods, A.: Estimation of size of megathrust zone in the Makran subduction system by thermal modelling, Geophys. J. Int., 228, 1530–1540, https://doi.org/10.1093/gji/ggab417, 2022.
Khan, M. A., Bendick, R., Bhat, M. I., Bilham, R., Kakar, D. M., Khan, S. F., Lodi, S. H., Qazi, M. S., Singh, B., Szeliga, W., and Wahab, A.: Preliminary geodetic constraints on plate boundary deformation on the western edge of the Indian plate from TriGGnet (Tri-University GPS Geodesy Network), J. Himal. Earth Sci., 41, 71–87, 2008.
Koshimura, S., Oie, T., Yanagisawa, H., and Imamura, F.: Developing fragility functions for tsunami damage estimation using numerical model and post-tsunami data from banda aceh, Indonesia, Coast. Eng. J., 51, 243–273, https://doi.org/10.1142/S0578563409002004, 2009.
Koster, B., Hoffmann, G., Grützner, C., and Reicherter, K.: Ground penetrating radar facies of inferred tsunami deposits on the shores of the Arabian Sea (Northern Indian Ocean), Mar. Geol., 351, 13–24, https://doi.org/10.1016/j.margeo.2014.03.002, 2014.
Kukowski, N., Schillhorn, T., Flueh, E. R., and Huhn, K.: Newly identified strike-slip plate boundary in the northeastern Arabian Sea, Geology, 28, 355–358, https://doi.org/10.1130/0091-7613(2000)28<355:NISPBI>2.0.CO;2, 2000.
Løvholt, F.: Tsunami Hazard and Risk Assessment, United Nations Off. Disaster Risk Reduct., 1–9, https://www.unisdr.org/we/inform/publications/57441 (last access: 27 September 2023), 2017.
Macintosh, A.: Coastal climate hazards and urban planning: how planning responses can lead to maladaptation, Mitigation and Adaptation Strategies for Global Change, 18, 1035–1055, https://doi.org/10.1007/s11027-012-9406-2, 2013.
Okada, Y.: Surface deformation due to shear and tensile faults in a half space, B. Seismol. Soc. Am., 75, 1135–1154, https://doi.org/10.1785/bssa0820021018, 1985.
Park, S., van de Lindt, J. W., Cox, D., and Gupta, R.: Concept of Community Fragilities for Tsunami Coastal Inundation Studies, Nat. Hazards Rev., 14, 220–228, https://doi.org/10.1061/(asce)nh.1527-6996.0000092, 2013.
Pendse, C. G.: The Mekran Earthquake of the 28th November 1945, Sci. Notes, X, 141–146, 1946.
Rehman, K. and Cho, Y. S.: Building damage assessment using scenario based tsunami numerical analysis and fragility curves, Water (Switzerland), 8, 109, https://doi.org/10.3390/w8030109, 2016.
Reilinger, R., McClusky, S., Vernant, P., Lawrence, S., Ergintav, S., Cakmak, R., Ozener, H., Kadirov, F., Guliev, I., Stepanyan, R., Nadariya, M., Hahubia, G., Mahmoud, S., Sakr, K., ArRajehi, A., Paradissis, D., Al-Aydrus, A., Prilepin, M., Guseva, T., Evren, E., Dmitrotsa, A., Filikov, S. V., Gomez, F., Al-Ghazzi, R., and Karam, G.: GPS constraints on continental deformation in the Africa-Arabia-Eurasia continental collision zone and implications for the dynamics of plate interactions, J. Geophys. Res.-Sol. Ea., 111, 1–26, https://doi.org/10.1029/2005JB004051, 2006.
Röbke, B. R., Schüttrumpf, H., and Vött, A.: Effects of different boundary conditions and palaeotopographies on the onshore response of tsunamis in a numerical model – A case study from western Greece, Cont. Shelf Res., 124, 182–199, https://doi.org/10.1016/j.csr.2016.04.010, 2016.
Röbke, B. R., Schüttrumpf, H., and Vött, A.: Hydro- and morphodynamic tsunami simulations for the ambrakian gulf (Greece) and comparison with geoscientific field traces, Geophys. J. Int., 213, 317–339, https://doi.org/10.1093/gji/ggx553, 2018.
Rodriguez, M., Fournier, M., Chamot-Rooke, N., Huchon, P., Bourget, J., Sorbier, M., Zaragosi, S., and Rabaute, A.: Neotectonics of the Owen Fracture Zone (NW Indian Ocean): Structural evolution of an oceanic strike-slip plate boundary, Geochem. Geophys. Geosyst., 12, https://doi.org/10.1029/2011GC003731, 2011.
Smith, G. L., McNeill, L., Henstock, I. J., and Bull, J.: The structure and fault activity of the Makran accretionary prism, J. Geophys. Res., 117, 1–17, https://doi.org/10.1029/2012JB009312, 2012.
Srinivasa Kumar, T. and Manneela, S.: A Review of the Progress, Challenges and Future Trends in Tsunami Early Warning Systems, J. Geol. Soc. India, 97, 1533–1544, https://doi.org/10.1007/s12594-021-1910-0, 2021.
Sujatmiko, K. A., Ichii, K., Murata, S., and Mulia, I. E.: Application of Stress Parameter from Liquefaction Analysis on the Landslide Induced Tsunami Simulation: A Case Study of the 2018 Palu Tsunami, J. Disaster Res., 18, 199–208, https://doi.org/10.20965/jdr.2023.p0199, 2023.
Tarbotton, C., Dall'Osso, F., Dominey-Howes, D., and Goff, J.: The use of empirical vulnerability functions to assess the response of buildings to tsunami impact: Comparative review and summary of best practice, Earth-Sci. Rev., 142, 120–134, https://doi.org/10.1016/j.earscirev.2015.01.002, 2015.
UNESCO: Indian Ocean, UNESCO [data set], https://iotic.ioc-unesco.org/, last access: 22 September 2021.
Van Ormondt, M., Nederhoff, K., and Van Dongeren, A.: Delft Dashboard: A quick set-up tool for hydrodynamic models, J. Hydroinformatics, 22, 510–527, https://doi.org/10.2166/hydro.2020.092, 2020.
Vernant, P., Nilforoushan, F., Hatzfeld, D., Abbassi, M. R., Vigny, C., Masson, F., Nankali, H., Martinod, J., Ashtiani, A., Bayer, R., Tavakoli, F., and Chéry, J.: Present-day crustal deformation and plate kinematics in the Middle East constrained by GPS measurements in Iran and northern Oman, Geophys. J. Int., 157, 381–398, https://doi.org/10.1111/j.1365-246X.2004.02222.x, 2004.
Watts, P.: Wavemaker Curves for Tsunamis Generated by Underwater Landslides, J. Waterw. Port, Coastal, Ocean Eng., 124, 127–137, https://doi.org/10.1061/(asce)0733-950x(1998)124:3(127), 1998.
Zaccagnino, D., Telesca, L., and Doglioni, C.: Scaling properties of seismicity and faulting, Earth Planet. Sc. Lett., 584, 117511, https://doi.org/10.1016/j.epsl.2022.117511, 2022.
- Abstract
- Introduction
- Tectonic settings and associated seismicity
- Methods
- Results and interpretations
- Discussion and conclusions
- Code availability
- Data availability
- Author contributions
- Competing interests
- Disclaimer
- Special issue statement
- Acknowledgements
- Financial support
- Review statement
- References
- Supplement