the Creative Commons Attribution 4.0 License.
the Creative Commons Attribution 4.0 License.
 | 04 Sep 2024
Precursors and pathways: dynamically informed extreme event forecasting demonstrated on the historic Emilia-Romagna 2023 flood
Joshua Dorrington
Marta Wenta
Federico Grazzini
Linus Magnusson
Frederic Vitart
Christian M. Grams
The ever-increasing complexity and data volumes of numerical weather prediction demand innovations in the analysis and synthesis of operational forecast data. Here we show how dynamical thinking can offer directly applicable forecast information, taking as a case study the extreme northern Italy flooding of May 2023. We compare this event with long-lasting historical northern Italy rainfall events in order to determine (a) why it was so extreme, (b) how well it was predicted, and (c) how we may improve our predictions of such extremes. Lagrangian analysis shows, in line with previous work, that 48-hourly extreme rainfall in Italy can be caused by moist air masses originating from the North Atlantic; North Africa; and, to a lesser extent, eastern Europe, with compounding moisture contributions from all three regions driving the May 2023 event. We identify the large-scale precursors of typical northern Italy rainfall extremes based on geopotential height and integrated vapour transport fields. We show in European Centre for Medium-Range Weather Forecasts (ECMWF) operational forecasts that a precursor perspective was able to identify the growing possibility of the Emilia-Romagna extreme event 8 d beforehand – 4 d earlier than the direct precipitation forecast. Such dynamical precursors prove to be well suited for identifying and interpreting predictability barriers and could help build forecasters' understanding of unfolding extreme scenarios in the medium range. We conclude by discussing the broader implications and operational potential of dynamically rooted metrics for understanding and predicting extreme events, both in retrospect and in real time.
- Article
(12627 KB) - Full-text XML
-
Supplement
(20567 KB) - BibTeX
- EndNote


In the spring of 2023, sustained heavy rainfall in northern Italy led to extensive flooding. Following earlier heavy rainfall between 1–3 May, a second, 40 h period of extreme precipitation in Emilia-Romagna between 15–17 May caused more than 65 000 landslides (Brath, 2023) and breached rivers in 23 separate points, flooding 540 km2 of lowland. Despite timely meteo-hydrological “red” warnings issued 48 h ahead – which triggered school closures and cancellation of transport – 16 casualties were unfortunately reported, as were over EUR 9 billion of damages (ARPAE, 2023; AST, 2023). The severity of the 15–17 May rainfall (hereafter the “case study event”) was unprecedented in the 102-year instrumental history of Romagna. While the compound nature of the event – amplified by the pre-saturated soils from the 1–3 May rainfall – complicates assessment of return times, estimates range from 60 years to more than 500 years for individual basins (Brath, 2023) and 200 years for the 1–18 May period which envelops both events (Barnes et al., 2023).
Current numerical weather predictions are generally able to make deterministic predictions of significant rainfall occurrence 1–3 d ahead, with an accurate prediction of intensity (relative to a model climate) perhaps 24 h ahead (Haiden and Janousek, 2023). Skilful probabilistic predictions of rainfall occurrence rarely exceed a week ahead (Gascón et al., 2023; Leon, 2023). The case study event was therefore typical in this respect, despite its extreme nature, with skilful predictions of event occurrence approximately 3 d ahead in the European Centre for Medium-Range Weather Forecasts (ECMWF) forecast (shown in Sect. 6). However, as early as 8 May – 8 d before the event – several of the authors of this study received early signs that such an extreme northern Italy rainfall event may occur, when no extreme signal was yet visible in precipitation forecasts. This signal came from an experimental monitoring of the large-scale circulation patterns that often lead to extreme rainfall events in different European regions within the ECMWF forecast, following an approach recently described in Dorrington et al. (2023).
In this paper, we use this recent case study event as a demonstrative example to discuss how and why such early signs of extreme events can be identified, and we use Lagrangian trajectory analysis to delve deeper into the moisture sources and smaller-scale dynamical drivers of northern Italy extreme precipitation, with reference to a climatology of such springtime precipitation extremes. We also show that precursors can be used to understand predictability barriers in a simple way, amenable to operational use. In doing so we aim to demonstrate the potential insights and practical predictive value that dynamically based perspectives can add to the toolbox of forecasters and to researchers of predictability and extreme events.
The specific lead times at which European rainfall can be accurately forecast vary between regions, seasons, and individual events, with mesoscale and convectively driven rainfall being less predictable than frontal systems (Keil et al., 2014; Grazzini et al., 2021). Our focus here is on larger-scale organised rainfall events with multi-day persistence. However, in the mid-latitudes, even mesoscale rainfall events are conditioned on the surrounding larger-scale circulation, with their occurrence encouraged or suppressed by Rossby wave activity, blocking events, and jet dynamics on the scale of thousands of kilometres. These large-scale “precursors” are more predictable than the rainfall itself, and their modulating effect on rainfall is not always well captured in models due to deficiencies in boundary layer processes (Haiden et al., 2018), orographic representation (Lavers et al., 2021), and precipitation parameterisations (Hermoso et al., 2021). Dorrington et al. (2023) recently showed in reanalysis data that national-scale extreme rainfall events can be predicted to at least some degree across Europe in all seasons by monitoring their typical large-scale flow characteristics at timescales of 3–6 d ahead. In a numerical forecasting context, this should be thought of as a possible “boost” of skill – if large-scale precursors can be predicted skilfully at day 5, then the resulting impact on rainfall may be improved out to days 8–11, as has recently been shown in Grazzini et al. (2024). In addition to the possibility of quantitative skill improvements, there is also narrative value in analysing precursor activity, which could help the operational forecaster understand the physical basis of emerging forecast scenarios and so better leverage their experience and intuition.
We briefly summarise the key dynamics of northern Italy rainfall in Sect. 2, introduce data and methodology in Sect. 3, discuss the climatology of springtime northern Italy extreme rainfall in Sect. 4, analyse the dynamics of the case study event in Sect. 5, and finally discuss forecast early warning and predictability barriers in Sect. 6. We conclude in Sect. 7 by summarising our findings and discussing the broader relevance of our results to extreme event prediction and present ideas for how to operationalise dynamical knowledge.
On the largest scales, a Rossby wave-dominated upper-level flow over the Euro-Atlantic and eastward-propagating Rossby wave packets originating from North America increase the probability of extreme rainfall in northern Italy in the following days (Grazzini et al., 2021). This is directly due to the development of an upper-level trough over the western Mediterranean favoured by wavy upstream flows, which drive strong southerly flow into northern Italy (e.g. Martius et al., 2008; Massacand and Wernli, 1998; Raveh-Rubin and Wernli, 2015). Grazzini et al. (2020) established elevated integrated water vapour transport magnitude (IVTmag) as a further key driver of heavy precipitation in the region.
However, large-scale features only set the stage for an extreme event, and smaller synoptic-scale and mesoscale processes are responsible for directly causing convection. The presence of an upper-level trough supports the transport of warm, southerly airflow across the western Mediterranean Basin (Martius et al., 2008; Massacand and Wernli, 1998), fuelling the development of warm conveyor belts. These ascending air masses are associated with Mediterranean cyclogenesis (Raveh-Rubin and Wernli, 2015; Dayan et al., 2015). In springtime the increased meridional temperature gradient along North Africa's coast and weak static stability near the Atlas Mountains particularly favour the formation of cyclones over North Africa (Trigo et al., 2002). These cyclonic systems interact with the steep orography of northern Italy, which can induce or intensify convection both through uplift and through forced convergence of the low-level wind (Khodayar et al., 2021). The combination of orographic forcing and a favourable large-scale flow (i.e. providing a persistent inflow of moist air) can also lead to the development of quasi-stationary mesoscale convective systems, which can further lead to extreme and highly localised precipitation (Miglietta and Davolio, 2022). The predictability of and observational constraints on these small-scale dynamics are generally poor and are the reason for the fundamentally probabilistic relation between the large-scale flow and the occurrence of precipitation.
In most cases, heavy precipitation events in the Mediterranean are preceded by high local moisture anomalies over the Mediterranean Sea (Raveh-Rubin and Wernli, 2015). Moisture uptake typically occurs within 2 d before a precipitation event but in some cases can involve remote (e.g. North Atlantic) moisture sources at timescales of 5 to 10 d. Studies using Lagrangian moisture diagnostics reveal the Mediterranean Sea surface and region as critical moisture contributors to the extreme rainfall events in the western part of the basin (Flaounas et al., 2019; Gangoiti et al., 2011). In a comprehensive 5-year study, Drumond et al. (2011) identified the Mediterranean Basin as the central moisture region influencing extreme rainfall on the Italian Peninsula. Winschall et al. (2014) further expanded on this, finding that the Mediterranean Sea's surface is one of several important moisture sources for extreme rainfall events in the north-western Mediterranean Basin, and additional sources are frequently required to intensify these events to extreme levels. These additional moisture sources, as described in studies such as Flaounas et al. (2019) and Gangoiti et al. (2011), appear to have a regional, mostly Mediterranean Basin origin. Duffourg and Ducrocq (2011) note a flow dependence, with local Mediterranean moisture sources being the predominant driver of extreme rainfall during upstream anticyclonic conditions.
In order to study both the large-scale and the synoptic-scale factors that led to the case study event, we use flow precursors and Lagrangian trajectory diagnostics. We identify the sources of the moisture that contributed to the rainfall and why case study precipitation totals were so high, the role the large-scale flow played in supporting and conditioning the event, and the added value provided by large-scale precursors over the direct precipitation forecast.
3.1 Data
ERA5 reanalysis (Hersbach et al., 2020) is used over the 1979–2021 period (for climatological calculations) and May 2023 (for case study analysis) to study the large-scale flow associated with extreme rainfall events in Italy. For precursor analysis, geopotential height at 500 hPa (Z500), surface pressure (SP), zonal and meridional 850 hPa wind (), and the magnitude of vertically integrated water vapour transport (IVTmag) were all used at 12-hourly 1° resolution. ERA5 total precipitation was downloaded at 0.25°. When anomalies are plotted, the fields have been deseasonalised using a day-of-year seasonal cycle smoothed with a 30 d running mean. For the calculation of Lagrangian trajectories (Sect. 3.3), we use the full three-dimensional fields of ERA5 on model levels interpolated on a horizontal latitude–longitude grid with 0.5° × 0.5° resolution and at 3-hourly temporal resolution (also in the 1979–2021 period for climatological calculations and May 2023 for the case study). In order to more confidently identify the exact times and locations of the most intense rainfall during the May 2023 Emilia-Romagna case, we use half-hourly IMERG data, an integration of multi-satellite rainfall observations, at 0.1° resolution (Huffman et al., 2019) and ARCIS gridded high-resolution rain gauge data (Pavan et al., 2019). To study predictability, we analyse the evolution of the May 2023 case study in 100-member ECMWF extended-range forecasts from the model cycle 48r1 (Haiden and Janousek, 2023), which was running daily in pre-operational mode at the time. We consider starting dates between 5 and 16 May and download total precipitation, Z500, and IVTmag fields at 0.5°, sampled down from the native horizontal resolution of ≈ 36 km. In order to compute precursor indices in forecast data (see below), we compute deseasonalised Z500 and IVTmag anomalies by removing a centred 3-week lead-time-dependent climatology, computed using 11-member hindcasts covering the 2003–2022 period from the same model cycle.
3.2 Rainfall precursor indices
Precursors of heavy rainfall events in northern Italy are identified by accurately following the method recently presented in Sect. 3.3 of Dorrington et al. (2023), which we now summarise. We begin by defining a Boolean time series of heavy rainfall events. This is done by spatially averaging MAM 48-hourly total precipitation from ERA5 over the domain of northern Italy (mask shown in Fig. S1 in the Supplement) and defining an event as a day with rainfall exceeding the 90th percentile of this domain average (≈ 8.5 mm d−1). We then compute lagged anomaly composites of deseasonalised large-scale field anomalies in the days preceding these heavy rainfall events. These composites are masked to focus on the regions of key activity: grid point anomalies that are statistically insignificant (p > 0.05) or have a magnitude the grid point climatological standard deviation are masked. Groups of unmasked grid points that comprise a connected area of less than 250 000 km2 (i.e. equivalent to 20 1×1° equatorial grid points) were also masked. Finally, all unmasked grid points were convolved with a five-point lat–long square: all grid points within 2° of an unmasked grid point were unmasked. This process produces smooth, large-scale statistically robust patterns that are associated with increasing the likelihood of extreme rainfall. Finally, these patterns are used to produce precursor indices: each pattern is projected onto the corresponding large-scale deseasonalised anomaly field to produce a scalar index, which is standardised, by subtracting the mean and dividing by the standard deviation, both estimated based on a 1979–2021 MAM ERA5 climatology. Positive index values indicate increased likelihood of an extreme, while negative values indicate decreased likelihood. To produce IFS forecasts of precursor activity, the deseasonalised forecast fields are projected onto the corresponding ERA5 precursor patterns and approximately standardised using the ERA5 index mean and standard deviation.
3.3 Lagrangian analysis
We use the LAGRANTO (Sprenger and Wernli, 2015) analysis tool to derive kinematic Lagrangian trajectories based on three-dimensional winds from the ERA5 dataset (Hersbach et al., 2020) of higher temporal and horizontal resolution. The positions of these trajectories are updated every 3 h, and along these trajectories, we trace parameters such as pressure height (p), temperature (T), specific humidity (Q), relative humidity (RH), potential temperature (θ), surface latent heat flux (SLHF), surface sensible heat flux (SSHF), 2 m air temperature (T2M), and underlying sea surface temperature (SST) and boundary layer height (BLH).
For our designated study region in northern Italy, the starting points of trajectories are identified using the methodology of Sodemann et al. (2008). We establish an equidistant grid of 50×50 km, framed by latitudes 42 to 47° N and longitudes 7 to 15° E (see Fig. S1). On the vertical scale, these points range from 1000 to 480 hPa, with intervals set by Δp=25 hPa, considering only starting points that have a relative humidity exceeding 80 % and that are over land. Trajectories are initiated every 3 h, starting from a specified time of an extreme rainfall event and extending 48 h backward. Each trajectory is run for a duration of 240 h backward and 12 h forward from its starting point, defined as time 0.
Based on the characteristics and directions of the trajectories, they are classified into the following distinct categories:
-
North African “low” trajectories (NAlow). These trajectories travel south of latitude 36° N within 168 h (7 d) before their initiation, and, when positioned there, they consistently register a pressure exceeding 800 hPa.
-
North African “up” trajectories (NAup). Similar to NAlow, these are located south of latitude 36° N within −168 h (7 d) preceding their initiation. Upon reaching this latitude, they register a pressure lower than 800 hPa. Considering that these trajectories represent only a small fraction of all started trajectories (∼ 5.4 %) and do not contribute significantly to precipitation in any of the analysed events, they have been excluded from further analysis.
-
East trajectories (EAST). This group includes trajectories that, −120 h (−5 d) before arrival in the starting region, are located east of longitude 15° E. It excludes trajectories classified as NAlow or NAup.
-
West trajectories (WEST). This category encompasses all trajectories that, −120 h (−5 d) before arrival in the starting region, are located west of longitude 15° E and are not classified as EAST, NAlow, or NAup.
On average, 0.13 % of trajectories do not fit into any of the categories described above. We consider data from 5 d prior for the identification of EAST and WEST trajectories and 7 d prior for NA trajectories. This approach is taken because NA trajectories typically remain in the Mediterranean region for up to 7 d after leaving North Africa and before contributing to rainfall. A shorter 5 d period was selected for analysing EAST and WEST trajectories because our analysis revealed that a 7 d threshold results in the mixing of EAST and WEST trajectories. This longer period is sufficient for trajectories to circumnavigate the globe, leading to potential overlap between the EAST and WEST categories.
3.3.1 Identification of moisture origins and loss
The origins of moisture are identified following the methodology of Sodemann et al. (2008), which has been widely adopted (e.g. Papritz et al., 2021; Xin et al., 2022; Jullien et al., 2020; Aemisegger and Papritz, 2018; Winschall et al., 2014). In this technique, moisture uptakes (i.e. specific humidity gains) along a given trajectory are defined as any 3-hourly specific humidity increment exceeding 0.02 g kg−1 (). Each such uptake is allocated a relative weight based on the subsequent humidity shifts within that trajectory. Thus, the overall influence of each uptake is re-calibrated by taking into account any precipitation events and subsequent uptakes it encounters.
Overall, our analysis indicates that the method used for identifying moisture uptakes explains about 80 % of the moisture content within the studied trajectories. The remaining 20 % may be attributed to processes occurring above the boundary layer, such as advection, horizontal turbulent mixing, or the evaporation of precipitation.
Similarly, moisture losses (i.e. specific humidity losses) along a trajectory are defined as negative 3-hourly specific humidity tendencies (). Following the approach of Sodemann et al. (2008), we determine that a negative specific humidity tendency indicates precipitation. We consider only the losses of moisture that occurred within the starting region of trajectories in northern Italy (42 to 47° N and 7 to 15° E) and within the preceding 48 h from the trajectory start.
4.1 Moisture sources of extreme rainfall
We begin by characterising the dynamics of MAM rainfall extremes in northern Italy from a Lagrangian perspective, identifying the sources of moisture and the properties of the contributing moist air masses in the preceding 10 d. We consider the 100 MAM events with the highest 48 h rainfall accumulations over northern Italy as identified in ERA5 between 1979–2021. We then discard 34 events that occur within 24 h of another, stronger event, leaving 66 independent 2 d rainfall extremes. These are then a subset of the upper-decile rainfall events used for defining precursor patterns, which benefit from a larger number of samples.
Considering the trajectories of precipitating air masses over our climatology, we identify three distinct pathways, shown in Fig. 1a. Defined quantitatively in Sect. 3.3, these pathways include trajectories passing over North Africa in the lower troposphere (NAlow), those originating east of the starting region (EAST), and those coming directly from the North Atlantic (WEST). Each pathway is unique, ensuring that trajectories classified in one category are not found in the others.
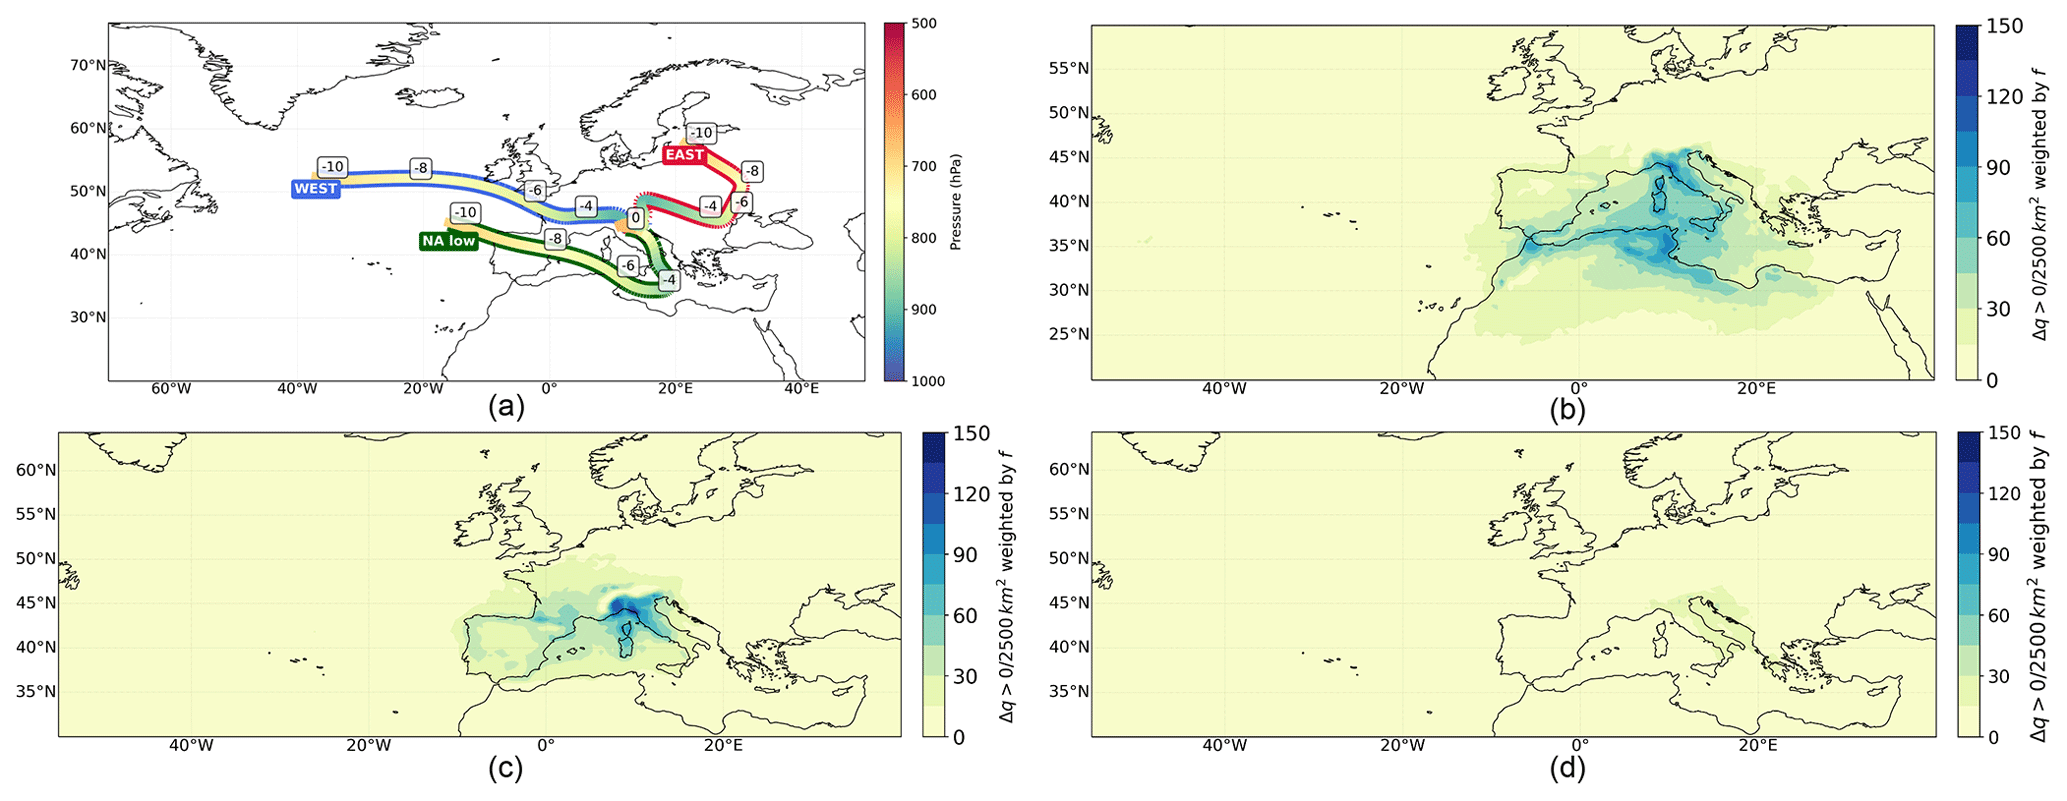
Figure 1(a) Location and altitude of Lagrangian trajectories that contribute to MAM rainfall in northern Italy between 1979–2021, averaged over each pathway. Time prior to rainfall is indicated in days. The number of uptakes per 2500 km2 () weighted by the contribution of uptake to total moisture content before precipitation (f) is shown for (b) NAlow trajectories, (c) WEST trajectories, and (d) EAST trajectories.
The sources of moisture uptakes for all the identified air mass pathways include both land and marine regions and are all relatively local, in agreement with Winschall et al. (2014). Individual moisture uptake locations are weighted by their contribution to total moisture content prior to precipitation (f), ensuring that uptake density remains unaffected by the density of trajectories (Fig. 1). NAlow trajectories primarily source moisture from the coastal areas of North Africa and the central Mediterranean, with additional, smaller moisture contributions from the Iberian Peninsula and Italy (Fig. 1b). The moisture uptake region for these trajectories is widespread, with the densest uptakes occurring along the Tunisian coast and Tyrrhenian Sea. WEST trajectories also gather a significant amount of moisture from the Mediterranean Sea's surface. However, northern Italy itself proves to be the most significant uptake region, highlighting the significance of local moisture recirculation in contributing to extreme rainfall events along this pathway. Additional non-local land sources of lower significance for WEST trajectories include the Iberian Peninsula and south-western France (Fig. 1c). EAST trajectories (Fig. 1d) have comparatively low moisture uptakes, as they contribute less rainfall overall to the analysed events. The majority of moisture carried by these air masses is sourced from the Adriatic Sea and the coasts of eastern Italy and Croatia.
Since the Mediterranean Sea has experienced an exceptionally long marine heatwave event starting in 2022 and lasting throughout 2023 (Marullo et al., 2023), coinciding with our case study, we considered whether SST anomalies systematically increase moisture uptake intensity. While the majority of moisture uptakes do occur over the ocean, the correlation between low-level moisture uptakes and underlying SST anomalies in MAM is in fact fairly weak (see Fig. S2), suggesting SSTs are not necessarily a source of predictive skill for rainfall. What can be inferred from these results is that the most intensive uptakes for all identified pathways occur over warmer waters (290–295 K), indicating that SSTs set an upper bound on uptake strength but do not guarantee strong uptake in isolation. Of course it is likely that SST anomalies may be more predictive during the warmer ocean periods, JJA and SON (Sanchez et al., 2023).
NAlow trajectories contribute the greatest fraction of precipitation, followed by WEST trajectories (Fig. 2). As demonstrated later, these pathways can be broadly linked to cyclogenesis in the lee of the Atlas Mountains or Alps, respectively. In contrast, and as mentioned before, the EAST trajectories generally play a minor role in northern Italy's extreme rainfall events but contribute substantially in a few cases – including the case study event. The rainfall totals assigned to each pathway for each event are essentially uncorrelated (corr < 0.1 in all cases), indicating that these spatially separated trajectories are also dynamically independent: the presence of moist air masses from one source does not support or suppress moisture influx from another source.
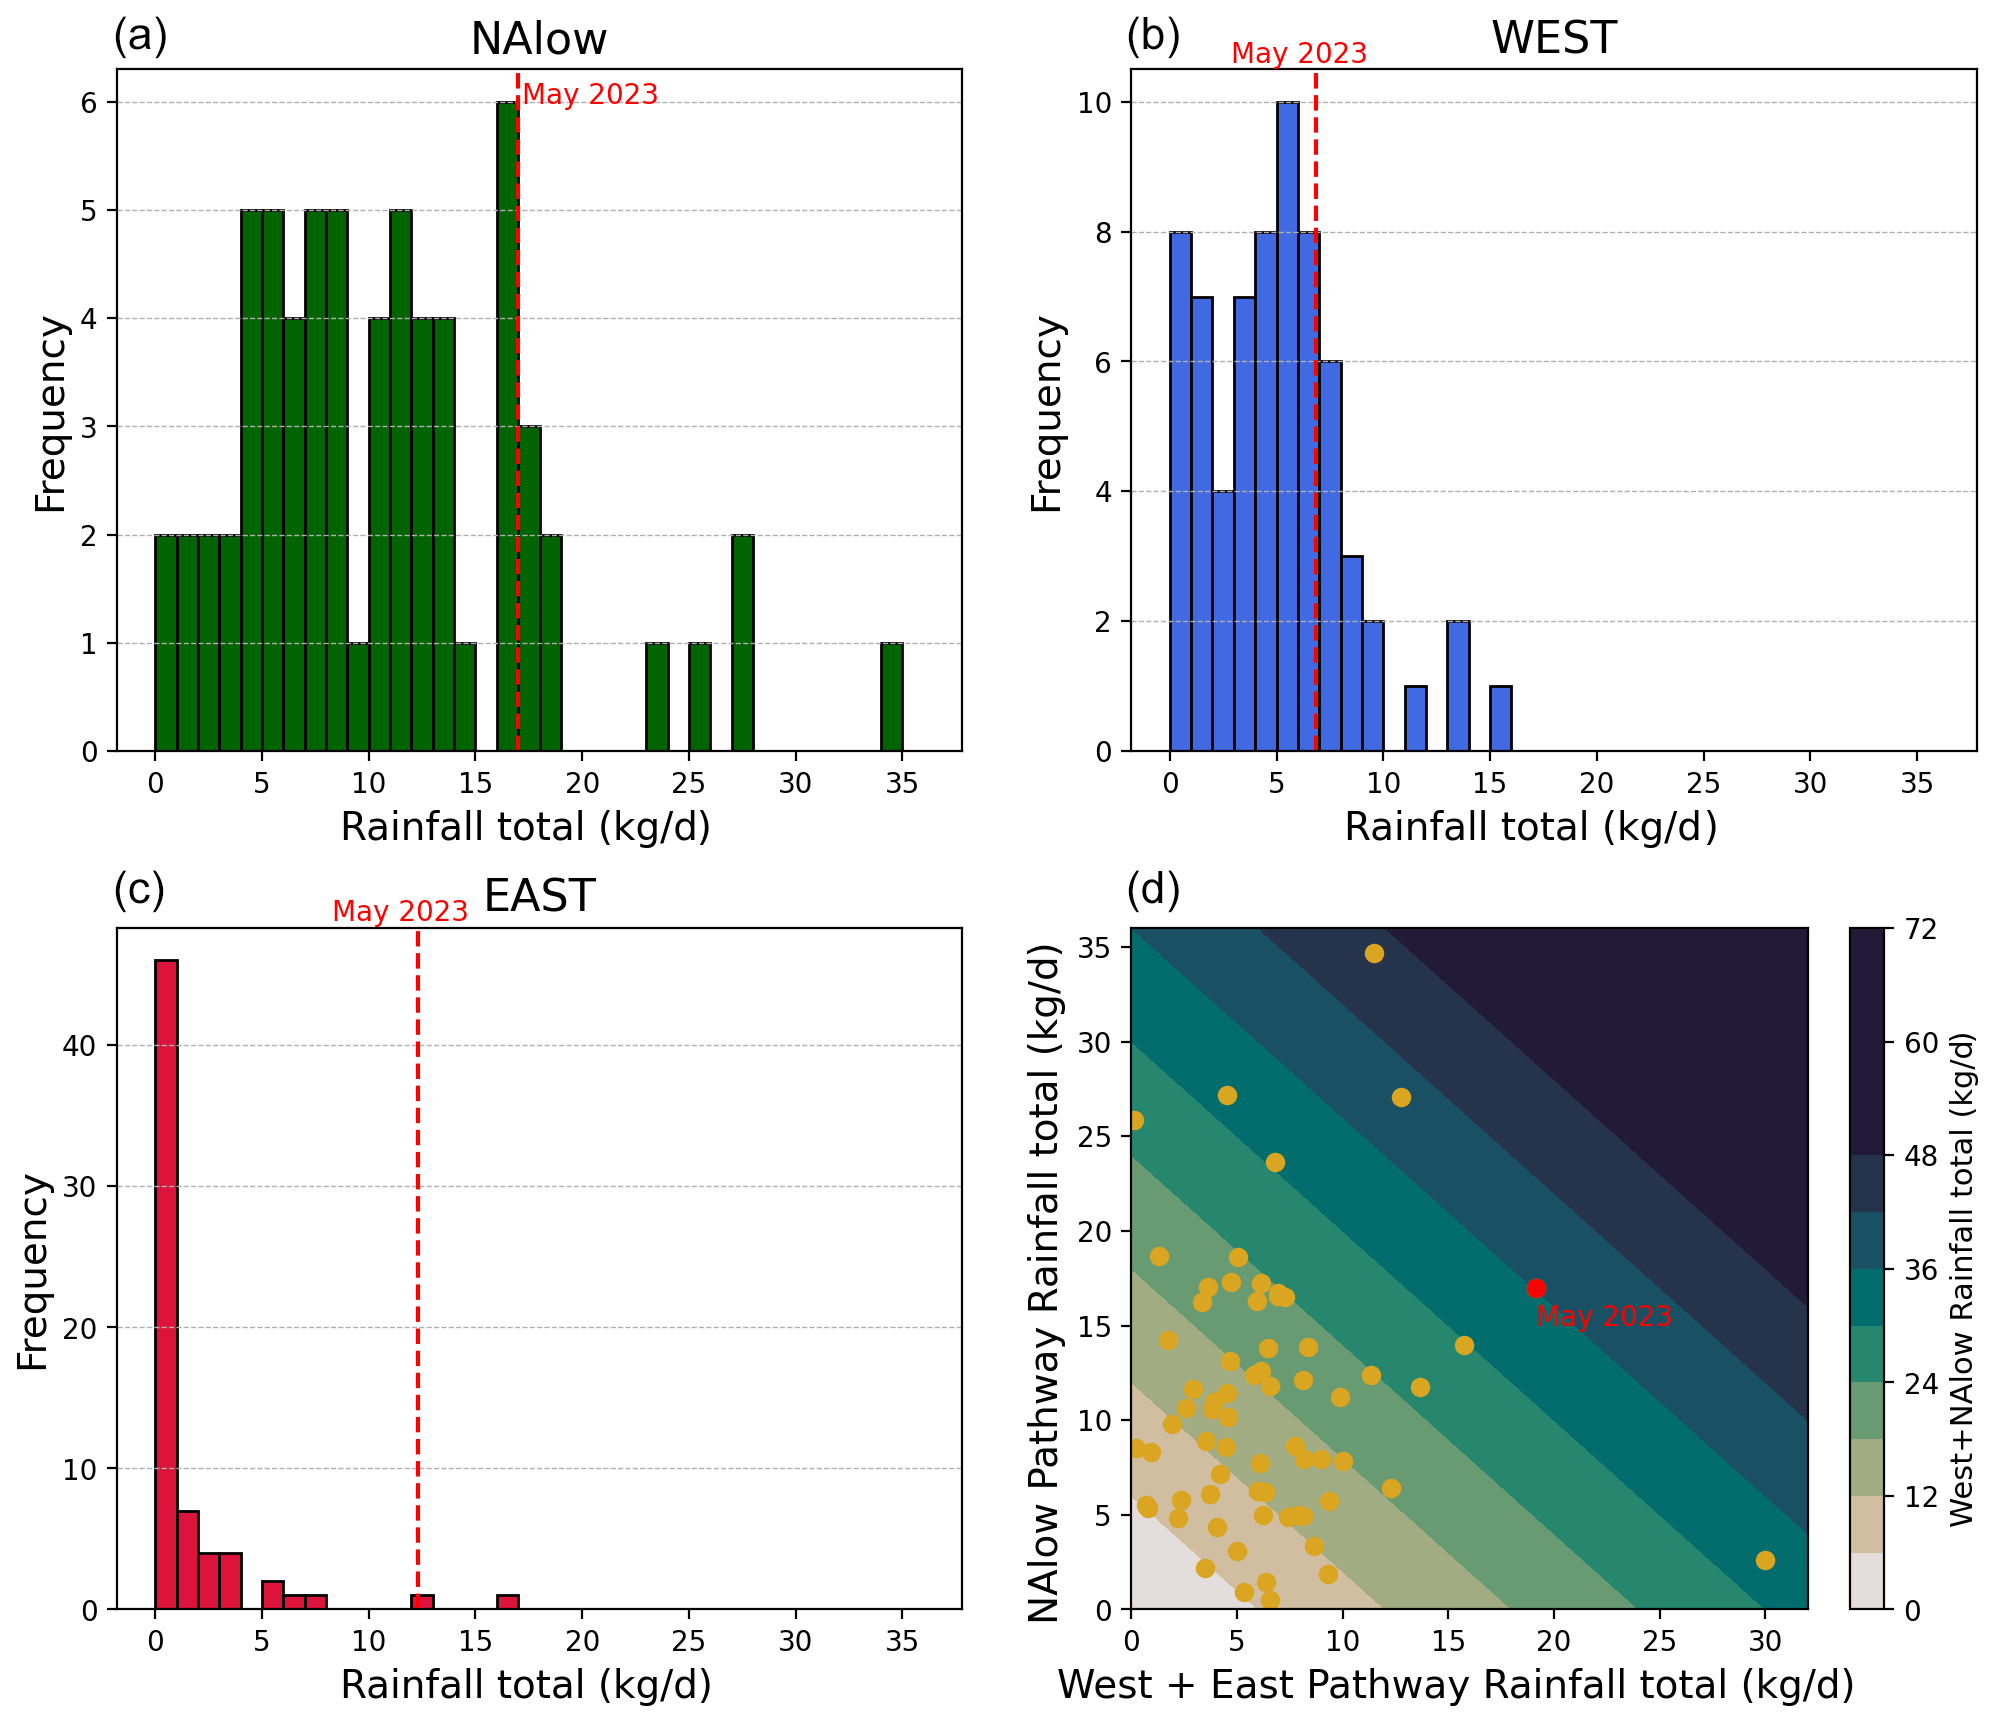
Figure 2Histograms of negative specific humidity tendency (i.e. precipitation) attributable to the (a) NAlow, (b) WEST, and (c) EAST pathways during 66 extreme rainfall events of 48 h in northern Italy, computed using Lagrangian analysis. The case study event, from 15–17 May 2023, is shown with a dashed red line. Panel (d) shows a scatterplot of WEST + EAST vs. NAlow rainfall totals, indicating their low correlation and that the case study featured strong contributions from all pathways.
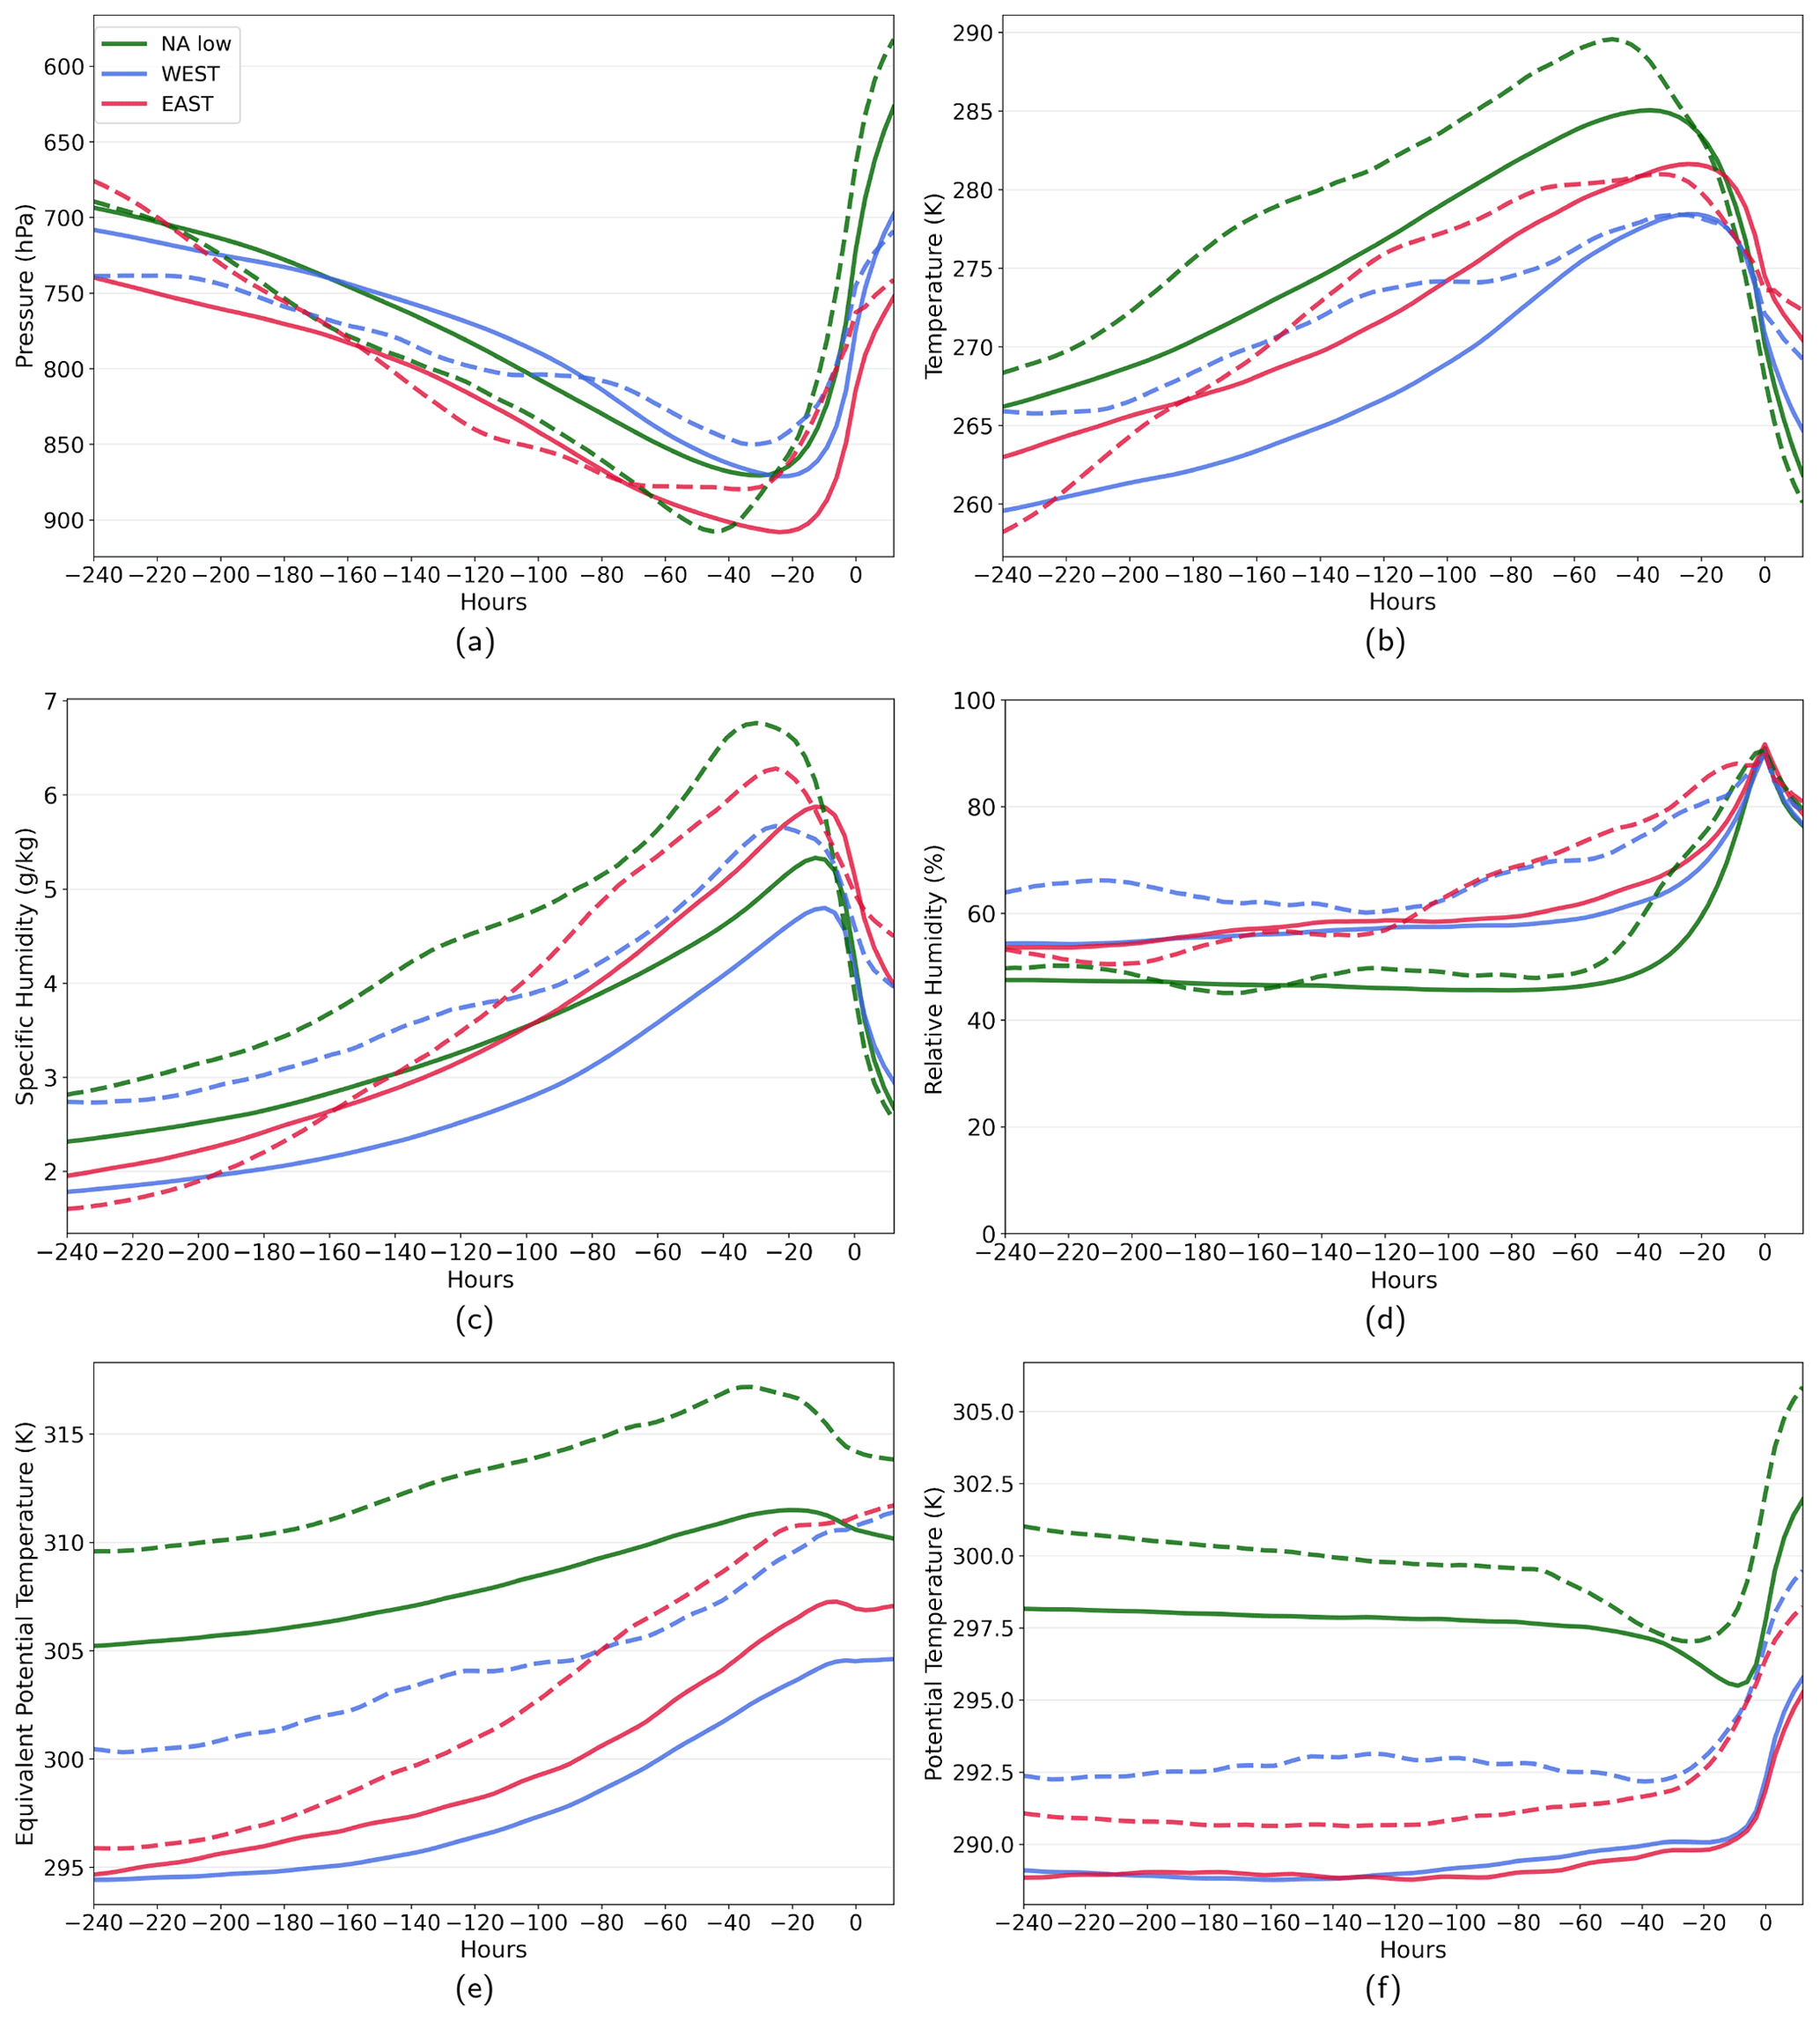
Figure 3Properties of trajectories averaged over the pathways, showing pressure in hectopascals (a), temperature in kelvin (b), specific humidity in grams per kilogram (c), relative humidity (d), and equivalent potential temperature (e) and potential temperature (f) both in kelvin. The solid lines represent the climatology of 66 extreme rainfall events, while the dashed lines denote the case study event of May 2023. The time on the x axis indicates the trajectory duration, with 0 marking the start and −240 representing 10 d prior.
Each trajectory pathway also has distinct properties, which modulate their ability to hold or precipitate moisture. Within the analysed trajectory subsets, NAlow trajectories are the warmest (Fig. 3b), as they spend several days in the lower latitudes (< 30∘), particularly over North Africa (see Fig. 1a). They also display the highest potential and equivalent potential temperatures (Fig. 3e, f). Their high thermal energy allows them to hold large volumes of moisture (Fig. 3c) and decreases their stability, allowing them to rapidly ascend (Fig. 3a). They therefore exhibit the largest negative specific humidity tendencies (i.e. produce the most rainfall) compared to WEST and EAST trajectories. Furthermore, these air masses may play a role in intensifying convective updrafts. An indicative sign of this is a slight drop in potential temperature prior to ascent (Fig. 3f, time −20 to −10 h), suggesting unstable atmospheric conditions. While they have lower specific humidity than EAST trajectories (Fig. 3c), NAlow trajectories show a rapid increase in relative humidity as precipitation begins, aligning with their major role in the analysed events. In comparison, the WEST and EAST trajectories, in terms of potential and equivalent potential temperatures (Fig. 3e, f), are similar but do not exhibit the same buoyancy and tendency for convection as seen in NAlow trajectories. Overall, EAST trajectories are slightly warmer (Fig. 3b), more humid (Fig. 3c), and generally occur in lower layers of the atmosphere than WEST trajectories.
4.2 Dynamical precursors of extreme rainfall
The coherent Lagrangian pathways we have just identified are connected to robust dynamical flow precursors prior to extreme rainfall in northern Italy on large scales. Documented extensively in recent years (Dorrington et al., 2023; Grazzini et al., 2021), these precursors isolate configurations of the large-scale flow, which favour the occurrence of a localised extreme in the following days. The details of the precursor circulations undergo seasonal fluctuations as the large-scale background state evolves, and while they are more clearly visible at long lead times during SON and DJF, they are also relevant in MAM and still robust at time lags of 0–2 d (Dorrington et al., 2023). Figure 4 shows lagged composite anomalies of large-scale fields in the days preceding MAM 90th percentile 48-hourly rainfall events in northern Italy, taken between 1979–2021, as described in Sect. 3. An Atlantic Rossby wave packet is visible in Z500, SP, and V850 anomaly composites at a 2 d lag prior to the events, with a strengthening western European trough leading to strong southerlies into Italy. Negative SP anomalies are shifted slightly east compared to Z500 anomalies, indicating baroclinic tilt with height, and extend notably further south, coinciding with westerly anomalies over the Atlas Mountains, visible in U850, which drive lee cyclogenesis. Positive IVTmag anomalies over the Mediterranean jump sharply in magnitude on the day of the events, which is consistent with the localised moisture sources shown in Fig. 1b–d.
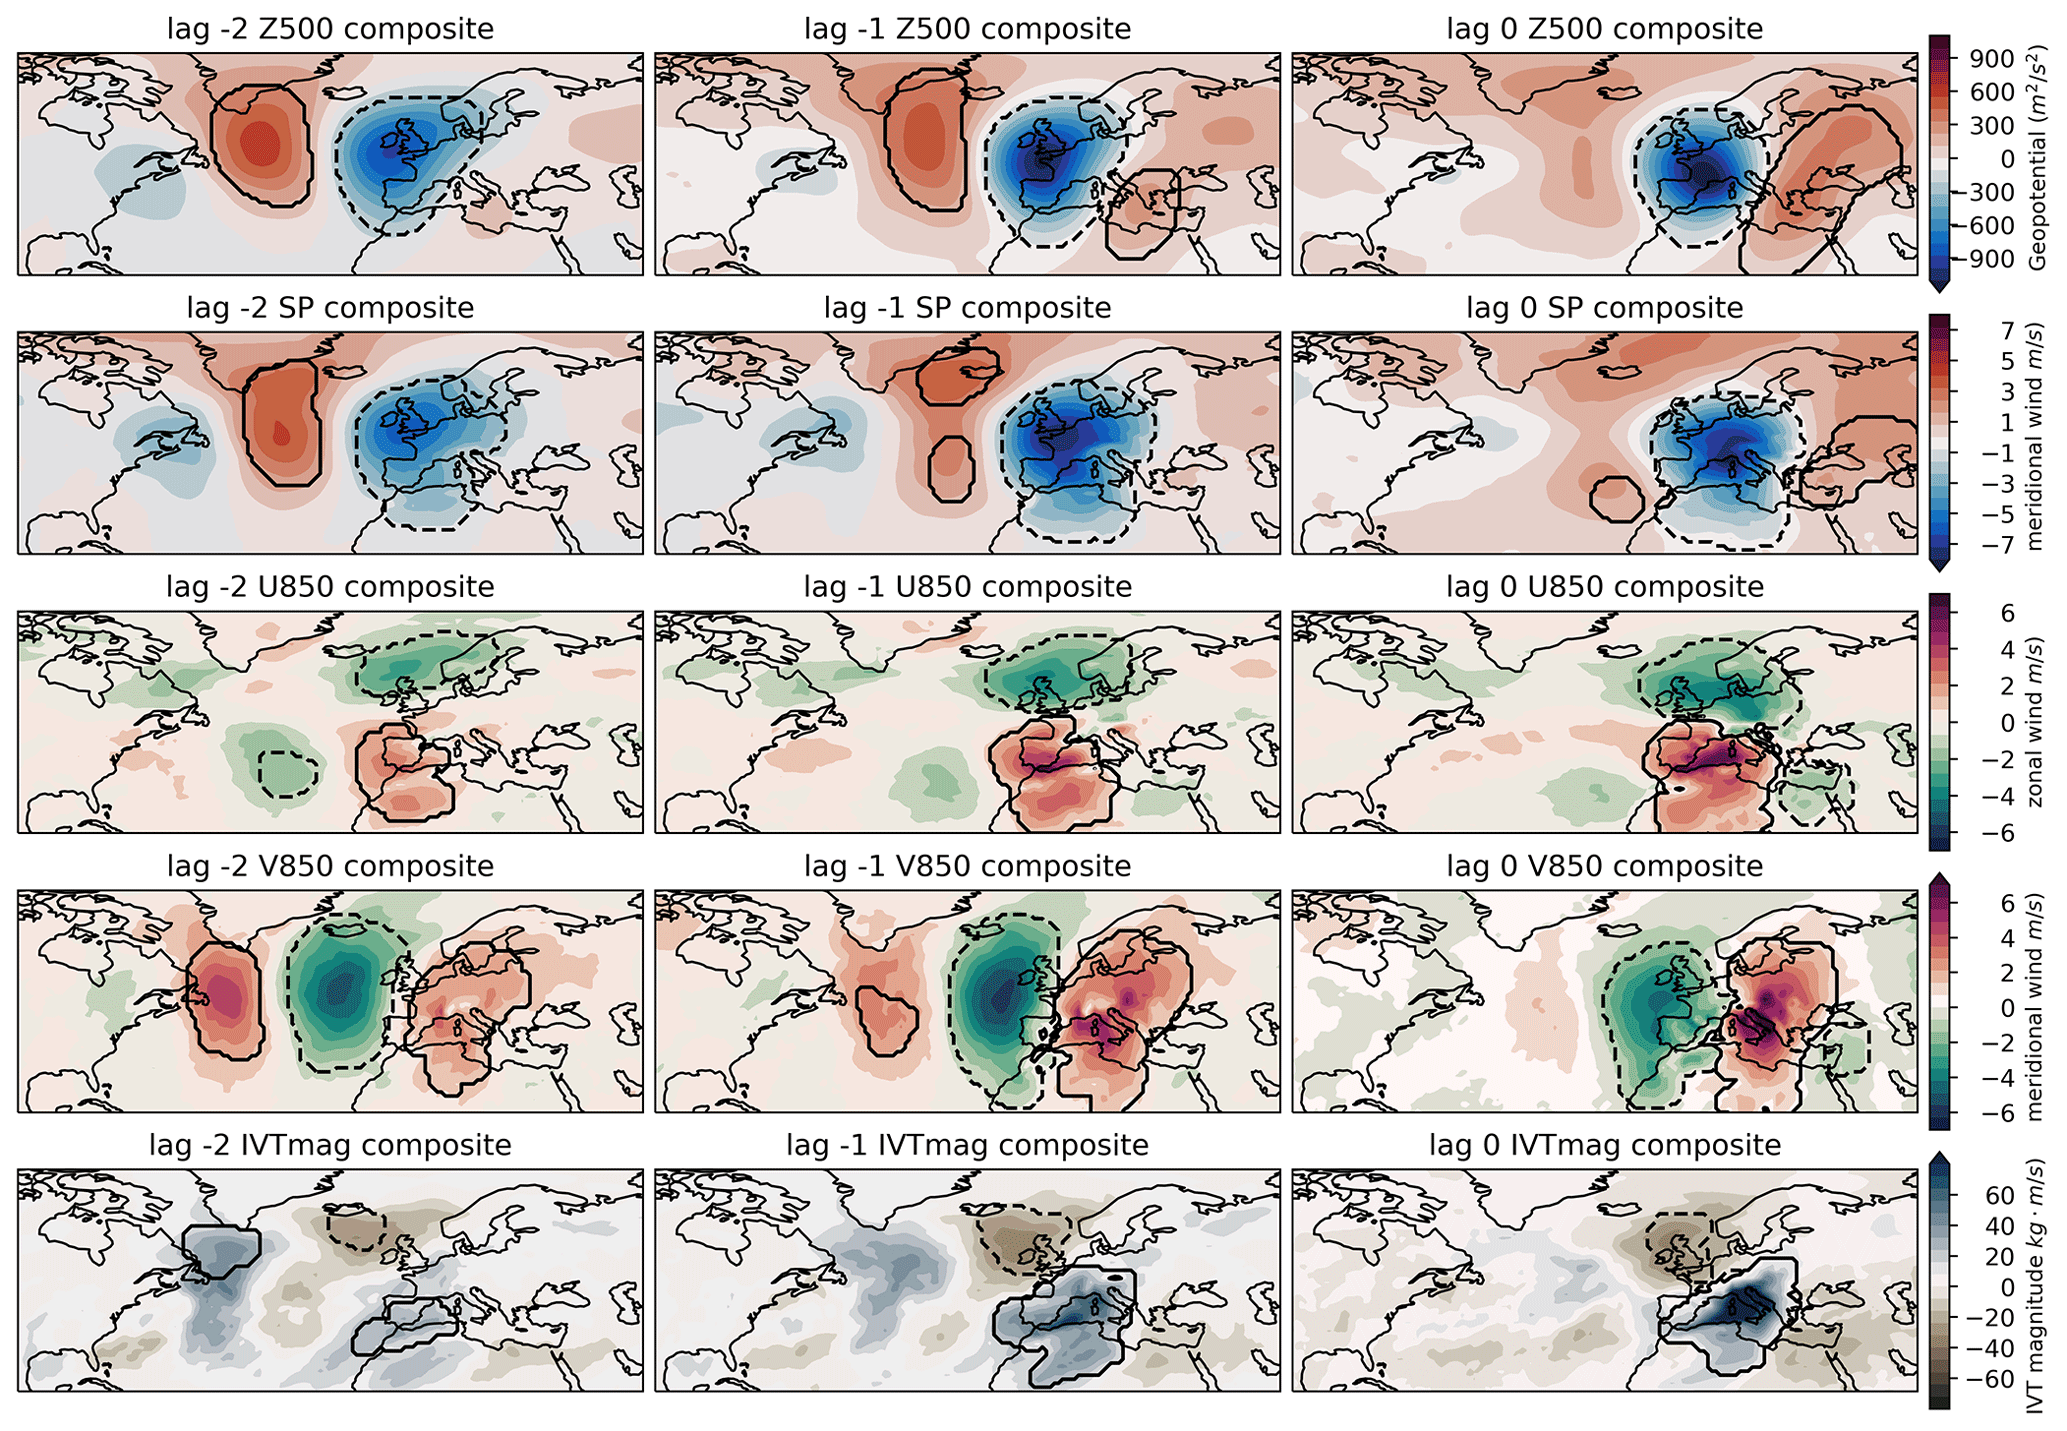
Figure 4Filled contours show lagged anomaly composites of upper-decile MAM rainfall events in northern Italy, 2, 1, and 0 d before precipitation. Black contours show regions used to define precursor patterns: these regions have statistically significant anomalies relative to climatology and a magnitude > 0.25 times the climatological standard deviation of the variable at each grid point and represent coherent areas of > 20 square degrees. See the “Data and methods” section for a more detailed explanation.
In Dorrington et al. (2023) it was proposed that lagged composites of typical flow precursors could be used to produce corresponding precursor activity indices: measures of the projection of an instantaneous anomaly field onto the expected precursor flow field for a particular extreme event class. These standardised activity indices can then be used as scalar summaries of the circulation, with positive values indicating an increased event likelihood. The black contours in Fig. 4 indicate the regions of the composites used to compute such indices, following the filtering procedure described in Sect. 3. Other regions of each composite are masked, and precursor activity indices are computed by projecting only onto the unmasked regions. Due to the high correlation (> 0.8) between many of these precursor activity indices, and for simplicity, we here consider only the Z500 lag 0 and IVTmag lag 0 indices, which capture projection onto a zonally oriented ridge–trough dipole over Italy and a strong positive Mediterranean moisture transport anomaly with suppressed transport over the UK, respectively. Figure S4 shows example daily fields corresponding to positive and negative precursor activity in both cases, while Fig. S5 confirms that these scalar indices are well correlated with actual rainfall totals over northern Italy. We explore the use of these indices in forecasting the May 2023 event in Sect. 6.
However, before we do so, we wish to understand in more detail how the distinct uncorrelated moisture sources identified using Lagrangian trajectories relate to this story of “typical” flow precursors. To do so, we composite the 66 extreme events for which trajectories were computed, separated according to their dominant moisture source. Specifically, we select events where the precipitation from a given pathway was in the upper quintile of the 66 events and where precipitation from the other two pathways was not. This gives a clear separation between the pathways and provides between 6–12 events for each class. Z500 composites are shown in Fig. S6, but most clarity comes from composites of surface pressure and 850 hPa wind, as shown in Fig. 5.
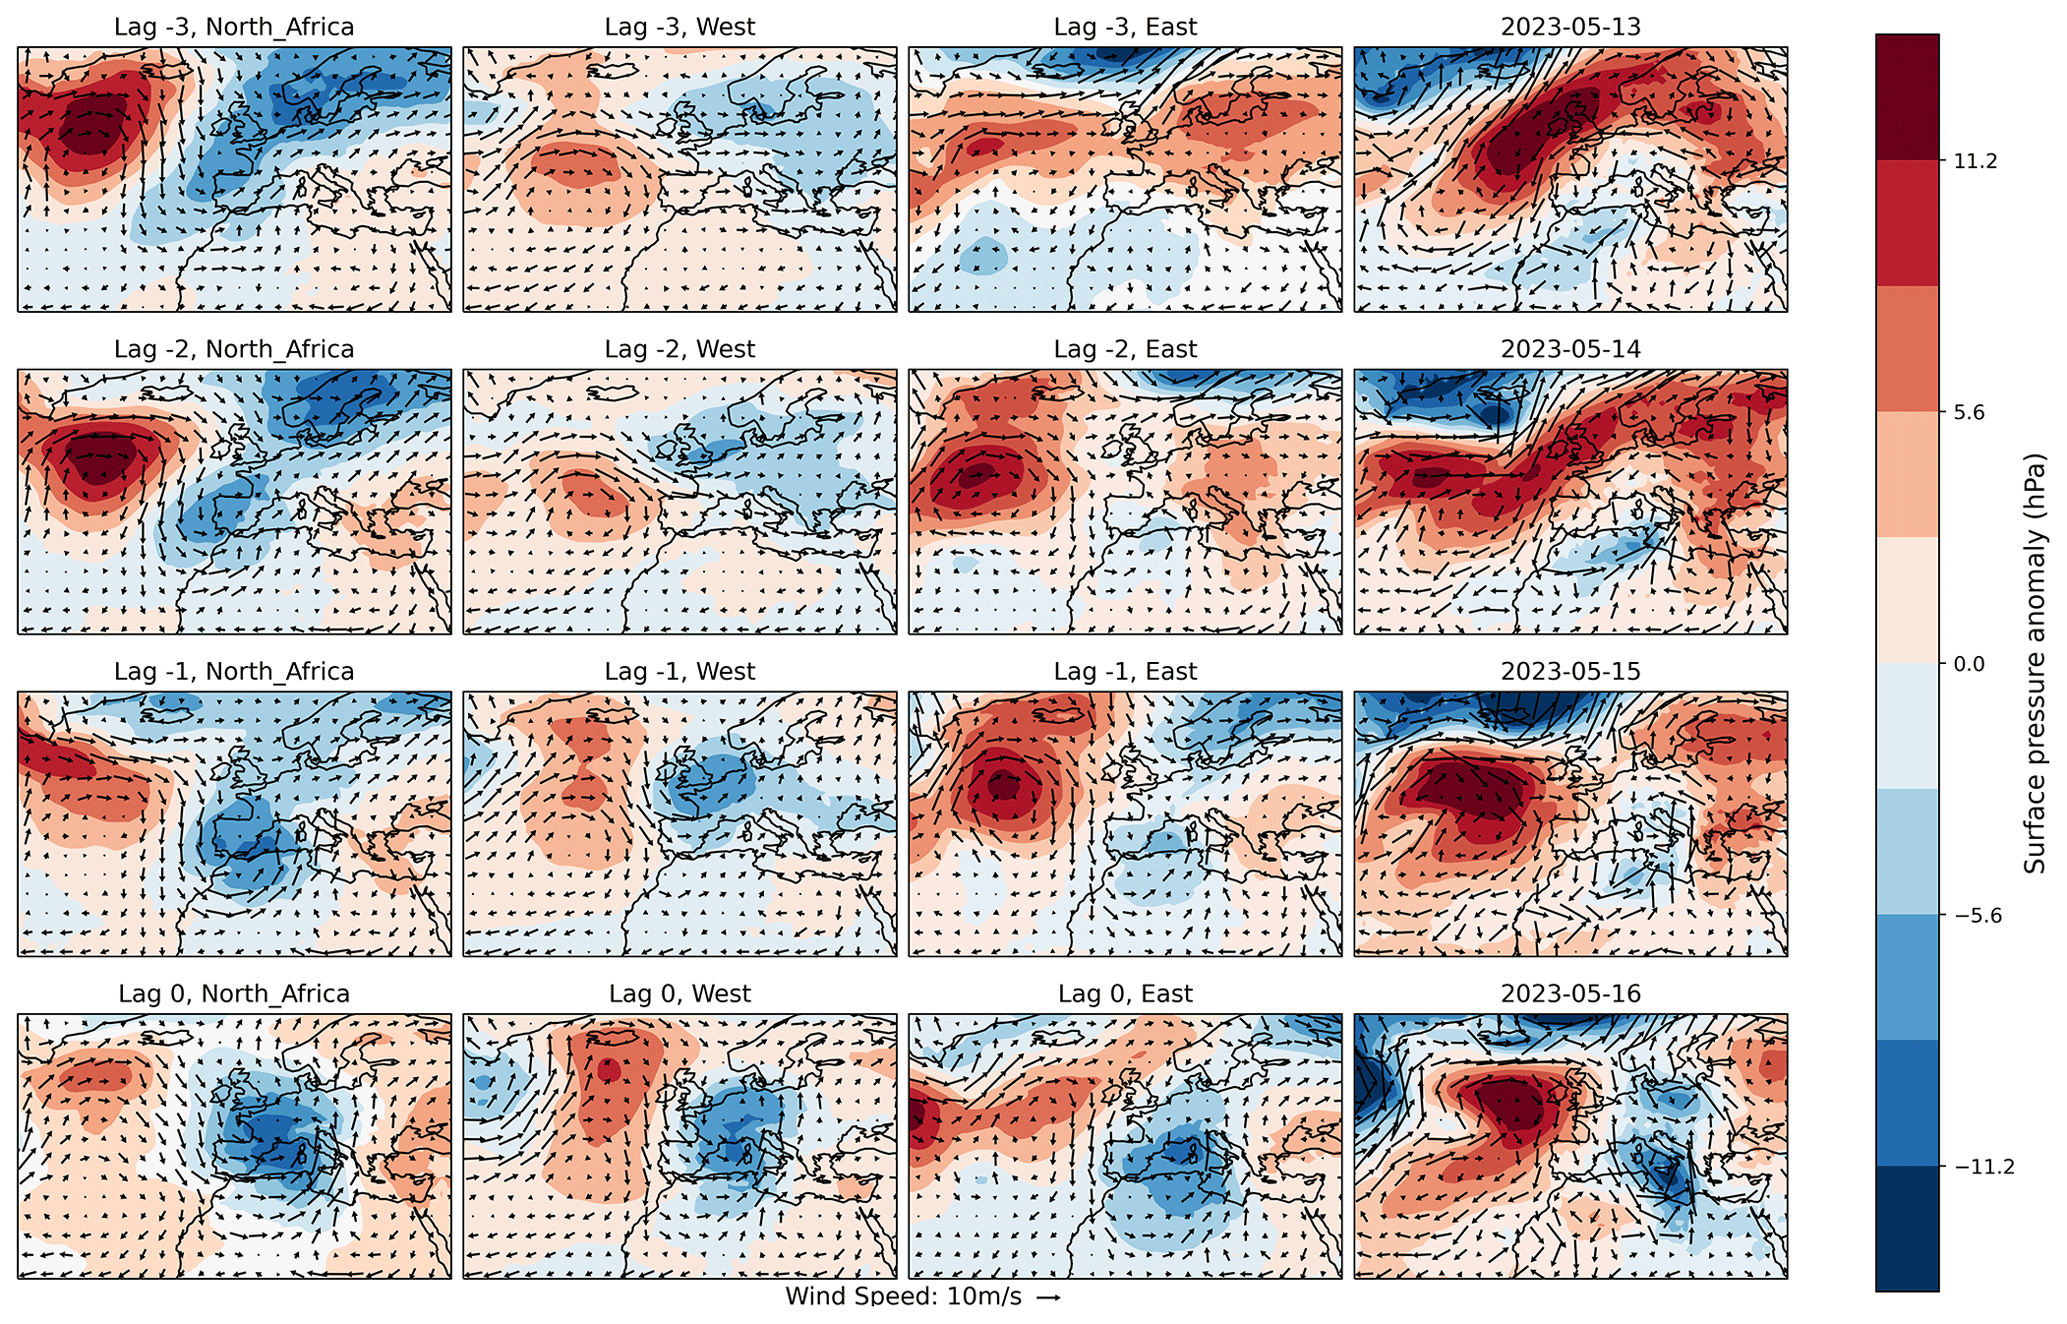
Figure 5Lagged composites of surface pressure anomalies (filled contours) and full-field 850 hPa wind (arrows) 3–0 d before rainfall pathway composites. Each composite consists of a subset of rainfall events dominated by Lagrangian moisture transport from a specific source region (see main text for details). The right-hand column shows the case study event, which received large moisture contributions from each source region.
Superficially, the composites share many similarities: a western anticyclonic anomaly, a European low-pressure anomaly, and a developing cyclonic system to the west of Italy. However, the details of the flows are quite distinct. NAlow-driven events are associated with a strong Atlantic ridge and a tilted low over Scandinavia and the UK, which favours a strong L-shaped low-level jet, with northerlies off Portugal and westerlies over the Atlas Mountains, with clear similarities to the precursor composites of Fig. 4. The developing lee cyclone then tracks north-east into northern Italy, embedded in an overall environment of high pressure. East-driven events feature less jet involvement due to anticyclonic anomalies prevailing over Europe, which deflect the jet north. The near-cutoff low-pressure system which develops is shifted south and develops rapidly. Finally, for “west”-driven events, the anticyclonic anomaly is shifted east, producing neutral conditions over North Africa and guiding the jet north of the Pyrenees and directly into the western Mediterranean, where cyclogenesis occurs in the lee of the Alps.
Clearly, the composites shown in Fig. 4 blur these different scenarios to an extent and represent only an approximate mean picture of the circulation prior to extremes. However, as demonstrated below, at least for the May 2023 case, which was unusual in several ways, this simplification proves to be useful for understanding the dynamical flow precursors.
We now move from the general to the specific, to understand how the climatological perspectives of our trajectories and precursors correspond to an individual concrete case.
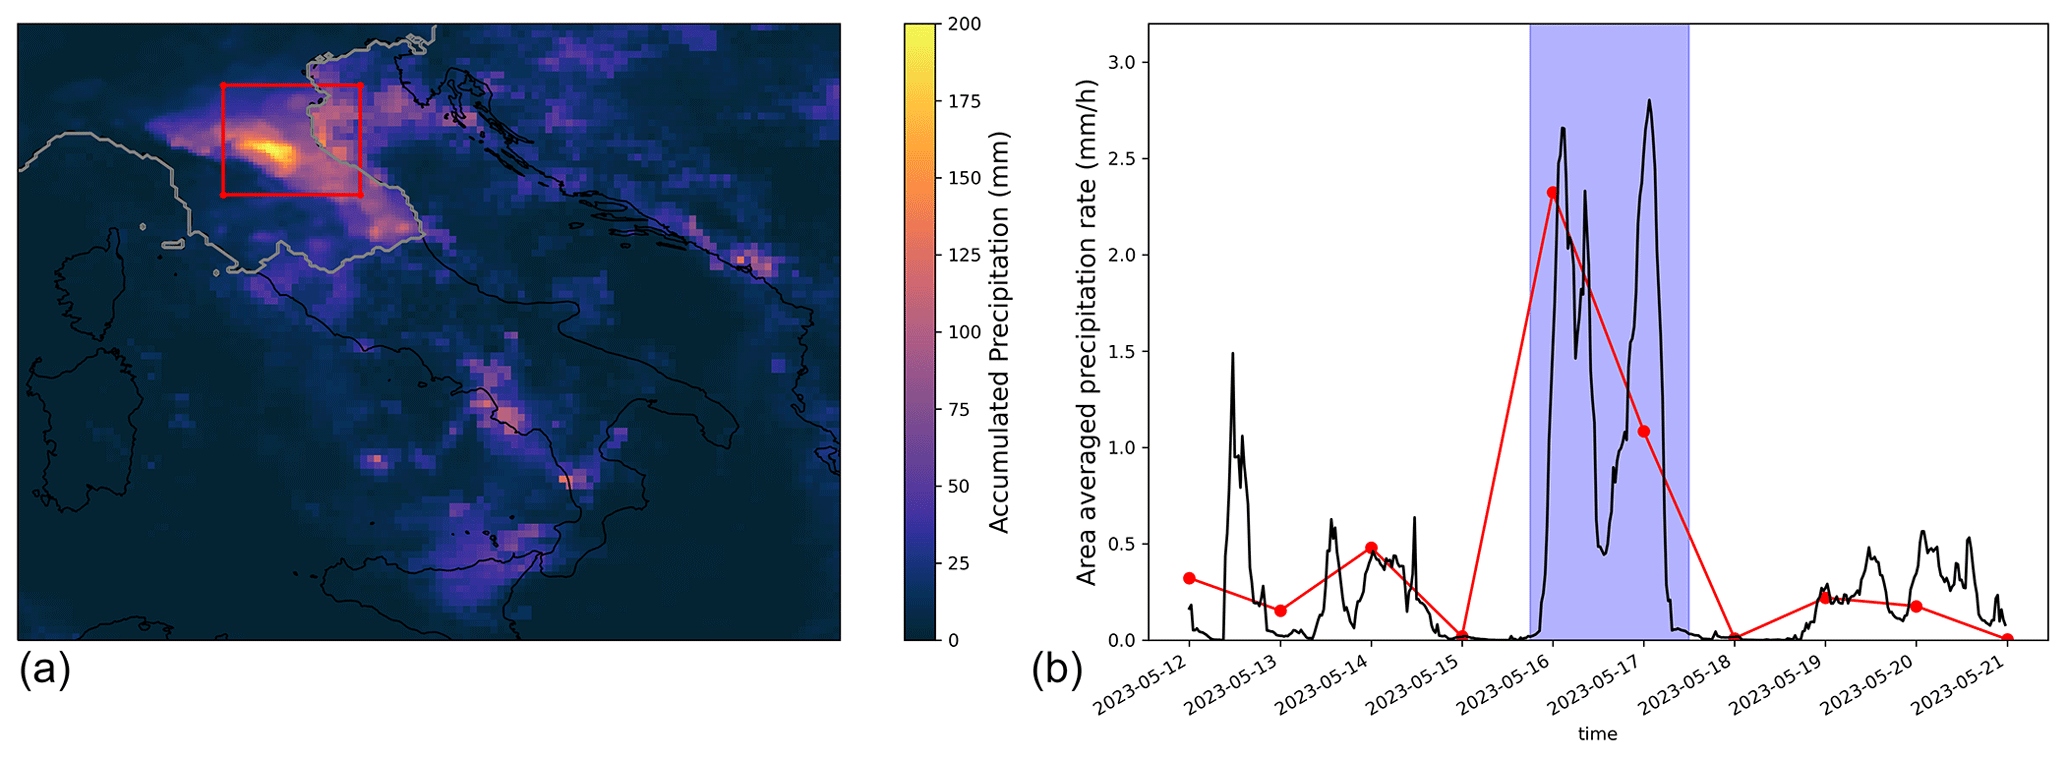
Figure 6(a) Observational rainfall accumulations over the 40 h window from 15 May 2023 at 18:00 UTC until 17 May 2023 at 12:00 UTC, based on ARCIS rain gauge data within the grey contour and GPM-IMERG satellite data in the wider domain. The Emilia-Romagna region is marked with a red box. (b) In black: half-hourly precipitation rates from GPM-IMERG, averaged over the Emilia-Romagna box, with the 40 h heavy rainfall period shaded in blue. In red: daily ARCIS precipitation data averaged over the same Emilia-Romagna box.
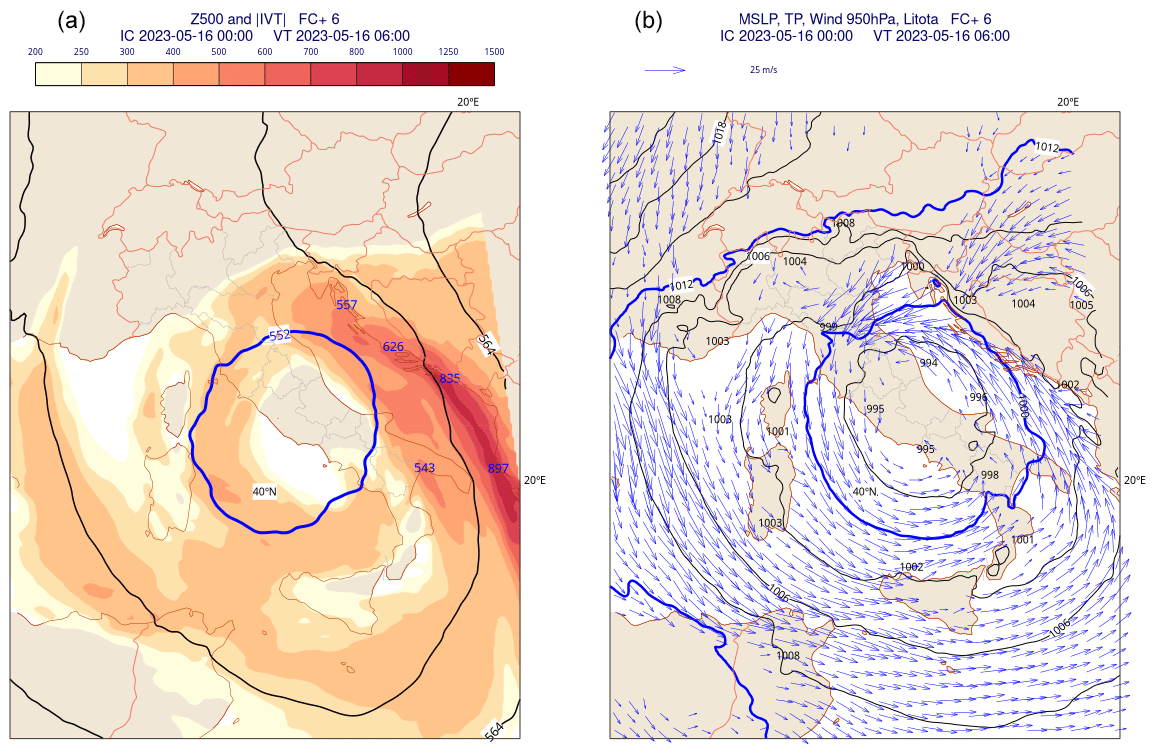
Figure 7A representative snapshot of the synoptic circulation around Italy, as captured by the ECMWF high-resolution forecast, initialised on 16 May 2023 at 00:00 UTC. (a) The 500 hPa geopotential height (contours, dam) and the magnitude of integrated water vapour transport (IVTmag, kg m s−1) in shading. (b) Mean sea level pressure (black and blue contours, hPa) and 950 hPa wind (arrows, m s−1).
The left panel of Fig. 6 shows rainfall accumulations over the 40 h period between 15 May 2023 at 18:00 UTC and 17 May 2023 at 06:00 UTC – our case study, discussed in the Introduction. While extreme rainfall occurred in Sicily, and also along the Adriatic coast and southern Bosnia, rainfall totals were particularly severe over Emilia-Romagna, whose position is approximated by the red box covering the domain (44–45.5° N, 11–13° E). The right panel of Fig. 6 shows rainfall accumulated over the red box, indicating that this 40 h period isolates the event well. The half-hourly IMERG satellite data indicate that there were two distinct peaks in precipitation, in the morning of 16 and 17 May, which is fully consistent with the daily ARCIS gauge data. This particular period of rainfall was caused by storm Minerva, which tracked from the southern Mediterranean over Sicily and into the southern Tyrrhenian Sea. Figure 7 provides a snapshot of the structure of Minerva during this first rainfall peak, with low surface pressure centred over the Apennines; a tilted upper-level trough; and fast, moist easterlies coming from the Adriatic into Emilia-Romagna.
However, it is cyclogenesis over the Labrador Sea, not the Mediterranean, which provides the first identifiable step in a chain of dynamical events that ultimately led to the Emilia-Romagna flooding. To shed light on this downstream development from the Labrador Sea toward the Mediterranean, Fig. 8 shows full geopotential height fields from 9–17 May, with anomaly fields shown in Fig. S7. On 10 May, a pre-existing low over Newfoundland rapidly deepened and tracked east toward Greenland. Interacting with the pre-existing wavy Atlantic flow, this Labrador Sea cyclone drove strong ridge building in the mid-Atlantic as seen on 11 May, and this ridge then broke anticyclonically on 12 May, producing a cutoff low-pressure system over south-western Europe and a strong anticyclonic anomaly over the Azores, inducing northerly flow down through Iberia. The consequence was a strong L-shaped low-level jet with strong low-level westerlies over the Atlas Mountains on 14 May (see Fig. 5, right column) and rapid lee cyclogenesis on the east side of the range. The remnant eastern Atlantic ridge, widening and decaying by 16 May, also supports north-westerly flow around the Alps on 15 and 16 May, which can be seen crossing France and plunging into Algeria before recirculating into Italy. At the same time, the anticyclonic anomaly over eastern Europe supports easterly flow into the central Mediterranean.
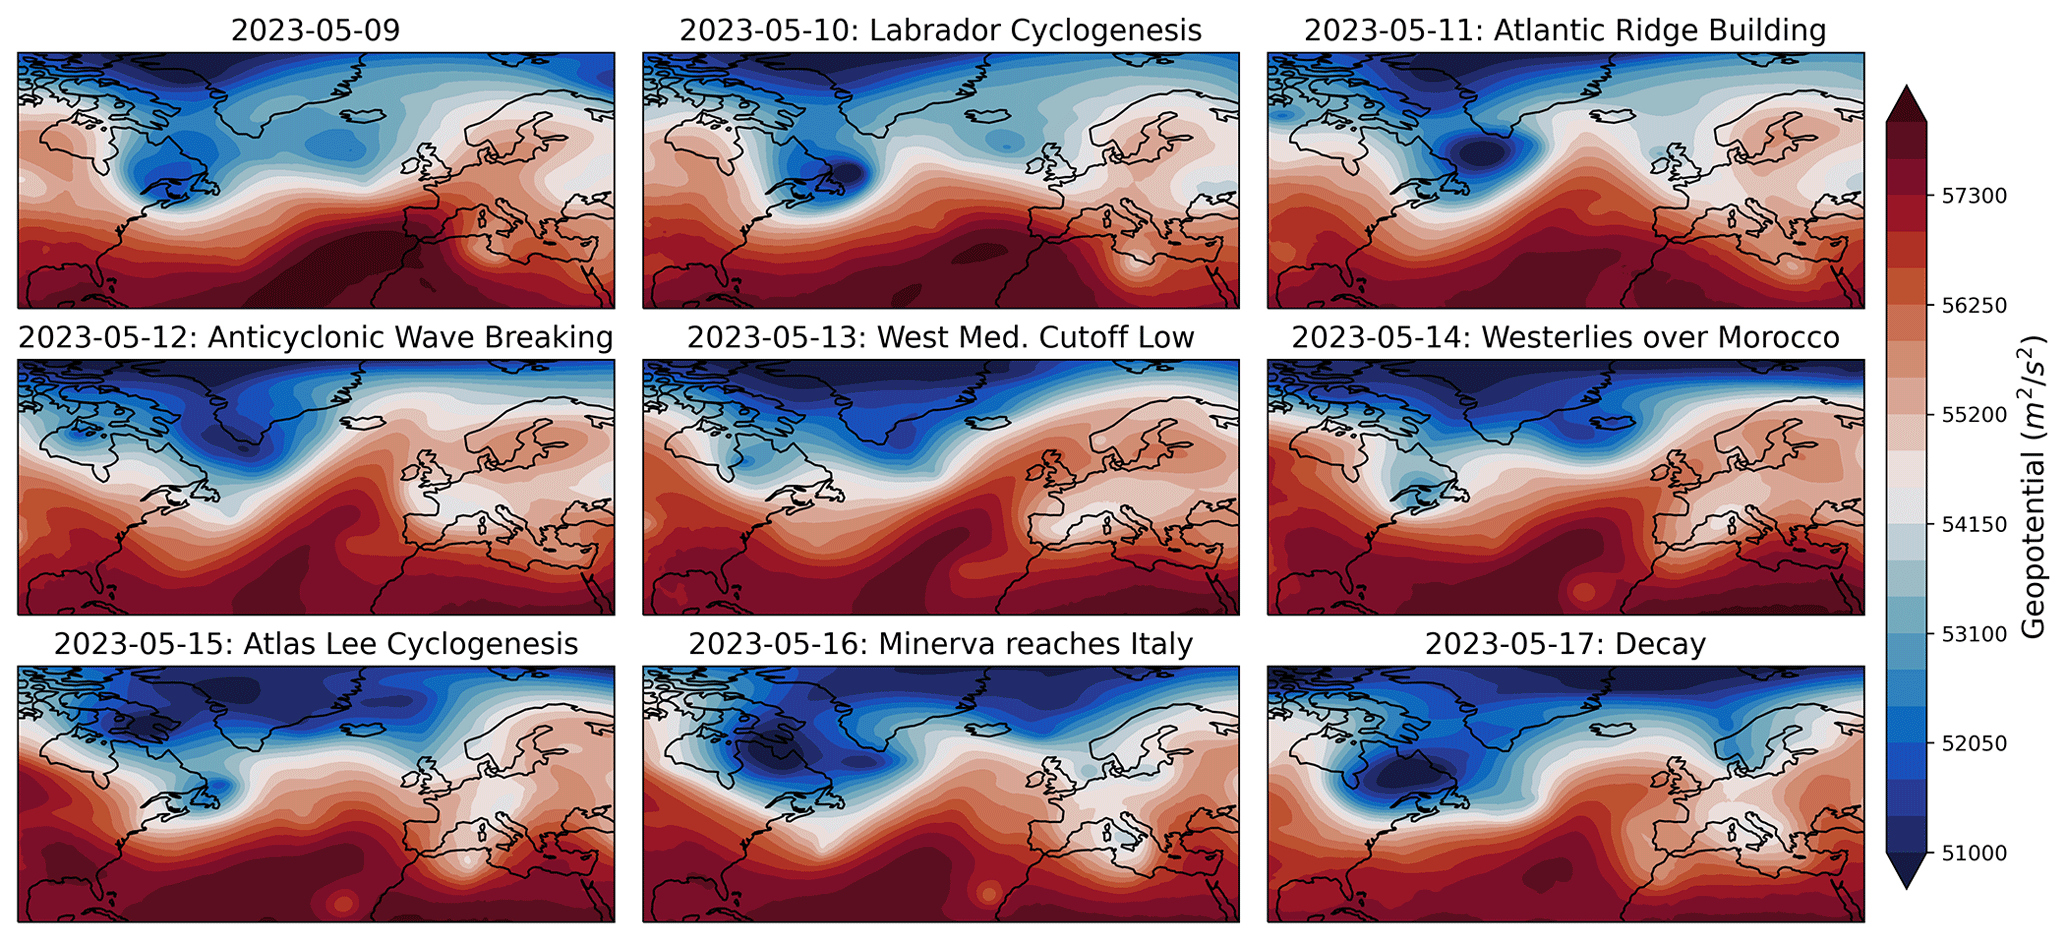
Figure 8Euro-Atlantic circulation in the week preceding the flooding. Rapid cyclonic intensification over eastern Canada and the Labrador Sea drives the development of a sharp Atlantic ridge, which breaks anticyclonically. This creates a cutoff low over western Europe, which propagates south and east, producing the Mediterranean cyclonic flow shown in Fig. 7. Equivalent geopotential anomalies are shown in Fig. S7.
From a precursor index perspective, both Z500 and IVTmag activity indices were positive during the event, with IVTmag strongly so from 14 May onward – 2 standard deviations above normal (see Fig. 9). This envelope of large-scale preconditioning captures the development, landfall, and decay of Minerva well. Interestingly, this was not the case for the earlier rainfall on 10 May: while IVTmag precursors are slightly positive, the Z500 precursor is 2 standard deviations below normal, which corresponds to the western European ridge and tilted eastern Mediterranean low visible for 10 May in Fig. 8. Such small-scale cutoff lows are not well accounted for in the large-scale precursor framework, and this is partly responsible for the overall reduced coherence of flow precursors in MAM and JJA noted in Dorrington et al. (2023).
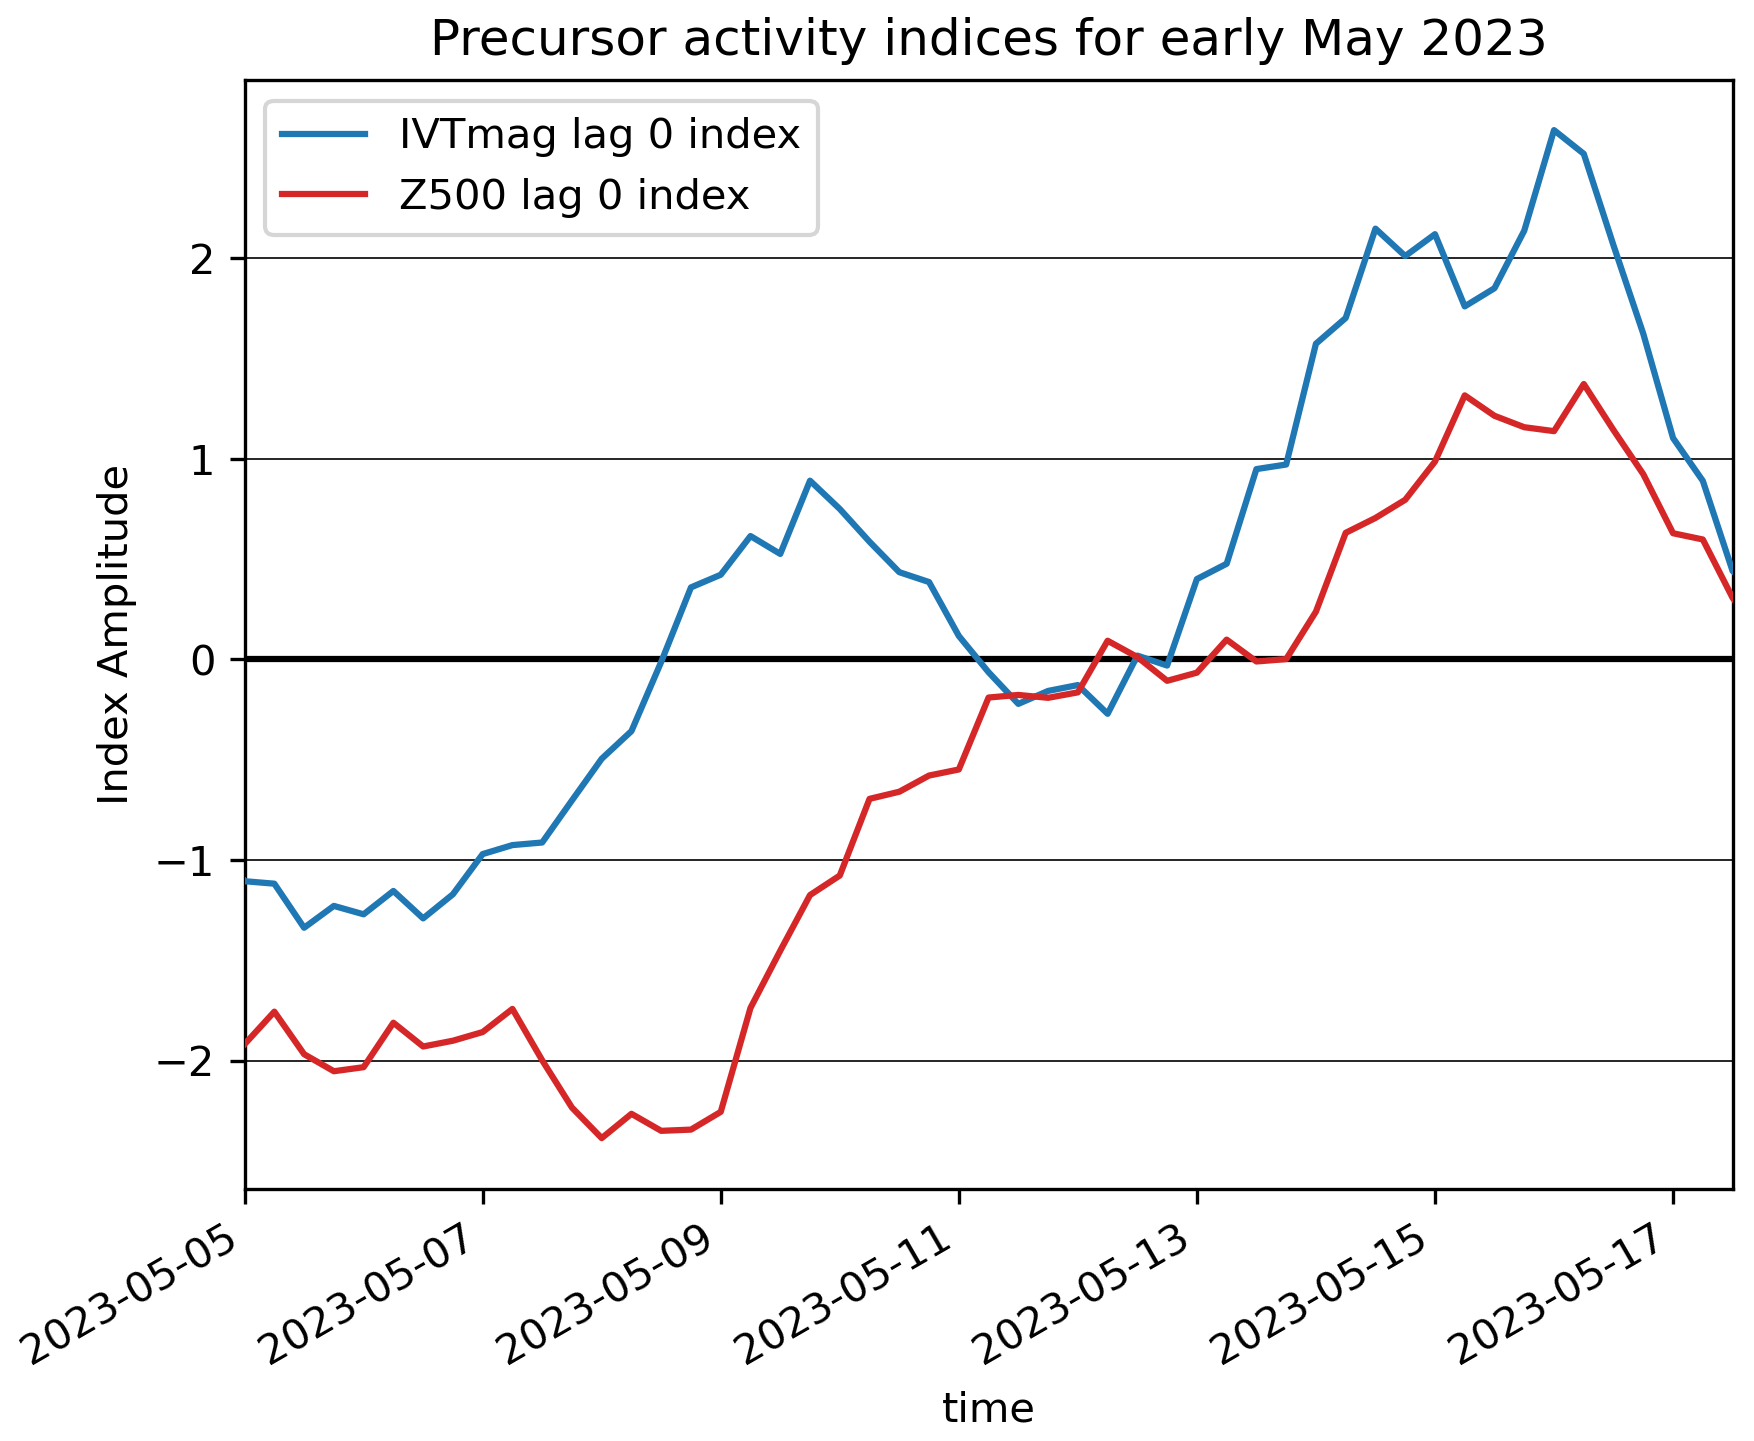
Figure 9Evolution of IVTmag and Z500 lag 0 precursor indices, in the period before and during the case study event. Both indices are standardised to mean 0 and standard deviation 1 and represent the occurrence of strong vapour transport over the Mediterranean and a trough–ridge dipole centred on Italy, respectively (see Fig. 4).
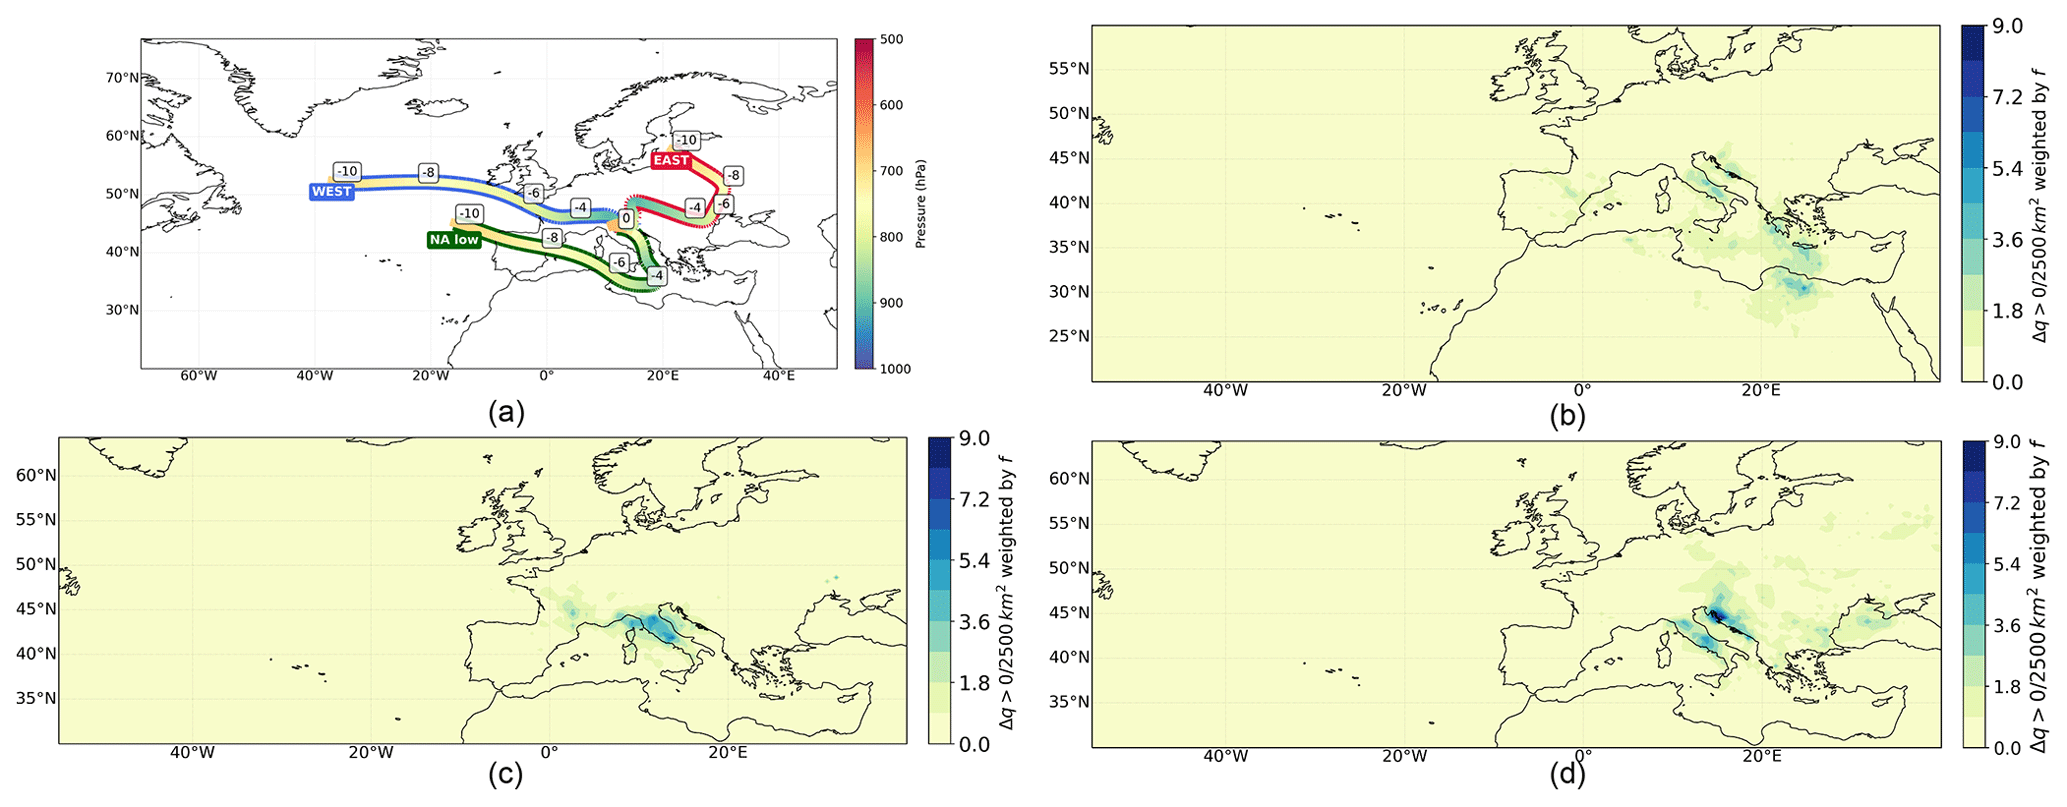
Figure 10(a) Location and altitude of Lagrangian trajectories that contribute to northern Italy rainfall in the case study event of 15–17 May 2023, averaged over each pathway. Time prior to rainfall is indicated in days. Moisture uptake () density per 2500 km2 weighted by the contribution of uptake to total moisture content before precipitation (f) is shown for (b) NAlow trajectories, (c) WEST trajectories, and (d) EAST trajectories.
The spatial structure of Lagrangian moisture source trajectories for the case study closely resembles the climatological data (see Figs. 1a and 10a). A key observation is that NAlow trajectories exhibit a distinct easterly turn, indicating recirculation over North Africa and the eastern Mediterranean. In contrast, EAST trajectories notably extend further eastward, reaching as far as the Black Sea. NAlow trajectories predominantly absorb moisture from the eastern Mediterranean and near Italy (Fig. 10b). The most intense moisture uptakes, exceeding those in both WEST and EAST trajectories, occur over the warm (290–295 K) southern Mediterranean (see Fig. S2). WEST trajectories, originating from the North Atlantic, absorb moisture from both sea and land, particularly around the Emilia-Romagna region (Fig. 10c). For EAST trajectories, most of the moisture uptakes occur through land-based evapotranspiration, particularly along the Croatian coast and from distant sources such as the Black Sea (Fig. 10d). Furthermore, the moisture sources of EAST trajectories associated with a warm sea surface are more intensive compared to those of WEST trajectories (Fig. S2). This indicates that EAST trajectories might have greater capacity for transporting larger amounts of moisture. This is further supported by the subsequent analysis, which reveals that EAST trajectories also maintain higher levels of equivalent potential temperature than WEST trajectories (Fig. 3e). In the comparison of this specific event with the climatology of 66 events from 1979–2021, we find that the moisture sources for NAlow and WEST trajectories are in fact similar to those observed historically (Figs. 10 and 1b–d). The moisture uptakes of NAlow air masses exhibit a slight eastward shift, aligning with the easterly turn depicted in Fig. 10a. However, it is the EAST trajectories that most notably diverge from the climatology (Figs. 10d and 1d), displaying a denser concentration of moisture sources. This characteristic is in line with their substantial contribution to the significant precipitation observed in May 2023.
The overall remarkably intense rainfall during the case study is due to strong rainfall from all three pathways, including the uncommon EAST pathway (Fig. 2c). This confluence of different sources marks the event as dynamically unusual and as a kind of compound extreme. This was the cause of the extended duration of the event and the two rainfall peaks. As shown in Fig. 11, the rainfall on 16 May came primarily from NAlow air masses accompanying Minerva, while the rainfall on 17 May was primarily due to later influx of moist westerly and easterly winds.
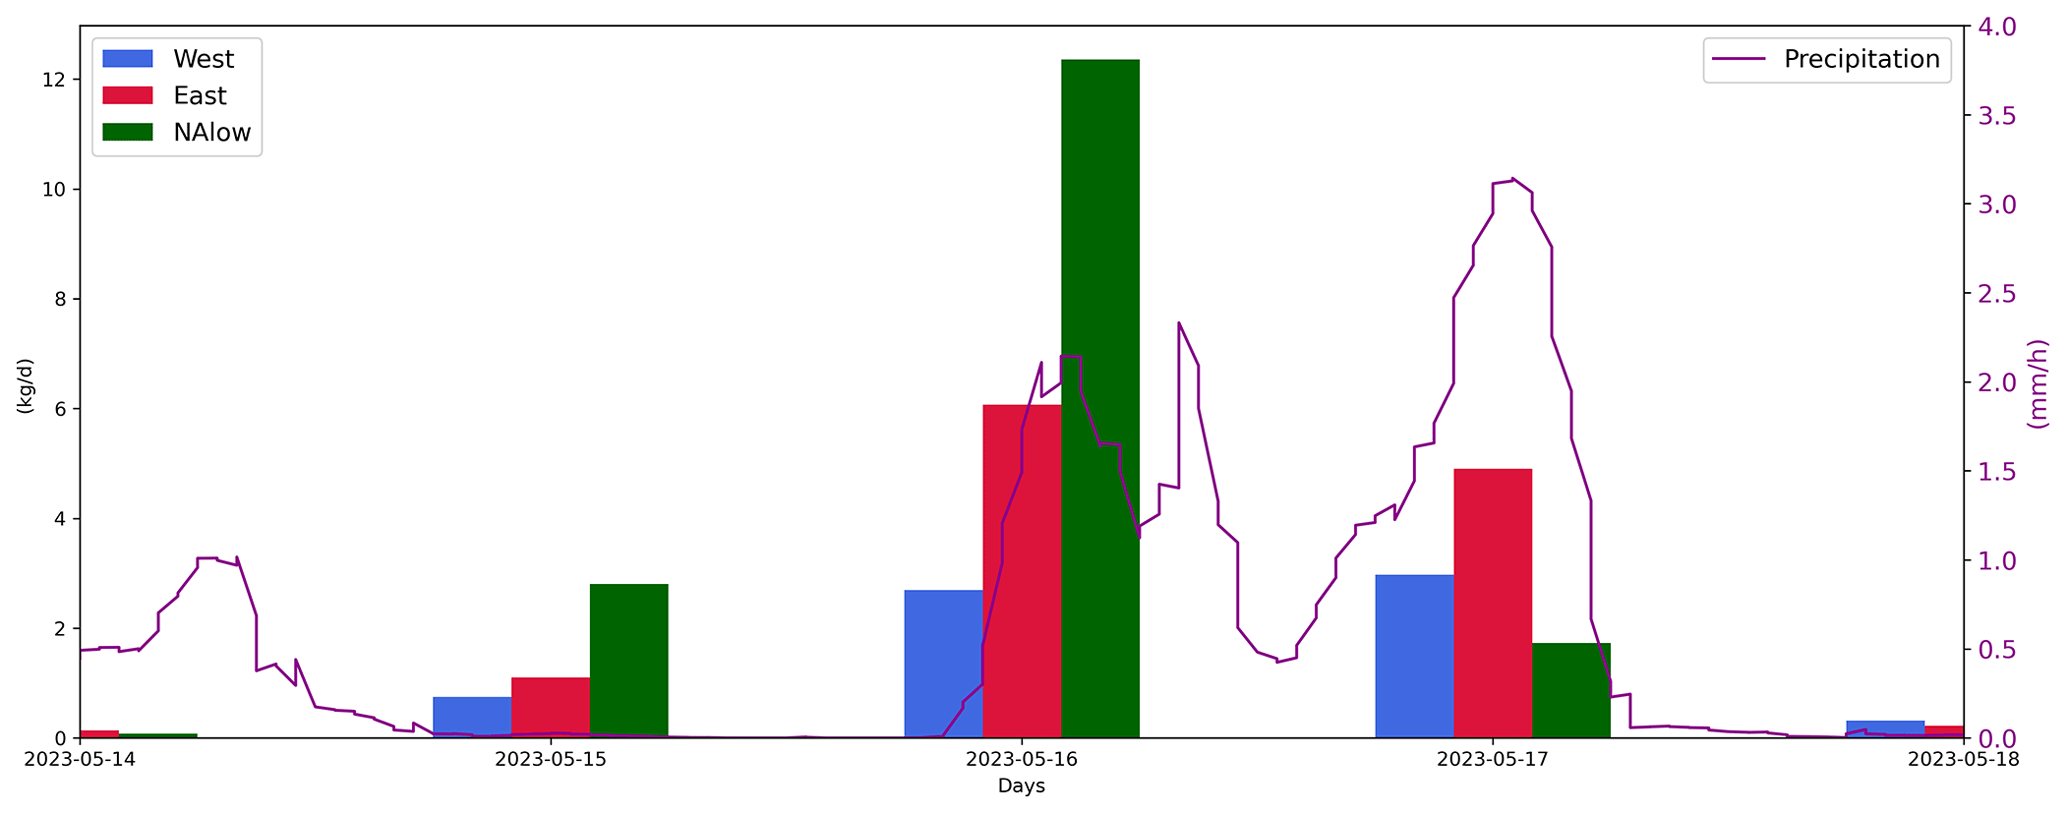
Figure 11Total moisture loss () and precipitation (mm h−1) during the case study event. The bars, divided into pathways from Fig. 10, represent the total moisture loss inferred from trajectory analysis in kilograms per day for the dates specified on the x axis. The solid purple line indicates precipitation in millimetres per hour, based on IMERG satellite data, as shown in Fig. 6b.
The reason for this confluence of trajectories can be understood by comparing the low-level flow anomalies of the May 2023 event to the pathway composites of Fig. 5. We see the flow anomalies for 13 May were most similar to the EAST-driven events with strong and persistent anticyclonic anomalies in eastern Europe but with the important difference that the wave breaking has produced a true cutoff low over the western Mediterranean. This produces strong enough westerlies over the Atlas Mountains to trigger cyclogenesis, even without an Iberian low, as is typical in the NAlow-driven events. Finally, the breakdown of the wave ultimately produces a strong anticyclonic anomaly on 15 May in just the right location to support north-westerlies over France, as in the WEST pathway. As such, air masses from all three pathways are able to converge into northern Italy over the 40 h period of the event. The resulting structure of the low-level flow (see Fig. 7) circles around the topographic barriers of central and southern Italy, which might otherwise trigger precipitation, before reaching Emilia-Romagna from the north Adriatic.
Even with a given pathway, the case study event was extreme, as evident in the properties of each pathway (Figs. 3 and S3). NAlow trajectories are anomalously warm and humid (Fig. 3b, c) and thus have a high potential for transporting large moisture volumes (Fig. 3e). As these trajectories descend into the lower troposphere, they undergo adiabatic warming (Fig. 3b) and gradually absorb more humidity (Fig. 3b). Eventually, they become the most humid air mass, reaching their peak humidity shortly before arrival into the starting region. Their ascent starts lower in the troposphere and is more rapid than usual (Fig. 3a), leading to a rapid loss of moisture (Fig. 3c). In addition, as in climatology, these trajectories exhibit a potential for the occurrence of convection (Fig. 3f), indicating a higher likelihood of intense precipitation. EAST and WEST trajectories are also warmer, more humid, and show higher equivalent potential temperatures than typically observed, indicating enhanced moisture absorption and buoyancy (Fig. 3e). EAST trajectories, originating in colder and drier conditions, undergo a transformation about 5 d before the event. As they descend into the lower troposphere, they warm up, gain moisture, and increase their relative humidity, contributing significantly to the precipitation in Emilia-Romagna between 15–17 May 2023. The percentile ranges and comparative analysis for these properties are further detailed in Fig. S4, utilising boxplots for a visual representation of the data spread for days 0 to −5 from the start of the trajectories.
In the previous sections we have developed a detailed understanding of the dynamics and flow evolution of the May 2023 case study event and of the broader class of MAM heavy rainfall events in northern Italy. We have found that the May 2023 event is linked to a co-occurrence of high rainfall from multiple air mass pathways and that each pathway can be linked to a distinct large-scale flow. In Dorrington et al. (2023) it was proposed that flow precursors could be used to improve the predictability of extreme events and understanding of forecast evolution but with the assumption that a single set of precursors could be used to understand the event. The three-pathway narrative we have described above provides a challenge for such an approach, especially as the operational application of specialised Lagrangian tools for identifying such pathways is impractical due to the substantial computational resources and extensive time required for calculating trajectories. Therefore in this section we explore how useful flow precursors based on a single-pathway approximation are to understand and raise early signs of the May 2023 event. Figure 12 shows ECMWF 15 d forecasts for 12 h rainfall accumulations in northern Italy over the case study period. We show 12 h accumulation forecasts rather than a 36 h accumulation in order to highlight the differing evolution of the event onset and peak: forecasts from 12 May onward contained scenarios with extreme rainfall totals for the earlier target times, with forecast confidence increasing more broadly on 14 May, indicating a 2–4 d skilful forecast range. Forecasts considering rainfall aggregated over only Emilia-Romagna provide the same qualitative conclusion (not shown).
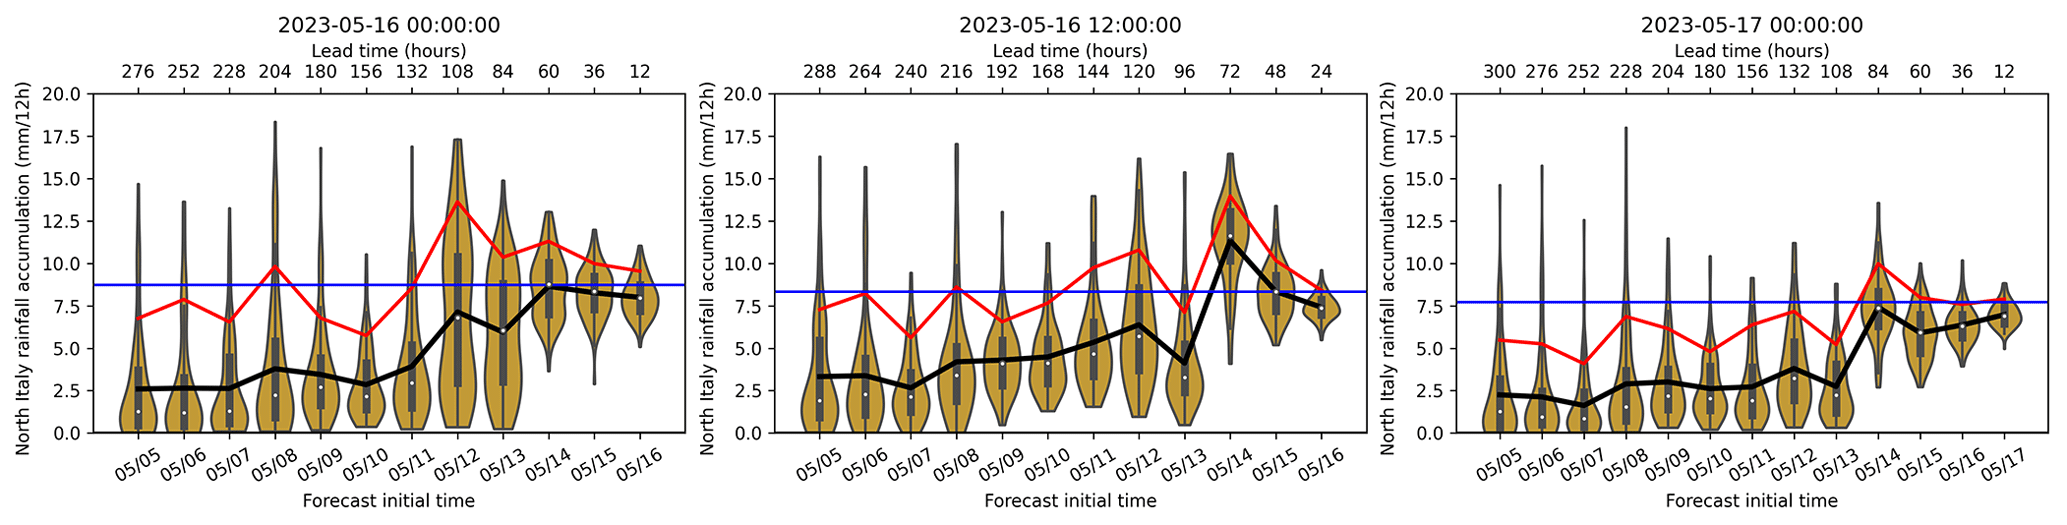
Figure 12Forecast evolution plots showing the ensemble distribution of rainfall accumulations (in mm) over northern Italy in ECMWF medium-range forecasts for the 12 h preceding 16 May 2023 at 00:00 UTC, 16 May 2023 at 12:00 UTC, and 17 May 2023 at 00:00 UTC. The black lines show the ensemble mean, while the box-and-whisker plots show the interquartile range and median values. The red line indicates the 90th percentile of the ensemble. The horizontal blue line indicates the ERA5 estimate of the true outcome.
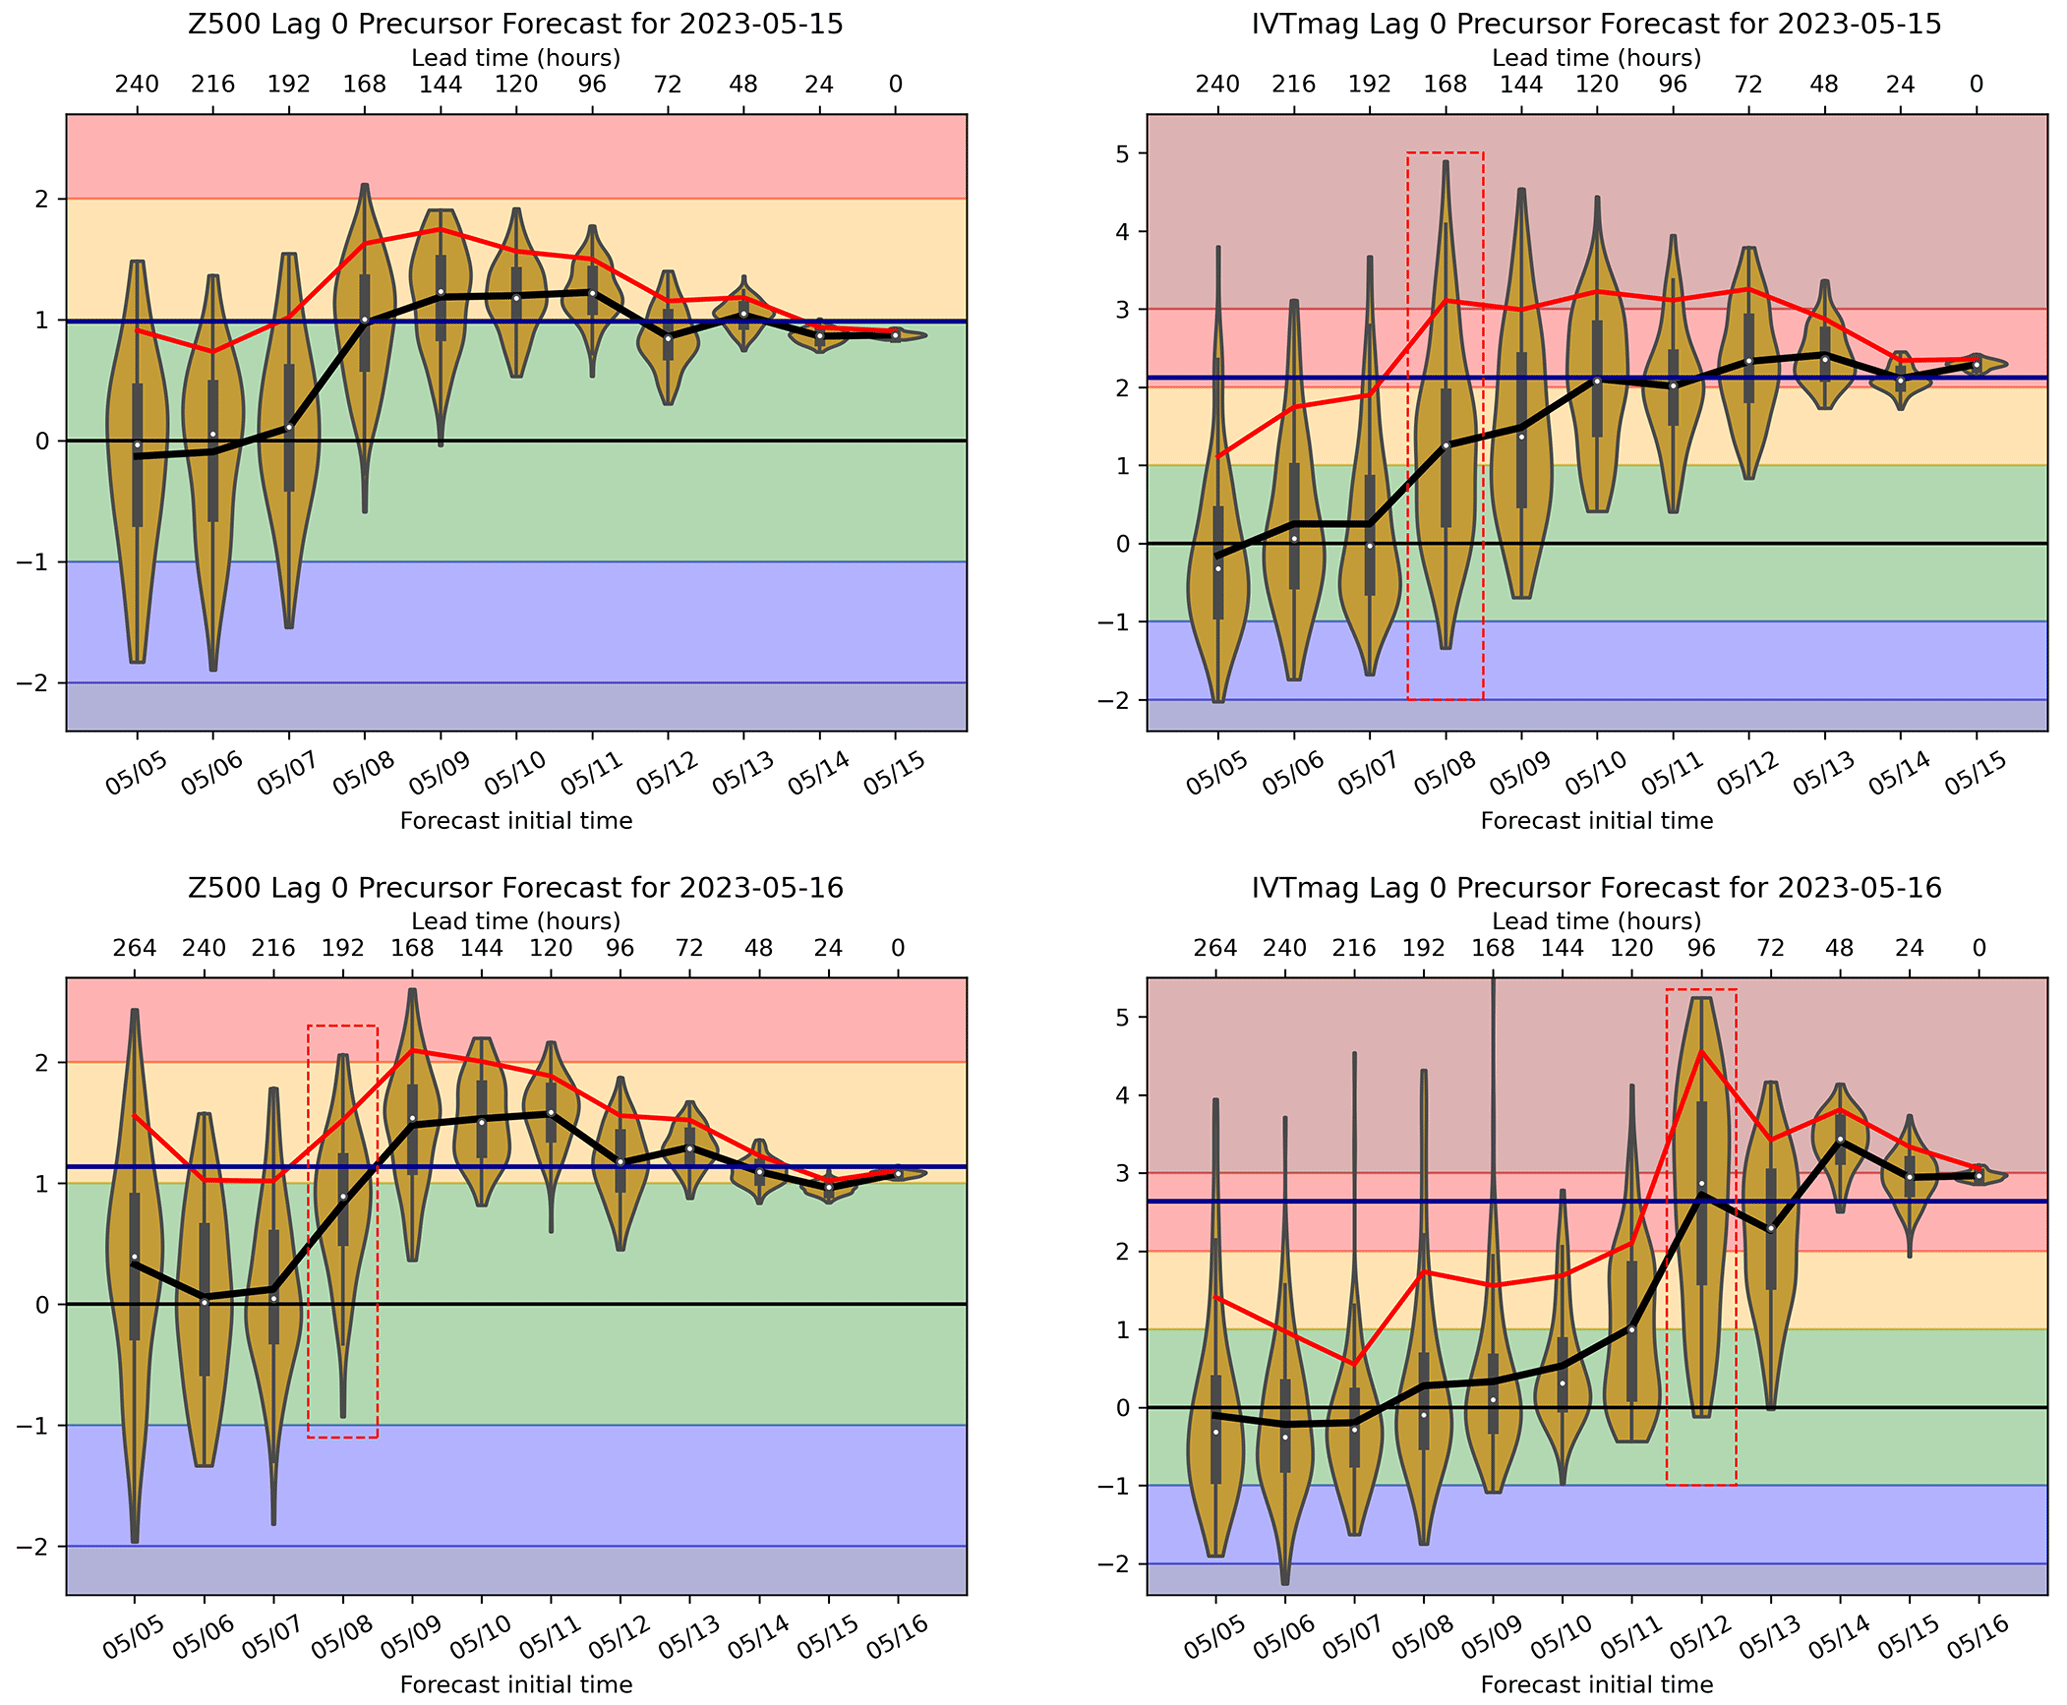
Figure 13Forecast evolution plots as in Fig. 12 but now for precursor activity indices on 15 and 16 May 2023. The horizontal blue line indicates the ERA5 estimate of the true outcome. The dashed red boxes indicate forecasts for which ensemble sensitivity is investigated. As each plot is on a different scale, the y axis is shaded to aid comparison and suggests a “traffic light system” of event risk.
In Fig. 13 forecasts for daily Z500 and IVTmag lag 0 precursor indices are shown, corresponding to the precursor patterns shown in the top and bottom right of Fig. 4 and the indices shown in Fig. 9. As mentioned in the Introduction, these precursors were monitored experimentally in late April 2023 onward, computed by projecting IFS Z500 and IVTmag forecast anomalies onto the reanalysis precursor patterns. From 8 May, the ensemble forecast predicted somewhat elevated Z500 precursors for 15 and 16 May (i.e. a trough–ridge structure surrounding Italy) in the ensemble mean but with a wide forecast spread. By 10 May, the ensemble actually overestimates the trough strength, with what ultimately proves to be an accurate magnitude predicted from 12 May onward.
Forecasts for IVTmag precursors (i.e. strong moisture transport over the central Mediterranean and Italy) for 15 May grow steadily more confident in high values from 8 May onward, with a number of very extreme > 4σ events in the forecast between 8 and 10 May. For 16 May, forecast IVTmag precursors increase sharply on 12 May, coinciding with the emerging direct rainfall forecasts. This is due to a time mismatch in earlier forecasts which favoured an extreme from 14–15 May. The precursor forecasts at long lead times did not provide a perfect prediction of the ultimate extreme, but they did flag clear risks of a possible extreme scenario from 8 May onward, at a lead time of 7–8 d, which was not visible in the direct rainfall predictions. Such qualitative early signals are of potential utility to the operational forecaster, provided the forecast is reliable. While large ensemble forecasts will often include extreme scenarios, understanding at a glance when extreme risk is elevated/suppressed provides a useful operating heuristic.
Further, the precursors have particular use for understanding very uncertain forecasts. As an example we consider the forecast from 8 May, predicting IVTmag for 15 May (a 7 d lead time), indicated by the red box in the top right panel of Fig. 13. Some members predicted an exceptional moisture transport over Italy, while others indicated a suppressed transport anomaly. To understand the differences between the scenarios captured by this particular ensemble forecast, we compute a sensitivity plot: we choose the five ensemble members with the highest IVTmag precursor prediction and the five members with the lowest IVTmag precursor prediction and compute two separate sub-ensemble means. Figure 14 shows the differences in the Z500 flow field between the two sub-ensembles and clearly indicates that the precise longitude of the Newfoundland cyclone is vital in determining the ultimate downstream development, altering the degree of wave breaking, and either supporting or suppressing the westerlies over the Atlas Mountains that lead to storm Minerva. Thus we identify a sequence of predictability barriers and a clear predictability horizon for the event, suggesting when they will be overcome (after the cyclone's development on 11 May in the first instance and after the possible wave breaking clarifies on 13 May), information which can be used by forecasters and atmospheric predictability or data assimilation specialists.
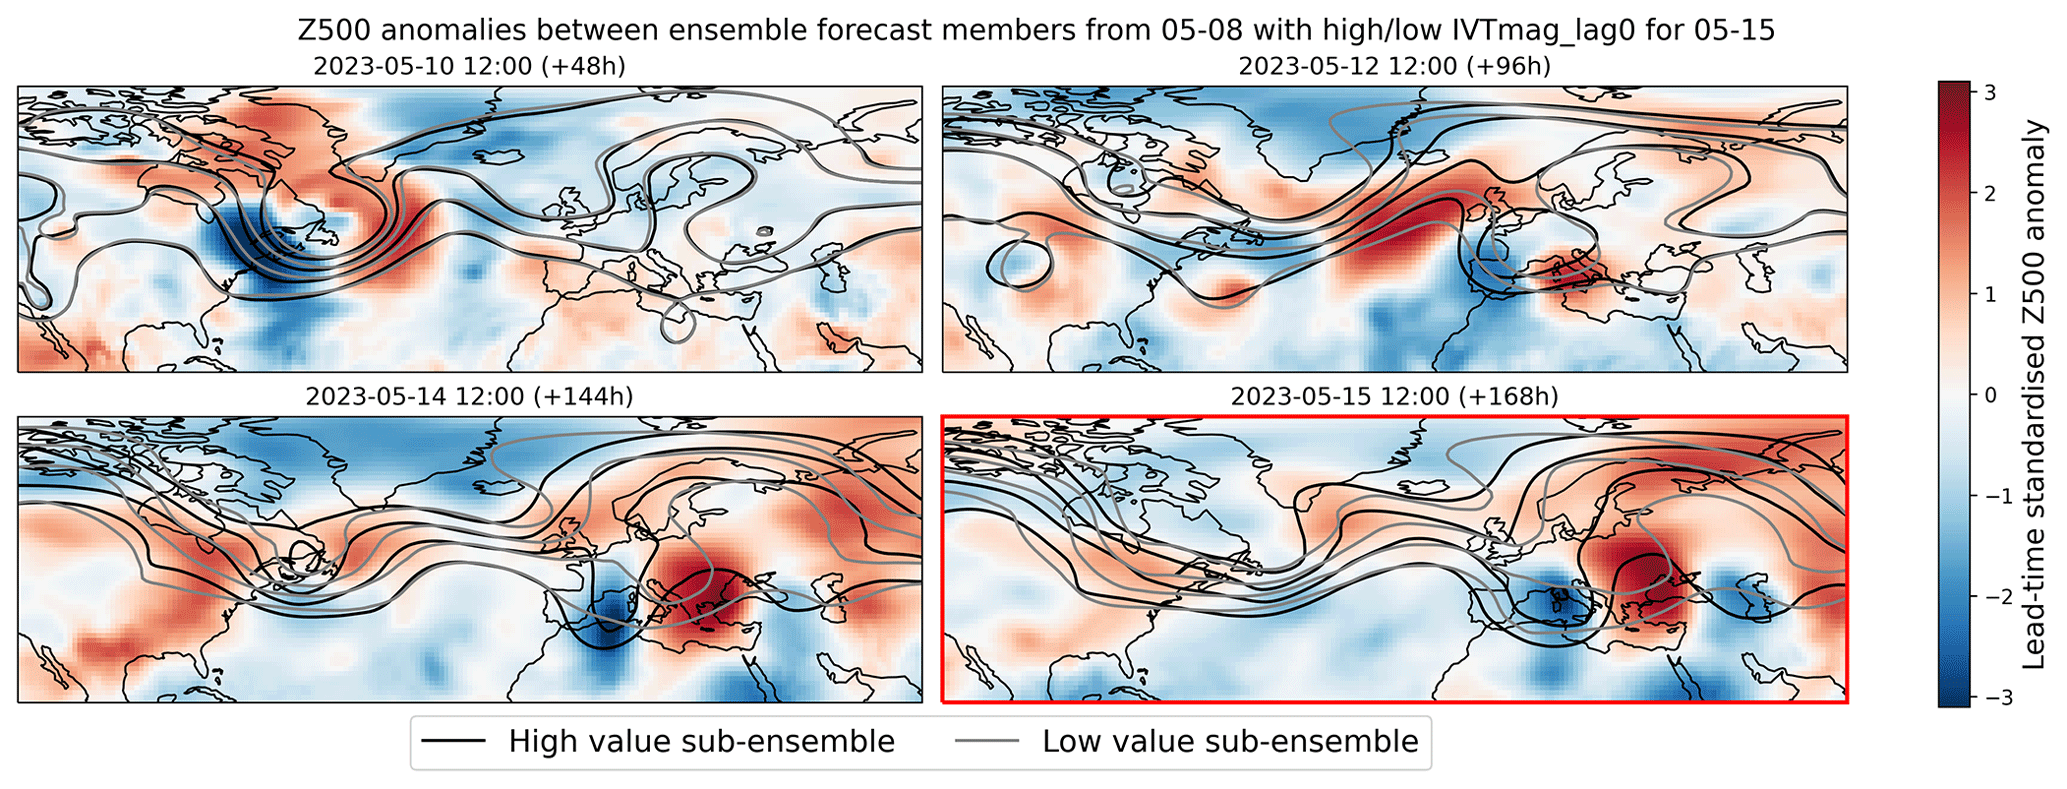
Figure 14An ensemble sensitivity plot showing mean Z500 fields (in contours) for two sub-ensembles of the 8 May 2023 forecast, with their difference (high–low) shown in shading. Sub-ensembles were defined by selecting the five ensemble members with the highest/lowest predicted values for the lag 0 IVTmag precursor activity index on 15 May 2023.
Of course, a natural rejoinder is that we could simply make a sensitivity plot based on members with high/low rainfall over northern Italy, bypassing the concept of flow precursors entirely, as we show in Fig. 15. However, this simplification can obscure matters rather than clarify them: the actual occurrence and intensity of rainfall are determined by boundary layer and mesoscale details which are both unpredictable on weekly timescales and difficult to reason from, not to mention stochastic perturbations in the case of the IFS. We see that the overall magnitude of flow anomalies between the two sub-ensembles is smaller than in the IVTmag-precursor-based plot, and the source of uncertainty is more ambiguous and spatially diffuse. The actual difference in northern Italy rainfall between the precursor-based sub-ensembles is almost as large as the precipitation-based sub-ensembles (Figs. S8 and S9), indicating that this narrative clarity does not come at the cost of overly reduced discrimination. This is not unique to the chosen sensitivity example: Sect. S2 (Fig. S10 onward) presents two additional examples, with very similar results, corresponding to the other red-boxed ensemble forecasts in Fig. 13.
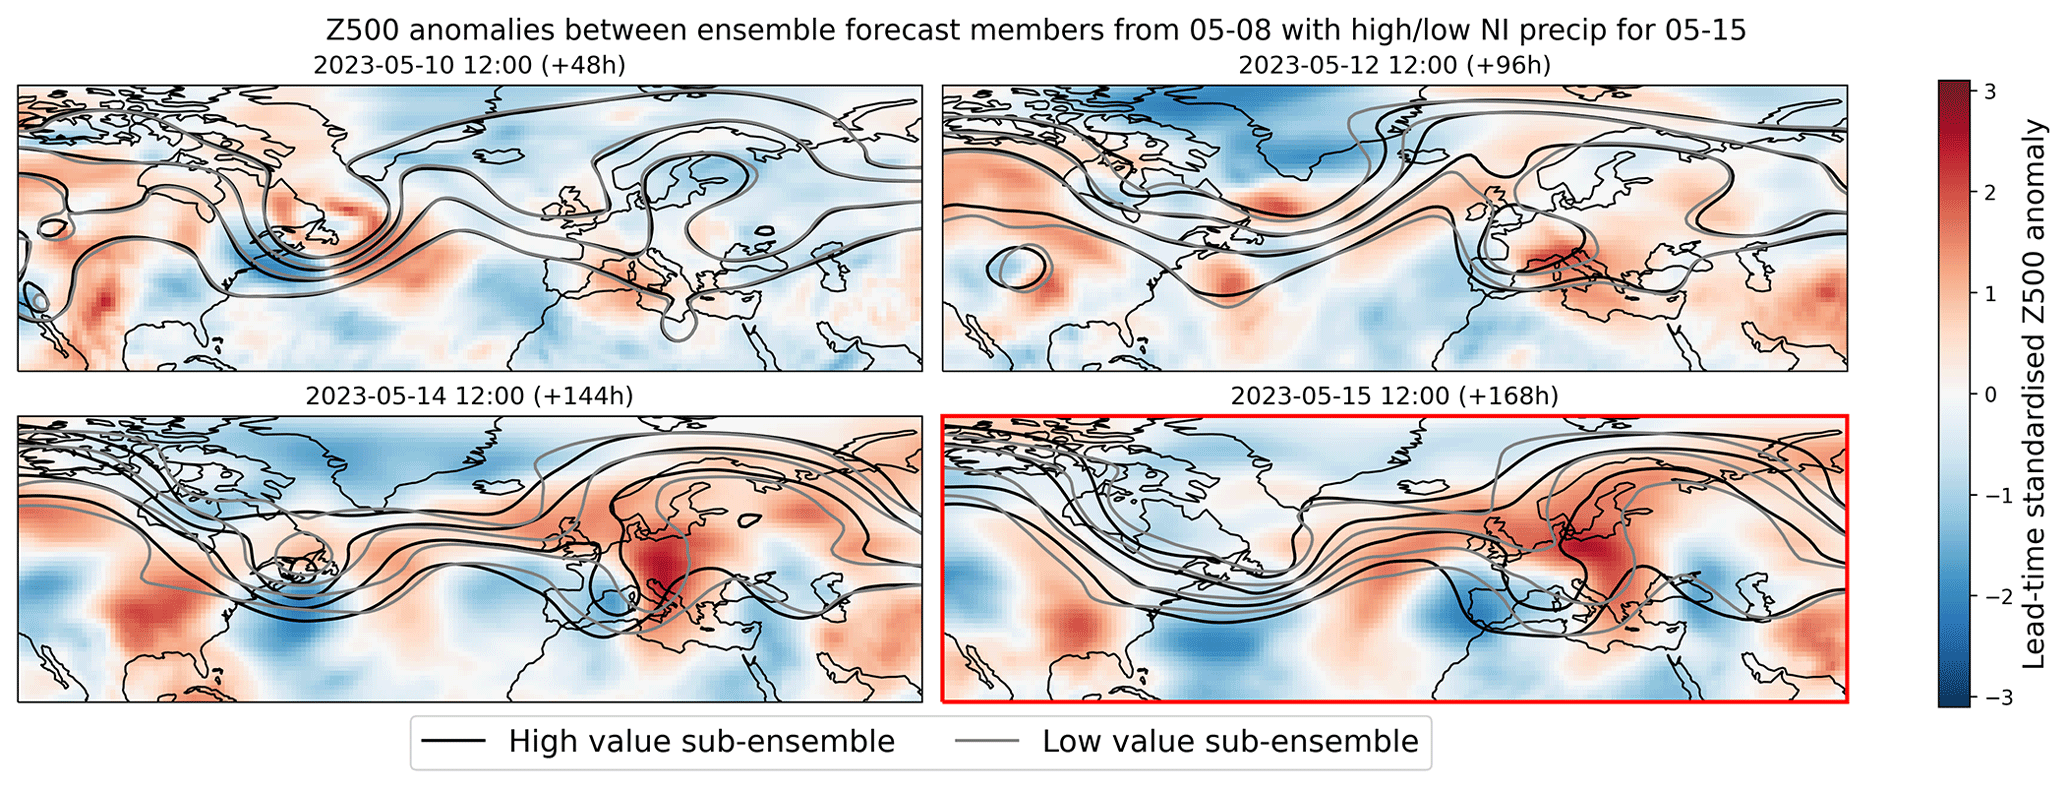
Figure 15As in Fig. 14 but with sub-ensembles defined by the highest/lowest predicted values of rainfall in northern Italy on 15 May 2023.
In this paper we have used two dynamically rooted methods – Lagrangian moisture analysis and event precursor analysis – to explore the dynamics and predictability of springtime rainfall extremes in northern Italy, including specifically the May 2023 flooding event. While these extremes are of interest and have major societal impact in their own right, we have in large part carried out this analysis in order to demonstrate and emphasise the potential of dynamical thinking for concretely assisting in forecasting extreme events.
The Lagrangian perspective has provided unique and important insights that impact the interpretation and understanding of MAM rainfall extremes in northern Italy. Firstly, surface moisture sources (accounting for ∼ 80 % of the total moisture content) are primarily local, within the Mediterranean region, with little apparent importance for long-range moisture transport. The remaining ∼ 20 % of moisture sources may derive from uptakes beyond the 10 d trajectory analysis we consider or from processes like horizontal turbulent mixing. This result contrasts with recent work putting emphasis on non-local moisture (e.g. Insua-Costa et al., 2022), and the balance of sources is seasonal, flow dependent, and conditional on the moisture tracking algorithm used. Regardless, the air masses which carry and then precipitate moisture over Italy assuredly have distinct properties depending on their origin, indicating an important non-local preconditioning at the very least. We have found that these trajectories naturally divide into three origin regions, with low-level recirculating North African air masses driving the majority of rainfall due to their high buoyancy and temperature. Air masses coming from the Atlantic are of secondary importance, while easterly air masses are rare contributors to northern Italy rain. In the case study event, from 15–17 May, all three independent pathways were active and contributed to precipitation at different times over the event. From this perspective, the flooding was a dynamically compound extreme. While Lagrangian trajectories are too complex and computationally expensive to be of direct applied use, the insights generated when studying a particular event class have intriguing operational implications. For example, as much of the rainfall over Italy can be attributed to moisture uptake over Italy, this highlights the importance of accurate soil moisture simulation and the possibility of compounding errors when multiple rainfall events follow each other in swift succession. Further, on the seasonal forecasting (and indeed climate projection) timescale, it is of interest that the dominant NAlow trajectories originate from ∼ 35° N and maintain their high potential temperature, which helps drive their rapid ascent and heavy rainfall contributions. Seasonal anomalies or forced trends in the meridional temperature gradient may therefore result in changes in the severity of northern Italy rainfall, although this goes beyond the scope of the current work.
From an event precursor perspective, we are able to reproduce and extend the existing body of knowledge on the large-scale drivers of northern Italy rainfall and, crucially, synthesise it into an operationally usable form. The compound nature of the case study event, contingent on the details of the European wave breaking, paints a complex dynamical picture with limited deterministic predictability, in agreement with the 3 d forecast horizon for direct precipitation seen in the IFS. However, as the large-scale trough–ridge setup and strong Mediterranean moisture transport were predicted early on, from a precursor perspective there was early signal 8 d ahead of a possible extreme event, albeit of a qualitative nature. In addition, the precursor perspective allows us to identify the evolution of the earlier Newfoundland cyclone on 10 May as the discriminating factor between more and less extreme forecast scenarios. After the cyclone develops, strong geopotential height precursors were well predicted, and high IVTmag precursor scenarios emerge, with spread reducing after the downstream wave breaking clarifies on 13 May. Knowing about this predictability barrier a priori and when it will be overcome provides guidance on when to expect a more reliable forecast and less spread in the ensemble. We should not expect such predictability barriers to be necessarily generic, although investigating whether systematic predictability barriers emerge when considering a class of extreme events is an interesting avenue for future study. Indeed, the in principle case-by-case nature of such barriers necessitates development of tools to identify them in real time.
The development of such tools is, in our opinion, timely. Forecasting involves both prediction and interpretation of the weather, but due to the rapidly increasing complexity and data volumes of operational forecasts, with more initialisation times and ensemble members than ever, it becomes more time-consuming for operational forecasters to go beyond the obvious direct-variable forecasts and to deeply explore the coming scenarios. Therefore synthesis and summary of the relevant large-scale flow features driving an extreme can help to maximise the value of forecasts. Further, we have shown evidence here that precursors can not only flag impactful forecast scenarios, but also help explain them: ensemble sensitivity plots conditioned on precursor activity were more coherent and interpretable than those based on precipitation directly, allowing predictability barriers to be identified.
In contrast to some of the sciences, meteorology is distinct in that the objects of theoretical study are often the exact same ones of relevance to applied practitioners. As we hope to have indicated, there is therefore great potential for dynamical perspectives to improve forecasting directly and not only through improved process understanding and model development. The Lagrangian analysis we have performed here has equal potential to inform the understanding of extreme rainfall in any region, while the flow precursors easily extend to other classes of events as well, such as wind gusts, heatwaves, etc. It is through the development of such extensible and generalisable frameworks, based ideally on openly available code and datasets, that this potential can be realised. In our own ongoing work, we intend to use the approach demonstrated here to produce real-time precipitation precursor forecasts as a proof-of-concept application accessible to interested researchers.
Observational and reanalysis data used in this study, from ERA5, IMERG, and ARCIS, are all publicly available as described in their relevant citations. The relevant ECMWF historical forecast data are freely available for non-commercial use. Precursors were computed with Domino, an open-source Python package available at https://github.com/joshdorrington/domino (joshdorrinton, 2023). Lagrangian pathways were computed with LAGRANTO-ECMWF which is freely available as described in the relevant reference.
The supplement related to this article is available online at: https://doi.org/10.5194/nhess-24-2995-2024-supplement.
JD and MW carried out data preparation, analysis, and visualisation with assistance from FG. JD and MW prepared the paper with contributions from all authors. All authors contributed to conceptualisation, with supervision from CMG.
The contact author has declared that none of the authors has any competing interests.
Publisher’s note: Copernicus Publications remains neutral with regard to jurisdictional claims made in the text, published maps, institutional affiliations, or any other geographical representation in this paper. While Copernicus Publications makes every effort to include appropriate place names, the final responsibility lies with the authors.
The contribution of Marta Wenta is funded by the German Research Foundation (DFG; grant GR 5540/2-1) as part of the Swiss–German collaborative project “The role of coherent air streams in shaping the Gulf stream’s impact on the large-scale extratropical circulation (GULFimpact)”.
The contribution of Christian M. Grams was partially supported by the Helmholtz Association as part of the Young Investigator Group “Sub-seasonal Predictability: Understanding the Role of Diabatic Outflow” (SPREADOUT; grant VH-NG-1243). Joshua Dorrington acknowledges funding by the subproject T2 of the Transregional Collaborative Research Center SFB/TRR 165 “Waves to Weather” (https://www.wavestoweather.de/, last access: 21 August 2024) funded by the German Research Foundation (DFG).
The article processing charges for this open-access publication were covered by the Karlsruhe Institute of Technology (KIT).
This paper was edited by Paolo Tarolli and reviewed by two anonymous referees.
Aemisegger, F. and Papritz, L.: A Climatology of Strong Large-Scale Ocean Evaporation Events. Part I: Identification, Global Distribution, and Associated Climate Conditions, J. Climate, 31, 7287–7312, https://doi.org/10.1175/JCLI-D-17-0591.1, 2018. a
ARPAE: Rapporto dell'evento dal 16 al 18 maggio 2023, Tech. rep., https://www.arpae.it/it/notizie/rapporto_idro_meteo_20230516-18.pdf (last access: 21 August 2024), 2023. a
AST: Alluvione. Oltre 8,8 miliardi di euro: è la stima provvisoria dei danni, di cui 1,8 per interventi necessari a fare fronte all'emergenza, https://protezionecivile.regione.emilia-romagna.it/notizie/2023/giugno/alluvione-oltre-8-8-miliardi-di-euro-la-stima-provvisoria-dei-danni-di-cui-1-8-per-interventi-necessari-a-fare-fronte-emergenza (last access: 21 August 2024), 2023. a
Barnes, C., Faranda, D., Coppola, E., Grazzini, F., Zachariah, M., Lu, C., Kimutai, J., Pinto, I., Pereira, C. M., Sengupta, S., Vahlberg, M., Singh, R., Heinrich, D., and Otto, F.: Limited Net Role for Climate Change in Heavy Spring Rainfall in Emilia-Romagna, Imperial college london, Report, https://doi.org/10.25561/104550, 2023. a
Brath, A.: Rapporto della Commissione tecnico-scientifica, Tech. rep., https://www.regione.emilia-romagna.it/alluvione/rapporto-della-commissione-tecnico-scientifica (last access: 21 August 2024), 2023. a, b
Dayan, U., Nissen, K., and Ulbrich, U.: Review Article: Atmospheric conditions inducing extreme precipitation over the eastern and western Mediterranean, Nat. Hazards Earth Syst. Sci., 15, 2525–2544, https://doi.org/10.5194/nhess-15-2525-2015, 2015. a
Dorrington, J., Grams, C., Grazzini, F., Magnusson, L., and Vitart, F.: Domino: A New Framework for the Automated Identification of Weather Event Precursors, Demonstrated for European Extreme Rainfall, Q. J. Roy. Meteorol. Soc., 150, 776–795, https://doi.org/10.1002/qj.4622, 2023. a, b, c, d, e, f, g, h
Drumond, A., Nieto, R., Hernandez, E., and Gimeno, L.: A Lagrangian analysis of the variation in moisture sources related to drier and wetter conditions in regions around the Mediterranean Basin, Nat. Hazards Earth Syst. Sci., 11, 2307–2320, https://doi.org/10.5194/nhess-11-2307-2011, 2011. a
Duffourg, F. and Ducrocq, V.: Origin of the moisture feeding the Heavy Precipitating Systems over Southeastern France, Nat. Hazards Earth Syst. Sci., 11, 1163–1178, https://doi.org/10.5194/nhess-11-1163-2011, 2011. a
Flaounas, E., Fita, L., Lagouvardos, K., and Kotroni, V.: Heavy rainfall in Mediterranean cyclones, Part II: Water budget, precipitation efficiency and remote water sources, Clim. Dynam., 53, 2539–2555, https://doi.org/10.1007/s00382-019-04639-x, 2019. a, b
Gangoiti, G., Gómez-Domenech, I., Sáez de Cámara, E., Alonso, L., Navazo, M., Iza, J., García, J. A., Ilardia, J. L., and Millán, M. M.: Origin of the water vapor responsible for the European extreme rainfalls of August 2002: 2. A new methodology to evaluate evaporative moisture sources, applied to the August 11–13 central European rainfall episode, J. Geophys. Res.-Atmos., 116, D21103, https://doi.org/10.1029/2010JD015538, 2011. a, b
Gascón, E., Montani, A., and Hewson, T. D.: Post-Processing Output from Ensembles with and without Parametrised Convection, to Create Accurate, Blended, High-Fidelity Rainfall Forecasts, arXiv [preprint], https://doi.org/10.48550/arXiv.2301.04485, 2023. a
Grazzini, F., Fragkoulidis, G., Pavan, V., and Antolini, G.: The 1994 Piedmont Flood: An Archetype of Extreme Precipitation Events in Northern Italy, Bulletin of Atmospheric Science and Technology, 1, 283–295, https://doi.org/10.1007/s42865-020-00018-1, 2020. a
Grazzini, F., Fragkoulidis, G., Teubler, F., Wirth, V., and Craig, G. C.: Extreme Precipitation Events over Northern Italy. Part II: Dynamical Precursors, Q. J. Roy. Meteor. Soc., 147, 1237–1257, https://doi.org/10.1002/qj.3969, 2021. a, b, c
Grazzini, F., Dorrington, J., Grams, C. M., Craig, G. C., Magnusson, L., and Vitart, F.: Improving forecasts of precipitation extremes over northern and central Italy using machine learning Q. J. Roy. Meteor. Soc., 150, 3167–3181 https://doi.org/10.1002/qj.4755, 2024. a
Haiden, T. and Janousek, M.: Tech Memo 911: Evaluation of ECMWF Forecasts, Including the 2023 Upgrade, ECMWF, https://doi.org/10.21957/d47ba5263c, 2023. a, b
Haiden, T., Sandu, I., Balsamo, G., Arduini, G., and Beljaars, A.: Addressing Biases in Near-Surface Forecasts, ECMWF, https://doi.org/10.21957/eng71d53th, 2018. a
Hermoso, A., Homar, V., and Plant, R. S.: Potential of Stochastic Methods for Improving Convection-Permitting Ensemble Forecasts of Extreme Events over the Western Mediterranean, Atmos. Res., 257, 105571, https://doi.org/10.1016/j.atmosres.2021.105571, 2021. a
Hersbach, H., Bell, B., Berrisford, P., Hirahara, S., Horányi, A., Muñoz-Sabater, J., Nicolas, J., Peubey, C., Radu, R., Schepers, D., Simmons, A., Soci, C., Abdalla, S., Abellan, X., Balsamo, G., Bechtold, P., Biavati, G., Bidlot, J., Bonavita, M., De Chiara, G., Dahlgren, P., Dee, D., Diamantakis, M., Dragani, R., Flemming, J., Forbes, R., Fuentes, M., Geer, A., Haimberger, L., Healy, S., Hogan, R. J., Hólm, E., Janisková, M., Keeley, S., Laloyaux, P., Lopez, P., Lupu, C., Radnoti, G., de Rosnay, P., Rozum, I., Vamborg, F., Villaume, S., and Thépaut, J.-N.: The ERA5 Global Reanalysis, Q. J. Roy. Meteor. Soc., 146, 1999–2049, https://doi.org/10.1002/qj.3803, 2020. a, b
Huffman, G. J., Stocker, E. F., Bolvin, D. T., Nelkin, E. J., and Tan, J.: GPM IMERG Late Precipitation L3 Half Hourly 0.1 degree x 0.1 degree V06, Greenbelt, MD, Goddard Earth Sciences Data and Information Services Center (GES DISC) [data set], https://doi.org/10.5067/GPM/IMERG/3B-HH-L/06, 2019. a
Insua-Costa, D., Senande-Rivera, M., Llasat, M. C., and Miguez-Macho, G.: A Global Perspective on Western Mediterranean Precipitation Extremes, npj Climate and Atmospheric Science, 5, 1–7, https://doi.org/10.1038/s41612-022-00234-w, 2022. a
joshdorrinton: Domino, GitHub [software], https://github.com/joshdorrington/domino (last access: 21 August 08 2024), 2023. a
Jullien, N., Vignon, É., Sprenger, M., Aemisegger, F., and Berne, A.: Synoptic conditions and atmospheric moisture pathways associated with virga and precipitation over coastal Adélie Land in Antarctica, The Cryosphere, 14, 1685–1702, https://doi.org/10.5194/tc-14-1685-2020, 2020. a
Keil, C., Heinlein, F., and Craig, G. C.: The Convective Adjustment Time-Scale as Indicator of Predictability of Convective Precipitation, Q. J. Roy. Meteorol. Soc., 140, 480–490, https://doi.org/10.1002/qj.2143, 2014. a
Khodayar, S., Davolio, S., Di Girolamo, P., Lebeaupin Brossier, C., Flaounas, E., Fourrie, N., Lee, K.-O., Ricard, D., Vie, B., Bouttier, F., Caldas-Alvarez, A., and Ducrocq, V.: Overview towards improved understanding of the mechanisms leading to heavy precipitation in the western Mediterranean: lessons learned from HyMeX, Atmos. Chem. Phys., 21, 17051–17078, https://doi.org/10.5194/acp-21-17051-2021, 2021. a
Lavers, D. A., Harrigan, S., and Prudhomme, C.: Precipitation Biases in the ECMWF Integrated Forecasting System, J. Hydrometeorol., 22, 1187–1198, https://doi.org/10.1175/JHM-D-20-0308.1, 2021. a
Leon, J. A. P.: Scale-Dependent Verification of Precipitation and Cloudiness at ECMWF, https://www.ecmwf.int/en/newsletter/174/earth-system-science/scale-dependent-verification-precipitation-and-cloudiness (last access: 21 August 2024), 2023. a
Martius, O., Schwierz, C., and Davies, H. C.: Far-upstream precursors of heavy precipitation events on the Alpine south-side, Q. J. Roy. Meteor. Soc., 134, 417–428, https://doi.org/10.1002/qj.229, 2008. a, b
Marullo, S., Serva, F., Iacono, R., Napolitano, E., di Sarra, A., Meloni, D., Monteleone, F., Sferlazzo, D., Silvestri, L. D., de Toma, V., Pisano, A., Bellacicco, M., Landolfi, A., Organelli, E., Yang, C., and Santoleri, R.: Record-Breaking Persistence of the 2022/23 Marine Heatwave in the Mediterranean Sea, Environ. Res. Lett., 18, 114041, https://doi.org/10.1088/1748-9326/ad02ae, 2023. a
Massacand, A. and Wernli, H.: Heavy precipitation on the Alpine Southside: An upper-level precursor, Geophys. Res. Lett., 25, 1435–1438, https://doi.org/10.1029/98GL50869, 1998. a, b
Miglietta, M. M. and Davolio, S.: Dynamical forcings in heavy precipitation events over Italy: lessons from the HyMeX SOP1 campaign, Hydrol. Earth Syst. Sci., 26, 627–646, https://doi.org/10.5194/hess-26-627-2022, 2022. a
Papritz, L., Aemisegger, F., and Wernli, H.: Sources and Transport Pathways of Precipitating Waters in Cold-Season Deep North Atlantic Cyclones, J. Atmos. Sci., 78, 3349–3368, https://doi.org/10.1175/JAS-D-21-0105.1, 2021. a
Pavan, V., Antolini, G., Barbiero, R., Berni, N., Brunier, F., Cacciamani, C., Cagnati, A., Cazzuli, O., Cicogna, A., De Luigi, C., Di Carlo, E., Francioni, M., Maraldo, L., Marigo, G., Micheletti, S., Onorato, L., Panettieri, E., Pellegrini, U., Pelosini, R., Piccinini, D., Ratto, S., Ronchi, C., Rusca, L., Sofia, S., Stelluti, M., Tomozeiu, R., and Torrigiani Malaspina, T.: High Resolution Climate Precipitation Analysis for North-Central Italy, 1961–2015, Clim. Dynam., 52, 3435–3453, https://doi.org/10.1007/s00382-018-4337-6, 2019. a
Raveh-Rubin, S. and Wernli, H.: Large-scale wind and precipitation extremes in the Mediterranean: a climatological analysis for 1979–2012, Q. J. Roy. Meteor. Soc., 141, 2404–2417, https://doi.org/10.1002/qj.2531, 2015. a, b, c
Sanchez, C., Gray, S., Volonte, A., Pantillon, F., Berthou, S., and Davolio, S.: How a warmer Mediterranean preconditions the upper-level environment for the development of Medicane Ianos, EGUsphere [preprint], https://doi.org/10.5194/egusphere-2023-2431, 2023. a
Sodemann, H., Schwierz, C., and Wernli, H.: Interannual variability of Greenland winter precipitation sources: Lagrangian moisture diagnostic and North Atlantic Oscillation influence, J. Geophys. Res., 113, D03107, https://doi.org/10.1029/2007JD008503, 2008. a, b, c
Sprenger, M. and Wernli, H.: The LAGRANTO Lagrangian analysis tool – version 2.0, Geosci. Model Dev., 8, 2569–2586, https://doi.org/10.5194/gmd-8-2569-2015, 2015. a
Trigo, I. F., Bigg, G. R., and Davies, T. D.: Climatology of Cyclogenesis Mechanisms in the Mediterranean, Mon. Weather Rev., 130, 549–569, https://doi.org/10.1175/1520-0493(2002)130<0549:COCMIT>2.0.CO;2, 2002. a
Winschall, A., Sodemann, H., Pfahl, S., and Wernli, H.: How important is intensified evaporation for Mediterranean precipitation extremes?, J. Geophys. Res.-Atmos., 119, 5240–5256, https://doi.org/10.1002/2013JD021175, 2014. a, b, c
Xin, F., Peng, D., Liu, R., and Liu, S.-C.: Moisture sources for the weather pattern classified extreme precipitation in the first rainy season over South China, Int. J. Climatol., 42, 6027–6041, https://doi.org/10.1002/joc.7576, 2022. a
- Abstract
- Introduction
- Dynamics of northern Italy rainfall
- Data and methods
- Climatological perspectives on extreme rainfall in northern Italy
- Dynamics of 15–17 May 2023
- Predictability and forecast interpretation
- Discussion and conclusions
- Code and data availability
- Author contributions
- Competing interests
- Disclaimer
- Acknowledgements
- Financial support
- Review statement
- References
- Supplement