the Creative Commons Attribution 4.0 License.
the Creative Commons Attribution 4.0 License.
 | 09 Aug 2024
Temporal clustering of precipitation for detection of potential landslides
Emanuele Bevacqua
Pauline Rivoire
Sérgio C. Oliveira
Joaquim G. Pinto
Alexandre M. Ramos
Carlo De Michele
Landslides are complex phenomena that cause important impacts in vulnerable areas, including the destruction of infrastructure, environmental damage, and loss of life. The occurrence of landslide events is often triggered by rainfall episodes, single and intense ones or multiple ones occurring in sequence, i.e., clustered in time. Landslide prediction is typically obtained via process-based or empirical thresholds. Here, we develop a new approach that uses information on the temporal clustering of rainfall to detect landslide events and compare it with the use of classical empirical rainfall thresholds. In addition, we evaluate the performance of the two approaches combined together as a case study in the region of Lisbon in Portugal. We consider a dataset that categorizes landslides into shallow and deep events and a review of empirical rainfall thresholds that makes a good benchmark for testing our novel method. We show that the new approach based on temporal clustering overall has a good power of detecting landslide events but has a skill comparable with the classic rainfall threshold method. While there is no clear outperformance of one method, the novel clustering-based method has a higher sensitivity despite a lower precision than the threshold-based method. For all approaches, the potential detection is better for deep landslides than for shallow ones. The results of this study could help to improve the prediction of rainfall-triggered landslides.
- Article
(4568 KB) - Full-text XML
- BibTeX
- EndNote


Landslides are complex phenomena modulated by several interacting factors which often cause catastrophic consequences in susceptible areas (Herrera et al., 2018; Maraun et al., 2022). Factors playing a role in landslide occurrences can be classified into two main categories (Dai and Lee, 2002): (a) static predisposing variables, like surface-related characteristics (e.g., soil type and slope, lithology, aspect, topography), and (b) triggering (dynamic) variables, like rainfall. Static variables describe factors such as surface-related characteristics which do not immediately cause the landslides but shape the landslide occurrence probability given certain conditions, e.g., weather conditions. Triggering variables describe factors that actually cause the landslides, for example intense precipitation events. Landslides often occur due to multiple factors, i.e., the combination of static and triggering variables or the combination of multiple triggering variables. Such combinations fall in the category of compound events, defined as “the combination of multiple drivers and/or hazards that contributes to societal or environmental risk” (Seneviratne et al., 2012; Leonard et al., 2014; Zscheischler et al., 2020). Hence, compound event analyses can help detect and predict this natural hazard. For example, a compound event perspective allows for understanding the probability of landslides after wildfires, since wildfires change soil characteristics, thereby increasing landslide likelihood (Di Napoli et al., 2020). Notably, temporally compounding precipitation events, i.e., temporal clustering of moderate to extreme rainfall events, can trigger landslides by raising groundwater levels of deep soil and rock layers (Bevacqua et al., 2021).
The latter example is relevant since one of the most important drivers of landslides is rainfall, either short and high-intensity episodes or long-lasting ones (Van Asch et al., 1999). Deep landslides, characterized by a slip surface deeper than about 1.5 m, are usually initiated by multiple moderate-intensity storms occurring over weeks or months (Trigo et al., 2005). Such wet periods can result in high soil moisture and pore water pressure, which are necessary to trigger deep movements (Chen et al., 2017). In contrast, shallow landslides and debris flow take place under a broader range of rainfall conditions, and they are more often associated with short-duration and high-intensity rainfall events (Corominas and Moya, 1999). In line with the above, for the north of Lisbon region, Bevacqua et al. (2021) showed about 70 %–83 % of deep landslides were preceded by a temporal cluster of precipitation events (over 23–90 d before the event). In contrast, only 7 %–9 % of shallow landslides were preceded by a cluster of precipitation (over 4–25 d before the event).
In addition, recent works have considered the combined role of antecedent and peak precipitation in the initiation of landslides (Kim et al., 2021; Nocentini et al., 2024). Antecedent rainfall, inducing a gradual increase in soil moisture and groundwater level, is an important factor in the determination of the slope stability and, therefore, the initiation of landslides (Rahardjo et al., 2001; Rahimi et al., 2011; Lee et al., 2012). Deep landslides, for example, may often be associated with monthly to seasonal fluctuations in the groundwater table. When the water table is high, light to moderate rainfall may provide sufficient water to trigger slope movement (Fuhrmann et al., 2008).
Despite the advances in our comprehension of the major drivers of landslides (Tehrani et al., 2022), processes linking rainfall and landslide occurrence are not yet fully understood, and thus modeling the occurrence of this natural hazard is not straightforward (Guzzetti et al., 2007; Tehrani et al., 2022). The prediction of landslides is mainly approached by defining rainfall thresholds that separate critical and non-critical rainfall events, i.e., events that are more or less likely to trigger landslides (Guzzetti et al., 2007; Segoni et al., 2018). Thresholds for landslide occurrence can be classified in two main typologies: (i) process-based and (ii) empirical. (i) Process-based thresholds are derived from slope stability models and allow for deriving the precipitation amount necessary to trigger the landslide, its date, and its location. However, obtaining such thresholds is often difficult due to data limitations. (ii) Empirical thresholds are estimated by studying past landslides. They are mainly obtained (a) from precipitation measurements during specific rainfall events causing (or not) landslides or (b) from antecedent conditions, i.e., the total precipitation preceding a landslide over different durations. Additional typologies of thresholds were proposed in the literature, and we refer to Guzzetti et al. (2007) for a complete overview. An innovative rainfall threshold is the one by Nocentini et al. (2024), which instead of considering thresholds based on either antecedent rainfall or peak intensity rainfall proposes a 3D threshold implementing both conditions.
The main drawback of empirical rainfall thresholds is that they are calibrated for a specific region, therefore implicitly including geomorphological and meteorological characteristics of the specific site. This prevents having a threshold that can be readily applied to different regions (Abbate et al., 2021). To overcome this limitation, global empirical rainfall thresholds have been developed; however they result in lower performance with a high rate of false alarms (Guzzetti et al., 2007). Hence, a proper general rule is still missing (Zêzere et al., 2008).
Building on the association of temporal clustering of rainfall events and landslides identified by Bevacqua et al. (2021), we investigate whether a compound event perspective may benefit the estimation of the probability of the occurrence of rainfall-triggered landslides, both shallow and deep ones. To this end, we develop a new approach that uses information on the temporal clustering of rainfall to detect landslides, and we compare it with the use of classical empirical rainfall thresholds. In addition, we evaluate the performance of the two approaches combined together. The newly proposed method is an empirically based approach, i.e., does not require any data beyond precipitation and landslide occurrence data. While it does not require a regression fitting, it still requires the definition of a quantile-based threshold of precipitation to identify critical precipitation events. The dependence on the quantile is however investigated to assess whether it may be more easily exported to other sites with respect to regression-based thresholds.
We apply our approach to two landslide datasets in the region of Lisbon in Portugal. For the Lisbon region, Zêzere et al. (2015) provide a collection of landslide events, subdivided into shallow and deep events, and a review of empirical rainfall thresholds, making it a good benchmark to test the novel method. An interesting characteristic of the two datasets is that they deal with areal and not single landslides. Older datasets, like the AVI dataset (Guzzetti et al., 1994), an inventory of landslides and floods that occurred in Italy, record landslides triggered by the same precipitation system as separate events. This is an important limitation when interested in identifying the landslides' triggers; therefore the subdivision between single landslide events and multiple landslide events has been gaining consensus recently. For example, this is the case of the new catalog FraneItalia by Calvello and Pecoraro (2018), the LAND-deFeND database (Napolitano et al., 2018), and the work of Crozier (2017).
The paper is organized as follows: in Sect. 2 we discuss the data and the methodology, results and discussions are provided in Sects. 3 and 4, and conclusions are given in Sect. 5.
Here, we assess the ability of temporal clustering of rainfall to estimate the probability of landslide occurrence, and we compare it with the use of classical rainfall thresholds. This was done for two landslide datasets in the Lisbon region (described in Sect. 2.1) in four steps: (i) rainfall thresholds are estimated (Sect. 2.2); (ii) the presence of temporal clustering of rainfall before each landslide event and before each day is studied (Sect. 2.3); (iii) alarm and non-alarm periods, with the selected approaches, are identified (Sect. 2.5); and (iv) the performance of the different approaches in landslide detection are assessed with the help of different metrics (Sect. 2.5).
2.1 Landslide and precipitation data
High levels of destruction caused by natural disasters of hydro-geomorphologic origin have been recorded in Portugal since the late 19th century (the DISASTER database; Zêzere et al., 2014). Until 2015, 281 disastrous landslide records registered considerable adverse consequences in mainland Portugal, such as loss of life (273 deaths) or injury, displaced people (>1600), property damage, economic disruption, or environmental degradation (Pereira et al., 2020). In this context, the Portuguese western Meso-Cenozoic border, in which the north of Lisbon and the Lisbon region are included, is recognized as one of the most high-risk areas (Fig. 1). In this region the number of deaths and missing people represents 21 % of the total in the country, but the displaced people due to landslides reaches almost 70 %, mainly associated with slow-moving deep-seated rotational and translational slides (Zêzere et al., 2014). Regionally, landslides are primarily controlled by lithology, geological structure, hydrogeological conditions, and slope. In the latter, shallow soil slips tend to concentrate on slopes steeper than 15° and deep-seated landslides on gentle to moderate slopes (5–15°), which are more favorable to water infiltration and storage (de Brum Ferreira and Zêzere, 1997).
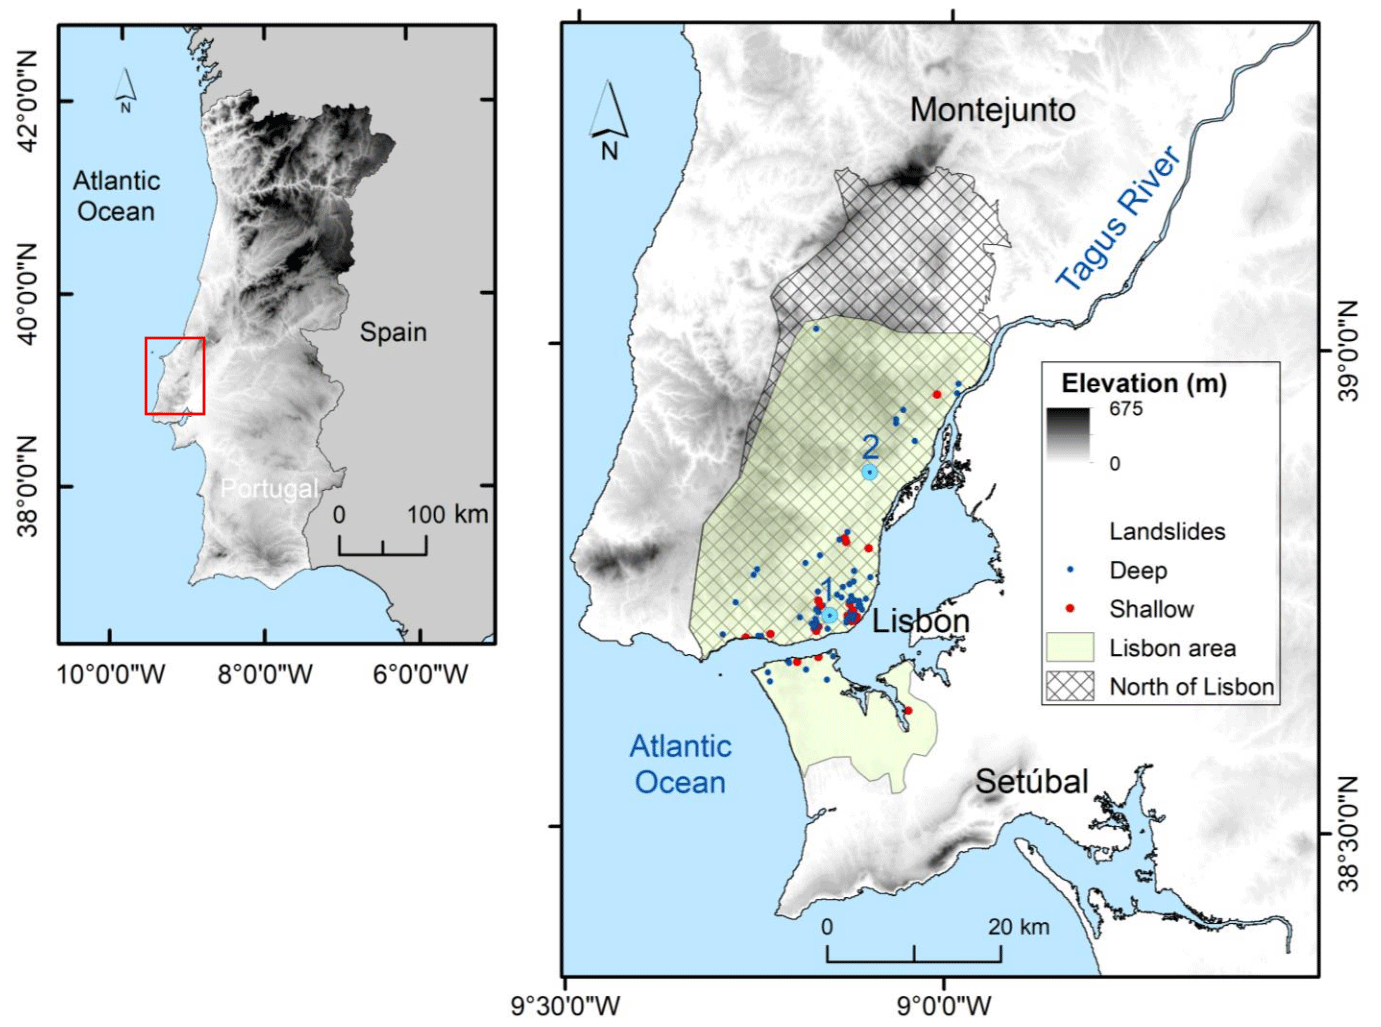
Figure 1North of Lisbon and Lisbon study areas. Dots represent the landslide cases associated with the different landslide events described in the DISASTER database available from Zêzere et al. (2022). Red dots represent shallow landslide events and blue dots the deep landslide events. Rainfall gauges (blue circles): (1) Lisboa Geofísico and (2) São Julião do Tojal. The landslides associated with the north of Lisbon dataset were not included to improve readability.
We selected the events from two datasets of landslides in the Lisbon region by Zêzere et al. (2015), since they were characterized by both shallow and deep events (Fig. 1). The first dataset covers the area of Lisbon from 1865 until 2010, and it includes 39 events which were collected from newspapers (Vaz et al., 2013). For this inventory, the landslide type is estimated based on the associated critical pair of rainfall intensity and duration preceding the landslide. The second dataset covers the north of Lisbon region from 1956 until 2010, and it includes 25 events (Zêzere and Trigo, 2011). Data were obtained from multiple sources: technical and scientific documents, fieldwork, and interviews with the local population. The distinction between deep and shallow landslides is based on the slip surface depth, with depths lower than 1.5 m associated with shallow landslides. For additional information about the two datasets, please refer to Zêzere and Trigo (2011), Vaz et al. (2013), and Zêzere et al. (2015). It is important to highlight that we are working here with landslide event dates and not with individual landslides; i.e., multiple landslides can occur during a landslide event (see Sect. 4.3).
A daily precipitation time series for the Lisbon area during 1863–2018 was obtained from the meteorological station of Lisboa-Geofísico, and it can be downloaded from the Portuguese Institute for Sea and Atmosphere (IPMA). To study the north of Lisbon region, the daily IBERIA02 dataset was employed (Belo-Pereira et al., 2011). The dataset has a 0.2° resolution (approx. 19.6 km), and the grid cell closest to the landslide events was chosen.
After an examination of the yearly distribution of landslide events in both datasets, we narrowed the analysis to the November–March period, when the majority of landslides occurred.
2.2 Empirical rainfall threshold estimation
The new method proposed in this work was compared with the empirical rainfall thresholds. One of the critical steps in the evaluation of rainfall thresholds is the definition of the critical rainfall period associated with each landslide event. We follow the approach of Zêzere et al. (2015), who assess the critical pair duration–quantity of rainfall preceding the landslide event as the one associated with the highest return period. The method works as follows: (i) the precipitation total along the whole time series for each time window of size from 1 to 90 d is calculated; (ii) for each duration the maximum over each year is computed; (iii) the series of maxima is fitted using a Gumbel distribution; (iv) the precipitation total preceding the landslide events, for windows of 1 to 90 d ending the day of the event, is computed (see Fig. 2); (v) the return period of each of these duration–quantity pairs is evaluated using the parameters of the Gumbel distribution estimated in step (iii); and (vi) for each landslide event the duration–quantity pair with the highest return period is considered the critical rainfall return period. Once the critical duration–quantity pair for each event is collected, a regression is fitted to these data to obtain the critical rainfall for each possible duration. For the north of Lisbon region, Zêzere et al. (2015) fitted a linear regression, while for the Lisbon area they fitted a potential regression: a lower-limit linear threshold that limits rainfall conditions below which no landslides occurred in the record and an upper-limit potential threshold above which landslides have been systematically observed. These regression curves are the rainfall threshold for landslide initiation.
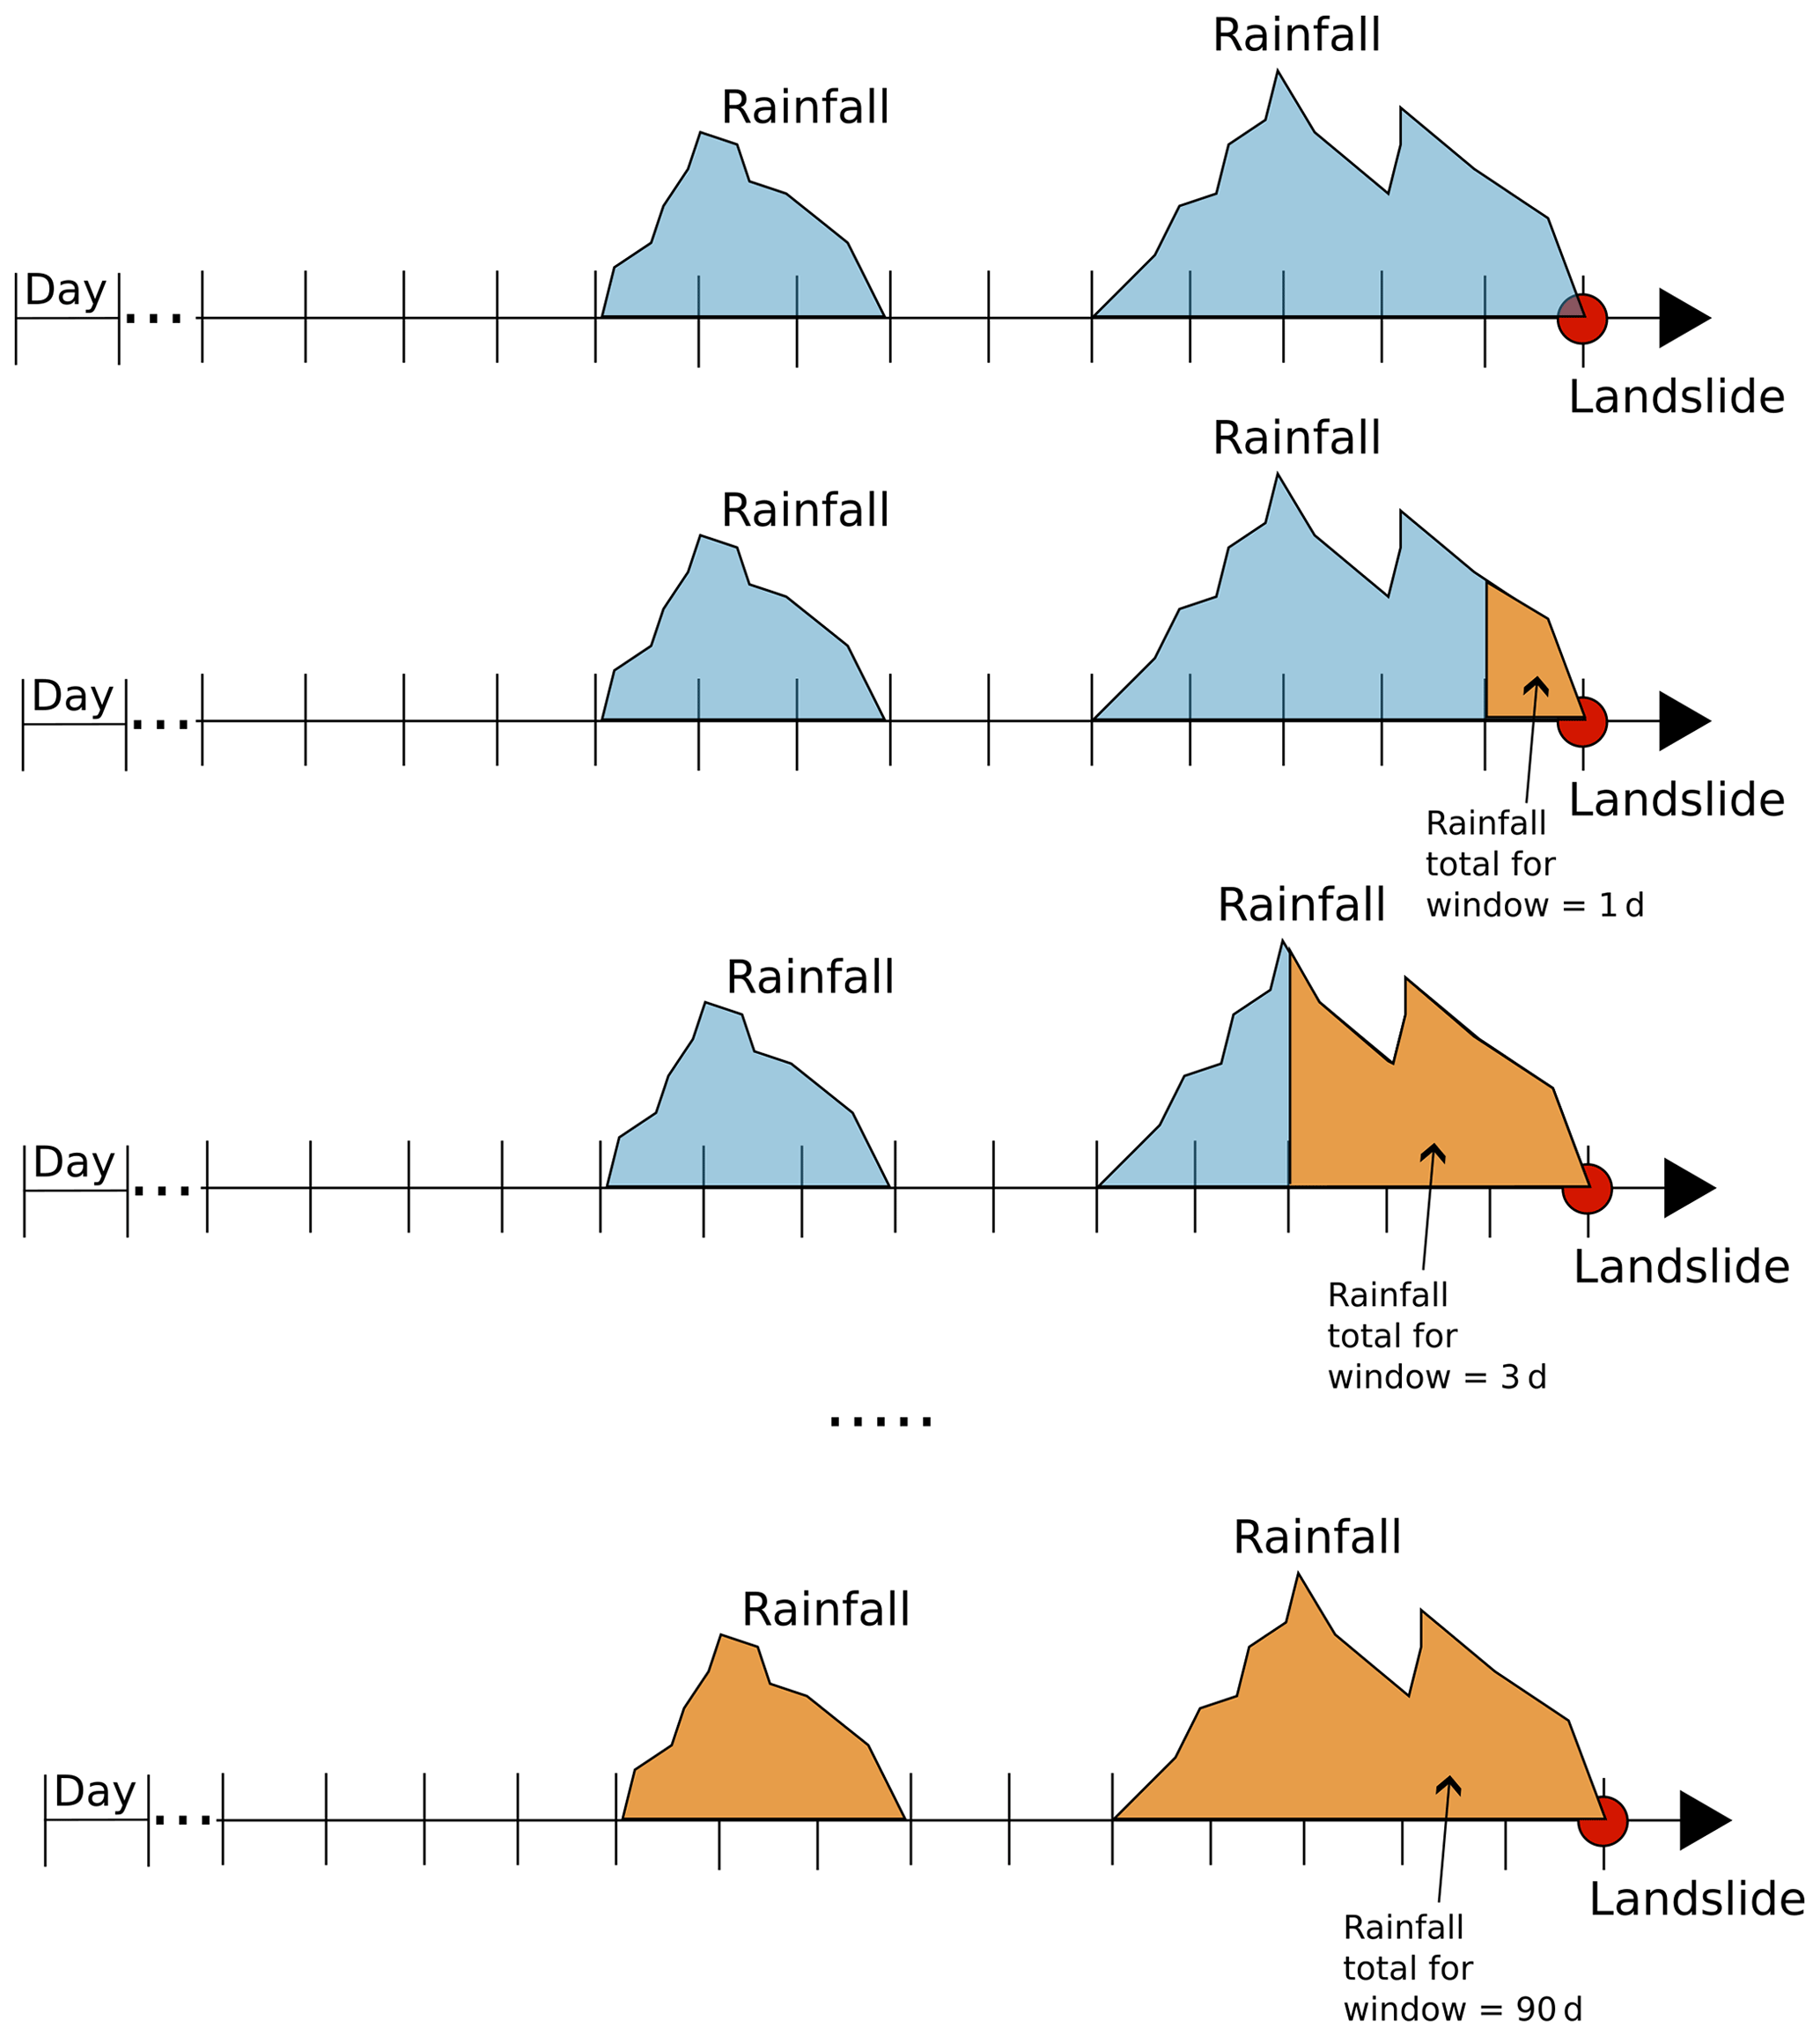
Figure 2Illustration of step (iv) (presented in Sect. 2.2) for the computation of rainfall thresholds. The first row represents the time series of precipitation prior to the occurrence of the landslide (shown as a red dot). The following rows show the accumulated precipitation (in orange) over time windows of different lengths prior to the landslide. By expanding the time window, more precipitation before the landslide is considered.
In this work, we computed the empirical thresholds for the two datasets following the same procedure of Zêzere et al. (2015). We selected the potential regression for the Lisbon area and the linear regression for the north of Lisbon region, based on the results of Zêzere et al. (2015), for comparison with the proposed method based on precipitation clustering.
2.3 Identification of temporal clustering of rainfall
In order to evaluate the occurrence of temporal clustering of rainfall before each landslide event, we employed the approach proposed by Banfi and De Michele (2022), extending the method of Bevacqua et al. (2021), with a different consideration of the effective window size as discussed below. The method is based on the idea that, once high-frequency clustering is removed, the number of precipitation events in a window is distributed as a binomial distribution in the absence of lower-frequency clusters.
The binomial distribution is the discrete probability distribution of the number of successes in n independent trials. Each trial can have only two outcomes, yes or no, and the probability of having a yes in each individual trial is equal to p. The parameters of the distribution are therefore p and n. In this case each day is a trial, and the outcome for each day is wet (yes) or dry (no). The probability of having a yes or no in a day is independent of the same probability in the other days; as an example, if day i is wet, it is not more probable that the following days are wet. This is true if the precipitation events are not clustered. If they are clustered, then if day i is wet, it is more probable that the following days are wet. The assumptions of the binomial distribution are therefore not respected.
This method requires a series of independent precipitation events (i.e., stemming from different perturbations). To identify the events, a threshold u of daily precipitation is used. To assure independence between them we adopt a (high-frequency) declustering procedure (Coles, 2001): when two events are separated by less than r days (see Ferro and Segers, 2003, for its estimation), only the first event is retained. Then, the probability of exceedance above u, p, is computed as , where N is the total number of independent events, L the total length of the series, and D is the number of days in which events were removed with high-frequency declustering.
Let x be the day for which the occurrence of a preceding temporal clustering of rainfall needs to be tested, w a time window ending the day x, and n the number of exceedances inside w. A statistical test for the presence of clusters can be defined (Fig. 3): the null hypothesis H0 is defined as the absence of temporal clustering of precipitation inside w and the alternative hypothesis H1 as the presence of temporal clustering of precipitation inside w. H0 is rejected if n is larger than what is expected from a binomial distribution of parameters weff and p, with a α % significance level. Here, weff is the effective window that takes into account the effect of the (high-frequency) declustering on the low-frequency clustering, equal to w−d, where d is the number of days exceeding u in w but already proceeded by at least 1 d exceeding u and at most r.
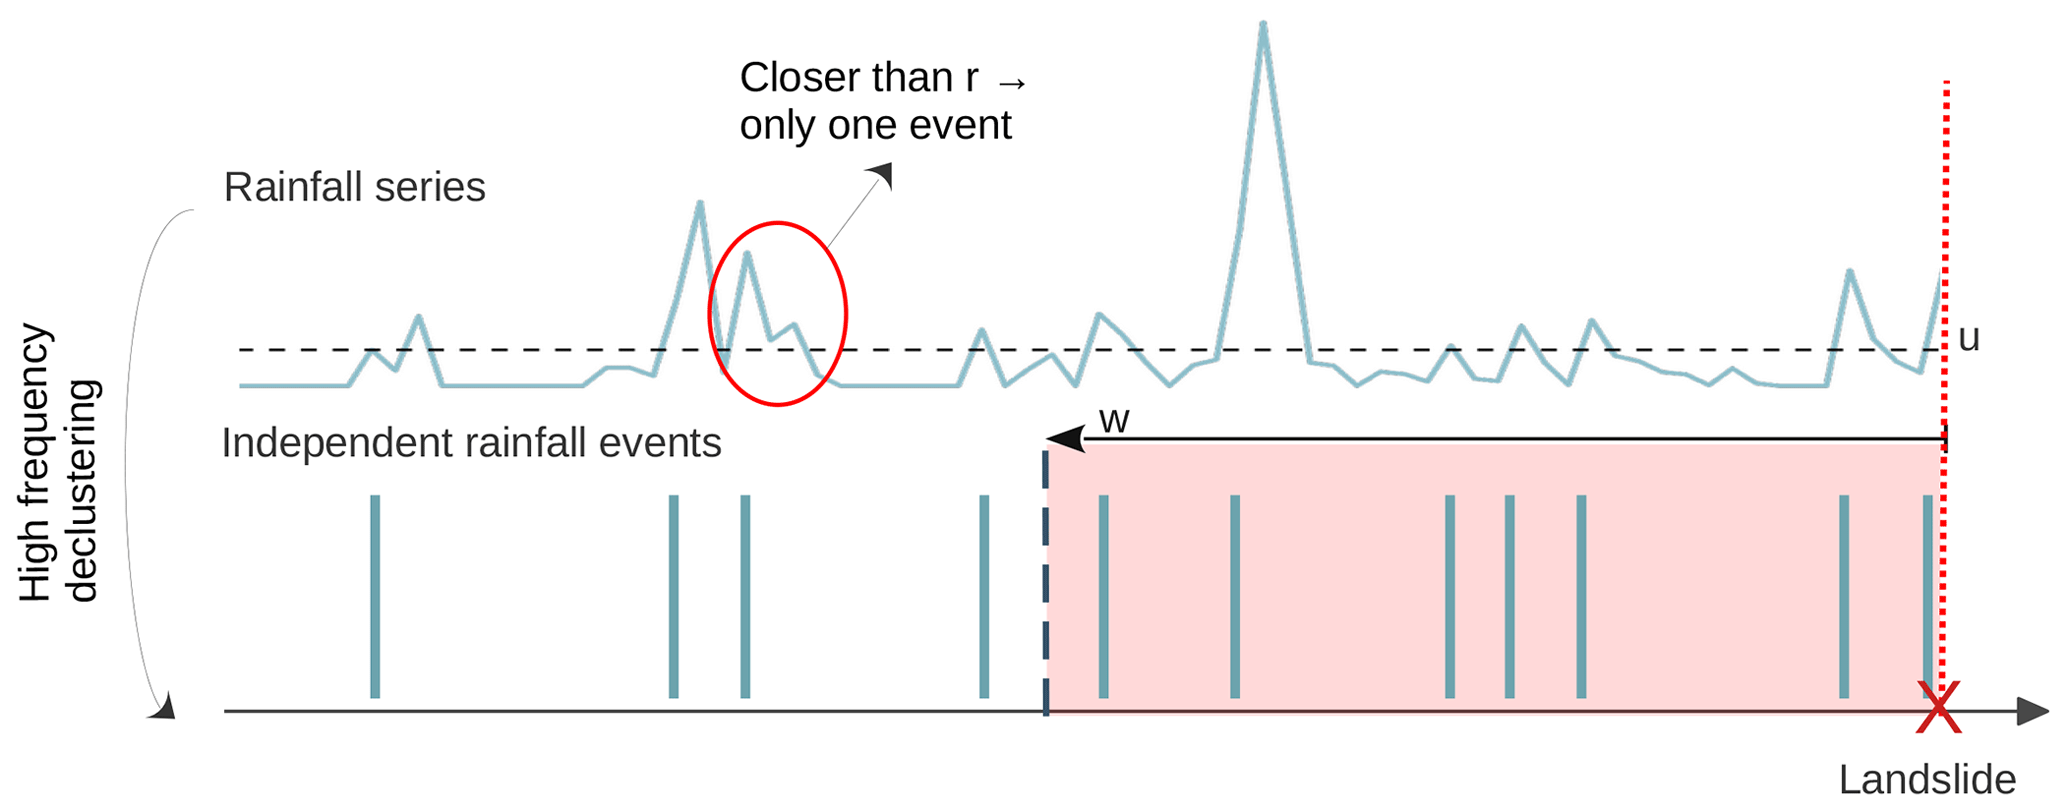
Figure 3Illustration of the detection method adopted for temporal clustering identification (Bevacqua et al., 2021; Banfi and De Michele, 2022). The top curve represents the rainfall time series and the peaks on the second line the selected heavy rainfall events after high-frequency declustering. r is the minimum number of days between two peaks. u is the threshold for heavy rainfall. w represents the time window (in days, red shading) before the occurrence of a landslide (red cross). We count n the number of events in the window w.
In the declustering procedure explained in Barton et al. (2016), we set r to 2 d, and we tested different values for u: namely, the 70th, 75th, 80th, 85th, 90th, and 95th percentile of above-zero daily precipitation. To compute u, we considered only the November–March period, during which the selected landslide events occurred. Regarding the time window w, we tested window sizes varying from 4 to 90 d (Bevacqua et al., 2021). The window size is chosen to include the temporal scales affecting both shallow and deep landslides. Windows shorter than 4 d were not considered since, after high-frequency declustering, more than 3 d are required to have at least two precipitation events. Given that the maximum window size is 90 days, the probability p was computed considering the period August–March.
To obtain the region of significance of the test, we must take into account both the discreetness of the p value and the presence of multiple dependent tests. We therefore adopted the Benjamini–Hochberg procedure (Benjamini and Hochberg, 1995) applied on mid-p values (Heller and Gur, 2011), with a significance level of 5 %. The procedure is the following: (i) the p values and are computed; (ii) the mid-p value is obtained summing pi and ; (iii) the critical value for each individual mid-p value is obtained as , where i is the rank of the p value and m the number of tests; and (iv) the overall critical p value is obtained as the largest individual mid-p value smaller than the critical one. The correction was applied separately on each day with temporal clustering and considering together all the windows from 4 to 90 d.
This procedure was applied with two different goals: (a) investigating the atmospheric drivers of the clustered precipitation events triggering landslides (see Sect. 2.4) and (b) testing the added value of the temporal clustering in landslide detection (see Sect. 2.5).
2.4 Connection between landslides
If two landslide events are triggered by the same precipitation clustering event, the second landslide event does not bring additional information about the triggering conditions. We therefore investigated the connection between multiple landslide events that occurred during the same season (Fig. 4). First, we selected seasons with more than one landslide event associated with precipitation clustering. Then, for each season, (i) we removed all the precipitation events preceding the first landslide event, (ii) we computed the presence of rainfall clustering preceding the second event with the modified series, (iii) we removed all the precipitation events preceding the second landslide event, and (iv) we computed the presence of rainfall clustering preceding the third event with the modified series – and so on for all the events in the same season. If two (or more) consecutive events are associated with temporal clustering of precipitation in the original series, while with the modified series they are not, then the two (or more) consecutive events are considered connected (Fig. 4).
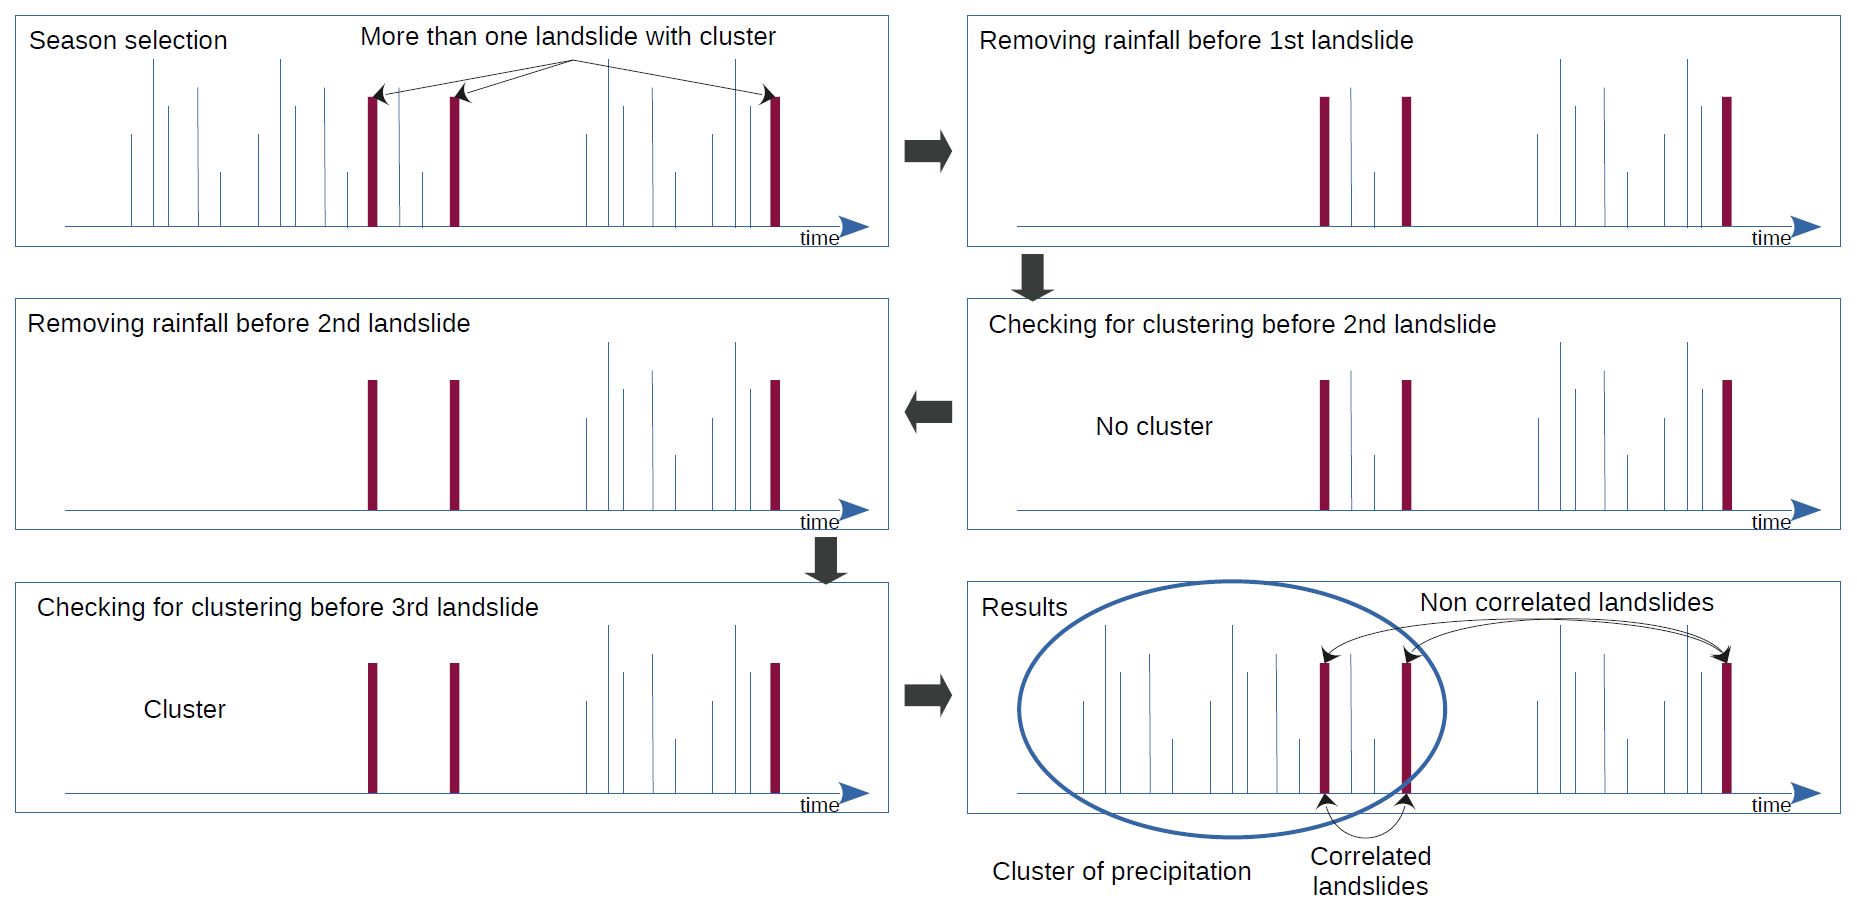
Figure 4Workflow to determine whether the triggering conditions of two landslide events (or more) are related. We gradually remove the precipitation events prior to each landslide (in chronological order) and check whether it removed the presence of temporal clustering of precipitation triggering the following landslide.
2.5 Landslide detection
We considered three approaches to estimate the probability of the occurrence of landslides: (a) the presence of temporal clustering of rainfall, (b) a rainfall duration-quantity pair above the rainfall threshold, and (c) the “and” combination of (a) and (b). The approach (a) was tested for different thresholds u (Sect. 2.3). The approach (b) was tested with the rainfall thresholds reported in Sect. 2.2.
To evaluate the performance of the methods, we separated the dataset into a training and a validation set. Due to the limited length of the sample we used a leave-one-out cross-validation. This procedure consists of performing a number of experiments equal to the number of seasons in the record, and for each experiment 1 year is used for testing and all the remaining ones for training.
In this way we had a number of regression parameters equal to the number of years (Fig. 5). For the method based on temporal clustering we have different threshold values for each year since the value of the quantile would be different.
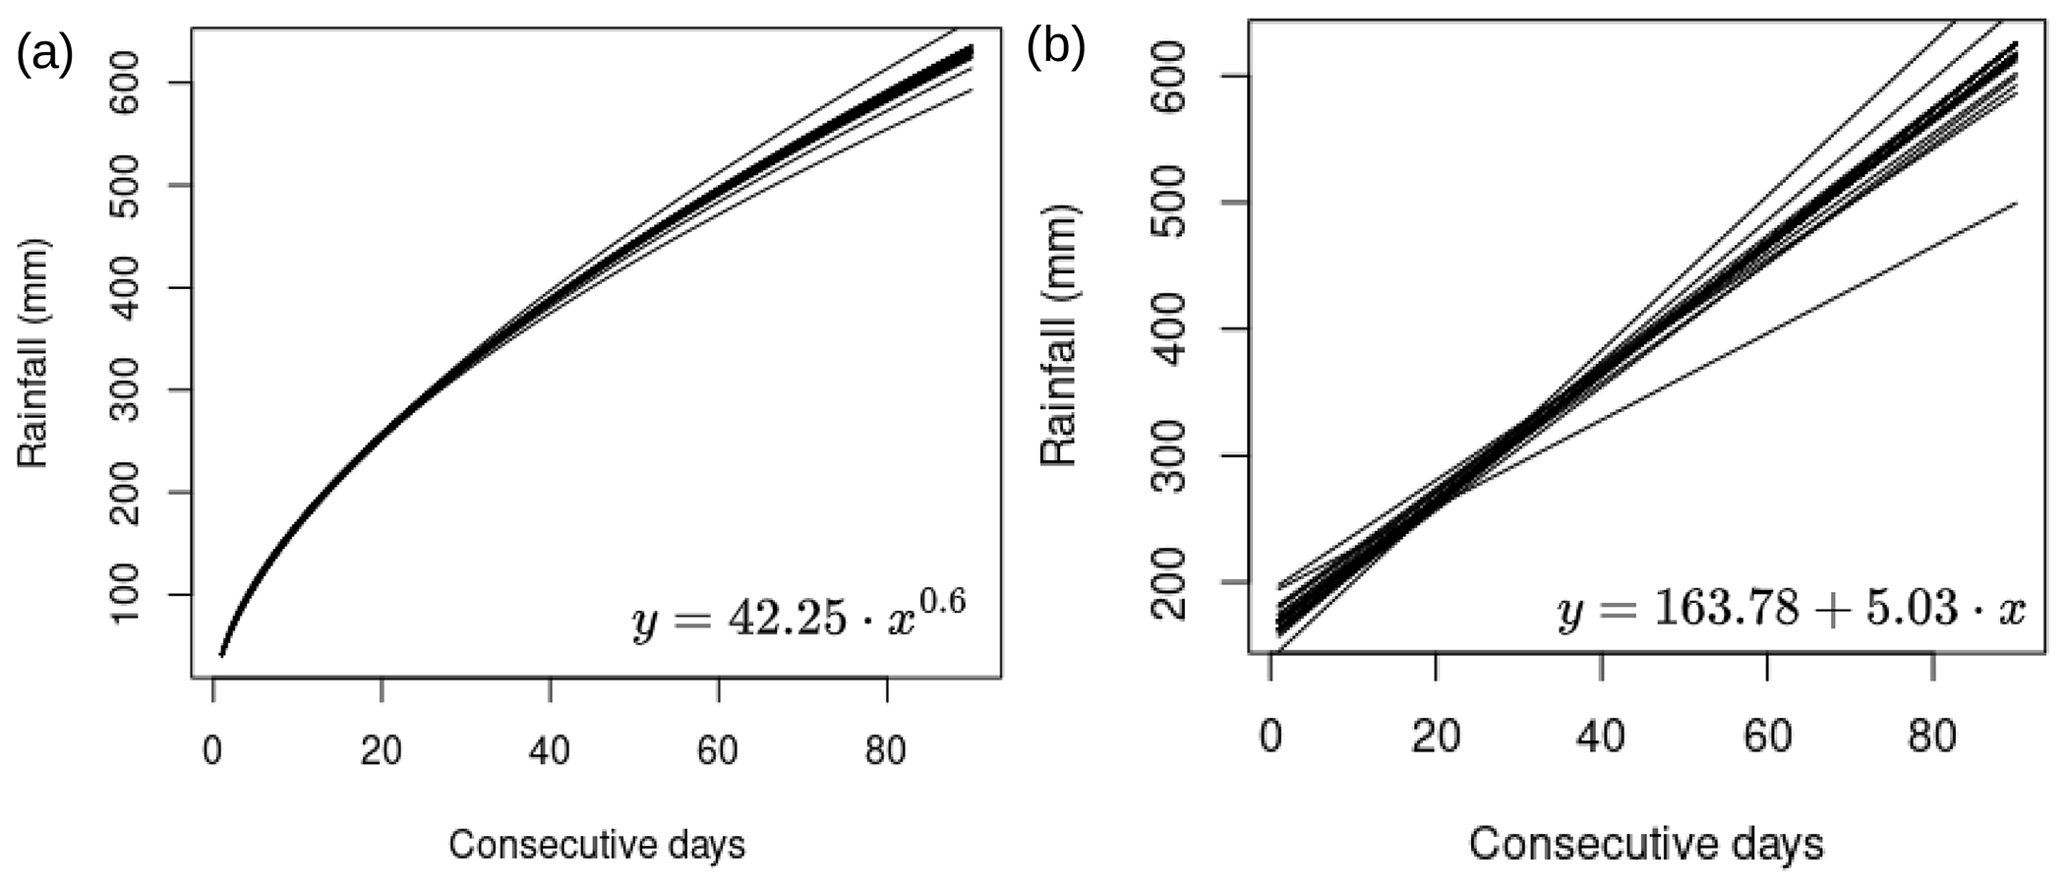
Figure 5Empirical thresholds obtained from the calibration procedure. Panel (a) Lisbon area and panel (b) the north of Lisbon region. In the bottom right the equation of the regression curve with the average parameters is reported.
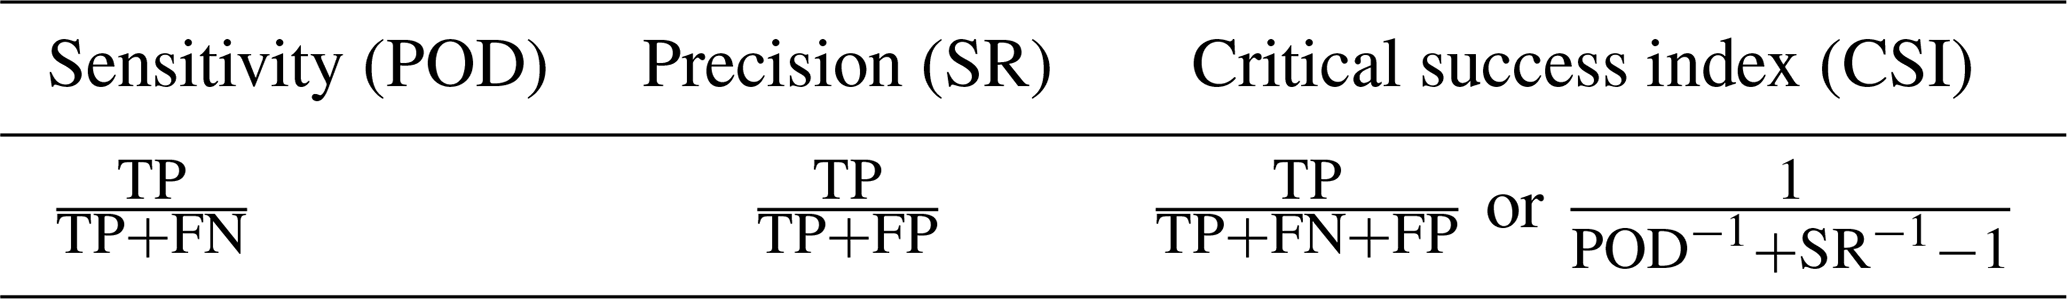
Then we computed three metrics to summarize the results, reported in Table 1. These metrics are based on four quantities: (a) the true positive (TP), which is the number of events accurately predicted; (b) the true negative (TN), which is the number of accurate predictions of the absence of an event; (c) the false positive (FP), which is the number of predicted events that did not occur; and (d) and the false negative (FN), which is the number of non-predicted events. The three metrics are (1) the sensitivity (also called probability of detection), which is the percentage of events that are forecasted; (2) precision (also called success ratio), which is the ratio of hits to the total number of events forecasted; and (3) the critical success index (CSI), which is the ratio of the number of hits to the total number of forecasts that were made or needed and can be computed from the previous two measures. Two components therefore contribute to the CSI: one that depends on TP and FN, thus highlighting the methods that have a high hit rate and miss few landslides, and the other one on TP and FP, thus highlighting the methods that have a high hit rate and produce few false alarm.
Table 1Performance metrics of predictive methods. The acronyms TP, FP, and FN stand respectively for true positive, false positive, and false negative.
The sensitivity, the precision, and the CSI highlight and summarize different aspects of the methods' performance. We did not consider the true negative in our metrics because we wanted to focus on the detection of extreme events. There are many “0” events but predicting the absence of events is not central here. We want to focus on landslides, their occurrence, and how often we caught them or had a false alarm.
For each day and for each method, we checked whether the method detected a potential landslide event. To compute true positives, we checked how many times the potential landslide detected occurred on the day of a real landslide event or on one of the 7 d preceding it. False positives were computed as the number of November–March periods without landslides during which at least one potential landslide event was erroneously detected.
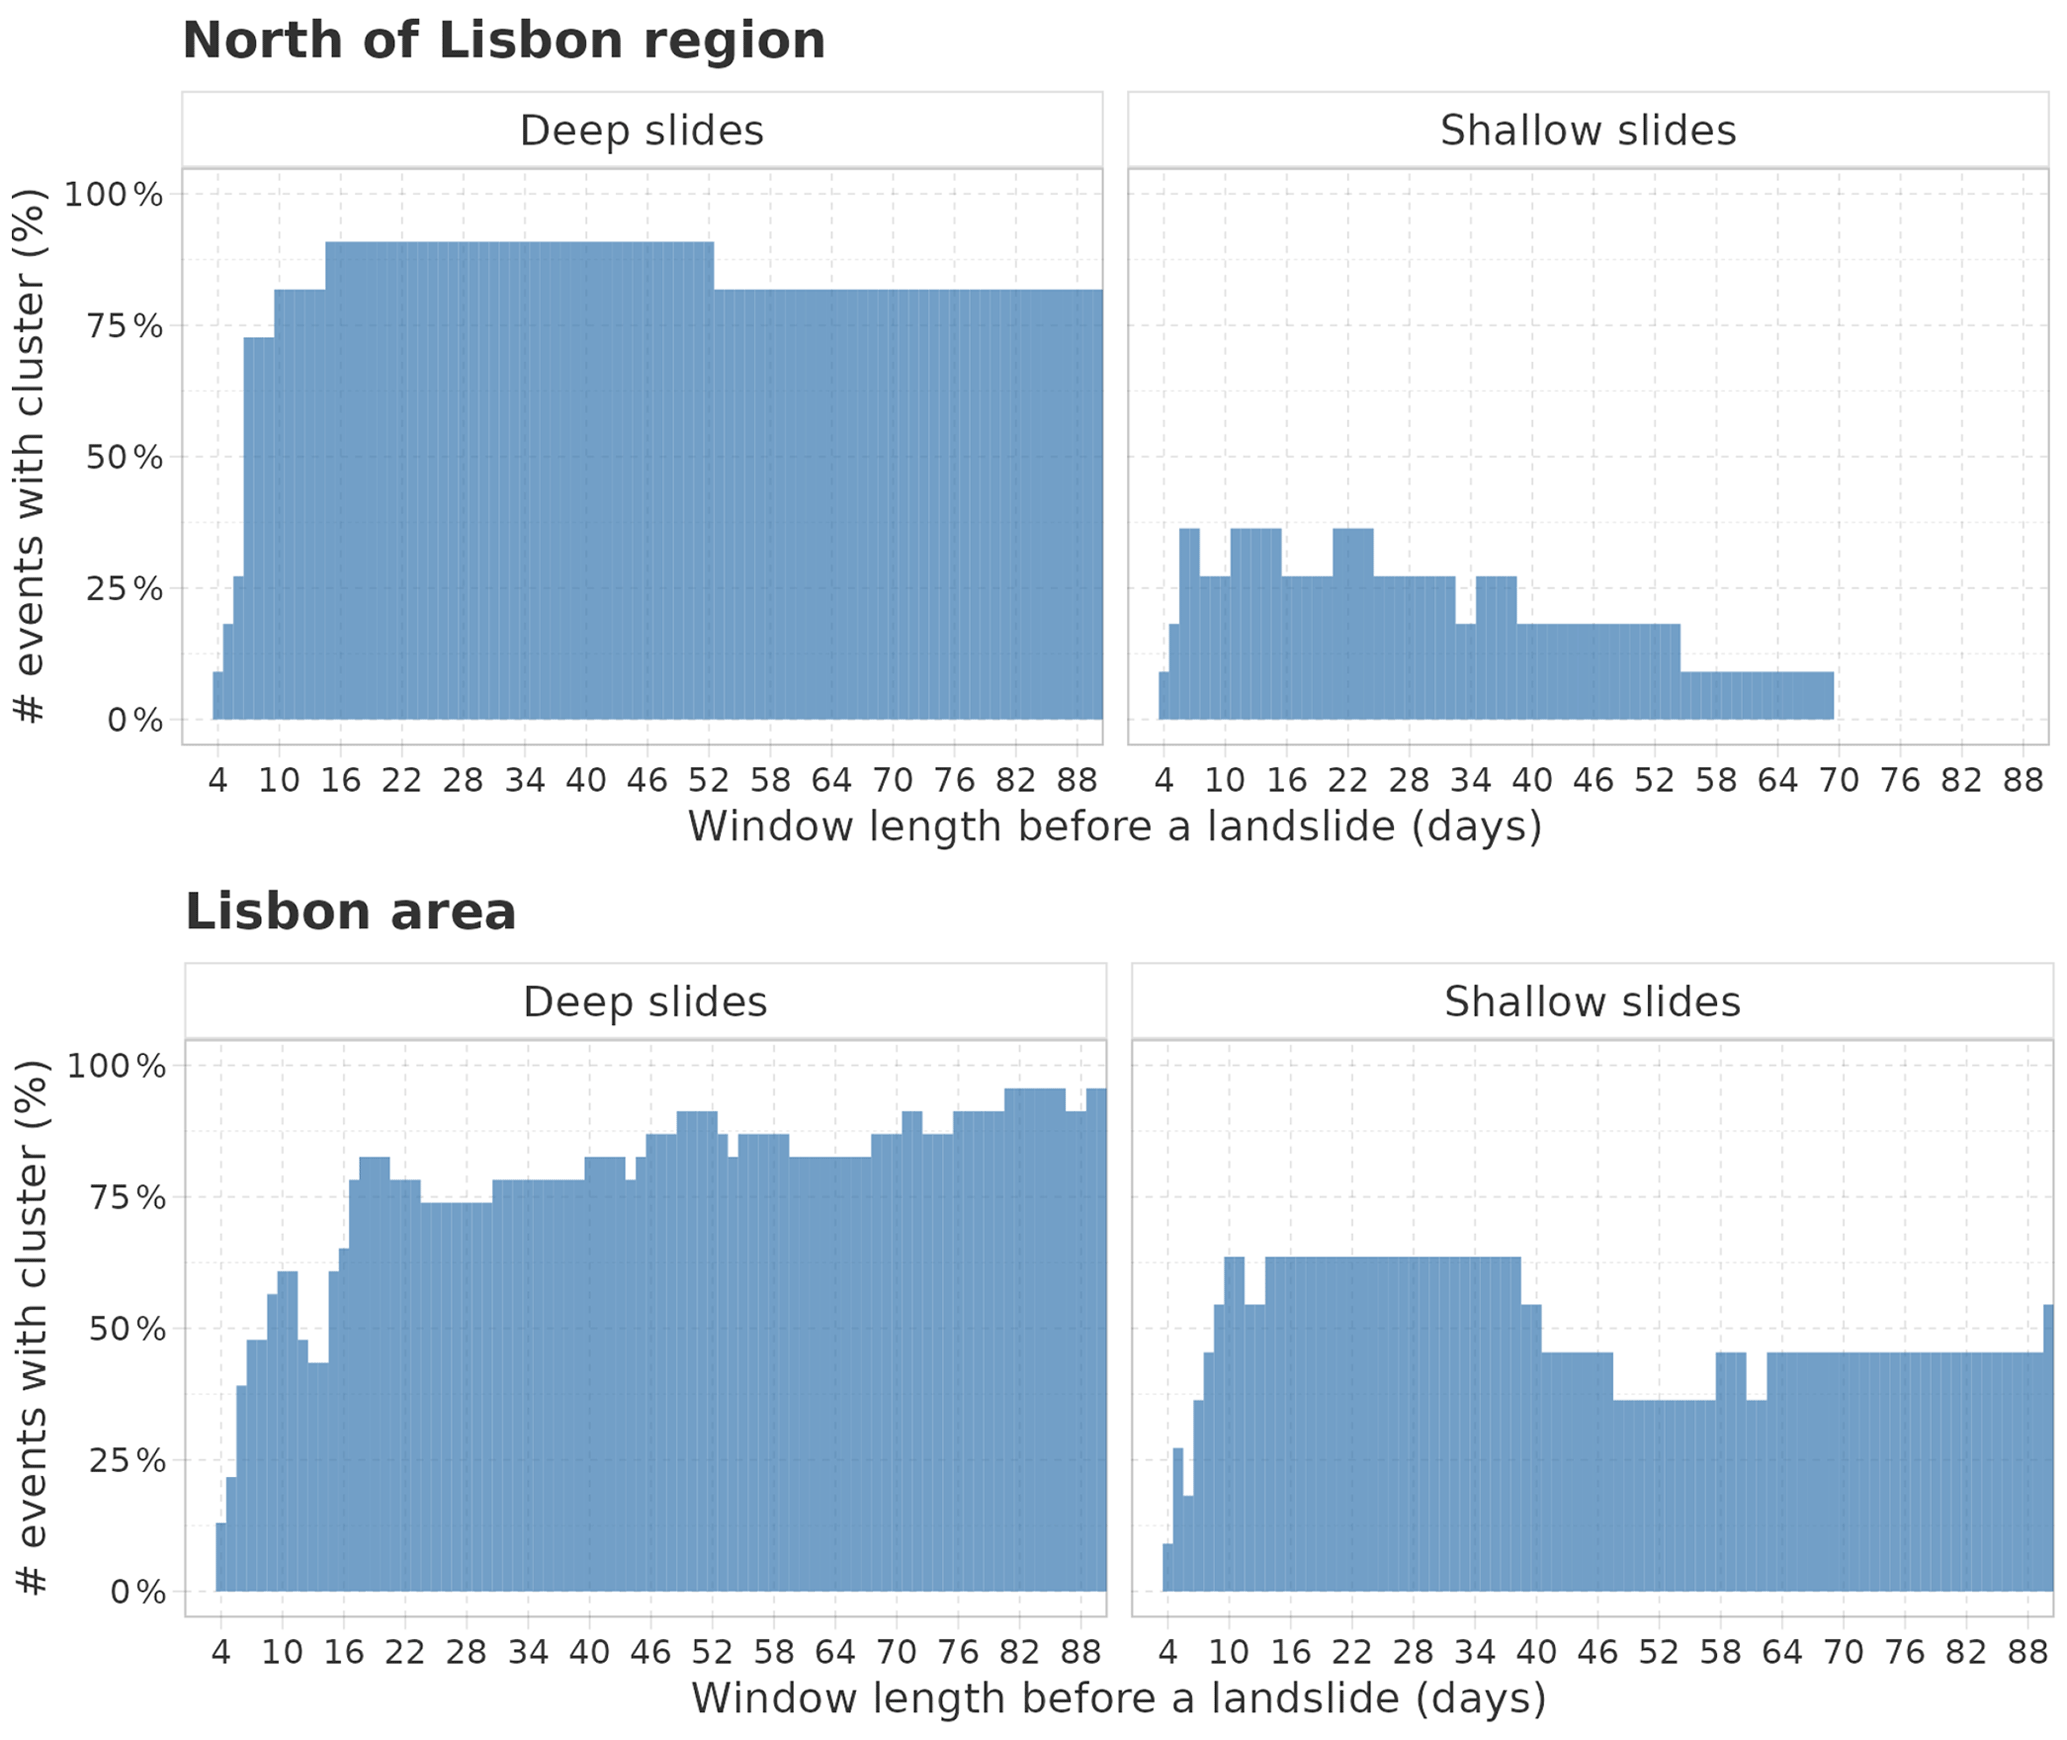
Figure 6Percentage of windows with temporal clustering of rainfall preceding landslide events for the two datasets separated between shallow and deep landslides. Results are reported for u equal to the 80th quantile of daily positive precipitation.
3.1 Temporal clustering of rainfall
The relation between the presence of multiple precipitation events in succession and the occurrence of landslide events is explored in the following, with a particular distinction between deep and shallow landslide types. In line with the results of Bevacqua et al. (2021), we observed a different behavior between deep and shallow landslides in both datasets (Fig. 6). In particular, shallow landslides are associated with a lower percentage of rainfall clustering, mainly relegated to shorter windows. In contrast, the presence of clusters preceding deep landslides is a recurrent feature, mainly when window sizes greater than 10–15 d are considered. For the north of Lisbon, considering precipitation events larger than the 80th quantile, we found a higher presence of clusters for deep landslides, compared to the Lisbon area, and a significantly lower presence of clusters for shallow landslides. In this dataset, in fact, the presence of temporal clustering of rainfall in time periods longer than 70 d was never observed before shallow landslides. In the north of Lisbon region, 91 % of deep landslides (10 out of 11) and 36 % of shallow landslides (4 out of 11) were associated with a cluster of rainfall in at least one window. In the Lisbon area, 95.6 % of deep landslides (22 out of 23) and 63.6 % of shallow landslides (7 out of 11) were associated with a rainfall cluster in at least one window.
3.2 Sequence of landslides
In both datasets, landslide events occurring in sequence, i.e., multiple landslides in the same season, were recorded (Fig. 7). The Lisbon area has around 14 % of seasons with at least one landslide and 4 % with more than one; the same percentages for the north of Lisbon region are 24.5 % and 7 %.
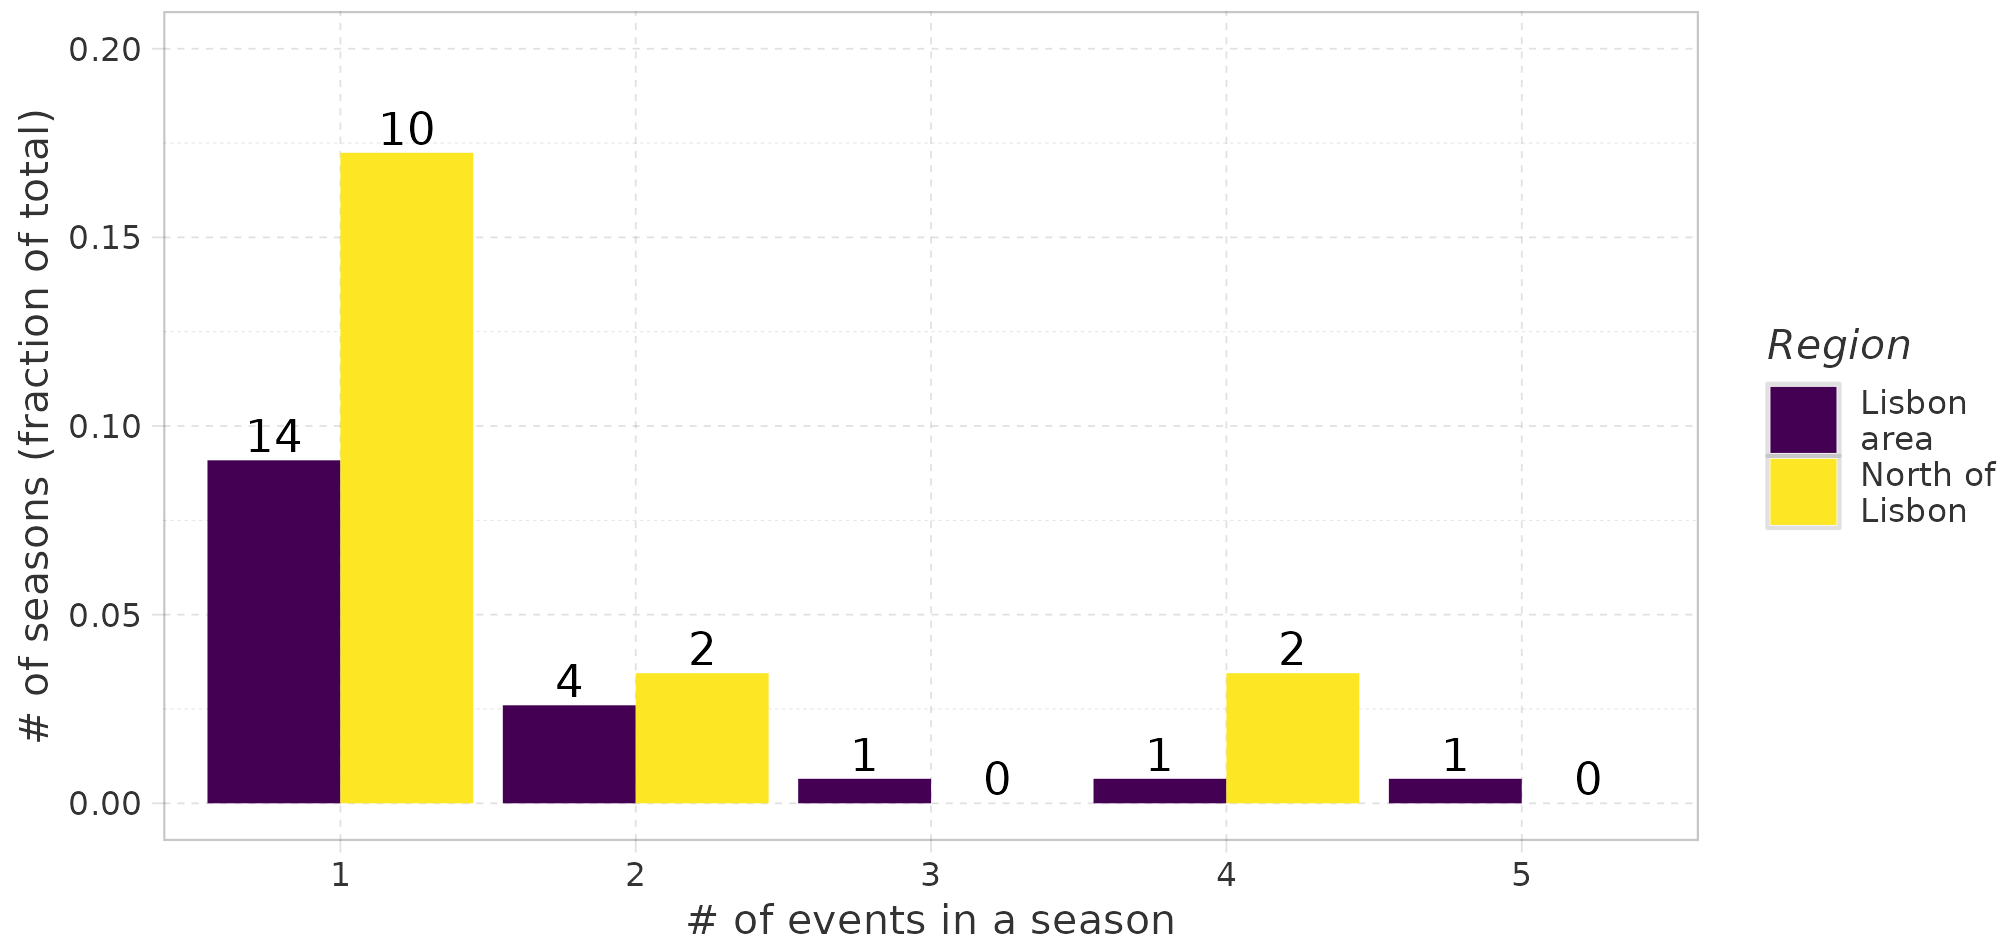
Figure 7Fraction of season with one, two, three, four, or five landslides (y axis) and absolute number (label above bars).
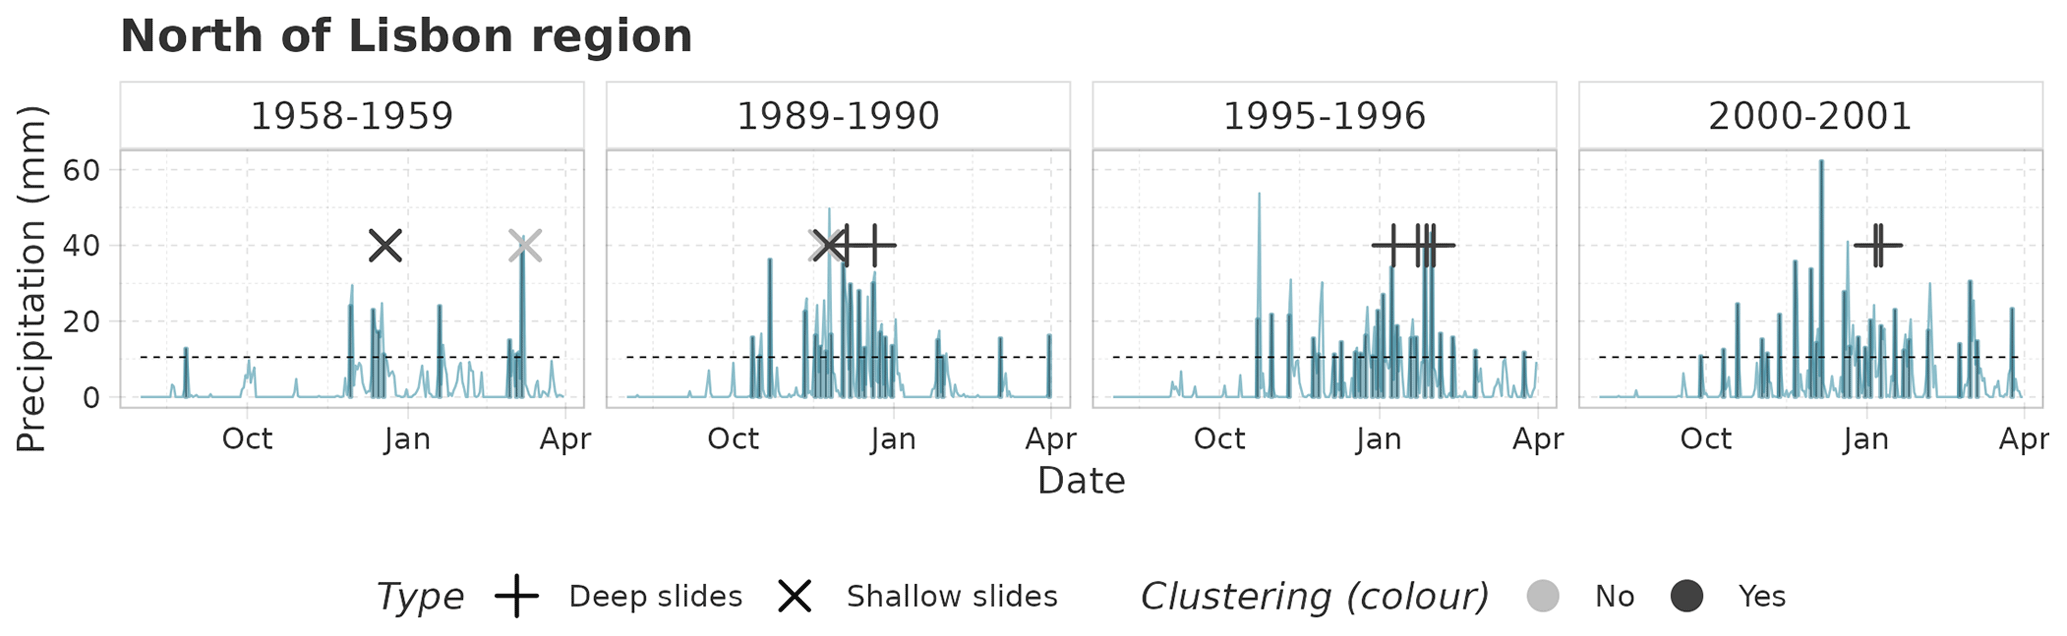
Figure 8Precipitation time series (light-blue line) and exceedances (blue bars) above the 80th quantile of wet days (dotted line) for the north of Lisbon region in some selected periods. Points corresponding with the occurrence of landslides are reported with crosses. The color of the crosses indicates the presence of precipitation clustering prior to the landslide.
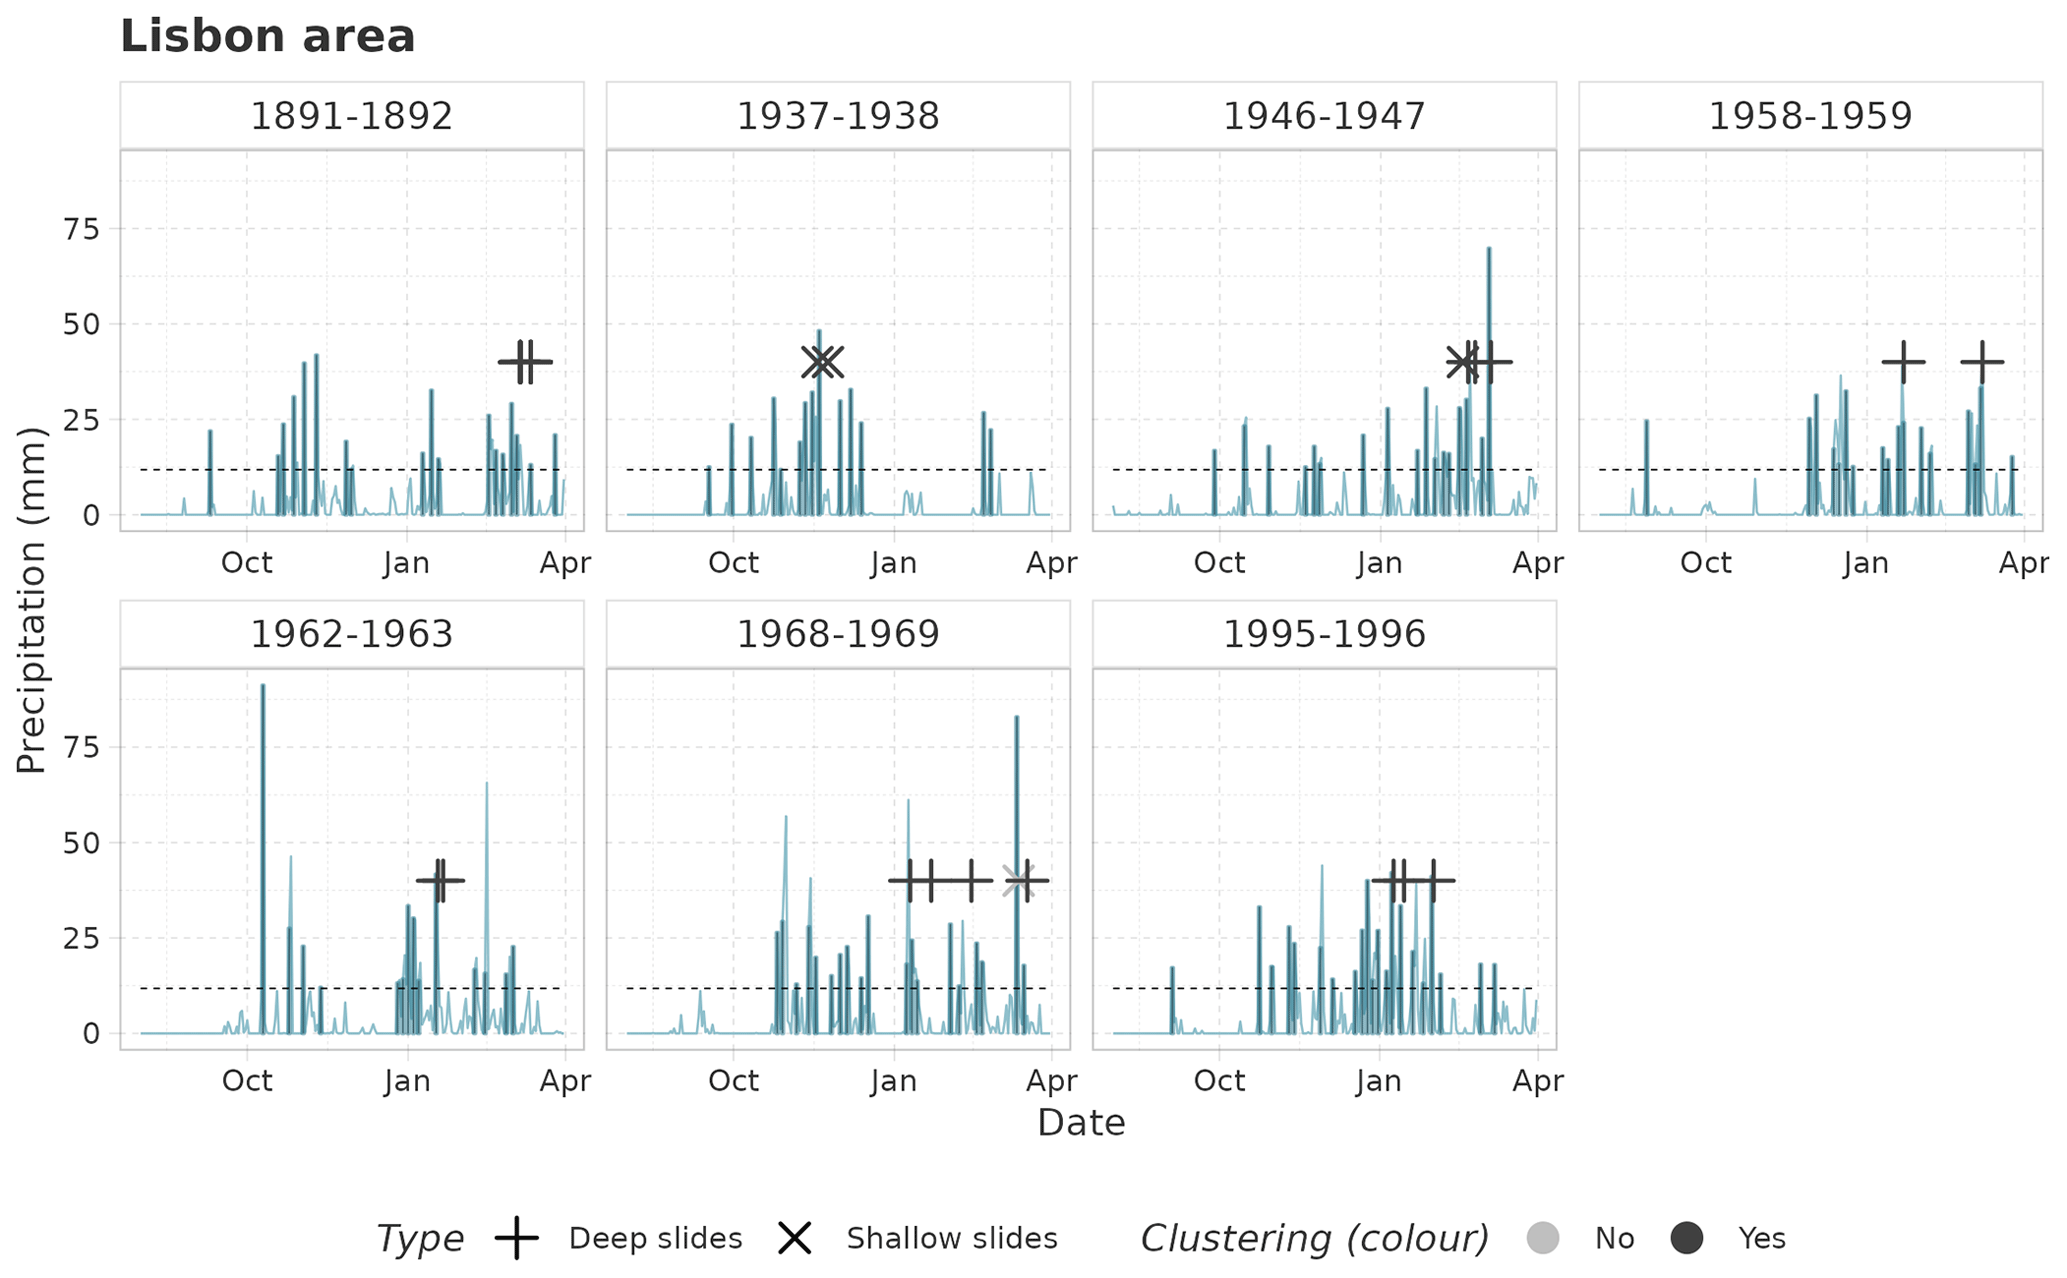
For the seasons with more than one landslide event we looked whether the events were connected, i.e., associated with the same cluster of precipitation, and we found that many of these multiple events are indeed connected (Figs. 8 and 9). In the north of Lisbon region (Fig. 8), we found a sequence of connected deep landslides in the November–March seasons 1995–1996 and 2000–2001. In the period 1958–1959, two unconnected shallow landslide events were recorded of which only the first one is characterized by the presence of temporal clustering. In the period 1989–1990, instead, we observed a combination of deep and shallow landslide events with and without a preceding temporal clustering of rainfall. Here, with the approach reported in Sect. 2.4, we associated the second and third landslide with the same rainfall cluster. The most frequent combination of multiple events in the Lisbon area (Fig. 9) is the occurrence of multiple connected deep landslides (periods 1891–1892, 1958–1959, 1962–1963, and 1995–1996). One exception is the succession of two connected shallow landslides during the period 1937–1938. The two remaining periods (1946–1947 and 1968–1969) are characterized by the presence of both typologies, shallow and deep, with different combinations of cluster presence or absence. Also in these seasons, landslides were associated with the same rainfall cluster.
3.3 Landslide detection
The approach based solely on cluster occurrence is compared with the classical rainfall thresholds in Fig. 10. The approach based on the combination of cluster occurrence and rainfall thresholds is compared to the use of rainfall thresholds only in Fig. 11. In both cases, we report the performance by the validation procedure.
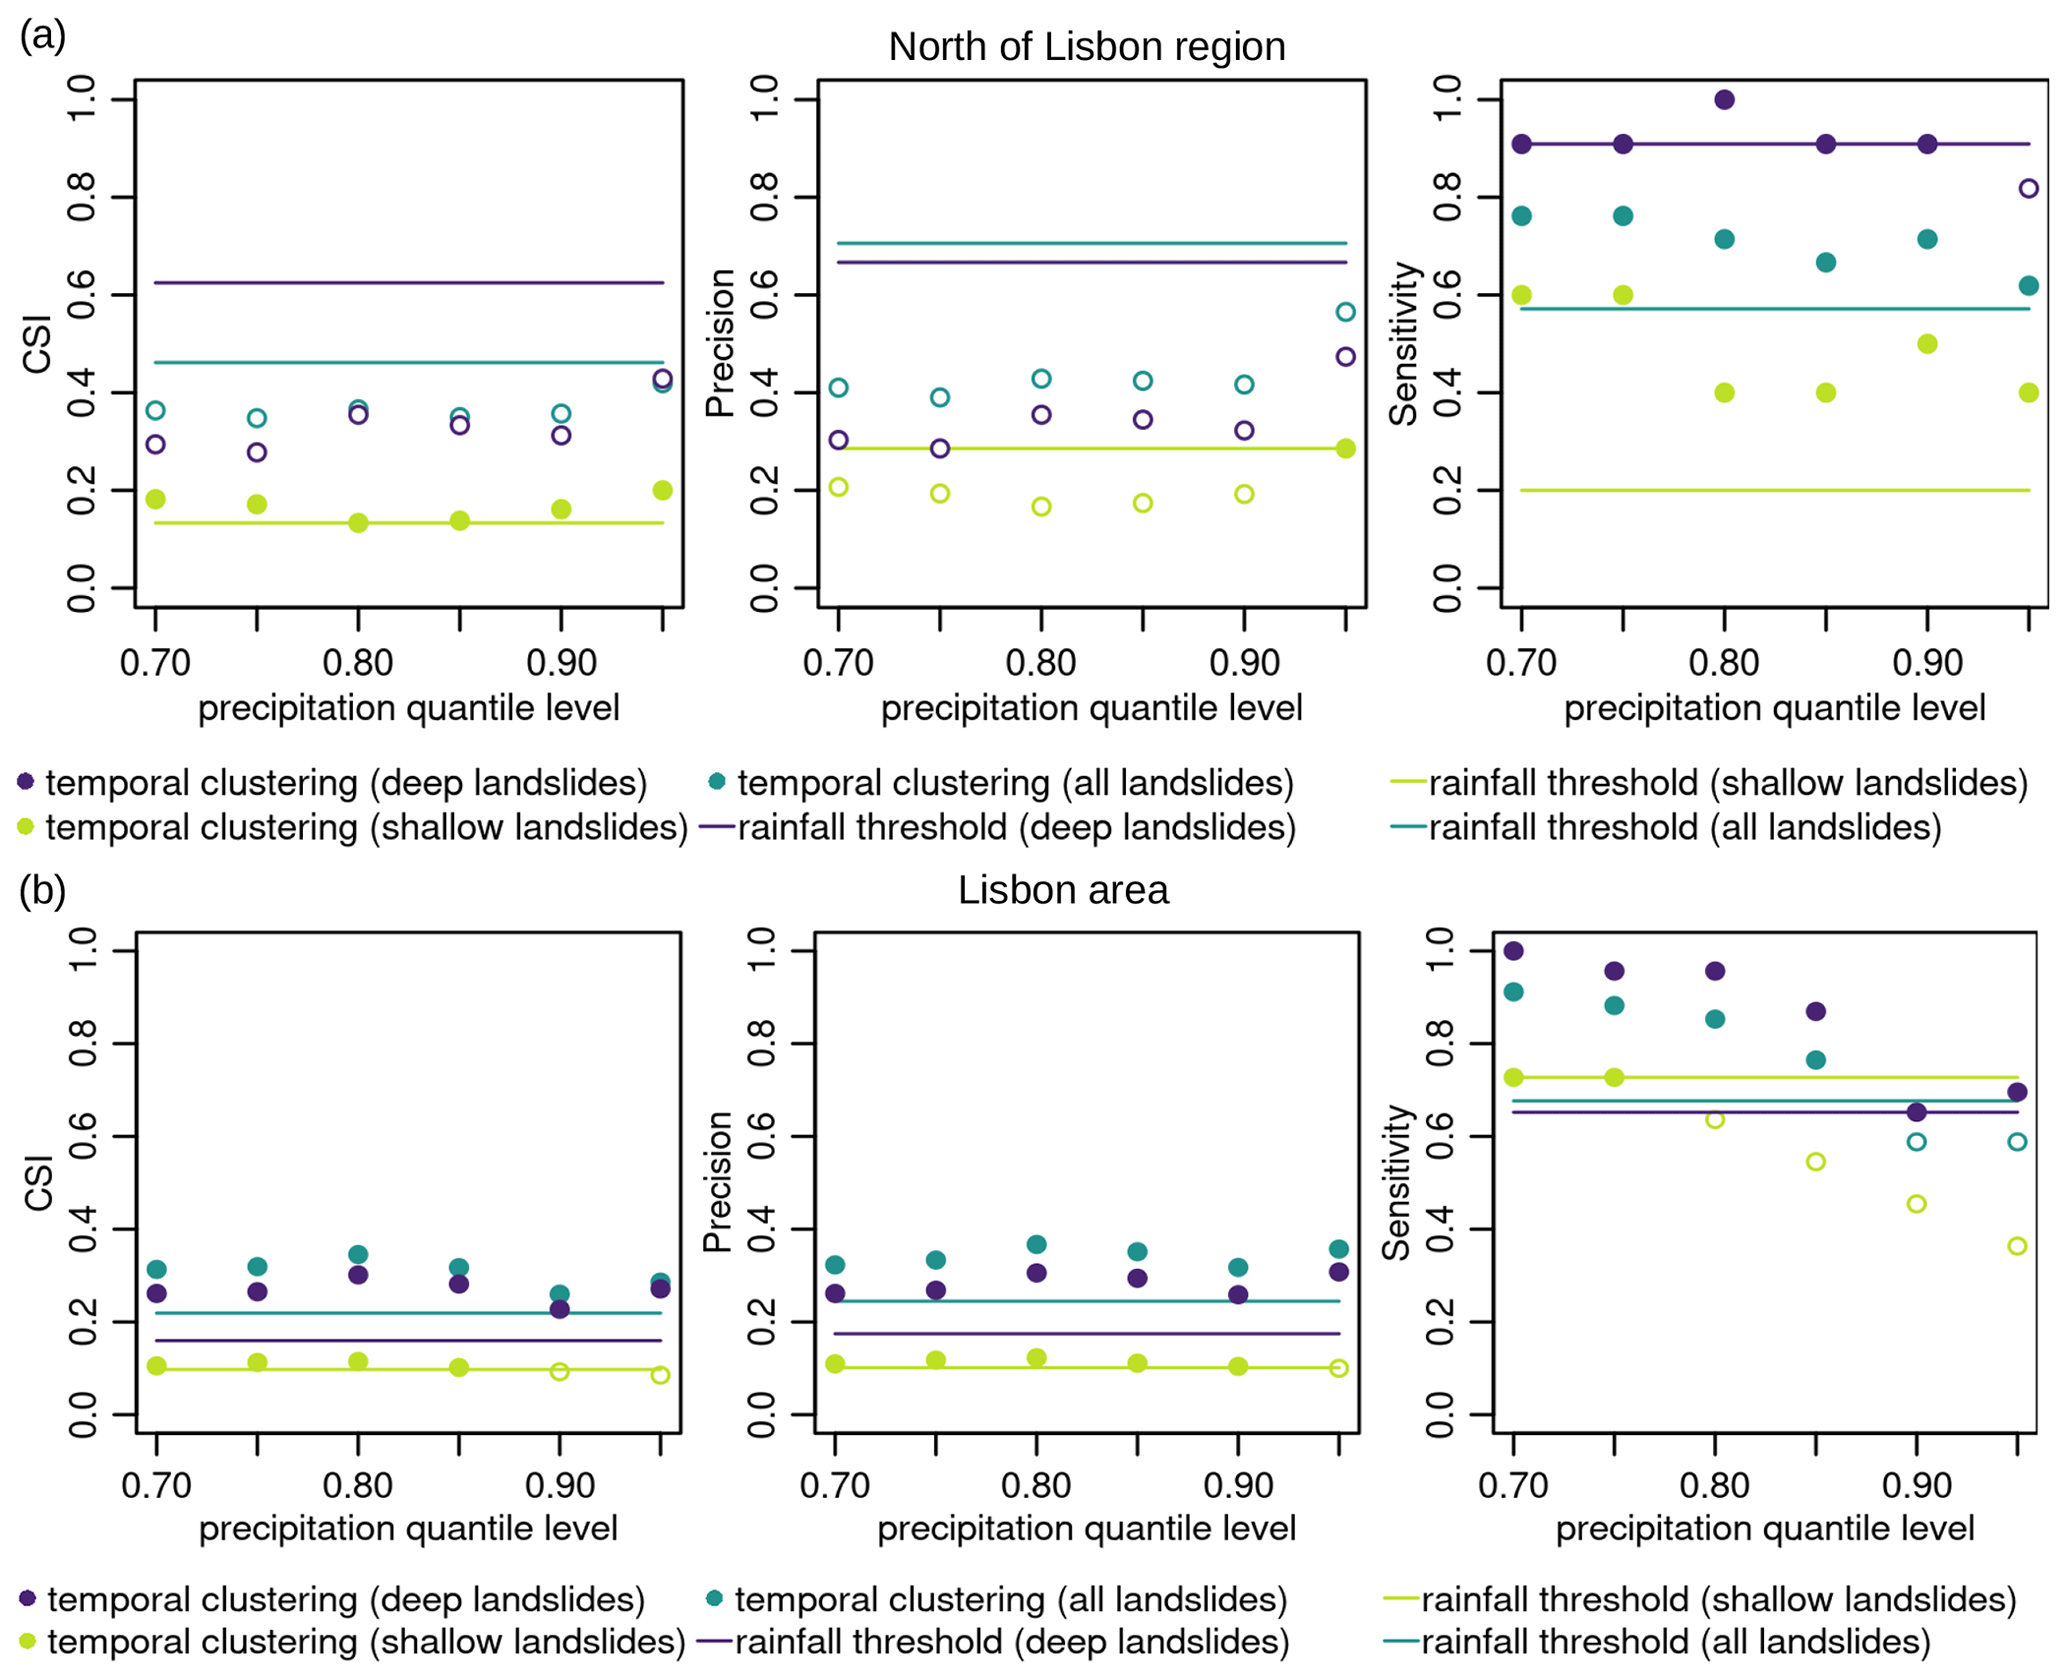
Figure 10Cluster occurrence approach (dots) compared to the use of rainfall thresholds only (lines) for (a) the north of Lisbon region and (b) Lisbon area. The considered metrics for performance are critical success index (CSI), precision (SR), and sensitivity (POD). Points are filled when the cluster-based approach outperforms the approach based solely on rainfall thresholds. Colors represent the subset of landslides used (see legend).
In a nutshell, introducing the method based on the temporal clustering of precipitation and comparing it to the regression curve from Zêzere et al. (2015), we have better performance with the new method for both sites and types of landslides in terms of sensitivity and for nearly all quantile levels. However, the performance in terms of precision is fairly different depending on the site, with better performance using the method based on temporal clustering with the Lisbon area dataset and worse performance with the north of Lisbon dataset.
Combining the two indexes with CSI, we have lower performance with the proposed method for the north of Lisbon region and deep landslides, while there is a higher performance for the north of Lisbon region and shallow landslides and both landslide event types for the Lisbon area.
To make the best out of the cluster-based approach and rainfall thresholds, we combine the precipitation cluster method with the rainfall threshold one and compare it with the use of only rainfall thresholds (Fig. 11). To combine them, we consider a landslide event to be detected when both methods detect an event. By construction, this hybrid method results in a number of TP and FP equal to or lower than the one of rainfall thresholds alone. In the north of Lisbon region, we obtain better or equal performance for all indices and all landslide types for nearly all choices of the quantile level, with a low influence of this last parameter. For deep landslides in the Lisbon area, we obtained a better performance with respect to rainfall thresholds, regarding both precision and CSI, but a lower one for sensitivity.
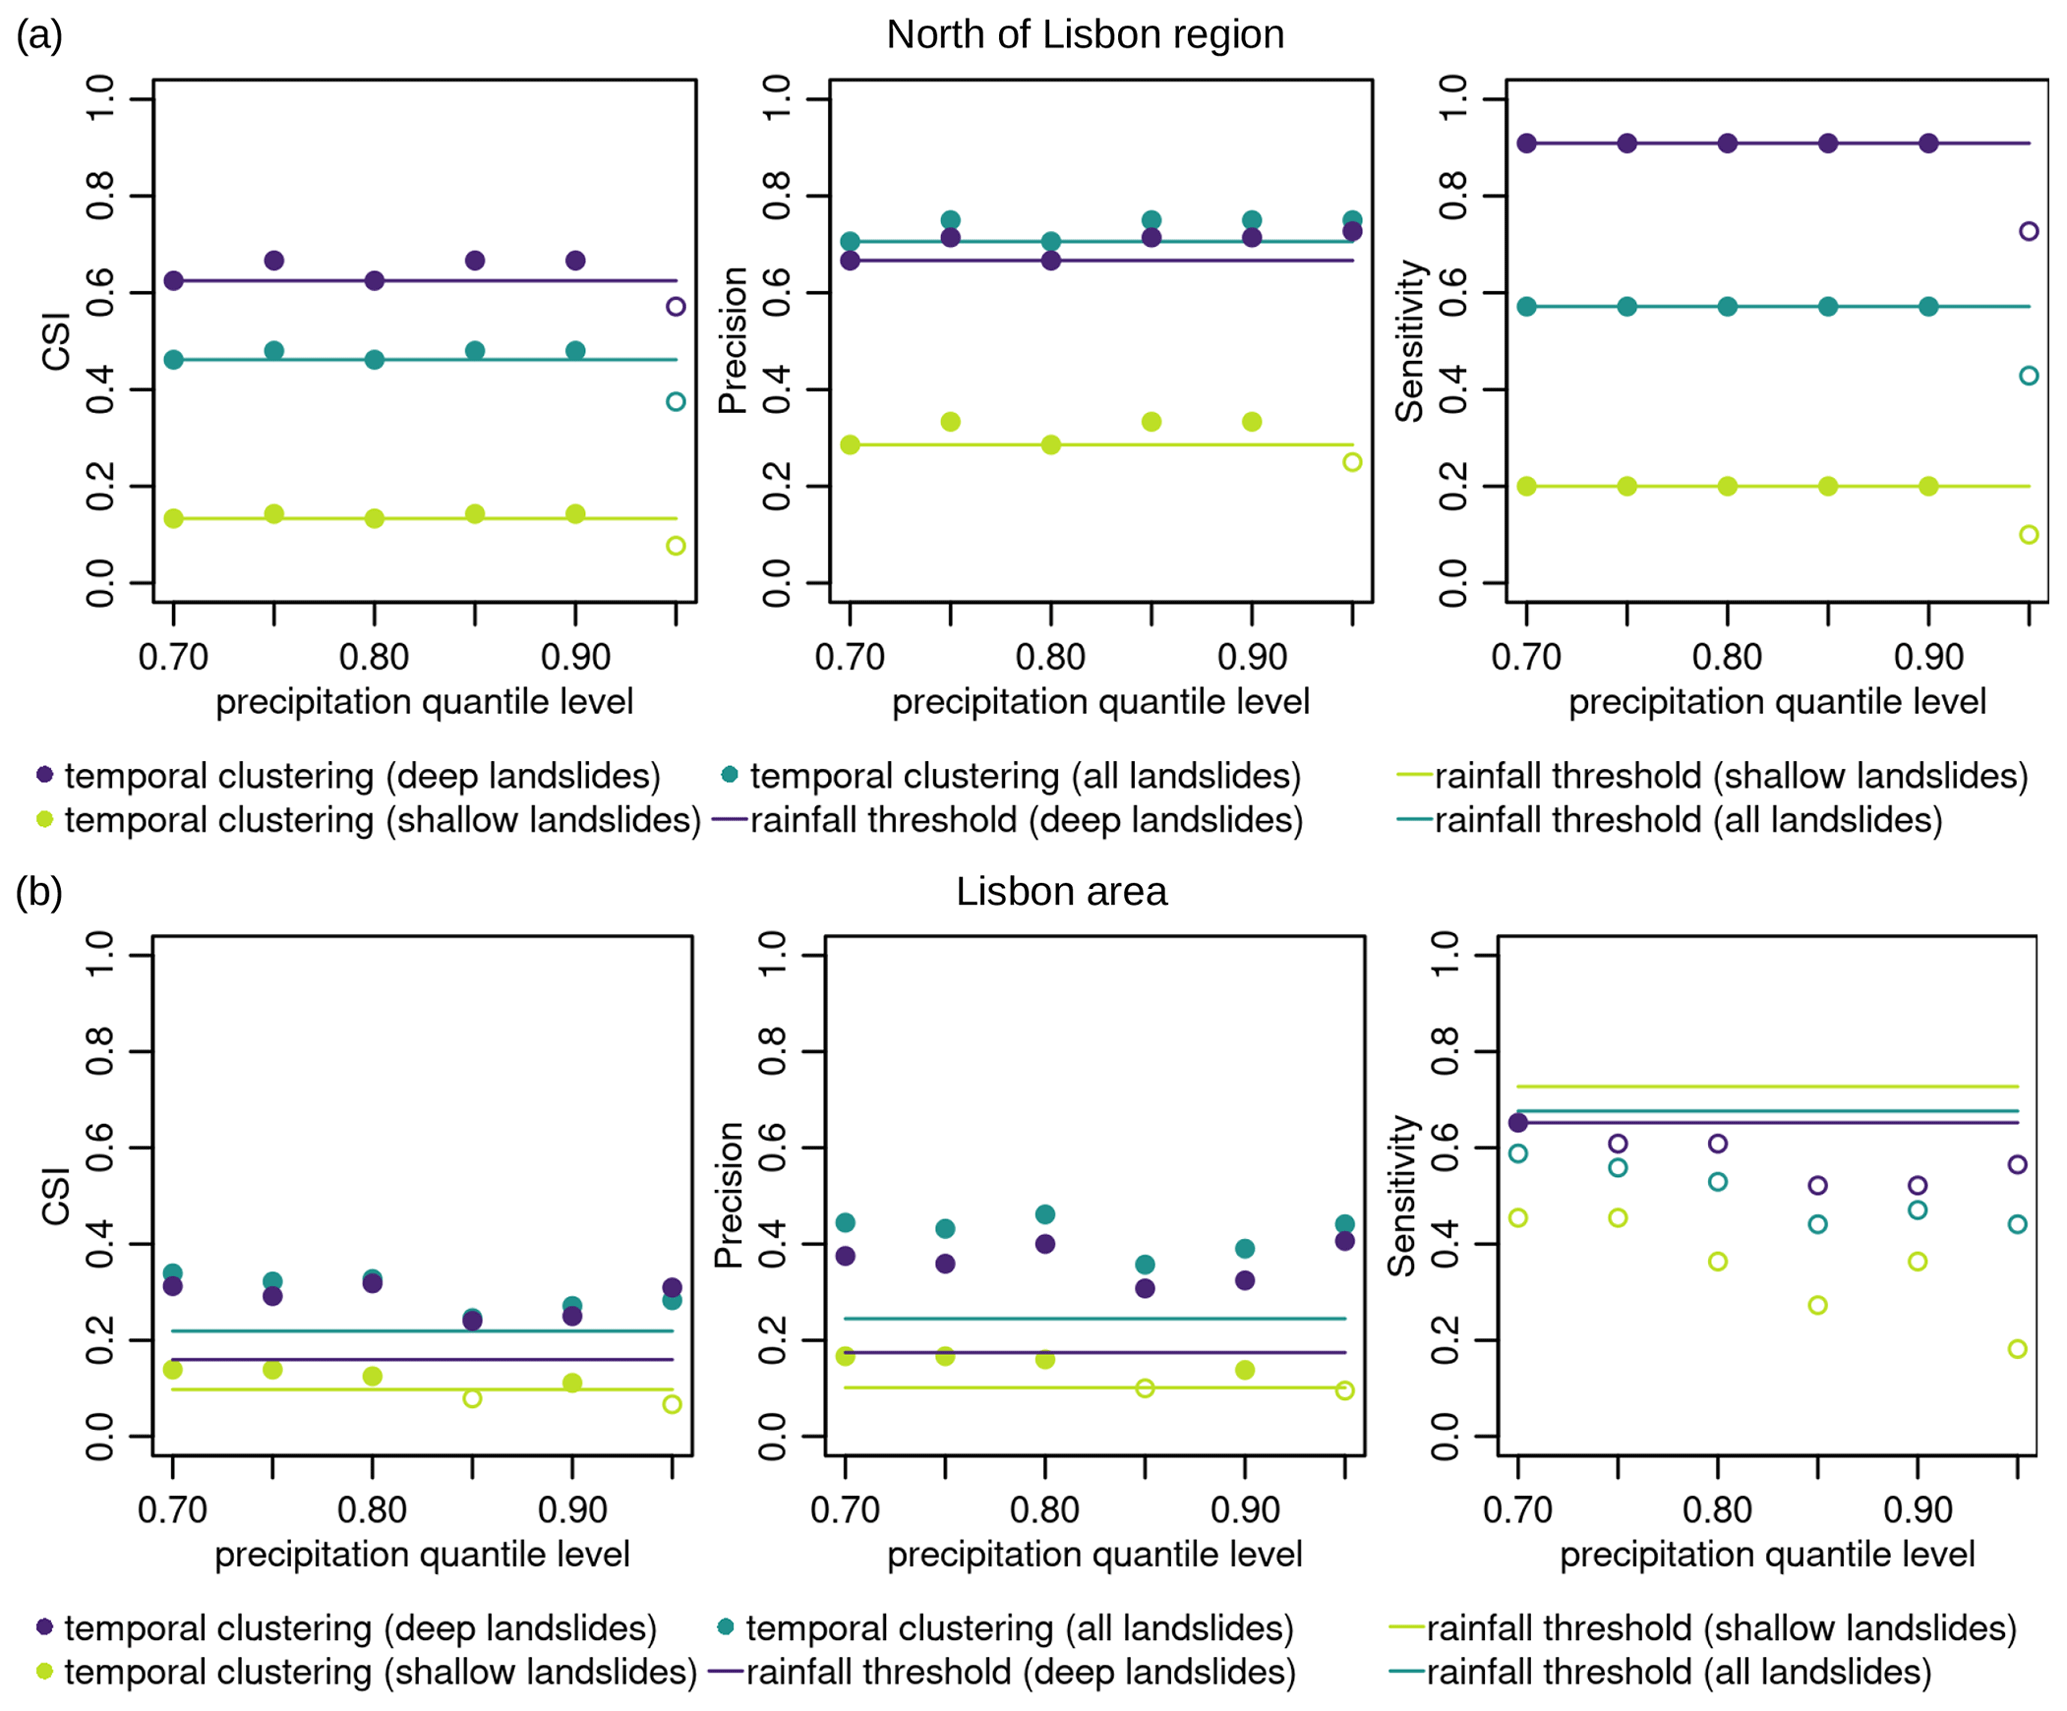
Figure 11Cluster occurrence approach combined with rainfall thresholds (dots) compared to the use of rainfall thresholds only (lines) for (a) the north of Lisbon region and (b) Lisbon area. The considered metrics for performance are critical success index (CSI), precision (SR), and sensitivity (POD). Points are filled when the cluster-based approach outperforms the approach based solely on rainfall thresholds. Colors represent the subset of landslides used (see legend).
4.1 Association between landslides and clustering of rainfall
As already observed by Bevacqua et al. (2021), we found different characteristics of the precipitation events triggering deep and shallow landslides. Precipitation clustering was observed before more than 90 % of deep landslides in the record. In particular, it was significant more frequently when longer time windows were considered. In contrast, clustering is present to a lesser extent in shallow landslides and mainly in smaller windows.
Investigating the connections between subsequent landslide events is important to properly understand the associated risk. Here, we observed that multiple landslides, occurring close in time, can be almost always attributed to a common cluster of precipitation. Interestingly five landslides occurred during the March–November period 1968–1969 in the Lisbon area: three deep landslide events, a shallow one, and again a deep one. Here we can see the different mechanisms generating the two landslide event types; in fact, we found a cluster associated with all deep movements and no cluster associated with the shallow one that was instead preceded by an intense precipitation event. We can also notice that the period 1995–1996 was characterized by the occurrence of three deep landslide events in both datasets. A further analysis that takes into account also the spatial dimension may provide further information about the interrelationship between landslide events.
The precipitation and meteorological conditions associated with landslide occurrence in Portugal, especially in the Lisbon region, have been studied in the past (e.g., Zêzere et al., 2005, 2015; Pereira et al., 2018). It was shown by Zêzere et al. (2005) that landslide occurrence can be associated with both the NAO index (North Atlantic Oscillation index) and the monthly rainfall anomalies, considering a 3-month moving average. Their analysis showed that months characterized by the occurrence of deep-seated landslides had very high values of average anomalous precipitation and intense negative average values of the NAO index. However, shallow landslide episodes are not critically associated with NAO. In addition, Zêzere et al. (2015) showed the importance of the 30 d antecedent precipitation in the occurrence of landslides in Portugal. This feature proves that landslides in mainland Portugal are usually preceded by high rainfall in the 30 d period before, thus confirming the role of antecedent rainfall as a critical preparatory factor for landslide activity.
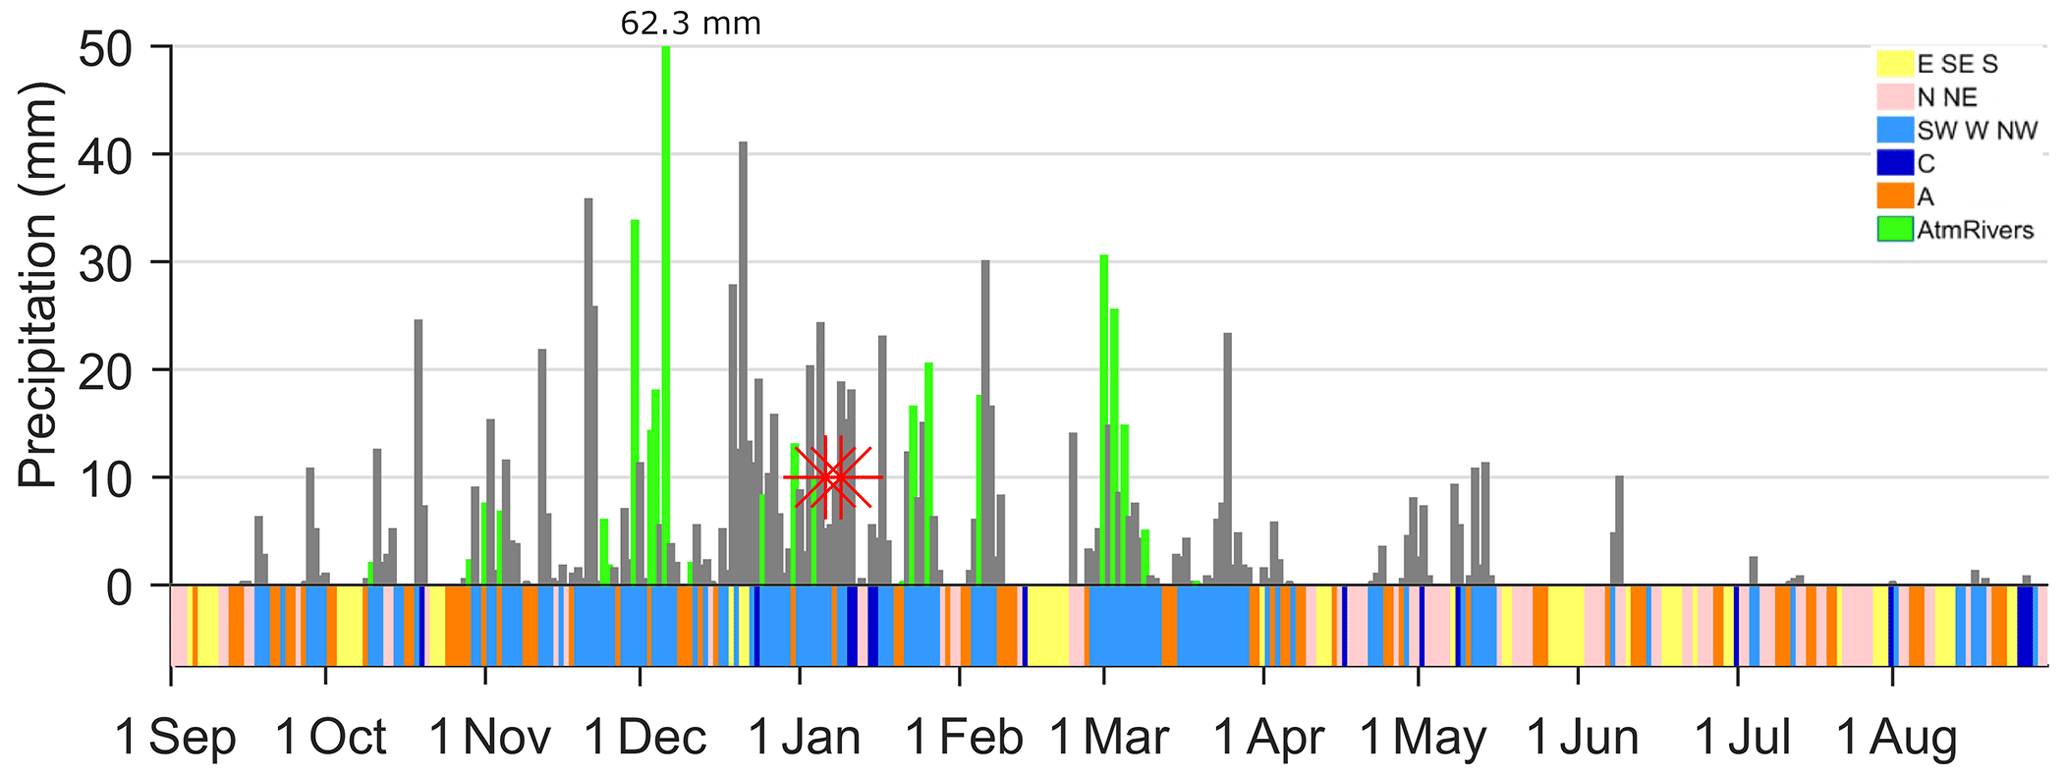
Figure 12Daily rainfall (light vertical gray bars) along with the corresponding circulation weather type (in colors) for the first months of the 2000/2001 hydrological year. In addition, if the occurrence of the ARs takes place during this hydrological year, it is highlighted in green in the daily rainfall bars. The red stars indicate the landslide occurrence.
A closer look at the main meteorological conditions of the precipitation regimes and extreme precipitation in Portugal during winter shows a clear relationship with a few circulation weather types (Trigo and DaCamara, 2000). In particular, the cyclonic (C) type and those with a westerly component (southwest, west, northwest) contribute to a large percentage of the monthly precipitation. These westerly types are associated with the passage of frontal systems from west to east over the North Atlantic basin (Cortesi et al., 2014; Ramos et al., 2014). Recent studies also show that over the western Iberian Peninsula extreme precipitation is often associated with the landfall of atmospheric rivers (ARs) (Ramos et al., 2014; Trigo et al., 2014; Eiras-Barca et al., 2016; Rebelo et al., 2018).
More recently, Pereira et al. (2018) analyzed a centennial catalogue of hydro-geomorphological events (including floods and landslides) and their atmospheric forcing. In accordance with the previous results, they concluded that the westerly flow and the cyclonic types are mainly associated with these hydro-geomorphological events. It was also shown that around 45 % of the 130 events were somehow associated with the passage of an atmospheric river. For comparison purposes, we extracted the circulation weather types from the same database used by Pereira et al. (2018) for the trigger days of the landslides (62 d) analyzed in this paper. The results show that 75 % of the landslide trigger days occurred during cyclonic weather types and those with a westerly component, confirming the results previously found. An example is given for the hydrological year 2000/2001. Figure 12 shows the daily rainfall (light vertical gray bars) from the IBERIA02 dataset along with the corresponding circulation weather type (in colors; Ramos et al., 2014) for the hydrological year 2000/2001. In addition, if the occurrence of the ARs (Ramos et al., 2015) takes place during a particular day, this is highlighted in green in the daily rainfall bars. As mentioned before, some circulation weather types are associated with above-average days or extreme rainfall events, especially the westerly circulation weather types like southwest, west, and northwest and also the cyclonic types (Ramos et al., 2014; Pereira et al., 2018).
Two landslide events occurred in January 2001 during the winter season (marked with red stars in Fig. 12). By the time of the landslide event occurrence, the accumulated precipitation since the beginning of the hydrological year (1 September) was above the 95th percentile of the hydrological year climatology. From the results in Fig. 8 we can see that the precipitation is associated with a temporal clustering of events. In particular, temporal clustering was observed over all the windows tested (up to 90 d) except for the smaller ones (below 7 d). The large-scale conditions that were associated with the anomalous accumulated precipitation over the hydrological year and specifically with the precipitation clustering can be easily assessed by analyzing the circulation weather types in Fig. 8 (in colors). Results show that from November 2020 onward, different periods of westerly flows (southwest, west, northwest, light blue) dominate the circulation over Portugal, which contribute to a large extent to the anomalous accumulated precipitation in this water year. Extreme precipitation also occurred in December, a month prior to the landslide events, and those days were also associated with atmospheric river landfall (precipitation bars highlighted in green) in accordance with Ramos et al. (2015).
The analysis of preconditioning meteorological variables has confirmed the influence of the cyclonic (C) weather types and those with a westerly component (southwest, west, northwest) in the occurrence of landslides in Portugal, together with atmospheric river landfall.
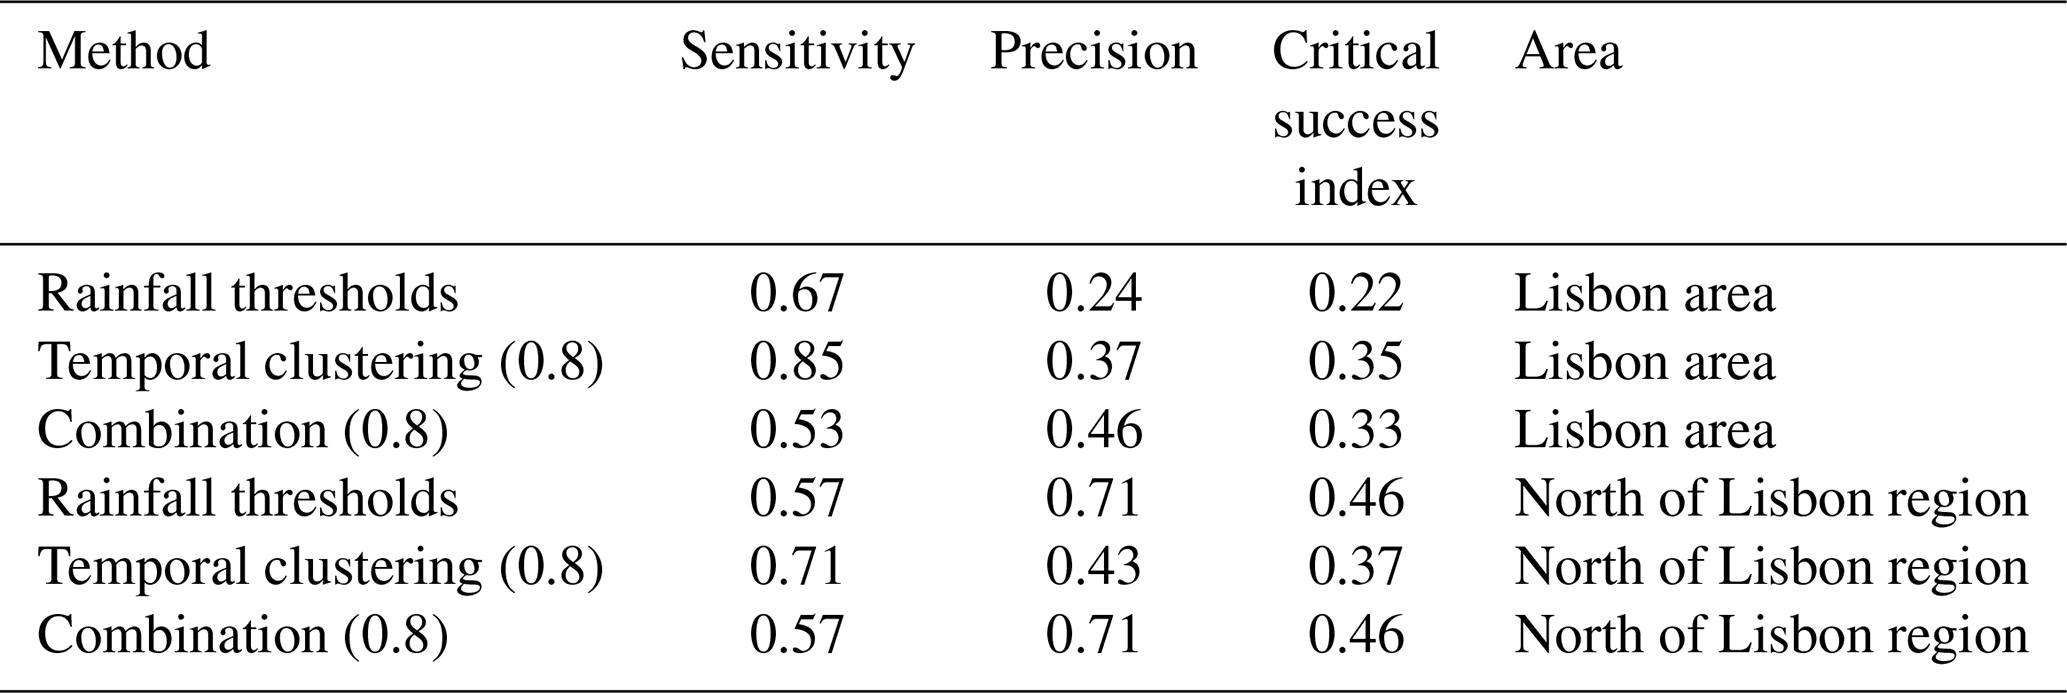
Table 2Performance metrics of predictive methods. The performance of the temporal clustering method and its combination with the rainfall thresholds are reported for a quantile of 0.8.
4.2 Landslide detection
The results in Figs. 10 and 11 are summarize in Table 2. They generally indicate that no method outperforms the other considering both datasets. The method solely based on the temporal clustering of precipitation has better performance for the Lisbon region in terms of both TP and FP; however, for the north of Lisbon region it outperforms rainfall thresholds only looking at sensitivity. For regional management, if the interest is towards high sensitivity (number of correct positives as high as possible), the proposed approach based on precipitation cluster occurrence is a better choice than rainfall thresholds. In contrast, the rainfall threshold approach presents a higher precision (ratio of hits to the total number of events forecast). When considering the CSI, which includes both sensitivity and precision, there is not a method clearly outperforming the other one for both sites.
Regarding the combination on the temporal clustering information and rainfall threshold, we obtained similar performance for the north of Lisbon region and better performance in terms of CSI and precision for the Lisbon region. Then, if the interest is towards high precision (number of false negatives as low as possible), the proposed approach based on precipitation cluster occurrence and rainfall threshold is a better choice than rainfall thresholds.
A cluster-based method depends on the choice of a quantile level to identify precipitation events. However, for a given index or region, we observed that the performance is consistent among most of the tested quantile levels when compared to the rainfall threshold methods. Therefore, the dependence of the performance on the precipitation quantile is weak. Nevertheless, for the two areas analyzed we suggest a quantile level of 0.75 for overall better performance.
In general, for both methods, detecting shallow landslides is more difficult than deep ones. Figure 6 showed the smaller dependence of shallow landslides to precipitation clusters. This might be due to the fact that a unique, heavy precipitation event may be enough to trigger shallow landslides (Corominas and Moya, 1999).
It is worth noticing that the proposed approach based on the temporal clustering of rainfall does not include any information about rainfall totals except in the initial selection of precipitation quantile. In contrast, it retains information on the number of precipitation events preceding a landslide and therefore their closeness in time. The temporal dynamic of rainfall may therefore be important, together with the cumulated volume over a window, in the occurrence of landslides. The same precipitation amount falling in a single event rather than distributed over multiple events may result in higher total runoff and less infiltration. In addition to rainfall, evaporation may also influence the association between precipitation clusters and landslide occurrence, with higher evaporation weakening the precipitation–landslide statistical association. If strong evaporation occurs between two consecutive rainfall events belonging to the same cluster, then the effect of the first event is not seen in the second one. So it is like it occurred in isolation.
4.3 Regional landslide events datasets
We observe differences in the method performance depending on the dataset. This may be in part explained by the different nature of the inventories. For the Lisbon region, the landslide dataset was collected from newspaper sources, and a landslide event was considered to be an individual landslide or a set of landslides that occurred on a precise date (day) (Zêzere et al., 2014). In cases where different landslides occurred on consecutive days, each day was considered a landslide event, and when the landslide activity was reported during several days, the first day of the period was assigned to the landslide event (Vaz et al., 2018). Such a database is strongly dependent on consequences (landslides which caused damage to people: fatalities, injuries, missing and homeless people); hence in some cases the sign of the precipitation trigger was unclear. In general, only newsworthy content is reported by newspapers, which means that landslides that caused human damage or occurred in an urban environment are usually highlighted. For this reason, only landslides with a rainfall threshold with a return period of more than 3 years were used. The main aim was to reduce the possibility of including landslides with a triggering factor other than rainfall (e.g., human activity). Landslides with critical rainfall combinations with a return period of less than 3 years were assumed not to have been triggered by rainfall. In contrast, rain-triggered landslides that did not cause social or economic damage were unlikely to have been reported in the newspapers (Zêzere et al., 2015; Vaz et al., 2018).
The second landslide dataset covers the region north of Lisbon. For this field-based landslide dataset, the regional criterion used to define a rainfall-triggered landslide is the identification of at least five individual landslides on natural slopes on a given date (Zêzere and Trigo, 2011; Zêzere et al., 2015). The temporal and spatial criteria for defining a rainfall-triggered landslide in the dataset north of Lisbon could be more difficult to apply regionally than the one associated with the single dates collected from the newspapers. The dataset distinguishes shallow (deep) landslide events as events for which more than 50 % of the landslide area is associated with slip surfaces below 1.5 m (above 1.5 m) (Zêzere and Trigo, 2011).
In fact in both datasets we can have both shallow and deep landslides occurring in the same landslide event. Nevertheless, that condition is more difficult to verify in the Lisbon area dataset, associated with the DISASTER database, mostly because it considers single dates and single landslide locations collected from newspapers.
The concept of a landslide event is not always straightforward. If we consider a landslide event associated with a single landslide, generally it is less difficult to identify the date of the event that will be then related to the daily rainfall data for the rainfall threshold assessment (Vaz et al., 2018). This is in fact what the DISASTER database, based on newspaper records, made possible for the Lisbon area, i.e., a very accurate definition of the temporal occurrence of the landslide events. However, the number of landslide events could be biased by the consequence criteria considered in the DISASTER database. Zêzere et al. (2015) point out that the number of registered landslide events in each study area in Portugal is relatively low, and this could make it difficult to establish reliable relationships between rainfall and landslides. In addition, several landslides could be triggered over consecutive days in a study area, and this may also be a potential source of uncertainty regarding the rainfall threshold definition mostly due to the selection of the landslide event date for which the rainfall threshold is defined (Vaz et al., 2018).
We can conclude that the criteria to detect and collect landslides in the two datasets are not homogeneous, and there are different problems and limitation, as detailed above. This results in non-homogeneous response data and in uncertainty in the statistical model. Ideally, landslide datasets with the same criteria could be a better benchmark, and they could be used in further testing of the methods.
In the present work, we assess the effect of including information on the temporal clustering of rainfall for estimating the probability of landslide occurrence. We propose an empirical method, alternative or complementary to classical rainfall thresholds, that requires only precipitation data as an input. Our parsimonious approach proved to have a good power of detecting events compared with rainfall threshold, with a maximum CSI, considering all landslides, of about 0.4 in both cases. It has a higher sensitivity to landslide occurrence compared to classical rainfall thresholds but lower precision, i.e., lower false negative (FN) but higher false positive (FP). One of the advantages of this method over rainfall thresholds is that it is not based on regression and does not include regime information on rainfall totals. Although it requires the selection of a precipitation quantile to identify precipitation events, we observed a weak dependence on the quantile choice. Hence, it may prove a more general and transferable approach, overcoming the main limitation of absolute rainfall thresholds. This could be investigated by testing the method on other inventories of rainfall-triggered landslides in other countries. Different ways of combining the information about the temporal clustering of rainfall and rainfall totals could also be explored in future studies.
Code and data are available upon request.
CDM, FB, PR, and EB conceived the methodology. SCO took care of the data. FB took care of the analysis. JGP and AMR provided the meteorological interpretation of the results. FB wrote a first draft of the manuscript. All authors reviewed the manuscript.
At least one of the (co-)authors is a member of the editorial board of Natural Hazards and Earth System Sciences. The peer-review process was guided by an independent editor, and the authors also have no other competing interests to declare.
Publisher's note: Copernicus Publications remains neutral with regard to jurisdictional claims made in the text, published maps, institutional affiliations, or any other geographical representation in this paper. While Copernicus Publications makes every effort to include appropriate place names, the final responsibility lies with the authors.
Sérgio C. Oliveira was financed by the European ground motion risk assessment tool project RASTOOL (grant agreement no. 101048474). Emanuele Bevacqua has received funding from the European Union's Horizon 2020 research and innovation programme under grant agreement no. 101003469 and from the DFG via the Emmy Noether Programme (grant ID 524780515). Joaquim G. Pinto thanks the AXA Research Fund for support. Alexandre M. Ramos is supported by the Helmholtz “Changing Earth” program and by the Portuguese Science Foundation (FCT) through the project AMOTHEC (DRI/India/0098/2020).
This study was carried out within the RETURN project (Multi-risk science for resilient communities under a changing climate) with Extended Partnership, which received funding from the European Union Next-GenerationEU (National Recovery and Resilience Plan–NRRP, Mission 4, Component 2, Investment 1.3–D.D. 1243 2/8/2022, PE0000005).
This paper was edited by Olivier Dewitte and reviewed by two anonymous referees.
Abbate, A., Papini, M., and Longoni, L.: Analysis of meteorological parameters triggering rainfall-induced landslide: a review of 70 years in Valtellina, Nat. Hazards Earth Syst. Sci., 21, 2041–2058, https://doi.org/10.5194/nhess-21-2041-2021, 2021. a
Banfi, F. and De Michele, C.: Compound flood hazard at Lake Como, Italy, is driven by temporal clustering of rainfall events, Commun. Earth Environ., 3, 234, https://doi.org/10.1038/s43247-022-00557-9, 2022. a, b
Barton, Y., Giannakaki, P., von Waldow, H., Chevalier, C., Pfahl, S., and Martius, O.: Clustering of regional-scale extreme precipitation events in Southern Switzerland, Mon. Weather Rev., 144, 347–369, https://doi.org/10.1175/MWR-D-15-0205.1, 2016. a
Belo-Pereira, M., Dutra, E., and Viterbo, P.: Evaluation of global precipitation data sets over the Iberian Peninsula, J. Geophys. Res.-Atmos., 116, D20101, https://doi.org/10.1029/2010JD015481, 2011. a
Benjamini, Y. and Hochberg, Y.: Controlling the false discovery rate: a practical and powerful approach to multiple testing, J. Roy. Stat. Soc. Ser. B, 57, 289–300, https://doi.org/10.1111/j.2517-6161.1995.tb02031.x, 1995. a
Bevacqua, E., De Michele, C., Manning, C., Couasnon, A., Ribeiro, A. F. S., Ramos, A. M., Vignotto, E., Bastos, A., Blesić, S., Durante, F., Hillier, J., Oliveira, S. C., Pinto, J. G., Ragno, E., Rivoire, P., Saunders, K., van der Wiel, K., Wu, W., Zhang, T., and Zscheischler, J.: Guidelines for Studying Diverse Types of Compound Weather and Climate Events, Earth's Future, 9, e2021EF002340, https://doi.org/10.1029/2021EF002340, 2021. a, b, c, d, e, f, g, h
Calvello, M. and Pecoraro, G.: FraneItalia: a catalog of recent Italian landslides, Geoenviron. Disast., 5, 13, https://doi.org/10.1186/s40677-018-0105-5, 2018. a
Chen, C., Oguchi, T., Hayakawa, Y. S., Saito, H., and Chen, H.: Relationship between landslide size and rainfall conditions in Taiwan, Landslides, 14, 1235–1240, https://doi.org/10.1007/s10346-016-0790-7, 2017. a
Coles, S.: An Introduction to Statistical Modeling of Extreme Values, Springer, London, https://doi.org/10.1007/978-1-4471-3675-0, 2001. a
Corominas, J. and Moya, J.: Reconstructing recent landslide activity in relation to rainfall in the Llobregat River basin, Eastern Pyrenees, Spain, Geomorphology, 30, 79–93, https://doi.org/10.1016/S0169-555X(99)00046-X, 1999. a, b
Cortesi, N., Gonzalez-Hidalgo, J. C., Trigo, R. M., and Ramos, A. M.: Weather types and spatial variability of precipitation in the Iberian Peninsula, Int. J. Climatol., 34, 2661–2677, https://doi.org/10.1002/joc.3866, 2014. a
Crozier, M.: A proposed cell model for multiple-occurrence regional landslide events: Implications for landslide susceptibility mapping, Geomorphology, 295, 480–488, https://doi.org/10.1016/j.geomorph.2017.07.032, 2017. a
Dai, F. C. and Lee, C. F.: Landslide characteristics and slope instability modeling using GIS, Lantau Island, Hong Kong, Geomorphology, 42, 213–228, https://doi.org/10.1016/S0169-555X(01)00087-3, 2002. a
de Brum Ferreira, A. and Zêzere, J. L.: Portugal and the Portuguese Atlantic Islands, in: Geomorphological Hazards of Europe, vol. 5 of Developments in Earth Surface Processes, edited by: Embleton, C. and Embleton-Hamann, C., Elsevier, 391–407, https://doi.org/10.1016/S0928-2025(97)80017-X, 1997. a
Di Napoli, M., Marsiglia, P., Di Martire, D., Ramondini, M., Ullo, S. L., and Calcaterra, D.: Landslide susceptibility assessment of wildfire burnt areas through Earth-observation techniques and a machine learning-based approach, Remote Sens., 12, 2505, https://doi.org/10.3390/rs12152505, 2020. a
Eiras-Barca, J., Brands, S., and Miguez-Macho, G.: Seasonal variations in North Atlantic atmospheric river activity and associations with anomalous precipitation over the Iberian Atlantic Margin, J. Geophys. Res.-Atmos., 121, 931–948, https://doi.org/10.1002/2015JD023379, 2016. a
Ferro, C. A. T. and Segers, J.: Inference for clusters of extreme values, J. Roy. Stat. Soc. Ser. B, 65, 545–556, 2003. a
Fuhrmann, C. M., Konrad, C. E., and Band, L. E.: Climatological Perspectives on the Rainfall Characteristics Associated with Landslides in Western North Carolina, Phys. Geogr., 29, 289–305, https://doi.org/10.2747/0272-3646.29.4.289, 2008. a
Guzzetti, F., Cardinali, M., and Reichenbach, P.: The AVI project: a bibliographical and archive inventory of landslides and floods in Italy, Environ. Manage., 18, 623–633, 1994. a
Guzzetti, F., Peruccacci, S., Rossi, M., and Stark, C. P.: Rainfall thresholds for the initiation of landslides in central and southern Europe, Meteorol. Atmos. Phys., 98, 239–267, https://doi.org/10.1007/s00703-007-0262-7, 2007. a, b, c, d
Heller, R. and Gur, H.: False discovery rate controlling procedures for discrete tests, arXiv [preprint], https://doi.org/10.48550/arXiv.1112.4627, 2011. a
Herrera, G., Mateos, R. M., García-Davalillo, J. C., Grandjean, G., Poyiadji, E., Maftei, R., Filipciuc, T., Jemec Auflič, M., Jež, J., Podolszki, L., Trigila, A., Iadanza, C., Raetzo, H., Kociu, A., Przyłucka, M., Kułak, M., Sheehy, M., Pellicer, X. M., McKeown, C., Ryan, G., KopaĊková, V., Frei, M., Kuhn, D., Hermanns, R. L., Koulermou, N., Smith, C. A., Engdahl, M., Buxó, P., Gonzalez, M., Dashwood, C., Reeves, H., Cigna, F., LišĊák, P., Pauditš, P., Mikulėnas, V., Demir, V., Raha, M., Quental, L., Sandić, C., Fusi, B., and Jensen, O. A.: Landslide databases in the Geological Surveys of Europe, Landslides, 15, 359–379, https://doi.org/10.1007/s10346-017-0902-z, 2018. a
Kim, S., Chun, K., and Kim, M. E. A.: Effect of antecedent rainfall conditions and their variations on shallow landslide-triggering rainfall thresholds in South Korea, Landslides, 18, 569–582, 2021. a
Lee, J. S., Song, Y.-K., and Kim, Y. T.: Slope stability characteristic of unsaturated weathered granite soil in Inje considering antecedent rainfall, J. Korean Soc. Hazard Mitig., 12, 85–92, 2012. a
Leonard, M., Westra, S., Phatak, A., Lambert, M., van den Hurk, B., McInnes, K., Risbey, J., Schuster, S., Jakob, D., and Stafford-Smith, M.: A compound event framework for understanding extreme impacts, WIREs Clim. Change, 5, 113–128, https://doi.org/10.1002/wcc.252, 2014. a
Maraun, D., Knevels, R., Mishra, A. N., Truhetz, H., Bevacqua, E., Proske, H., Zappa, G., Brenning, A., Petschko, H., Schaffer, A., et al.: A severe landslide event in the Alpine foreland under possible future climate and land-use changes, Commun. Earth Environ., 3, 1–11, 2022. a
Napolitano, E., Marchesini, I., Salvati, P., Donnini, M., Bianchi, C., and Guzzetti, F.: LAND-deFeND – An innovative database structure for landslides and floods and their consequences, J. Environ. Manage., 207, 203–218, https://doi.org/10.1016/j.jenvman.2017.11.022, 2018. a
Nocentini, N., Medici, C., and Barbadori, F. E. A.: Optimization of rainfall thresholds for landslide early warning through false alarm reduction and a multi-source validation, Landslides, 21, 557–571, 2024. a, b
Pereira, S., Ramos, A., Rebelo, L., Trigo, R., and Zêzere, J.: A centennial catalogue of hydro-geomorphological events and their atmospheric forcing, Adv. Water Resour., 122, 98–112, https://doi.org/10.1016/j.advwatres.2018.10.001, 2018. a, b, c, d
Pereira, S., Santos, P., Zêzere, J., Tavares, A., Garcia, R., and Oliveira, S.: A landslide risk index for municipal land use planning in Portugal, Sci. Total Environ., 735, 139463, https://doi.org/10.1016/j.scitotenv.2020.139463, 2020. a
Rahardjo, H., Li, X., Toll, D., and Leong, E.: The effect of antecedent rainfall on slope stability, Unsaturated soil concepts and their application in geotechnical practice, Springer, Dordrecht, https://doi.org/10.1007/978-94-015-9775-3_8, 371–399, 2001. a
Rahimi, A., Rahardjo, H., and Leong, E.-C.: Effect of antecedent rainfall patterns on rainfall-induced slope failure, J. Geotech. Geoenviron. Eng., 137, 483–491, 2011. a
Ramos, A. M., Cortesi, N., and Trigo, R. M.: Circulation weather types and spatial variability of daily precipitation in the Iberian Peninsula, Front. Earth Sci., 2, 25, https://doi.org/10.3389/feart.2014.00025, 2014. a, b, c, d
Ramos, A. M., Trigo, R. M., Liberato, M. L. R., and Tomé, R.: Daily Precipitation Extreme Events in the Iberian Peninsula and Its Association with Atmospheric Rivers, J. Hydrometeorol., 16, 579–597, https://doi.org/10.1175/JHM-D-14-0103.1, 2015. a, b
Rebelo, L., Ramos, A., Pereira, S., and Trigo, R.: Meteorological Driving Mechanisms and Human Impacts of the February 1979 Extreme Hydro-Geomorphological Event in Western Iberia, Water, 10, 454, https://doi.org/10.3390/w10040454, 2018. a
Segoni, S., Piciullo, L., and Gariano, S. L.: A review of the recent literature on rainfall thresholds for landslide occurrence, Landslides, 15, 1483–1501, https://doi.org/10.1007/s10346-018-0966-4, 2018. a
Seneviratne, S. I., Nicholls, N., Easterling, D., Goodess, C. M., Kanae, S., Kossin, J., Luo, Y., Marengo, J., McInnes, K., Rahimi, M., Reichstein, M., Sorteberg, A., Vera, C., and Zhang, X.: Changes in climate extremes and their impacts on the natural physical environment, in: Managing the Risks of Extreme Events and Disasters to Advance Climate Change Adaptation, A Special Report of Working Groups I and II of the Intergovernmental Panel on Climate Change (IPCC), edited by: Field, C., Barros, V., Stocker, T., Qin, D., Dokken, D., Ebi, K., Mastrandrea, M., Mach, K., Plattner, G.-K., Allen, S., Tignor, M., and Midgley, P., Cambridge University Press, Cambridge, UK, and New York, NY, USA, 109–230, ISBN 978-1-107-02506-6, 2012. a
Tehrani, F. S., Calvello, M., Liu, Z., Zhang, L., and Lacasse, S.: Machine learning and landslide studies: recent advances and applications, Nat. Hazards, 114, 1197–1245, https://doi.org/10.1007/s11069-022-05423-7, 2022. a, b
Trigo, R., Varino, F., Ramos, A., Valente, M., Zêzere, J., Vaquero, J., Gouveia, C., and Russo, A.: The record precipitation and flood event in Iberia in December 1876: description and synoptic analysis, Front. Earth Sci., 2, 3, https://doi.org/10.3389/feart.2014.00003, 2014. a
Trigo, R. M. and DaCamara, C. C.: Circulation weather types and their influence on the precipitation regime in Portugal, Int. J. Climatol., 20, 1559–1581, https://doi.org/10.1002/1097-0088(20001115)20:13<1559::AID-JOC555>3.0.CO;2-5, 2000. a
Trigo, R. M., Zêzere, J. L., Rodrigues, M. L., and Trigo, I. F.: The influence of the North Atlantic Oscillation on rainfall triggering of landslides near Lisbon, Nat. Hazards, 36, 331–354, https://doi.org/10.1007/s11069-005-1709-0, 2005. a
Van Asch, T. W. J., Buma, J., and Van Beek, L. P. H.: A view on some hydrological triggering systems in landslides, Geomorphology, 30, 25–32, https://doi.org/10.1016/S0169-555X(99)00042-2, 1999. a
Vaz, T., Zêzere, J. L., Pereira, S., and Quaresma, I.: Determinaçao de limiares de precipitaçao para o desencadeamento de movimentos de vertente na regiao de Lisboa com base em informaçao centenária, in: IX Congresso da Geografia Portuguesa, É vora, 28–30 November 2013, Évora is the place of congress, 791–796, ISBN 978-972-99436-6-9, 2013. a, b
Vaz, T., Zêzere, J. L., Pereira, S., Oliveira, S. C., Garcia, R. A. C., and Quaresma, I.: Regional rainfall thresholds for landslide occurrence using a centenary database, Nat. Hazards Earth Syst. Sci., 18, 1037–1054, https://doi.org/10.5194/nhess-18-1037-2018, 2018. a, b, c, d
Zêzere, J., Pereira, S., Tavares, A., Bateira, C., Trigo, R., Quaresma, I., Santos, P., Santos, M., and Verde, J.: DISASTER database on hydro-geomorphologic disasters in Portugal, Zenodo [data set], https://doi.org/10.5281/zenodo.7117037, 2022. a
Zêzere, J. L. and Trigo, R. M.: Impacts of the North Atlantic Oscillation on landslides, in: Hydrological, Socioeconomic and Ecological Impacts of the North Atlantic Oscillation in the Mediterranean Region, Springer, 199–212, https://doi.org/10.1007/978-94-007-1372-7_14, 2011. a, b, c, d
Zêzere, J. L., Trigo, R. M., and Trigo, I. F.: Shallow and deep landslides induced by rainfall in the Lisbon region (Portugal): assessment of relationships with the North Atlantic Oscillation, Nat. Hazards Earth Syst. Sci., 5, 331–344, https://doi.org/10.5194/nhess-5-331-2005, 2005. a, b
Zêzere, J. L., Trigo, R. M., Fragoso, M., Oliveira, S. C., and Garcia, R. A. C.: Rainfall-triggered landslides in the Lisbon region over 2006 and relationships with the North Atlantic Oscillation, Nat. Hazards Earth Syst. Sci., 8, 483–499, https://doi.org/10.5194/nhess-8-483-2008, 2008. a
Zêzere, J. L., Pereira, S., Tavares, A. O., Bateira, C., Trigo, R., Quaresma, I., Santos, P. P., Santos, M., and Verde, J.: DISASTER: a GIS database on hydro-geomorphologic disasters in Portugal, Nat. Hazards, 72, 503–532, 2014. a, b, c
Zêzere, J. L., Vaz, T., Pereira, S., Oliveira, S. C., Marques, R., and Garcia, R. A. C.: Rainfall thresholds for landslide activity in Portugal: a state of the art, Environ. Earth Sci., 73, 2917–2936, https://doi.org/10.1007/s12665-014-3672-0, 2015. a, b, c, d, e, f, g, h, i, j, k, l, m
Zscheischler, J., Martius, O., Westra, S., Bevacqua, E., Raymond, C., Horton, R. M., van den Hurk, B., AghaKouchak, A., Jézéquel, A., Mahecha, M. D., Maraun, D., Ramos, A. M., Ridder, N. N., Thiery, W., and Vignotto, E.: A typology of compound weather and climate events, Nat. Rev. Earth Environ., 1, 333–347, https://doi.org/10.1038/s43017-020-0060-z, 2020. a