the Creative Commons Attribution 4.0 License.
the Creative Commons Attribution 4.0 License.
 | 25 Jul 2024
Model-based assessment of climate change impact on inland flood risk at the German North Sea coast caused by compounding storm tide and precipitation events
Helge Bormann
Jenny Kebschull
Lidia Gaslikova
Ralf Weisse
In addition to storm tides, inland flooding due to intense rainfall has become an increasing threat at coastal lowlands. In particular, the coincidence of both types of events poses great challenges to regional water boards since their technical drainage capacities are limited. In this study, we analysed historical data and scenario-based simulations for gauge Knock near Emden at the German North Sea coast. The evaluation of observed inland flood events shows that mainly moderate storm tide series in combination with large-scale, intense precipitation led to an overload of inland drainage systems, whereas the highest individual storm tides or precipitation events alone could be handled well. Proactive risk management requires climate projections for the future. Therefore, a hydrological and a hydrodynamic ocean model were set up and driven by the same climate simulations to estimate future drainage system overloads. The evaluation of the simulations for the control period of two climate models confirms that the models can reproduce the generation mechanism of the compound events. The coincidence of storm tides and precipitation leads to the highest drainage system overloads, while system overload is also caused by intense rainfall events alone rather than by storm tides without intense precipitation. Scenario projections based on two climate models and two emission scenarios suggest that the intensity of compound events of rainfall and storm tides will increase consistently against the background of mean sea level rise for all investigated climate projections, while simulated system overload is higher for the RCP8.5 scenario compared to the RCP2.6 scenario. Comparable to the past, future compound events will cause more potential damage compared to single extreme events. The model results indicate an increasing frequency and intensity of inland drainage system overloads along the North Sea coast if timely adaptation measures are not taken.
- Article
(6466 KB) - Full-text XML
- BibTeX
- EndNote


Drainage management at flat coasts is a traditional challenge to enable the use of the dike hinterland for human activities such as agriculture, settlements, or trade (Titus et al., 1987; Ritzema and Stuyt, 2015; Waddington et al., 2022). The inhabitants of the northwestern German marsh area along the North Sea started building dikes and sea walls more than 1000 years ago to protect the productive landscape against storm tides (Behre, 2002). Due to the humid climate and the corresponding rainfall excess of inland areas, concurrent development of an efficient drainage system was necessary (Bormann et al., 2020). Tidal gates and pumping stations were built to convey the excess water from the hinterland to the sea. Such drainage management has been improved over the past few decades (Spiekermann et al., 2018, 2023), keeping all areas productive during the year and protecting low-lying coastal areas against inland flooding. Similar systems for coastal protection and inland drainage have also been developed in other low-lying coastal areas around the world, such as the Netherlands (van Alphen et al., 2022; Ritzema and Stuyt, 2015), the United States of America (Titus et al., 1987), Australia (Waddington et al., 2022), and New Zealand (Kool et al., 2020).
Climate change projections suggest that global mean sea level will continue to rise until the end of the 21st century and beyond (IPCC, 2021). Coastal areas are therefore identified as highly threatened areas (IPCC, 2022). Low-lying coasts are particularly vulnerable because water hazards may come from two sides (van den Hurk et al., 2015; Kool et al., 2020; Xu et al., 2023). Both sea level rise and intense rainfall events will have an increasing impact on flooding until the end of the century. Recent studies indicate that climate change might also intensify the pronounced seasonality in runoff generation along the North Sea coast (Bormann and Kebschull, 2023; Bronstert et al., 2023), leading to increasing drainage demands in the future if drainage standards are kept at minimum at the status quo.
However, water boards along the North Sea coast are increasingly operating their systems at the edge of their capacity as a consequence of increasing climate variability and extreme events (Spiekermann et al., 2018, 2023). Water boards are therefore aware that the effects of climate change will place even greater demands on drainage infrastructure in the future (Ahlhorn et al., 2018). Coastal water boards are responsible for the regulation of the water flow in the regional drainage networks, consisting of canals, ditches, tidal gates, and pumping stations. They guarantee both water drainage in wet periods and regulation of discharge in dry periods. In addition to the individually occurring events, such as storm tides or intense precipitation, compound events in particular pose a special challenge for flood protection and inland drainage. For example, if storm tide and intense rainfall events occur at the same time, even a combination of moderate single events often leads to an overload of the inland drainage system (Santos et al., 2021; Kool et al., 2020; van den Hurk et al., 2015). According to Pugh and Woodworth (2014), a storm tide is defined as the sum of a storm surge and the astronomical tide. At the German North Sea coast of Lower Saxony, such an event was last observed in February 2022, when a series of storm depressions (Ylenia, Zeynep, Antonia) was accompanied by several days of intense rainfall. Consequently, regional flooding occurred due to drainage system overload.
Climate change adaptation and flood risk management must explicitly consider the flood generation mechanism of such events (van den Hurk et al., 2015), especially if climate change will intensify as projected by the IPCC (2021, 2022). Most available studies focus on the coincidence of storm tides and high regional river discharges. For example, Heinrich et al. (2023a) investigated the coincidence of storm tides and high river discharge at European coasts. While they found a significantly increased likelihood of simultaneous storm tides and high river discharge for westward-facing estuaries, they did not identify a frequency higher than expected by chance of such compound events for other estuaries, including the northward-facing Ems Estuary. Similarly, Svensson and Jones (2002) analysed the dependence between storm tides, river flow, and precipitation in the UK. They identified compound events of high river flow and storms for specific storm track directions. The dependence between high river flow and storm surge was found to be stronger during winter than in summer.
While most available studies focus on data analyses, Paprotny et al. (2020) demonstrated that large-scale hydrodynamic models are capable of representing observed compound flood events in northwestern Europe. Thus, model-based tools can be useful for the projection of climate change impacts. Bevacqua et al. (2019, 2020) projected a strong increase in the occurrence rate of compound flooding events for the future, especially in northern Europe, mainly due to the stronger precipitation as a result of a warmer atmosphere carrying more moisture. A similar result was obtained by Heinrich et al. (2023b) but was mostly attributed to future rising mean sea level. Xu et al. (2023) investigated the impact of future rainfall changes and sea level rise on compound flood risk for a coastal city in China using hydrodynamic modelling. They showed that both drivers increase flood extent, flood depth, and flood duration, while future rainfall changes will have a greater impact on flood risk. However, the combined effect of future rainfall changes and sea level rise on flood risk is assumed to be larger than the sum of their individual effects.
Other climate change impact analyses focus on the impacts of storm tides (e.g. van Alphen et al., 2022; Waddingten et al., 2022) or changes in runoff generation (e.g. Bormann et al., 2018; Bormann and Kebschull, 2023) or are based on statistical approaches (e.g. Santos et al., 2021). The latter is a consequence of the fact that the available resolution of climate projections is often insufficient to drive regional hydrodynamic ocean models to represent water level dynamics including storm tides. After all, they require regional wind fields at high temporal resolution. Similarly, process-based runoff generation models require precipitation intensities at sufficient resolution.
To date, no scenario-based climate change impact assessment, projecting the above-described compound events causing local to regional flooding at shallow coasts by coupling ocean and hydrological models, is available. While such impact is neglected on the global scale, local to regional studies either focus on data analyses (e.g. van den Hurk et al., 2015) or combine explicit modelling of the terrestrial hydrology with assumptions on sea level rise and storm surges (e.g. Xu et al., 2023).
In this study, we fill this gap by driving a runoff generation model and a regional hydrodynamic ocean model with the same regionalized climate scenarios at hourly temporal resolution, enabling consistent coupled projections of compound events. We use climate projections of two climate models quantifying the effects of two different emission scenarios and analyse this small ensemble with regard to change signals in the impact of storm tides and runoff generation on the overload of a regional drainage system at the German North Sea coast.
2.1 Target area
The target area of this study is located in the northwestern part of East Frisia (northern Germany) and includes the area of the Emden water board (EEVE; Fig. 1). The area of the Emden water board is bordered by the Ems Estuary, the Dollart, and the North Sea. The water board has an area of 465 km2, of which is located below sea level (Spiekermann et al., 2018). The landscape is dominated by marsh soils, mainly used for dairy farming (grassland). But the region also has residential and commercial areas, and tourism plays an important role in the regional economy.
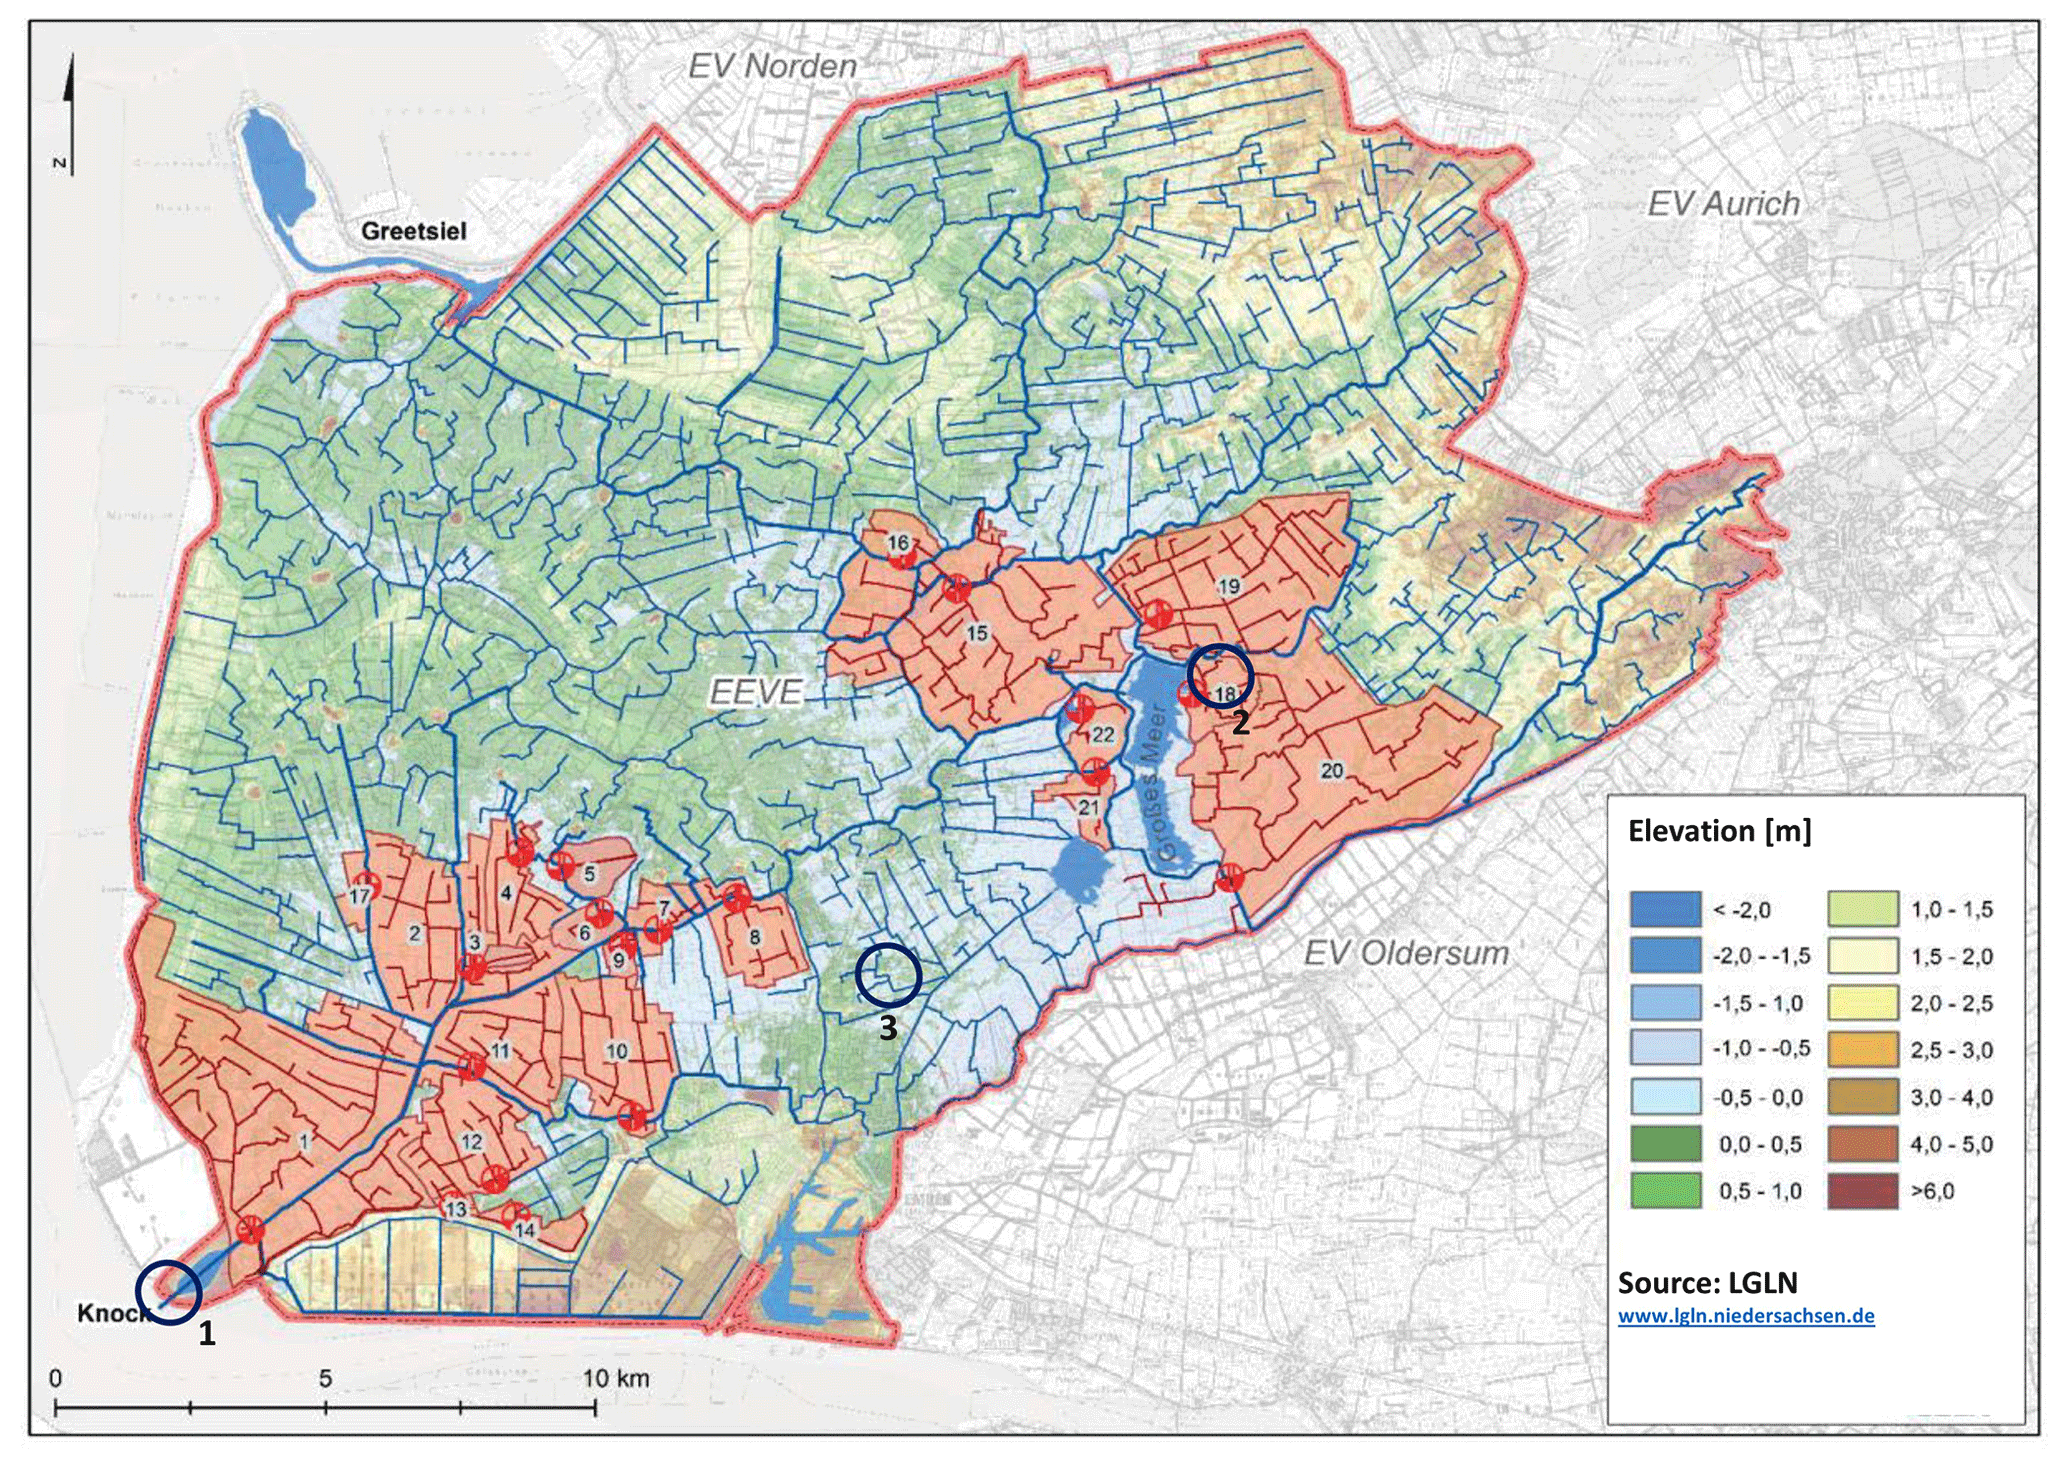
Figure 1Topography of the Emden water board (EEVE; area within the red border; elevation in metres above NHN – ”Normalhöhen Null” or standard elevation 0). The orange areas are 22 low-lying pump areas (black numbers), and linear blue structures represent the drainage system. The black circles represent the measurement stations: 1 – gauge Knock, 2 – gauge Bedekaspel, 3 – DWD weather station in Emden. Data source: extract from the basic geodata of the Lower Saxony surveying and cadastral administration (LGLN; https://www.lgln.niedersachsen.de, last access: 23 July 2024).
Since permanent and reliable drainage is a prerequisite for settlement and use of the area, the water board maintains a watercourse network 1100 km in length, which conveys the runoff to the two tidal gates and pumping stations Knock and Greetsiel. Depending on the seawater level, either free drainage is possible (currently approx. of the drainage volume) or pumping is required (currently approx. of the drainage volume). In the case of high seawater levels, the pumping capacity drops significantly due to the increasing geodetic head (Bormann et al., 2023; for details see Sect. 2.4.3).
Specific inland flood risk is caused in periods when storm tides and intense rainfall coincide. In such a situation high runoff generation and reduced pumping capacities can lead to drainage system overload and inland flooding. The effect of high river Ems discharge is negligible compared to the impact of storm tides due to the wide Ems Estuary at gauge Knock and due to the time lag between high precipitation and river runoff caused by the catchment size (> 13 000 km2). However, water boards located upstream are impacted by high Ems River discharge as well.
2.2 Data
For the analyses of historic events, a regional 20-year time series (2000–2019) of seawater level, inland water level, and weather data was used for the Emden water board at high temporal resolution:
-
seawater levels at 1 min resolution at gauge Knock (location 1 in Fig. 1; source: state agency of NLWKN; https://www.nlwkn.niedersachsen.de, last access: 23 July 2024)
-
inland water levels at 15 min resolution at gauge Bedekaspel (location 2 in Fig. 1; source: Emden water board; https://www.entwaesserungsverband-emden.de/, last access: 23 July 2024)
-
precipitation at daily resolution at Emden station (location 3 in Fig. 1; source: German Weather Service; https://www.dwd.de, last access: 23 July 2024).
As forcing for the impact modelling, four data sets from the EURO-CORDEX initiative were used with sufficient temporal resolution. The data sets provide regional climate projections for Europe at 12.5 km (0.11°) resolution (Jacob et al., 2014). For these data sets, the regional climate model REMO (Jacob et al., 2007) in two different versions (REMO2009 and REMO2015) was driven by the output of two global climate models (HadGEM2-ES; Jones et al., 2011, and MPI-ESM-LR; Giorgetta et al., 2013) that are part of the CMIP5 ensemble (Taylor et al., 2012). For both regionalizations, one realization with hourly model output was available for a historic period and two emission scenarios (RCP8.5 and RCP2.6) in the following combinations:
-
HadGEM2-ES, regionalized by the regional climate model REMO2009 (1950–2099; RCP2.6 and RCP8.5), referred to as HadGEM in the following, and
-
MPI-ESM-LR, regionalized by the regional climate model REMO2015 (1950–2100; RCP2.6 and RCP8.5), referred to as MPI in the following.
Bias correction was carried out for the simulated temperature and precipitation of both dynamic climate models. A monthly linear scaling (Shrestha et al., 2017) was applied to the control period (1971–2000) to correct a long-term overestimation of precipitation and temperature. To reproduce seasonality in precipitation and temperature correctly, monthly specific bias correction factors were applied to the model data for all months of the year (for details see Ley et al., 2023; Bormann and Kebschull 2023).
2.3 Classification and determination of compound events
Compound events are defined as a combination of processes (climate drivers and hazards) leading to a significant impact on one system (Zscheischler et al., 2018). The IPCC (2012) describes compound events as combinations of (1) two or more extreme events occurring simultaneously or successively, (2) combinations of extreme events with underlying conditions that amplify the impact of the events, or (3) combinations of events that are not extremes themselves but lead to an extreme event or impact when combined. The contributing events can be of a similar type (clustered multiple events) or different types (Seneviratne et al., 2012).
Based on these definitions, Zscheischler et al. (2020) suggested a typology of meteorological compound events. They distinguish between the following:
-
multivariate compound events, which are the simultaneous occurrence of different events affecting the same system;
-
spatial compound events, defined as the occurrence of events in different regions affecting the same system;
-
temporal compound events, characterized by several consecutive events affecting the same system; and
-
preconditioned compound events, described as events that occur only under certain conditions.
In this study, the multivariate compound events resulting from the coincidence of storm tide series and intense precipitation on the North Sea coast are investigated for the Emden water board (East Frisia). Practical experience of the water board shows that system overload at the North Sea occurs in particular when intense precipitation falls over a longer time during a period in which the pumping capacity is reduced by high sea levels (Spiekermann et al., 2018, 2023). During the course of such events the drainage system overload is exacerbated by the technical limitation of the pumping capacity installed in the dike line.
Compound events in the observations were identified following the approach suggested by van den Hurk et al. (2015) by selecting the 15 largest events according to sea level (mean sea level over a five-tide period), precipitation (antecedent 3 d precipitation sum), and highest inland water levels (maximum daily value). This corresponds to a characteristic 3 d period as storm tide series of a 3 d duration have already been observed in the region in the past few years (e.g. in February 2022). For adaptation planning, regional stakeholders therefore demand an estimation of the impact of compound events with a 3 d duration (Spiekermann et al., 2023). The water boards aim at a constant water level of the inland water system to guarantee permanent use of the area. Thus, a positive deviation from the target water level can be interpreted as a system overload. While van den Hurk et al. (2015) compared the 20 largest inland water levels to the 10 highest wind-induced surges and precipitation events, we extracted 15 events each as a compromise between limited data availability (20-year time series of observations) and the minimum number of events required for evaluation.
For the model-based analyses, compound events were identified by an adjusted method, since inland water levels could not be simulated directly. This is due to the complex drainage system and the anthropogenic regulation of the hydraulic head, while regulation is not documented and is not always rule based. Instead of water levels, system overloads (in millions of cubic metres) were calculated as the sum of the current system overload on a distinct day and runoff generation minus the pump capacity of that day (which depends on the average sea level; for details see the following section on the model set-up). By selecting a characteristic 3 d period, a potential delay between precipitation and system overload (“concentration time”) is taken into account. Similar to the analysis of the observed data, the 15 largest events were selected for the highest sea levels (average sea level over a period of five tides) and precipitation events (antecedent 3 d precipitation sum). A total of 15 events with the highest magnitudes of the simulated system overloads of the inland drainage system were used as a proxy for high inland water level events.
To describe the compound events with regard to their drivers, the maximum of the 15 selected largest sea levels and precipitation events each are called extreme events, while the remaining 14 events are called high storm tides and intense precipitation. Further events which are lower than the 15 highest selected are called moderate events. While such definition may lead to the fact that, under climate change conditions, an extreme event from the past could be only classified as an intense event in a future period, it enables to assess the contribution of the individual drivers to a compound event with regard to the ensemble of events in the respective period.
2.4 Model set-up
While an analysis of compound events based on observations could be carried out straightforwardly according to the literature (van den Hurk et al., 2015), for the evaluation of climate change projections a new model set-up was necessary to represent the generation of multivariate compound events. Extreme and intense precipitation events and high water levels of storm tides were derived from simulations directly, but due to the complexity of the coastal drainage system, inland water levels could not be simulated for the water board area; instead, system overload was estimated as follows (Fig. 2). A storage approach represents the volume of the coastal drainage system. Runoff generation simulated by the SIMULAT water balance model (Diekkrüger and Arning, 1995; Bormann, 2008) is the only input term, and pump capacity is the only output term. We assume that there is no exchange of water between the area of the Emden water board and the neighbouring water board areas and that there is no limitation of lateral water flow within the water board area through canals and ditches. The time-variable drainage capacity then depends on the sea level simulated by the regional hydrodynamic ocean model TRIM-NP (Kapitza et al., 2008), the inland water level (assumed to be constant at the current target level), and the parameters of the pumps. Since both models (SIMULAT and TRIM-NP) are driven by the same climate projections, consistent representations of possible future conditions are simulated.
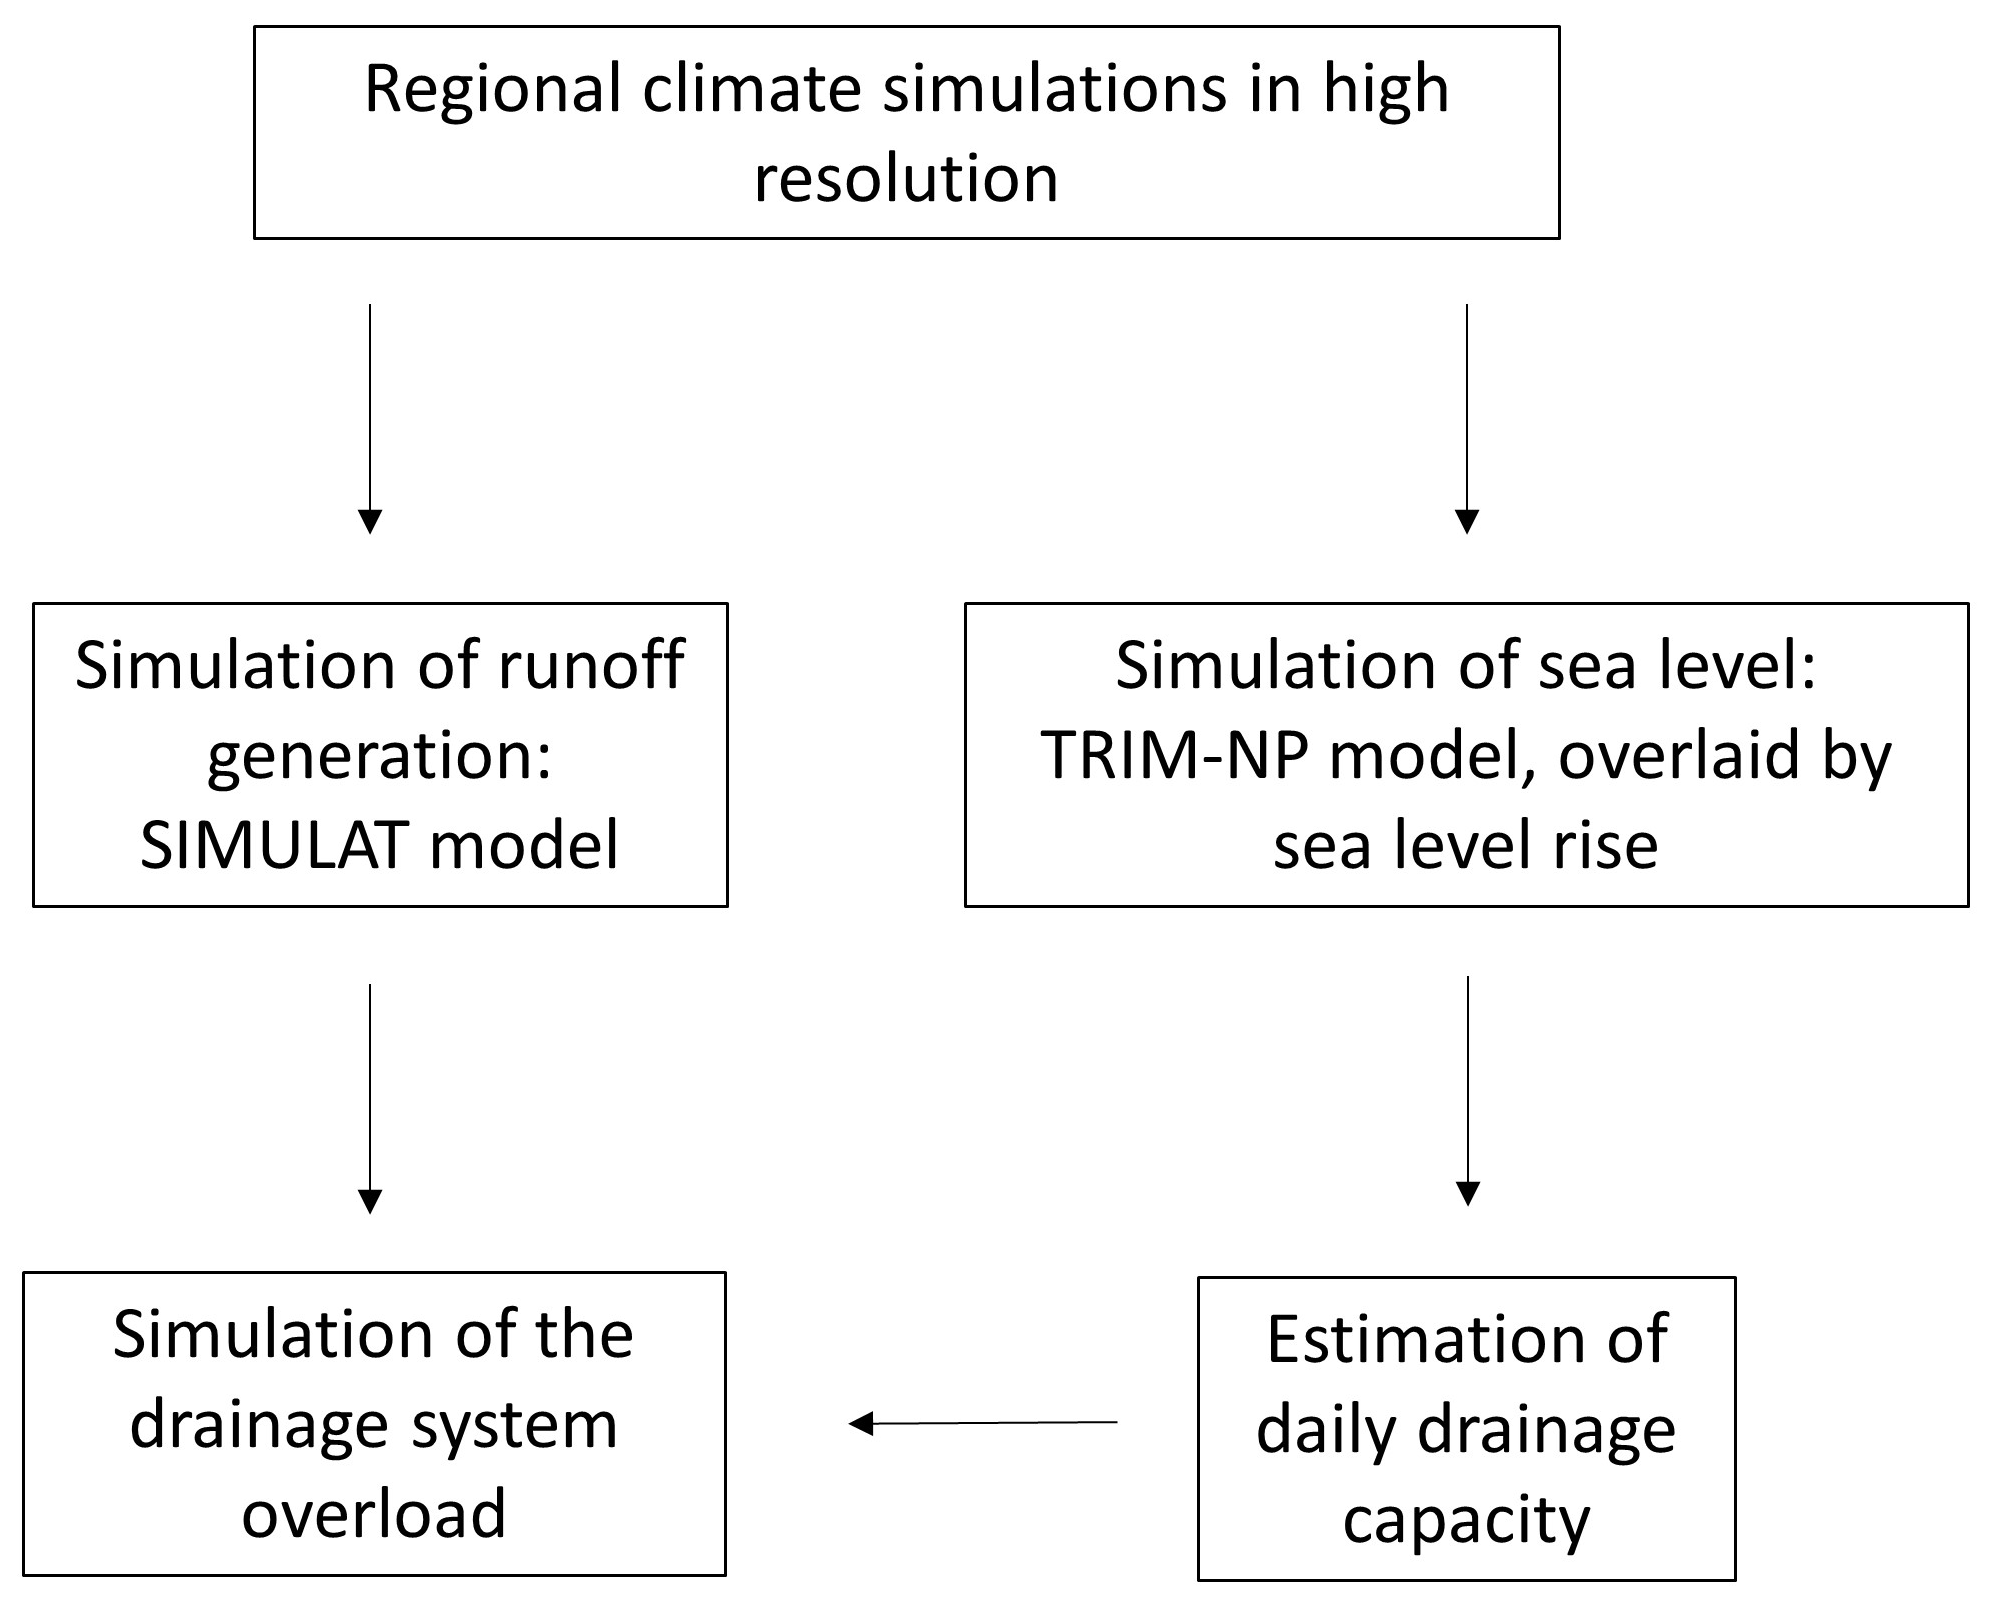
Figure 2Model chain for the projection of future compound events: regionalized climate projections drive a regional runoff generation model (SIMULAT) and a regional hydrodynamic ocean model (TRIM-NP); estimation of daily drainage capacity from seawater levels enables the comparison with runoff generation, resulting in projections of drainage system overload.
An application of this methodology to the observed data was not carried out due to the limited temporal resolution of precipitation data. Since precipitation is available only at daily resolution, a disaggregation would have been required, introducing additional uncertainty.
2.4.1 SIMULAT model: runoff generation
The physically based hydrological model SIMULAT (Diekkrüger and Arning, 1995; Bormann, 2008) is a continuous hydrological soil–vegetation–atmosphere transfer (SVAT) scheme, initially developed to simulate local-scale hydrological processes. Basic equations included in SIMULAT are the Richards equation to calculate soil water flux and the Penman–Monteith equation for potential evapotranspiration (PET). Actual evapotranspiration (ETA) is calculated from PET, taking into account the actual soil moisture status (approaches of Feddes et al., 1978, for transpiration and Ritchie, 1972, for evaporation). Further processes considered by SIMULAT are the separation of rainfall into surface runoff and infiltration (performed by a semi-analytical solution of the Richards equation; Smith and Parlange, 1978), interflow (based on Darcy's law), groundwater recharge, and snowmelt (degree-day approach). A plant growth model is not included; instead, the average seasonal development of plant parameters necessary for the Penman–Monteith equation is estimated by linear interpolation of values given from the literature (see Bormann and Kebschull, 2023). Soil parameters are derived by the pedotransfer function of Rawls and Brakensiek (1985). At the scale of hydrological response units (HRUs) derived for the Emden water board by Bormann et al. (2018) based on the available spatial data sets, runoff generation is calculated by accumulating all three runoff components (surface runoff, interflow, and groundwater recharge) for each daily time step. At the water board scale, runoff generation is calculated for all HRUs and afterwards weighted per unit area. Runoff routing is not considered since hydraulic gradients are mainly affected by the operation of the drainage system and are therefore temporarily variable. We assume that the concentration time is considerably smaller than the maximum duration of the events analysed in this study (3 d). SIMULAT was successfully calibrated and validated for the Emden water board (Bormann et al., 2018) and for neighbouring water boards (Bormann and Kebschull, 2023) by comparing runoff generation simulated by the model with the estimated drainage rates.
For the climate change impact analysis, SIMULAT is driven by hourly climate variables of the regionalized climate models MPI and HadGEM, namely air temperature, air humidity, wind speed, global radiation, and precipitation. As output, SIMULAT calculates daily runoff generation rates.
2.4.2 TRIM-NP model: total sea level
For the high-resolution modelling of water levels in the German Bight and the attached estuary of the river Ems, the hydrodynamic numerical model TRIM-NP (Casulli and Stelling, 1998; Kapitza, 2008) is used. TRIM-NP is a 3D finite-difference model that solves the Reynolds-averaged Navier–Stokes equations on a Cartesian grid. It allows for wetting and drying. For the simulations in this study, the model is used in a 2D barotropic mode with nested grids. The coarsest grid with 12.8 km resolution covers the northeastern Atlantic, North Sea, and Baltic Sea. Three further grid refinements are nested one way towards a 1.6 km resolution over the German Bight. The finite element solutions (FES) tidal signal (Lyard et al., 2006) is applied at the lateral boundaries of the coarsest grid. For the climate change impact analysis, TRIM-NP is driven by hourly 10 m height wind components and sea level pressure from the regionalized climate models MPI and HadGEM. The output sea level variations for the 1950–2100 (2099) period are stored at 20 min resolution for the German Bight (Gaslikova, 2023). For further model details and applicability for the climate change scenarios, see also Gaslikova et al. (2013). The resulting high-frequency sea level variations are additionally superimposed by regionalized long-term projections of the mean sea level rise (IPCC, 2021). In particular, for the 2020–2100 period the medians of the regional SSP1–2.6 and SSP5–8.5 projections for Delfzijl from the IPCC AR6 Sea Level Projection Tool (Garner et al., 2021; Fox-Kemper et al., 2021) are used together with the RCP2.6 and RCP8.5 climate projections respectively. For the sake of clarity all combinations of modelled storm tides and mean sea level are hereafter referred to as either RCP2.6 or RCP8.5. The data set is complemented with the observed annual mean sea level at Norderney (WSV, 2021) for the historical period of 1971–2019.
2.4.3 Drainage capacity
The drainage capacity of a coastal outlet structure consisting of a tidal gate and a pumping station (such as station Knock for the Emden water board; Fig. 1) depends on both individual drainage capacities, which apply as a function of the total dynamic head between the inland water level and sea level. While gravity-driven flow through the tidal gate is possible for low sea levels, water needs to be pumped for high sea levels.
Pump capacity depends on the total dynamic head, which is defined as the work to be done by a pump, per unit of weight and per unit of water volume. Based on an estimation of gravity-driven flow through the tidal gate (provided by the state agency, NLWKN) and the pump parameters (provided by the Emden water board), a drainage capacity function was derived for the Knock station.
Estimation of the pump capacity is based on the pump characteristics and is done for each blade position, which is adjusted in intervals of 50 cm hydraulic heads. Above a hydraulic head of 3.75 m, the pumps have to be switched off. A third-order polynomial function was fitted by the least squares approximation for the estimated values (see Fig. 3). The drainage system is managed in such a way that the inland water levels remain as constant as possible. Deviations from the intended inland water level occur in the case of system overload and are analysed in more detail in the next section. Although this unwanted increase in the inland water level of the order of a few decimetres is critical for flood risk analysis, it does not significantly change the pump capacity. As can be seen from Fig. 3, a change in the total dynamic head of several decimetres does not have a strong impact on the pump rates. Thus, it is assumed that the hydraulic head mainly depends on the sea level outside the pump station, and pump capacity considerably decreases with increasing seawater level.
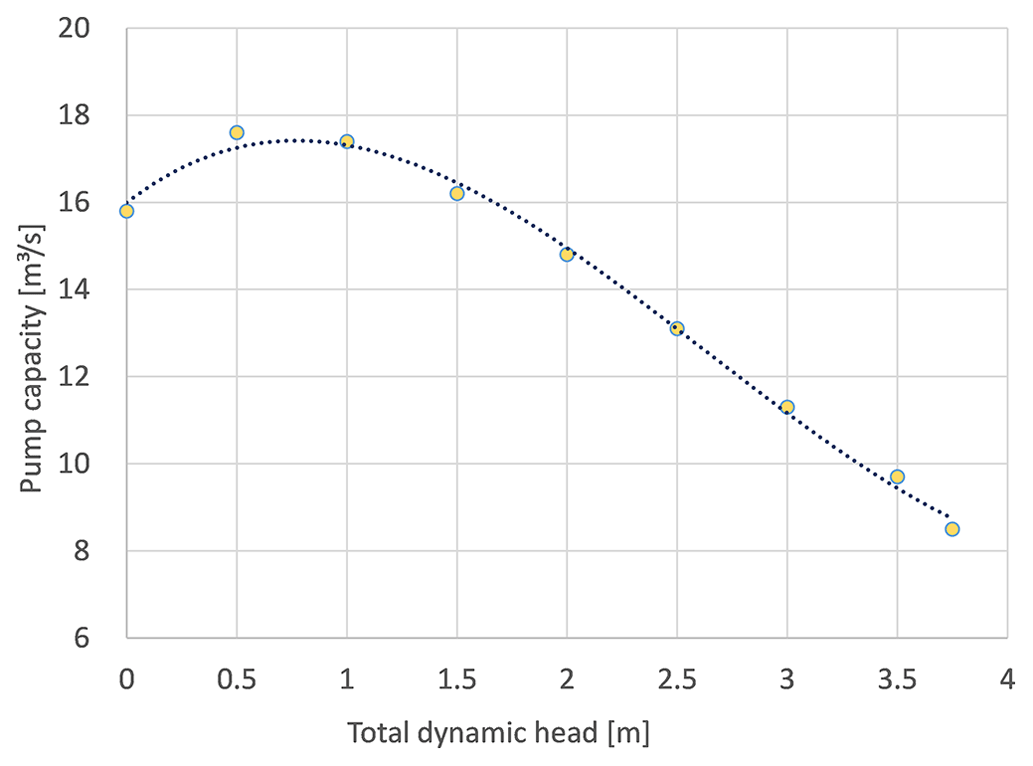
Figure 3Function of the pump capacity per pump at the Knock station. The yellow dots are estimations of the pump capacity based on the pump characteristics; the dotted line is a corresponding third-order polynomial approximation.
3.1 Identification of compound events based on historical data
The water level in the inland water system is regulated to keep the inland water level constant. The difference between the observed and the intended (i.e. regulated) inland water level provides a proxy for the drainage system overload. To analyse possible compound effects, the events with the 15 largest inland water anomalies were selected and plotted together with the corresponding observed mean sea level over five tides and the antecedent 3 d precipitation sum. In addition, the 15 largest sea level and precipitation events were also selected and plotted together with their observed inland water level anomalies (Fig. 4). If none of the 15 highest precipitation events and 15 storm tides contributed to the 15 highest inland water levels, this would result in 45 events in total, while if all of the highest observed storm tides and rainfall events contributed to the 15 highest inland water levels, only 15 circles would be drawn.
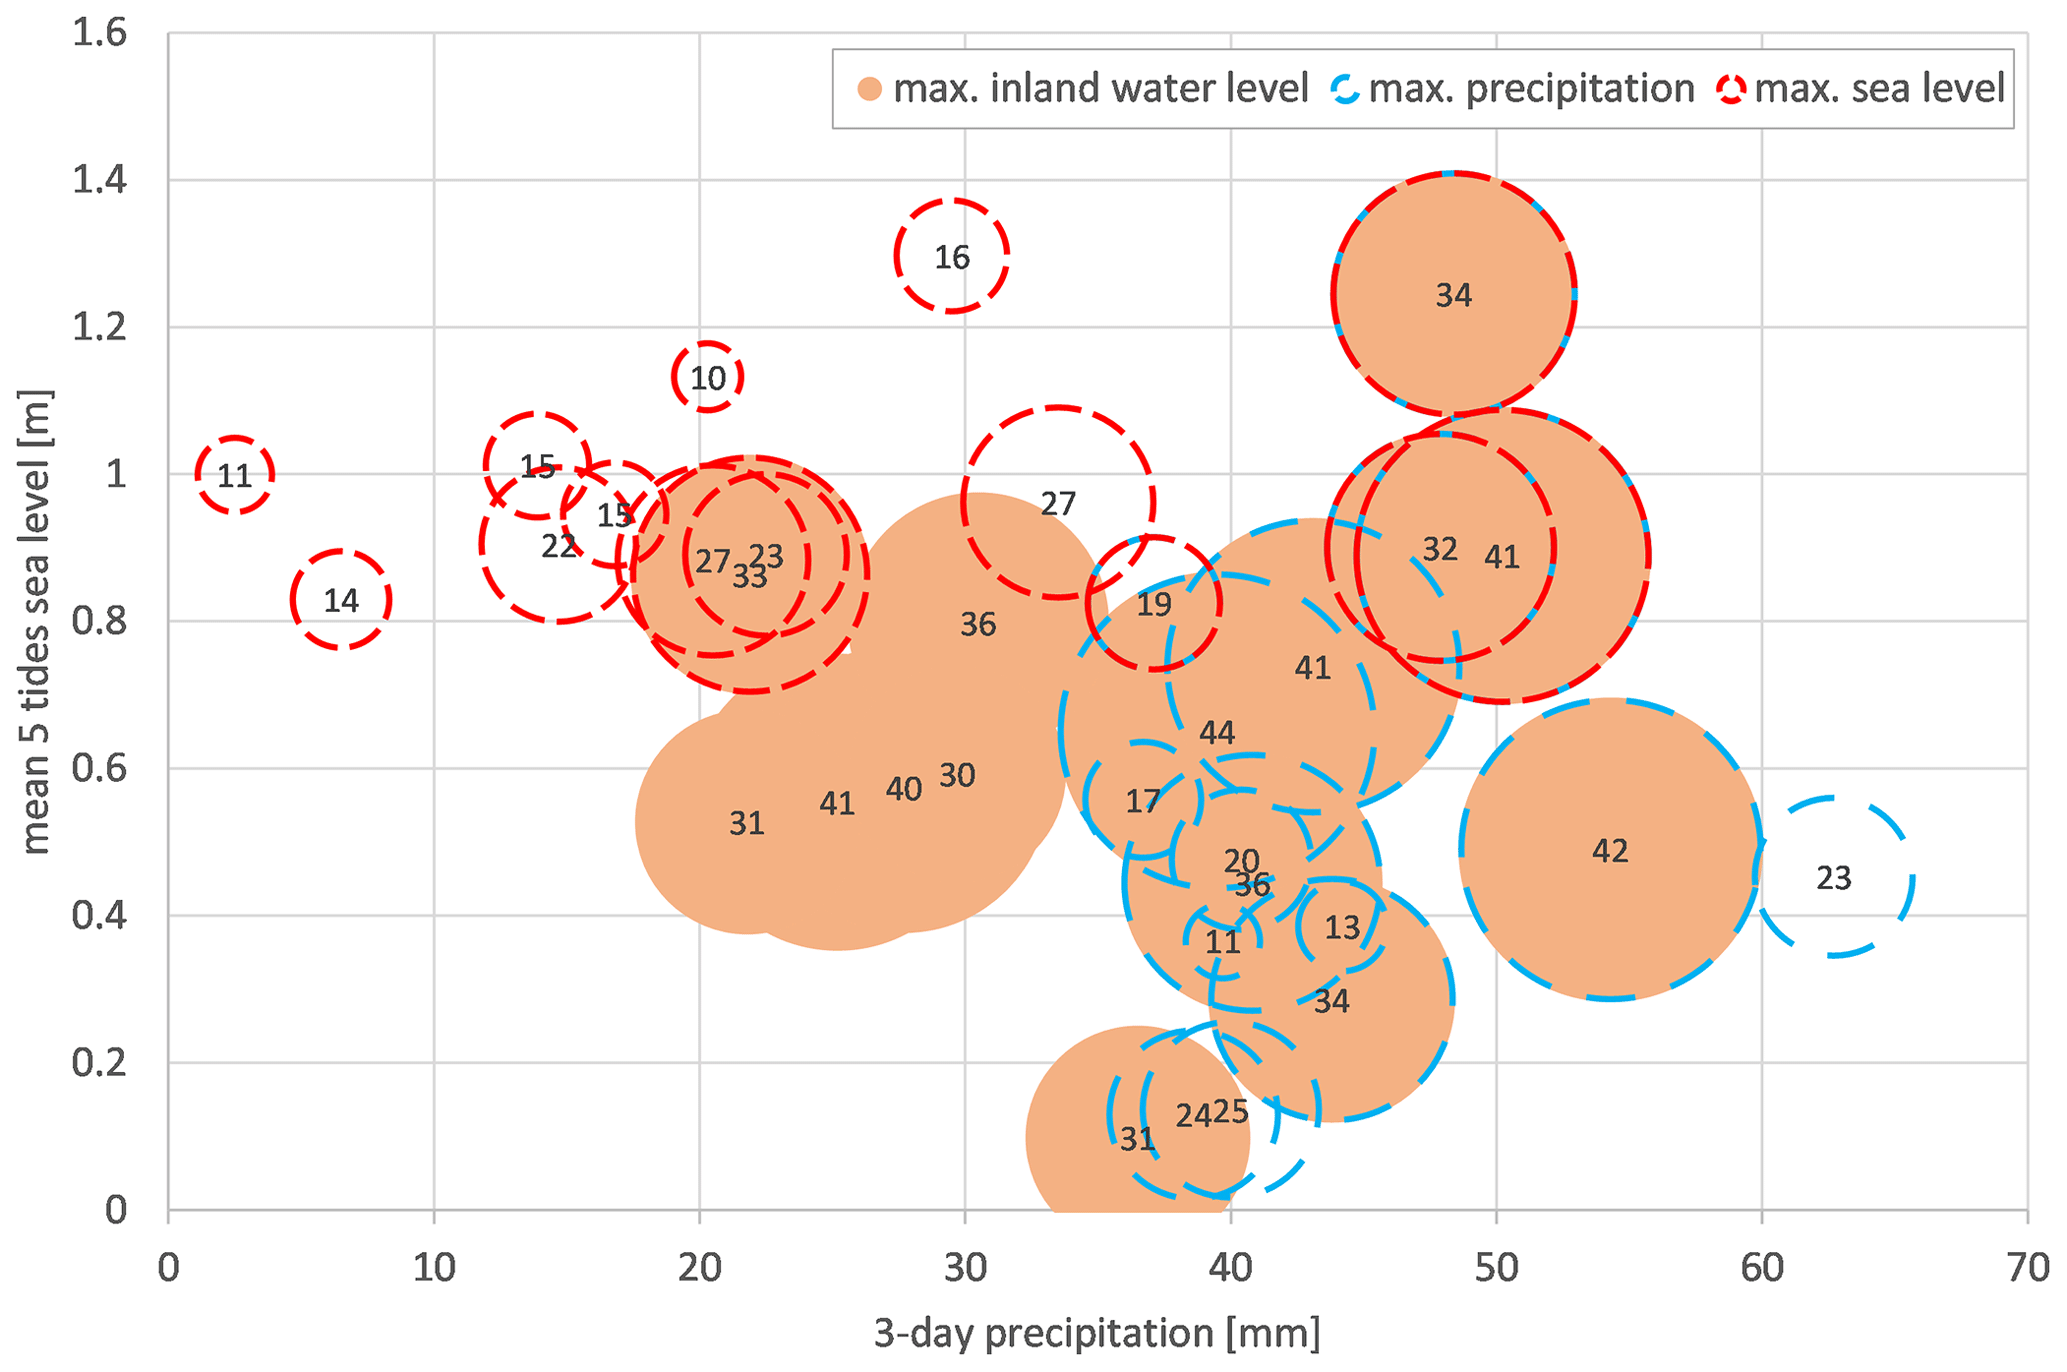
Figure 4Inland water level anomaly as the difference from the regulated inland water level (cm) for the 15 highest sea level (mean sea level over a five-tide period above NHN (m); red circles) and precipitation (antecedent 3 d precipitation sum (mm); blue circles) events in the 2000–2019 period. Additionally, the 15 highest inland water level anomalies in the same period are shown (orange bubbles). The diameter of the circles is proportional to the size of the difference between the observed and the intended regulated inland water level (number in the circles and bubbles in centimetres).
The analysis reveals that either the co-occurrence of high sea levels together with intense precipitation events or the joint occurrence of moderate sea levels and intense precipitation sums leads to the largest observed deviations from the regulated inland water level (in total 9 of the 15 largest events: orange bubbles with red and/or blue contour). This is in agreement with the results and conclusions presented by van den Hurk et al. (2015). Moreover, a tendency can be inferred that precipitation is a somewhat more important driver, as 5 of the 15 highest inland water level anomalies were associated with intense precipitation only (orange bubbles with blue contour), while sea level heights were moderate. In addition, Fig. 4 reveals that sea level and precipitation do not represent the sole drivers of inland water anomalies as some of the events with rather similar combinations of precipitation and sea levels were associated with rather different inland water heights. Thus, assuming a storm tide–precipitation multivariate compound event gives insight into the overload generation mechanism. But it cannot explain the variability in the data alone. Preconditions such as antecedent soil moisture are probably an important additional driver, but observational data on soil saturation are not available.
3.2 Identification of compound events based on scenario simulations
3.2.1 Control period of the climate simulations
Analysis of compound events from the impact models driven with data from the two downscaled climate models (HadGEM, MPI) for the control period (1971–2000) reveals that the model set-up can reproduce the structure of compounding sea level and precipitation events contributing to inland flooding as obtained from the observations. Repeating the analysis done for the observations (Fig. 4) for the 1971–2000 control period yields the same three different groups of events (Fig. 5), as derived from observed data (Sect. 3.1). Note that instead of inland water level anomaly (cm), simulated drainage system overload (millions of cubic metres) was used in the analysis of the model results.
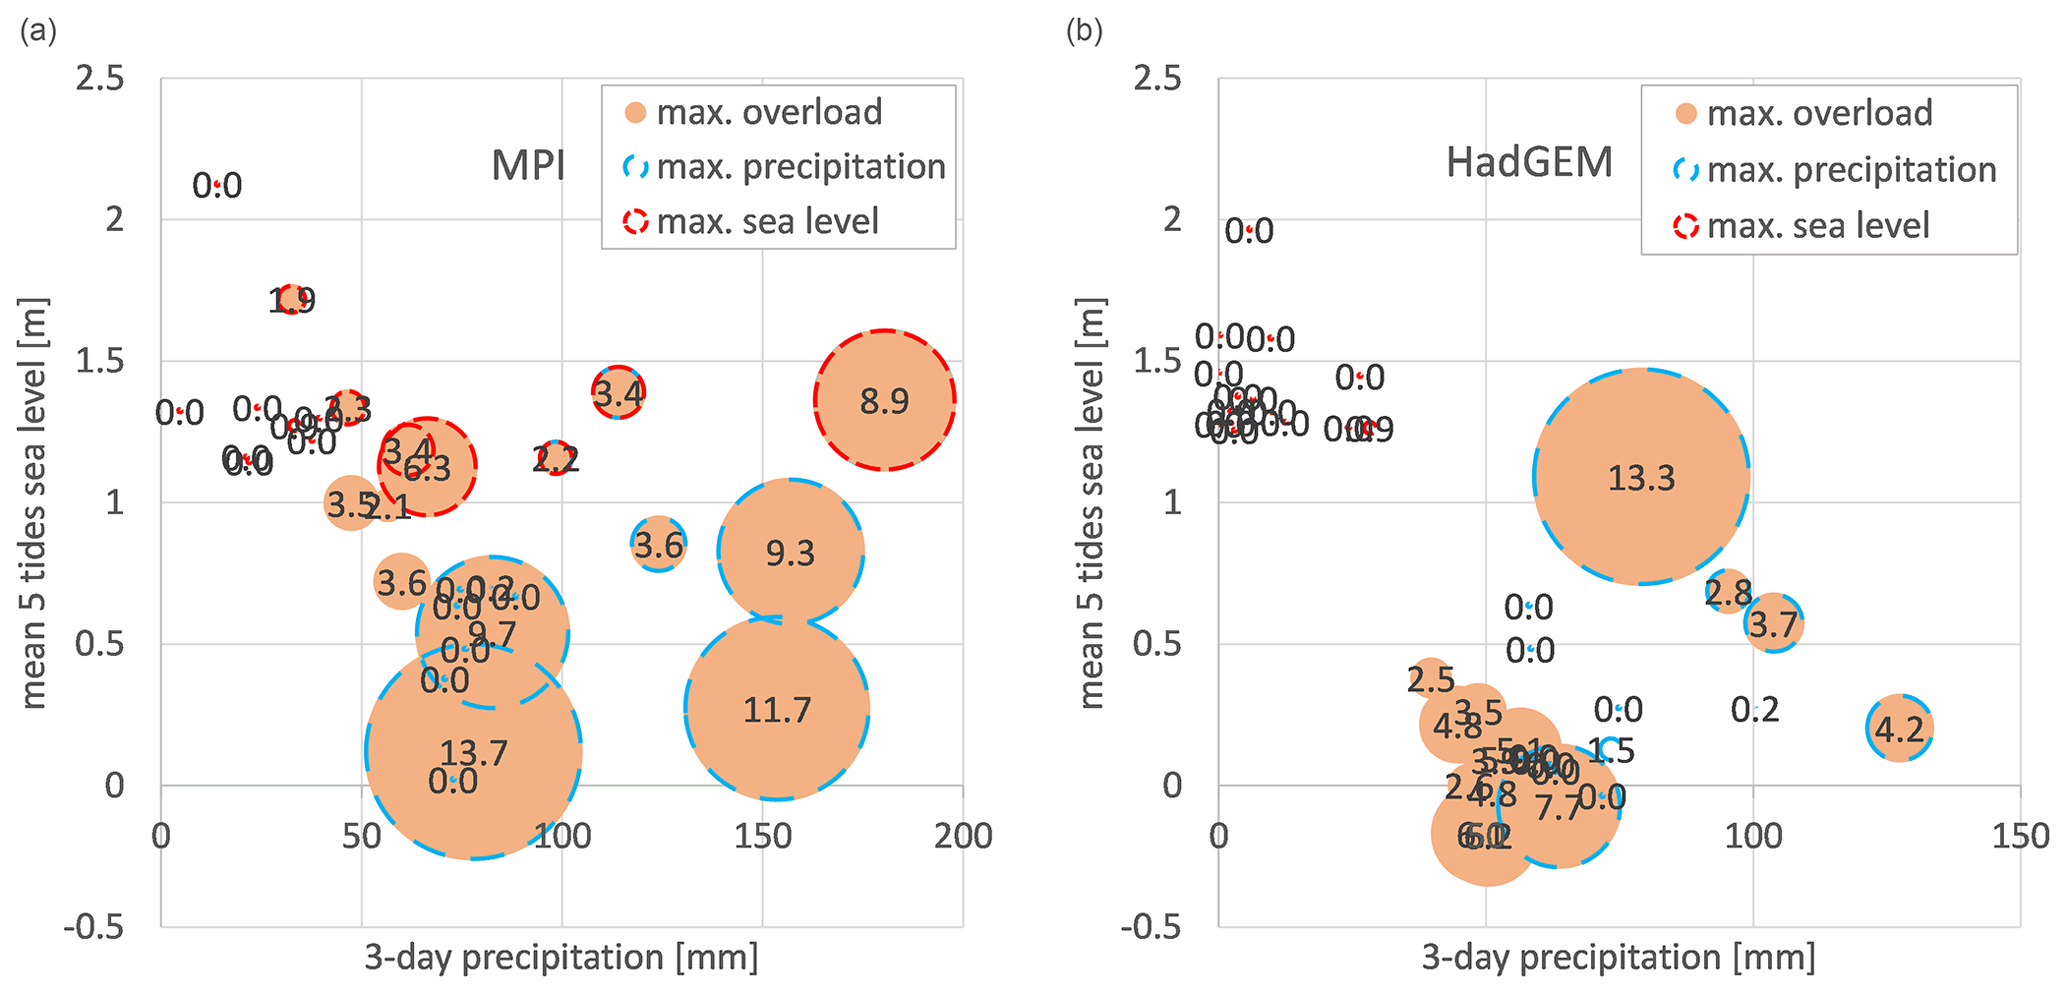
Figure 5Simulated drainage system overload (106 m3) for the 15 highest sea level (mean sea level over a five-tide period above NHN (m); red circles) and precipitation (antecedent 3 d precipitation sum (mm); blue circles) events in the 1970–2000 period derived from the simulations driven by the MPI (a) and HadGEM (b) model data. Additionally, the 15 simulated drainage system overloads in the same period are shown (orange circles). The diameter of the circles is proportional to the magnitude of the modelled drainage system overload (number in the circles and bubbles in millions of cubic metres).
For the control period, the overlap of the 15 largest five-tide mean sea levels with the 15 highest inland drainage system overloads (seven events for the MPI model, no event for HadGEM) is smaller compared to the highest precipitation events (eight events for the MPI model, five events for HadGEM). For the HadGEM model in particular, intense precipitation seems to be the more important driver contributing to high inland drainage system overloads. The largest system overloads (13.7 million m3 for the MPI model and 13.3 million m3 for the HadGEM model) are caused by neither the maximum sea level nor the largest precipitation sum. They are generated by a combination of moderate storm tides and intense precipitation. However, obviously both precipitation sums and sea levels are larger in the control simulations compared to the observational data. Such events would lead to local inundations since only about half of the calculated volume can be retained by the regional drainage system. (Spiekermann et al., 2023). The magnitude of the calculated events follows the perception of regional stakeholders on the highest events experienced in the past few decades (Spiekermann et al., 2023), while differences in the observed water anomalies (Fig. 3) may partially be due to the shorter period of observational data compared to the simulations.
For precipitation, the overestimation by the simulations can also be caused by individual small-scale convective summer events. In reality, such events do not cover the whole water board area and therefore do not induce a system overload. However, they are overrepresented in the results of the regional climate models due to a relatively coarse grid size. Therefore, the same evaluation of compound events was repeated with a focus on events in the winter half-year only (October to March; Fig. 6).
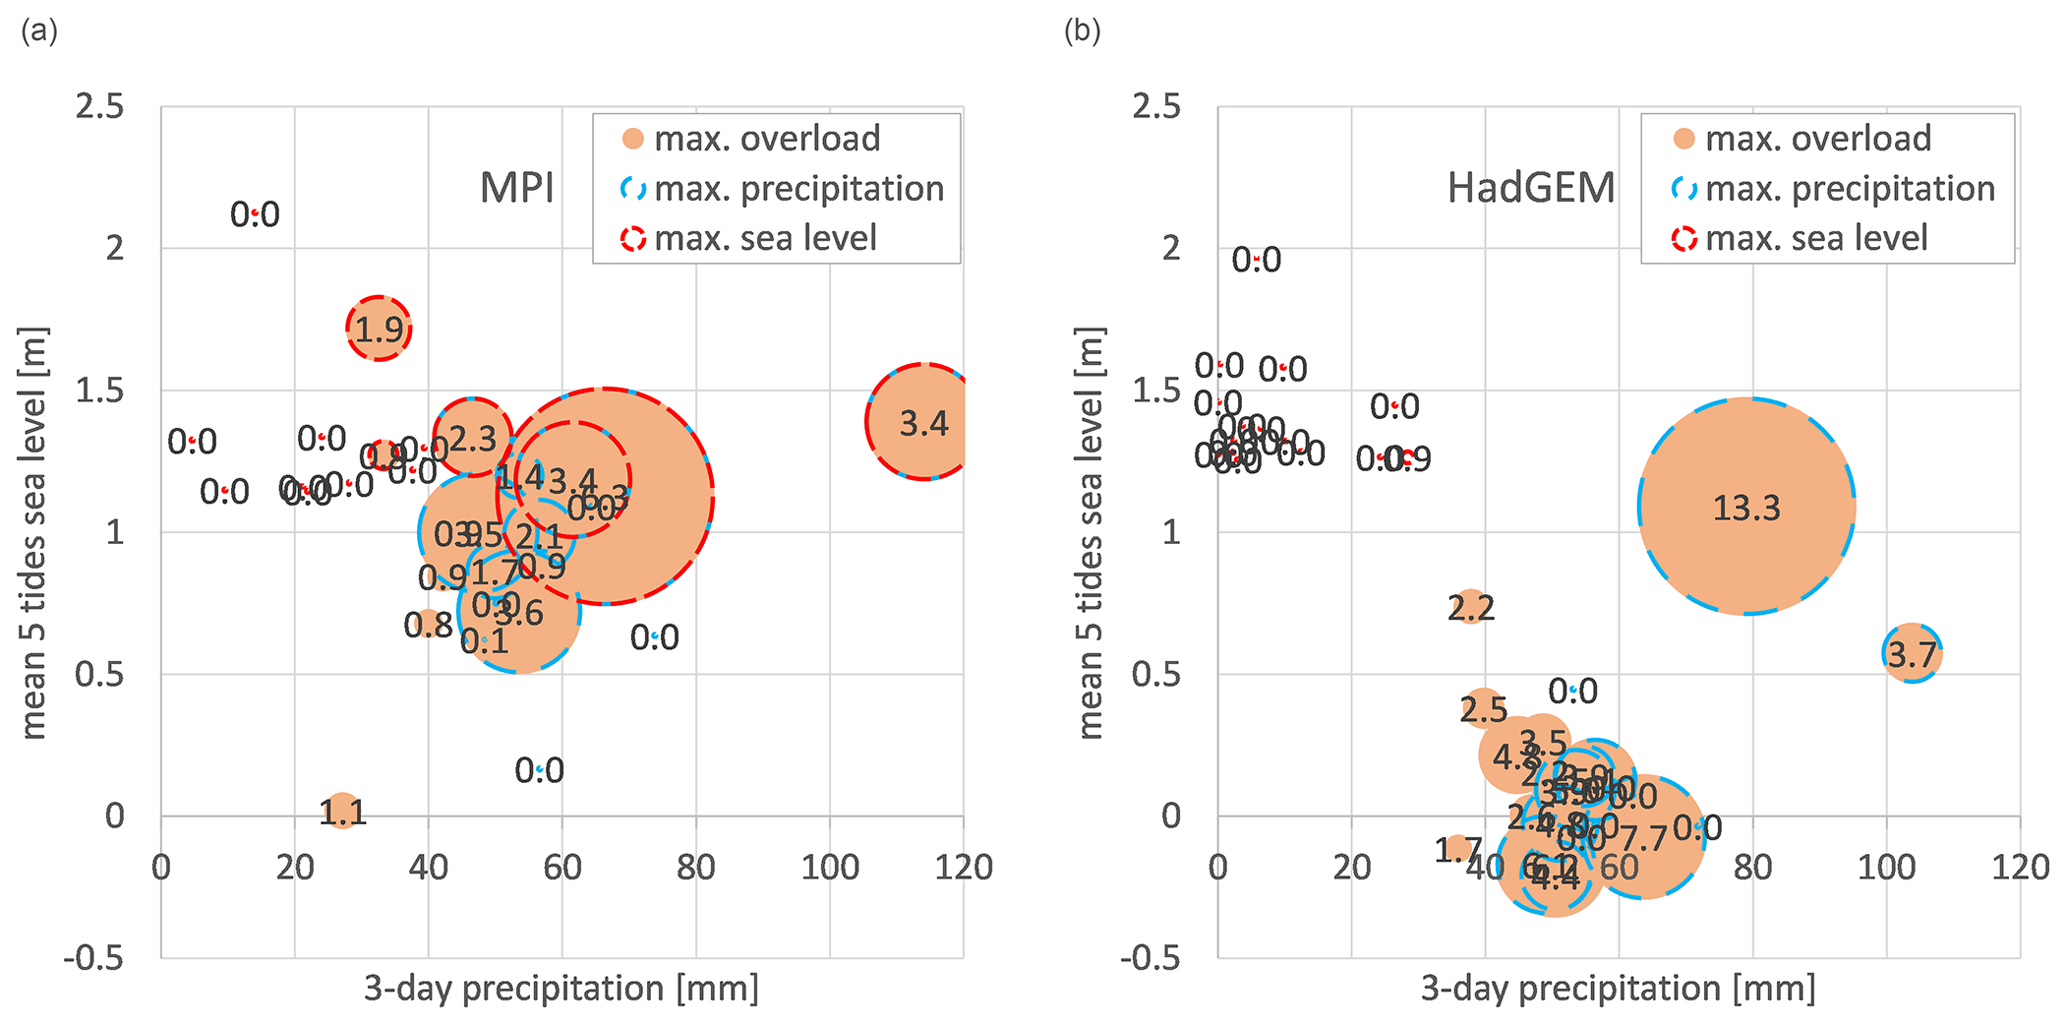
Figure 6As Fig. 5 but for the winter half-year (October to March) only (number in the circles and bubbles in millions of cubic metres).
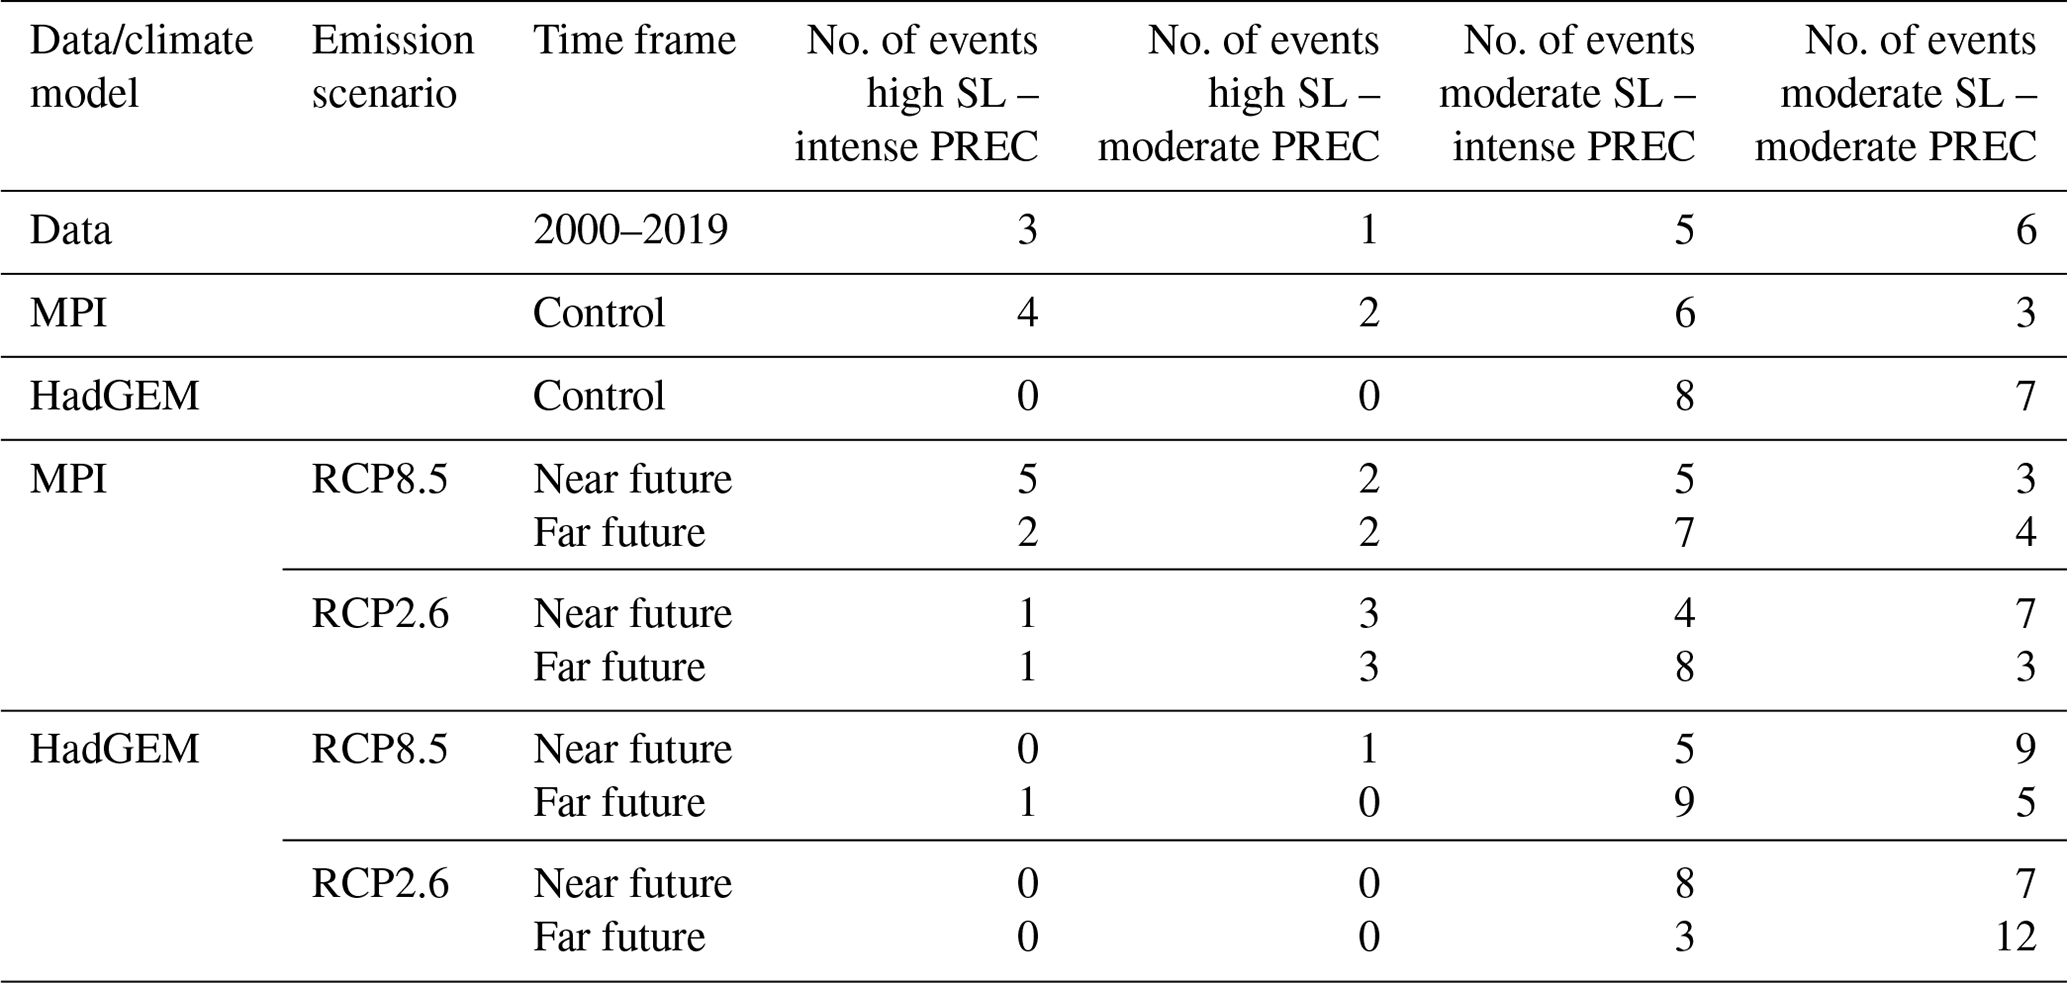
As expected, the winter subset resulted in considerably lower precipitation amounts but in a similar pattern of compound events. While four of the highest system overloads simulated by the MPI model co-occur with extreme and intense precipitation events and high storm tides (orange bubbles with red and blue circles), the system overloads simulated by the HadGEM model are mainly caused by intense precipitation (orange bubbles with blue circles; Fig. 6). None of the 15 highest storm tides out of HadGEM contributes to the 15 highest system overloads, and most of the system overloads are simulated for moderate sea levels, which are more than 0.5 m lower than for the MPI model. Analysing the timing of the events reveals that for MPI most of the 15 highest storm tides (11 out of 15) and precipitation events (13 out of 15) are simulated in late autumn. HadGEM also simulates most of the precipitation events in late autumn (11 out of 15), while the simulated storm tides are more equally distributed over the winter season (8 in late autumn and 7 in winter). Therefore, it is more likely for the MPI model that high storm tides and intense precipitation co-occur. With regard to the pattern of co-occurrence, MPI seems to be closer to the observations than HadGEM in terms of the number of events (see also Table 1).
Table 1Frequency of the co-occurrence of the individual drivers (storm tides and precipitation) related to their intensity, for the 15 largest events of drainage system overload. Sea level – SL; precipitation – PREC. For definitions of extreme, high or intense, and moderate events, see Sect. 2.3.
3.2.2 Impact of climate change on water balance terms
All climate scenarios applied in this study feature a temperature increase until the end of the 21st century. Regional warming is projected for all seasons, while the increase in temperature seems to be larger in winter than in summer. For East Frisia, the temperature rise projected by the HadGEM model exceeds that of the MPI model (Ley et al., 2023). Compared to temperature, the projected patterns in precipitation are much more variable, depending on the season, the emission scenario, the model, and the time period considered in the future. While both climate models and emission scenarios considered in this study project a more humid future on the annual scale, change signals are model and scenario specific on a seasonal scale (Fig. 7). Here, the HadGEM model projects a stronger increase in winter precipitation for the far future (end of the 21st century), which can be expected to be a major driver of future compound events.
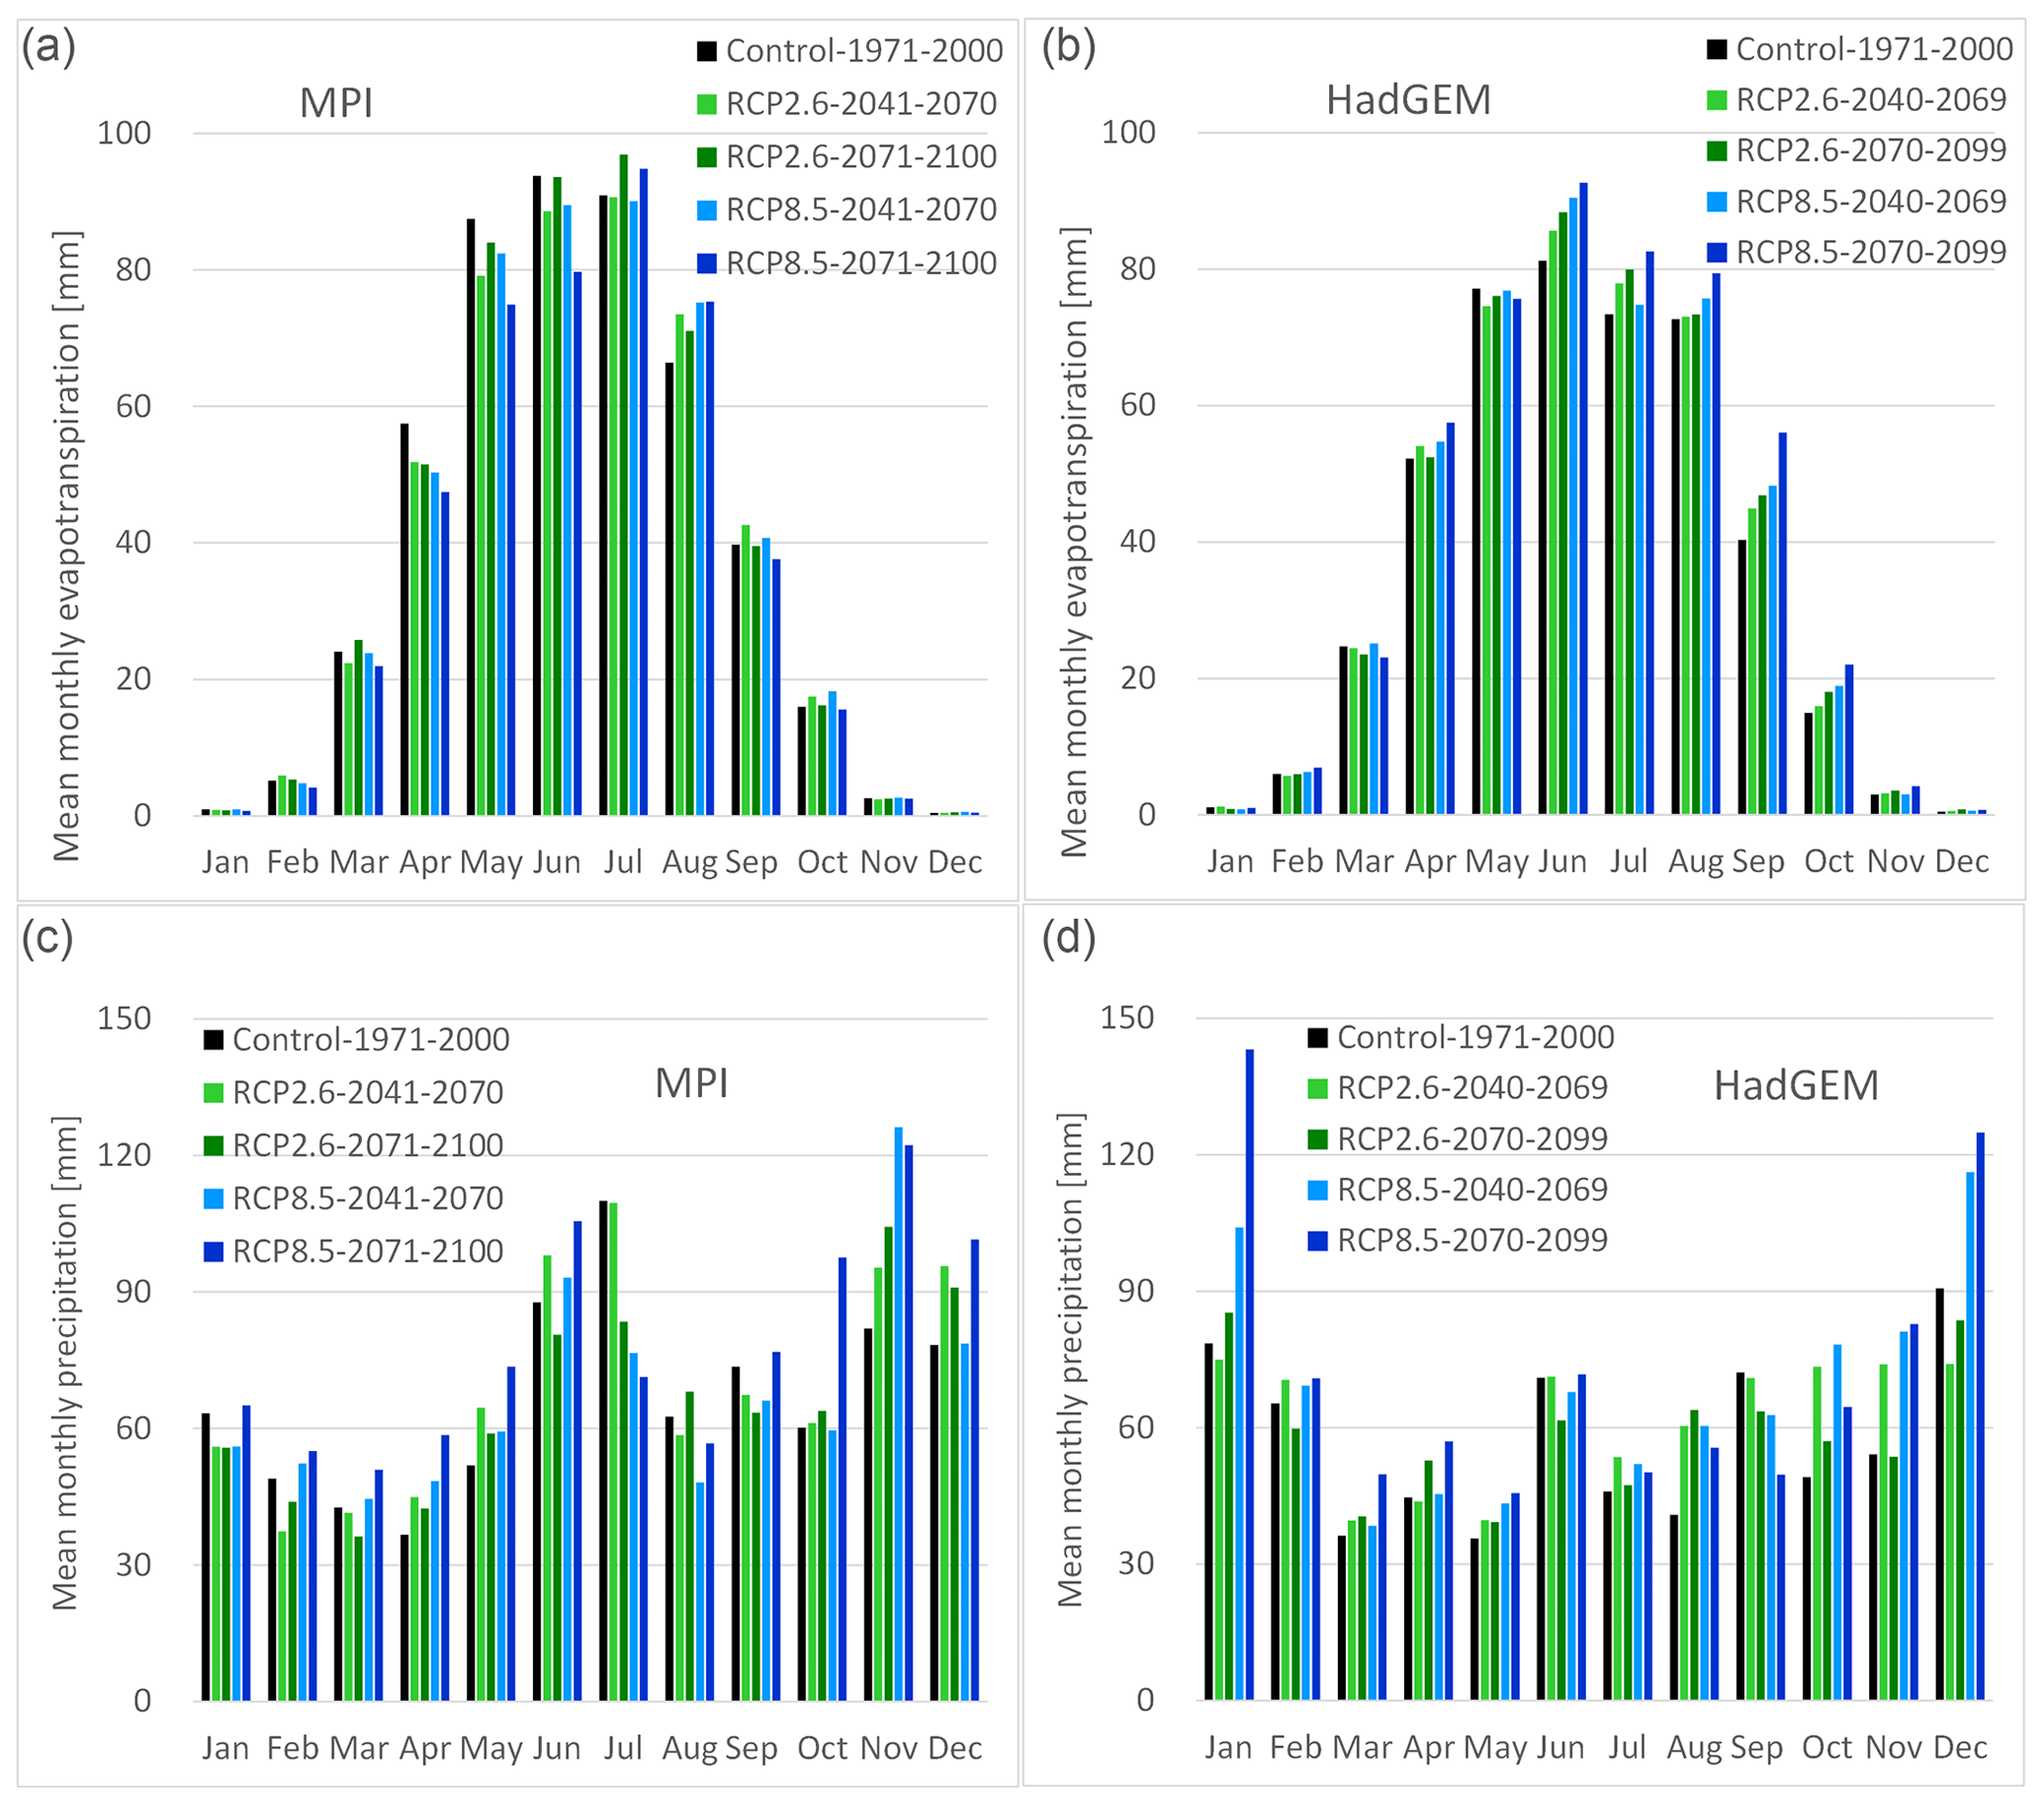
Figure 7Scenario- and model-specific values of mean monthly evapotranspiration (a, b) and mean monthly precipitation (c, d).
For the evapotranspiration calculated by the SIMULAT model, the projected changes also depend on the climate model and the scenario. While projections based on the HadGEM model show an increase for both scenarios and periods in summer and autumn, the signal is not that clear for the climate projections based on the MPI model (Fig. 7). The difference in the projected evapotranspiration can mainly be attributed to the differences in the temperature projections.
3.2.3 Impact of sea level rise on drainage capacity and frequency of system overload
The drainage capacity at tidal gauge Knock was calculated based on the simulations of the TRIM-NP model overlaid by long-term sea level rise derived from the regionalized projections of the IPCC (2021) for the German Bight (Fig. 8). Sea level extremes associated only with the storm events show strong inter-annual and inter-model variability with no significant trends in water level upper percentiles for the 21st century for any realization. Secular sea level rise is thus the main driver of substantial changes in high water levels for future scenarios. The magnitude of sea level changes is strongly dependent on the chosen pathway scenario (here RCP2.6 and RCP8.5) with a minor influence of the driving climate model (MPI or HadGEM).
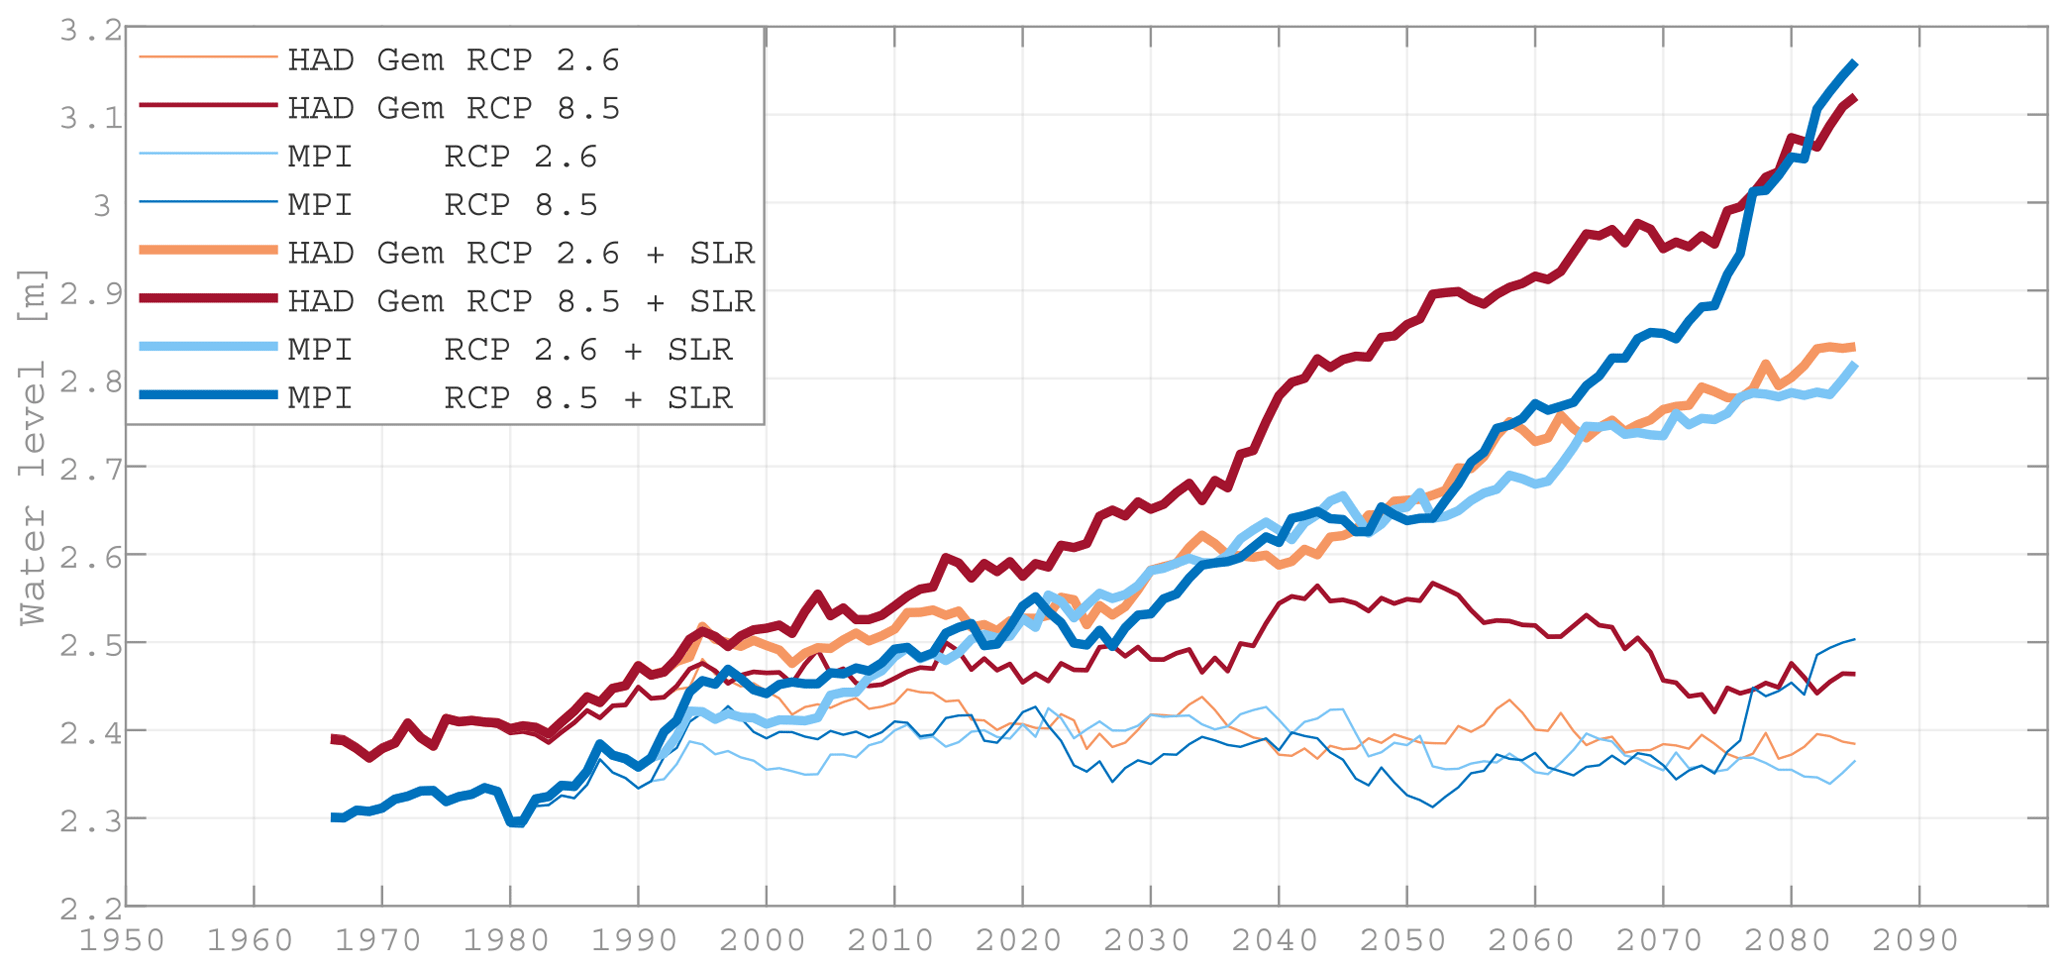
Figure 8The 30-year running mean of annual 99.9th percentiles of seawater level at gauge station Knock (in metres above NHN) for different projections with and without mean sea level rise (SLR), using 90 cm sea level rise for RCP8.5 and 50 cm sea level rise for RCP2.6 by the end of the 21st century.
In general, high water levels disable free drainage and reduce the pump capacity, which depends on the pressure head between the inland water level and sea level (Fig. 3). The climate projections show a long-term decrease in drainage capacity (Fig. 9), which is in agreement with the projected increase in sea level (Fig. 8). While the decrease for the control period is relatively weak (especially for the HadGEM model), it accelerates, in particular for the RCP8.5 scenario, in the second half of the 21st century, while the decrease in drainage capacity is weaker for the RCP2.6 scenario. Such a decrease can be expected to contribute to a future increase in drainage system overload even if precipitation extremes will not increase for the future.
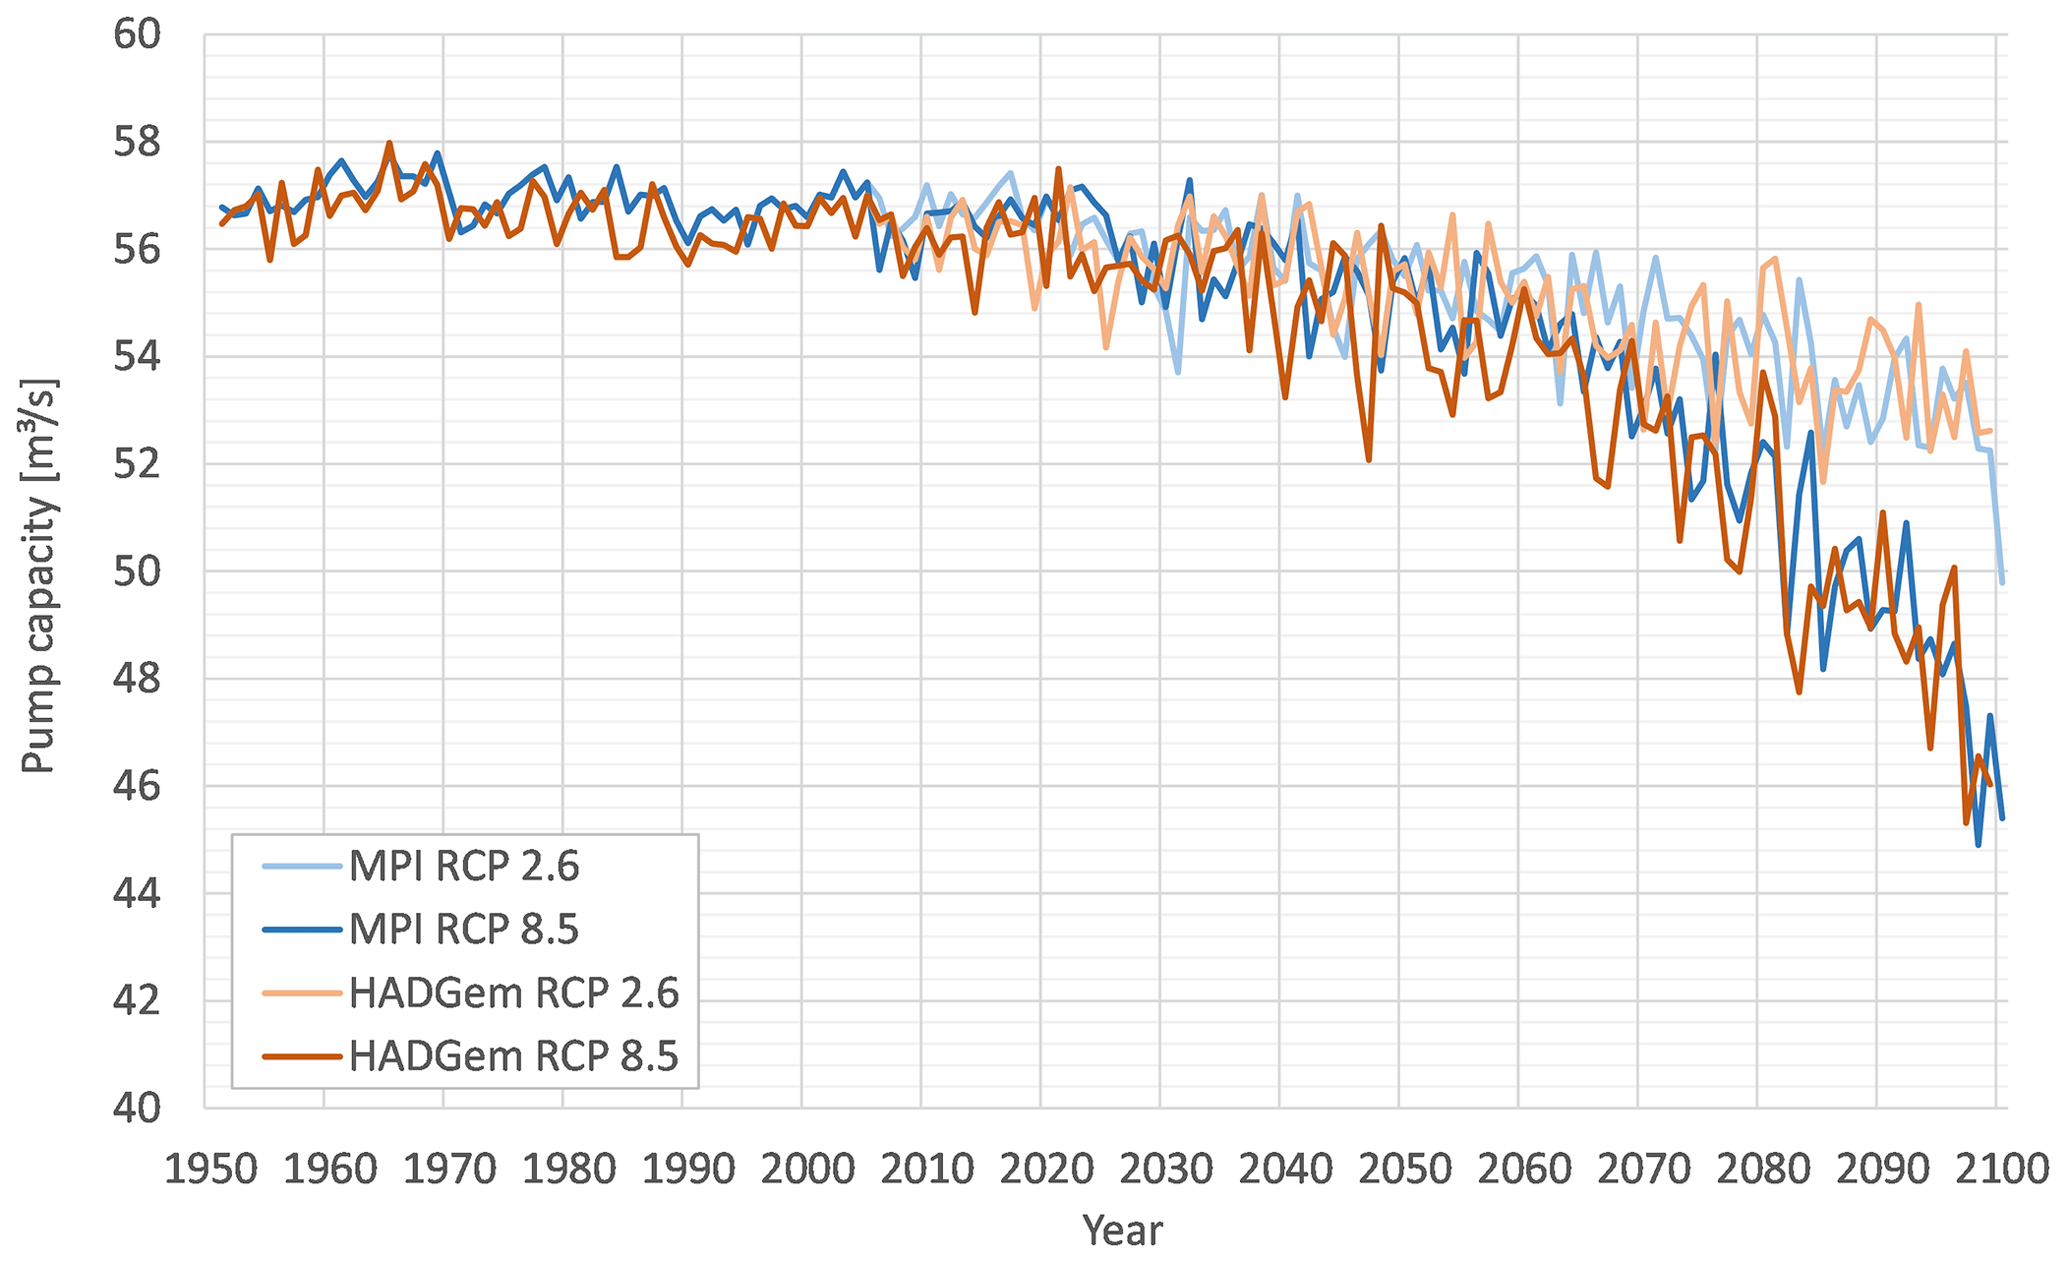
Figure 9Impact of sea level rise on the estimated annual pump capacity (m3 s−1) per pump at gauge station Knock.
As expected from the projected increase in winter precipitation and the decrease in drainage capacity, the projected number of days with drainage system overload increases for all investigated combinations of climate models, emission scenarios, and future periods. Compared to the control period, the increase is higher for the RCP8.5 scenario than for the RCP2.6 scenario and higher for the far future (end of the century) than for the near future. Generally, the number of days with system overload is higher in the simulations driven by the HadGEM model than those driven by the MPI model (Fig. 10). This can partially be attributed to the HadGEM model simulating more long-lasting rainfall events, resulting in a higher number of consecutive days with drainage system overload (compared to the MPI model), while the number of separate rainfall events causing system overload is similar to that of the MPI model.
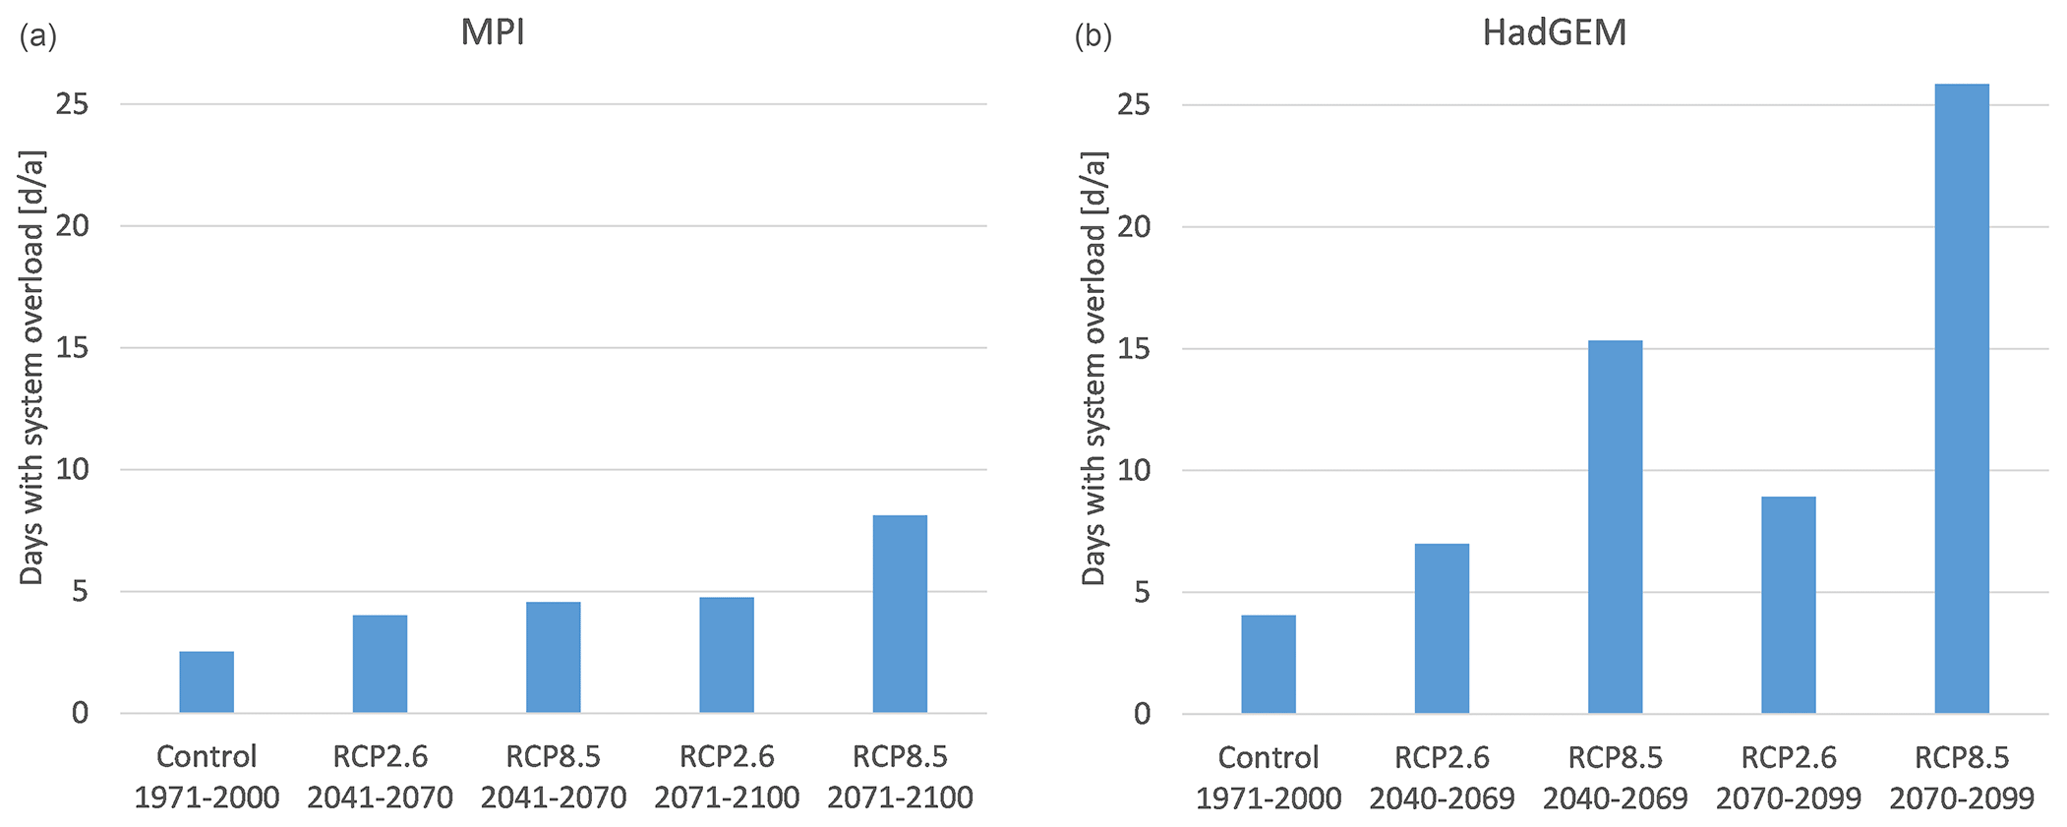
Figure 10Projected number of days with drainage system overload at station Knock obtained from the different models and scenarios for the middle and the end of the 21st century (MPI: a; HadGEM: b).
3.2.4 Analysis of scenario calculations on compound events
As for the control period, the 15 largest winter events (October to March) of drainage system overload, sea level, and precipitation were selected from the 30-year periods centred around the middle and the end of the 21st century. The pattern of contributing drivers was analysed for a small ensemble of two climate models (HadGEM, MPI), for two concentration pathways (RCP2.6, RCP8.5), and for two different periods (near future, far future).
The projections based on the HadGEM (Fig. 11) and MPI models (Fig. 12) indicate that for all combinations of scenarios and models and for both investigated periods, the highest system overloads are not generated by a combination of the extreme individual events (five-tide mean sea level, 3 d precipitation) but by compound events of moderate or intense precipitation and moderate or high coastal sea levels.
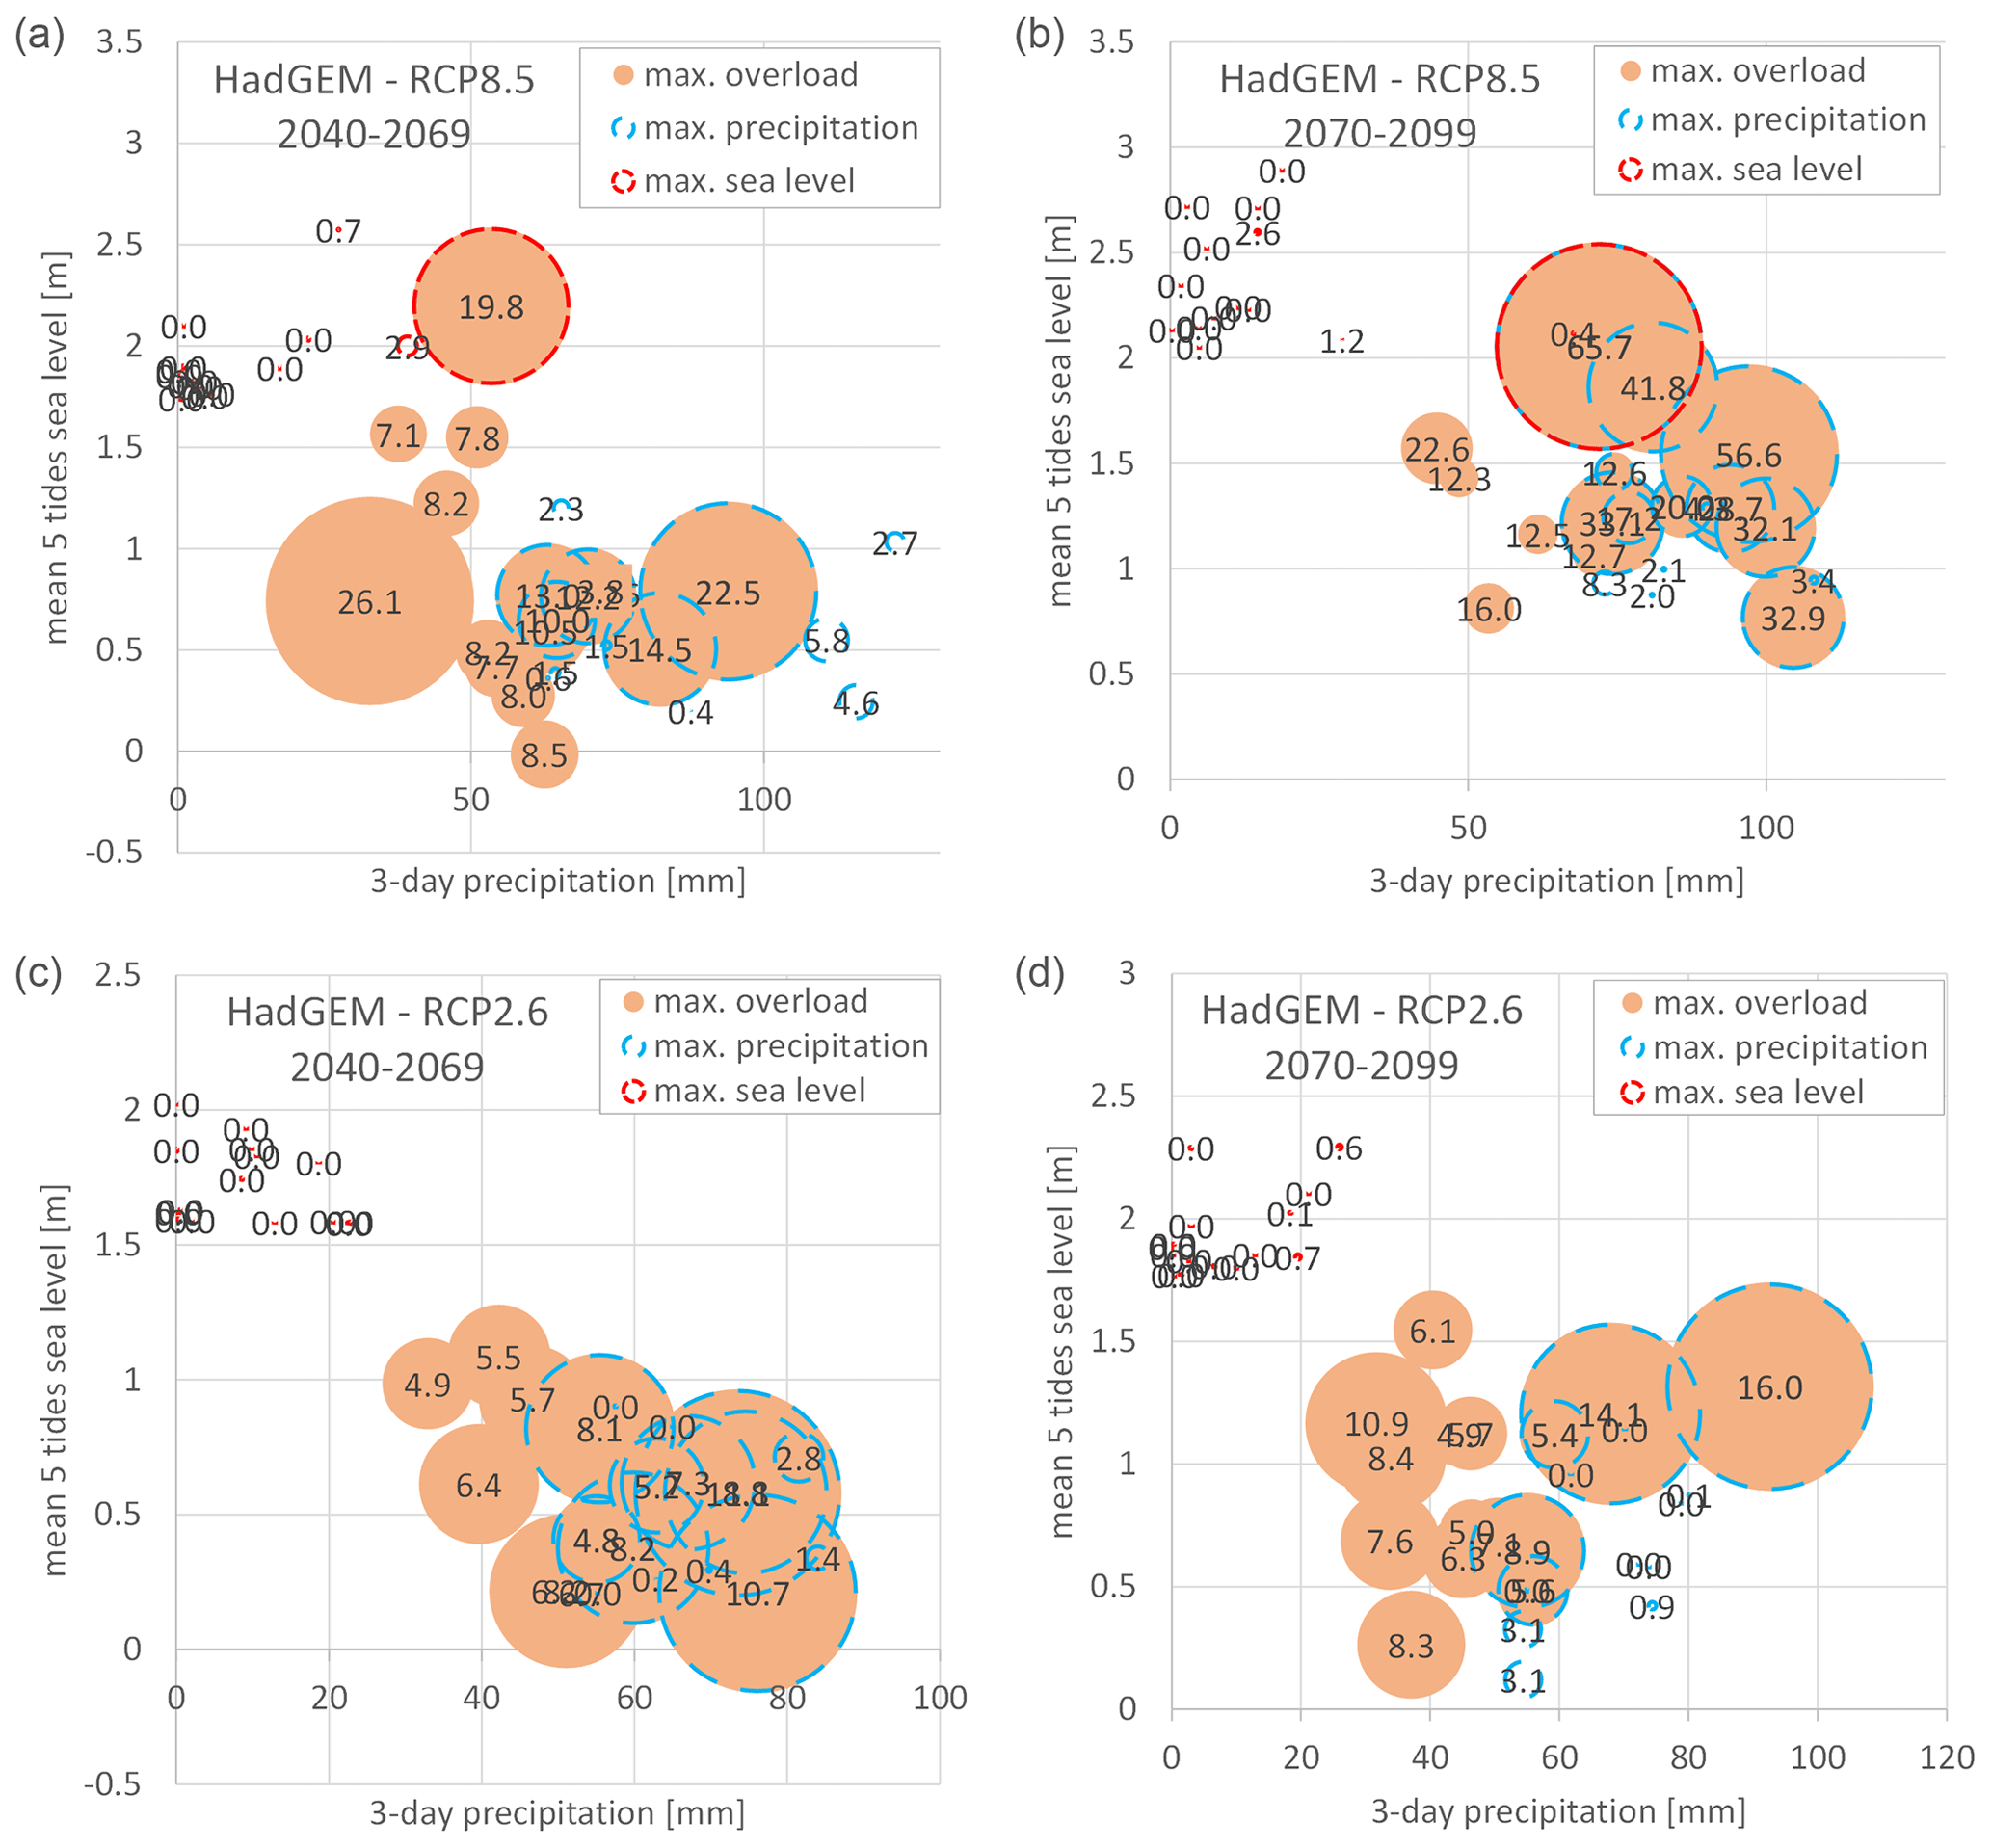
Figure 11Simulated drainage system overload (106 m3) for the 15 highest sea level (mean sea level over a five-tide period above NHN (m); red circles) and precipitation (antecedent 3 d precipitation sum (mm); blue circles) events in the winter half-year (October to March) in the periods of 2040–2069 (a, c) and 2070–2099 (b, d) for the RCP8.5 (a, b) and RCP2.6 (c, d) scenarios derived from the simulations driven by the HadGEM model data. Additionally, the 15 simulated drainage system overloads in the same period are shown (orange circles). The diameter of the circles is proportional to the magnitude of the modelled drainage system overload (number in the circles and bubbles in millions of cubic metres).
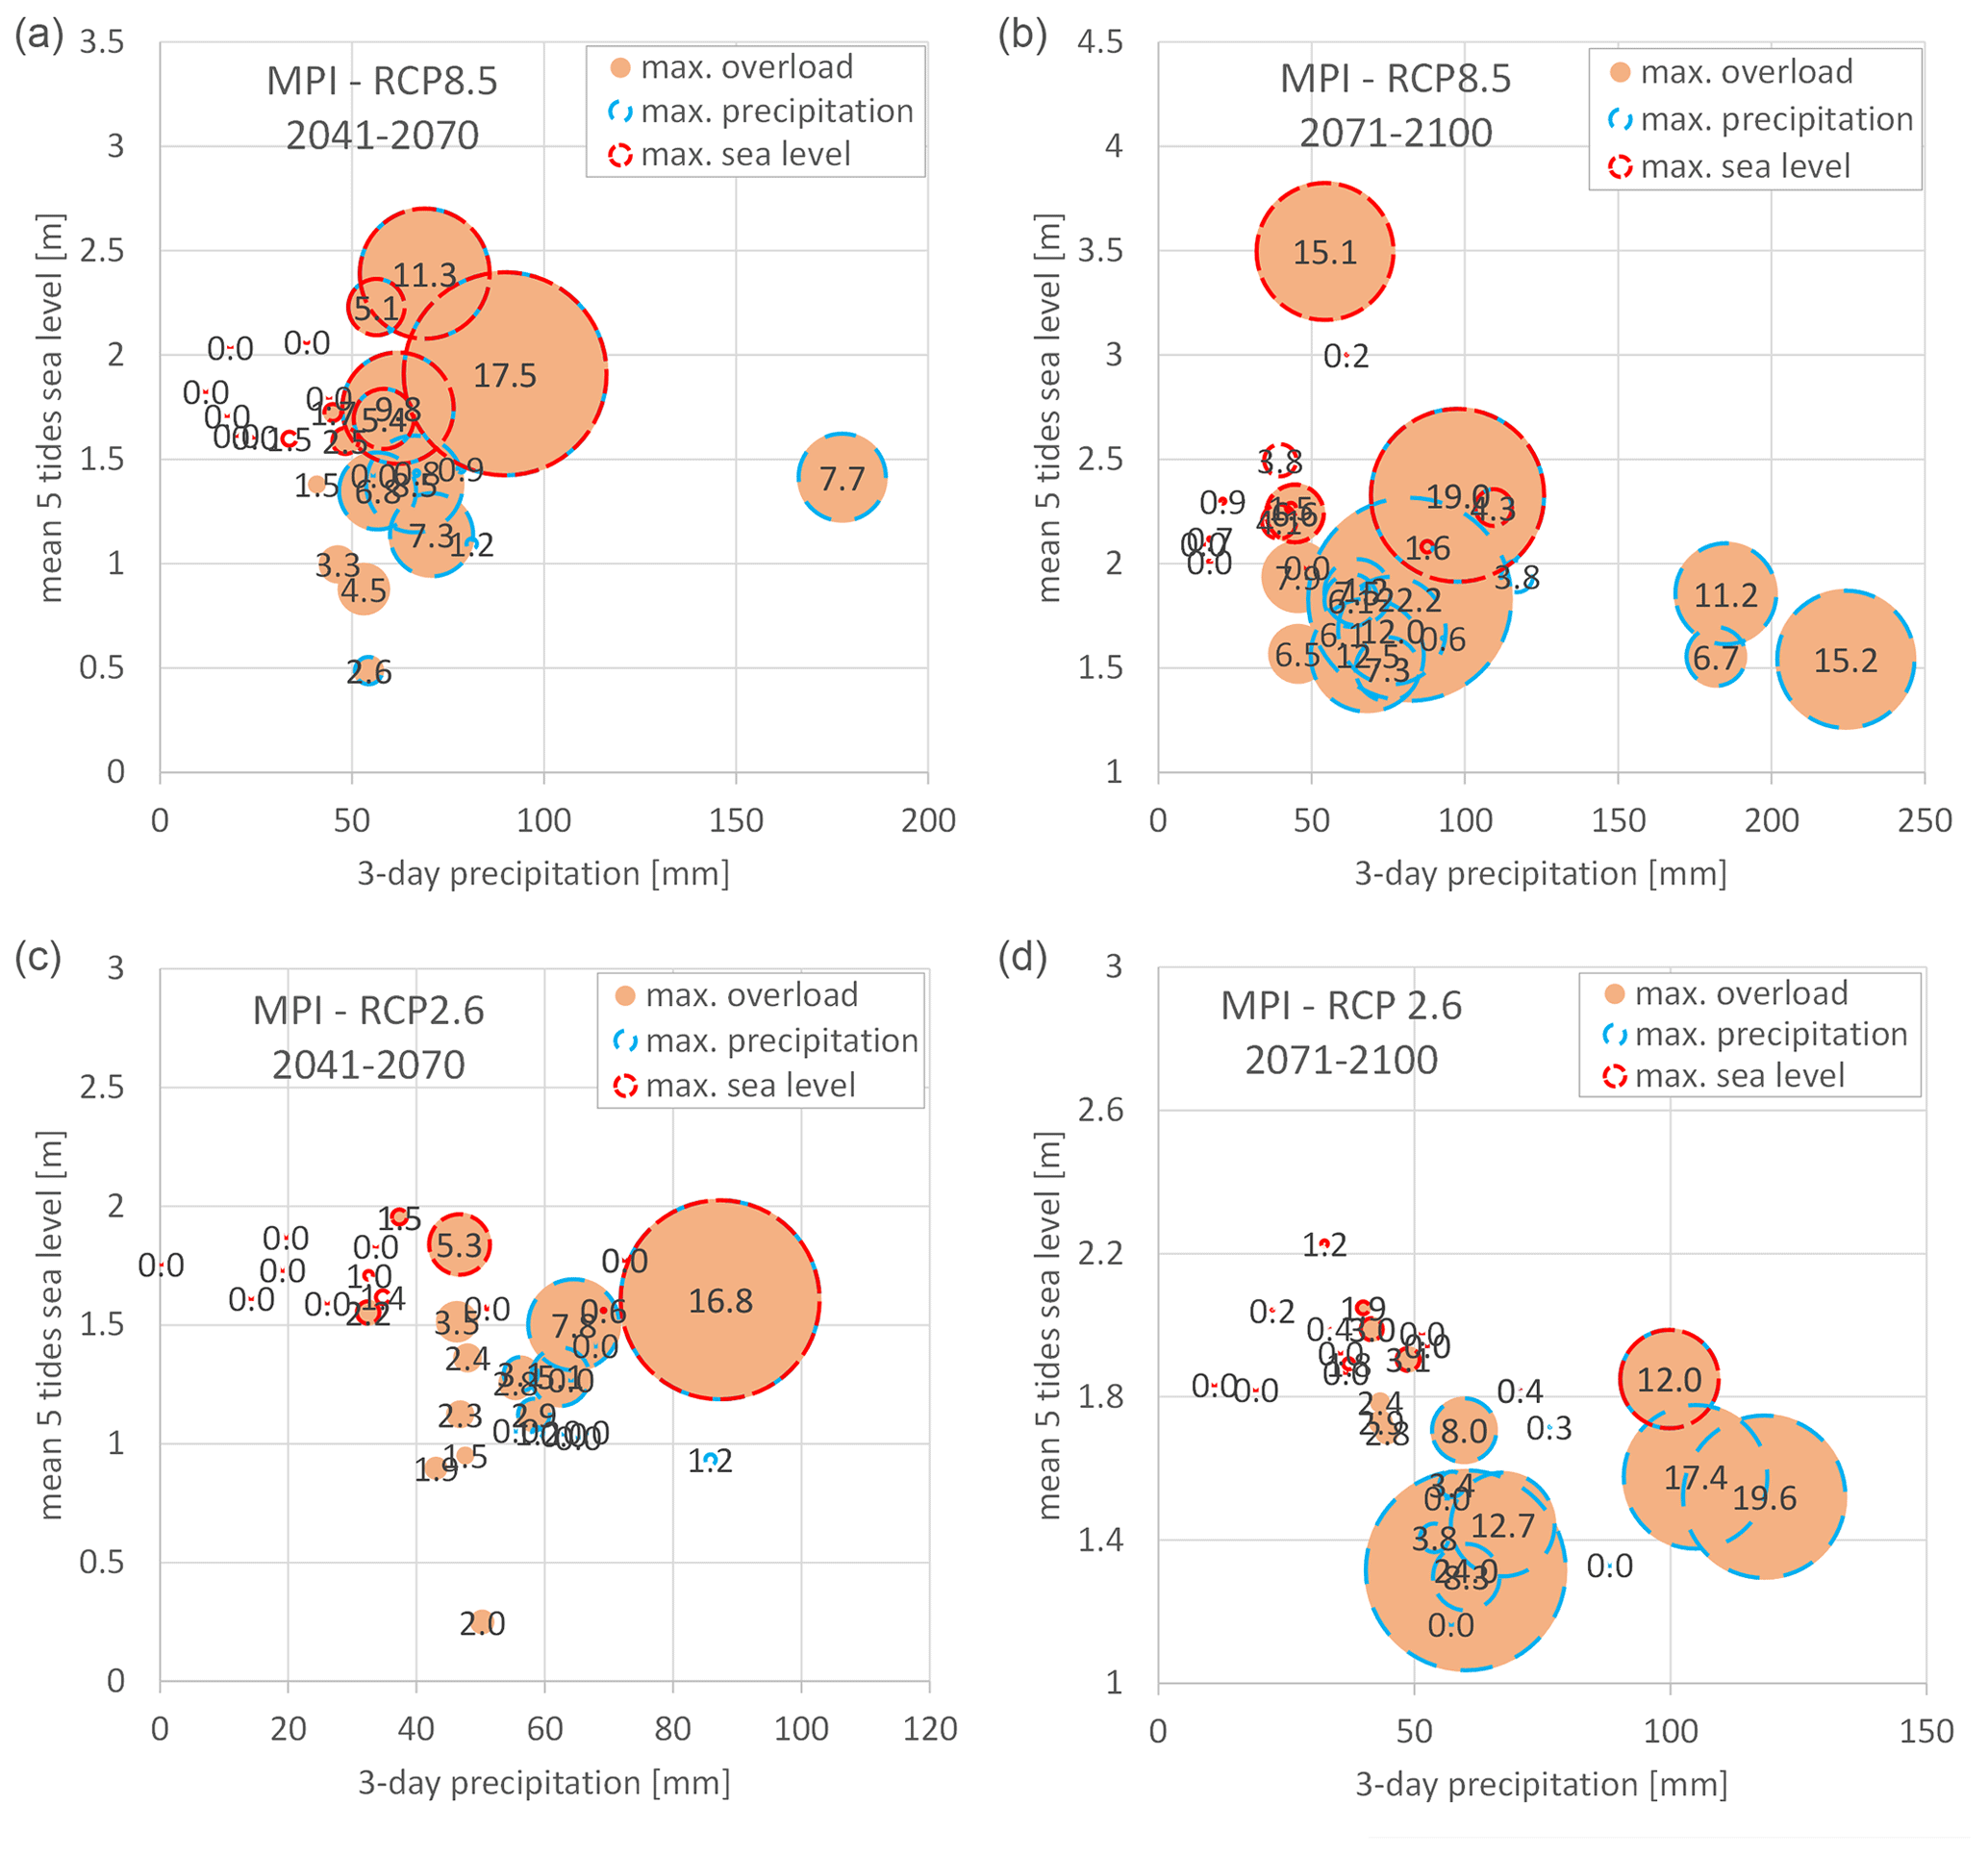
Figure 12As Fig. 10 but for the simulations driven by the MPI model. Note that periods for the analyses are shifted by 1 year compared to Fig. 10 because of the shorter duration of the HadGEM simulation (number in the circles and bubbles in millions of cubic metres).
By the end of the century and for all projections, the inland flood generation mechanisms are dominated by compounding events. The general pattern of contributing drivers and the compound events is similar for the simulations driven by both climate models (Figs. 11, 12), while the number of events attributed to the contributing drivers differs: moderate five-tide coastal sea levels in combination with intense precipitation generate the highest drainage system overloads. As for the control period, flood generation seems to be more sensitive to intense precipitation compared to high sea level during a storm tide. For the simulations based on both climate models, most of the high storm tides do not lead to any drainage system overload (only one event for HadGEM in the far future for RCP8.5), while most of the intense precipitation events do. Both models, but especially HadGEM, simulate several compound events due to a combination of moderate drivers, since simulated system overloads are almost only simulated for moderate storm tides (see also Table 1). The magnitude of the driving precipitation events and their timings also differ between the climate models (Figs. 11, 12). While the antecedent 3 d precipitation is higher (mainly generated by rainfall events in late autumn) for the MPI model, for the HadGEM model the antecedent 3 d precipitation is smaller (mainly generated by precipitation events in winter). In both climate models and scenarios there is a high inter-annual variability in storm activity. The seasonal distribution of storm surges is not expected to shift significantly towards the end of the century (Fig. 13). A shift in the timing of the events could result in a decreasing likelihood that storm tides and intense precipitation coincide.
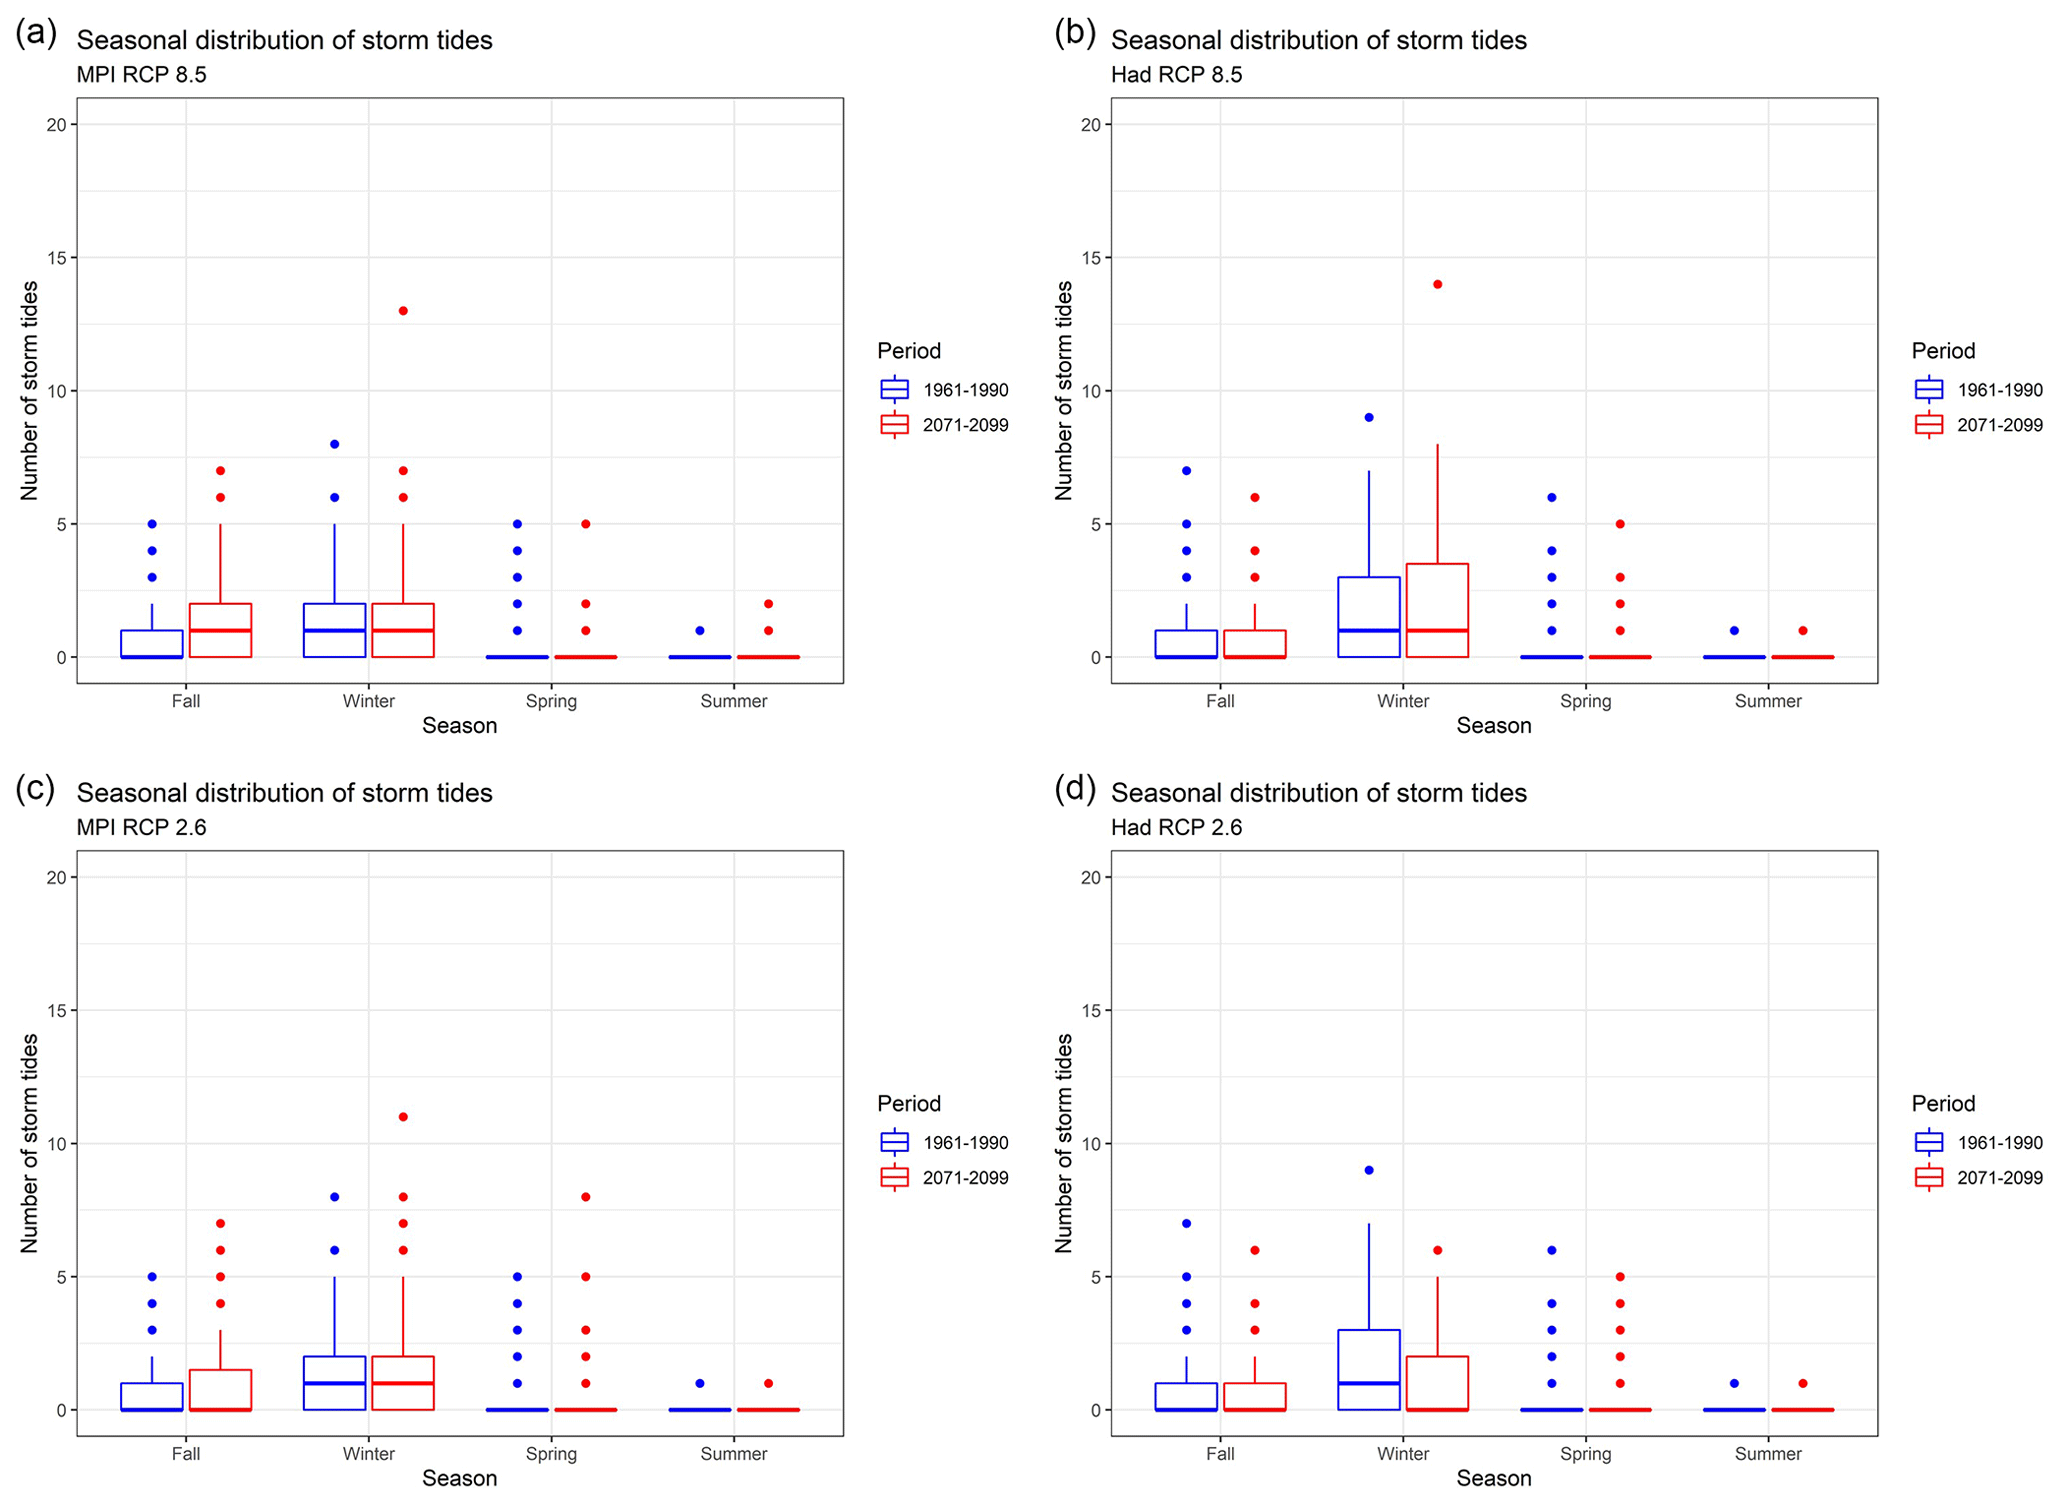
Figure 13Seasonal frequency distribution of storm tides in the analysed scenarios. RCP8.5 (a, b), RCP2.6 (c, d), MPI (a, c), and HadGEM (b, d).
As indicated by the development of contributing drivers, especially for the pessimistic RCP8.5, compound events probably become more intense and more frequent until the end of the 21st century. The magnitude of drainage system overload will become significantly larger with intensification of the single drivers (concerning the max system overload: by a factor of 5 for the HadGEM model and by a factor of 3.5 for the MPI model). Moderate events contributing to the compound events will also be more intense in the future. For RCP8.5, drainage system overload is expected to be significantly larger by the end of the century compared to the near future. Analysing the projections for the more optimistic RCP2.6 emission scenario, the results indicate that the generation mechanisms of compound events remain constant as well, while the magnitude of system overload does not increase from the near to the far future for both climate models. Drainage system overload within RCP2.6 simulations seems to be mainly caused by intense rainfall situations.
Similar to the observations and the control period, assuming a multivariate compound event does not entirely explain the pattern of the events, indicating that preconditions such as antecedent soil moisture could provide better insight.
Analysis of historical data revealed that compound events of moderate storm tides and intense rainfall caused inland coastal flooding due to an overload of the drainage system of the Emden water board rather than individual drivers. This is in agreement with observations and analyses from the Dutch coast (van Hurk et al., 2015), China (Xu et al., 2023), and the UK (Svensson and Jones, 2002), although compound events of storm tides and high river discharge are not observed more frequently in the Ems Estuary than are expected by chance (Heinrich et al., 2023a). Since all these sites are located at shallow coasts with tidal influence and more or less face the main wind direction, we assume that the findings are spatially transferable to coasts with similar characteristics.
Heinrich et al. (2023a) found that only rivers along the westward-facing coasts of Europe experienced an increased probability of simultaneous storm tides and high river discharges. For the area of coastal water boards, the exposition of the coastline seems to be of minor importance as long as the coast is exposed to the west or northwest, since the location of water board areas is usually close to the dike (close to the North Sea) compared to the headwaters of the rivers flowing into the North Sea. Therefore, we assume that the findings of our study are transferable to large parts of the Dutch, German, and Danish low-lying North Sea coasts. Based on a comprehensive ensemble study, Heinrich et al. (2024) showed that in all climate models and scenarios, an increased frequency of atmospheric cyclonic westerlies in winter is to be expected by 2100. An increasing flood risk can be assumed for westerly estuaries but not for northward estuaries like the Ems River. Heinrich et al. (2023b) further showed that in future scenarios compound events will increase mainly because of rising mean sea level, which will further increase the risk and occurrence of events. For water boards located upstream in an estuary, high river discharges will become more relevant. Even if Heinrich et al. (2023a) did not reveal an increased probability of a coincidence of storm tides and high river discharges, such events nevertheless may induce increased water levels in the river.
Individual projections on the impact of climate change on winter precipitation (Fig. 7), runoff generation (Bormann and Kebschull, 2023), and sea level rise (IPCC, 2021) suggested that drainage of coastal regions might become a greater challenge for the future (see also Spiekermann et al., 2023). The question arose whether compound events, as observed in the past, can be assumed to cause the largest system overloads (inland flood events) in the future as well or whether the importance of contributing drivers might change. The simulation results of the modelling experiment emphasize that the generation mechanisms and the resulting patterns of current inland flooding at the German North Sea coast can be simulated at the water board scale by the model set-up applied in this study. This is essential for the predictability of future compound events under climate change conditions, needed for the adaptation to long-term climate change impacts. The model projections indicate that the flood generation mechanisms remain stable for future time periods under climate change conditions. The results based on the small ensemble also suggest that, in accordance with Seneviratne (2012), compound events of moderate individual drivers will be an important source of inland flood risk until the end of the 21st century. The simulation results based on both climate models are consistent with respect to runoff generation mechanisms despite model-specific differences in the projections (e.g. precipitation projections, Fig. 7; contribution of high storm tides, Figs. 11, 12), indicating that such behaviour might also be confirmed by larger model ensembles. However, this needs to be confirmed by future studies as soon as larger climate ensembles are available at high temporal resolution.
The magnitude of drainage system overloads is expected to increase significantly for the RCP8.5 scenario by the end of the century, while the intensity of system overloads seems to remain constant for the projections based on the more optimistic RCP2.6. This is in accordance with other climate change impact studies on hydrological systems in Germany (Brasseur et al., 2023). The intensity of precipitation events seems to be the more important driver compared to the average sea level during one or a series of storm tides. Nevertheless, as long as rainfall amounts and intensities do not exceed those represented by the climate projections, moderate rainfall alone – without any restriction on drainage capacity – is not expected to lead to large flooding in shallow coastal inland regions along the North Sea coast until the end of the 21st century.
The projections emphasize that climate change adaptation will also be required for all scenarios considered. In accordance with Cioffi et al. (2018), existing drainage infrastructure will not be sufficient to cope with the consequences of climate change, even for more optimistic emission scenarios (RCP2.6). As shown by this study, adaptation thereby does not only need to consider the individual impacts of sea level rise (Bormann et al., 2023; NLWKN, 2007) and runoff generation (Bormann and Kebschull, 2023) but explicitly the potential impacts of compound events because the highest drainage system overload must be expected by such a type of combined events.
Despite the representation of past events, the study has some uncertainties. First, the ensemble of climate models and climate change scenarios is small. It remains possible that combinations of other climate models and emission scenarios would lead to a different climate change signal. We already recognized that the projections and process representations of the MPI and HadGEM models differ. This needs to be reviewed using a larger ensemble as soon as more long-term climate model simulations are available that provide forcing data for the impact models at least at an hourly resolution. Second, the storage-based representation of the water spatially distributed in the water board area neglects internal flow processes. Better data on such internal flow processes and state variables could reduce this uncertainty. Nevertheless, as long as the management of the anthropogenic drainage system does not follow clear and systematic rules and is influenced by unknown or even erratic individual decisions, a process-based simulation of the drainage system will probably fail. Third, while a bias correction of the climate scenario simulations was required for precipitation and temperature (input for SIMULAT), no bias correction was carried out for the wind speed (input for TRIM-NP). This might cause some inconsistency concerning the driving forces of this study, which could be quantified by model intercomparison with vs. without systematic bias correction. Finally, the observed and simulated data show that a combination of intense individual events (one or more storm tides and rainfall events) does not necessarily cause the largest system overloads in the simulations. There are probably other influencing factors (such as high soil saturation of the water board area, e.g. caused by a longer rainfall memory) that have not yet been considered by the approach presented above. Thus, assuming a multivariate compound event based on storm tides and intense rainfall does not entirely explain the pattern of the events, additional modelling studies could reveal its impact, since usually soil moisture observations are not available. Concerning the typology of compound events, we agree with Zscheischler et al. (2020) that “the complex nature of compound events results in some cases inevitably fitting into more than one class, necessitating soft boundaries within the typology”. For flood generation at shallow coasts, we suggest explicitly considering combinations of the defined types (e.g. multivariate and preconditioned events) to represent the complex regional flood generation process.
The results of this study indicate that the highest overload of coastal drainage systems currently is and in the future will be caused by compound events of moderate to intense storm tides and intense rainfall. While intense rainfall, in particular, poses a big challenge to coastal drainage systems, the simultaneous occurrence of storm tides and rainfall will pose major problems for the defence systems. Therefore, the dimensioning of coastal and flood protection measures as well as the related risk management must explicitly take such events into account to avoid flood events and resulting damages.
However, such a type of compound event is explicitly considered neither in current risk management nor in long-term planning of climate change adaptation in Germany. Therefore, there is a need for rethinking the question of what kind of events and hazards a society needs to adapt to. While this study emphasizes that compound events need to be considered for adaptation planning and risk management, for a quantitative assessment larger climate model ensembles at high temporal resolution need to be considered in future studies.
The data used in this paper are available from the authors upon request.
The conceptualization of the study was carried out by HB and RW. The simulations were performed by JK and LG. The evaluation of observations and simulations was carried out by HB. All authors contributed to the preparation and revision of the paper.
The contact author has declared that none of the authors has any competing interests.
Publisher’s note: Copernicus Publications remains neutral with regard to jurisdictional claims made in the text, published maps, institutional affiliations, or any other geographical representation in this paper. While Copernicus Publications makes every effort to include appropriate place names, the final responsibility lies with the authors.
This investigation was funded by the German Federal Ministry of Education and Research (Bundesministerium für Bildung und Forschung, BMBF) as a part of the WAKOS – Wasser an den Küsten Ostfrieslands project (RegIKlim programme).
This investigation was funded by the German Federal Ministry of Education and Research (BMBF) (grant numbers 01LR2003D, 01LR2003D1, 01LR2003A, and 01LR2003A1) (submitted version).
This paper was edited by Philip Ward and reviewed by Wiebke Jäger and two anonymous referees.
Ahlhorn, F., Spiekermann, J., Schaal, P., Bormann, H., and Kebschull, J.: Akteursbeteiligung bei der Anpassung des Entwässerungsmanagements im norddeutschen Küstenraum, Wasser und Abfall, 20, 28–35, https://doi.org/10.1007/978-3-658-42657-6_20, 2018.
Behre, K. E.: Landscape Development and Occupation History Along the Southern North Sea Coast, in: Wefer, G., Berger, W.H., Behre, K.E., Jansen, E. (eds): Climate Development and History of the North Atlantic Realm, Springer, Berlin, Heidelberg, https://doi.org/10.1007/978-3-662-04965-5_18, 2002.
Bevacqua, E., Maraun, D., Vousdoukas, M.I., Voukouvalas, E., Vrac, M., Mentaschi, L., and Widmann, M.: Higher probability of compound flooding from precipitation and storm surge in Europe under anthropogenic climate change, Science Advances, 5, eaaw5531, https://doi.org/10.1126/sciadv.aaw5531, 2019.
Bevacqua, E., Vousdoukas, M. I., Zappa, G., Hodges, K., Shepherd, T. G., Maraun, D., Mentaschi, L., and Feyen, L.: More meteorological events that drive compound coastal flooding are projected under climate change. Commun. Earth Environ., 1, 1–11, https://doi.org/10.1038/s43247-020-00044-z, 2020.
Bormann, H.: Sensitivity of a regionally applied soil vegetation atmosphere transfer scheme to input data resolution and data classification, J. Hydrol., 351, 154–169, https://doi.org/10.1016/j.jhydrol.2007.12.011, 2008.
Bormann, H. and Kebschull, J.: Model based estimation of climate change impacts on the drainage demand of low lying coastal areas in Northwest Germany along the North Sea, J. Hydrol. Regional Studies, 48, 101451, https://doi.org/10.1016/j.ejrh.2023.101451, 2023.
Bormann, H., Kebschull, J., Ahlhorn, F., Spiekermann, J., and Schaal, P.: Modellbasierte Szenarioanalyse zur Anpassung des Entwässerungsmanagements im nordwestdeutschen Küstenraum, Wasser und Abfall, 20, 60–66, https://doi.org/10.1007/s35152-018-0083-7, 2018.
Bormann, H., Kebschull, J., and Ahlhorn, F.: Challenges of Flood Risk Management at the German Coast, in: Water Resources Quality and Management in Baltic Sea Countries, edited by: Negm, A. M., Zelenakova, M., and Kubiak-Wojcocka, K., Springer Water, 141–155, https://doi.org/10.1007/978-3-030-39701-2_8, 2020.
Bormann, H., Kebschull, J., and Spiekermann, J.: Quantifizierung der Auswirkungen des Meeresspiegelanstiegs auf die Entwässerungskapazitäten an der Nordseeküste, Wasser und Abfall, 25, 24–31, https://doi.org/10.1007/s35152-023-1457-z, 2023.
Brasseur, G. P., Jacob, D., and Schuck-Zöller, S.: Klimawandel in Deutschland. Springer Spektrum, Berlin, Heidelberg, Germany, 2nd edition, 539 pp., https://doi.org/10.1007/978-3-662-66696-8, 2023.
Bronstert, A., Bormann, H., Bürger, G., Haberlandt, U., Hattermann, F., Heistermann, M., Huang, S., Kolokotronis, V., Kundzewicz, Z. W., Menzel, L., Meon, G., Merz, B, Meuser, A., Paton, E. V., and Petrow, T.: Hochwasser und Sturzfluten an Flüssen in Deutschland, in: Klimawandel in Deutschland, edited by: Brasseur, G. P., Jacob, D., and Schuck-Zöller, S., 2nd edition, Springer, https://doi.org/10.1007/978-3-662-66696-8_10, 2023.
Casulli, V. and Stelling, G. S.: Numerical simulation of 3D quasi-hydrostatic, free-surface flows, J. Hydraul. Eng., 124, 678–686, https://doi.org/10.1061/(ASCE)0733-9429(1998)124:7(678), 1998.
Cioffi, F., De Bonis Trapella, A., and Conticello, F.R.: Efficiency Assessment of Existing Pumping/Hydraulic Network Systems to Mitigate Flooding in Low-Lying Coastal Regions under Different Scenarios of Sea Level Rise: The Mazzocchio Area Study Case, Water, 10, 820, https://doi.org/10.3390/w10070820, 2018.
Diekkrüger, B. and Arning, M.: Simulation of water fluxes using different methods for estimating soil parameters, Ecol. Model., 81, 83–95, https://doi.org/10.1016/0304-3800(94)00162-B, 1995.
Feddes, R. A., Kowalik, P. J., and Zaradny, H.: Simulation of field water use and crop yield. Simulations Monograph. Pudoc, Wageningen, https://edepot.wur.nl/172222 (last access: 23 July 2024), 1978.
Fox-Kemper, B., Hewitt, H. T., Xiao, C., Aðalgeirsdóttir, G., Drijfhout, S. S., Edwards, T. L., Golledge, N. R., Hemer, M., Kopp, R. E., Krinner, G., Mix, A., Notz, D., Nowicki, S., Nurhati, I. S., Ruiz, L., Sallée, J.-B., Slangen, A. B. A. and Yu, Y.: Ocean, Cryosphere and Sea Level Change. In Climate Change 2021: The Physical Science Basis. Contribution of Working Group I to the Sixth Assessment Report of the Intergovernmental Panel on Climate Change, edited by: Masson-Delmotte, V., Zhai, P., Pirani, A., Connors, S. L., Péan, C., Berger, S., Caud, N., Chen, Y., Goldfarb, L., Gomis, M. I., Huang, M., Leitzell, K., Lonnoy, E., Matthews, J. B. R., Maycock, T. K., Waterfield, T., Yelekçi, O., Yu, R., and Zhou B., Cambridge University Press, Cambridge, United Kingdom and New York, NY, USA, 1211–1362, https://doi.org/10.1017/9781009157896.011, 2021.
Garner, G. G., Hermans, T., Kopp, R. E., Slangen, A. B. A., Edwards, T. L., Levermann, A., Nowicki, S., Palmer, M. D., Smith, C., Fox-Kemper, B., Hewitt, H. T., Xiao, C., Aðalgeirsdóttir, G., Drijfhout, S. S., Golledge, N. R., Hemer, M., Krinner, G., Mix, A., Notz, D., Nurhati, I. S., Ruiz, L., Sallée, J.-B., Yu, Y., Hua, L., Palmer, T., and Pearson, B.: IPCC AR6 Sea-Level Rise Projections. Version 20210809, https://podaac.jpl.nasa.gov/announcements/2021-08-09-Sea-level-projections-from-the-IPCC-6th-Assessment-Report (last access: 5 January 2024), 2021.
Gaslikova, L.: coastDat TRIM-NP-2d CMIP5 hydrodynamic transient scenarios for the North Sea and the Northeast Atlantic for the period 1950–2100 with REMO MPI-ESM and HadGEM2 forcing, World Data Center for Climate (WDCC) at DKRZ [data set], https://doi.org/10.26050/WDCC/cD_C5_sc, 2023.
Gaslikova L., Grabemann, I., and Groll, N.: Changes in North Sea storm surge conditions for four transient future climate realizations, Nat. Hazard, 66, 1501–1518, https://doi.org/10.1007/s11069-012-0279-1, 2013.
Giorgetta, M. A., Jungclaus, J., Reick, C. H., Legutke, S., Bader, J., Böttinger, M., et al.: Climate and carbon cycle changes from 1850 to 2100 in mpi-esm simulations for the coupled model intercomparison project phase 5, J. Adv. Model. Earth Sy., 5, 572–597, https://doi.org/10.1002/jame.20038, 2013.
Heinrich, P., Hagemann, S., Weisse, R., Schrum, C., Daewel, U., and Gaslikova, L.: Compound flood events: analysing the joint occurrence of extreme river discharge events and storm surges in northern and central Europe, Nat. Hazards Earth Syst. Sci., 23, 1967–1985, https://doi.org/10.5194/nhess-23-1967-2023, 2023a.
Heinrich, P., Hagemann, S., Weisse, R., and Gaslikova, L.: Changes in compound flood event frequency in northern and central Europe under climate change, Frontiers in Climate, 5, 1227613, https://doi.org/10.3389/fclim.2023.1227613, 2023b.
Heinrich, P., Hagemann, S., and Weisse, R.: Automated Classification of Atmospheric Circulation Types for Compound Flood Risk Assessment: CMIP6 Model Analysis Utilising a Deep Learning Ensemble, Preprint, under review at Theoretical and Applied Climatology, https://doi.org/10.21203/rs.3.rs-4017900/v1, 2024.
IPCC: Managing the Risks of Extreme Events and Disasters to Advance Climate Change Adaptation. A Special Report of Working Groups I and II of the Intergovernmental Panel on Climate Change, edited by: Field, C. B., Barros, V., Stocker, T. F., Qin, D., Dokken, D. J., Ebi, K. L., Mastrandrea, M. D., Mach, K. J., Plattner, G.-K., Allen, S. K., Tignor, M., and Midgley, P. M., Cambridge University Press, Cambridge, UK, and New York, NY, USA, 582 pp., https://www.ipcc.ch/site/assets/uploads/2018/03/SREX_Full_Report-1.pdf (last access: 5 January 2024), 2012.
IPCC: Climate Change 2021. The Physical Science Basis. Contribution of Working Group I to the Sixth Assessment Report of the Intergovernmental Panel on Climate Change, edited by: Masson-Delmotte, V., Zhai, P., Pirani, A., Connors, S. L., Péan, C., Berger, S., Caud, N., Chen, Y., Goldfarb, L., Gomis, M. I., Huang, M., Leitzell, K., Lonnoy, E., Mat-thews, J. B. R., Maycock, T. K., Waterfield, T., Yelekçi, O., Yu, R., and Zhou, B., Cambridge University Press. Cambridge, UK and New York, USA, 2391 pp., https://report.ipcc.ch/ar6/wg1/IPCC_AR6_WGI_FullReport.pdf (last access: 5 January 2024), 2021.
IPCC: Climate Change 2022. Impacts, Adaptation and Vulnerability. Contribution of Working Group II to the Sixth Assessment Report of the Intergovernmental Panel on Climate Change, edited by: Pörtner, H.-O., Roberts, D. C., Tignor, M., Poloczanska, E. S., Mintenbeck, K., Alegría, A., Craig, M., Langsdorf, S., Löschke, S., Möller, V., Okem, A., and Rama, B., Cambridge University Press, Cambridge, UK and New York, NY, USA, 3056 pp., https://report.ipcc.ch/ar6/wg2/IPCC_AR6_WGII_FullReport.pdf (last access: 5 January 2024), 2022.
Jacob, D., Bärring, L., Christensen, O.B., Christensen, J.H., de Castro, M., Déqué, M., et al.: An inter-comparison of regional climate models for Europe: model performance in present-day climate, Climatic Change, 81, 31–52, https://doi.org/10.1007/s10584-006-9213-4, 2007.
Jacob, D., Petersen, J., Eggert, B. et al.: EURO-CORDEX: new high-resolution climate change projections for European impact research, Reg. Environ. Change, 14, 563–578, https://doi.org/10.1007/s10113-013-0499-2, 2014.
Jones, C. D., Hughes, J. K., Bellouin, N., Hardiman, S. C., Jones, G. S., Knight, J., Liddicoat, S., O'Connor, F. M., Andres, R. J., Bell, C., Boo, K.-O., Bozzo, A., Butchart, N., Cadule, P., Corbin, K. D., Doutriaux-Boucher, M., Friedlingstein, P., Gornall, J., Gray, L., Halloran, P. R., Hurtt, G., Ingram, W. J., Lamarque, J.-F., Law, R. M., Meinshausen, M., Osprey, S., Palin, E. J., Parsons Chini, L., Raddatz, T., Sanderson, M. G., Sellar, A. A., Schurer, A., Valdes, P., Wood, N., Woodward, S., Yoshioka, M., and Zerroukat, M.: The HadGEM2-ES implementation of CMIP5 centennial simulations, Geosci. Model Dev., 4, 543–570, https://doi.org/10.5194/gmd-4-543-2011, 2011.
Kapitza, H.: MOPS – A Morphodynamical Prediction System on Cluster Computers, in: High performance computing for computational science-VECPAR 2008, in: Lecture Notes in Computer Science, edited by: Laginha, J. M., Palma, M., Amestoy, P. R., Dayde, M., Mattoso, M., and Lopez, J., Springer, 63–68, https://doi.org/10.1007/978-3-540-92859-1_8, 2008.
Kool, R., Lawrence, J., Drews, M., and Bell, R.: Preparing for sea-level rise through adaptive managed retreat of a New Zealand stormwater and wastewater network, Infrastructures, 5, 92, https://doi.org/10.3390/infrastructures5110092, 2020.
Ley, A., Hähnel, P., and Bormann, H.: Addressing the challenges of climate scenario-based impact studies in modelling groundwater recharge on small barrier islands at the German North Sea coast, J. Hydrol. Regional Studies, 50, 101578, https://doi.org/10.1016/j.ejrh.2023.101578, 2023.
Lyard, F., Lefevre, F., Letellier, T., and Francis, O.: Modelling the global ocean tides: modern insights from FES2004, Ocean Dynam., 56, 394–415, https://doi.org/10.1007/s10236-006-0086-x, 2006.
NLWKN: Generalplan Küstenschutz Niedersachsen/Bremen – Festland. Küstenschutz, Band 1. Niedersächsischer Landesbetrieb für Wasserwirtschaft, Küsten- und Naturschutz, https://www.nlwkn.niedersachsen.de/download/22925/Generalplan_Kuestenschutz_ Niedersachsen_Bremen_ Teil_ 1_ -_Festland.pdf (last access: 5 January 2024), 2007.
Paprotny, D., Vousdoukas, M. I., Morales-Nápoles, O., Jonkman, S. N., and Feyen, L.: Pan-European hydrodynamic models and their ability to identify compound floods, Nat. Hazards, 101, 933–957, https://doi.org/10.1007/s11069-020-03902-3, 2020.
Pugh, D. and Woodworth, P.: Sea Level Science: Understanding Tides, Surges, Tsunamis and Mean Sea-Level Changes, Cambridge University Press, Cambridge, UK, https://doi.org/10.1017/CBO9781139235778, 2014.
Rawls, W. and Brakensiek, D.: Prediction of soil water properties for hydrologic modeling, edited by: Jones, E. and Ward, T. J., in: Proc. Symp. Watershed Manag. Eighties, Denver, US, ISBN 978-0872624498, 1985.
Ritchie, J. T.: A model for predicting evaporation from a row crop with incomplete cover, Water Resour. Res., 8, 1204–1213, https://doi.org/10.1029/WR008i005p01204, 1972.
Ritzema, H. P. and Stuyt, L. C. P. M.: Land drainage strategies to cope with climate change in the Netherlands, Acta Agr. Scand.-B S. P., 65, 80–92, https://doi.org/10.1080/09064710.2014.994557, 2015.
Santos, V. M., Casas-Prat, M., Poschlod, B., Ragno, E., van den Hurk, B., Hao, Z., Kalmár, T., Zhu, L., and Najafi, H.: Statistical modelling and climate variability of compound surge and precipitation events in a managed water system: a case study in the Netherlands, Hydrol. Earth Syst. Sci., 25, 3595–3615, https://doi.org/10.5194/hess-25-3595-2021, 2021.
Seneviratne, S. I., Nicholls, N., Easterling, D., Goodess, C. M., Kanae, S., Kossin, J., Luo, Y., Marengo, J., McInnes, K., Rahimi, M., Reichstein, M., Sorteberg, A., Vera, C., and Zhang, X.: Changes in climate extremes and their impacts on the natural physical environment, in: Managing the Risks of Extreme Events and Disasters to Advance Climate Change Adaptation, edited by: Field, C. B., Barros, V., Stocker, T. F., Qin, D., Dokken, D. J., Ebi, K. L., Mastrandrea, M. D., Mach, K. J., Plattner, G.-K., Allen, S. K., Tignor, M., and Midgley, P. M., A Special Report of Working Groups I and II of the Intergovernmental Panel on Climate Change (IPCC), Cambridge University Press, Cambridge, UK, and New York, NY, USA, 109–230, https://www.ipcc.ch/site/assets/uploads/2018/03/SREX-Chap3_FINAL-1.pdf (last access: 5 January 2024), 2012.
Shrestha, M., Acharya, S. C., and Shrestha, P. K.: Bias correction of climate models for hydrological modelling – are simple methods still useful?, Meterol. Appl., 24, 531–539, https://doi.org/10.1002/met.1655, 2017.
Smith, R. E. and Parlange, J. Y.: A parameter-efficient hydrologic infiltration model, Water Resour. Res., 14, 533–538, https://doi.org/10.1029/WR014i003p00533, 1978.
Spiekermann, J., Ahlhorn, F., Bormann, H., and Kebschull, J.: Zukunft der Binnenentwässerung: Strategische Ausrichtung in Zeiten des Wandels. Eine Betrachtung für das Verbandsgebiet des I. Entwässerungsverbandes Emden. University of Oldenburg, Jade University of Applied Sciences, Oldenburg, Germany, 64 pp., https://uol.de/klever/ergebnisbroschuere (last access: 5 January 2024), 2018.
Spiekermann, J., Bormann, H., Kebschull, J., and Kramer, N.: Management von Binnenhochwasserrisiken im Küstenraum – Roadmap für eine erfolgreiche Klimaanpassung im westlichen Ostfriesland. University of Oldenburg, Jade University of Applied Sciences, Oldenburg, Germany, 112 pp., https://uol.de/klever-risk/ergebnisbroschuere (last access: 5 January 2024), 2023.
Svensson, C. and Jones, D. A.: Dependence between extreme sea surge, river flow and precipitation in eastern Britain, Int. J. Climatol., 22, 1149–1168, https://doi.org/10.1002/joc.794, 2002.
Taylor, K. E., Stouffer, R. J., and Meehl, G. A.: An Overview of CMIP5 and the Experiment Design, B. Am. Meteorol. Soc., 93, 485–498, https://doi.org/10.1175/BAMS-D-11-00094.1, 2012.
Titus, J. G., Kuo, C. Y., Gibbs, M. J., LaRoche, T. B., Webb, M. K., and Waddell, J. O.: Greenhouse effect, sea level rise, and coastal drainage systems, J. Water Res. Plan. Man., 113, 216–225, https://doi.org/10.1061/(ASCE)0733-9496(1987)113:2(216), 1987.
van Alphen, J., Haasnoot, M., and Diermanse, F.: Uncertain accelerated sea-level rise, potential consequences, and adaptive strategies in the Netherlands, Water, 14, 1527, https://doi.org/10.3390/w14101527, 2022.
van den Hurk, B., van Meijgaard, E., de Valk, P., van Heeringen, K.-J., and Gooijer, J.: Analysis of a compounding surge and precipitation event in the Netherlands, Environ. Res. Lett., 10, 035001, https://doi.org/10.1088/1748-9326/10/3/035001, 2015.
Waddington, K., Khojasteh, D., Marshall, L., Rayner, D., and Glamore, W.: Quantifying the effects of sea level rise on estuarine drainage systems. Water Resour. Res. 58, e2021WR031405, https://doi.org/10.1029/2021WR031405, 2022.
WSV: German Federal Waterways and Shipping Administration (WSV), personally communicated by the German Federal Institute of Hydrology (BfG), 2021.
Xu, K., Zhuang, Y., Bin, L., Wang, C., and Fuchang, T.: Impact assessment of climate change on compound flooding in a coastal city, J. Hydrol., 617, 129166, https://doi.org/10.1016/j.jhydrol.2023.129166, 2023.
Zscheischler, J., Westra, S., van den Hurk, B. J. J. M., Seneviratne, S. I., Ward,, P. J., Pitman, A., AghaKouchak, A., Bresch, D. N., Leonard, M., Wahl, T., and Zhang, X.: Future climate risk from compound events, Nat. Clim. Change, 8, 469–477, https://doi.org/10.1038/s41558-018-0156-3, 2018.
Zscheischler, J., Martius, O., Westra, S., Bevacqua, E., Raymond, C., Horton, R. M., van den Hurk, B., AghaKouchak, A., Jézéquel, A., Mahecha, M. D., Maraun, D., Ramos, A. M., Rid-der, N. N., Thiery, W., and Vignotto, E.: A typology of compound weather and climate events, Nat. Rev. Earth Environ., 1, 333–347, https://doi.org/10.1038/s43017-020-0060-z, 2020.