the Creative Commons Attribution 4.0 License.
the Creative Commons Attribution 4.0 License.
 | 24 Jul 2024
A glacial lake outburst flood risk assessment for the Phochhu river basin, Bhutan
Tandin Wangchuk
Ryota Tsubaki
The melting of glaciers has led to an unprecedented increase in the number and size of glacial lakes, particularly in the Himalayan region. A glacial lake outburst flood (GLOF) is a natural hazard in which water from a glacial or glacier-fed lake is swiftly discharged. GLOFs can significantly harm life, infrastructure, and settlements located downstream and can have considerable ecological, economic, and social impacts. Based on a dam breach model, BREACH, and a hydrodynamic model, HEC-RAS (Hydrologic Engineering Centre's River Analysis System), we examined the potential consequences of a GLOF originating from the Thorthomi glacial lake, located within the Phochhu river basin, one of Bhutan's largest and rapidly expanding glacial lakes. Our analysis revealed that following a breach the Thorthomi glacial lake will likely discharge a peak flow of 16 360 m3 s−1 within 4 h. Such a discharge could potentially cause considerable damage, with an estimated 245 ha of agricultural land and over 1277 buildings at risk of inundation. To mitigate ecological, economic, and social impacts on downstream areas, our results emphasise an urgent need for understanding and preparing for the potential consequences of a GLOF from Thorthomi lake. Our findings provide valuable insights for policymakers and stakeholders involved in disaster management and preparedness.
- Article
(13963 KB) - Full-text XML
- BibTeX
- EndNote


1.1 Glacial lakes and outburst floods
Floods are one of the most common natural disasters worldwide and can cause extensive socio-economic damage. Globally, over the last 2 decades, floods have affected approximately 2.3 billion people and have caused an estimated USD 622 billion in damage (UNISDR, 2015). Glacial lake outburst floods (GLOFs) are floods caused by sudden water release from glacial or glacier-fed lakes and cause a rapid rise in water level over a short time in downstream areas, resulting in devastating consequences (Gurung et al., 2017; Komori et al., 2012; Taylor et al., 2023). GLOFs are infrequent but highly destructive natural disasters that are difficult to predict. Prior to their occurrence, the extent of damage is also difficult to predict. Over the past few decades, the acceleration of glacier melt and recession, primarily driven by climate change, has led to a significant increase in the number of moraine-dammed (natural dams formed by glacial processes) glacial lakes (Sattar et al., 2021; Westoby et al., 2014; Worni et al., 2014). Taylor et al. (2023) estimated that approximately 15 million people are exposed to risks associated with potential GLOFs and that most of these populations are concentrated within High Mountain Asian (HMA) areas. Due to climate warming (Gardelle et al., 2011), the eastern Himalayan area, in particular, has seen a significant increase in the number and area of glacial lakes, thereby increasing the vulnerability of nearby communities to potential GLOF impacts (Hagg et al., 2021).
Although GLOF research and studies have gained global momentum in recent years, only a few studies have been performed in Bhutan. Numerous studies conducted in Nepal and China have simulated and assessed GLOF risks, although detailed studies on Bhutan's exposure to GLOF-related hazards are scarce. Such scarcity can be attributed to a lack of required field data, as well as to Bhutan's limited exposure to the global scientific community.
1.2 Past GLOF events in Bhutan
In the past, Bhutan has faced several GLOF events; however, many of these events were either not reported or not documented. One of the most catastrophic GLOFs took place on 6 October 1994, when the moraine dam of Luggye lake partially collapsed, leading to the release of a massive amount of water and debris downstream, destruction to infrastructure and farmland, and the death of 21 people (Watanabe and Rothacher, 1996; Leber et al., 2000). Another significant GLOF occurred in 2009, when an outburst from Tshojo lake, located at the headwaters of the Phochhu river, caused downstream flooding. Based on satellite imagery and a sedimentological and geomorphological analysis, Komori et al. (2012) attributed an outburst from the supraglacial lake on the Tshojo glacier to the event. The most recent GLOF, the Lemthang Tsho outburst, took place on 28 July 2015. Gurung et al. (2017) reported that heavy rainfall triggered the event and that 0.37×10⁶ m3 of water was discharged.
1.3 Potentially dangerous glacial lakes in Bhutan
Based on the latest report from the National Center for Hydrology and Meteorology (NCHM) in Bhutan, 567 glacial lakes in the country span an area of 55.04 km2, accounting for 19.03 % of total water bodies (NCHM, 2021). In 2001, the Department of Geology and Mines (DGM) in Bhutan and the International Centre for Integrated Mountain Development (ICIMOD) performed the first-ever inventory of glaciers, glacial lakes, and potentially dangerous glacial lakes (PDGLs), and they identified 24 glacial lakes that fit this category (Mool et al., 2001). However, in 2019, using field-verified data and the latest Sentinel-2 satellite images, NCHM reassessed the number of PDGLs and revised the number to 25, with eight lakes now considered to be safe based on lake morphology, surrounding features, bathymetry conditions, and associated feeding glaciers (NCHM, 2019). Figure 1 provides a map of rivers and the river basin system within Bhutan, together with the distribution of glaciers and glacial lakes. The Punatsangchhu river basin contains 11 PDGLs, which is the largest number of PDGLs per basin the in the country. The Phochhu sub-basin contains nine PDGLs, making it a hotspot for GLOFs and glacially related disasters.
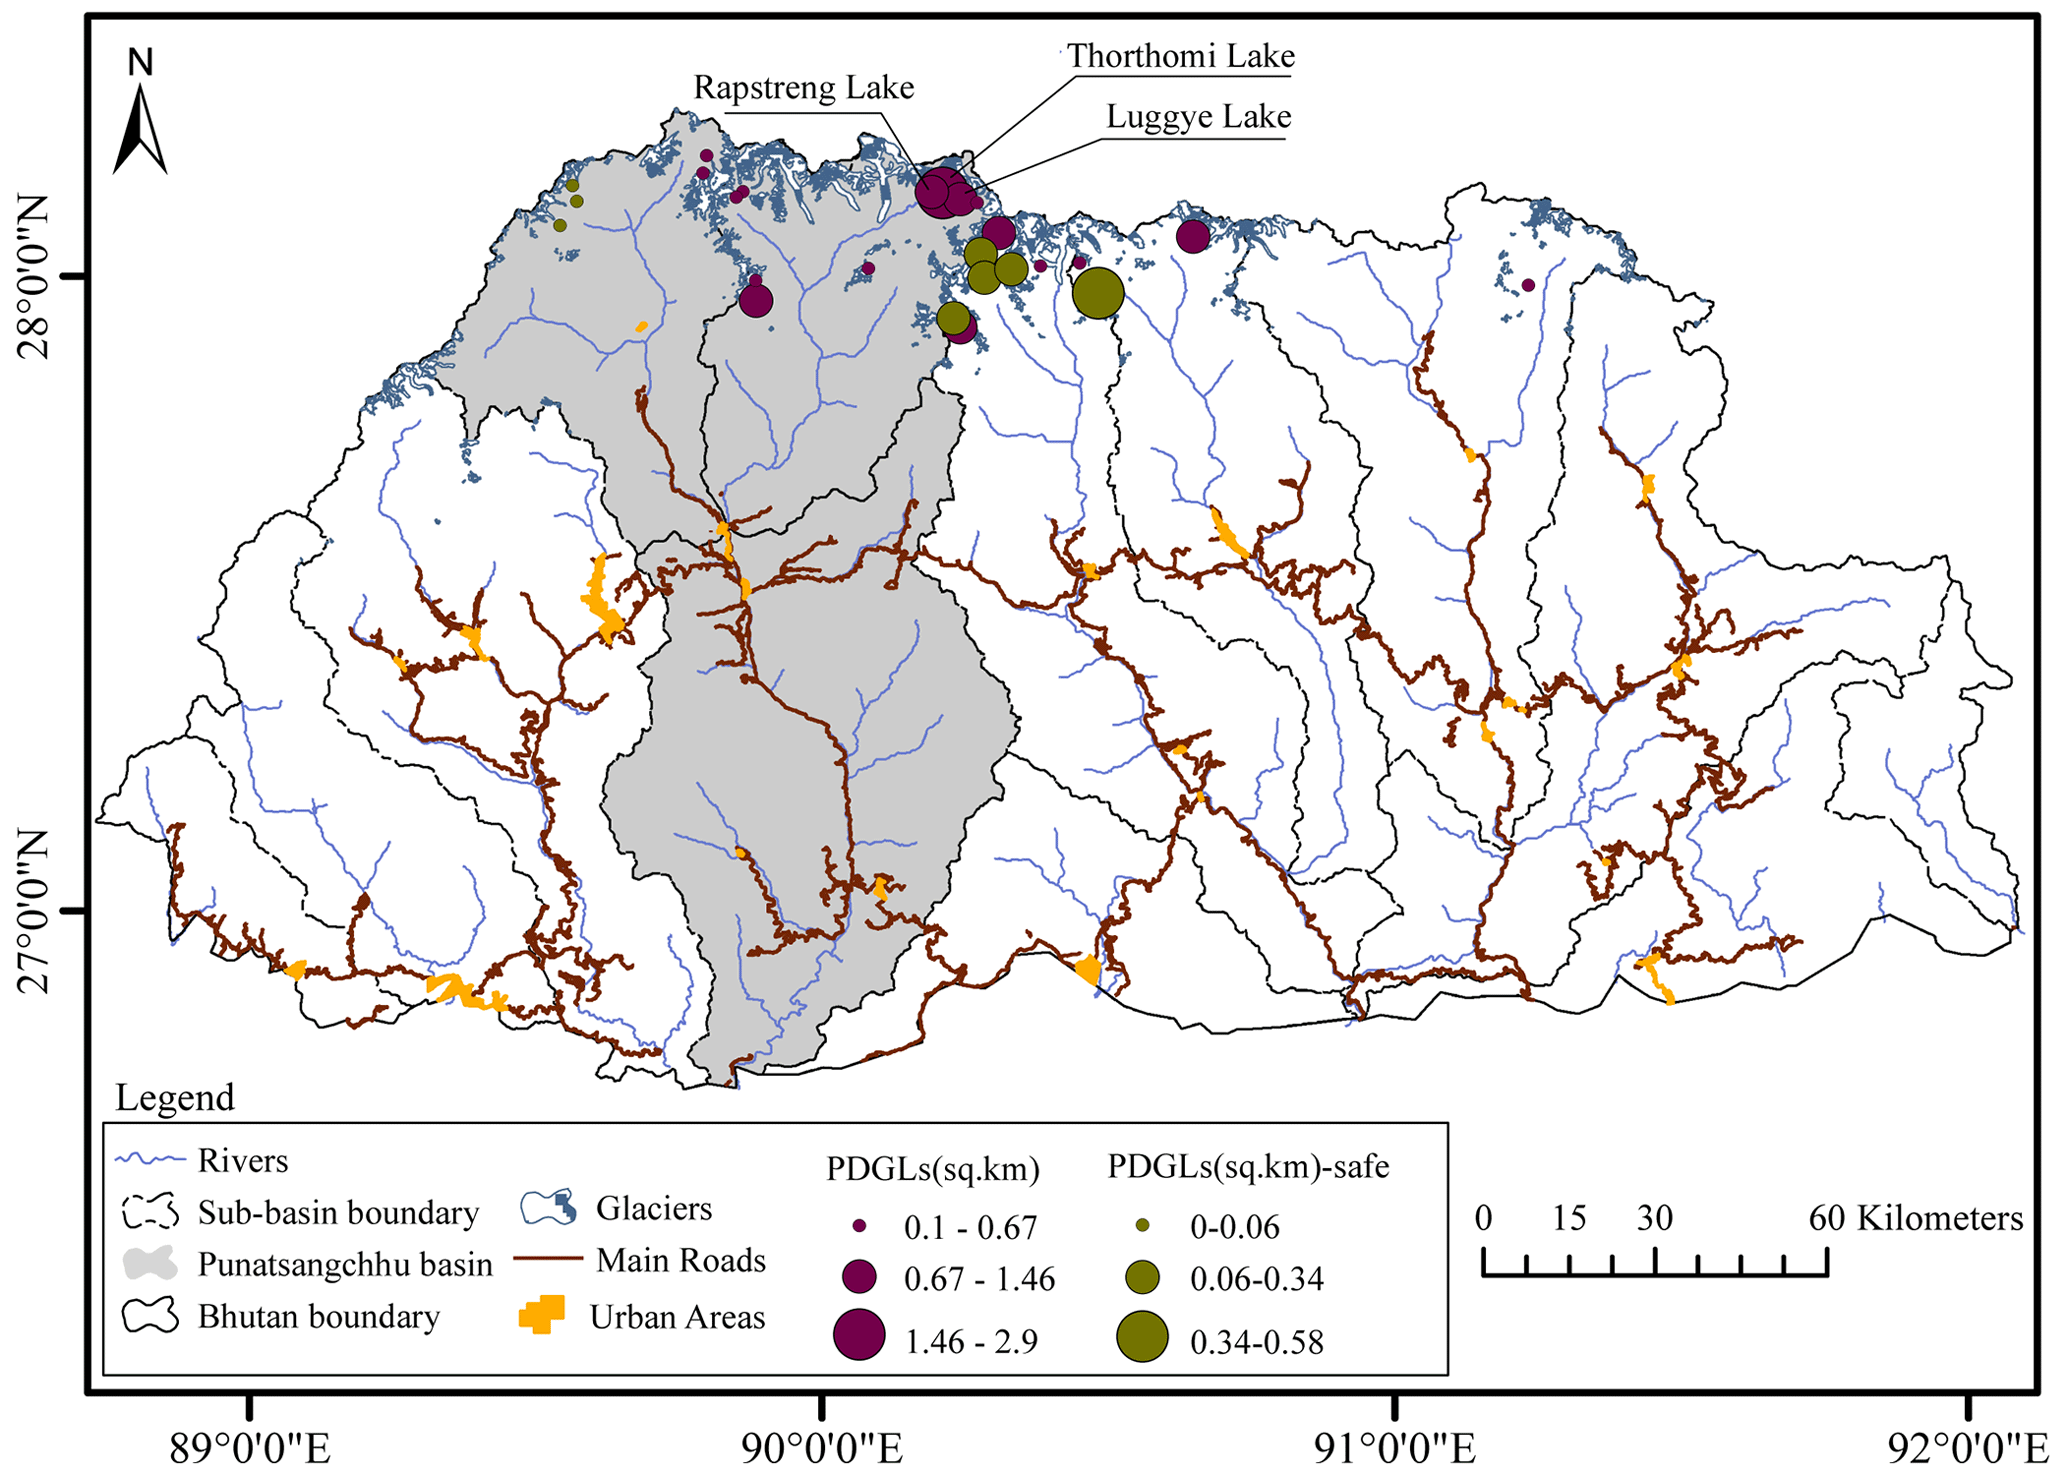
Figure 1A map showing the rivers and basin system of Bhutan, as well as the distribution of potentially dangerous glacial lakes, the main road network, and major urban areas. Bubbles are scaled to total lake area and colour-coded for classification. PDGLs stand for potentially dangerous glacial lakes. Data source: National Center for Hydrology and Meteorology (NCHM).
Warming climate exacerbates the hazards of GLOFs, so a comprehensive GLOF assessment is urgently needed since these risks will increase in the coming years. As such, a study assessing hazards associated with glacial lakes and GLOFs is crucial for understanding hazards, as well as their subsequent impacts on hydrological and socio-economic aspects within the Punatsangchhu river basin.
1.4 Increasing concern regarding a Thorthomi GLOF
Thorthomi lake is the largest of nine PDGLs within the Phochhu basin. Due to the significant potential risk posed to downstream settlements resulting from a GLOF, the Thorthomi glacial lake has become a serious concern due to the following factors: (1) rapid expansion of the Thorthomi supraglacial lake, (2) the size of glaciers and probable future lake size, (3) the weakened left lateral moraine of the lake due to the 1994 Luggye GLOF, (4) active sliding on the moraine wall separating the Thorthomi and Rapstreng lakes, (5) seepage from the lake, and (6) rock and snow avalanches, as summarised by Karma (2013). To address these factors, the government of Bhutan initiated a high-priority project, referred to as the National Adaptation Plan of Action (NAPA), under the United Nations Framework Convention on Climate Change (UNFCCC) funding scheme in 2006. The project sought to reduce the GLOF risk potential from Thorthomi lake and involved lowering the lake's water level over 4 years, resulting in a reduction of 3.68 m. However, due to challenging working conditions and health issues, the project fell 1.32 m short of its target, although approximately 17×106 m3 of lake water was artificially released. The project additionally included setting up a GLOF early warning system along the Punakha–Wangdue valley for alerting residents in the event of a GLOF.
1.5 The focus of our study
To contribute to risk management efforts, we evaluated the potential risk of a GLOF from Thorthomi lake. The physically based mathematical dam breach model, BREACH, was used to simulate a glacial lake dam breach and was coupled with the Hydrologic Engineering Centre's River Analysis System (HEC-RAS) to route the flood wave propagating downstream. We sought to simulate both the spatial extent and the lead time of flood wave arrival at several locations along the river. Prior to predicting Thorthomi GLOF hazards and potential risks, we reconstructed the 1994 Luggye GLOF event to validate the dam breach model and the flood wave routing model, which includes river topography and roughness.
Our study is one of a few studies that has simulated probable floods from Thorthomi lake and that has estimated inundation extent and flood arrival times within a scientific setting. Such studies form an essential basis for flood risk assessments, early warning system installation, economic planning, countermeasure planning, design, and stakeholder education and awareness programmes.
The main components of our study are as follows:
-
estimating the geometry and water volume of Thorthomi lake using available glacial lake geometry data;
-
estimating the potential outburst flood hydrograph using a dam breach model, BREACH, with available physical parameters; and
-
assessing Thorthomi GLOF hazards and potential risks using a 2D hydraulic model.
1.6 Structure of the paper
The paper contains six sections. Section 1 introduces the overall concept of a GLOF and provides information obtained from previous studies and information related to GLOFs in the context of Bhutan. Section 2 describes the study area and the GLOF event used for model validation and calibration. We explain materials and methods in Sect. 3. Obtained results are reported in Sect. 4. Based on the results, we discuss the consequences of a Thorthomi GLOF in Sect. 5. We conclude our study in Sect. 6.
We assessed flood risk for a catchment of under-construction hydropower plants, specifically the Punatsangchhu Hydroelectric Project Authority (PHPA-I and II), caused by a GLOF from Thorthomi lake. The catchment is the upper part of the Punatsangchhu river basin (PRB), located within the central portion of Bhutan and indicated by the grey area in Fig. 2a. PRB is one of the largest basins in Bhutan, spanning an approximate area of 9760 km2, which covers approximately 25 % of the total area of the country (38 394 km2), and is drained by the Phochhu and Mochhu rivers (Fig. 2a) to the Indian plains. The annual averaged discharge of the basin ranges from 194 to 374 m3 s−1, with the highest recorded discharge of 2654 m3 s−1, observed at the WangdiRapid station (location shown in Fig. 2c), occurring in 2009 during Cyclone Aila.
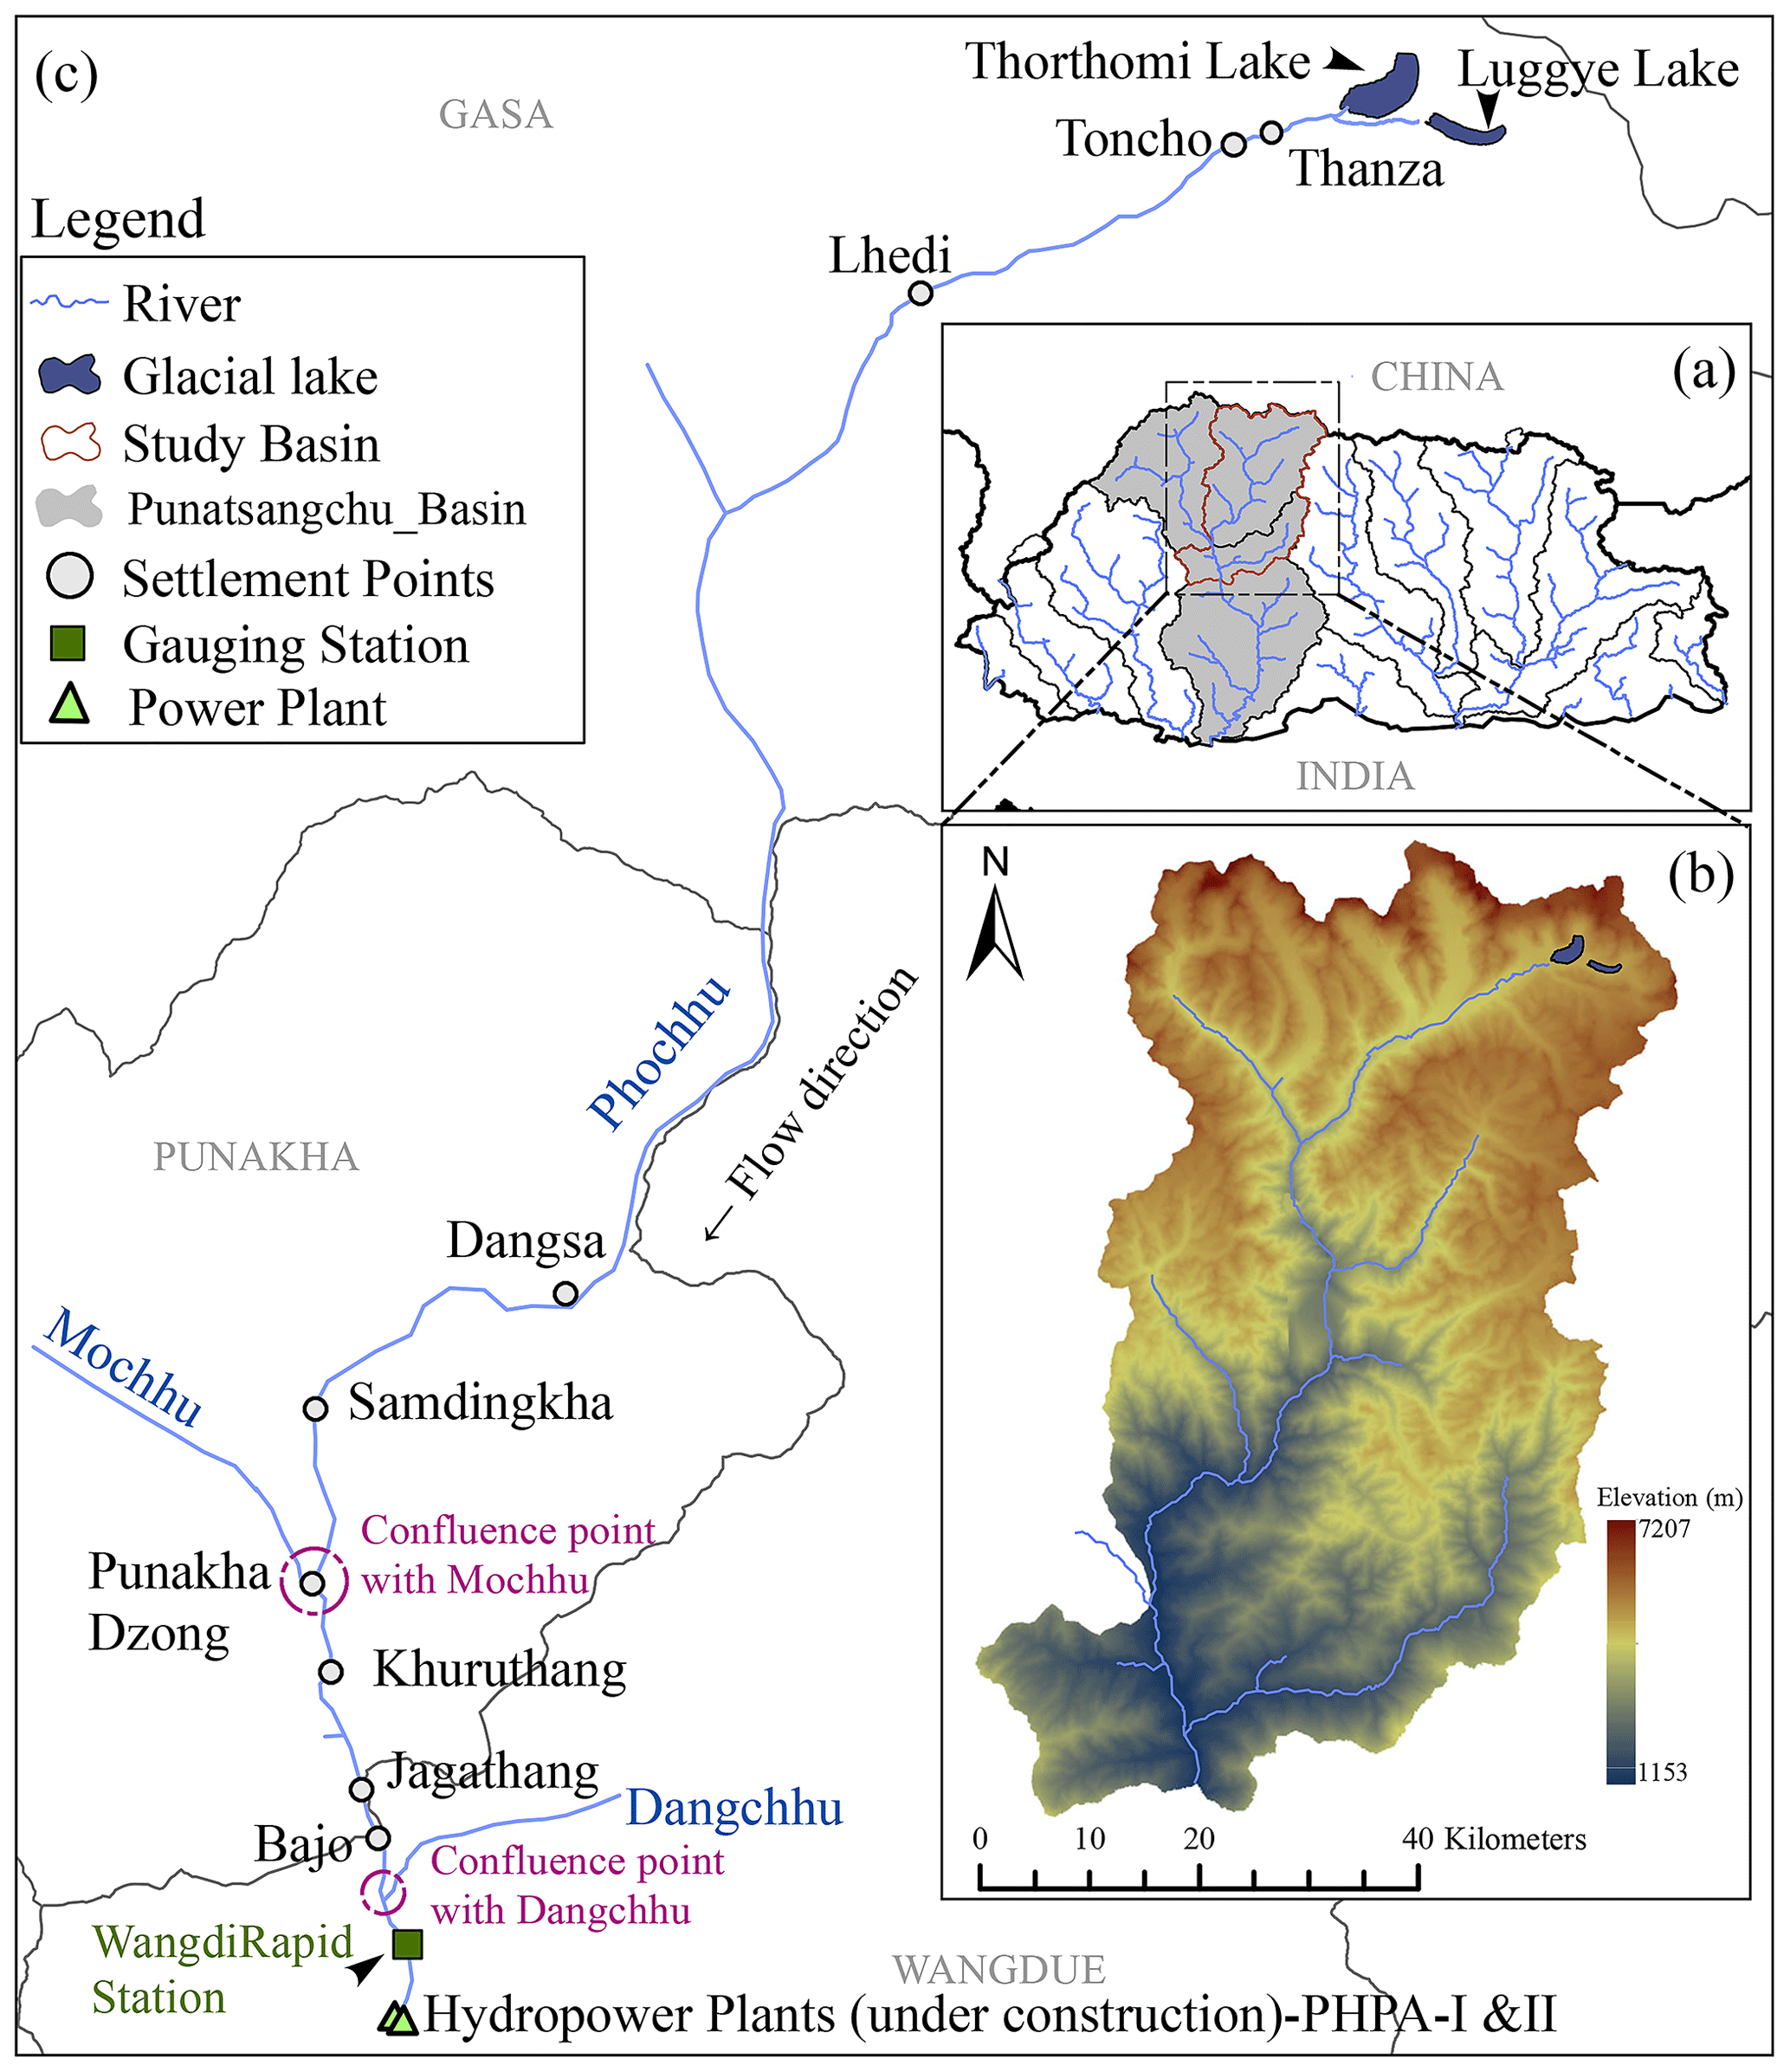
Figure 2Map of the study area. (a) A Bhutan map showing rivers and river basins (the grey area shows the Punatsangchhu river basin). (b) The elevation distribution of the study area (the catchment area of PHPA-I and II excludes the Mochhu river basin). (c) Major settlement points within the study area.
The Phochhu river, one of the main tributaries of the Punatsangchhu river, originates from the high mountains of Lunana, in northern Bhutan, and flows some 90 km downstream, where it joins Mochhu at Punakha Dzong (monastery) (Fig. 2c), and flows from this area as the Punatsangchhu river. The Thorthomi glacial lake, considered to be one of the most dynamic and dangerous glacial lakes within Bhutan, with an area of 4.3 km2 (NCHM, 2019), is located at the headwater of the Phochhu sub-basin at over 4440 m above sea level. The Thorthomi glacial lake is widely recognised as the likely consequence of climate warming and, since feeding glaciers terminating in the lake rapidly melt, is expanding each year. Based on a comprehensive analysis of cryospheric, geotechnical, and geomorphological factors, Rinzin et al. (2023) concluded that Thorthomi lake is highly susceptible to GLOF events.
The PRB consists of five administrative districts: Gasa, Punakha, Wangdue Phodrang, Dagana, and Tsirang. These districts constitute 16.6 % (735 533) of the total population of Bhutan (NSB, 2018). The Punakha and Wangdue Phodrang districts (Fig. 2) within the PRB are renowned as Bhutan's primary rice production regions, contributing 16 % and 11 %, respectively, to the nation's total rice output (NSB, 2021). The area is also rich in historical and cultural heritage, with notable landmarks such as Punakha Dzong, which served as the former capital of Bhutan. Fertile flood plains are located along the Phochhu and Punatsangchhu rivers, and the region encompasses settlements such as Samdingkha and Jagathang, together with major towns such as Khuruthang and Bajo. The floodplain of the Punatsangchhu river accommodates these settlements, while downstream, approximately 115 km away from Thorthomi lake, two significant hydropower plants, PHPA-I and II, are currently under construction (see the bottom of Fig. 2c for locations of the two hydropower plants). Given the exposure of critical infrastructure and settlements to potential GLOFs from PDGLs, especially the Thorthomi glacial lake, an assessment of hazards within this area is of paramount importance.
The Luggye glacial lake is one of the PDGLs in Lunana, Bhutan's northern region. The lake is one of four glacial lakes in an area that spans a few kilometres (Fig. 3) and had an outburst in 1994. Although there is no detailed official documentation on the GLOF at the Luggye glacial lake, reports and articles describing the event do exist (e.g. Koike and Takenaka, 2012; Meyer et al., 2006; Richardson and Reynolds, 2000; Watanabe and Rothacher, 1996). The event was also documented in a technical report (Leber et al., 2000), when the Royal Government of Bhutan launched a major investigative project in 2000 to study the cause of the event.
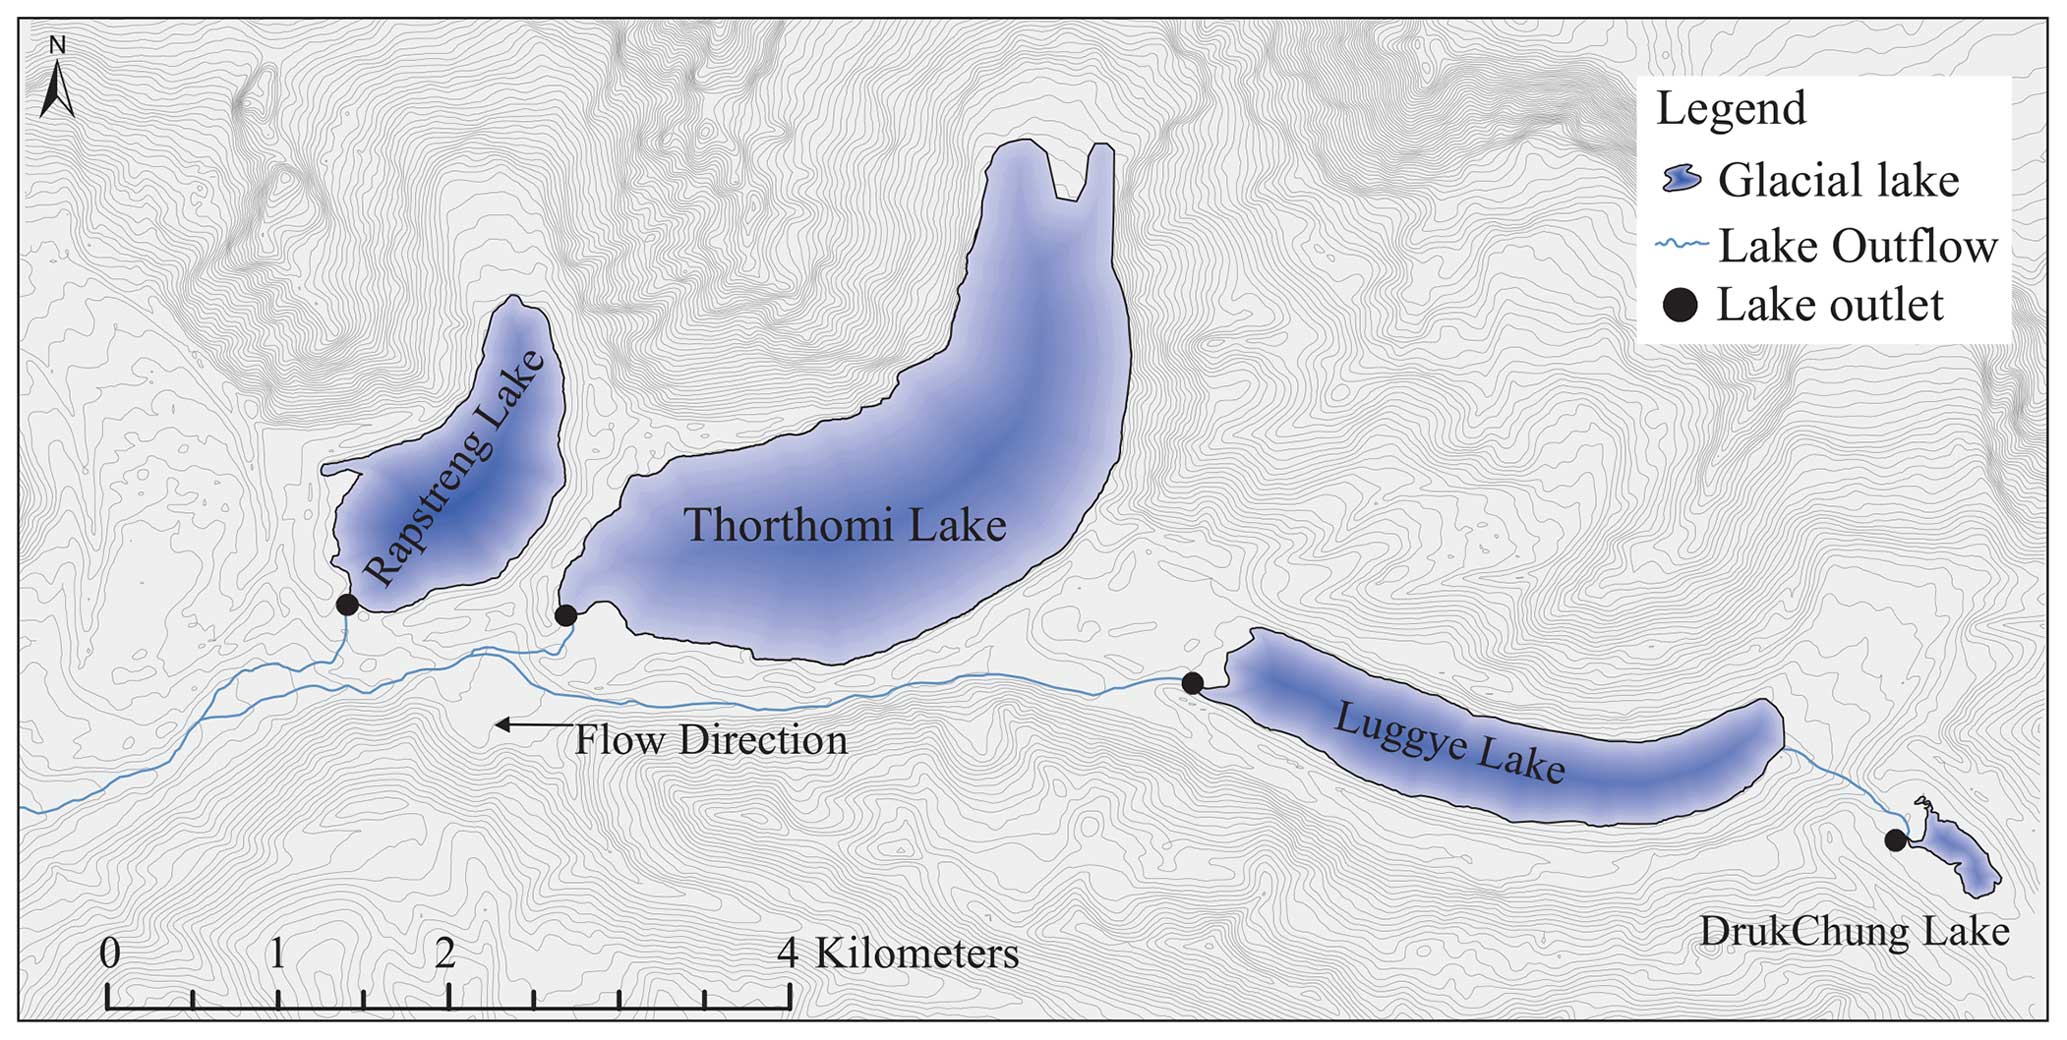
Figure 3Four glacial lakes within the Lunana region (the Lunana complex).
The 1994 Luggye GLOF was a cascading phenomenon, where sudden drainage of the upstream Druk Chung glacial lake (Fig. 3) into Luggye lake increased hydrostatic pressure on the moraine dam of Luggye lake, releasing 18×106 m3 of flood water (Leber et al., 2000). The 1994 Luggye GLOF claimed the lives of 21 people and inflicted major damage to infrastructure and downstream settlements; notably, the Punakha Dzong (monastery) suffered significant damage, although it is located 93 km downstream from the lake (Richardson and Reynolds, 2000; Watanabe and Rothacher, 1996). During this period, a peak flow rate of 2539 m3 s−1 was observed at the WangdiRapid gauging station, located 15 km downstream of Punakha Dzong (Fig. 2) and approximately 108 km downstream of the flood source (data from NCHM). Contributions from the Mochhu (96 m3 s−1 on 7 October 1994), Dangchhu basins (no gauging station in the basin), and other small tributaries to the peak flow rate should have been minor due to limited base flow during the season.
To estimate the breach outflow hydrograph, several studies have attempted to reconstruct the 1994 Luggye GLOF event (e.g. JICA, 2001; Koike and Takenaka, 2012; Meyer et al., 2006). Koike and Takenaka (2012) estimated that peak discharge from the Luggye lake breach ranged from 1800 to 2500 m3 s−1, depending on inflow conditions measured by Yamada et al. (2004).
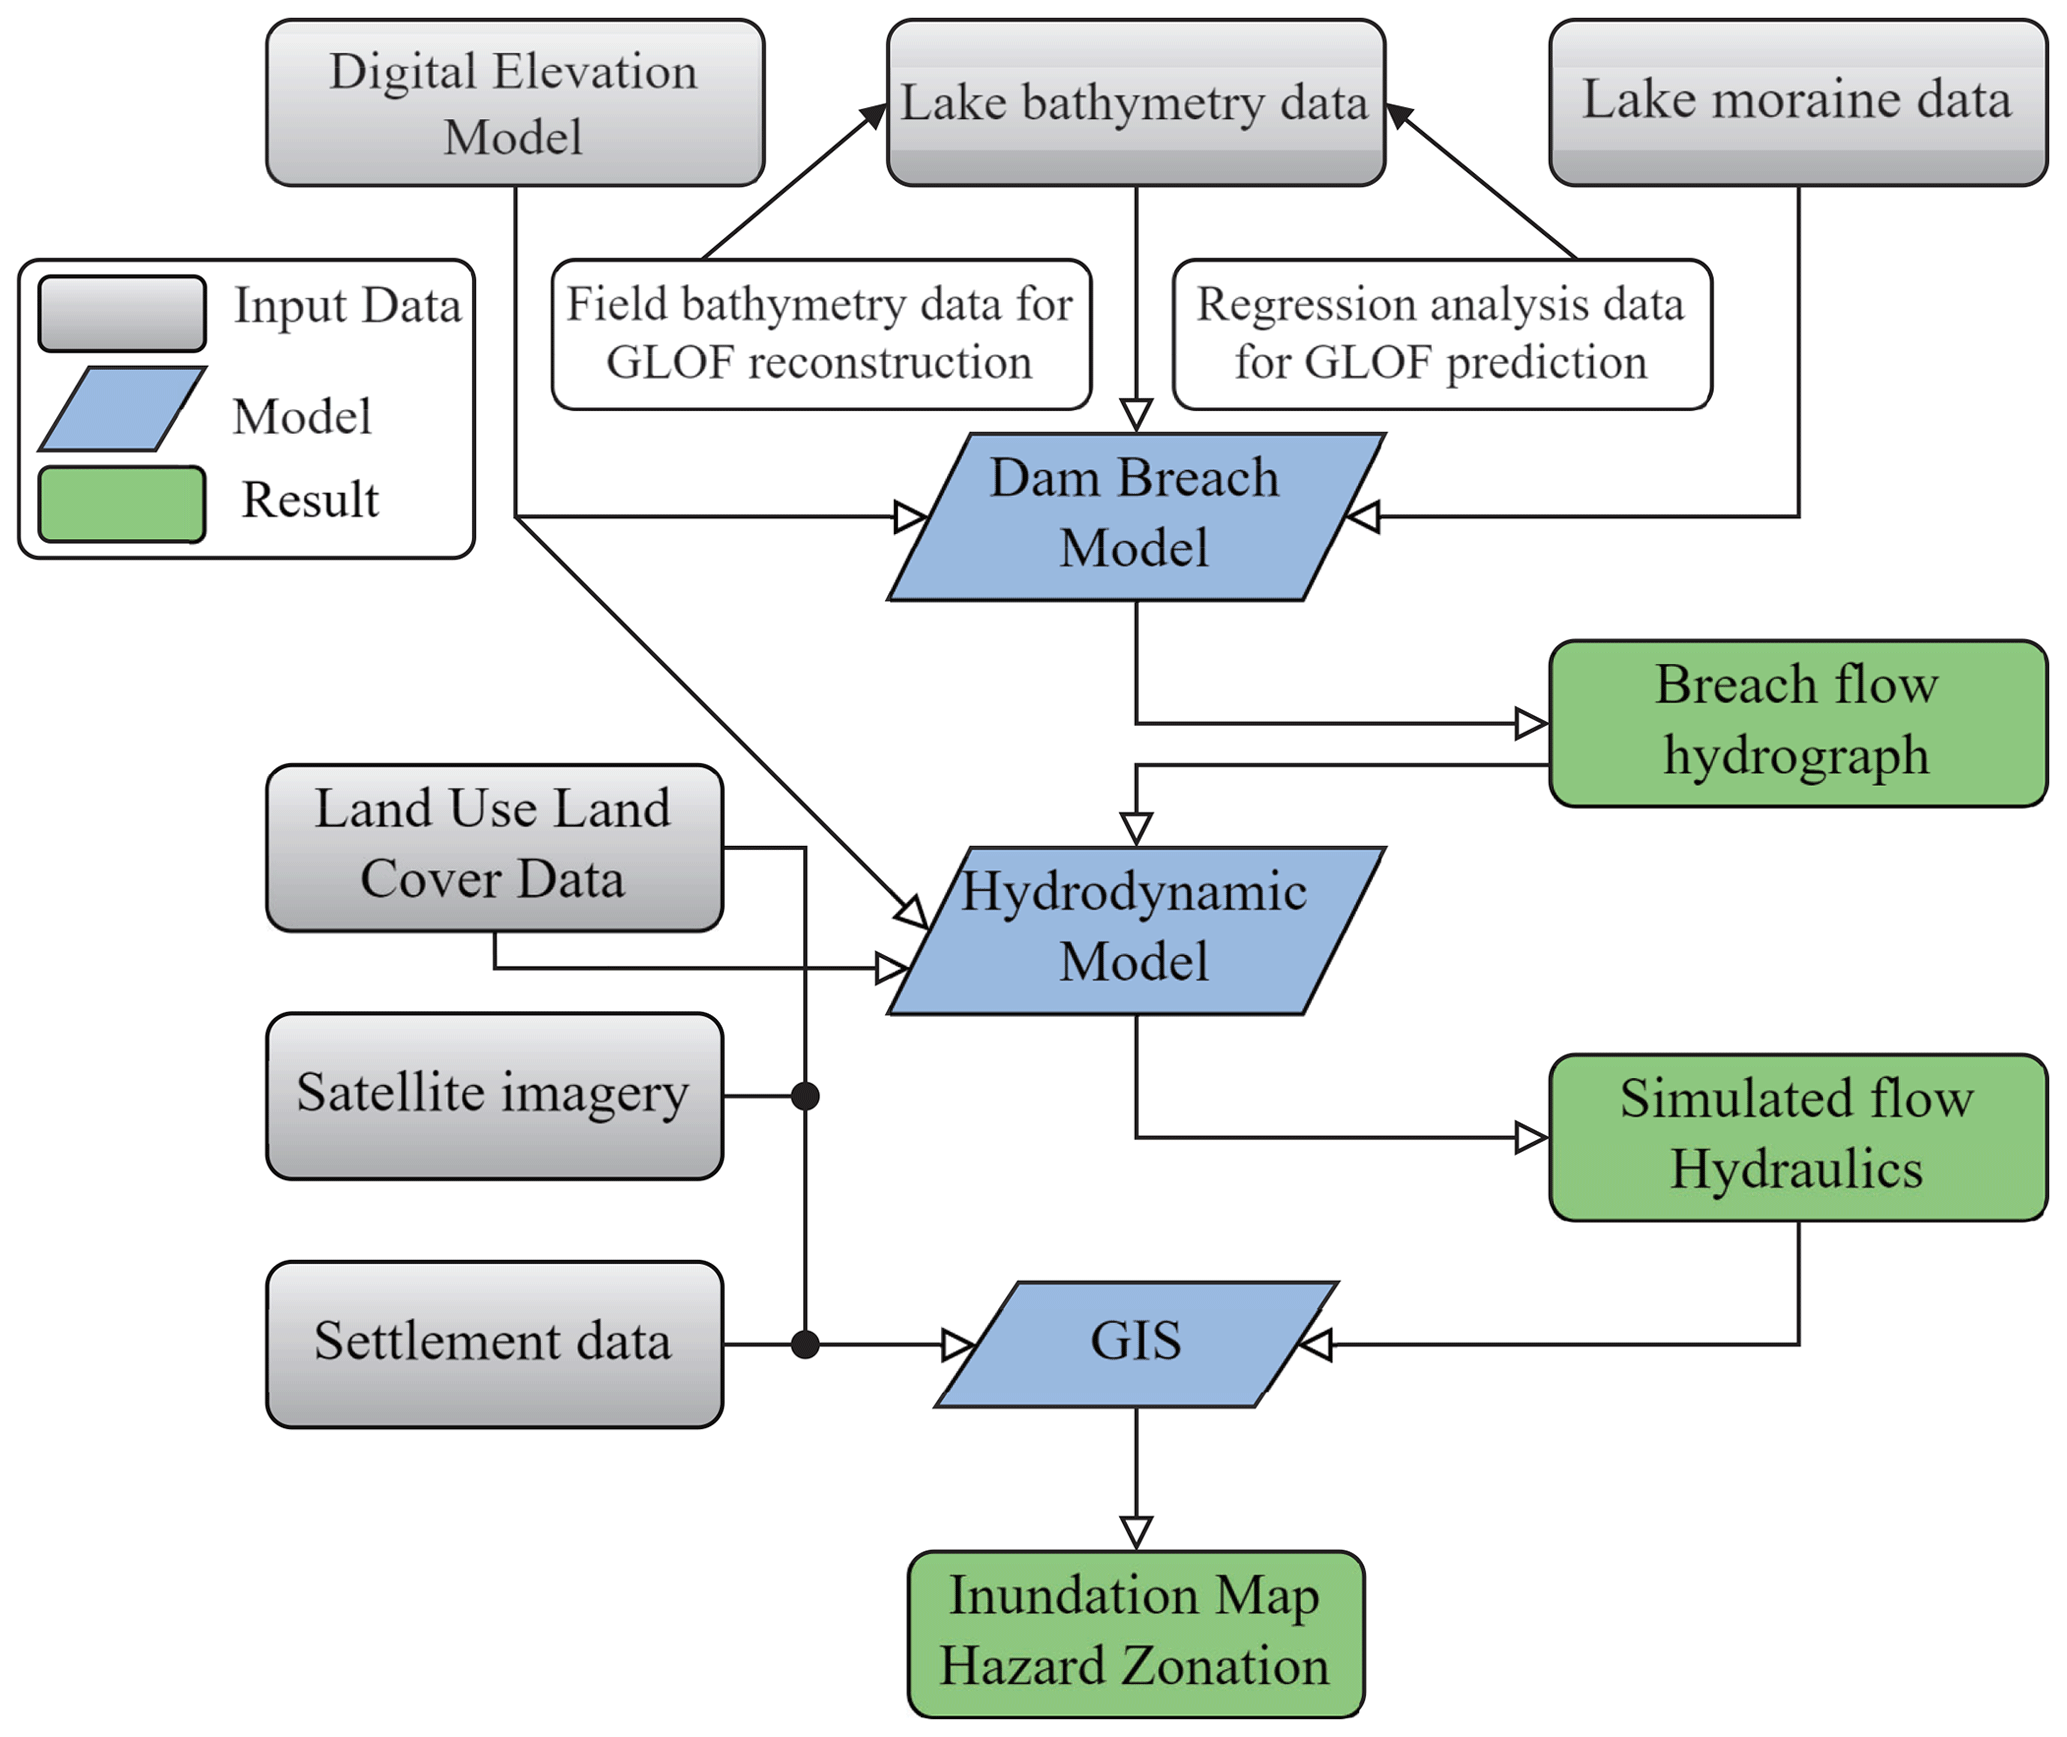
A schematic diagram showing input data, used models/methods, and outputs is provided in Fig. 4. We reconstructed the 1994 GLOF event to verify (1) a glacial lake geometry estimation model, (2) a dam breach model, (3) a digital elevation model and its error correction method, and (4) Manning's coefficient. Then, the same models were used to predict the potential risk caused by a Thorthomi GLOF.
3.1 Uncertainty in GLOF bathymetry
The volume and geometry of a glacial lake are regulating factors of the glacial lake outburst process. Glacial lakes are generally formed from a depression left behind by retreating glaciers, which, in most cases, are produced when a moraine is filled with meltwater. Depending on geomorphology, the presence of sediment, and glacial over-deepening capacity, formed glacial lakes can manifest specific lake bathymetry and influence glacial hydrology (Cook and Swift, 2012). Due to remote locations and high elevations, accessing and conducting field surveys to map glacial lake bathymetry is challenging.
Despite challenges, measurements of lake bathymetry are crucial for determining a lake's volume and surface area and are necessary for assessing potential flood volumes and the risk of GLOFs. In 2019, the National Centre for Hydrology and Meteorology (NCHM) conducted bathymetric surveys in 14 of the 25 identified potentially dangerous glacial lakes and mapped their maximum depth and volume. However, even though the Thorthomi glacial lake is considered to be a critical lake that could burst in the future, due to the difficulty associated with conducting a survey, the bathymetry of the Thorthomi glacial lake remains unknown. Since lake geometry is a crucial parameter for dam breach modelling and subsequent hydraulic routing, lake depth and volume needed to be estimated.
3.2 Estimating geometries of glacial lakes
Estimating the potential flood volume of a glacial lake is critical for determining the magnitude of a GLOF. Bathymetry data are necessary for calculating lake volume as well as potential flood volume, but bathymetry for glacial lakes is scarce due to the challenging and inaccessible environments in which glacial lakes are often located, including for Thorthomi lake. Although several reports have estimated Thorthomi lake volume (Karma, 2013; Singh, 2009), no details on how volumes were estimated have been documented.
To address data scarcity for glacial lake geometries, various studies have proposed methods for estimating glacial lake depth and volume based on other more accessible parameters such as lake area (Cook and Quincey, 2015; Huggel et al., 2002; O'Connor et al., 2001; Sakai, 2012), as well as depression angle from the lakeshore (Fujita et al., 2013) and surrounding topography (Heathcote et al., 2015). Empirical relationships such as area–volume and area–depth are useful for estimating a lake's depth and potential flood volume. Cook and Quincey (2015) refined the area–volume relationship proposed by Huggel et al. (2002) by increasing sample size and removing duplicated samples. They also classified the predictability of lake volume and depth based on regions and lake types and determined that predictability is influenced by a lake's origin and evolution. The relationship proposed by Cook and Quincey (2015) takes the following form:
where Dmean is the mean depth (in m) and A is the area (in m2). The volume–area relationship (V, volume in m3) can simply be derived by multiplying the area of both sides, as follows:
Sakai (2012) used a similar approach and proposed a model for estimating maximum depth instead of mean depth. The bathymetric measurement data of 17 glacial lakes (15 moraine-dammed glacial lakes and 2 thermokarst lakes) from Bhutan, Nepal, and Tibet were used to derive an area–maximum depth–volume relationship, so estimations of depth and volume from the area of glacial lakes could be determined (Sakai, 2012). The regression equation took the following form:
where Dmax is maximum depth (in m) and A is area (in km2). The volume–area relationship (V, volume in 106 m3) takes the following form:
For predicting the moraine dam breach process explained in the following section, lake geometries, especially the maximum depth, are crucial, so we employed the equations proposed by Sakai (2012). The equations allow the independent calculation of maximum depth and volume. As conceptualised by Cook and Quincey (2015), bathymetry of the lake was estimated based on idealised geometric shape. The lake bottom was also assumed to follow an elliptical shape, as commonly observed in most moraine-dammed glacial lakes in Bhutan.
3.3 The moraine dam breach and its modelling
3.3.1 Previous studies
GLOFs are triggered by a breach of a moraine dam that holds the lake in place and are caused by an external triggering event. While the structure of the dam itself is an important factor, destabilisation of a dam due to a trigger event is the primary cause of a breach. Since the overtopping of lake water is the major failure mode (Awal et al., 2010; Begam et al., 2018; Neupane et al., 2019), our study assumed that GLOFs are triggered by the overtopping of lake water.
To estimate flood flow and associated hazards resulting from a dam breach, several studies have simulated dam breach floods using dam breach models (Bajracharya et al., 2007; Hagg et al., 2021; Huggel et al., 2002; Koike and Takenaka, 2012; Maskey et al., 2020; Meyer et al., 2006; Shahrim and Ros, 2020; Wang et al., 2008; Worni et al., 2014). BREACH is a numerical model describing the dam breach process and the resulting outflow hydrograph. The model is based on fundamental principles of hydraulics, sediment transport, soil mechanics, and the physical properties of dam materials and the reservoir. The model is physically based and was designed to predict the size, shape, and time of dam breach development, as well as the resulting flow rate and the volume of water released. Unlike parametric models, physically based breach models, including BREACH, consider the geotechnical aspects of dam materials, as well as hydraulic and sediment transport (Fread, 1988; Maskey et al., 2020; Worni et al., 2014), which increases the predictive accuracy of future GLOF processes. Due to this, the BREACH model has been widely used in studies of dam breach flood hazards and risk assessments (Fread, 1988).
Koike and Takenaka (2012) used the BREACH model coupled with the flood flow model, FLO-2D, to perform a scenario analysis on the risks of a GLOF on the Mangdechhu river basin, due to an outburst flood of the Metatshota glacial lake in Bhutan. The study concluded that although the breaching potential of the lake is low due to the wide crest and gentle slope of the moraine dam, a GLOF would affect several houses and farmland located on the flood plain (Koike and Takenaka, 2012). Hagg et al. (2021) performed a GLOF hazard assessment within the Mochhu basin in Bhutan using the HEC-RAS dam break module, simulating a dam breach of the Shintaphu glacial lake, and concluded that risk is comparably small.
Our study used BREACH for describing the dam breach process for target lakes due to its better predictive accuracy for a future extraordinary Thorthomi GLOF event. The dam is assumed to breach due to overtopping flow resulting from a trigger event, such as an ice calving/avalanche or a rock avalanche. Most of the geotechnical properties of dam materials required as an input parameter are available in the report published by the National Center for Hydrology and Meteorology (NCHM, 2020). A few properties were published by Koike and Takenaka (2012). Some unavailable data were estimated by referring to previous studies.
3.3.2 Reconstruction of the 1994 Luggye GLOF dam breach
For reconstruction of the 1994 Luggye GLOF, the dam breach outflow hydrograph was estimated using BREACH (Fread, 1988). The bathymetry of Luggye lake (Fig. 5) and the material properties of the moraine dam (the middle row of Table 1) required for the model were based on various reports (NCHM, 2019, 2020). Topographic data of the moraine dam were derived from the digital surface model (DSM). Since wave overtopping is a more common failure mode for moraine-dammed glacial lakes as compared to a piping failure (Neupane et al., 2019), to estimate breach outflow from Luggye lake, overtopping failure of the moraine dam was assumed. The properties of moraine dam material have a significant effect on the growth of a breach (Maskey et al., 2020; Westoby et al., 2014). The mechanism in which the formation of a breach largely occurs determines the shape of the breach outflow hydrograph (Westoby et al., 2014). Therefore, gathering accurate in situ data for reliable breach process reproduction is essential. Based on the estimation by Fujita et al. (2008), deduced from a combination of field measurements and remote-sensing observations, the level of lake water was reduced 19 m during the event.
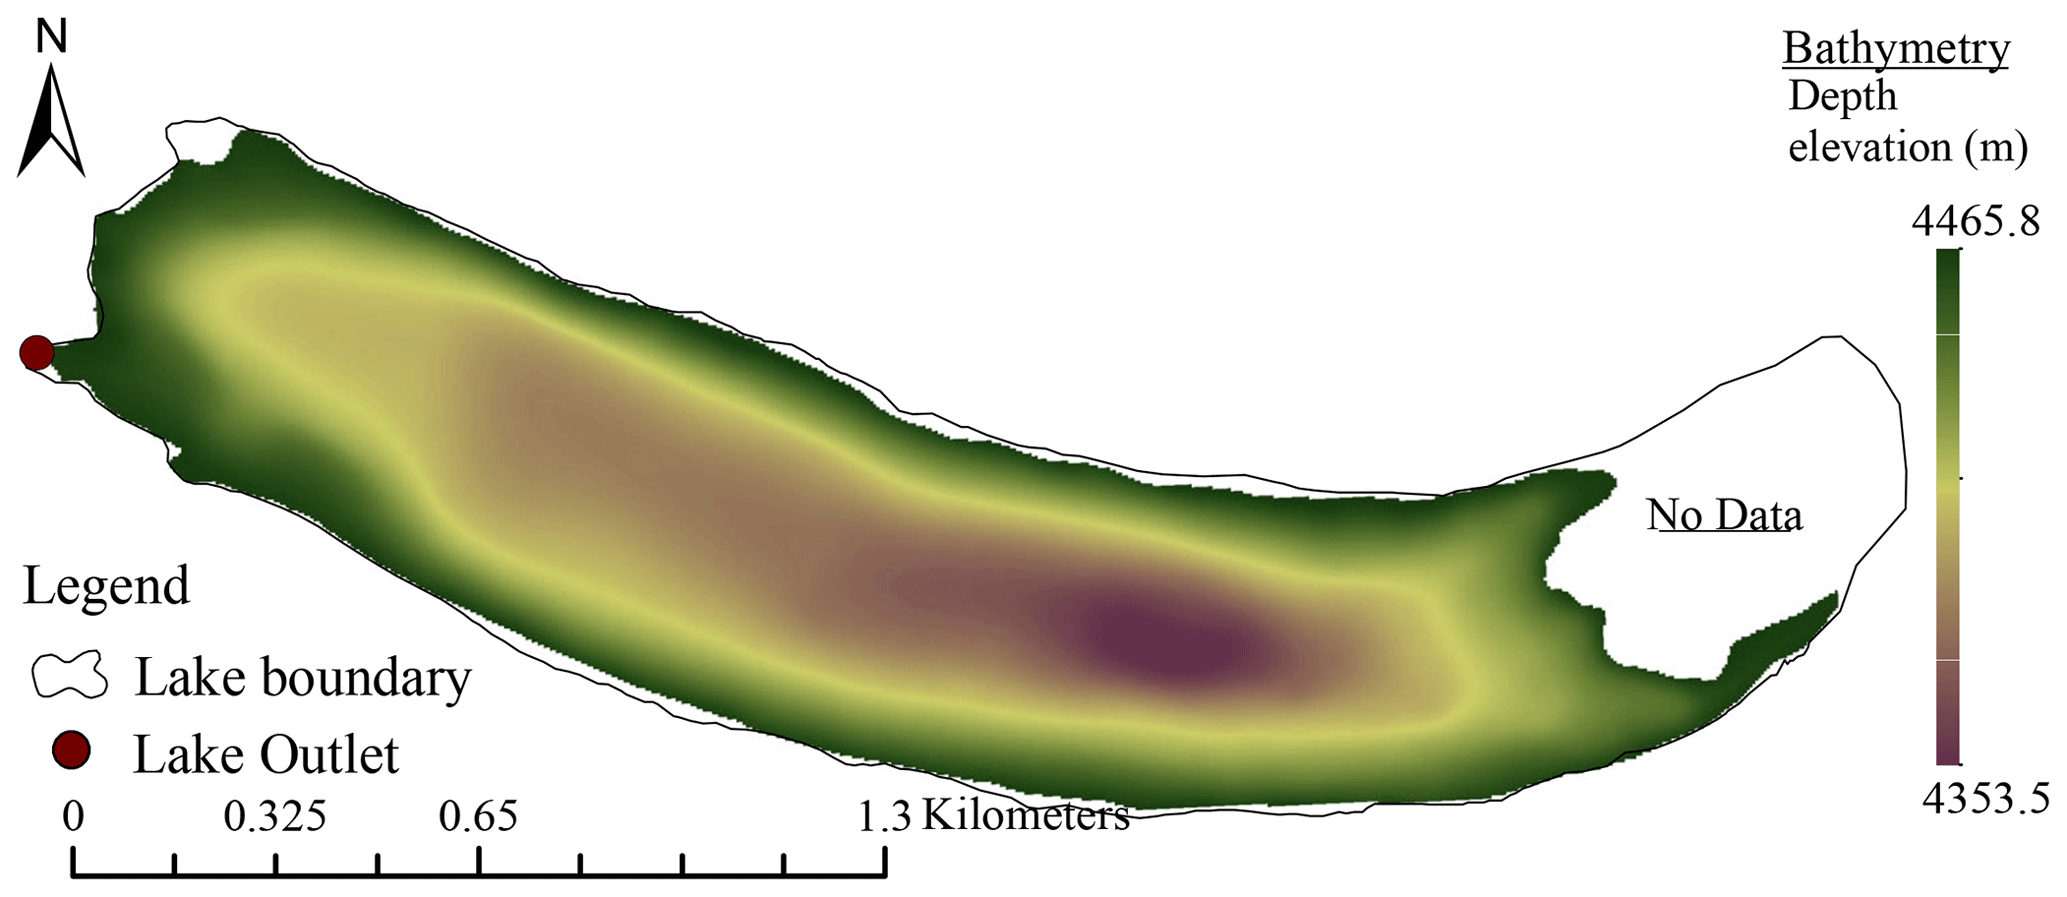
Figure 5The bathymetry of Luggye lake (data from NCHM).
Table 1Input parameters for the 1994 Luggye GLOF reconstruction and the Thorthomi GLOF prediction.
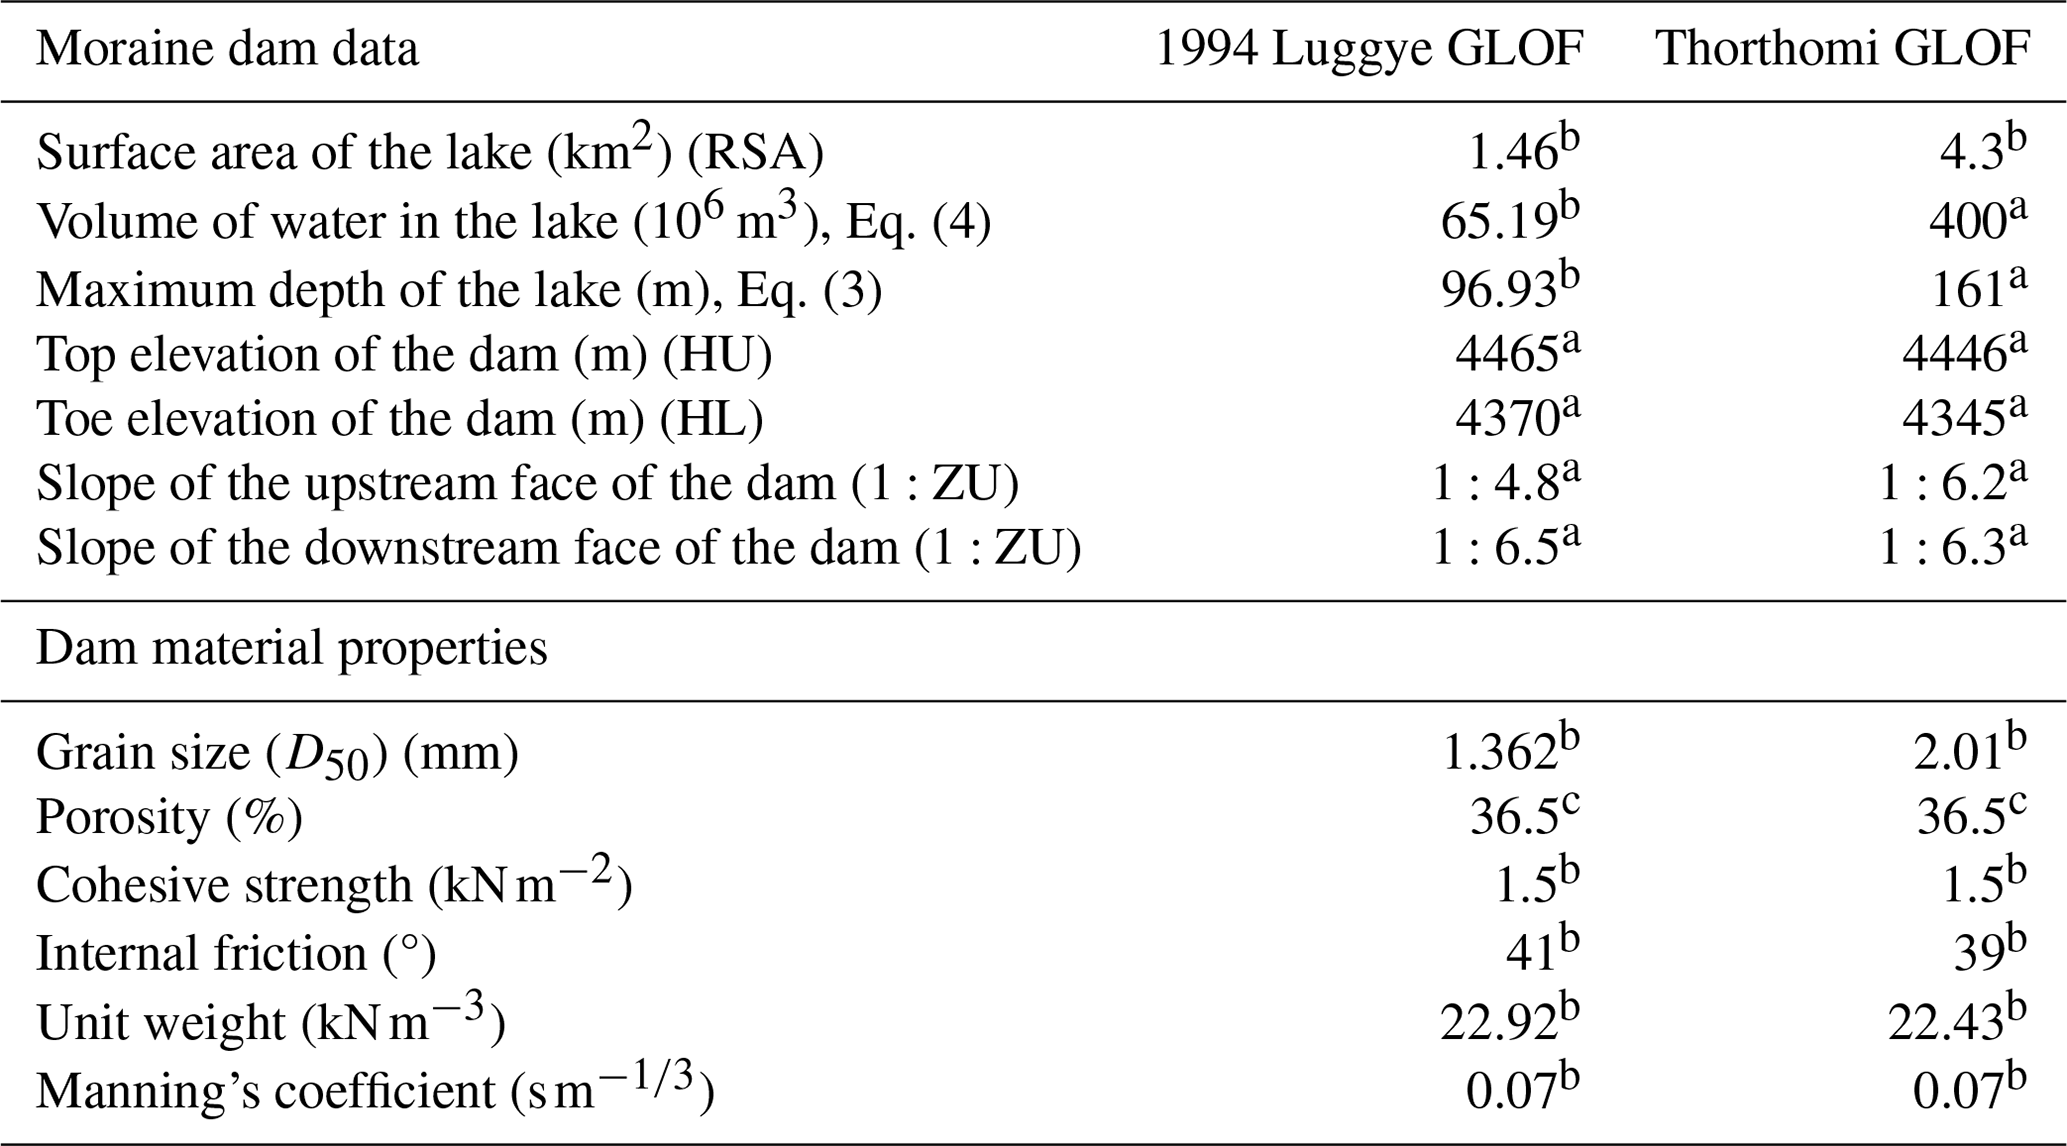
a Estimated in this study. b NCHM (2020). c Koike and Takenaka (2012).
3.3.3 The Thorthomi GLOF prediction
Breach initiation is assumed to occur due to an overtopping wave at the existing outlet (Fig. 3) induced by any probable triggering event. Moraine material properties and topographic data for the Thorthomi lake BREACH model were either estimated from available terrain data or adopted from available reports and research documents, and this is also listed in the right row of Table 1.
3.4 Flood routing
3.4.1 The hydrodynamic model
A hydrodynamic model is essential for understanding the characteristics of a flood wave caused by a GLOF propagating downstream, as well as for quantitatively evaluating the potential risks caused by a flood. To simulate the propagation of outflow from glacial lake breaches in Nepal, numerous studies, such as HEC-RAS used in Maskey et al. (2020), have employed various hydrodynamic models. Similar approaches that couple dam breach models to hydrodynamic models (e.g. Bajracharya et al., 2007; Koike and Takenaka, 2012; Westoby et al., 2015; Worni et al., 2014) have been performed for modelling the GLOF process chain in various regions.
Worni et al. (2014) provided a summary of various hydrodynamic models that have been used to model GLOFs. Discussed models include HEC-RAS, FLO-2D, BASEMENT, and Delft3D. The choice of a hydrodynamic model depends on factors such as the end objective, data availability, and the available budget. Each model has its own level of accuracy; however, the accuracy of results is primarily dependent on the precision of the elevation model, including channel geometry and floodplain topography. Errors in the elevation model can lead to inaccuracies in results (Casas et al., 2006; Xu et al., 2021).
HEC-RAS is a commonly used hydrodynamic model that allows users to perform 1D and 2D steady/unsteady flow simulations (Brunner, 2016b). We used the HEC-RAS to perform a 2D unsteady flow simulation for floods caused by a glacial lake dam breach. Since they represent spatially varied flood hydraulics (Horritt and Bates, 2001), the two-dimensional models employed are standard in flood modelling. In a 2D unsteady simulation, flow varies in time, along two spatial dimensions, and processes are predicted by the laws of conservation of mass (continuity) and the conservation of momentum for two horizontal directions. We used a full set of momentum equations (the shallow water equations) to simulate flooding as clear water flow. Although high-viscosity and hyper-concentrated (sediment entrained) flows are inherent to the GLOF phenomenon (Clague and Evans, 2000; Vuichard and Zimmermann, 1987), to simplify modelling complexity and data requirements, most studies (Hagg et al., 2021; Koike and Takenaka, 2012; Maskey et al., 2020; Rinzin et al., 2023) have simulated GLOFs as clear water flow.
Other important considerations in hydrodynamic modelling are Manning's roughness coefficient and channel geometry. Both have significant impacts in predicting inundation extent and flow characteristics (Mosquera-Machado and Ahmad, 2007; Ye et al., 2018; Zhu et al., 2019). Hagg et al. (2021) demonstrated the influence of Manning's roughness coefficient for glacial lake outburst floods from the Shintaphu glacial lake in Mochhu basin, Bhutan, and concluded that channel roughness is not essential for inundation extent but exerts a significant effect on flood velocity and flood arrival time.
Since such information is needed to estimate the area needed for evacuation and the lead time for evacuation, flood travel time and peak flow are essential parameters for early warning purposes. In this study, flood travel time was calculated based on timing of the breach outflow hydrograph and the flow hydrograph at the point of interest, when there was significant inundation depth and extent. Peak flow is the maximum simulated flow resulting from a dam breach.
3.4.2 Ground elevation models and pre-conditioning
The accuracy of hydrodynamic model results is heavily influenced by the quality of the elevation model used (Gyasi-Agyei et al., 1995; Yamazaki et al., 2014, 2017). Casas et al. (2006) demonstrated the effects of a topographic data source and resolution on flood peak discharge and the extent of inundation and then concluded that laser-based elevation data are a suitable source for hydraulic modelling. Similarly, the influence of grid size on inundation propagation and water depth under varied topographical settings in 2D modelling has been analysed (Tsubaki and Kawahara, 2013). Both fine grid size representing main topographic features of the floodplain and accurate elevations at each grid point are essential for simulating flood flow with less uncertainty. Therefore, using the best available elevation model for the hydrodynamic simulation of floods is essential.
Since an accurate elevation model is essential for accurate hydrodynamic simulations, various methods for correcting generic noise errors and biases originating from topography measurements have been proposed and have been used in elevation models prior to running hydrodynamic/hydrological analyses.
Below, we compare three different elevation models covering the study area. The first model, the Multi-Error-Removed Improved-Terrain (MERIT) Hydro DEM (Fig. 6a), was developed based on SRTM and AW3D DEM. Water layer data at a 3 arcsec resolution (∼90 m) were developed for river hydrology analyses at global, as well as at local, scales (Yamazaki et al., 2017, 2019). Other bias-corrected elevation data are the Forest And Buildings removed Copernicus DEM (FABDEM) (Fig. 6b), developed from Copernicus DEM (COPDEM), where the height of trees and buildings are removed using machine learning, and are also a preferable source for terrain data (Hawker et al., 2022). The AW3D digital surface model (DSM) (Fig. 6c) was jointly developed by the Remote Sensing Technology Centre (RESTEC) and the NTT DATA Corporation, utilising PRISM data acquired by the Advanced Land Observing Satellite (ALOS) of the Japan Aerospace Exploration Agency (JAXA). Rough-resolution DSMs are distributed by several organisations free of charge; however, for our study, we used the finer commercial DSM product, AW3D 2.5 m, as the primary source of topography. The cell size of the DSM for the focus area was approximately 2.2 m for both the X and Y directions and was projected to WGS84 UTM zone 45N. The AW3D 2.5 m DSM represents details of topography, especially in the river valley and in the developed flood plain, much better than other models.
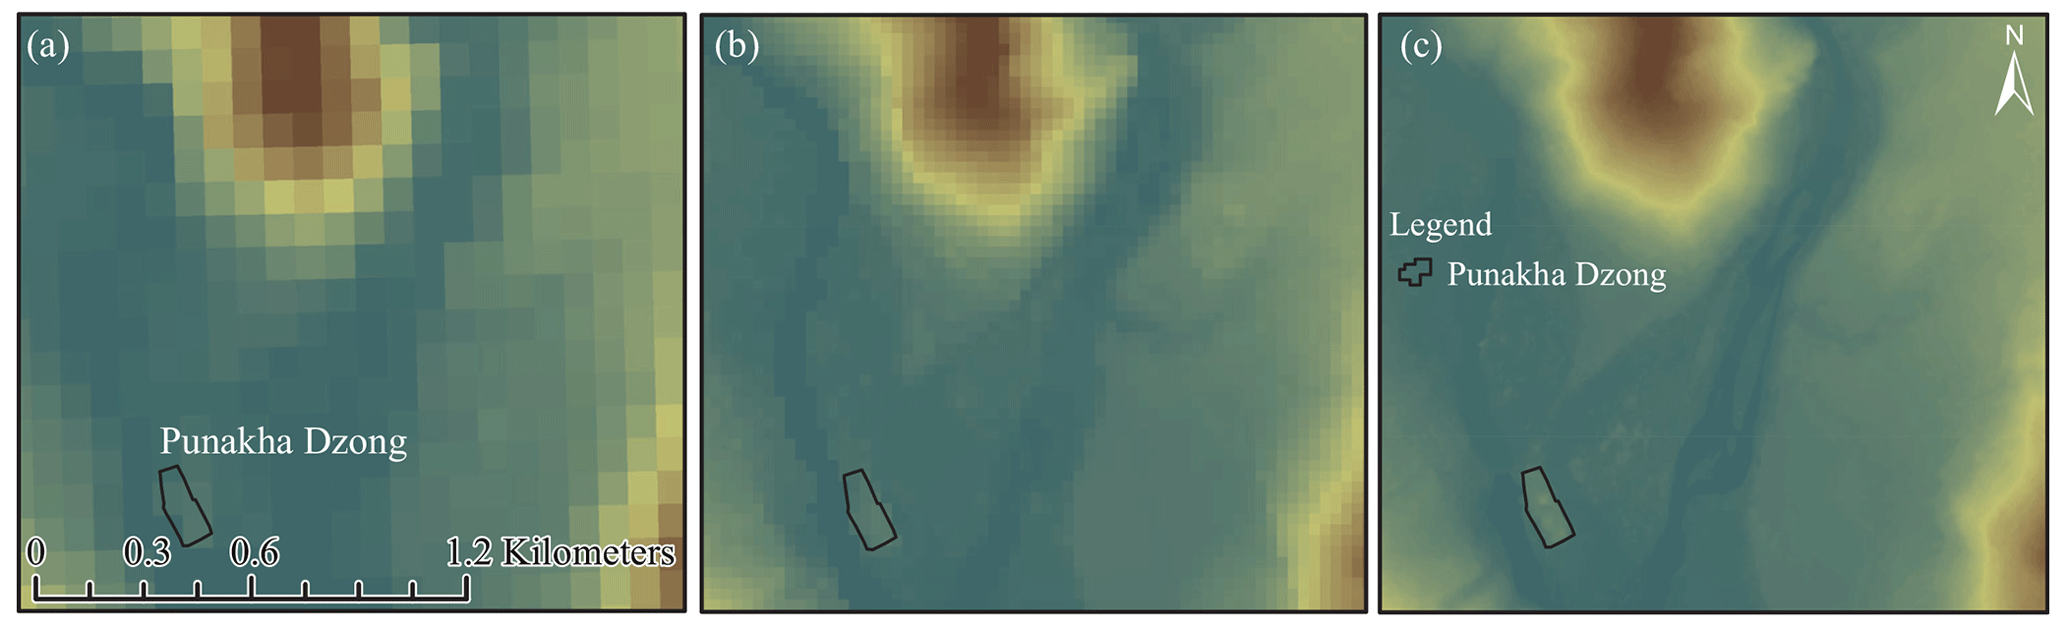
Figure 6The Punakha Dzong region as represented by three different terrain models: (a) the MERIT HydroDEM 90 m, (b) the FABDEM-30 m, and (c) the AW3D 2.5 m DSM.
Since the AW3D DSM was obtained using satellite photogrammetry, representations of the river bottom, especially in forested and deep gorge areas, are sometimes inaccurate. If we directly used topography in hydrodynamic modelling, the DSM covered structures along the river, as well as bridges crossing the river, disturbing flood water flow. To avoid such anomalies in the elevation model and in the hydrodynamic simulation results, a river channel delineation was performed. The presence of spikes within the DSM, along the river's path, can obstruct flood water flow, resulting in the formation of non-existent deep pools. One way to improve topography surrounding a river is the use of bathymetric survey data. However, no such survey has been conducted within the study area. To improve representation for the river channel, our study utilised a rule-based correction method.
The Agriculture Conservation Planning Framework (ACPF) is a GIS-based tool developed by the United States Department of Agriculture (USDA) to identify areas with impeded water flow and to improve hydrologic flow using flow direction and an accumulation analysis (Porter et al., 2016). While the ACPF is a valuable tool for hydrologic flow and watershed planning, it has limited applicability for terrain correction in hydrodynamic modelling because the ACPF does not allow users to define the bathymetry of a river channel.
Another widely used channel modification method is the inbuilt function of HEC-RAS. The Channel Design/Modification editor tool is a module used to modify an unrealistic cross-section or to introduce a user-defined channel cross-section (Brunner, 2016a). The tool effectively removes spikes in the elevation model along a river channel while maintaining the natural slope of the represented topography. The modified channel TIN (triangulated irregular network) can be overlain on the original DSM and exported as a single raster file with modified features. Rinzin et al. (2023) applied the method to modify terrain and to delineate river flow paths for a GLOF simulation. For our study, we used this tool to condition the DSM in the middle region of the model domain, a forested deep gorge, where huge spikes were included within the elevation model. The modification was only applied to the channel section, and the remaining portion was left as it was.
3.4.3 Implementation for GLOF reconstruction and prediction
Downstream propagation of the flood was simulated using the HEC-RAS model for the 1994 Luggye GLOF reconstruction. The calculation domain was defined by the 2D flow area. The overall size of the flow area was 64 km2. The domain was modelled using a 20 m resolution computational grid, consisting of 157 188 computational cells, and solved with a time step of 1 s. The elevation of each grid cell was specified based on a 2.2 m, hydro-conditioned digital surface model, and Manning's n was set to 0.035, in the range provided by the HEC-RAS manual (Brunner, 2016a). The dam breach outflow hydrograph obtained from the BREACH model was used as the upstream boundary; and normal depth, calculated based on downstream slopes derived from the DSM, was used as the downstream boundary condition.
For the Thorthomi GLOF prediction, we used a hydrodynamic model similar to the model used for the 1994 Luggye GLOF reconstruction. The domain was a bit shortened because the Thorthomi glacial lake is located 2 km downstream of the Luggye glacial lake. The overall size of the flow area was 62 km2. The domain was modelled using a 20 m resolution computational grid consisting of 153 790 computational cells with a temporal resolution of 1 s.
4.1 The 1994 Luggye GLOF reconstruction
4.1.1 Dam breach processes
Simulated peak flow (Qp) of the dam breach outflow hydrograph was 6030 m3 s−1, and 1.9 h (∼114 min) was required to reach peak flow (the time to peak, Tp) (Fig. 7a). The volume of the GLOF and the reduction of lake water level due to the event were 21×106 m3 and 19 m, respectively, in agreement with the findings of Fujita et al. (2008), which was based on a combination of in situ observations and remote-sensing data. Dimensions for the estimated breach of the dam are provided in Fig. 7b.
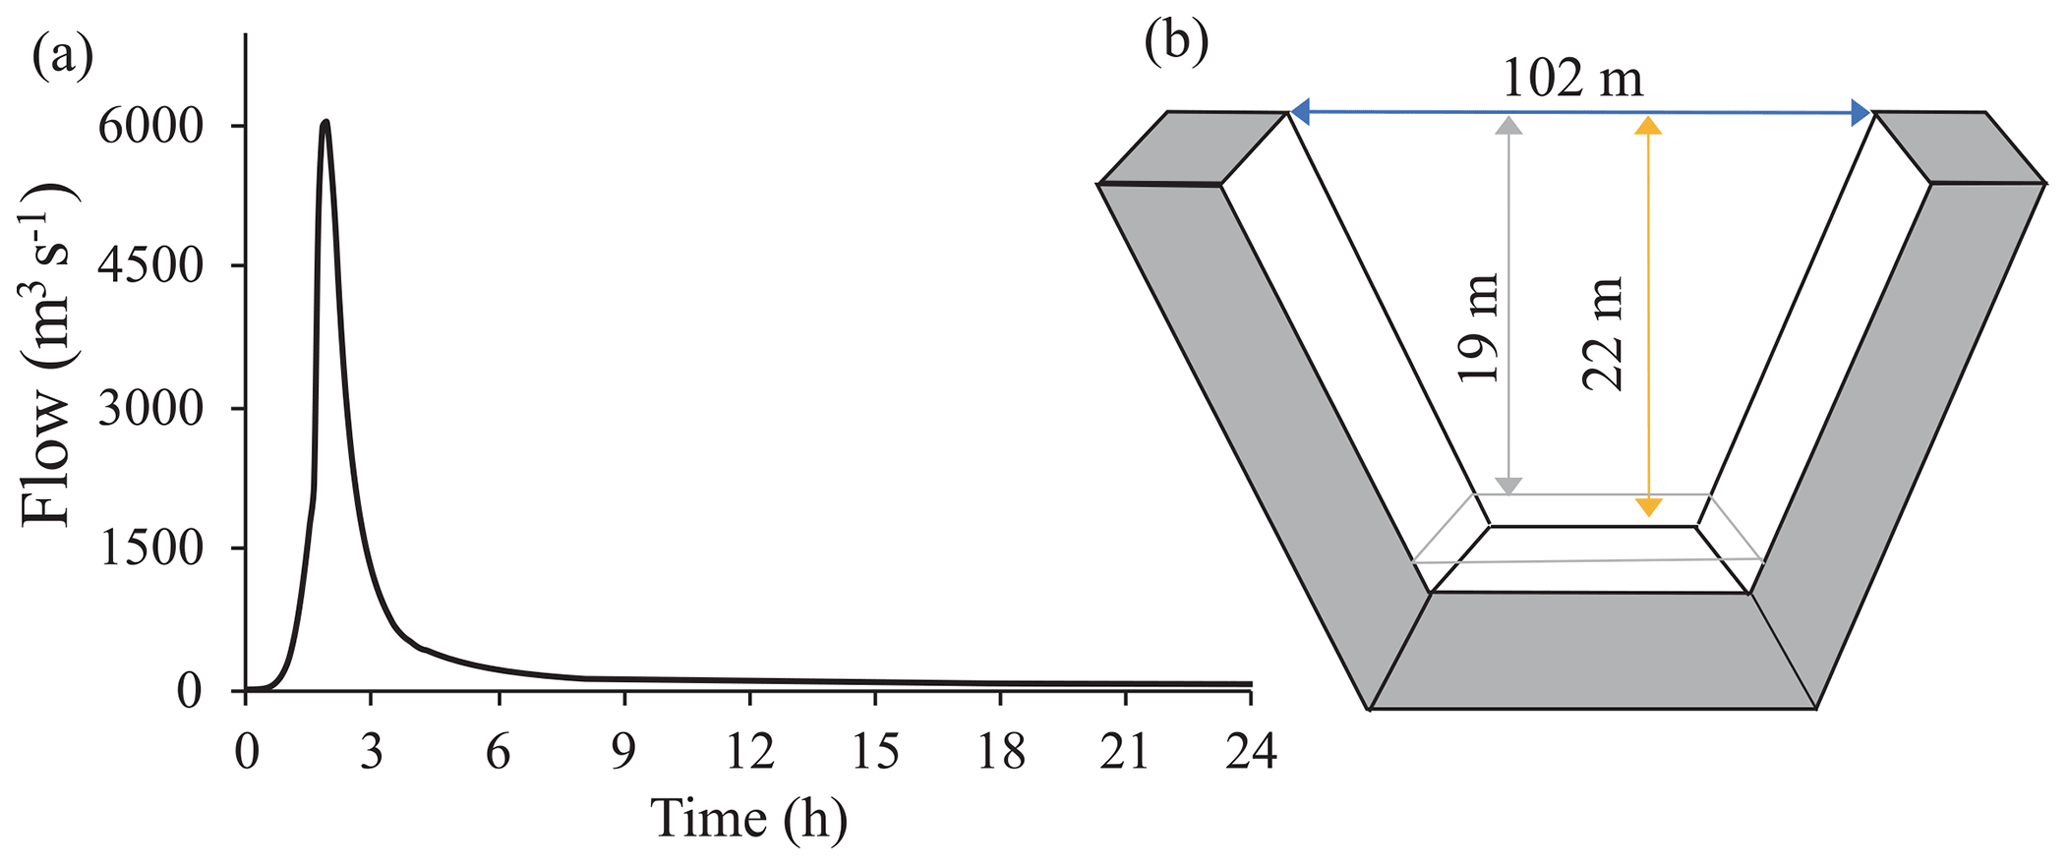
Figure 7(a) A breach outflow hydrograph from the BREACH model and (b) an illustration of breach parameters, breach width ( ), breach depth (
 ), and the change in water surface elevation (
 ).
).
4.1.2 Downstream peak flow and flood travel time
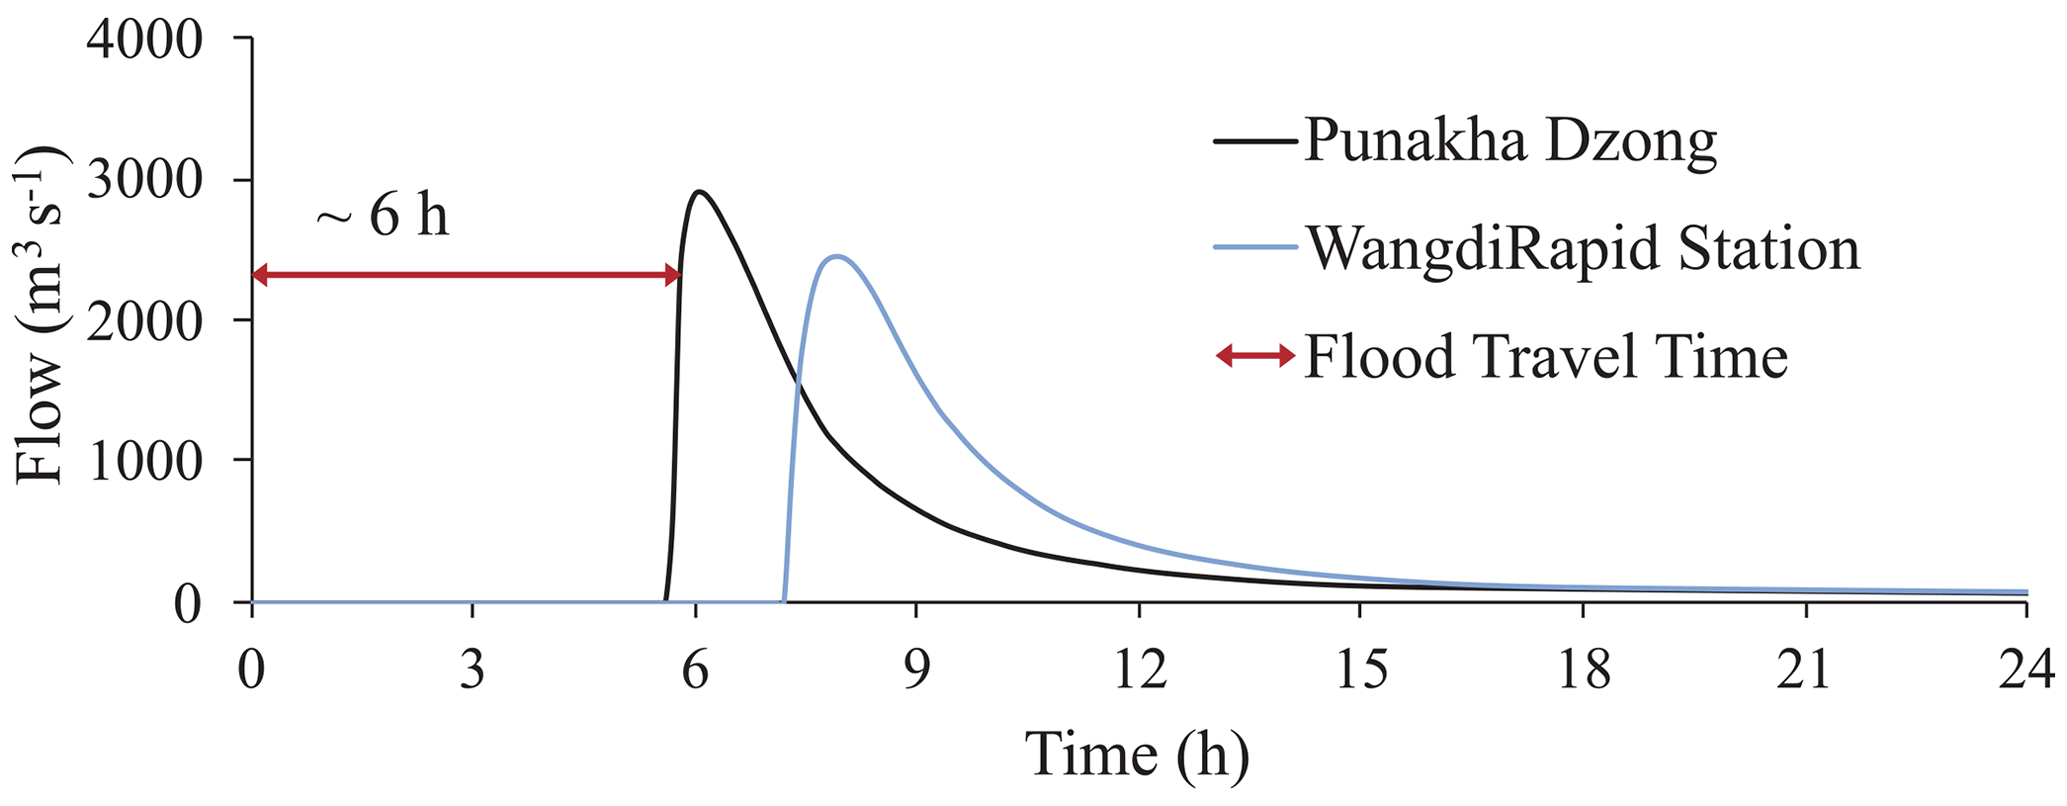
Flow hydrographs at various locations along the flow path are provided in Fig. 8. Conforming to the findings of Meyer et al. (2006), after approximately 6 h, the GLOF had a peak discharge of 2897 m3 s−1 as it reached Punakha Dzong, located 93 km downstream of the lake. Peak flow at the WangdiRapid station (shown in Fig. 2c), 15 km downstream of Punakha Dzong, was 2455 m3 s−1, close to the recorded value of 2539 m3 s−1. Here, the recorded flow rate included the contribution of normal flow from tributaries, which was not accounted for in our analysis. Good agreement of results for simulated flow and flood travel time with observed data, as well as previous studies, indicated that the performance of the employed models and the modelling approach were adequate and capable of yielding satisfactory results for predictive modelling of the target lake. The total inundated area along the basin was approximately 13.1 km2.
4.2 Future Thorthomi GLOF prediction
4.2.1 Lake bathymetry
The estimated volume and maximum depth of Thorthomi lake based on Eqs. (3) and (4) were 400×106 m3 and 161 m, respectively (the top right of Table 1). The estimated volume and maximum depth of Thorthomi lake falls within the predicted band, considering a 95 % confidence level. The utilised equations showed a good relationship between area and volume and between and area and maximum depth, with the prediction of 400×106 m3 for the mean and 281×106 m3 and 560×106 m3 for the lower bound and the upper bound, respectively. The prediction range for maximum depth was 161 m for the mean prediction (130 m and 270 m for the lower bound and the upper bound, respectively). Compared to other glacial lakes in Bhutan, the estimated parameters indicate that the Thorthomi glacial lake is one of the largest and deepest lakes. The bathymetry of Thorthomi lake, estimated based on the above parameters, is provided in Fig. 9.
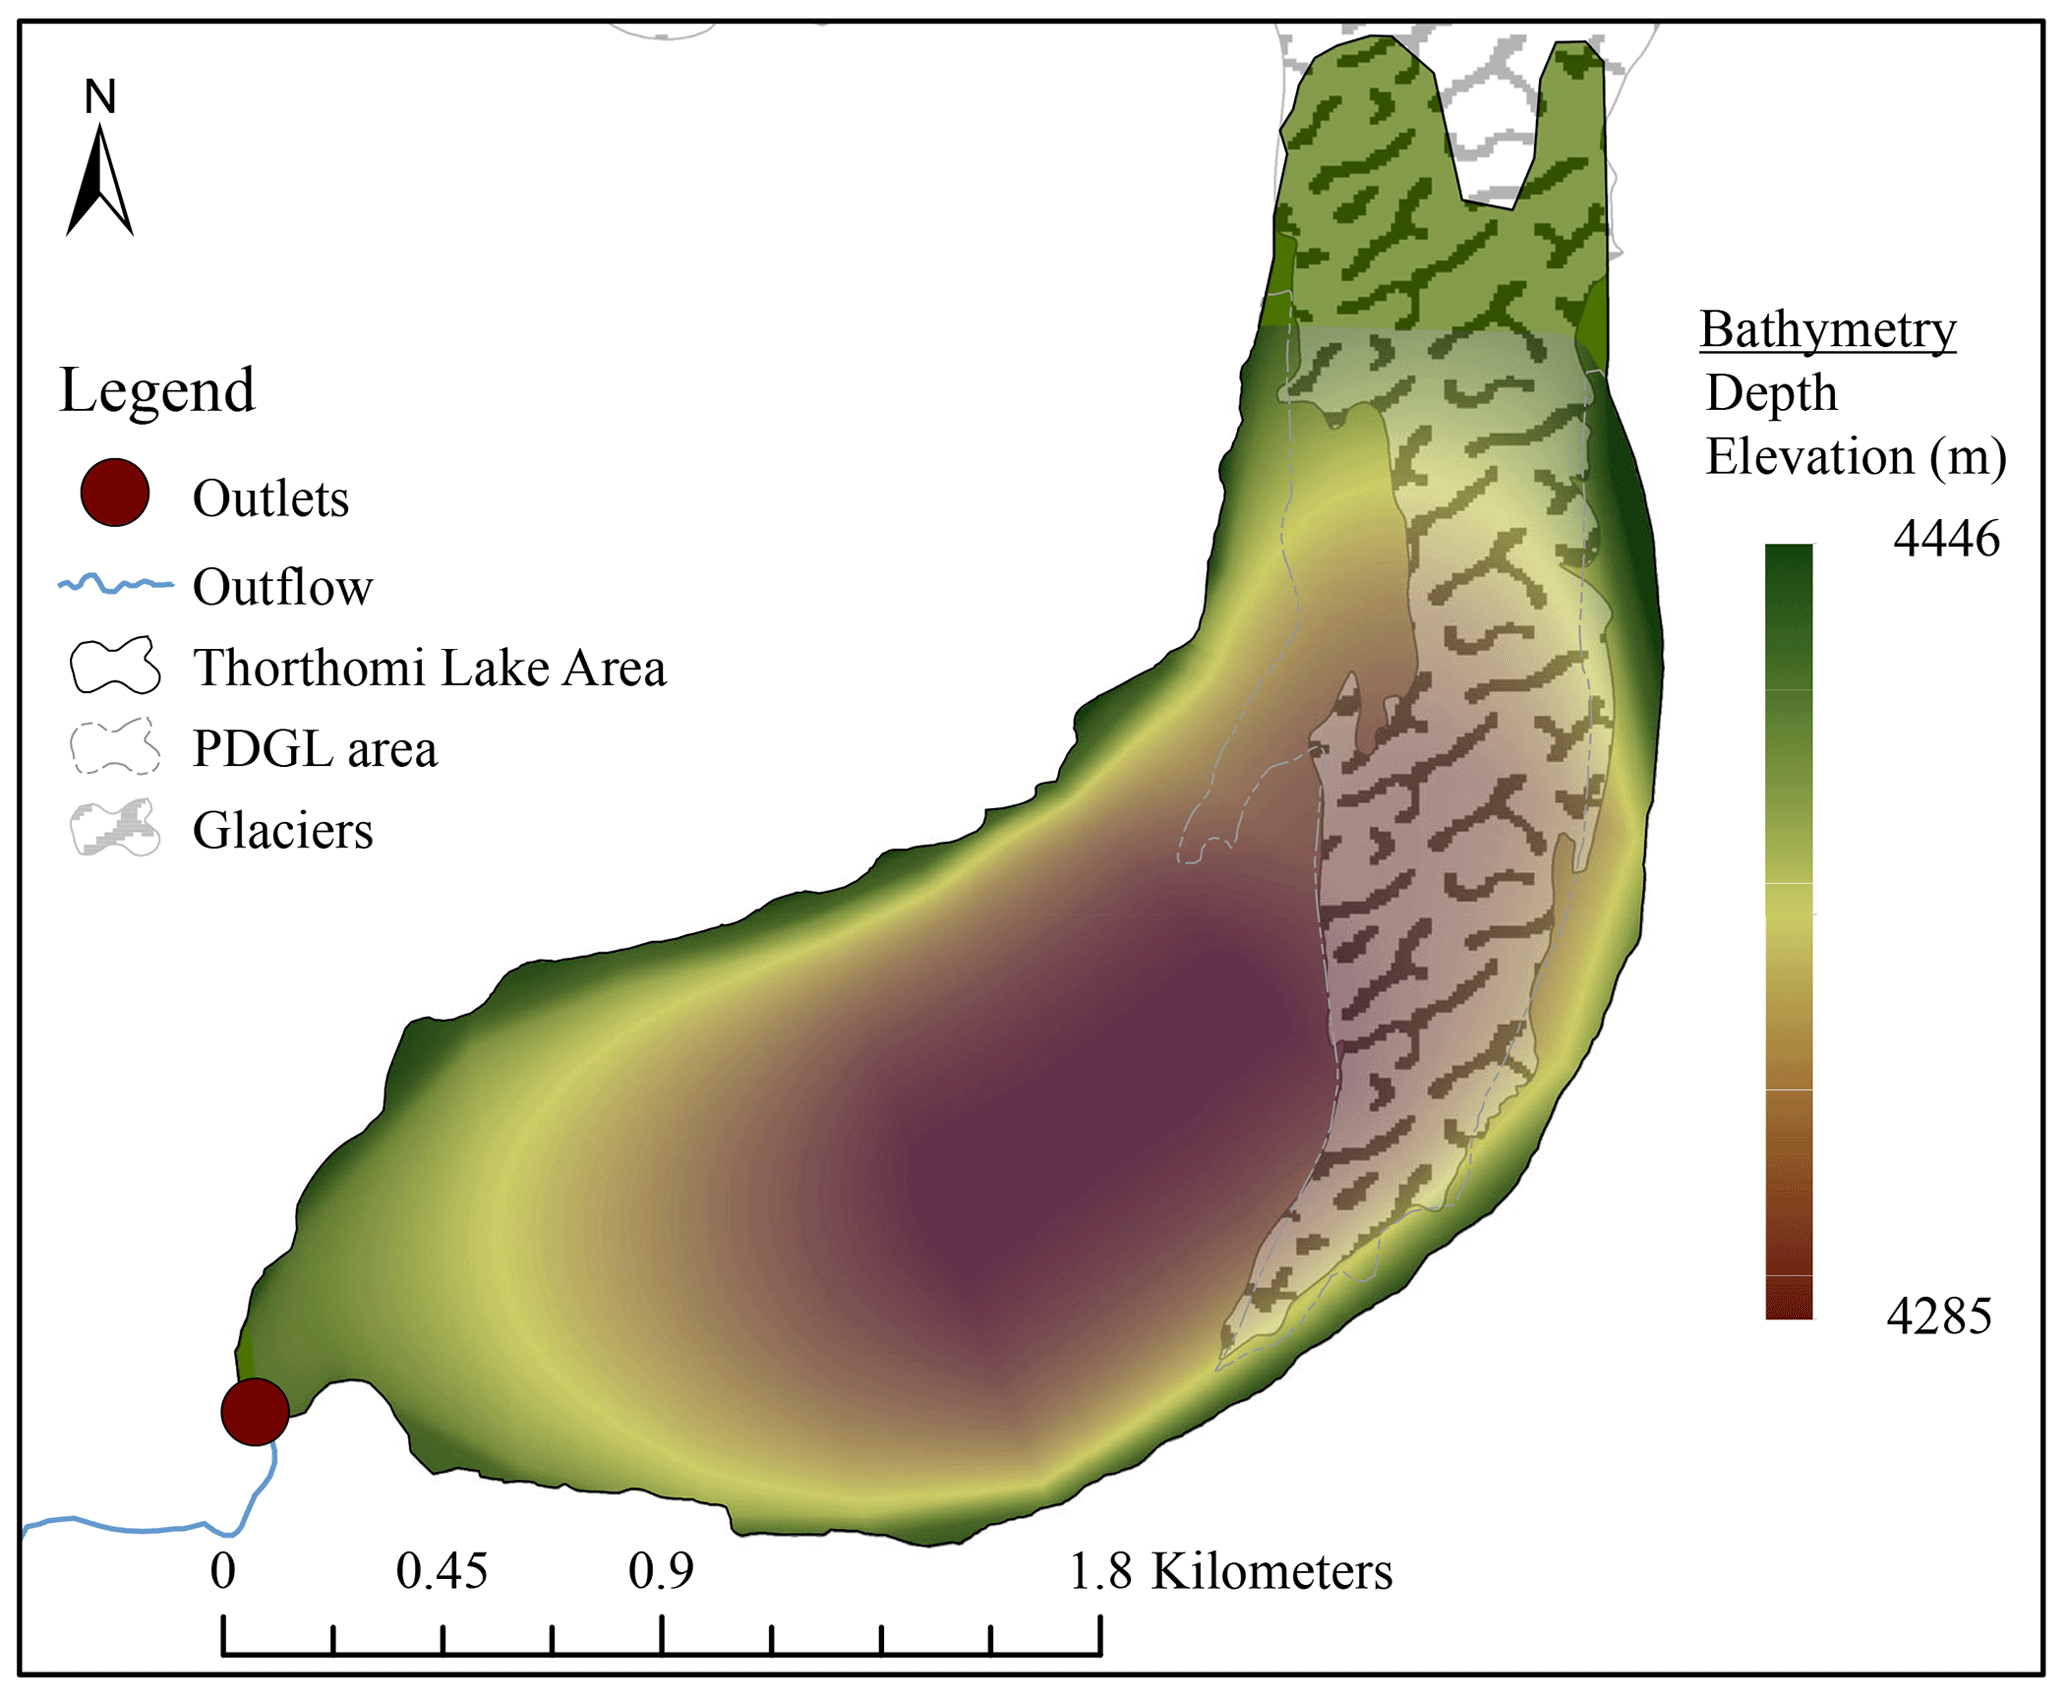
Figure 9The estimated bathymetry of Thorthomi lake.
A recent study from Nepal proposed a glacial lake volume estimation equation by considering the width and length ratio of the lake (Qi et al., 2022). Based on the equation provided in Qi et al. (2022), the water volume of Thorthomi lake can be estimated as 227×106 m3. This volume is substantially small compared to the volume estimated by Eq. (4). The discrepancy may be related to the dataset used for each study, namely Eq. (4) is based on lakes in Bhutan, Nepal, and Tibet; and Qi et al. (2022) is based on lakes in the Peruvian Andes and other areas, including non-moraine-dammed lakes.
4.2.2 Dam breach processes
Different dam breach scenarios for maximum breach and a partial breach for a half breach width and depth (50 % of maximum width and depth) were simulated to ascertain the potential risk under various breaching possibilities, including a partial dam breach, which occurred in 1994 (e.g. the 1994 Luggye GLOF). Simulated peak flow (Qp) resulting from the Thorthomi dam breach under different breach scenarios ranged from 9700 m3 s−1 (for a 50 % breach depth) to 16 360 m3 s−1 (for maximum breach width and depth), with a time to peak (Tp) of 3.4 to 4 h, respectively (Fig. 10a). The bathymetry of the lake and the topography of the moraine dam dictate the total lake drawdown depth and the volume of the outburst flood. In this study, we estimated that 100 m of lake water depth will be lowered before the breach outflow channel becomes sufficiently stable, after sending 283×106 m3 (approximately 70 % of estimated lake water) of flood water downstream (Fig. 10b). The breach outflow channel was assumed to be stable when its bottom elevation reached the natural bed level of the downstream channel and down-cutting ceased.
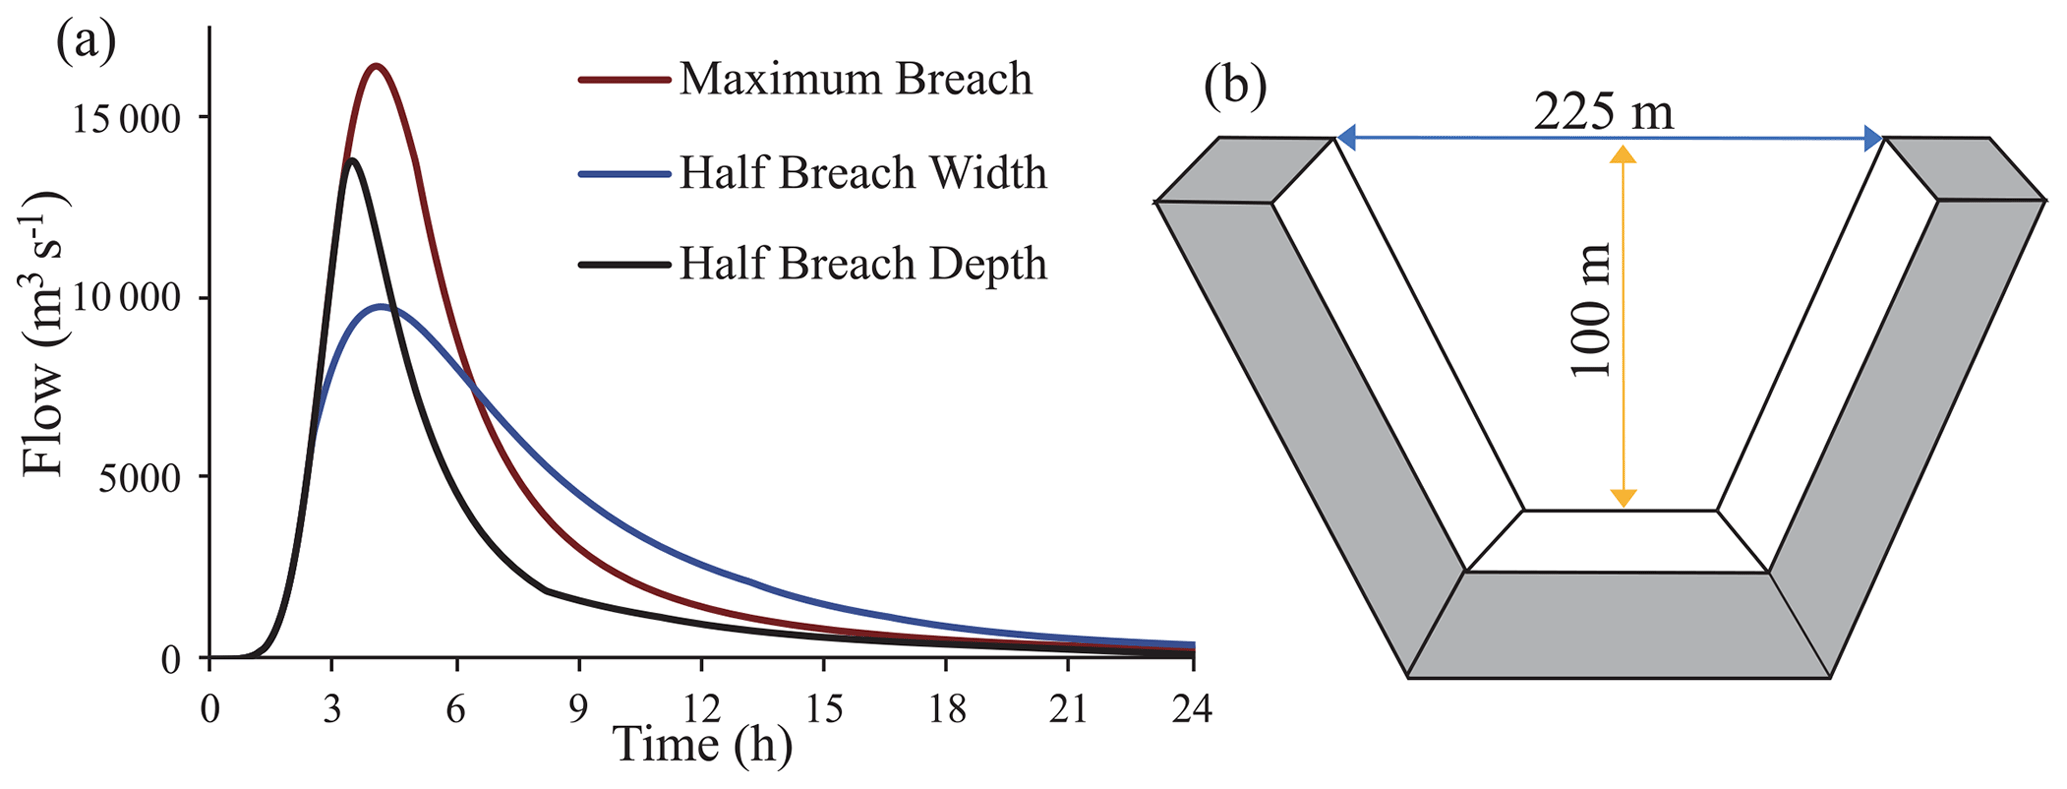
Figure 10(a) A dam breach outflow hydrograph obtained from the BREACH model for three different scenarios and (b) breach parameters, breach width (), and breach depth () in metres for the maximum breach scenario.
4.3 Downstream peak flow and flood travel time
The simulated flow hydrographs for three different scenarios at eight major settlement areas are provided in Fig. 11. Peak flow of the GLOF gradually attenuated as it propagated downstream. Peak flow at Punakha Dzong ranged from 8900 to 14 130 m3 s−1 and decreased from 8200 to 11 500 m3 s−1 when it arrived at the hydropower plant (PHPA-I).

Figure 11A simulated flow hydrograph at important locations, derived from the HEC-RAS; result for each scenario (max: maximum breach; BRD-50 %: half of maximum breach depth; BRW-50 %: half of maximum breach width).
A schematic representation of an approximate distance, peak flow, averaged channel slope, and the estimated flood travel time for a maximum breach condition is provided in Fig. 12 (refer to Sect. 3.4.1 for the definition of the peak flow and flood travel time in this study). The estimated peak flow at Punakha Dzong, 14 130 m3 s−1, is expected to be over 5 times higher than the 1994 Luggye GLOF (the recorded value is 2539 m3 s−1, and the value estimated in this study is 2455 m3 s−1).
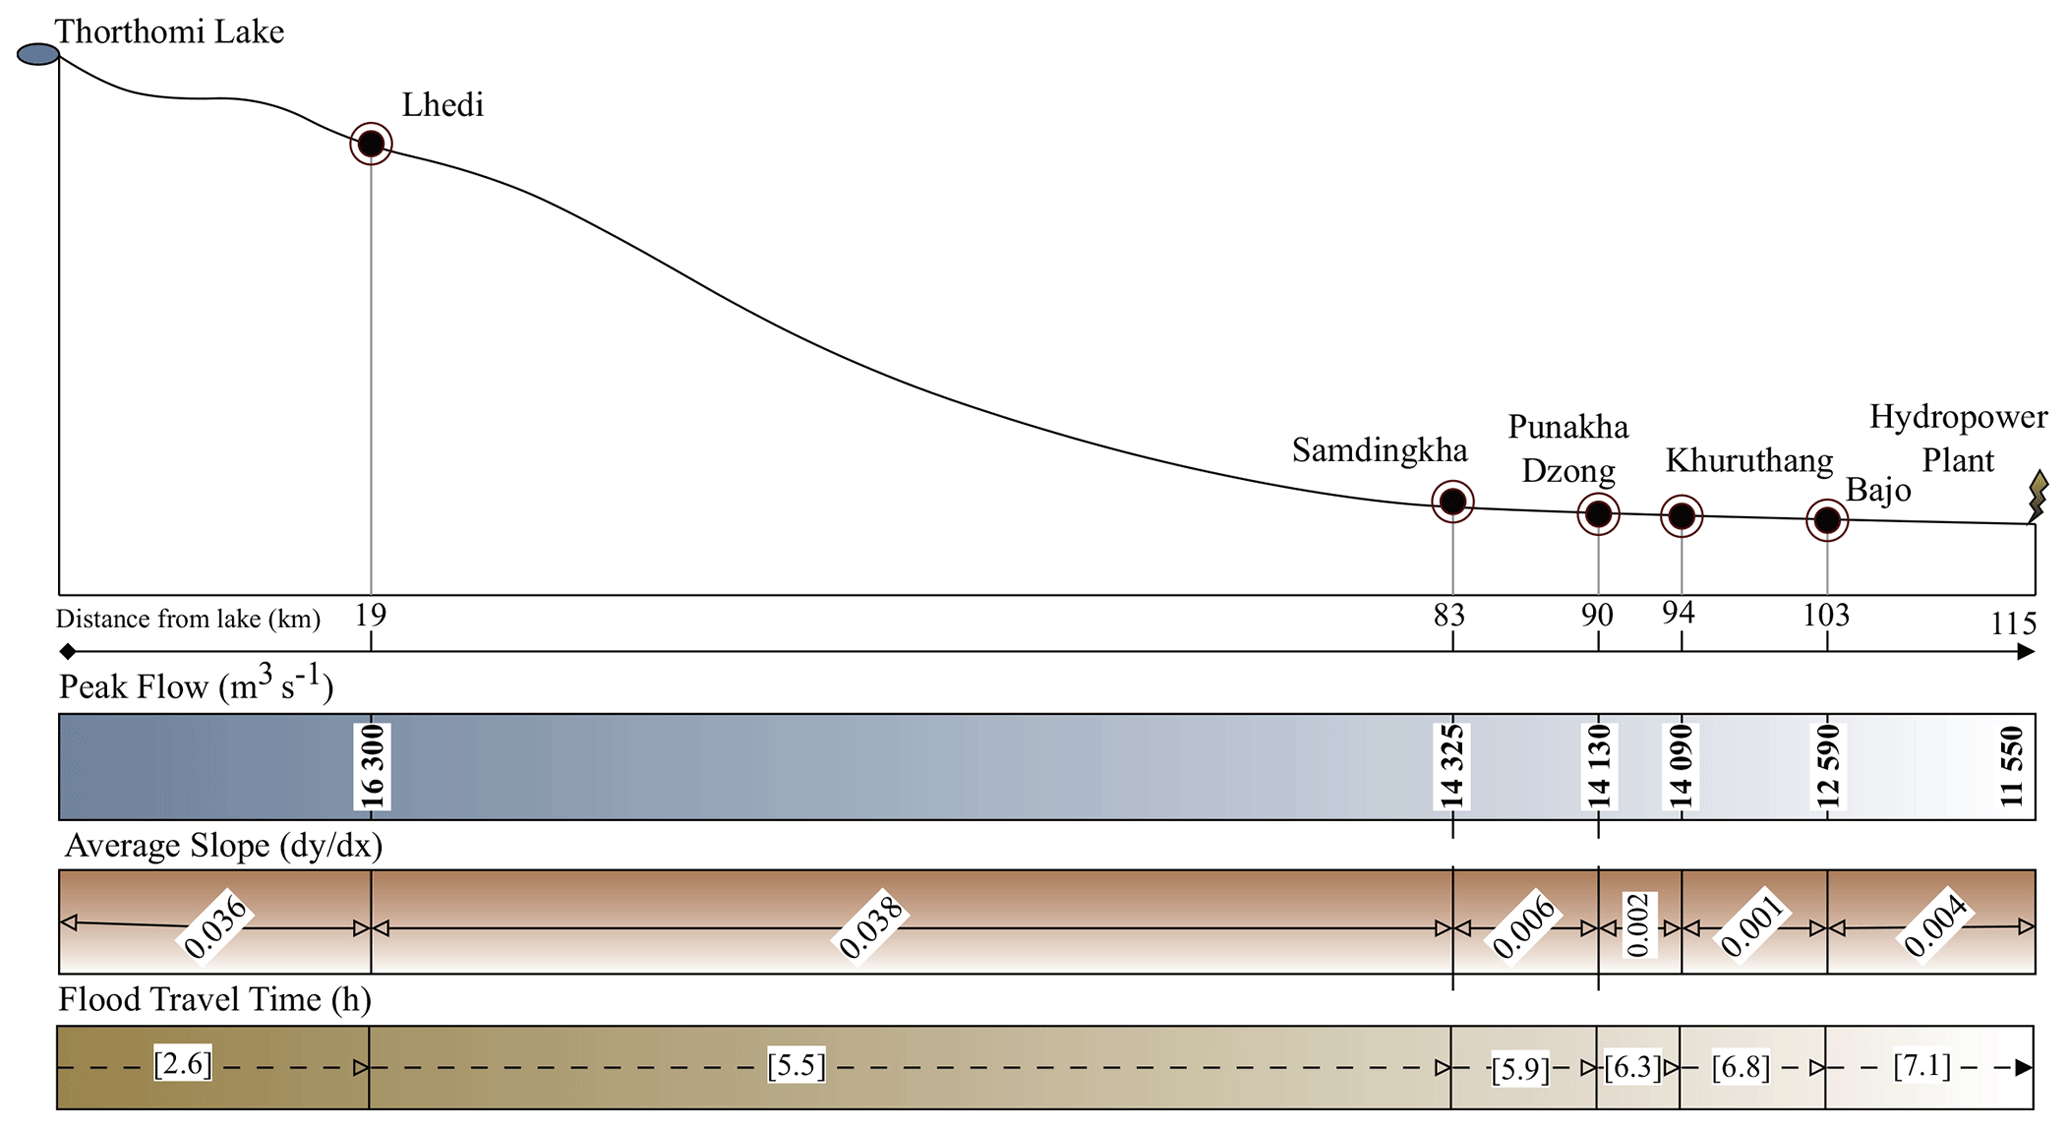
Figure 12A schematic representation of flood parameters at six important locations along the flow path for the maximum breach scenario.
5.1 Inundation hazard in five vulnerable areas under the maximum breach scenario
The flood depth distribution, highlighting five vulnerable areas for a maximum breach scenario, is provided in Fig. 13. The villages of Thanza, Toncho, and Lhedi, located in the northernmost part of the study area (Fig. 2), are expected to be inundated under a Thorthomi GLOF scenario. The 1994 Luggye GLOF also caused major damage to these settlement areas, but a Thorthomi GLOF is expected to cause more severe damage due to larger flood volume and shorter lead time. Major settlements along the river basin lie in the lower valleys of the Punakha and Wangdue districts, where large areas are expected to be flooded. Major towns and settlements, such as Samdingkha, Khuruthang, and Bajo, are expected to be inundated. The Mochhu river converges with the Phochhu river at the top left of Fig. 13c. Substantial overflow surrounding the Mochhu river, around the confluence, has been predicted. This result is due to backwater flow from the Phochhu river. Water flow from the Mochhu river is not easy to accurately estimate in advance and was not accounted for in this study, so inundation surrounding Punakha Dzong may be underestimated. However, the contribution of water from the Mochhu river can be negligible because the base flow of the Mochhu river is approximately 100 m3 s−1, which is substantially small compared to estimated peak flow in this area, 14 130 m3 s−1. Total inundated area due to a Thorthomi GLOF, with a maximum breach, was estimated to be approximately 22 km2, which is almost twice the area inundated under the Luggye GLOF simulation (13.1 km2, estimated in this study).
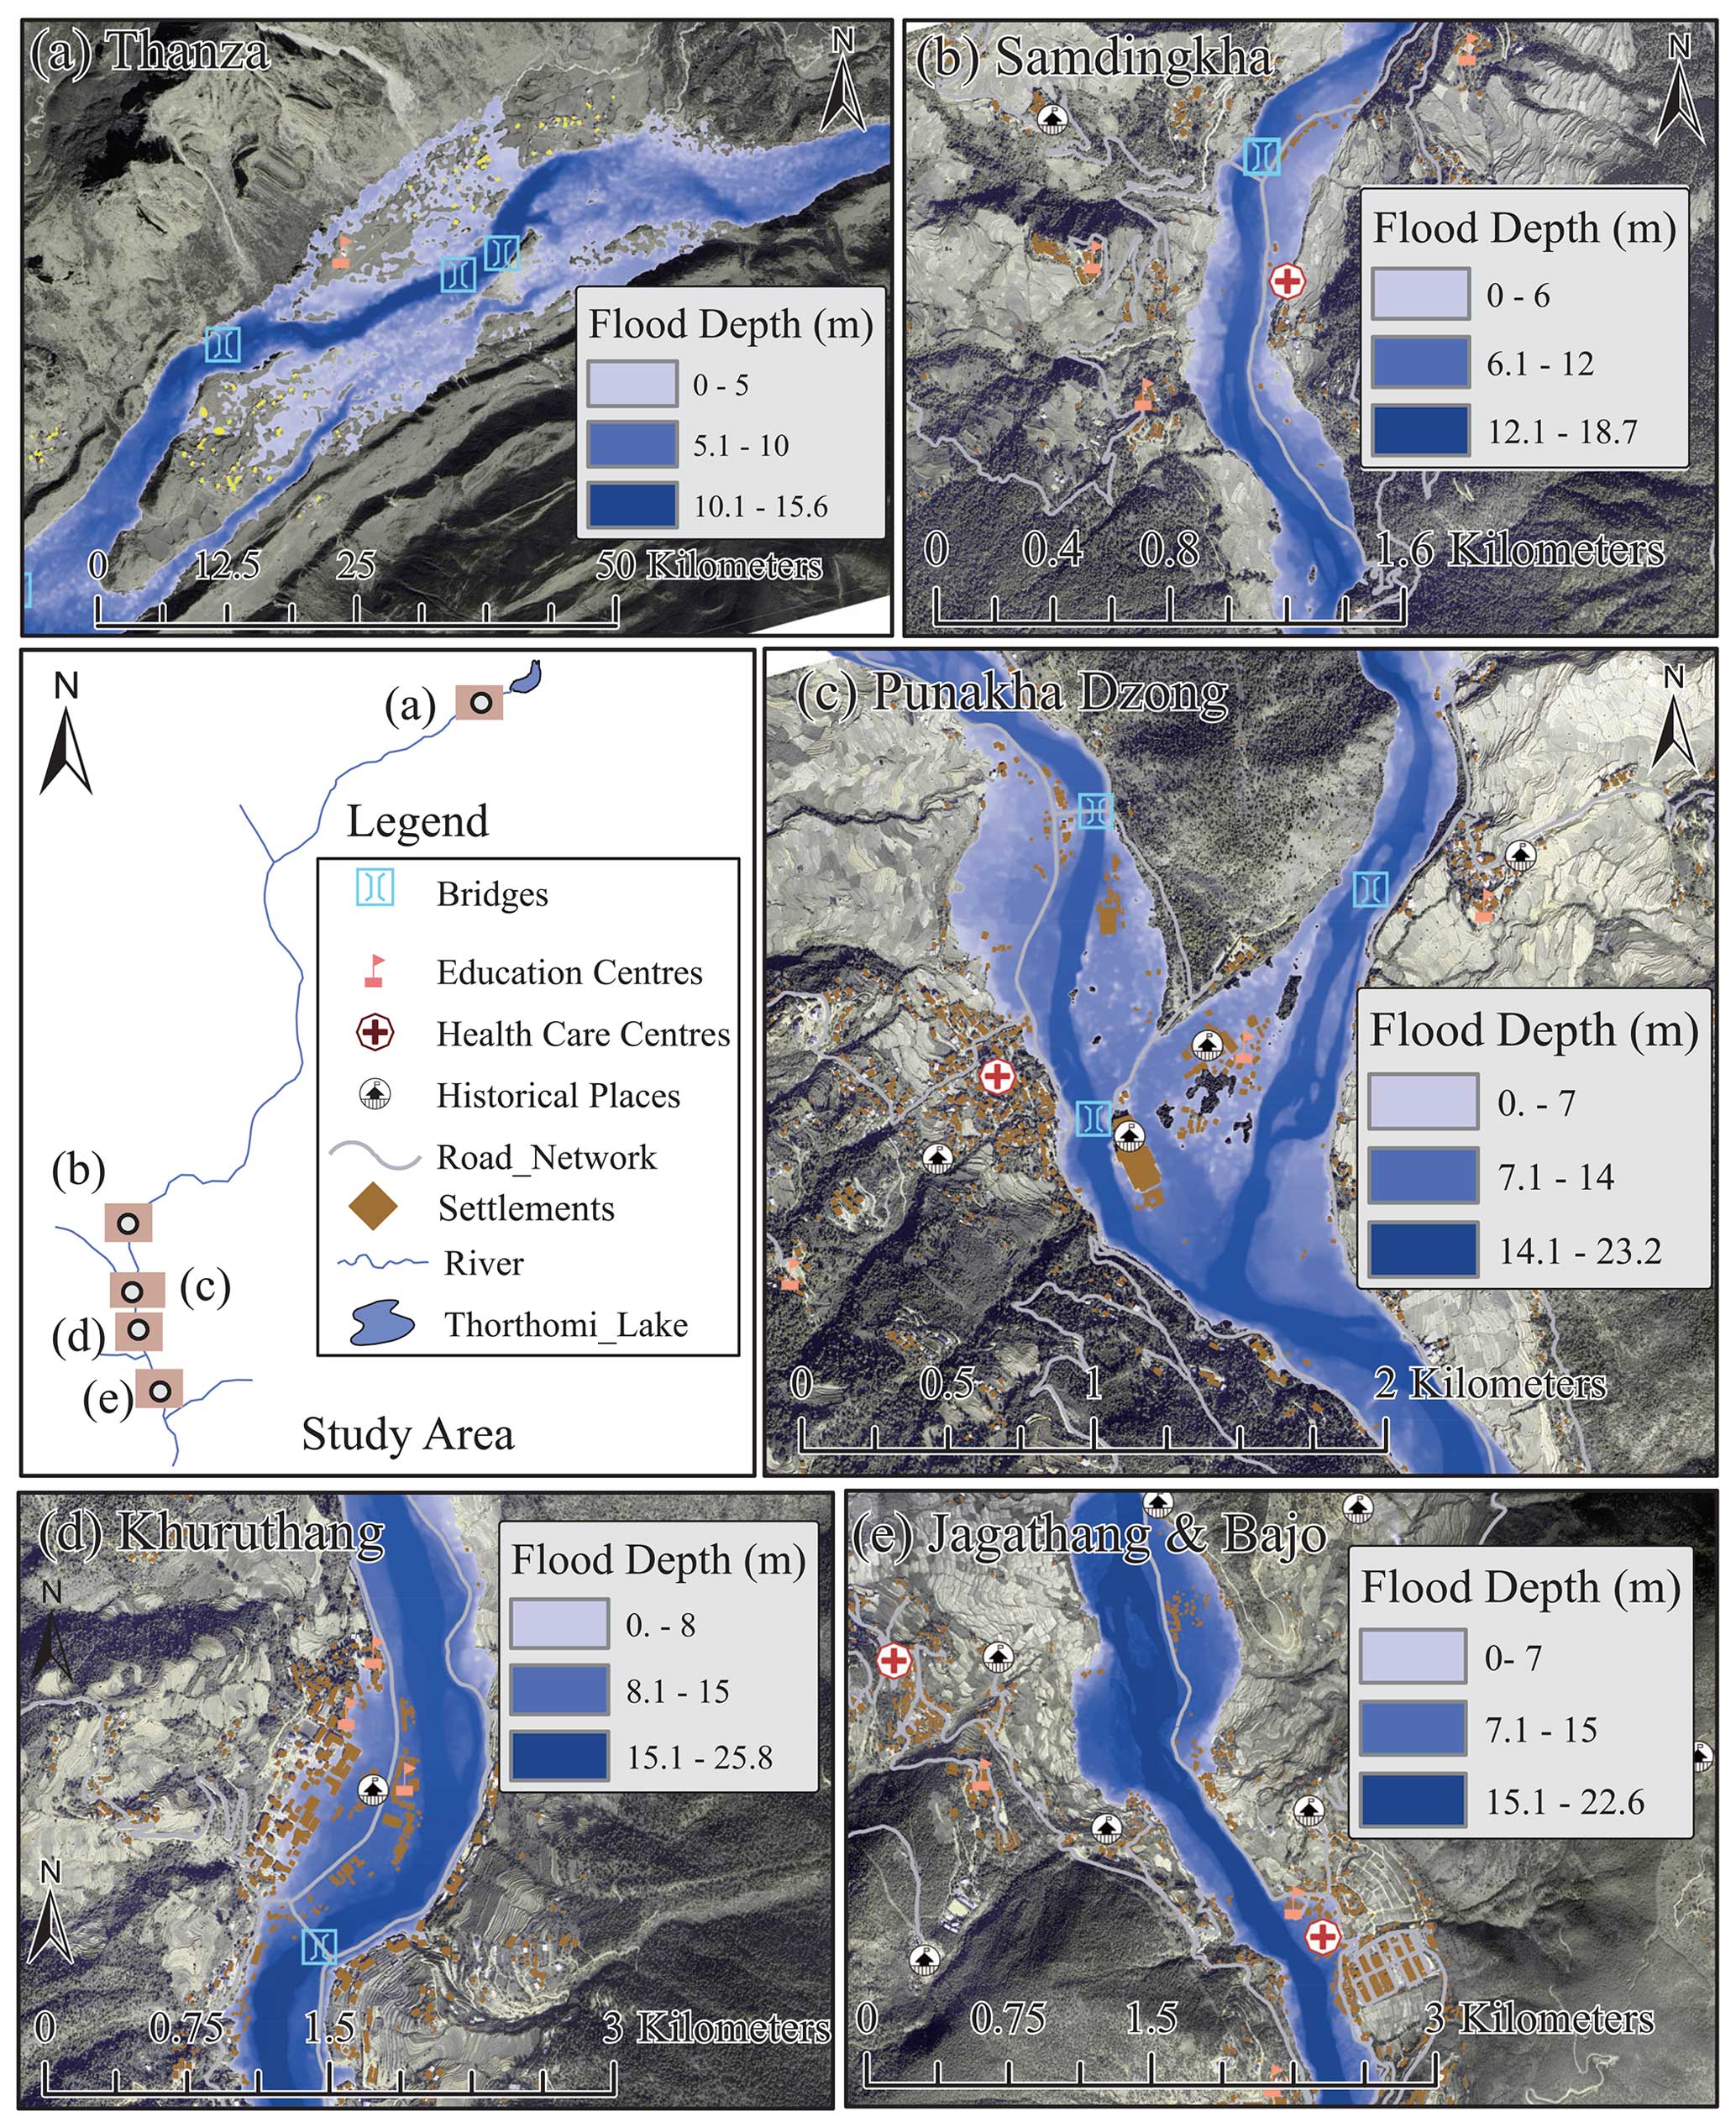
Figure 13A maximum GLOF inundation map of the study area under the maximum breach scenario. Map data: © Google Earth 2023, CNES/Airbus, Maxar Technologies.
5.2 A comparison between three scenarios
Figure 14 compares the maximum inundation depth and extent for three different scenarios for the town of Khuruthang. Simulation results for the three scenarios considered in this study revealed that the overall inundation extent and flood depths were higher for the maximum breach scenario. However, the depth and flood extent for the two other scenarios were comparable to the maximum breach scenario. The results indicate that even for a partial breach of the moraine dam, substantial damage within the downstream settlement areas (Punakha and Wangdue) is expected. The results imply that the difference in glacial lake bathymetry may also affect the maximum inundation in downstream areas but is not very sensitive because of the nature of the GLOF event (consisting of a rapid dam breach process and flood routing in steep valleys).
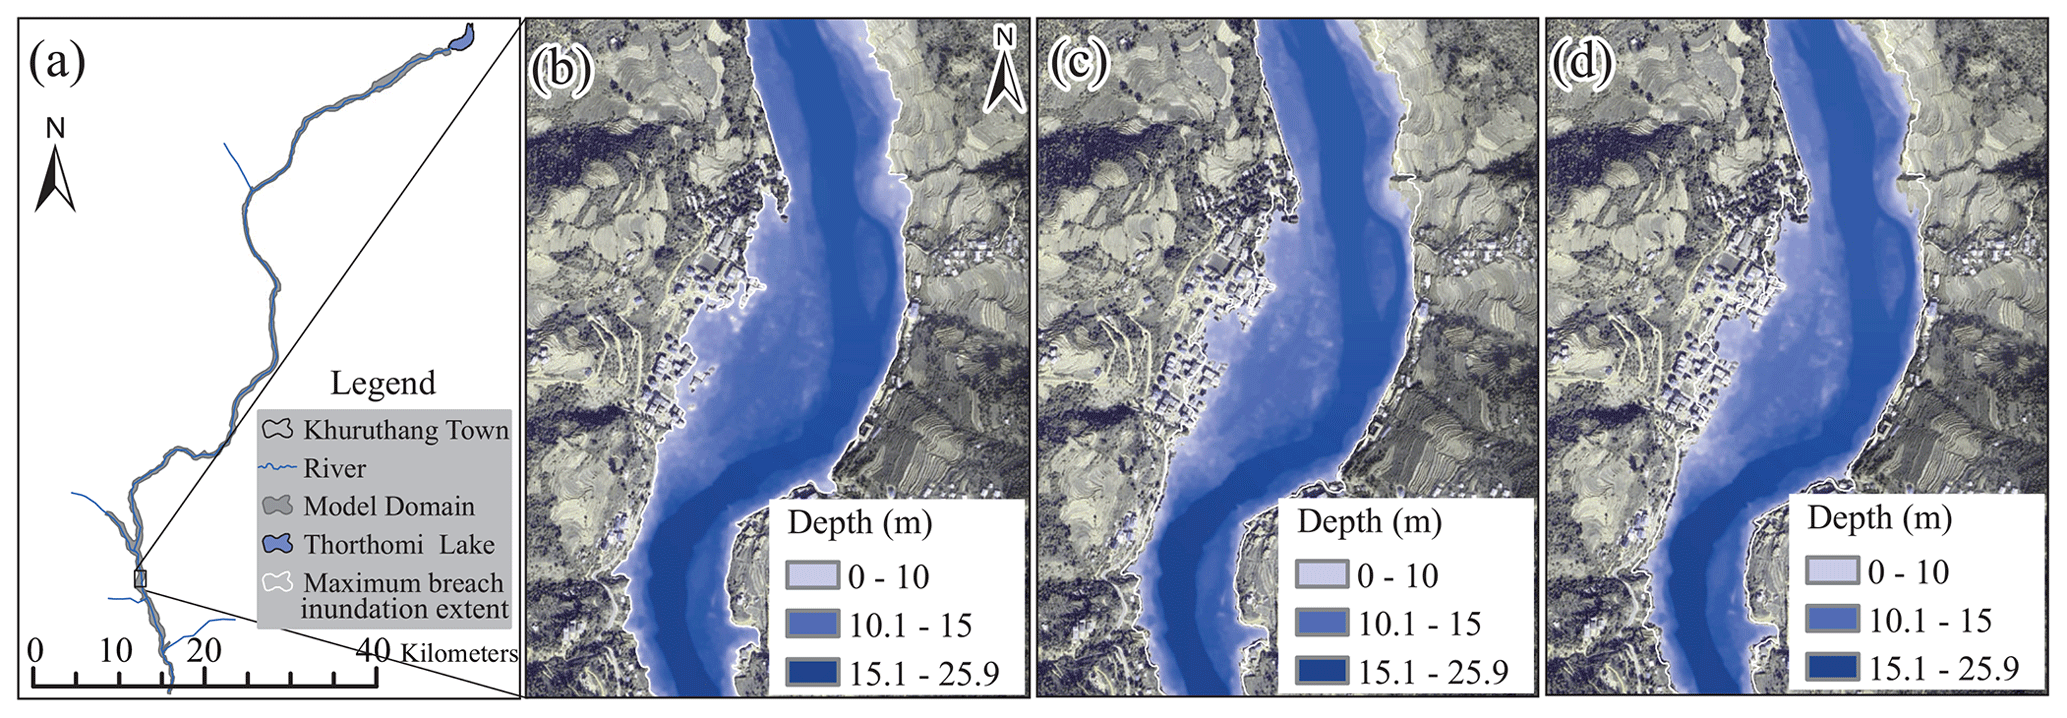
Figure 14A comparison of inundation depth and extent for three breach scenarios within the Khuruthang study area. (a) A model domain highlighting Khuruthang town. (b) The maximum breach scenario. (c) A 50 % breach depth scenario. (d) A 50 % breach width scenario. Map data: © Google Earth 2023, CNES/Airbus, Maxar Technologies.
5.3 Time series change of flood depth distribution surrounding Punakha Dzong
The spatial distribution of flood depth for a maximum breach scenario, at different time steps, for Punakha Dzong and Khuruthang town are provided in Fig. 15. Due to higher peak flow and a longer flood duration, overall flood hazard potential for the inhabited area caused by the Thorthomi lake GLOF, as compared to damages during the 1994 Luggye GLOF, was significantly higher. Most of the flood path lies in the narrow V-shaped valley, where there are few to no settlements or infrastructure. We estimated that over 1277 houses, most in the lower region of the study area, will be inundated in a GLOF. Aside from this, infrastructure such as roads, bridges, and sand dredging equipment will be damaged.
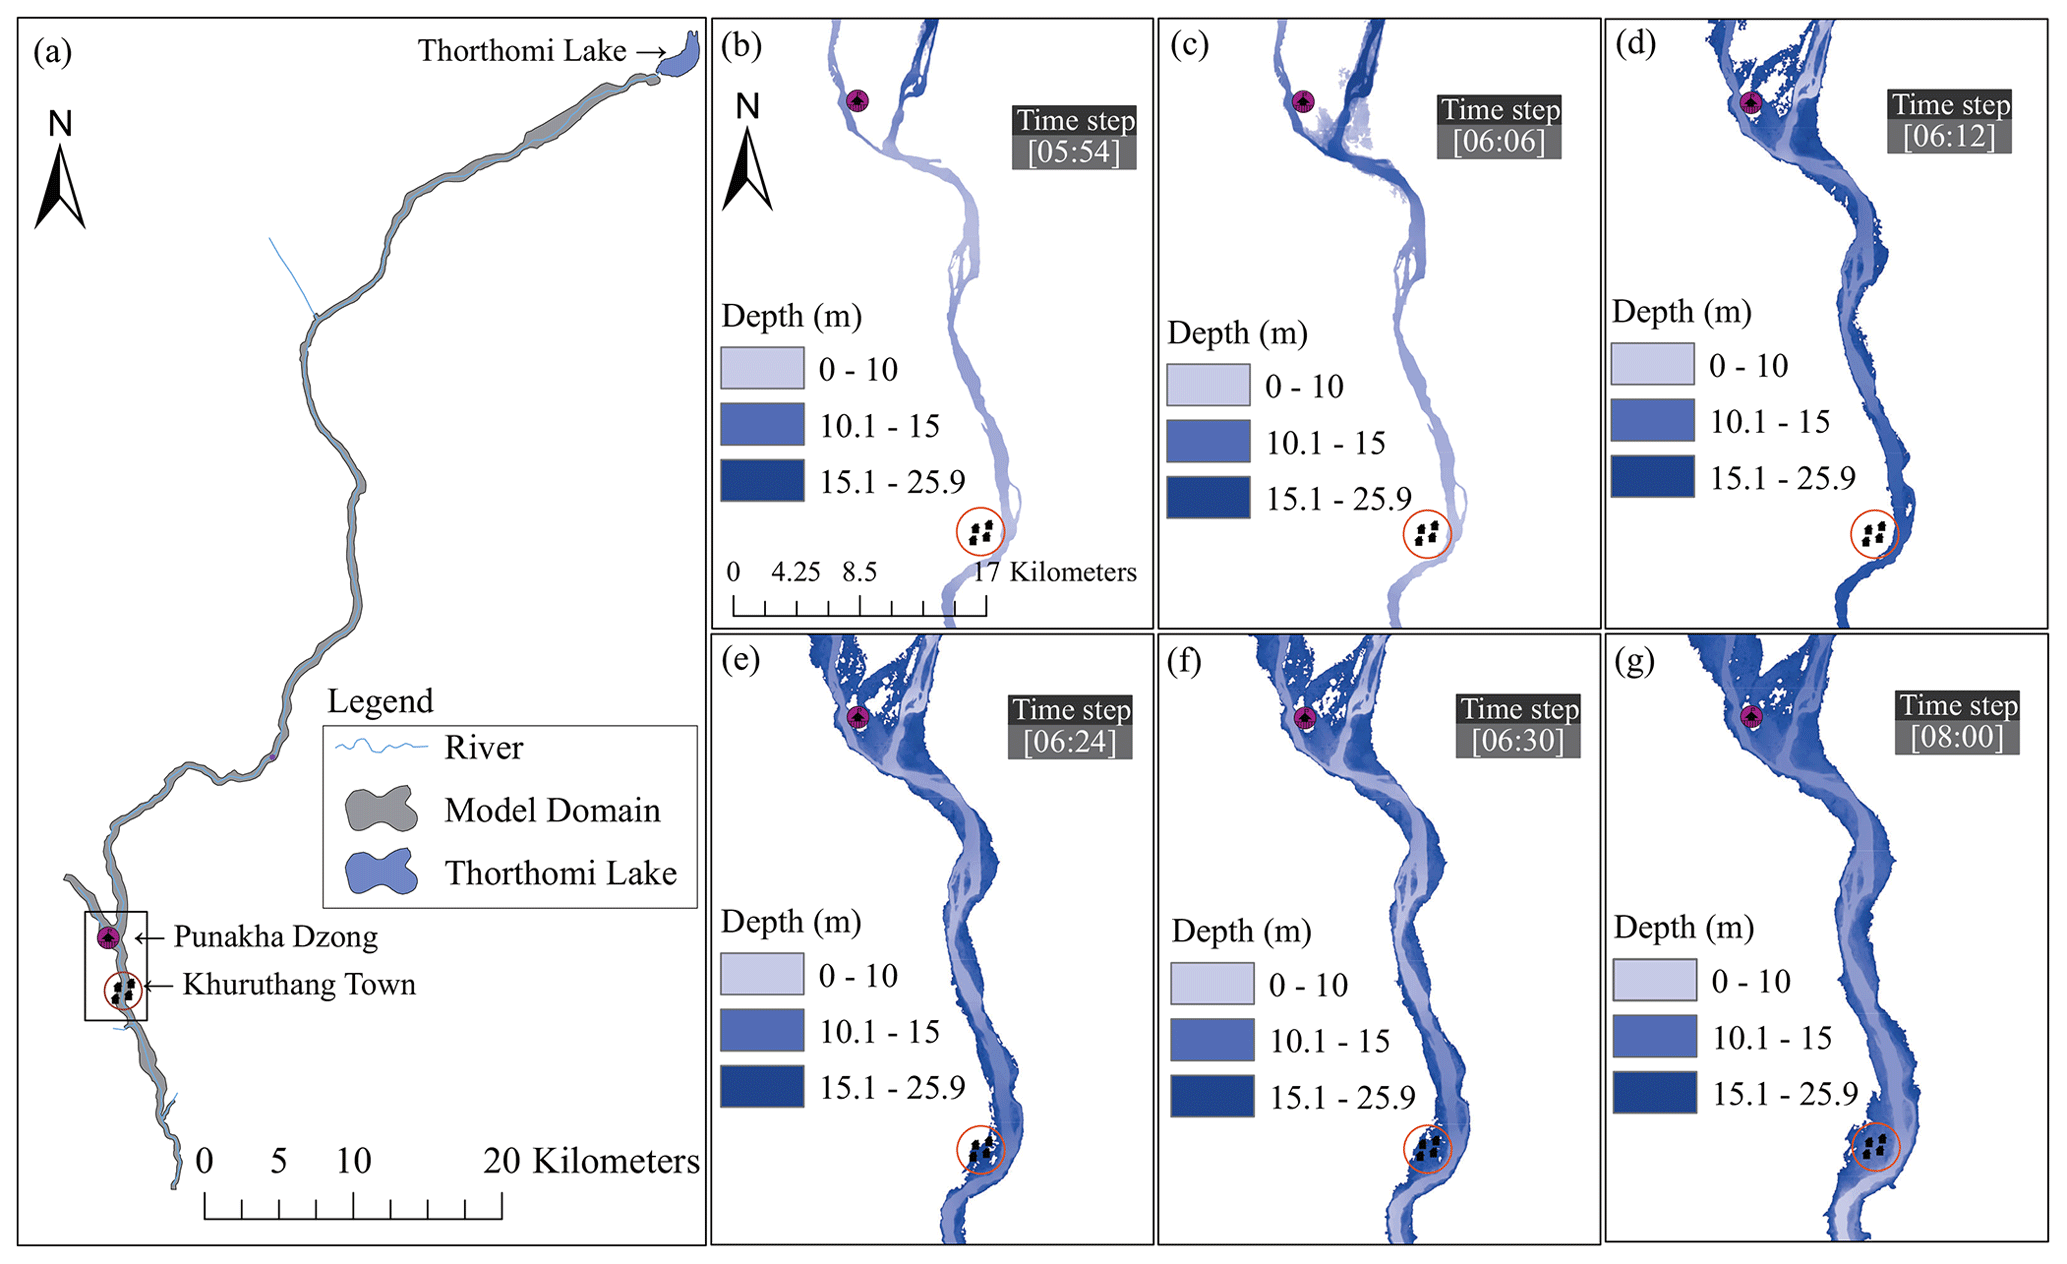
Figure 15The temporal change of the spatial extent of flood depth at Punakha Dzong and Khuruthang. (a) The hydrodynamic model domain. (b–g) The inundation depth at six time steps.
Notable damage during the 1994 GLOF occurred in Punakha Dzong. The area near the Punakha Dzong was completely inundated in the 1994 Luggye GLOF. The simulated future GLOF indicates that the Punakha Dzong area will be completely flooded, with a maximum depth of over 10 m (Figs. 13 and 15).
5.4 Socio-economic impact
The Punakha (the middle downstream of the domain; see Fig. 13) and the Wangdue districts (consisting of the Bajo and Jagathang settlements, as well as the downstream domain; see Figs. 2 and 13) are leading producers of rice, an essential crop for the country's GDP and food security. Any damage to agricultural land would have a devastating impact on farmers and the nation. Aside from potential damage to buildings and infrastructure, such as roads and bridges, agricultural land would also become submerged and destroyed by a flood. We estimated that approximately 193 to 245 ha of agricultural land will be inundated under different scenarios in a Thorthomi GLOF event. Figure 16 shows the potential extent of floods for different land use classes and highlights probable damage to agricultural land, particularly in the areas of Samdingkha and Jagathang.
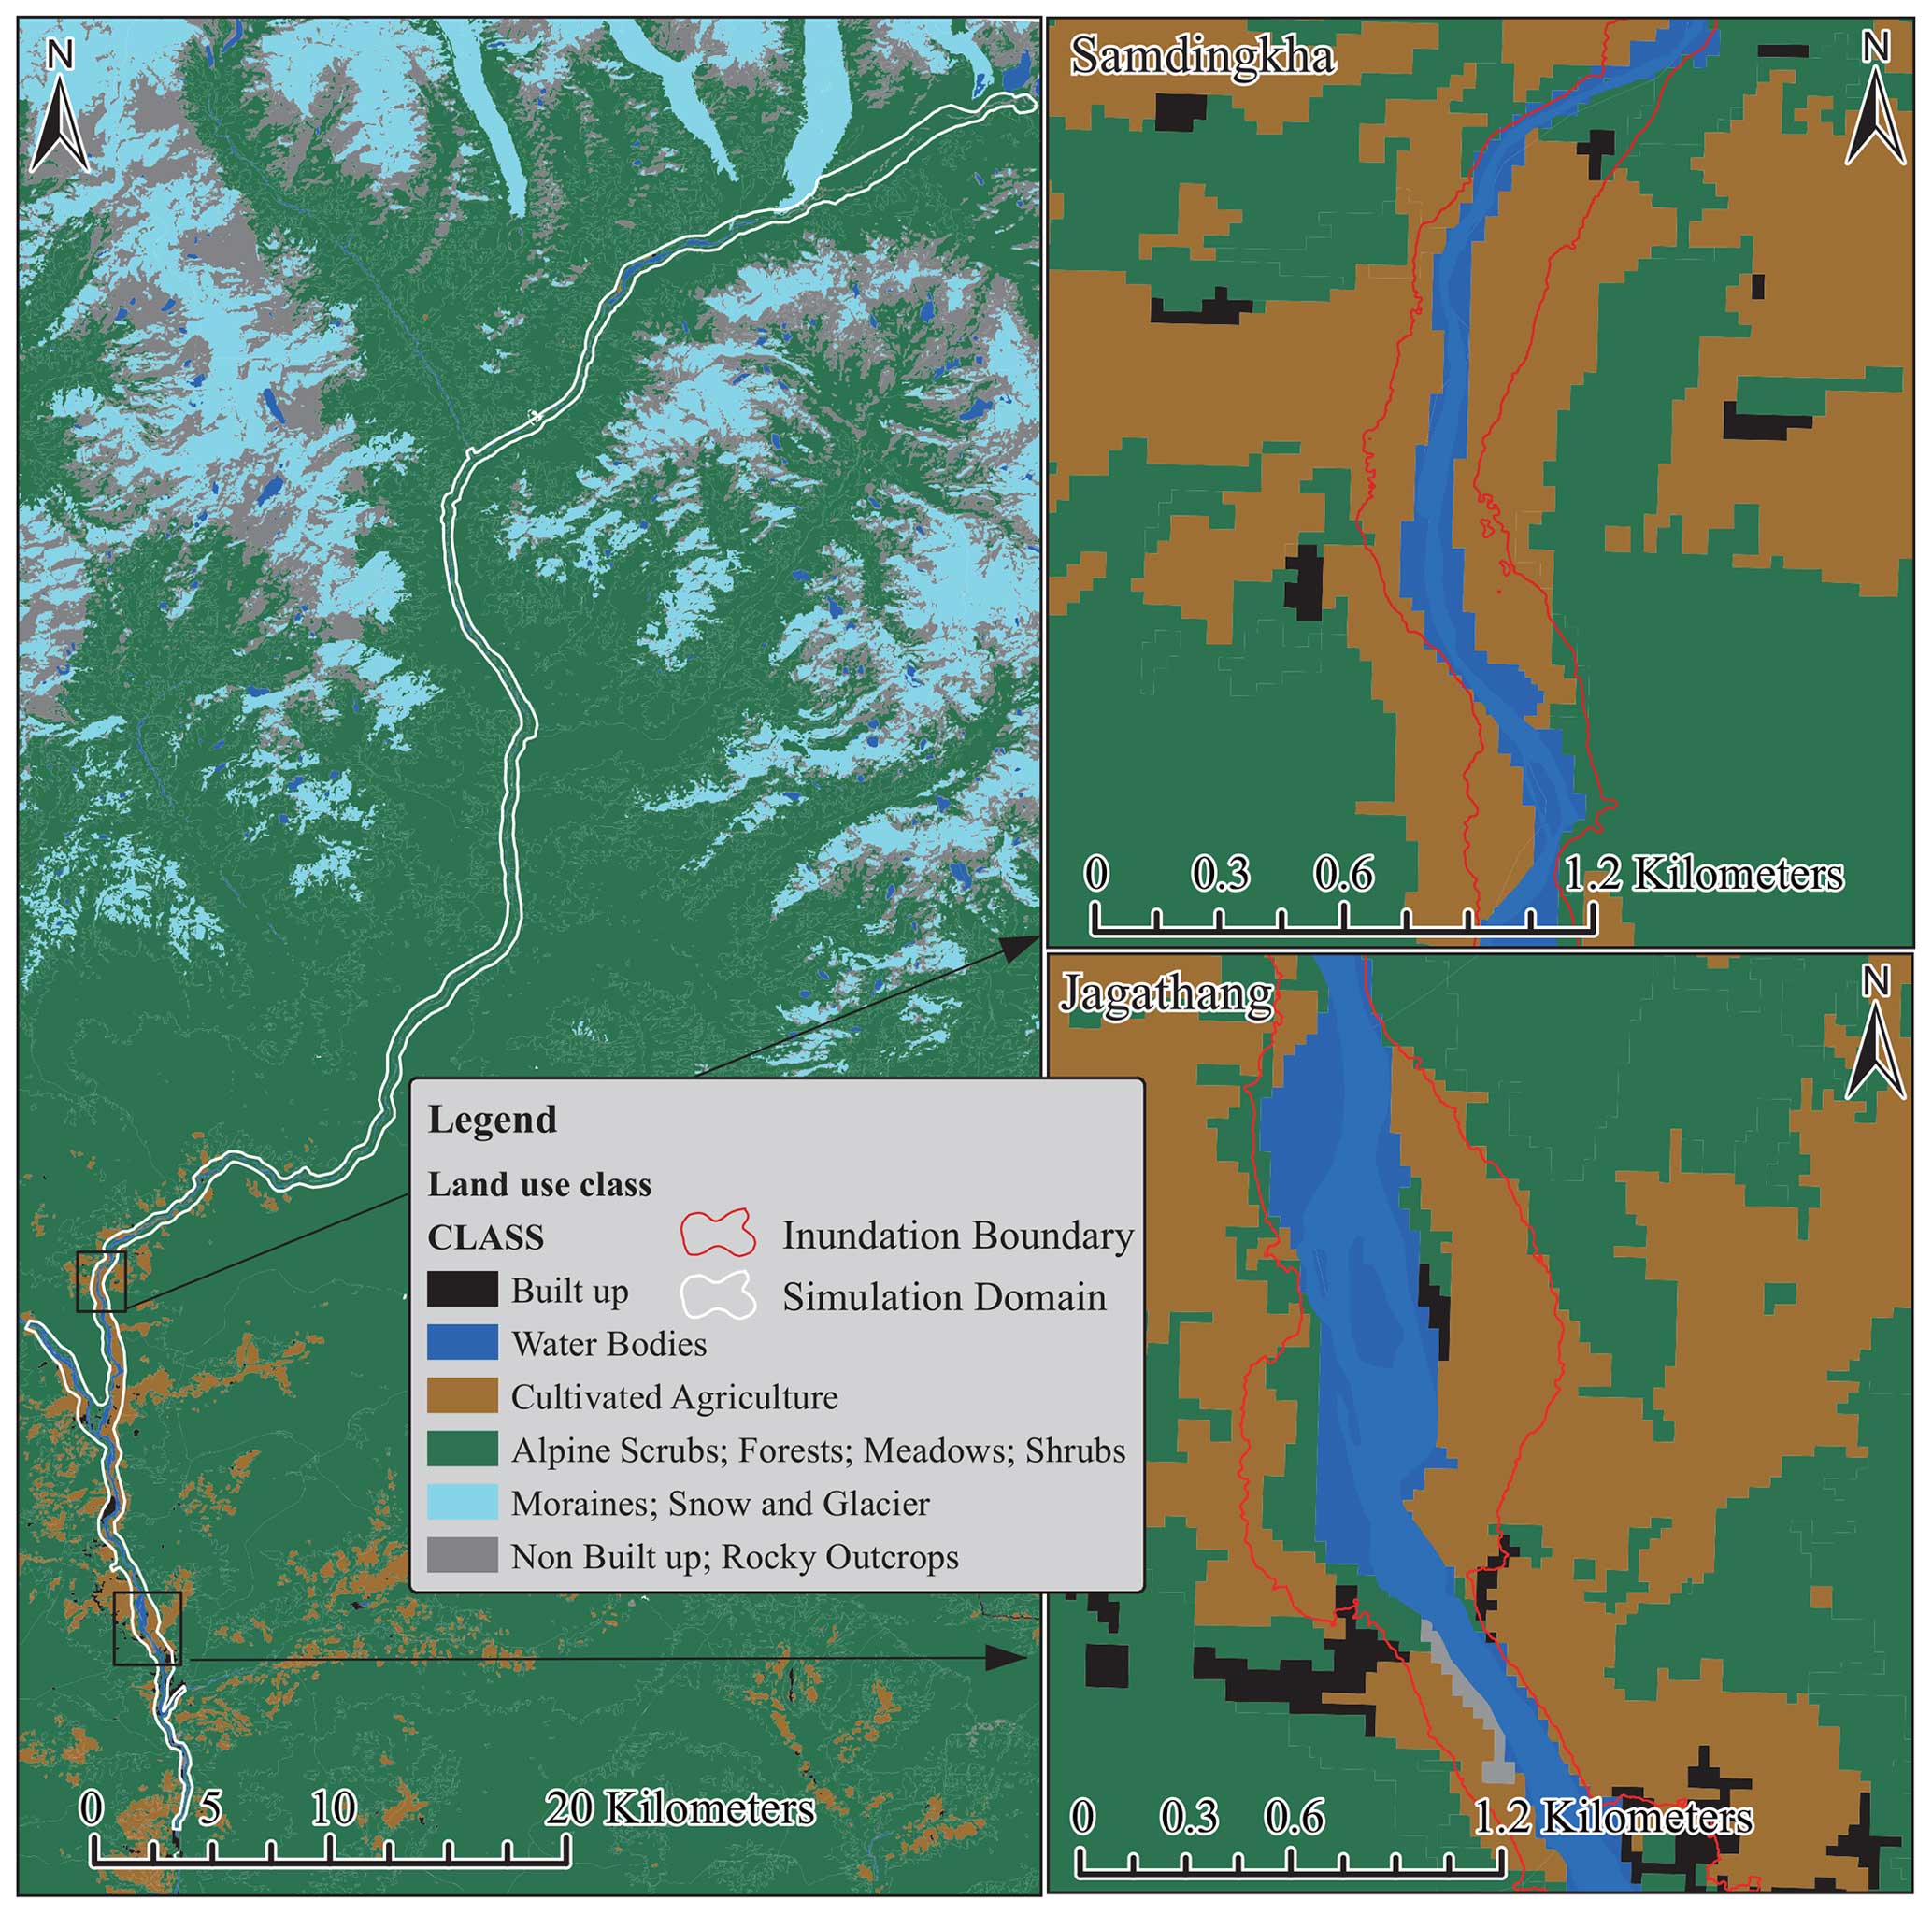
Figure 16The probable GLOF inundation extent on land use classes. (Land use data source: National Land Commission Secretariat, Bhutan.)
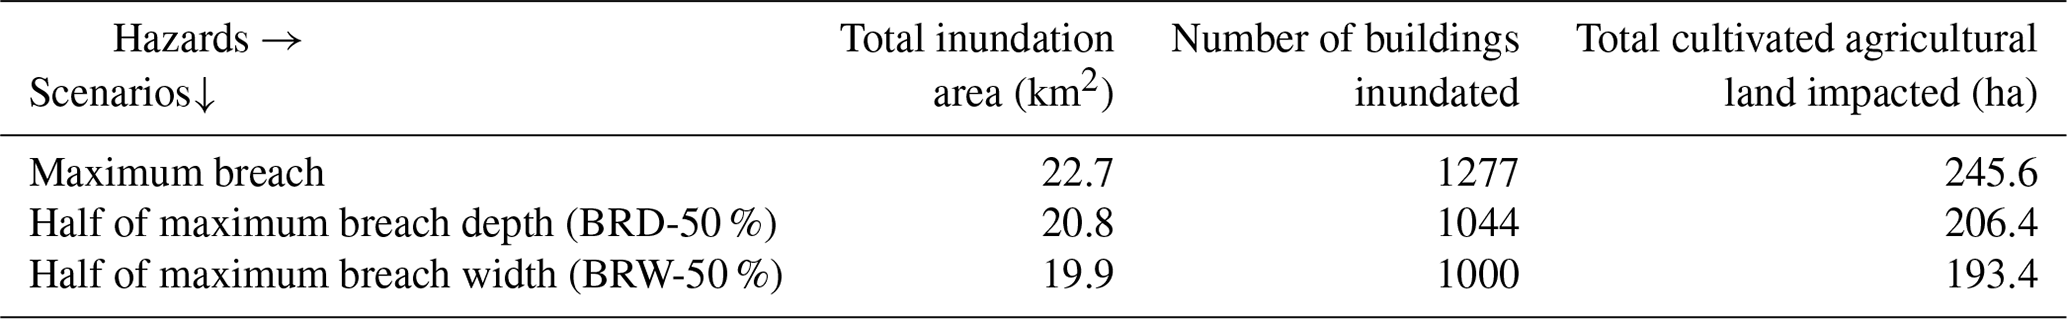
The overall hazard potential of a GLOF from Thorthomi lake under different scenarios is summarised in Table 2. Although the peak flow rate of each scenario is different (29 % to 37 % between the maximum and minimum for the result depicted in Fig. 11), the total inundation area, the number of submerged buildings, and the area of impacted cultivated land are not much different (12 %, 22 %, and 21 %, respectively), implying that the estimated flood is significant even for the most minor flood scenario (BRW-50 % scenario) for the Thorthomi GLOF. The scenarios indicate that most of the damage will occur for river properties and that farmland will be substantially damaged, even when a dam breach is not drastic. The soil in farmlands will also be eroded and covered by debris. Damage to irrigation is expected and may affect agriculture in farmland located behind flooded areas. Over the long term, damage to soil and irrigation would extensively reduce farmers' production. In advance, careful evacuation planning and business continuity planning (e.g. JICA, 2015), including a plan for agriculture, are essential for mitigating damage caused by a future Thorthomi GLOF.
5.5 Limitations of this study
Due to a lack of actual surveyed data, volume and maximum depth were estimated based on the statistical relationships established by past studies; an uncertainty for the estimated bathymetry of Thorthomi lake is a major limitation of our study. As compared to the bathymetry presented, the use of actual, surveyed bathymetric data may yield a more accurate prediction. An additional limitation of our study is the clear water assumption. Compared to clear water, hyper-concentrated water has different dynamic properties. Debris in flood water may cause substantial damage to farmland, infrastructure, and human life. Research on glacial lakes and their outburst floods is an emerging field (e.g. Qi et al., 2022; Taylor et al., 2023). To obtain more accurate damage predictions, data and methods should be revised following research progress.
The close proximity of glacial lakes within the Lunana region, especially the Thorthomi and Rapstreng lakes (Fig. 3), poses an even greater potential risk due to a possible cascading GLOF event. Failure of the lateral moraine of Thorthomi lake would lead to lake water breaching into Rapstreng lake, which would consequently cause the failure of its moraine dam. Since our study considered failure of the terminal moraine in the direction of the existing outlet, it is highly unlikely for such an event to occur under the current scenario. Accordingly, a cascading GLOF was not assessed in our study, but such possibilities should also be explored to better understand the potential risk of cascading events which may cause more severe damage to society.
We explored future hazards and damages arising from a GLOF from Thorthomi lake, one of the potentially dangerous glacial lakes in Bhutan but not well investigated within the scientific literature to date. To validate the approach used in our study and to calibrate the model, we reconstructed the 1994 Luggye lake GLOF prior to assessing the hazards of a Thorthomi GLOF. The BREACH model was used to estimate the outflow hydrograph emanating from a failure of moraine dams due to overtopping flow. Moraine materials and soil parameters used to parameterise the model were obtained from a report published by the National Center for Hydrology and Meteorology (NCHM), Bhutan. Propagation of the GLOF was simulated using a 2D routing module in HEC-RAS for modelling unsteady flow, which is an inherent characteristic of a GLOF where there is a sharp rise in the flow hydrograph.
The bathymetry of Thorthomi lake was estimated based on a regression equation derived from the relationship between lake area–depth–volume found within moraine lakes. We estimated that the total volume of the lake is approximately 400×106 m3, with a maximum depth of 161 m. According to the maximum breach scenario, the Thorthomi GLOF may release 283×106 m3 of water in under 12 h, with a peak flow rate of 16 360 m3 s−1, occurring approximately 4 h following initiation of the breaching process. Outflow hydrographs estimated by the model were used as the upstream boundary condition in hydrodynamic modelling.
Flood routing was performed to reach a length of approximately 115 km, and then peak discharge, flood travel time, and flood depths at major downstream settlements were estimated. According to the maximum breach scenario, Punakha Dzong, which lies 90 km downstream of Thorthomi lake and at the beginning of major settlements, would witness a peak discharge of 14 128 m3 s−1, approximately 6 h following breach initiation. A potential GLOF from Thorthomi lake would cause extensive agricultural and infrastructural damage to 245 ha of agricultural lands, and, for a maximum breach scenario, 1277 buildings are expected to be inundated. Comparable damage is also expected for two minor flood scenarios, implying that such damage is inevitable for a future Thorthomi GLOF.
A hazard assessment for a GLOF plays a crucial role for understanding and mitigating risks associated with these devastating natural events. Our study quantified the potential danger a GLOF from Thorthomi lake would pose to the downstream settlements and infrastructure. Such assessments will enable policymakers, local communities, and relevant stakeholders to make informed decisions regarding land use planning, disaster preparedness, and early warning systems.
Since glacial environments are dynamic and subject to change due to climate variations, GLOF hazard assessments are not static. Continuous monitoring and regular reassessments of glacial lakes and associated hazards are essential to account for environmental shifts and to ensure the effectiveness of mitigation strategies. Furthermore, a multi-disciplinary approach in GLOF hazard assessments is necessary. Collaborations between researchers, policymakers, local communities, and other stakeholders are essential for effective decision-making, disaster preparedness, and the implementation of mitigation measures. To essentially reduce GLOF risk, the development of methods to safely release dammed water to downstream areas is important.
Our study used open and commercial data (NSB, 2021, 2018; NCHM, 2021). Commercial data may be distributed under licence terms and conditions.
TW: conceptualisation, data curation, method, and writing original draft; RT: conceptualisation, data curation, draft writing, and reviewing and editing.
The contact author has declared that neither of the authors has any competing interests.
Publisher's note: Copernicus Publications remains neutral with regard to jurisdictional claims made in the text, published maps, institutional affiliations, or any other geographical representation in this paper. While Copernicus Publications makes every effort to include appropriate place names, the final responsibility lies with the authors.
Tandin Wangchuk acknowledges a Human Resource Development Scholarship from the Japan International Cooperation Agency (JICA). We acknowledge Yuji Toda and Takashi Tashiro, as well as other lab members of the Hydraulic Research Laboratory at Nagoya University. We also express our gratitude to Shigeo Suizu, Tomoyuki Wada, and Toru Koike at Earth System Science Co., Ltd. We sincerely thank members of the National Center for Hydrology and Meteorology for their continued support of our study.
This paper was edited by Pascal Haegeli and reviewed by Stefan Ram and Rayees Ahmed.
Awal, R., Nakagawa, H., Fujita, M., Kawakie, K., Baba, Y., and Zhang, H.: Experimental study on glacial lake outburst floods due to waves overtopping and erosion of moraine dam, Annuals of Disas. Prev. Res. Inst. Kyot Univ., 53, 583–594, 2010.
Bajracharya, B., Shrestha, A. B., and Rajbhandari, L.: Glacial lake outburst floods in the Sagarmatha region: Hazard assessment using GIS and hydrodynamic modelling, Mt. Res. Dev., 27, 336–344, https://doi.org/10.1659/mrd.0783, 2007.
Begam, S., Sen, D., and Dey, S.: Moraine dam breach and glacial lake outburst flood generation by physical and numerical models, J. Hydrol., 563, 694–710, https://doi.org/10.1016/j.jhydrol.2018.06.038, 2018.
Brunner, G. W.: HEC-RAS River Analysis System Hydraulic Reference Manual, Hydrologic Engineering Center, Issue February, https://www.hec.usace.army.mil/software/hec-ras/documentation/HEC-RAS 5.0 Reference Manual.pdf (last access: 8 July 2024), 2016a.
Brunner, G. W.: HEC-RAS River Analysis System: User Manual 1D and 2D Version 5.0, US Army Corps of Engineers, February, 1–790, https://www.hec.usace.army.mil/software/hec-ras/documentation/HEC-RAS 5.0 Users Manual.pdf (last access: 8 July 2024), 2016b.
Casas, A., Benito, G., Thorndycraft, V. R., and Rico, M.: The topographic data source of digital terrain models as a key element in the accuracy of hydraulic flood modelling, Earth Surf. Proc. Land., 31, 444–456, https://doi.org/10.1002/esp.1278, 2006.
Clague, J. J. and Evans, S. G.: A review of catastrophic drainage of moraine-dammed lakes in British Columbia, Quaternary Sci. Rev., 19, 1763–1783, 2000.
Cook, S. J. and Quincey, D. J.: Estimating the volume of Alpine glacial lakes, Earth Surf. Dynam., 3, 559–575, https://doi.org/10.5194/esurf-3-559-2015, 2015.
Cook, S. J. and Swift, D. A.: Subglacial basins: Their origin and importance in glacial systems and landscapes, Earth-Sci. Rev., 115, 332–372, https://doi.org/10.1016/j.earscirev.2012.09.009, 2012.
Fread, D. L.: BREACH: An Erosion Model for Earthen Dam Failure, Hydrologic Research Laboratory, National Weather Service, National Oceanic and Atmospheric Administration, https://www.sylvestre.us/images/models/breach.pdf (last access: 8 July 2024), 1988.
Fujita, K., Suzuki, R., Nuimura, T., and Sakai, A.: Performance of ASTER and SRTM DEMs, and their potential for assessing glacial lakes in the Lunana region, Bhutan Himalaya, J. Glaciol., 54, 220–228, https://doi.org/10.3189/002214308784886162, 2008.
Fujita, K., Sakai, A., Takenaka, S., Nuimura, T., Surazakov, A. B., Sawagaki, T., and Yamanokuchi, T.: Potential flood volume of Himalayan glacial lakes, Nat. Hazards Earth Syst. Sci., 13, 1827–1839, https://doi.org/10.5194/nhess-13-1827-2013, 2013.
Gardelle, J., Arnaud, Y., and Berthier, E.: Contrasted evolution of glacial lakes along the Hindu Kush Himalaya mountain range between 1990 and 2009, Global Planet. Change, 75, 47–55, https://doi.org/10.1016/j.gloplacha.2010.10.003, 2011.
Gurung, D. R., Khanal, N. R., Bajracharya, S. R., Tsering, K., Joshi, S., Tshering, P., Chhetri, L. K., Lotay, Y., and Penjor, T.: Lemthang Tsho glacial Lake outburst flood (GLOF) in Bhutan: cause and impact, Geoenvironmental Disasters, 4, 56–64, https://doi.org/10.1186/s40677-017-0080-2, 2017.
Gyasi-Agyei, Y., Willgoose, G., and De Troch, F. P.: Effects of vertical resolution and map scale of digital elevation models on geomorphological parameters used in hydrology, Hydrol. Process., 9, 363–382, https://doi.org/10.1002/hyp.3360090310, 1995.
Hagg, W., Ram, S., Klaus, A., Aschauer, S., Babernits, S., Brand, D., Guggemoos, P., and Pappas, T.: Hazard assessment for a glacier lake outburst flood in the mo chu river basin, Bhutan, Appl. Sci.-Basel, 11, 9463 https://doi.org/10.3390/app11209463, 2021.
Hawker, L., Uhe, P., Paulo, L., Sosa, J., Savage, J., Sampson, C., and Neal, J.: A 30 m global map of elevation with forests and buildings removed, Environ. Res. Lett., 17, 024016, https://doi.org/10.1088/1748-9326/ac4d4f, 2022.
Heathcote, A. J., Giorgio, P. A., and Prairie, Y. T.: Predicting bathymetric features of lakes from the topography of their surrounding landscape, Can. J. Fish. Aquat. Sci., 72, 643–650, https://doi.org/10.1139/cjfas-2014-0392, 2015.
Horritt, M. S. and Bates, P. D.: Effects of spatial resolution on a raster based model of flood flow, J. Hydrol., 253, 239–249, https://doi.org/10.1016/S0022-1694(01)00490-5, 2001.
Huggel, C., Kääb, A., Haeberli, W., Teysseire, P., and Paul, F.: Remote sensing based assessment of hazards from glacier lake outbursts: A case study in the Swiss Alps, Can. Geotech. J., 39, 316–330, https://doi.org/10.1139/t01-099, 2002.
Japan International Cooperation Agency (JICA): Feasibility study on the Development of Punatsang Chhu Hydropower Project in the Kingdom of Bhutan, Final Report, https://openjicareport.jica.go.jp/643/643/643_102_11623022.html (last access: 8 July 2024), 2001.
Japan International Cooperation Agency (JICA): Natural Disaster Risk Assessment and Area Business Continuity Plan Formulation for Industrial Agglomerated Areas in the ASEAN Region Risk Profile Report – Hai Phong of Vietnam, https://openjicareport.jica.go.jp/pdf/1000023393.pdf (last access: 8 July 2024), 2015.
Karma: Reducing Lake Water Level in Thorthormi Glacial Lake in Bhutan: An Adaptation Project to the Adverse Impact of Climate Change, Report, 2013.
Koike, T. and Takenaka, S.: Scenario Analysis on Risks of Glacial Lake Outburst Floods on the Mangde Chhu River, Bhutan, Global Environmental Research, 16, 41–49, 2012.
Komori, J., Koike, T., Yamanokuchi, T., and Tshering, P.: Glacial Lake Outburst Events in the Bhutan Himalayas, Global Environmental Research, 16, 59–70, 2012.
Leber, D., Haeuser, H., Brauner, M., and Skuk, S.: Luggye Tsho Outburst Flood Mitigation Project, Lunana, Bhutan, Technical Report, 2000.
Maskey, S., Kayastha, R. R. B., and Kayastha, R. R. B.: Glacial Lakes Outburst Floods (GLOFs) modelling of Thulagi and Lower Barun Glacial Lakes of Nepalese Himalaya, Progress in Disaster Science, 7, 100106, https://doi.org/10.1016/j.pdisas.2020.100106, 2020.
Meyer, M. C., Wiesmayr, G., Brauner, M., Häusler, H., and Wangda, D.: Active tectonics in Eastern Lunana (NW Bhutan): Implications for the seismic and glacial hazard potential of the Bhutan Himalaya, Tectonics, 25, 199–214, https://doi.org/10.1029/2005TC001858, 2006.
Mool, P. K., Wangda, D., Bajracharya, S. R., Kunzang, K., Gurung, D. R., and Joshi, S. P.: Inventory of Glaciers, Glacial Lakes and GLOF, 53, 1689–1699, 2001.
Mosquera-Machado, S. and Ahmad, S.: Flood hazard assessment of Atrato River in Colombia, Water Resour. Manag., 21, 591–609, https://doi.org/10.1007/s11269-006-9032-4, 2007.
National Center for Hydrology and Meteorology (NCHM): Reassessment of Potentially Dangerous Glacial Lakes in Bhutan, Cryosphere Services Division, Bhutan, https://www.nchm.gov.bt/attachment/ckfinder/userfiles/files/Re-assessment of Potentailly Dangerous Glacial Lakes.pdf (last access: 8 July 2024), 2019.
National Center for Hydrology and Meteorology (NCHM): Detailed Assessment Report on GLOF Hazard from Thorthomi Glacial Lake and Associated Glaciers, https://www.nchm.gov.bt/attachment/ckfinder/userfiles/files/Report_on_Thorthormi_assessment_2019.pdf (last access: 8 July 2024), 2020.
National Center for Hydrology and Meteorology (NCHM): Bhutan Glacial Lake Inventory (BGLI) 2021, Cryosphere Services Division, Bhutan, https://www.nchm.gov.bt/attachment/ckfinder/userfiles/files/Bhutan Glacial Lake Inventory 2021.pdf (last access: 18 July 2024), 2021.
National Statistics Bureau (NSB): 2017 Population and housing census of Bhutan, National Report, https://www.nsb.gov.bt/wp-content/uploads/dlm_uploads/2022/06/ASR2021-Book-for-WEB.pdf (last access: 8 July 2024), 2018.
National Statistics Bureau (NSB): Agriculture Survey Report 2021, https://www.nsb.gov.bt/wp-content/uploads/dlm_uploads/2022/06/ASR2021-Book-for-WEB.pdf (last access: 8 July 2024) 2021.
Neupane, R., Chen, H., and Cao, C.: Review of moraine dam failure mechanism, Geomat. Nat. Haz. Risk, 10, 1948–1966, https://doi.org/10.1080/19475705.2019.1652210, 2019.
O'Connor, J. E., Hardison, J. H., and Costa, J. E.: Debris flows from failures of neoglacial-age moraine dams in the Three Sisters and Mount Jefferson wilderness areas, Oregon, US Geological Survey Professional Paper, Issue 1606, https://doi.org/10.3133/pp1606, 2001.
Porter, S. A., Tomer, M. D., James, D. E., and Boomer, K. M. B.: Agricultural Conservation Planning Framework ArcGIS Toolbox User's Manual Version 2.2, p. 82, http://northcentralwater.org/acpf/ (last access: 17 June 2022), 2016.
Qi, M., Liu, S., Wu, K., Zhu, Y., Xie, F., Jin, H., Gao, Y., and Yao, X.: Improving the accuracy of glacial lake volume estimation: A case study in the Poiqu basin, central Himalayas, J. Hydrol., 610, 127973, https://doi.org/10.1016/j.jhydrol.2022.127973, 2022.
Richardson, S. D. and Reynolds, J. M.: An overview of glacial hazards in the Himalayas, Quatern. Int., 65–66, 31–47, https://doi.org/10.1016/S1040-6182(99)00035-X, 2000.
Rinzin, S., Zhang, G., Sattar, A., Wangchuk, S., Allen, S. K., Dunning, S., and Peng, M.: GLOF hazard, exposure, vulnerability, and risk assessment of potentially dangerous glacial lakes in the Bhutan Himalaya, J. Hydrol., 619, 129311, https://doi.org/10.1016/j.jhydrol.2023.129311, 2023.
Sakai, A.: Glacial Lakes in the Himalayas: A Review on Formation and Expansion Processes, Global Environmental Research, 16, 23–30, 2012.
Sattar, A., Haritashya, U. K., Kargel, J. S., Leonard, G. J., Shugar, D. H., and Chase, D. V.: Modeling lake outburst and downstream hazard assessment of the Lower Barun Glacial Lake, Nepal Himalaya, J. Hydrol., 598, 126208, https://doi.org/10.1016/j.jhydrol.2021.126208, 2021.
Shahrim, M. F. and Ros, F. C.: Estimation of breach outflow hydrograph using selected regression breach equations, IOP C. Ser. Earth Env., 476, 012129, https://doi.org/10.1088/1755-1315/476/1/012129, 2020.
Singh, S. M.: The Cost of Climate Change: The Story of Thorthormi Glacial Lake in Bhutan, WWF, World Wide Fund for Nature, 10–13, https://wwf.fi/app/uploads/h/5/7/5rqxrm5dl5ejasicpp5m4zc/the_cost_of_climate_change.pdf (last access: 8 July 2024), 2009.
Taylor, C., Robinson, T. R., Dunning, S., Carr, J. R., and Westoby, M.: Glacial lake outburst floods threaten millions globally, Nat. Commun., 14, 487, https://doi.org/10.1038/s41467-023-36033-x, 2023.
Tsubaki, R. and Kawahara, Y.: The uncertainty of local flow parameters during inundation flow over complex topographies with elevation errors, J. Hydrol., 486, 71–87, https://doi.org/10.1016/j.jhydrol.2013.01.042, 2013.
United Nations International Strategy for Disaster Reduction (UNISDR): The Human Cost of Weather Related Disaster, Centre for Research on the Epidemiology of Disasters, 1–30, https://www.unisdr.org/2015/docs/climatechange/COP21_WeatherDisastersReport_2015_FINAL.pdf (last access: 8 July 2024), 2015.
Vuichard, D. and Zimmermann, M.: The 1985 Catastrophic Drainage of a Moraine-Dammed Lake, Khumbu Himal, Nepal: Cause and Consequences, International Mountain Society, Mt. Res. Dev., 7, 91–110, 1987.
Wang, X., Liu, S., Guo, W., and Xu, J.: Assessment and simulation of glacier lake outburst floods for longbasaba and Pida lakes, China, Mt. Res. Dev., 28, 310–317, https://doi.org/10.1659/mrd.0894, 2008.
Watanabe, T. and Rothacher, D.: The 1994 Lugge Tsho Glacial Lake Outburst Flood, Bhutan Himalaya, Mt. Res. Dev., 16, 77, https://doi.org/10.2307/3673897, 1996.
Westoby, M. J., Glasser, N. F., Brasington, J., Hambrey, M. J., Quincey, D. J., and Reynolds, J. M.: Modelling outburst floods from moraine-dammed glacial lakes, Earth-Sci. Rev., 134, 137–159, https://doi.org/10.1016/j.earscirev.2014.03.009, 2014.
Westoby, M. J., Brasington, J., Glasser, N. F., Hambrey, M. J., Reynolds, J. M., Hassan, M. A. A. M., and Lowe, A.: Numerical modelling of glacial lake outburst floods using physically based dam-breach models, Earth Surf. Dynam., 3, 171–199, https://doi.org/10.5194/esurf-3-171-2015, 2015.
Worni, R., Huggel, C., Clague, J. J., Schaub, Y., and Stoffel, M.: Coupling glacial lake impact, dam breach, and flood processes: A modeling perspective, Geomorphology, 224, 161–176, https://doi.org/10.1016/j.geomorph.2014.06.031, 2014.
Xu, K., Fang, J., Fang, Y., Sun, Q., Wu, C., and Liu, M.: The Importance of Digital Elevation Model Selection in Flood Simulation and a Proposed Method to Reduce DEM Errors: A Case Study in Shanghai, Int. J. Disast. Risk Sc., 12, 890–902, https://doi.org/10.1007/s13753-021-00377-z, 2021.
Yamada, T., Naito, N., Koshima, S., Fushimi, H., Nakazawa, F., Segawa, T., Uetake, J., Suzuki, R., Sato, N., Karma, Chhetri, I. K., Gyenden, L., Yabuki, H., and Chikita, K.: Outline of 2002-research activities on glacier lakes in Lunana region, Bhutan Himalayas, Bulletin of Glaciological Research, 21, 79–90, 2004.
Yamazaki, D., Sato, T., Kanae, S., Hirabayashi, Y., and Bates, P. D.: Regional flood dynamics in a bifurcating mega delta simulated in a global river model, Geophys. Res. Lett., 41, 3127–3135, https://doi.org/10.1002/2014GL059744, 2014.
Yamazaki, D., Ikeshima, D., Tawatari, R., Yamaguchi, T., O'Loughlin, F., Neal, J. C., Sampson, C. C., Kanae, S., and Bates, P. D.: A high-accuracy map of global terrain elevations, Geophys. Res. Lett., 44, 5844–5853, https://doi.org/10.1002/2017GL072874, 2017.
Yamazaki, D., Ikeshima, D., Sosa, J., Bates, P. D., Allen, G. H., and Pavelsky, T. M.: MERIT Hydro: A High-Resolution Global Hydrography Map Based on Latest Topography Dataset, Water Resour. Res., 55, 5053–5073, https://doi.org/10.1029/2019WR024873, 2019.
Ye, A., Zhou, Z., You, J., Ma, F., and Duan, Q.: Dynamic Manning's roughness coefficients for hydrological modelling in basins, Hydrol. Res., 49, 1379–1395, https://doi.org/10.2166/nh.2018.175, 2018.
Zhu, S., Liu, B., Wan, W., Xie, H., Fang, Y., Chen, X., Li, H., Fang, W., Zhang, G., Tao, M., and Hong, Y.: A new digital lake bathymetry model using the step-wise water recession method to generate 3D lake bathymetric maps based on DEMs, Water, 11, 1151, https://doi.org/10.3390/w11061151, 2019.