the Creative Commons Attribution 4.0 License.
the Creative Commons Attribution 4.0 License.
 | 28 Jun 2024
Evaluating post-wildfire debris-flow rainfall thresholds and volume models at the 2020 Grizzly Creek Fire in Glenwood Canyon, Colorado, USA
Samuel Bower
Andrew Knapp
Jason W. Kean
Danielle W. vonLembke
Matthew A. Thomas
Jaime Kostelnik
Katherine R. Barnhart
Matthew Bethel
Joseph E. Gartner
Madeline Hille
Dennis M. Staley
Justin K. Anderson
Elizabeth K. Roberts
Stephen B. DeLong
Belize Lane
Paxton Ridgway
Brendan P. Murphy
As wildfire increases in the western United States, so do postfire debris-flow hazards. The U.S. Geological Survey (USGS) has developed two separate models to estimate (1) rainfall intensity thresholds for postfire debris-flow initiation and (2) debris-flow volumes. However, the information necessary to test the accuracy of these models is seldom available. Here, we studied how well these models performed over a 2-year period in the 2020 Grizzly Creek Fire burn perimeter in Glenwood Canyon, Colorado, USA, through the development of a debris-flow response inventory. The study area had the advantage of a network of 11 rain gauges for rainfall intensity measurements and repeat lidar data for volume estimates. Our observations showed that 89 % of observed debris flows in the first year postfire were triggered by rainfall rates higher than the fire-wide rainfall threshold produced by the current USGS operational model (M1). No debris flows were observed in the second year postfire, despite eight rainstorms with intensities higher than the modeled rainfall threshold. We found that the operational model for debris-flow initiation rainfall thresholds works well in this region during the first year but may be too conservative in year 2 due to vegetation recovery and sediment depletion. However, rainfall thresholds in the second year can be improved by using updated remote sensing imagery to recalculate the debris-flow initiation likelihood with the M1 model. The current volume model overestimates for this region by a median value of 4.4 times. However, the offset between the model estimates and observations is approximately linear, and the volumes from the Grizzly Creek debris flows had a similar magnitude to historic postfire debris flows in the region. Consequently, the current volume model could be adjusted with a regional correction factor.
- Article
(12986 KB) - Full-text XML
-
Supplement
(36619 KB) - BibTeX
- EndNote


Wildfire has been increasing in the western US in recent decades (Westerling et al., 2006; Westerling, 2016), as a warming climate has increased the number of days of high fire danger (Abatzoglou et al., 2021). This increased fire activity has resulted in more acreage burned (Dennison et al., 2014) at higher severity (Mueller et al., 2020). Despite this recent spike in activity, historical records suggest that the western US has a higher potential for wildfire than has been experienced in recent years (Murphy et al., 2018). Wildfire activity results in a variety of postfire hazards (Santi and Rengers, 2022) from rockfall (De Graff et al., 2015; Graber and Santi, 2023; Guasti et al., 2013; Melzner et al., 2019) to flash flooding (Brogan et al., 2017; Brooks et al., 2009; Cannon et al., 2008; Meyer et al., 2001; Neary et al.,, 2002; Warrick et al., 2022) to debris flows (Kean et al., 2019, 2016, 2011; Klock and Helvey, 1976; Murphy et al., 2019; Nyman et al., 2011; Parise and Cannon, 2012; Santi et al., 2008; Thomas et al., 2021; Tillery and Rengers, 2019; Wells, 1987; Wohl and Pearthree, 1991).
The proximate cause for increased hazards after wildfire in steep, vegetated terrain is the consumption of vegetation by fire and fire-induced changes to forest hydrology. In prefire conditions, the vegetation canopy intercepts incoming rainfall, both reducing the kinetic energy imparted by rain to the soil and storing some of the water (Rutter et al., 1975, 1971). In addition, vegetation stems and vegetation litter/duff on the forest floor create hydraulic roughness that can slow and store overland flow (Arcement and Schneider, 1989). Wildfire changes these characteristics, reducing canopy interception (Williams et al., 2019), surface roughness (e.g., Hoch et al., 2021; Tang et al., 2019a), and litter/duff water storage (e.g., Ebel, 2013) creating faster pathways from rainfall to runoff. In addition, soil in many burn areas shows increased water repellency resulting from hyper-dry conditions (Moody and Ebel, 2012), hydrophobicity (DeBano, 2000; DeBano et al., 1979), or soil pore clogging (Larsen et al., 2009). These wildfire-induced changes result in an increased likelihood of overland flow compared to unburned conditions. At high velocities, overland flow can develop sediment transport conditions sufficient to initiate runoff-generated debris flows (e.g., Rengers et al., 2019; Tang et al., 2019b).
Rainfall intensity thresholds can be used to successfully assess the occurrence of postfire runoff-generated debris-flow hazards (Cannon et al., 2008). In particular, short-duration rainfall intensities (<15 min), which are a key predictor of runoff generation, have been shown to be the most likely to initiate runoff-generated debris flows (Kean et al., 2011; Thomas et al., 2023). The current USGS operational model (the M1 model described in the Methods section) predicts the likelihood of debris-flow initiation based on short-duration rainfall intensity, burn severity, slope steepness, and soil erodibility (Staley et al., 2017). Using the M1 model it is possible to estimate a rainfall intensity threshold based on a debris-flow initiation likelihood (e.g., 50 %) (Staley et al., 2017). Spatially explicit rainfall intensity thresholds can be modeled throughout the burn perimeter, but the median rainfall intensity threshold at a 50 % likelihood for all watersheds over the entire burn perimeter is typically used as guidance to support early warning operations in the first year postfire (U.S. Geological Survey, 2020). The present study leverages an opportunity to test the performance of the M1 model rainfall threshold and its implementation for operational postfire hazard assessments.
Similar to the model for debris-flow initiation, the USGS operational hazard assessment uses an empirical model to estimate postfire runoff-generated debris-flow volumes. This model incorporates rainfall intensity, burn severity, and topography (Gartner et al., 2014). The volume model was developed using empirical data from southern California, and it has been shown to work well in that region where a large proportion of the debris-flow sediment is sourced from hillslopes (Rengers et al., 2021). In different cases, postfire debris flows in the Rocky Mountains have been observed to incorporate the bulk of their material from rilling and sheetwash (Cannon et al., 2001) and from channel incision (Santi et al., 2008). This raises the question of the applicability of the USGS volume model in the Rocky Mountain region of Colorado, USA, which differs in geology, climate, and topography from the area that the volume model was developed. Accurate estimates of debris-flow volume are particularly important for debris-flow runout models (Barnhart et al., 2021) and the design of debris-flow mitigation structures (Prochaska et al., 2008).
Opportunities to test the current USGS models for debris-flow initiation and volume are rare because they require a relatively dense rain gauge network (e.g., sufficiently dense to capture small convective rainstorms) and field observations to attribute debris-flow activity and/or volume to individual storms. The recent Grizzly Creek Fire in August 2020 created a suitable case for model testing in Glenwood Canyon, CO, which is in a region where postfire debris flows have been previously observed (Cannon et al., 2001, 2008). Using the Grizzly Creek Fire, we examined the regional applicability of the two current USGS operational models for debris-flow initiation and debris-flow volume with (1) a detailed inventory of storms that produced debris flows versus flood or no response, (2) a dense rain gauge network, (3) pre- and post-event lidar, and (4) airborne and satellite imagery. This work explored whether the current USGS operational models for debris-flow rainfall thresholds and volume successfully predicted debris-flow occurrence and volume, respectively, at our study site during the first 2 years following wildfire. We additionally recorded some of the major infrastructure and water resource impacts due to the postfire debris-flow activity.
2.1 Wildfire and site conditions
The Grizzly Creek Fire ignited on 10 August 2020 and burned 13 000 ha and 19 river kilometers through Glenwood Canyon, CO, until it was fully contained on 18 December 2020. Glenwood Canyon is a narrow, high-relief canyon along the Colorado River. The fire burn severity (Parsons et al., 2010) was a mosaic of high (12 %), moderate (43 %), and low or unburned severity (45 %), with the highest burn severity on the steep canyon slopes near the Colorado River and decreased severity as the fire moved upslope towards the canyon rim. This wildfire threatened critical infrastructure including U.S. Interstate Highway 70 (I-70), the Union Pacific Railroad, the Shoshone hydroelectric power plant, a Colorado Department of Transportation tunnel security facility, and the Glenwood Springs municipal water supply surface water intakes in the Grizzly Creek and No Name Creek watersheds.
Glenwood Canyon has a semi-arid climate with an average annual precipitation of 600 mm (National Oceanic and Atmospheric Administration, 2023). Precipitation is typically composed of snowfall in the winter months and rainfall in the summer months, primarily driven by the North American Monsoon, which occurs from June through September (Adams and Comrie, 1997). The 2021 North American Monsoon was particularly active in western Colorado with precipitation reaching 130 %–170 % of the average annual precipitation (Castellano et al., 2023). Steep cliffs in the canyon create large areas with minimal soil development (Graber and Santi, 2023, 2022), primarily leading to shallow loams with varying amounts of clay and gravel (NRCS Soils, 2021). The vegetation at the site includes pinyon–juniper woodlands (Pinus Edulis and Juniperus scopulorum), montane forest and shrublands (e.g., Artemisia tridentata subsp. tridentata, Sarcobatus vermiculatus), lodgepole pine (Pinus contorta), Douglas fir (Pseudotsuga menziesii), Engelmann spruce (Picea engelmannii), Gambel oak (Quercus gambelii), Aspen (Populus tremuloides), and subalpine spruce–fir forests (United States Forest Service, 2020). The geology of the Glenwood Canyon is characterized by biotite granites intruding into mica schists and gneisses (Paleoproterozoic age) near the Colorado River overlain by limestones, marine shales, and gypsum (Kirkham et al., 2009). Finally, there are numerous Quaternary-age landslides within Glenwood Canyon, including a large portion of the Devil's Hole watershed (Kirkham et al., 2009).
2.2 Debris-flow events: historical and Grizzly Creek Fire
Postfire debris flows have been observed previously near Glenwood Canyon, CO (Cannon et al., 2001, 2008). The South Canyon Fire in July 1994 burned west of Glenwood Springs, CO, and a rainstorm 2 months later (1 September 1994) triggered runoff-generated debris flows in the Maroon Formation (Permian–Pennsylvanian aged) (Cannon et al., 2001). The debris flows trapped 30 cars on I-70, and two vehicles were moved into the Colorado River. The debris flows deposited an estimated sediment volume of 68 000 m3. Field mapping after this event shows that the majority of debris flows were runoff generated (Cannon et al., 2001). Similarly, the Coal Seam Fire burned 4941 ha west of Glenwood Springs, CO, in June 2002 (Cannon et al., 2008), and debris flows originated within the burn perimeter on 5 August 2002. The peak 10 min rainfall intensities at the Coal Seam Fire varied between 19.8–57.9 mm h−1 during the months following the wildfire (August and September 2002). Those rates were equal to or less than the 2-year recurrence interval storm, and during these storms a train and a passenger vehicle were buried during debris-flow events (Cannon et al., 2003, 2008).
Postfire debris flows triggered from June to August 2021 in the Grizzly Creek burn perimeter caused major disruptions in Glenwood Canyon to roads, railroad lines, the Colorado River (a source of drinking water, energy generation, and a recreation industry), and a bicycle path adjacent to I-70. Initial repair costs for the highway were more than USD 50 million (Stroud, 2021c), and the overall repair costs to road infrastructure were estimated at USD 116 million (Stroud, 2021a). In addition, debris-flow disruptions leading to closures of I-70 resulted in lost revenue from interstate commerce, estimated at approximately USD 1 million per hour (Erku, 2023). During the summers of 2021 and 2022, there were a combined total of 14 road closures (Colorado Department of Transportation (CDOT), personal communication). Railroad closures of passenger and freight rail due to debris flows caused severe disruptions (Erku, 2021a), and the commercial rafting and recreation industry in Glenwood Canyon was substantially affected (Blevins, 2021). Finally, long-term degradation of water quality was caused by debris-flow material deposited in the Colorado River. Communities more than 30 km downstream of Glenwood Canyon required enhanced filtration for turbidity and heavy minerals for months following the debris flows (Erku, 2021b).
3.1 Hazard assessment
The U.S. Geological Survey produces hazard assessment maps to support early warning, risk assessment, and emergency response planning in burn areas in the United States (e.g., U.S. Geological Survey, 200). These hazard assessments contain information on debris-flow initiation likelihood (a metric that can be used to estimate a rainfall triggering threshold), debris-flow volume, and a combined hazard (Staley et al., 2017). The M1 model used to estimate the likelihood of debris-flow initiation (p) contains four primary inputs: burn severity (Parsons et al., 2010) (a measure of soil and vegetation change), slope, the differenced normalized burn ratio (dNBR), and the soil KF-factor (a measure of erodibility) obtained from STATSGO (Schwartz and Alexander, 1995). These parameters are used to determine the rainfall expected to trigger debris flows using
where Rp is the peak rainfall accumulation [mm] over a time duration (here we use a 15 min duration); β is the intercept of the M1 logistic regression model; T is the proportion of upslope area with moderate to high burn severity and gradients ≥23°; F is the average dNBR of upslope pixels divided by 1000; S is the average KF-factor of upslope area; and C1, C2, and C3 are empirically defined coefficients. Note the coefficients C1–C3 and β do not vary across fires or regions but differ based on rainfall duration. All coefficient values for the M1 model are shown in Staley et al. (2017).
Equation (1) is used to generate spatially explicit rainfall thresholds for individual channel segments or basins (<8 km2). However, in practice, managers can only use a single fire-wide rainfall threshold for warnings over a burn area. Therefore, to generate a single year-1 threshold, we first estimated the 15 min rainfall intensity threshold for all basins delineated by the hazard assessment (Fig. 1) using Eq. (1) and assuming p=50 % (P50). We then used the median value of all of the basins as the single fire-wide rainfall threshold for warning. A similar method was used to estimate the year-2 threshold, except we set p=75 % (P75) to estimate a year-2 rainfall threshold, and then used the median rainfall threshold from all of the basins as the single fire-wide rainfall threshold. These probabilities were used to define a fire-wide 15 min rainfall intensity threshold (); however, the success rate of the P50 and P75 rainfall thresholds have not been rigorously tested. Therefore, in this study we compared the median P50 for all basins in the burn perimeter with the measured peak 15 min intensity (I15) in 2021 () and the P75 in 2022 () to determine the performance of the P50 and P75 thresholds estimated using Eq. (1).
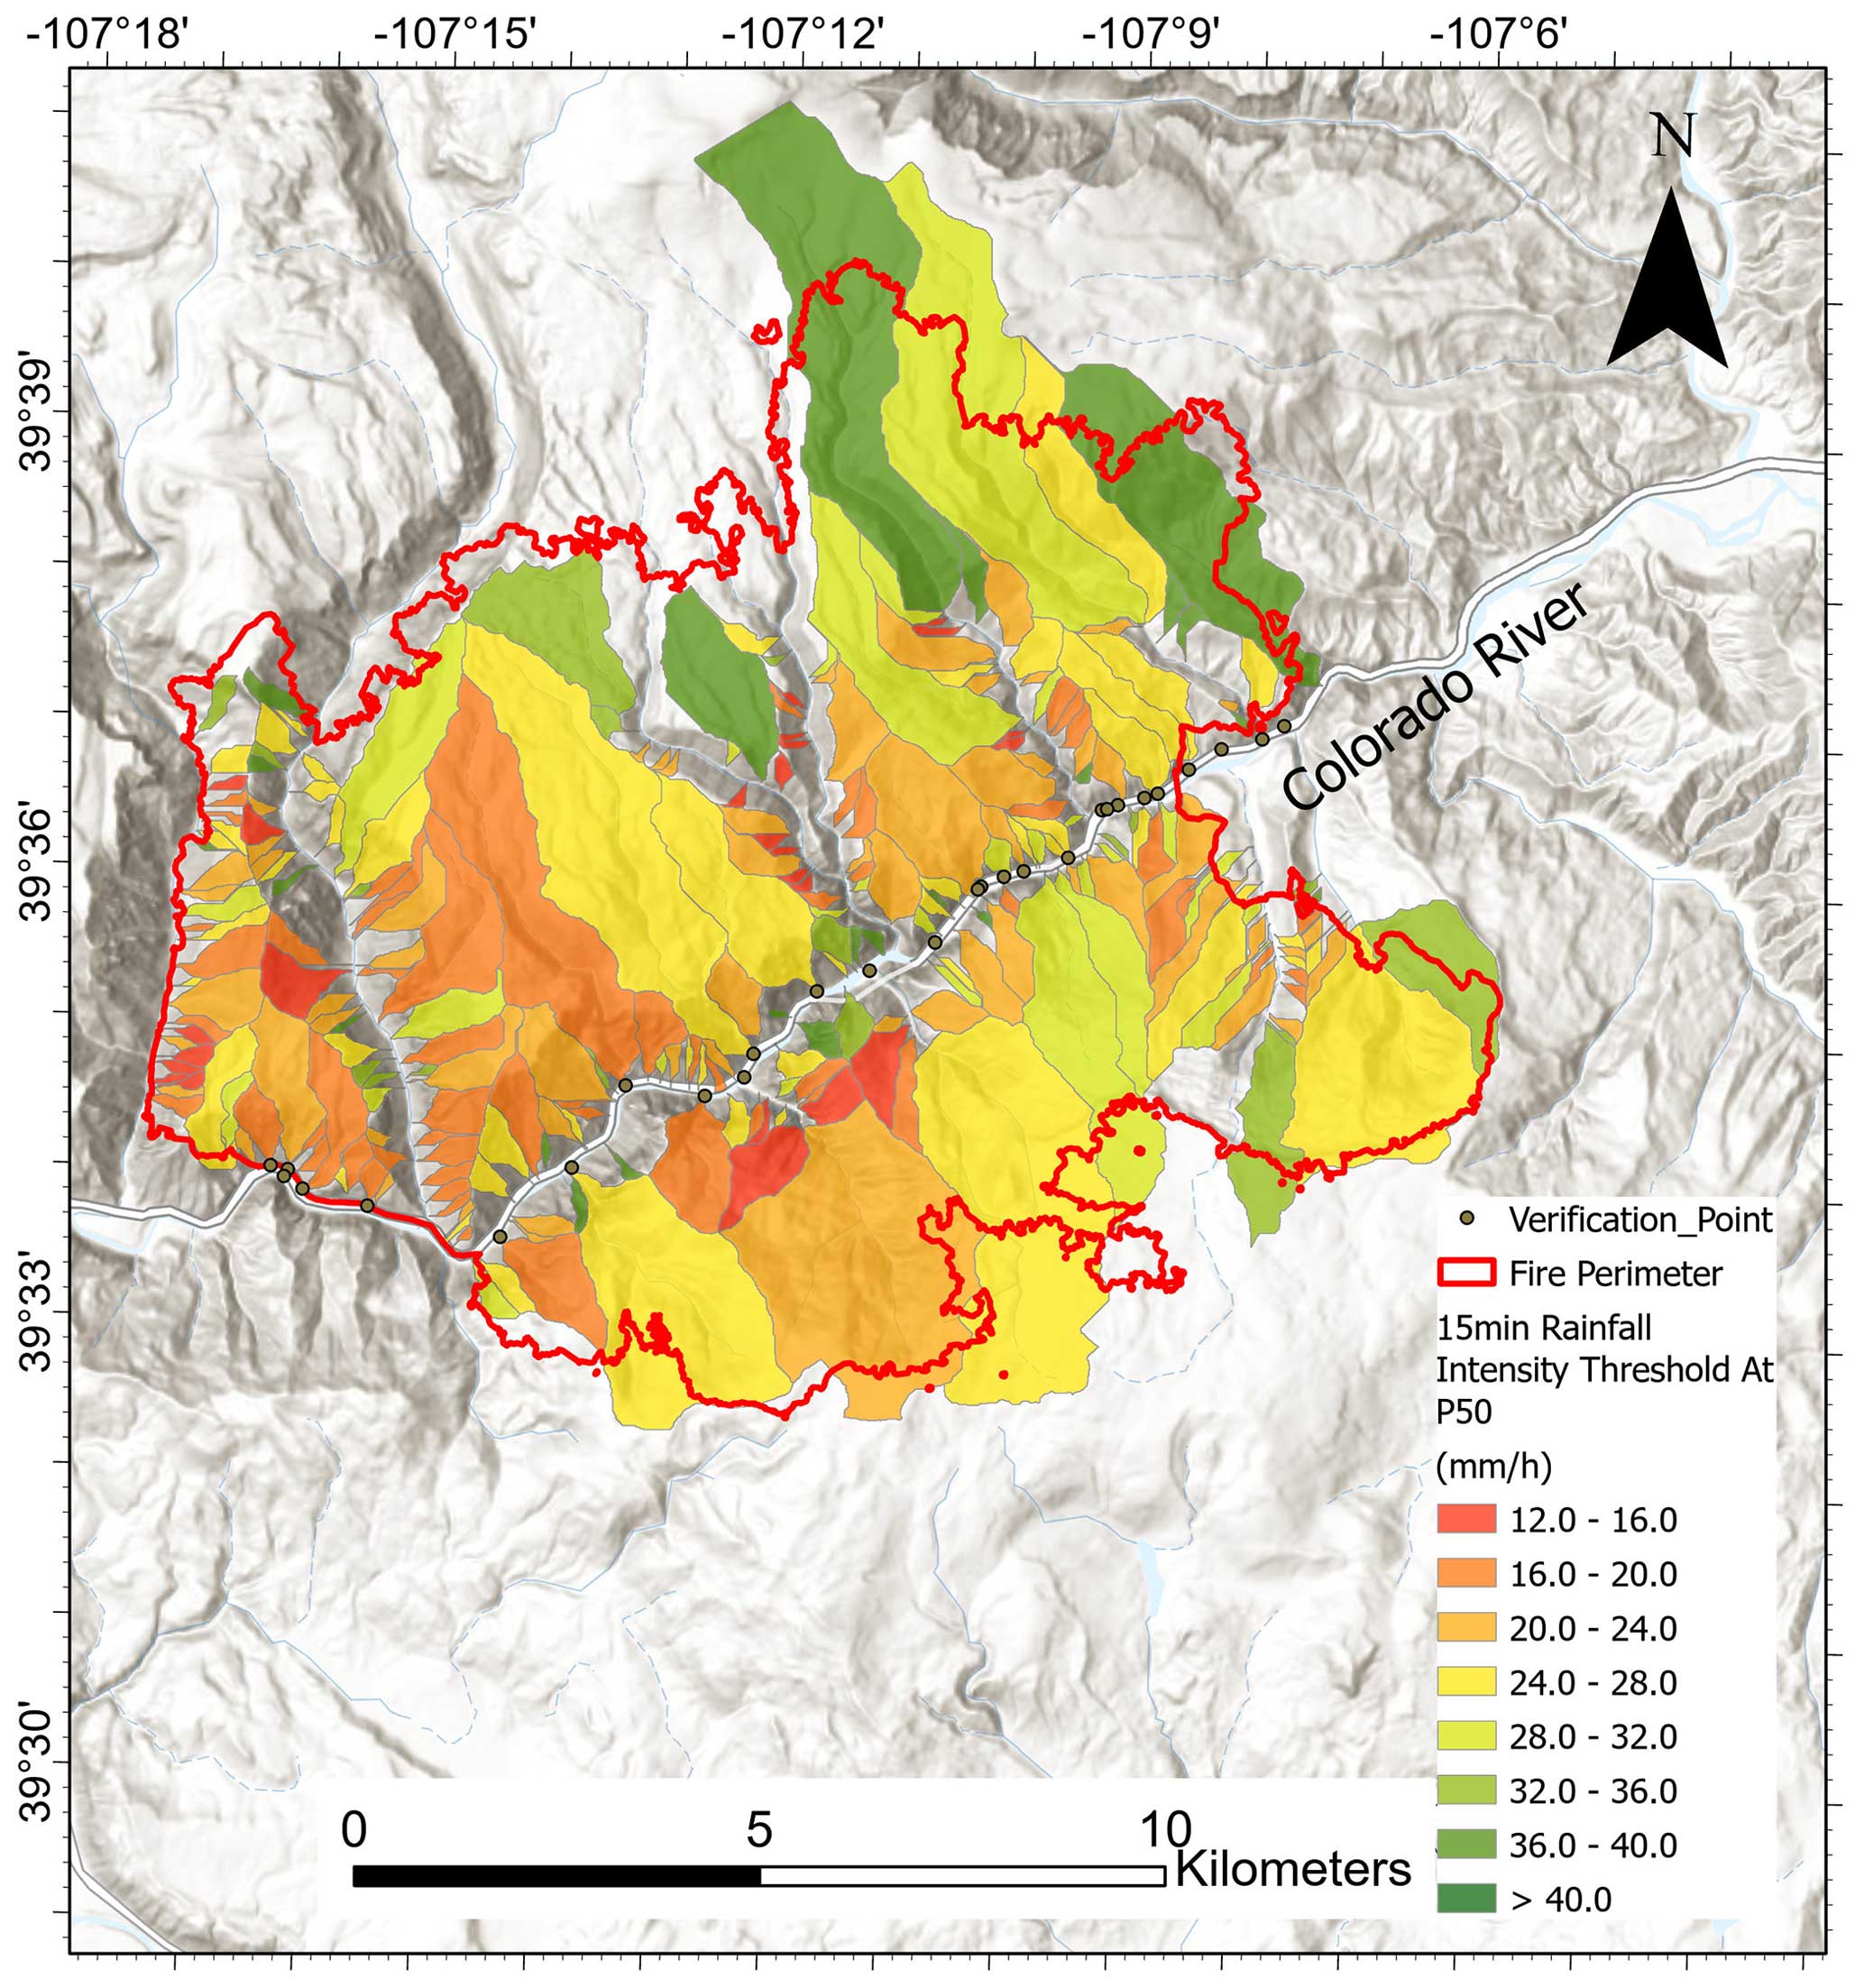
Figure 1USGS debris-flow hazard assessment produced for the Grizzly Creek Fire perimeter using Eq. (1). The 15 min rainfall intensity threshold is shown for each basin, assuming a likelihood of 50 % (P50). The median value from all of these basins is used to estimate the year-1 15 min rainfall intensity threshold for the entire burn area. Background shaded relief topography credit: ESRI, Garmin, U.S. Geological Survey, and Bureau of Land Management.
The volume model used in the USGS operational postfire debris-flow hazard assessments was developed by Gartner et al. (2014), with the form
where Vg is volume [m3], I15 is the 15 min rainfall intensity [mm h−1], Bmh is watershed area burned at moderate and high severity [km2], and R is the watershed relief [m]. This approach was developed using postfire debris-flow volume data from sediment retention basins in southern California (Gartner et al., 2014).
3.2 Rainfall monitoring network
Three tipping bucket rain gauges were installed in the burn area on 17 September 2020 by the USGS Landslide Hazards Program. These gauges (USGS_gc_1, USGS_gc_2, USGS_gc_3; Fig. 2) were deployed specifically for the task of verifying the hazard assessment model (Fig. 1). An additional seven rain gauges (7) were added during the summer of 2021 by the USGS Colorado Water Science Center to provide situational awareness and inform operational warnings by the National Weather Service and CDOT. We were also able to obtain data from the Bair Ranch gauge operated by CDOT. As a result, a total of 11 rain gauges captured high-frequency (15 min) rainfall intensities in and around Glenwood Canyon (Fig. 2) and provided a relatively dense network of rain data to associate with debris-flow events. All gauges were operating by mid-July 2021, beginning on several different dates (Table 1).
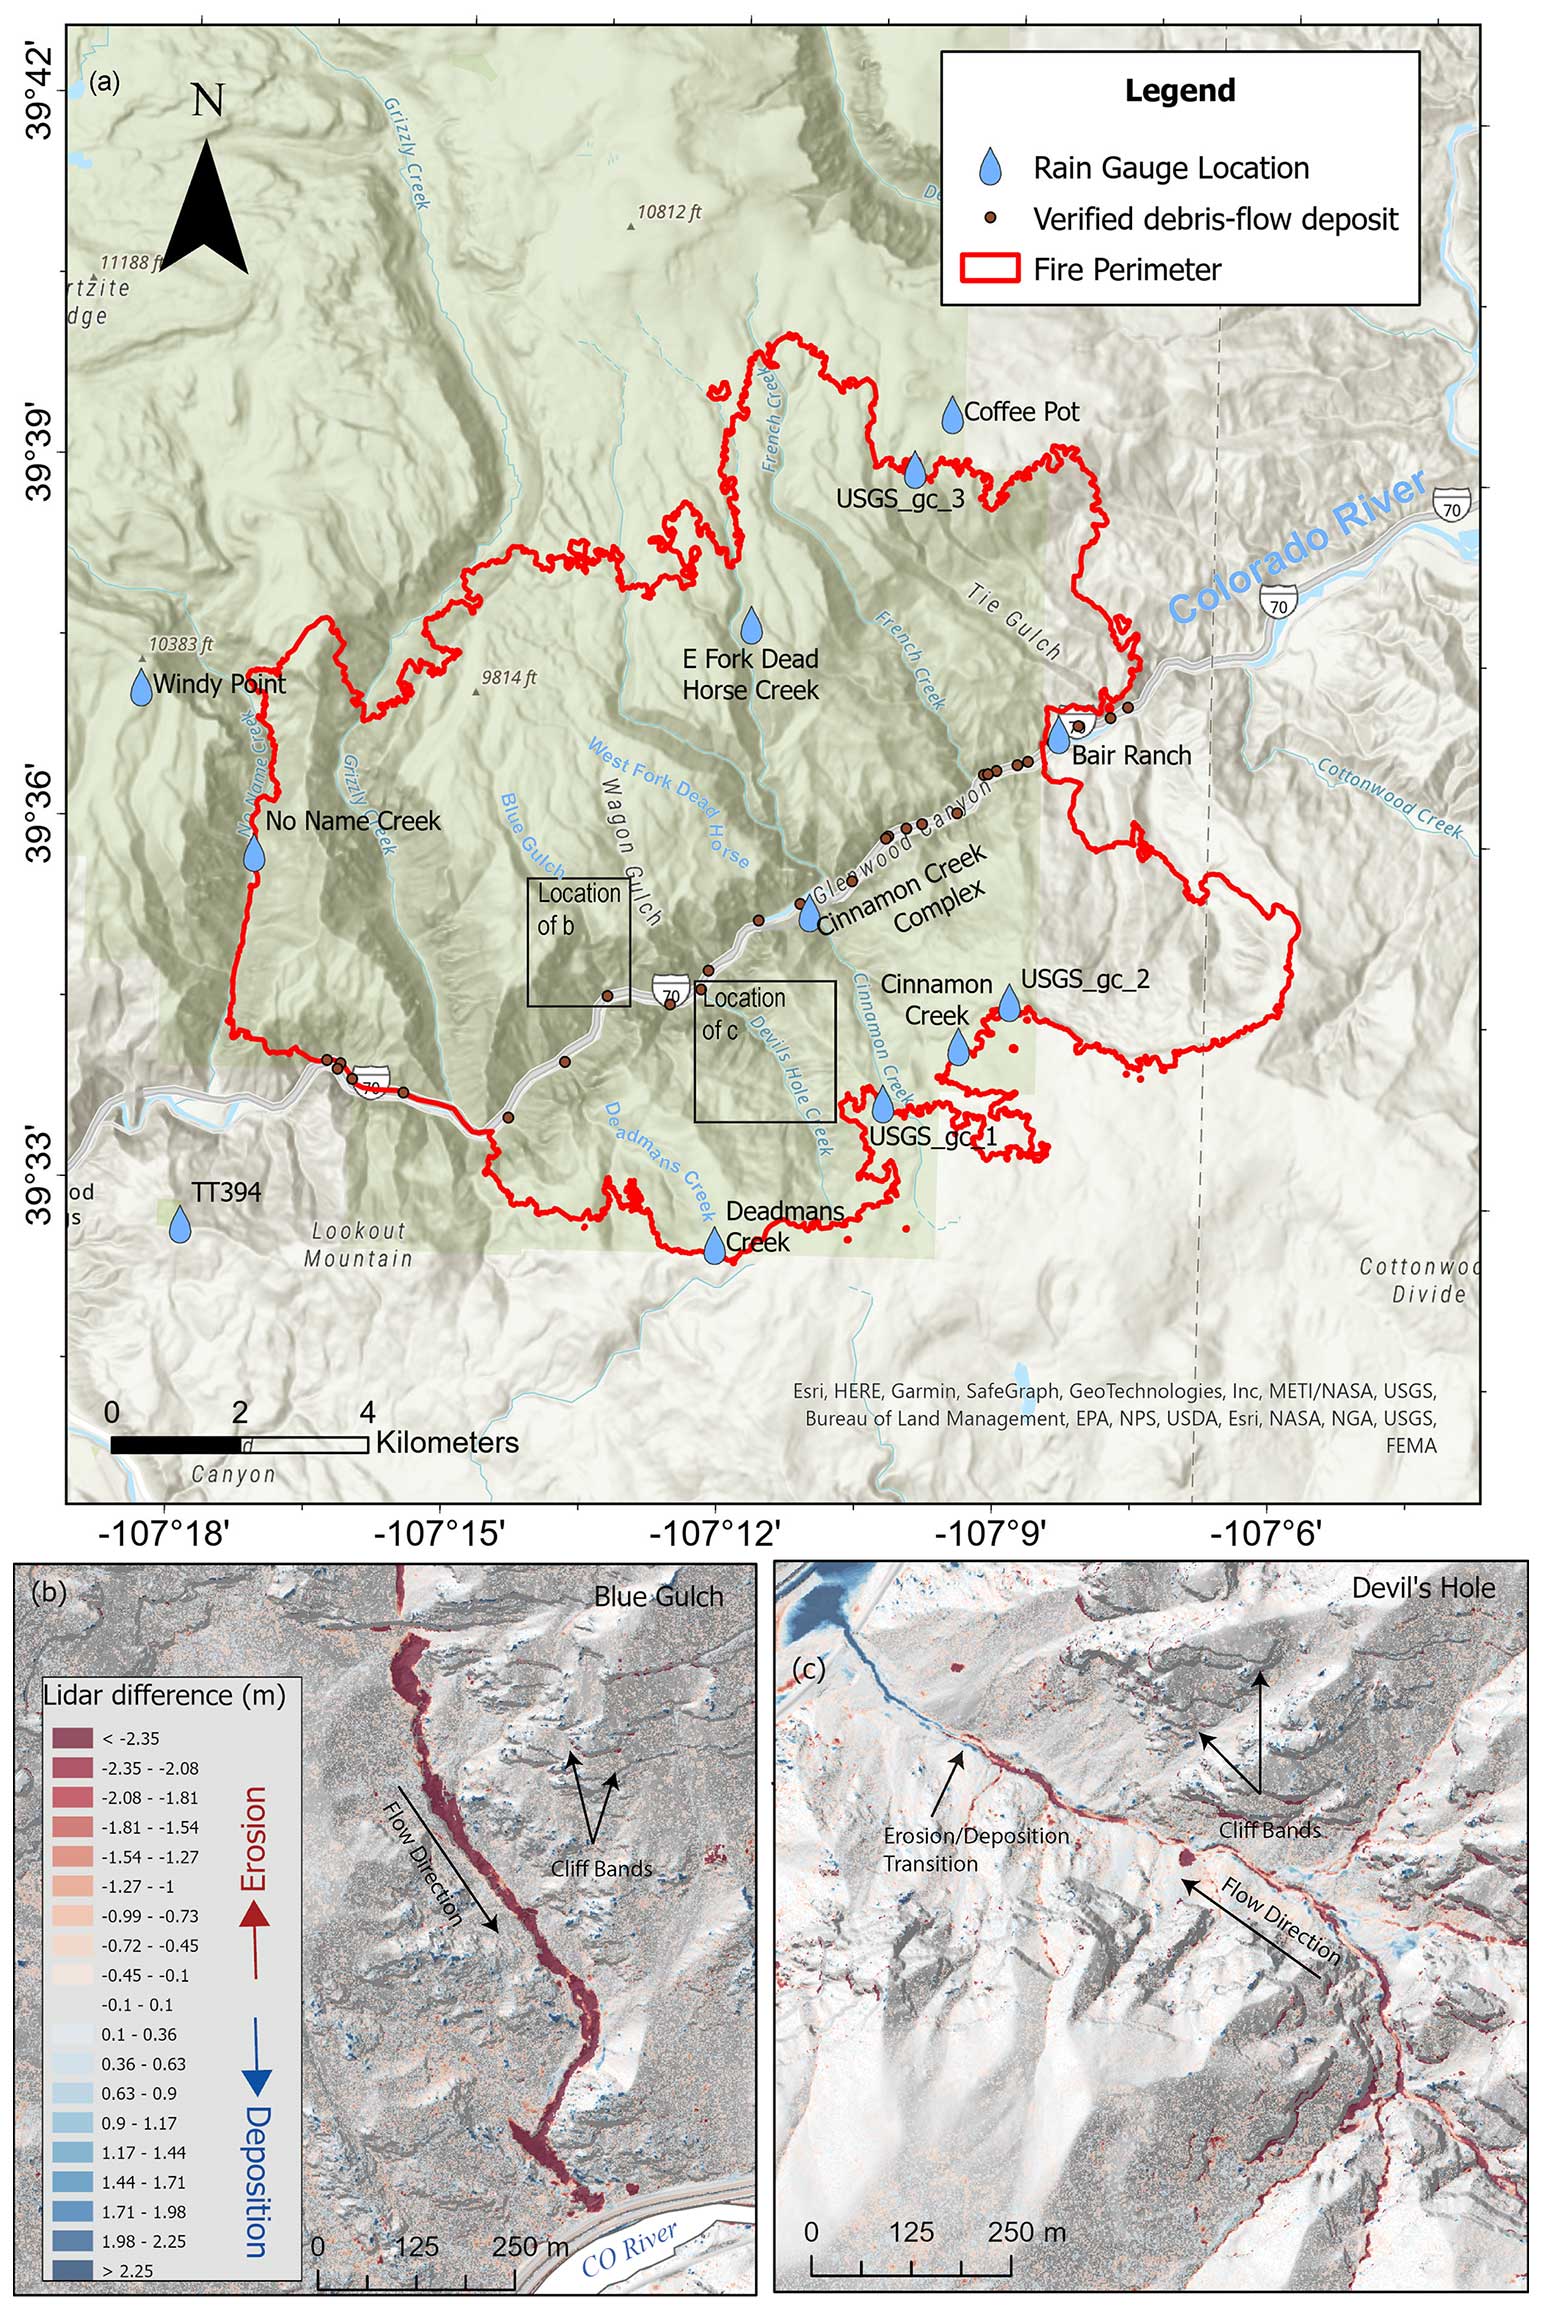
Figure 2(a) Map showing the burn perimeter, rain gauges, and locations of debris-flow observations. (b) DEM of difference map showing erosion (red) and deposition (blue) in the lower half of the Blue Gulch drainage. (c) DEM of difference showing erosion (red) and deposition (blue) in the lower half of the Devil's Hole drainage.
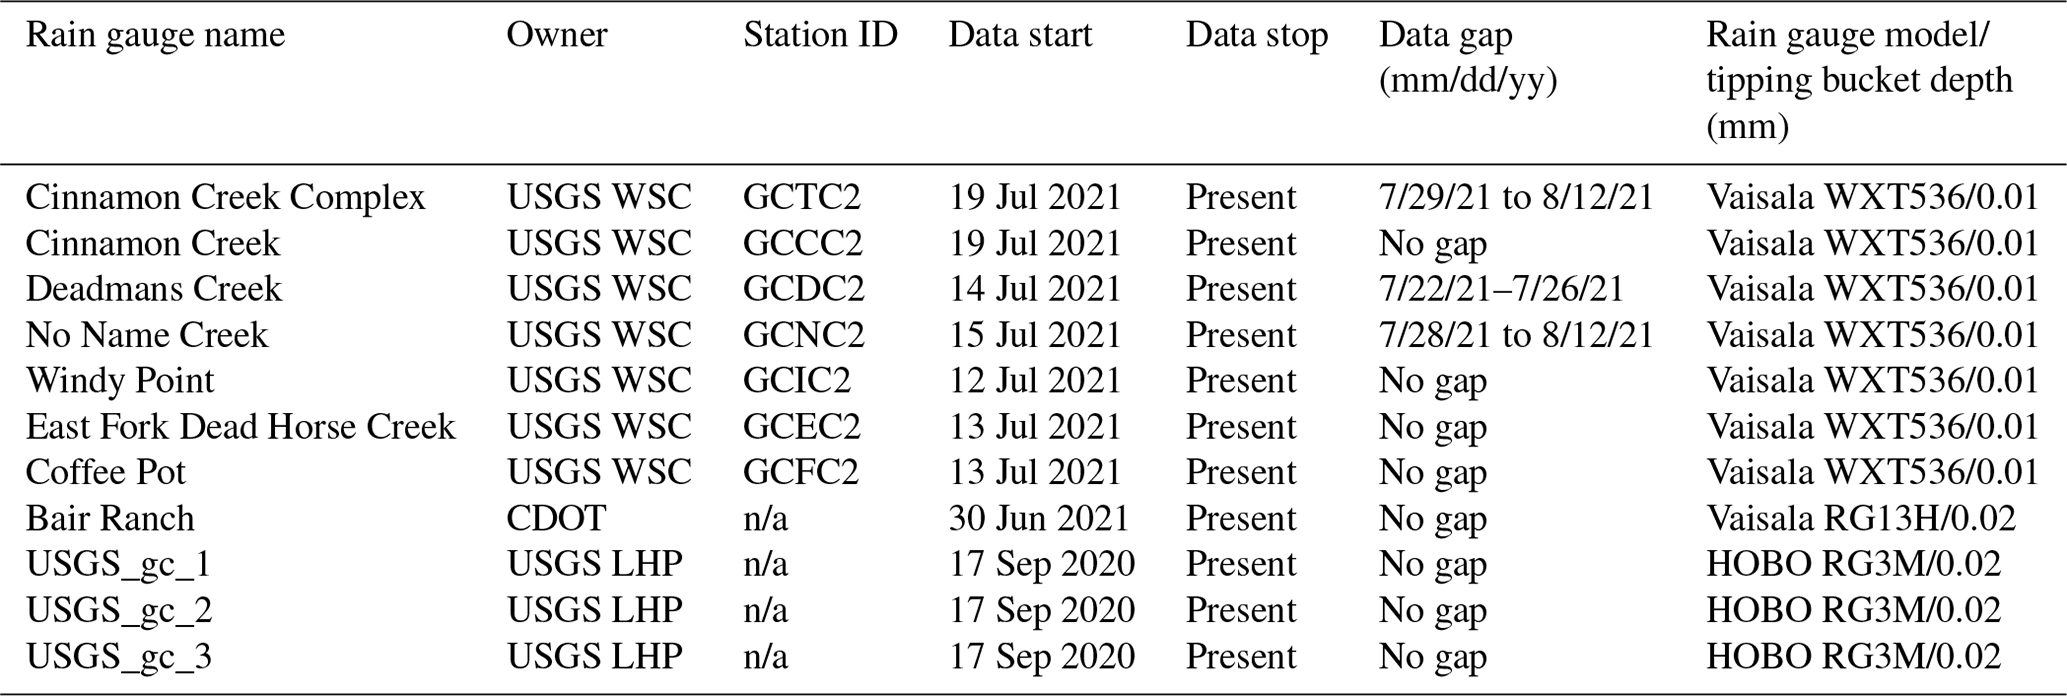
Table 1Rain gauges deployed in and around the Grizzly Creek burn area, operated by the USGS Colorado Water Science Center (USGS WSC), the Colorado Department of Transportation (CDOT), or the USGS Landslide Hazards Program (USGS LHP). Note that if no station ID is assigned, it is listed as not applicable (n/a).
3.3 Inventory of debris flows and storms
We generated an inventory of storms and debris flows using the rain gauge network near the fire perimeter (Rengers et al., 2023b). Observations of debris flows in drainages along I-70 were provided by CDOT personnel following storms. We used rainfall data to identify specific storms over the canyon during the 2021 and 2022 monsoon seasons, defining each new storm as the first measurement of precipitable water following a period of more than 8 h without rainfall (Staley et al., 2013). This standard was used to maintain consistency with Staley et al. (2017). For each defined storm, we calculated the total rainfall; the storm duration; and the peak 15, 30, and 60 min rainfall intensities (Rengers et al., 2023b).
We associated each debris-flow occurrence with rainfall data from a nearby representative rain gauge. Several rules were used to choose which rain gauge to attribute to a given debris-flow observation. First, we were limited by the available rainfall record, so we only used gauges with a rainfall record spanning the storm event (Table 1). Second, we prioritized rainfall data closest to the source areas of the debris flows. That is, the Colorado River dissects Glenwood Canyon in a general east–west direction, and tributary drainages flow obliquely into the Colorado River from the north and south rims of the canyon (Fig. 2a). Consequently, if a debris-flow observation was at the mouth of a drainage on the north side of the Colorado River, we would prioritize using a rain gauge on the north side of the canyon because the rainfall was expected to be more reflective of the upstream drainage basin that contributed to the observation rather than selecting a closer gauge on the opposite side of the Colorado River. Finally, if there were multiple rain gauges within a similar distance to the observation, we used a conservative approach and associated the gauge with the highest I15 rainfall record to the debris-flow observation. The maximum distance between an observation and its associated gauge was 6.8 km, the minimum distance was 0.2 km, and the average distance was 4.2 km (Rengers et al., 2023b). These distances are similar to other studies. Staley et al. (2016) used rain gauges within 4 km of an observation to generate the debris-flow inventory used to develop the M1 model, and Gartner et al. (2014) used distances of 2 km to assign storms to debris-flow activity.
3.4 Debris-flow initiation and volume
3.4.1 Mapping debris-flow initiation
Low-altitude aerial imagery and lidar were collected from a crewed aircraft on 24 August 2021, and we used these data to map points of debris-flow initiation. Unlike many runoff-generated debris flows that initiate from coalescing rills (e.g., Tillery and Rengers, 2019), debris-flow initiation at this site occurred primarily within channels (Fig. 4). We mapped initiation points where a difference in channel scour was visible in the imagery (Fig. S1 in the Supplement). Select mapped locations were verified with field observations in the Blue Gulch (Fig. 3), French Creek, and Grizzly Creek watersheds. Mapped debris-flow initiation points were subsequently checked against a before–after lidar digital elevation model (DEM) of difference (DoD) (see Sect. 3.4.2). If the DoD showed a distinct change from no erosion to erosion at a mapped debris-flow initiation location, the mapped initiation point was retained, but if there was no change in erosion in the DoD, the initiation point was rejected (Fig. S1).
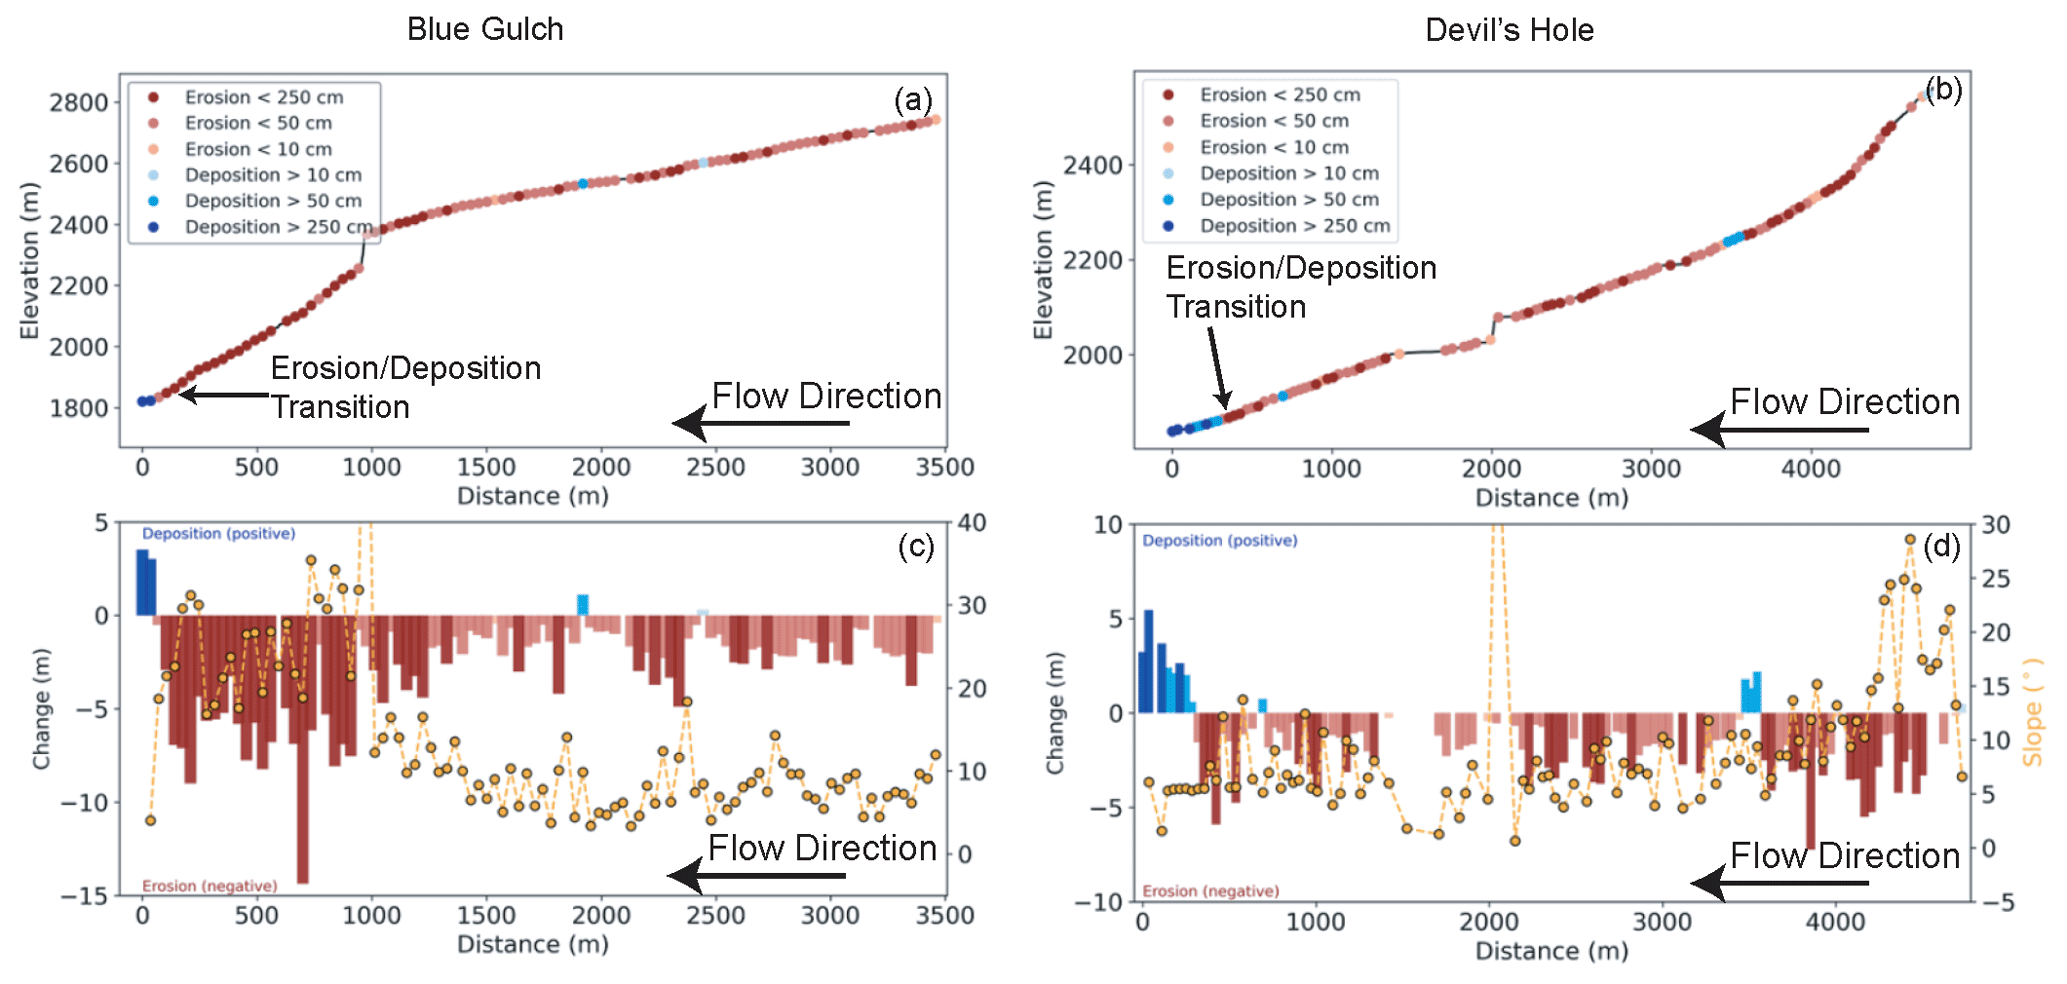
Figure 3(a) Longitudinal profile of the Blue Gulch watershed. (b). Longitudinal profile of the Devil's Hole watershed. In both (a) and (b) red dots and blue dots represent erosion and deposition, respectively. Areas without a dot did not experience change beyond the level of detection. (c) Measured deposition and erosion in the Blue Gulch watershed. (d) Measured deposition and erosion in the Devil's Hole watershed. In both (c) and (d) local slope is shown on the secondary y axis.
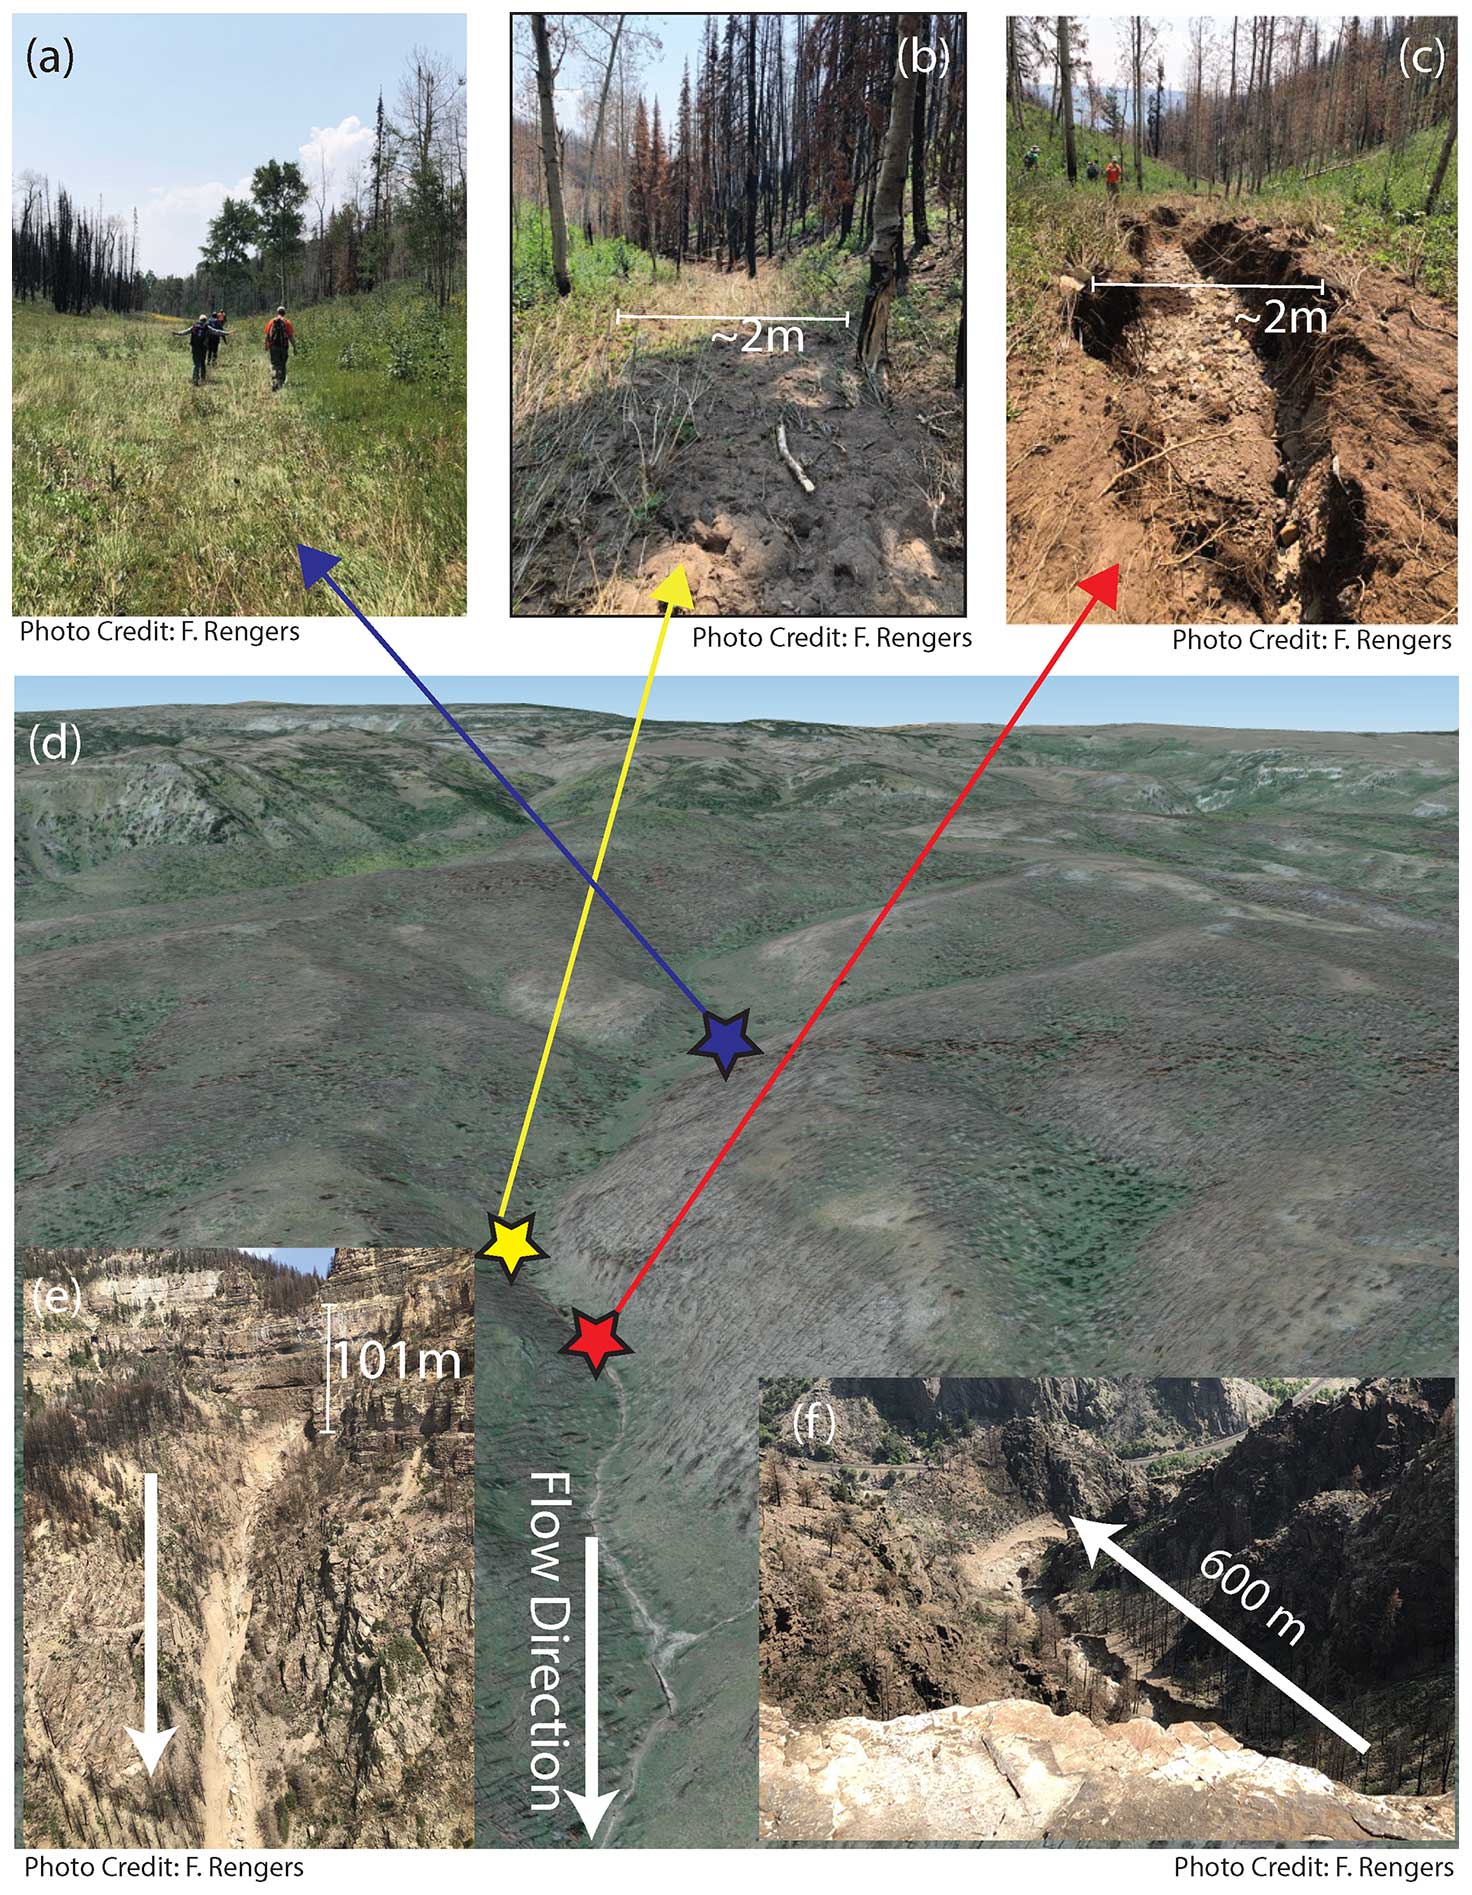
Figure 4Debris flows were triggered in the Blue Gulch watershed on 29 July and 31 July 2021. Photos from 17 August 2021 show debris-flow initiation transitioning from (a) water flow matting down grass (see people for scale), (b) to incipient erosion of grassy root wads without distinct channel incision, and (c) to channelized erosion below the root layer. (d) © Google Earth imagery of the upper portion of the Blue Gulch watershed. (e) Photo from 18 August 2021 of a cliff (101 m relief) in the Blue Gulch watershed 2.2 km downstream of the initiation location. (f) Photo from 17 August 2021 at the cliff edge (shown in e) illustrating the debris-flow path towards the Colorado River.
3.4.2 Lidar collection and volume estimation
Lidar data were available before and after the Grizzly Creek Fire in 2016 and in 2021 (Rengers et al., 2023a). The 2016 lidar was collected during a series of flights between 10 June and 7 October 2016. The 2021 lidar flight was conducted on 24 August 2021. An initial investigation of the 2016 point cloud determined that there was an internal flight line offset of approximately 0.5 m. To address this offset, we requested that the original vendor re-process the 2016 point clouds. Using the re-processed point clouds, we sought to determine any misalignment between the 2016 and 2021 datasets by examining the distribution of elevation differences over a large low-slope hillslope area of the canyon. We found that the change was normally distributed around a mean of 0 (Fig. S2), showing that there was no systematic horizontal offset in the two datasets after re-processing the 2016 data. We evaluated the level of detection (LoD) for the lidar difference along I-70, assuming that the road surfaces were stable and fixed between the 2016 and 2021 scans. The paved roads consistently showed error variance of less than 10 cm; therefore, we used ±10 cm as our LoD (Fig. S3).
Using the two lidar datasets (1 m pixel), we subtracted the elevation of the post-event lidar from the pre-event lidar (Z2021−Z2016) to create a DoD map of erosion and deposition throughout the Grizzly Creek burn area (Figs. 2 and 3). For each debris-flow observation in our inventory, we mapped erosional and depositional areas in each channel with separate polygons by hand. Hillslope erosion, which is below the detection limit of the lidar, was assumed to be minimal based on post-event field observations that indicated minor hillslope surface erosion. We masked cliff areas from the DoD and all slopes >45° to eliminate lidar artifacts due to interpolation across steep slopes. Some deposition was observed in the field in the form of levees (Fig. S4); however, levees were not systematically mapped in the lidar because they were often smaller than the pixel cells and therefore difficult to confirm without field verification. Additionally, some spurious change was observed on the hillslopes, likely due to vegetation classification errors, and this error was mitigated by focusing our analysis on channelized areas where field observations showed the primary debris-flow activity. The mapped channel polygons allowed us to quantify the provenance of the debris-flow material and its volume as a function of contributing drainage area, as well as to examine the erosion to deposition transition in debris-flow channels.
The eroded volume was estimated by summing DoD pixels within each mapped erosion polygon from the estimated point of debris-flow initiation to the onset of deposition. Similarly, deposited volume was estimated by summing DoD pixels within the deposition polygon from the erosion/deposition transition point to the base of the fan. At sites where the depositional fan was retained, we compared the volume of material eroded upstream to the volume of material deposited. Where fans were not modified by fluvial erosion or highway cleanup work, the upstream erosional measurements in the DoD should match the downstream depositional measurements within the LoD uncertainty. Confidence in the erosion estimates from the DoD is relatively high because the channels were mostly undisturbed between the debris-flow activity and the post-event lidar flight. However, there was more uncertainty around depositional areas.
3.4.3 Fan volume estimate
Debris flows triggered during the 2021 storms resulted in sediment storage in either (1) large fans at watershed outlets or (2) in-channel deposits. The timing of the large fans at channel outlets was captured in our inventory because they were observed by CDOT personnel. The timing of in-channel deposition is unknown because there were not witnesses to document the event. In-channel deposits were specifically observed in French Creek, Tie Gulch, Grizzly Creek, and Dead Horse Creek (Fig. 5). Debris flows observed along Grizzly Creek most likely occurred on 31 July 2021 based on satellite imagery (3 m) (Planet Application Program Interface: In Space for Life on Earth, 2021). The remaining three drainages (French Creek, Tie Gulch, and Dead Horse Creek) with in-channel deposits could not be assigned to a single storm due to gaps in imagery and cloud cover. The deposit in French Creek likely occurred between 3–5 July 2021 based on trail camera data (Video S1 in the Supplement) and satellite imagery (Planet Application Program Interface: In Space for Life on Earth, 2021). The deposit in Dead Horse Creek likely occurred between 5–12 August 2021 based on satellite imagery (Planet Application Program Interface: In Space for Life on Earth, 2021). The timing of debris-flow deposition in Tie Gulch could not be identified specifically, but it occurred in the summer of 2021.
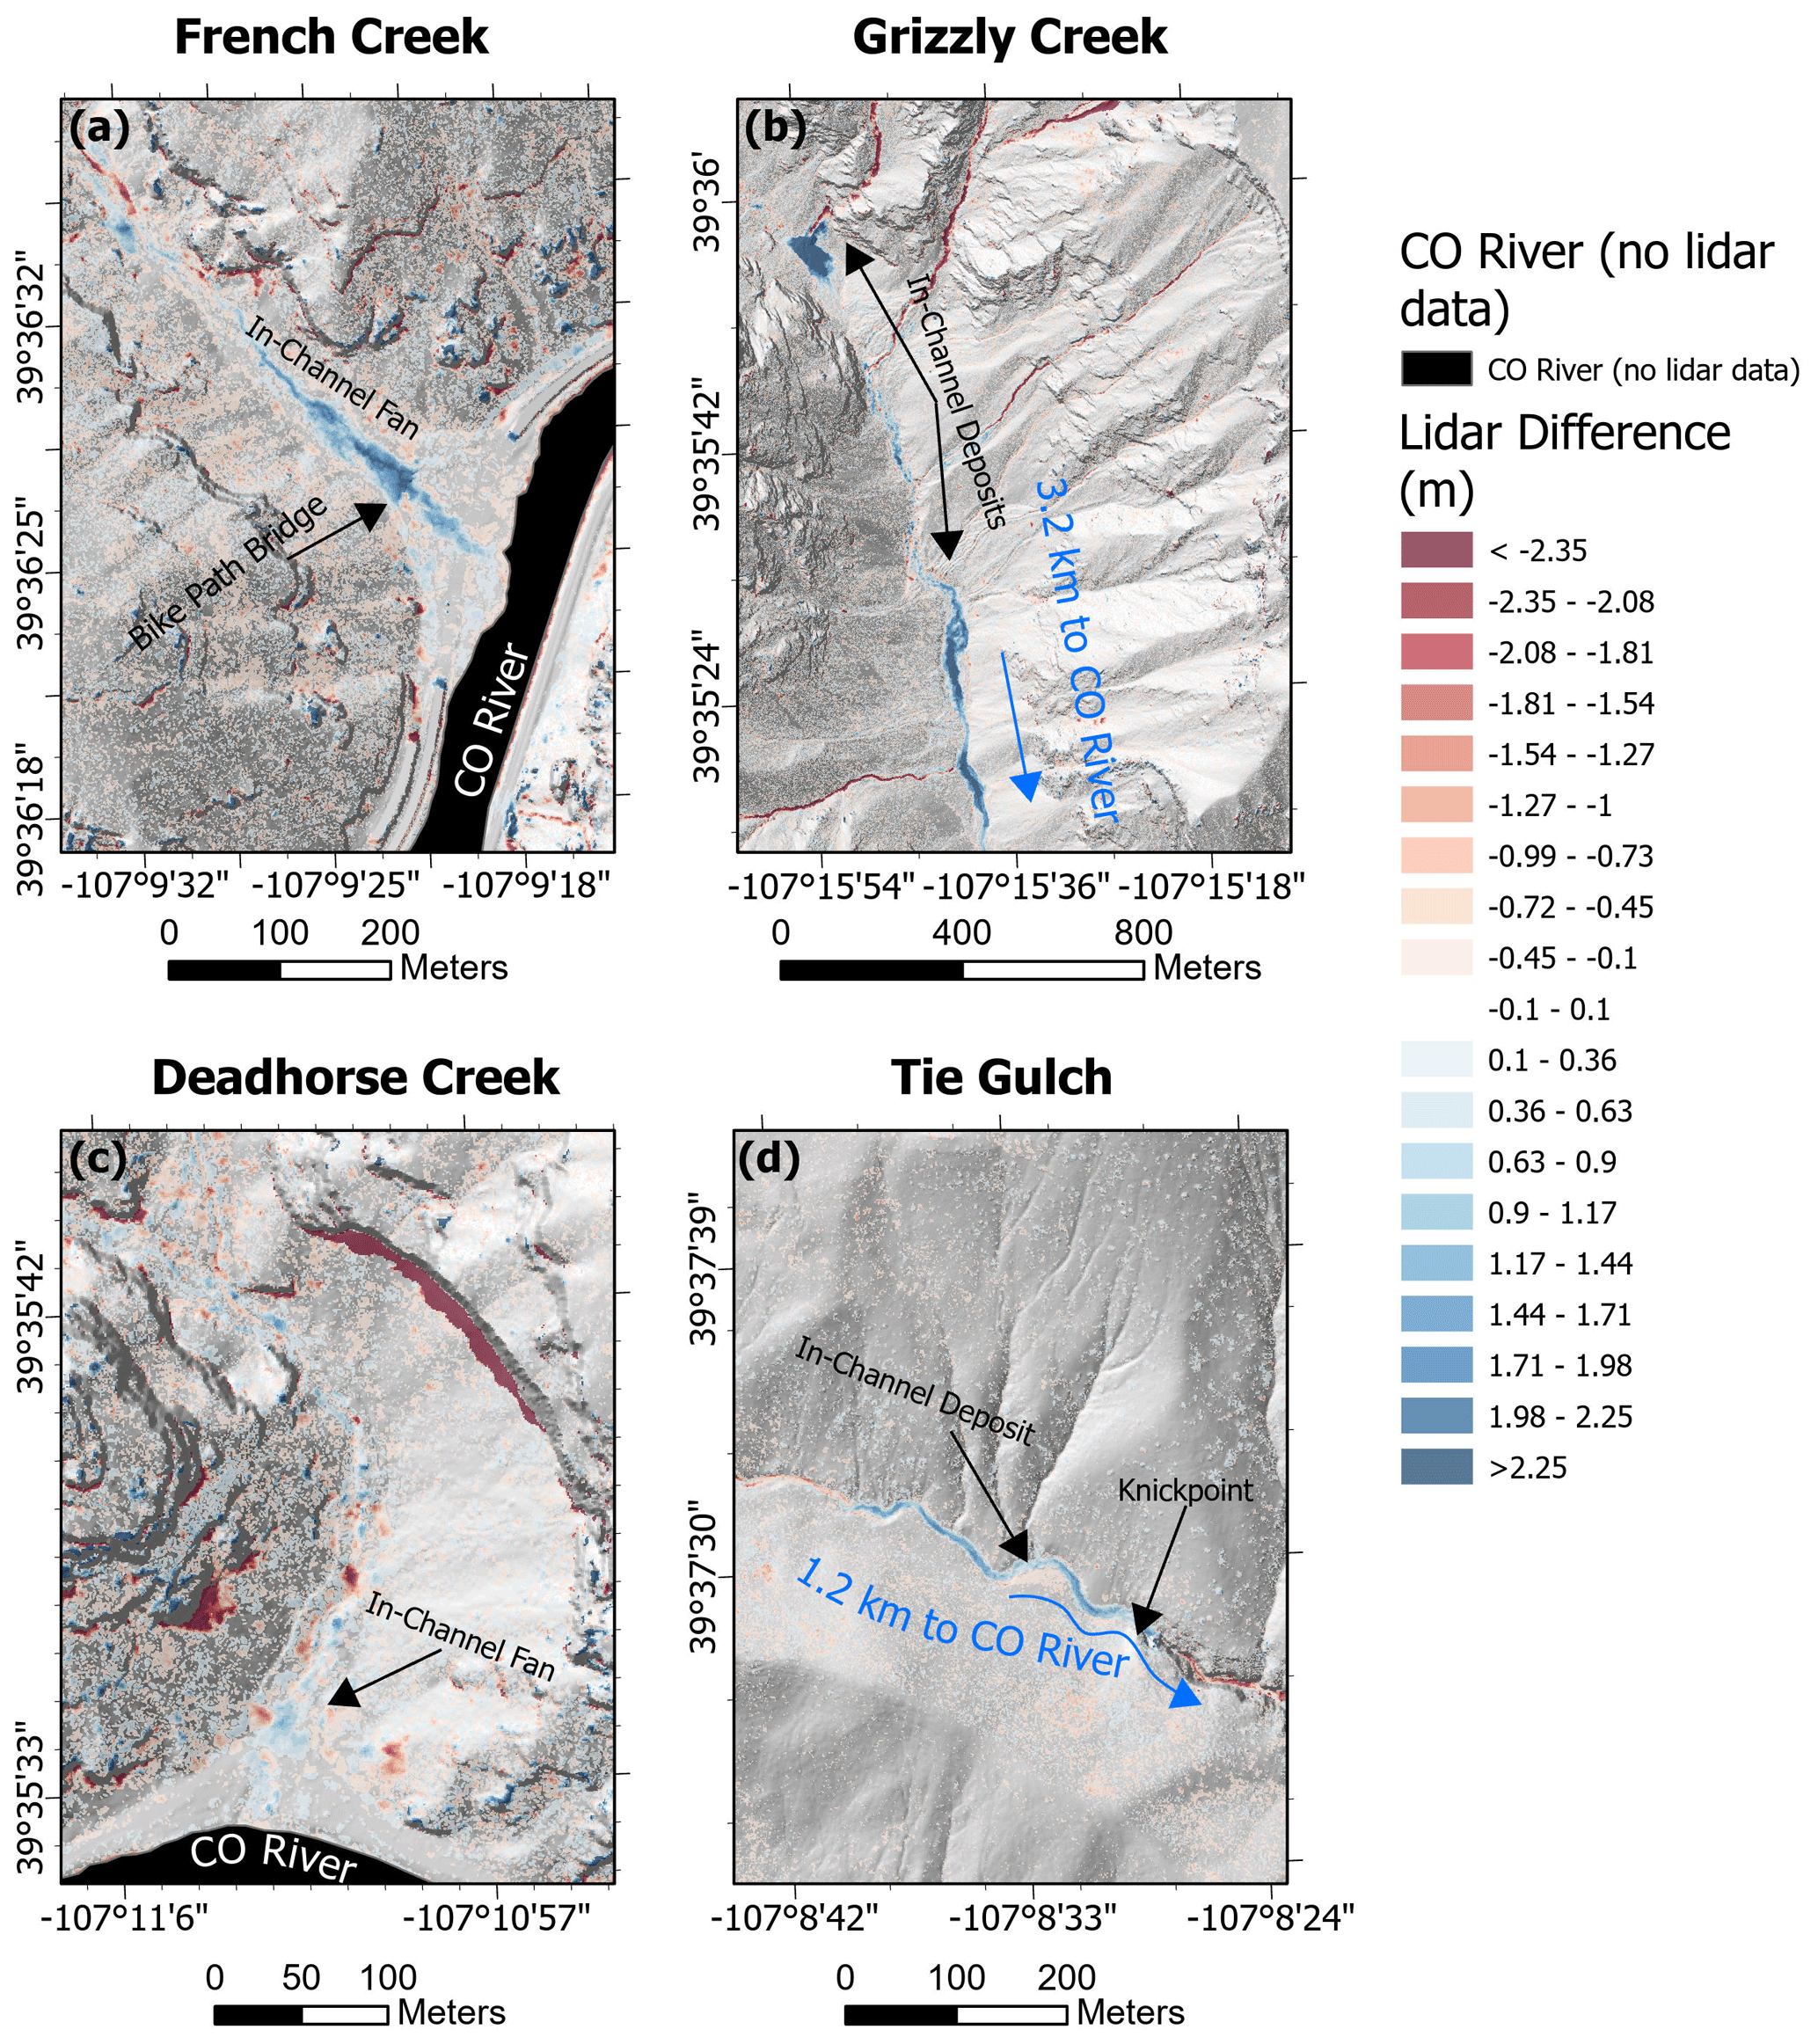
Figure 5In-channel sediment deposits in large drainage basins. (a) French Creek: a fan forms upstream of the Colorado River, primarily because sediment is blocked by a concrete bike path bridge. (b) Grizzly Creek: several in-channel deposits formed several kilometers upstream of the Colorado River. No fan formed at the outlet of Grizzly Creek. (c) Dead Horse Creek: relatively minor depositional fan forms upstream of the Colorado River. (d) Tie Gulch: in-channel deposits develop upstream of a knickpoint.
Large fans with known depositional timing at watershed outlets were identified in six locations along the Colorado River (Table 1). Of the six fans where timing was known, five were triggered by a storm on 31 July 2021. A sixth fan at Devil's Hole resulted from two separate storms that caused debris-flow deposition: a storm on 22 July 2021 and a second storm on 29 July 2021 (Fig. 2c). Note that all debris-flow fans deposited onto I-70 were removed by maintenance crews prior to the 2021 lidar collection, and therefore fan deposition on I-70 was not available for analysis.
To estimate the depositional volume of the six fans in the Colorado River, we divided the deposit into three sets of volumes (V1, V2, and V3) (Fig. 6). V1 is the total volume of sediment deposited upstream of the Colorado River computed from the DoD. This volume is calculated as
where i represents the index of each DEM cell in a deposited fan, n is the total number of cells in the DoD of the deposited fan, Z2021 is the elevation of the lidar DEM from 2021, Z2016 is the elevation of the lidar DEM from 2016, and Acell is the surface area of the DEM cell. We divided the volume deposited in the Colorado River into two pieces. These volumes are stacked (one on top of the other) in an area that was fully occupied by the Colorado River prior to fan deposition. V2 is the subaerial volume above the river water surface elevation (WSE) at the time of the post-event lidar collection. V2 was calculated using
where hw is the average elevation at the margins of the fan, which serves as a proxy for the WSE at the time of the 2021 lidar flight. Finally, V3 represents the volume underneath hw. Here we used personally communicated reports of the average sediment depth (d) for the entire plan view mapped area below the water surface (Aplanview) estimated from CDOT maintenance crews who excavated the material (Table 2).
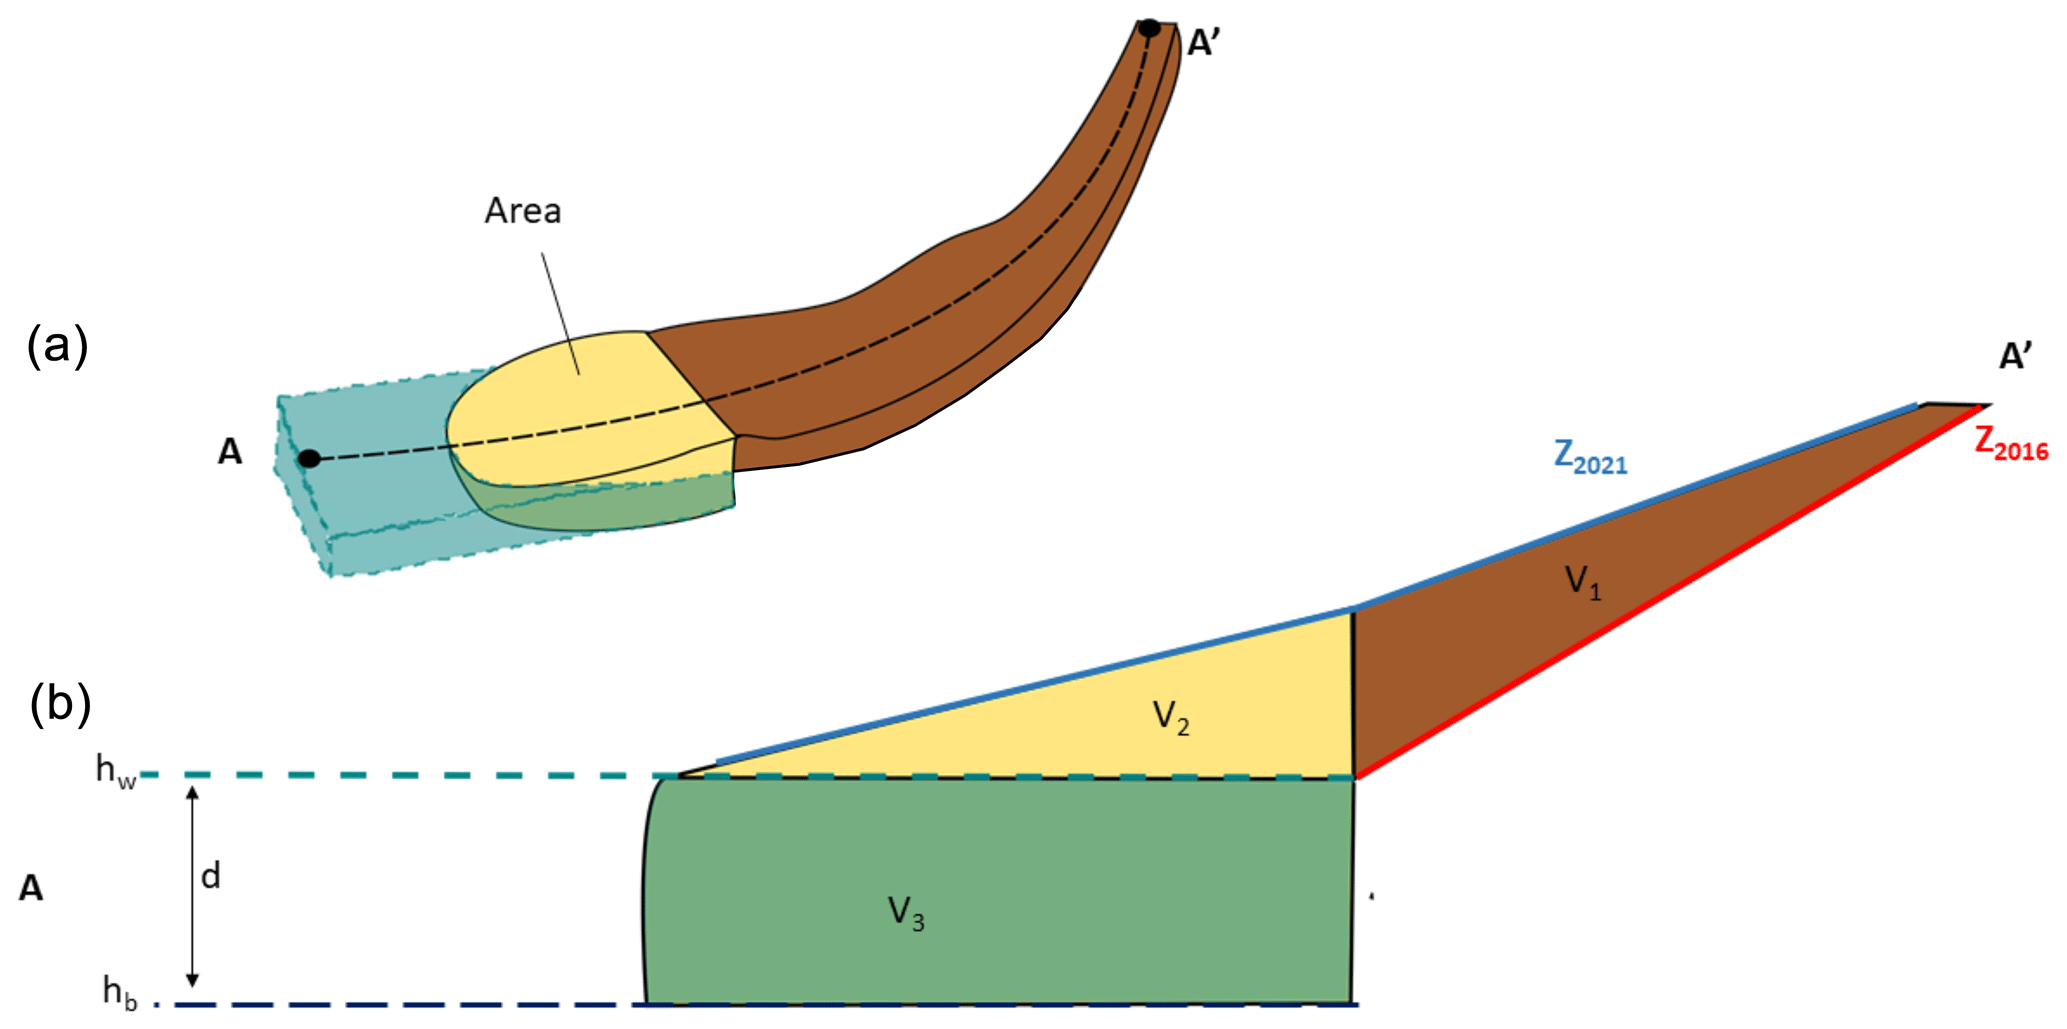
Figure 6(a) Oblique view and (b) cross-sectional view of the approach used to estimate the volume of deposited sediment in the Colorado River due to unknown bathymetry. The volume of sediment deposition was divided into three zones. V1 is the sub-areal zone, where a lidar difference can be used to estimate the volume. V2 is the zone above the water surface. V3 is the subaqueous zone, and the depth is estimated based on reports from CDOT maintenance crews.
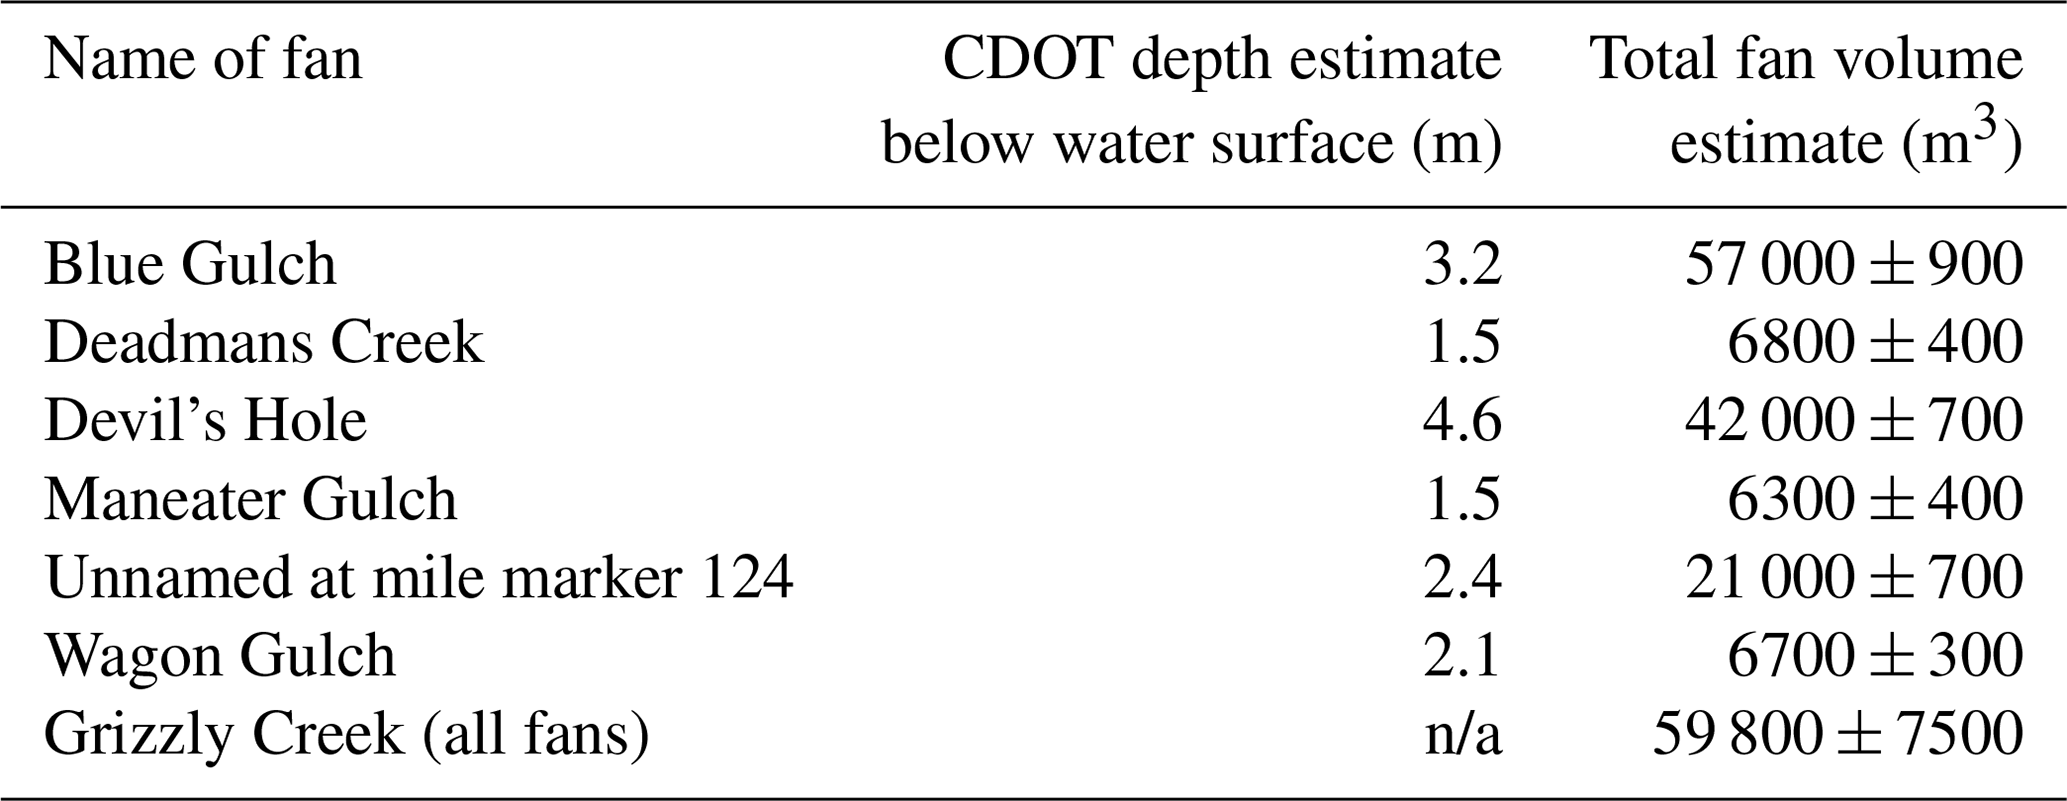
Table 2Table of depositional fans with known storm triggering dates. For fans deposited within the Colorado River, CDOT estimates of the sub-aerial sediment depth are provided. n/a stands for not available.
Sediment deposited in the Colorado River was removed both by fluvial erosion and by mechanical excavation intended to protect infrastructure. Because the post-event lidar was collected after some sediment removal and because pre-event bathymetry of the Colorado River was unknown, we expect our approach gives lower-bound estimates for depositional fan volumes within the Colorado River.
3.4.4 Volume model analysis
We compared the volume of the erosional portion of the debris-flow channels with the current debris-flow volume model used in USGS postfire debris-flow hazard assessments (Eq. 2). For this comparison, we selected the transition point of erosion to deposition in drainage basins where debris-flow timing was known to calculate Bmh and R. Debris-flow timing recorded in our inventory was used to select the peak I15 from the nearest representative rain gauge. If there were multiple storms that triggered debris flows in the same watershed, we used Eq. (2) to estimate Vg for each storm and then summed volumes. We fit a regression line to Vg versus the observed volume (Vo) to examine the success of the estimated volumes and examined how Vg and Vo changed as a function of upstream drainage area.
To set the Grizzly Creek Fire debris-flow volume observations into a regional context, we also compared the Grizzly Creek volume data to available volume data from debris flows observed following the South Canyon and Coal Seam fires. Limited rainfall data for the South Canyon Fire precluded the use of Eq. (2); however, upstream drainage area and debris-flow volume data were available (Cannon et al., 2001). The Coal Seam Fire had sufficient data to perform a comparison between observed volumes and estimated volumes computed using Eq. (2). The volume data for the South Canyon and Coal Seam fires were collected using the methods described by Santi et al. (2008), where researchers made measurements within channels estimating scour depth. The uncertainty differences between these field measurements and the lidar data are unclear; however, we estimate that the field measurements may be of a similar magnitude as the lidar (tens of centimeters).
3.5 Vegetation recovery
Vegetation recovery was monitored by field excursions in the burn area to qualitatively observe regrowth within specific plant communities, in particular Gambel oak (Quercus gambelii), cottonwood (Populus angustifolia), Aspen (Populus tremuloides), and mixed conifer that include Douglas fir (Pseudotsuga menziesii). To quantify postfire regrowth of vegetation and evaluate its effect on debris-flow susceptibility in the Grizzly Creek burn area, we examined three remotely sensed satellite vegetation indices. We acquired satellite imagery from Landsat 8–9 (Collection 2 – L2 processing level, 30 m spatial resolution, 8 to 16 d revisit time) and Sentinel 2 (Level 2A processing level, 10 m spatial resolution, 5 d revisit time). The imagery was used to quantify changes in surface-reflectance-derived spectral indices, which represent vegetation states across the Grizzly Creek Fire (Sentinel Hub, 2023). With these data we calculated the normalized burn ratio (NBR), normalized difference vegetation index (NDVI), and the enhanced vegetation index (EVI). Vegetation index values were averaged across each modeled basin (U.S. Geological Survey, 2020) that intersects the burn perimeter. We then tracked these indices during five distinct periods: (1) at the beginning of the monsoon season (15 June 2020) prior to the fire, (2) prior to fire ignition (10 August 2020), (3) after fire containment (18 December 2020), (4) at the beginning of the monsoon season in 2021 (15 June 2021), and (5) at the beginning of the monsoon season in 2022 (15 June 2022). Owing to differences in satellite revisit times and atmospheric conditions over the burn area, the Landsat and Sentinel imagery collection times are typically within 2 weeks of each other. We estimated recovery as the increase in reflectance in vegetation indices from the postfire period divided by the difference in reflectance between the pre- and postfire periods.
3.6 Using dNBR to estimate a year-2 threshold
We tested the current method of using P75 as a rainfall threshold for year 2 against a new approach using remotely sensed metrics. As an alternative to P75, we re-calculated the hazard assessment (Eq. 1) using the dNBR from the Landsat imagery at the beginning of the second monsoon season and estimated rainfall thresholds based on the recovered vegetation indices. We compared the median (P50) approach using the updated dNBR values in Eq. (1) and the P75 estimated from the original dNBR with the observed rainfall rates and debris-flow activity in year 2. This allowed us to test the efficacy of the current P75 approach.
4.1 Predicted rainfall thresholds
The debris-flow inventory reported by CDOT staff in the summer of 2021 captured 40 debris flows in 25 drainages (Rengers et al., 2023b). Some of these locations produced debris flows during more than one storm (Figs. 2 and 7). There were no debris flows reported in 2022. The storm inventory during the summer of 2021 included 49 rainstorms with a peak I15 greater than 1 mm h−1 from 15 June to 29 September 2021. Nine of these storms triggered one or more debris flows (Fig. 8a). The storm inventory during the summer of 2022 included 56 unique rainstorms with a peak I15 greater than 1 mm h−1 from 18 June to 17 September 2022 (Fig. 8b).
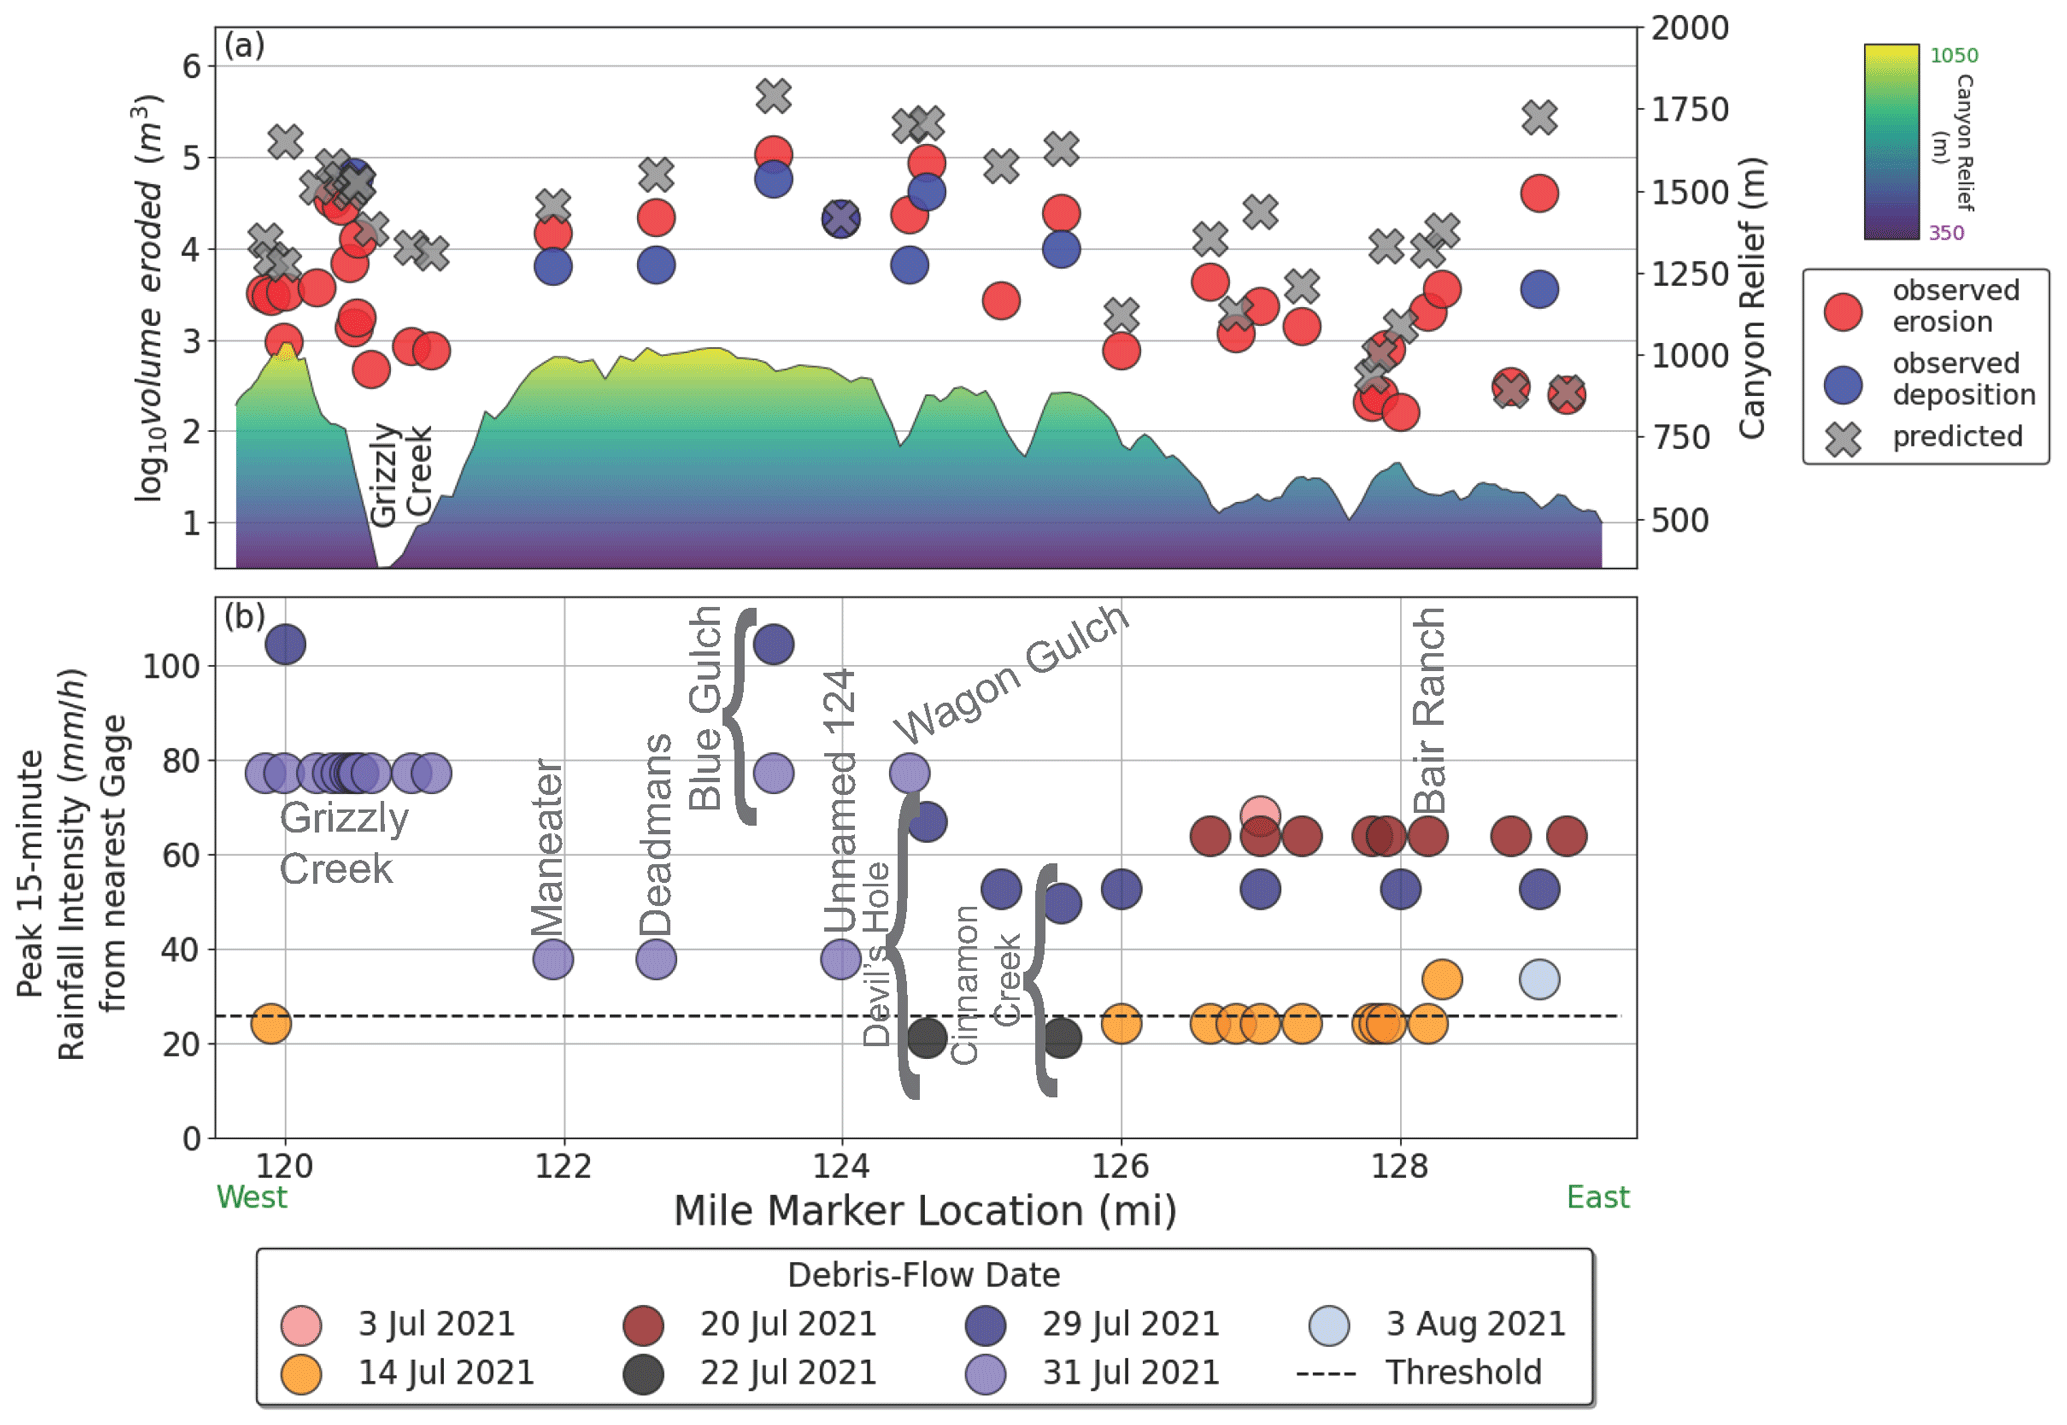
Figure 7(a) Observed sediment volume (erosional and depositional) and estimated sediment volume using Eq. (2) shown as a function of the mile marker location in Glenwood Canyon. For context, the canyon relief is shown on the secondary axis. The relief profile indicates the elevation from the north side of the canyon approximately parallel to I-70. (b) Peak 15 min rainfall intensity from the nearest representative gauge shown at locations identified by debris-flow date. Note that debris-flow verification points were associated with a mile marker location at the watershed outlet, as this was the preferred method of identification by CDOT personnel. In cases where the channel outlet did not directly intersect I-70, the outlet was simply translated onto a line segment representing I-70 to estimate a mile marker location.
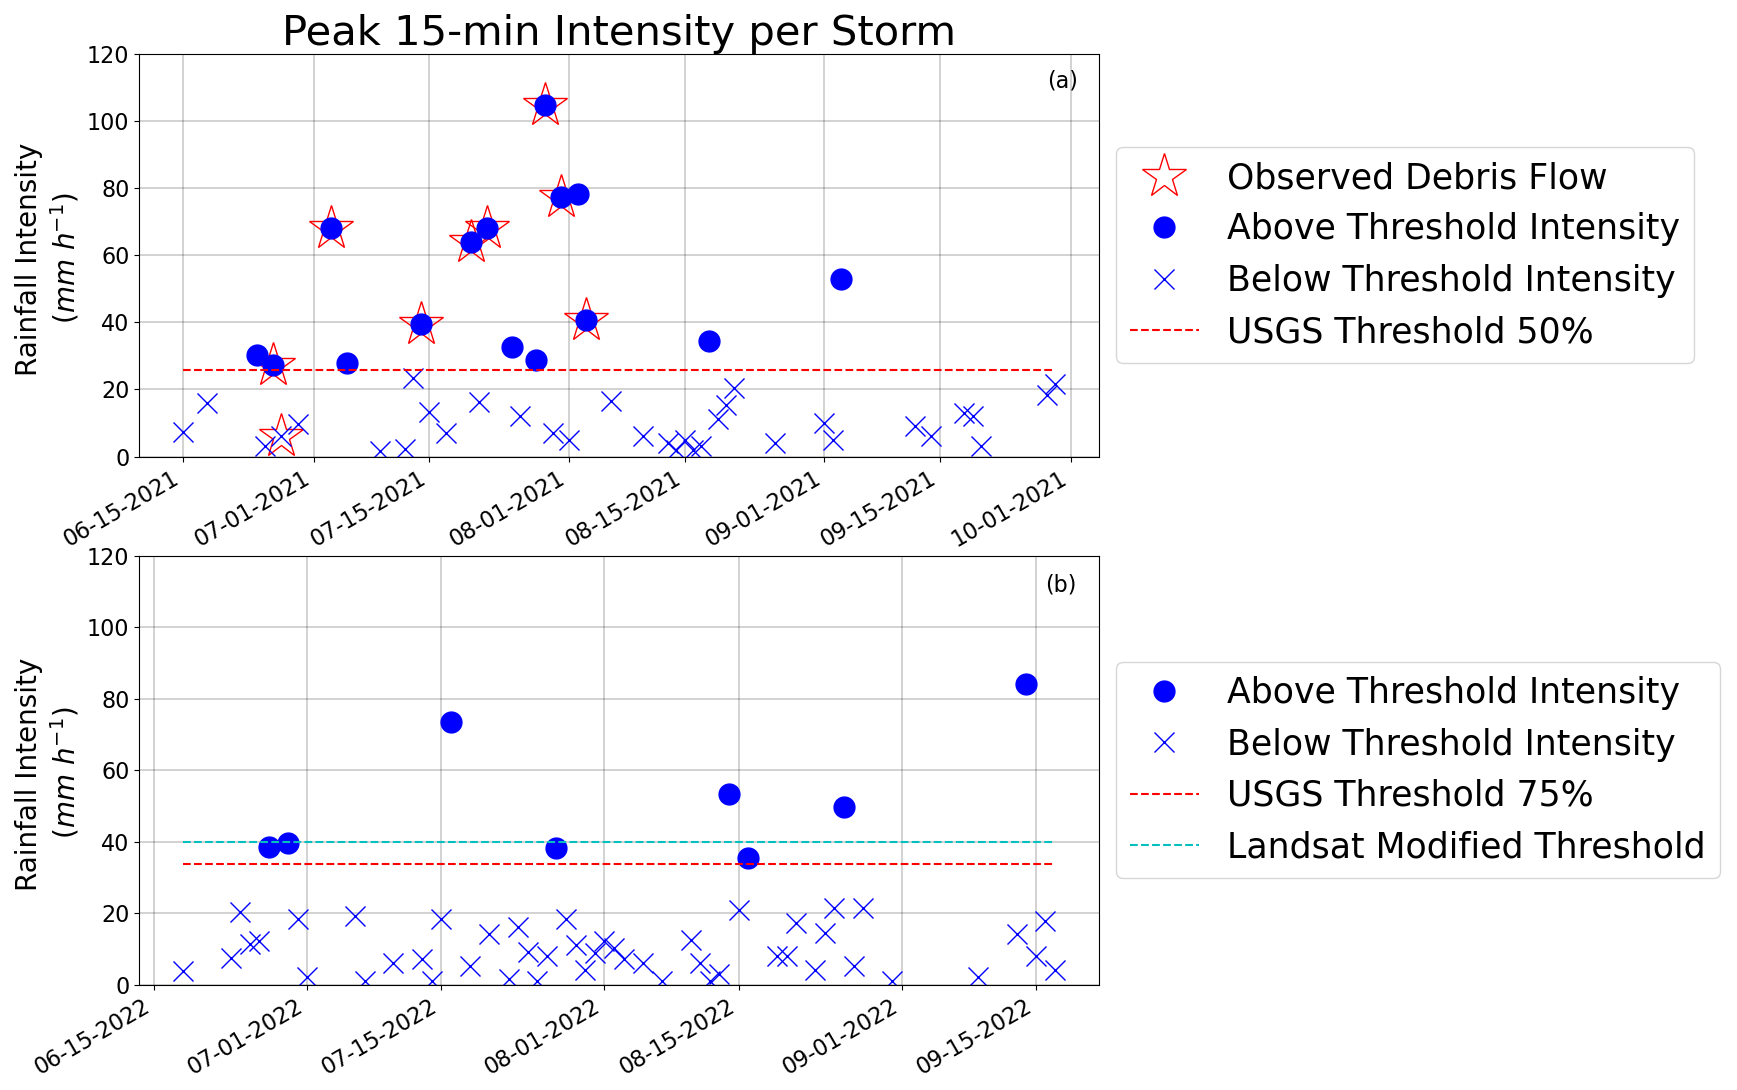
Figure 8(a) Maximum 15 min rainfall intensity during each storm from the 11 rain gauges near the Grizzly Creek Fire perimeter during the 2021 monsoon. Rainfall rates below the modeled intensity threshold of 25.9 mm h−1 (50 % likelihood) are shown with a cross, and those above the modeled threshold are shown with a circle. Any storms that produced a debris flow are indicated with a star. (b) Maximum 15 min rainfall intensity during each storm from the 11 rain gauges near the Grizzly Creek Fire perimeter during the 2022 monsoon. The year 2 (75 % likelihood) of 33.7 mm h−1 was used as the USGS threshold. A recalibrated dNBR value from Landsat at the beginning of the monsoon season was used with the M1 model to develop an additional threshold of 40 mm h−1 using the 50 % likelihood of debris-flow occurrence. Note that no debris flows were observed in 2022.
When the debris-flow and storm inventories were compared with the P50 rainfall threshold created by the debris-flow hazard assessment in 2021, we observed relatively good performance of the estimated rainfall threshold (Fig. 8a). The I15 values associated with the initiation of one or more debris flows (Fig. 8a) were above the (25.9 mm h−1) produced by the hazard assessment (Staley et al., 2017) in eight out of nine cases during the first year postfire (U.S. Geological Survey, 2020). The only observed debris flow with a rainfall rate below was on 27 June 2021. However, most of the rain gauges were not operating at that time (Table 1 and Fig. S3); therefore, it is possible that the closest available rain gauge was not reflective of the maximum rainfall rate in the storm. In the second summer postfire, the was increased (33.7 mm h−1) and several storms generated I15 rainfall intensities larger than ; however, no debris flows were documented (Fig. 7b).
The high spatial variability in debris-flow occurrence was likely a result of the localized nature of monsoonal storms. Some storms only produced debris flows within a small portion of the burned area (e.g., 14 July 2021, 22 July 2021), whereas other storms produced debris flows across a wider area within the burn perimeter (e.g., 29 July 2021) (Fig. 7b). No debris flows were observed after 3 August 2021 despite rainfall intensities that exceeded the rainfall threshold. This observation likely results from vegetation recovery in susceptible basins as has been observed elsewhere (Santi and Macaulay, 2021).
4.2 Debris-flow initiation and volume
4.2.1 Initiation mechanisms revealed through mapping
Field observations and the lidar DoD revealed that the majority of sediment incorporated into debris flows in 2021 originated in channelized areas with a relatively minor sediment contribution from adjacent hillslopes (Figs. 2b and c and 4). Field observations suggest that channel erosion was initiated in part by surface water that was strong enough to uproot grassy vegetation to access sediment below the root zone (Fig. 4), as has been observed in grassland settings (Rengers et al., 2016). Moreover, field mapping in multiple watersheds (Blue Gulch, Grizzly Creek, and French Creek) confirm the observations of in-channel debris-flow initiation observed in the DoD. Hillslope rilling was only observed in a few locations with relatively low levels of revegetation in 2021 (Fig. S5).
4.2.2 Debris-flow volume observations and estimations
We mapped 26 debris-flow channels along the I-70 corridor and 8 debris flows within the Grizzly Creek watershed, and we measured a net erosional volume of 460 000 ± 16 700 m3 using the lidar DoD. Because the timing of the flows along Grizzly Creek is less certain (i.e., no eye-witness accounts), we do not include the Grizzly Creek flows in the inventory with an associated storm (Rengers et al., 2023b), though imagery suggests they occurred on 31 July 2021. The observed debris-flow erosional volumes were substantially smaller than the volume estimated by Eq. (2) (Figs. 7, 9, and S6). For example, the observed volume of erosion for individual watersheds ranged from 160 ± 25–107 000 ± 3800 m3, whereas the estimated volumes for the same watersheds ranged from 270–470 000 m3. A best-fit line derived from a linear regression was developed to compare the estimated to observed erosion (Grizzly Creek Fire data only).
The depositional volumes observed were less than the erosional volumes, as was expected due to sediment disturbance between the time of debris-flow deposition and the lidar flight (Fig. 7).
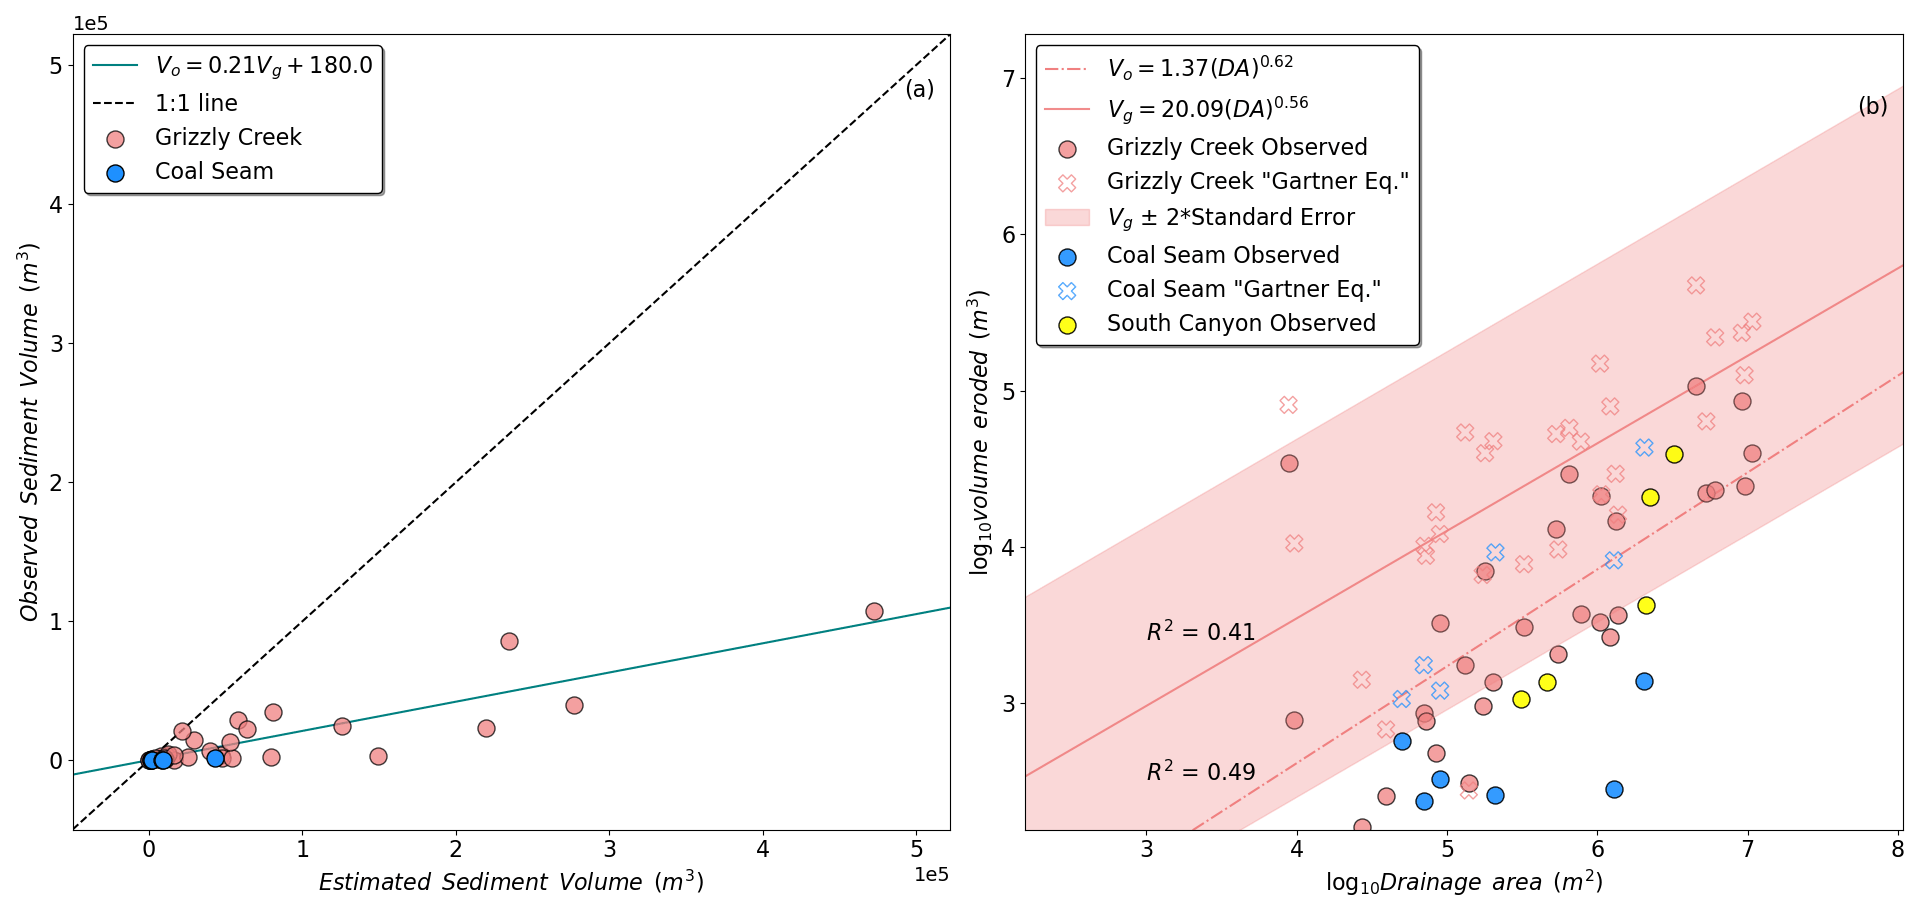
Figure 9(a) Observed sediment volume (erosional) versus estimated sediment volume using Eq. (2) developed by Gartner et al. (2014). Linear trend line shows the relationship between the estimated (Vg) and observed (Vo) volume at the Grizzly Creek Fire. (b) A comparison of the total volume of observed sediment with estimated volume from Eq. (2) as a function of upstream drainage area (DA). The observation volumes represent the volume of erosion upstream of a transition to deposition. Best-fit power law equations (dashed and solid red lines) were fit to the observed (red circles) and estimated (red crosses) data points for the Grizzly Creek Fire, respectively. R2 values are reported for these fits.
The volumes from the Grizzly Creek Fire were similar in magnitude to the observed volumes from the two prior postfire debris flows near Glenwood Canyon, the Coal Seam and South Canyon fires (Fig. 9), suggesting regional similarities between the observed volumes across three different fires. Moreover, the trend of volume overestimation by Eq. (2) was observed in both the Grizzly Creek Fire data and the Coal Seam Fire data (Fig. 9). This suggests that the overestimation of Eq. (2) is not related to fire- or storm-specific characteristics of the Grizzly Creek Fire. Rather the overestimation of Eq. (2) is more likely related to regional differences in sediment, vegetation, and sediment transport processes tied to the regional geomorphology.
4.3 Vegetation recovery and year-2 threshold
All three satellite vegetation indices show similar declines from the prefire period to the postfire period. After this initial decrease, gradually higher vegetation index values are observed in later epochs (Fig. 10). Our median Landsat- versus Sentinel-derived NBR, NDVI, and EVI calculations are well correlated at the basin scale for all calculation periods (R2 ≥ 0.99). Recovery levels are consistent across satellite platforms but exhibit some variability across vegetation indices. We calculated 16 %, 21 %, and 34 % recovery among NBR, NDVI, and EVI for the first postfire monsoon season and 53 %, 50 %, and 68 % recovery among NBR, NDVI, and EVI for the second postfire monsoon season. When averaged across satellite platforms and vegetation indices, we estimate 24 % and 57 % recovery for the first and second postfire monsoon seasons following the fire, respectively.
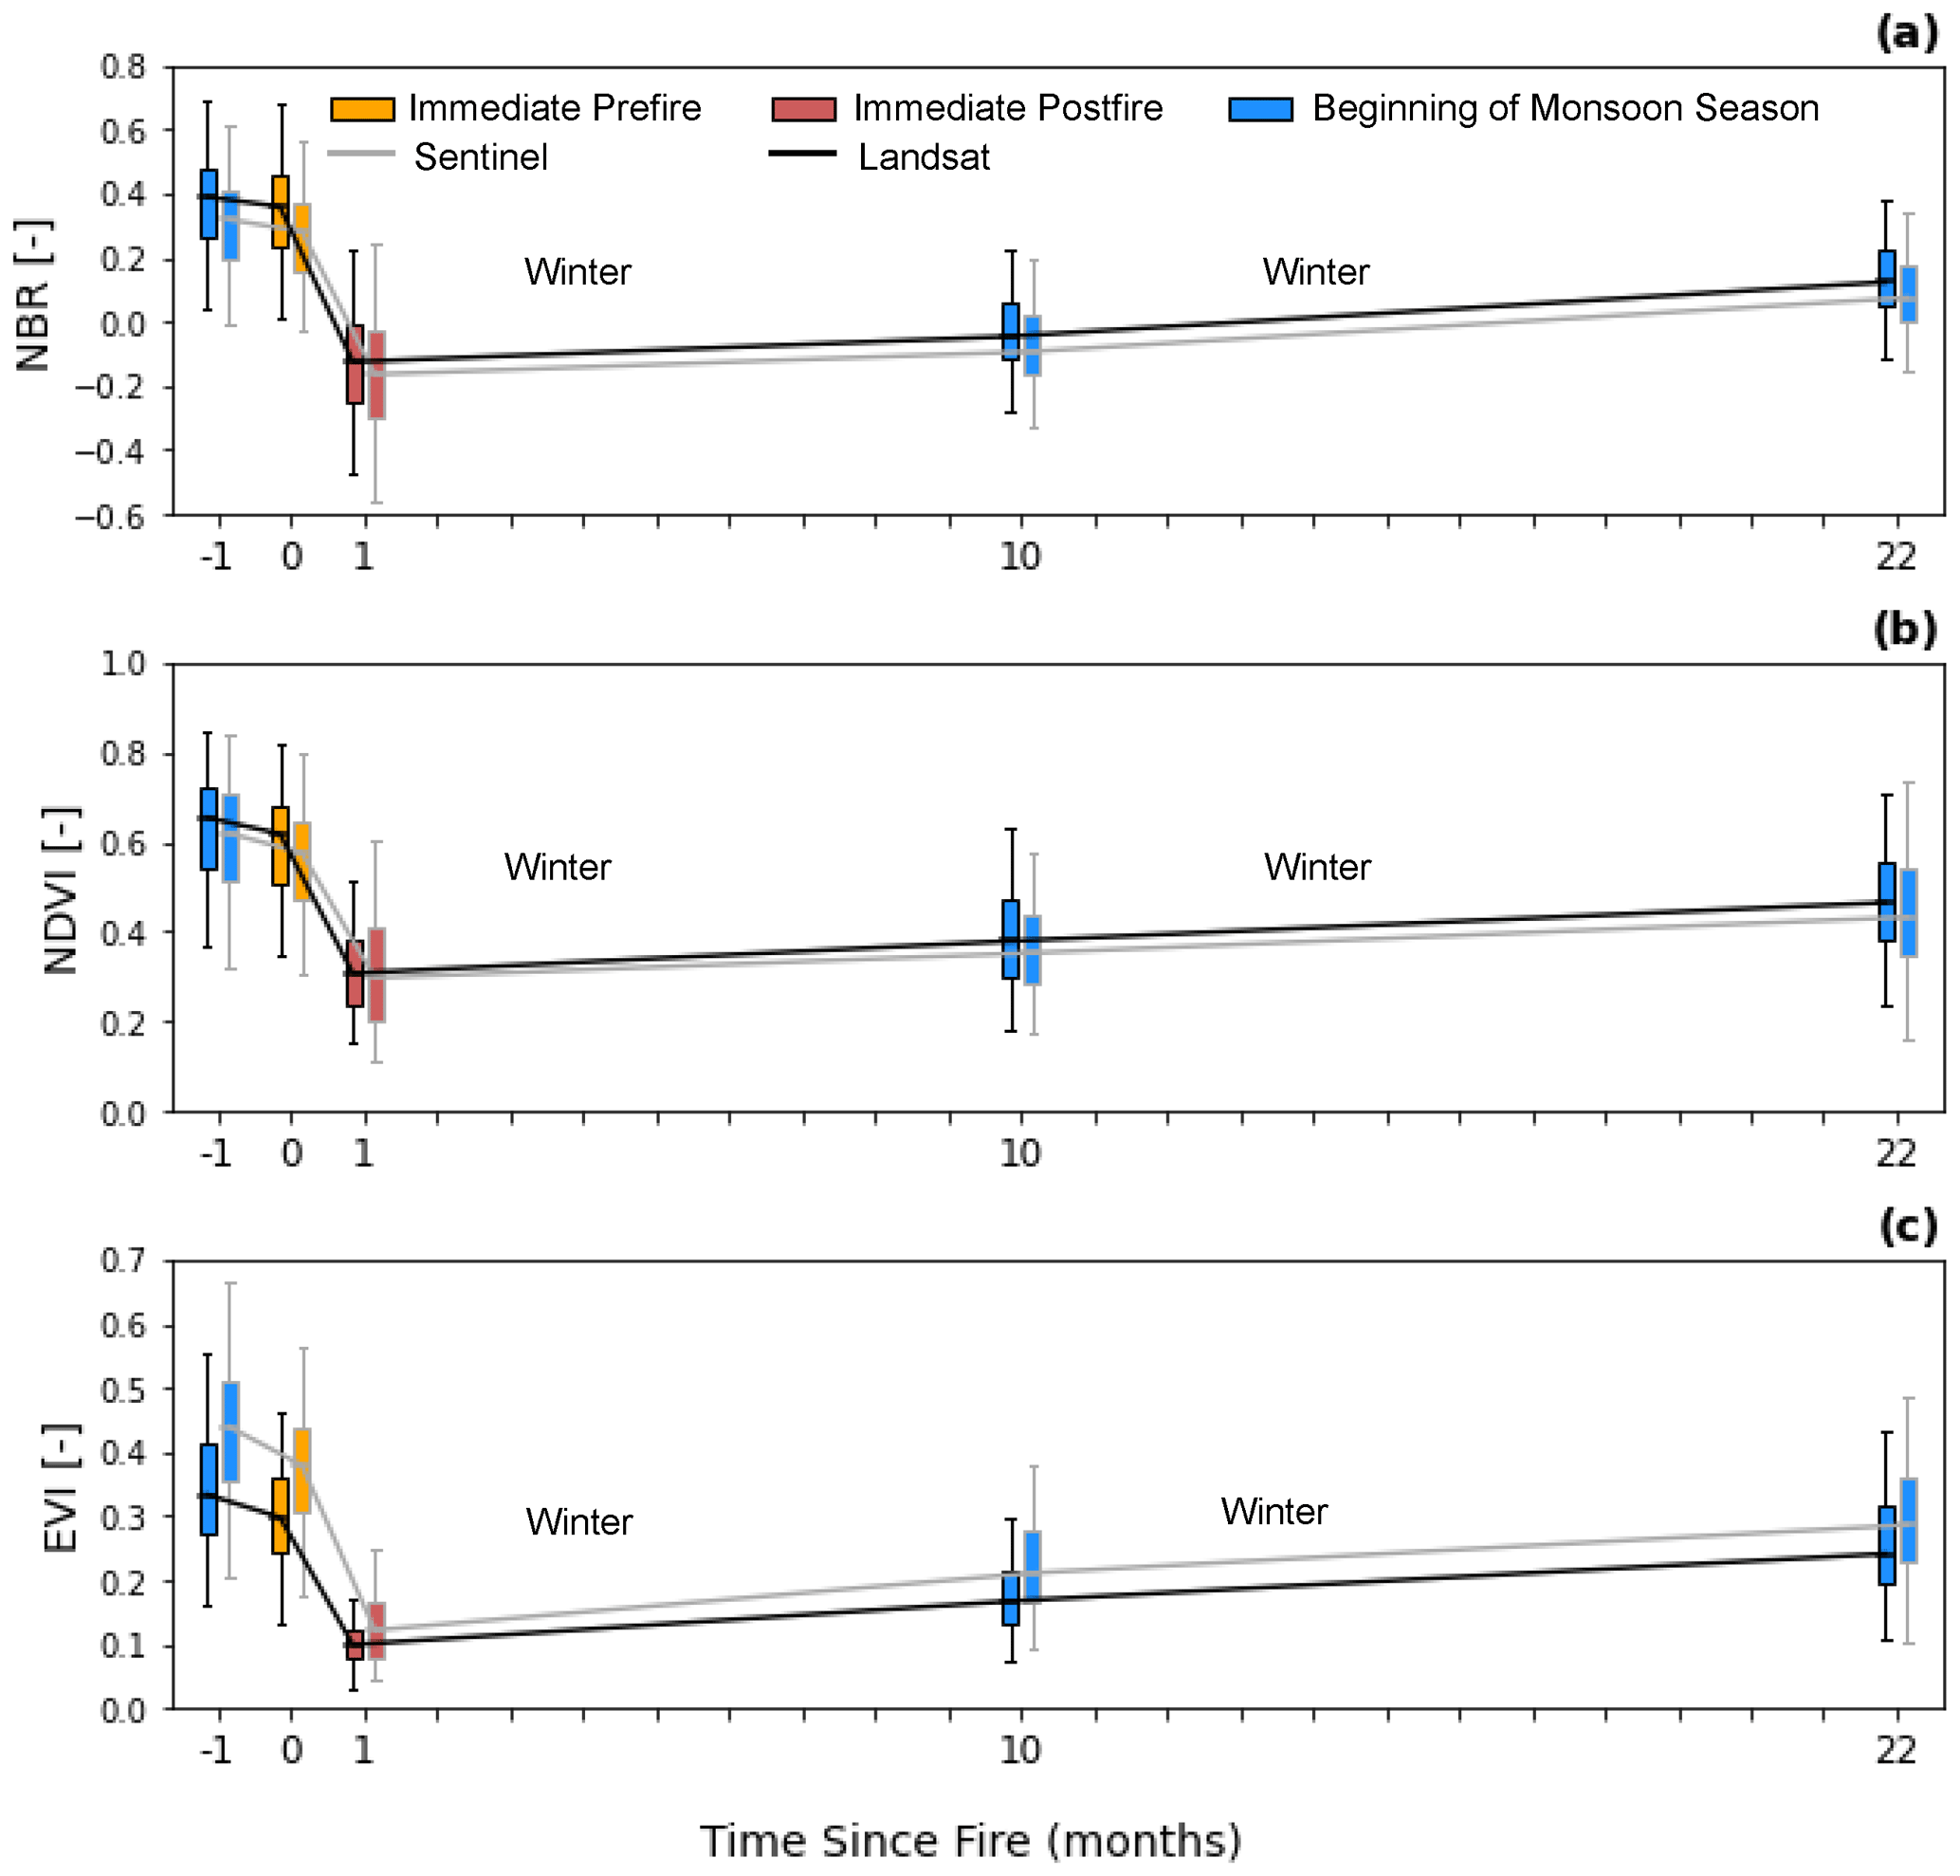
Figure 10Landsat- (black outline) versus Sentinel-derived (gray outline) measurements of the (a) normalized burn ratio (NBR), (b) normalized difference vegetation metric (NDVI), and (c) enhanced vegetation index (EVI) for the 2020 Grizzly Creek Fire. Boxplots summarize the distribution of the mean reflectance metric for each modeled basin (U.S. Geological Survey, 2020) that intersects the burn area for the beginning of the monsoon season (blue), immediately before the fire (orange), and immediately after the fire (red).
A new P50 estimate for the second year () using updated dNBR values from Landsat imagery (Landsat Modified Threshold) resulted in an updated rainfall threshold (40 mm h−1). This value was larger than the original P75 rainfall threshold (33.7 mm h−1) (USGS Threshold) eliminating four storms (Fig. 8b). Consequently, the new Landsat modified threshold based on measured recovery rates may help to avoid false alarms in the second year postfire.
4.4 Infrastructure and water resource impacts
During the collection of our debris-flow and storm inventory in Glenwood Canyon, we additionally observed many major impacts from the debris flows. Debris flows within Glenwood Canyon damaged railroad lines (Union Pacific), roads (I-70), and the Colorado River (Fig. 11). One relatively large debris flow sourced from the Devil's Hole watershed (Figs. 2 and 3) fully blocked the flow of the Colorado River temporarily on 22 July 2021 (Fig. 11d). The storm on 22 July 2021 started at 16:34 LT and reached a peak intensity of 21.3 mm h−1. The upstream stream gauge on the Colorado River showed a slight increase in flow during the storm; however, the downstream stream gauge at Glenwood Springs shows a drop in river level because of the debris flow blocking the Colorado River (Fig. 11d and e).
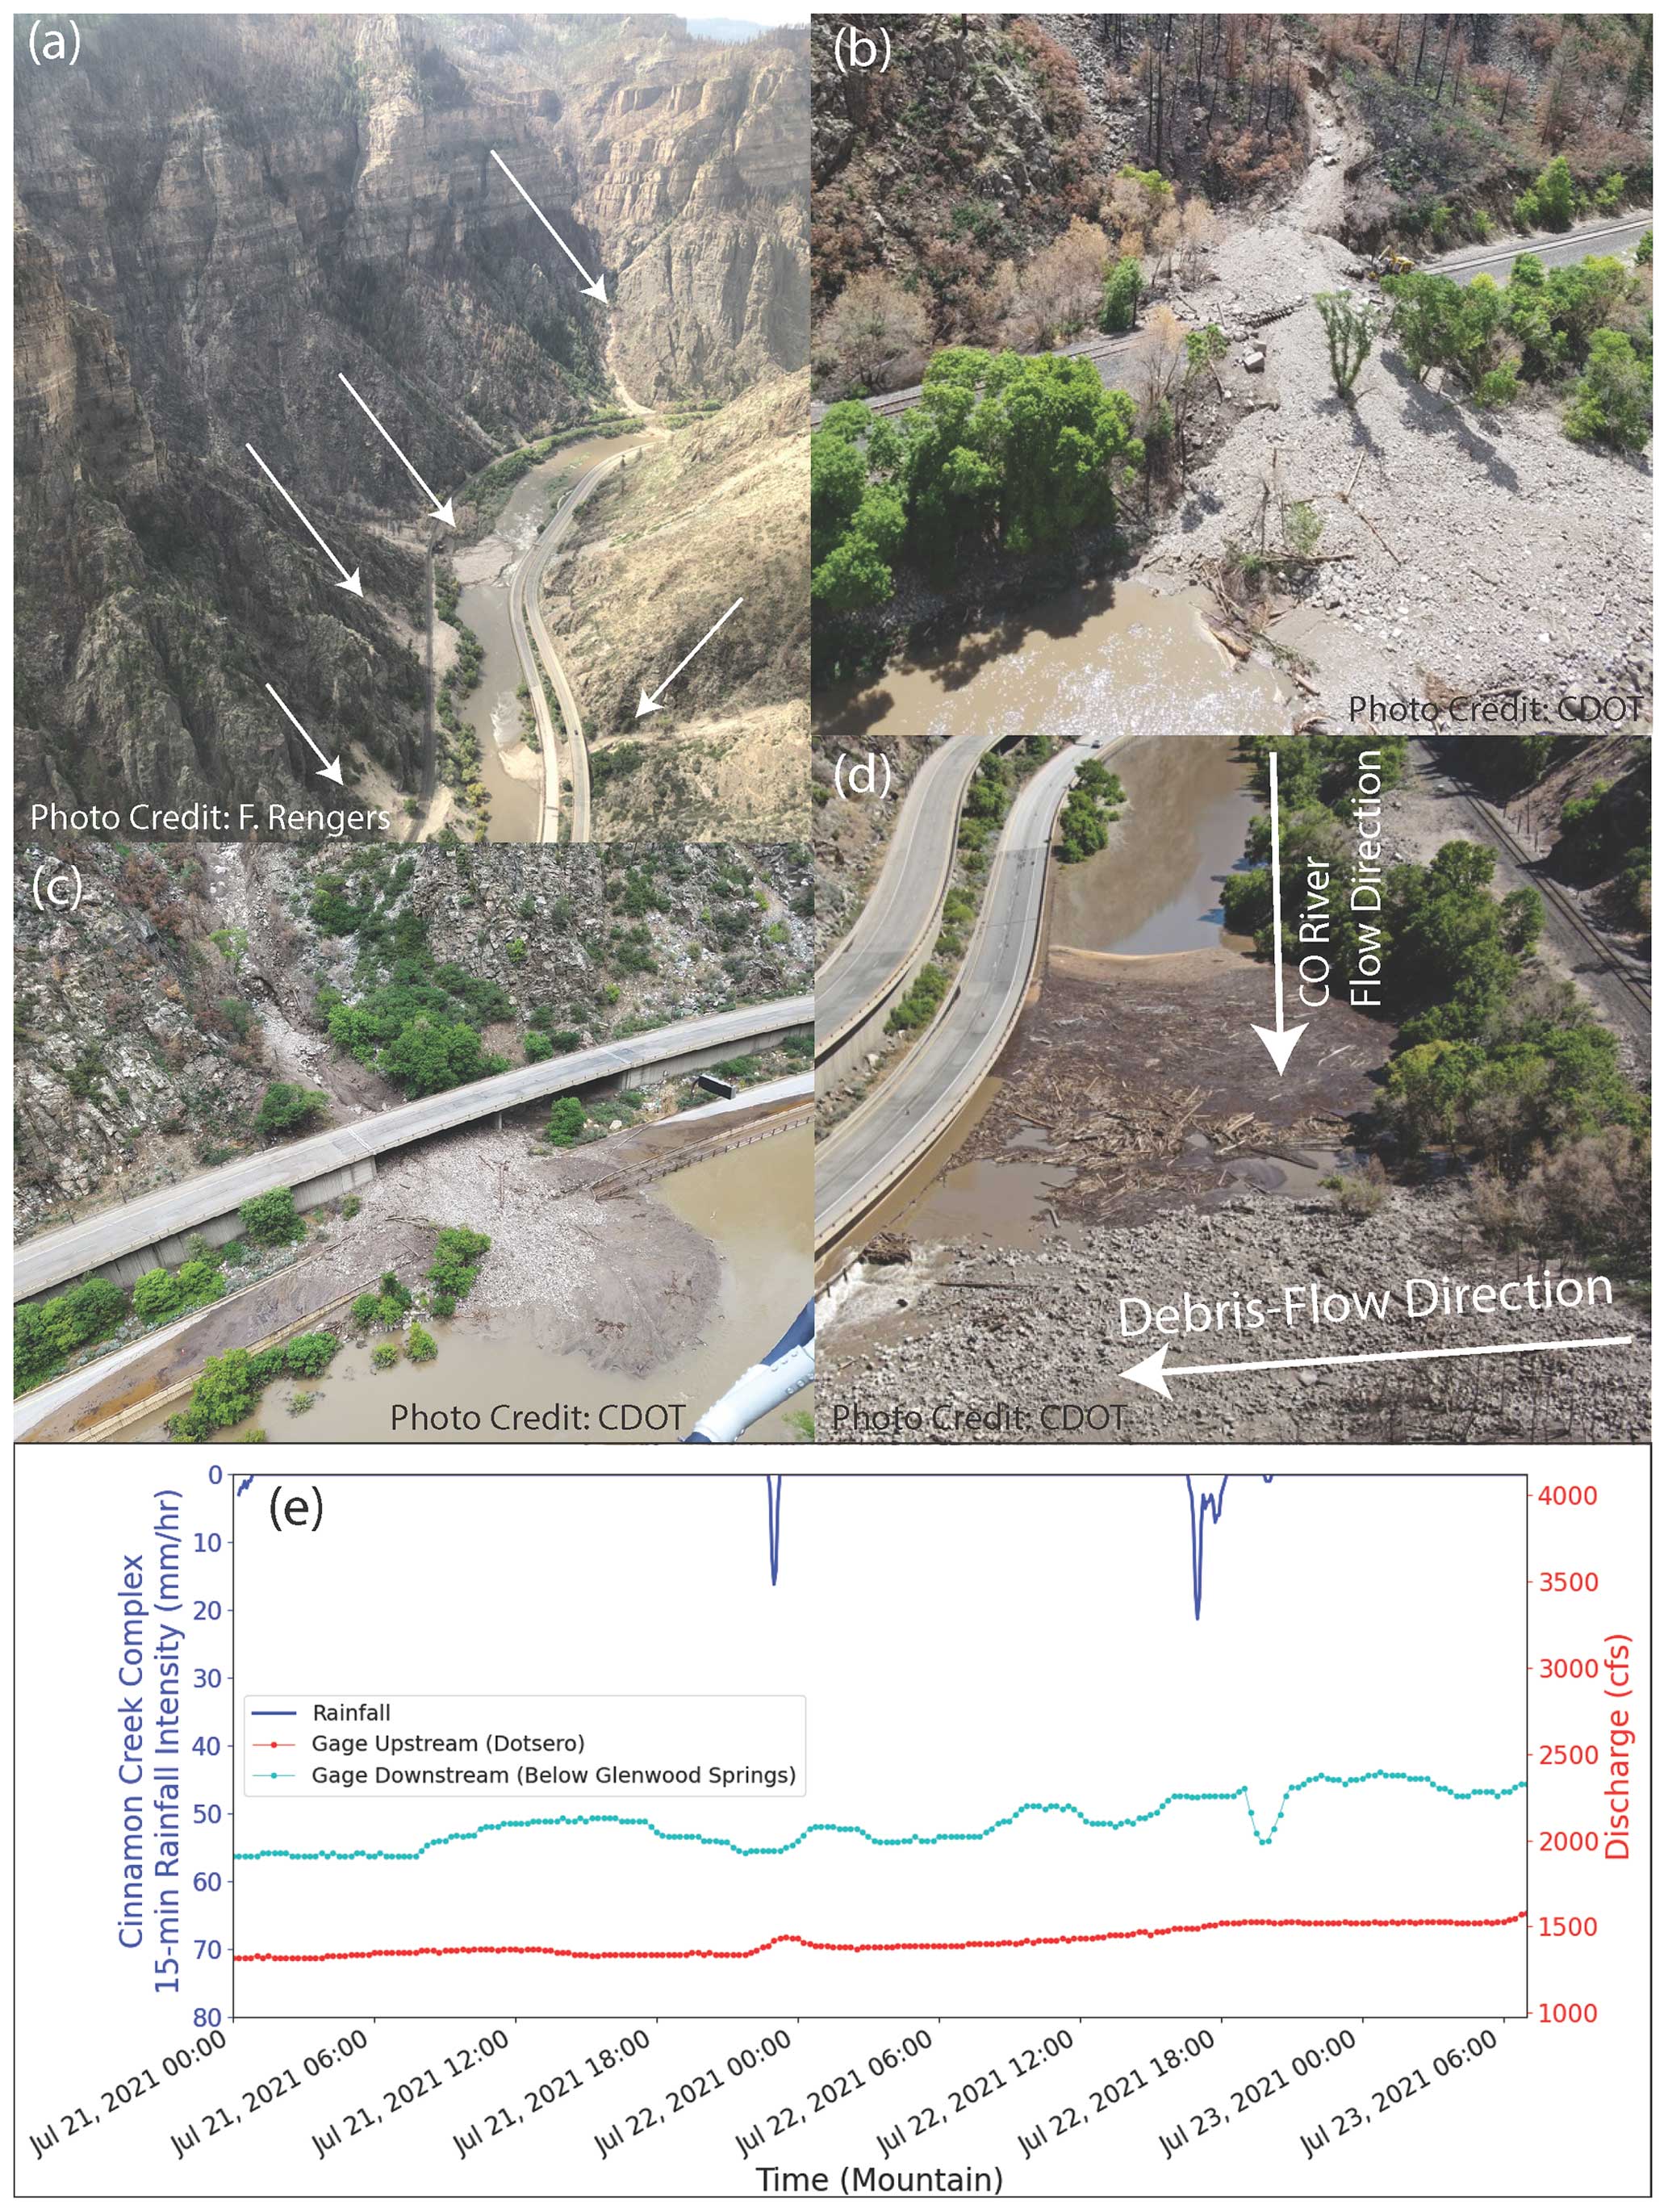
Figure 11(a) View of debris-flow paths and deposits in the Colorado River looking southwest on 18 August 2021. Arrows indicate new debris-flow paths. (b) Sedimentation on the railroad in Glenwood Canyon on 1 August 2021. (c) Sedimentation on the lower deck of I-70 on 1 August 2021. (d) Photo of temporary damming of the Colorado River on 22 July 2021. (e) Damming can be observed in the discharge record of the Colorado River on 22 July 2021. The upstream discharge in the Colorado River (red) rises steadily in response to the closest-measured 15 min rainfall intensity (blue). When the debris flow at Devil's Hole temporarily dammed the Colorado River, a drop in discharge is observed at the downstream river gauge (cyan).
The USGS M1 likelihood model successfully estimated an appropriate rainfall threshold for most debris flows in year 1 using the P50 value. For eight out of nine debris-flow-producing storms in 2021, the observed peak I15 from the rain gauges was greater than the median fire-wide rainfall threshold produced by the hazard assessment model (U.S. Geological Survey, 2020) (Fig. 8). This result is similar to previous research (Kean et al., 2011), showing debris flows initiating during storms with high short-duration rainfall intensities. However, the spatial footprint of any given storm observed at our study area was highly variable. For example, during the storm on 22 July 2021, rainfall intensities only exceeded the rainfall threshold at 6 of the 11 rain gauges (Fig. S7), and the observed debris flows from that storm intersected a narrow section of I-70 (between mile markers 124–126) (Fig. 7b). In contrast, during the storm on 29 July 2021, rainfall intensities exceeded the rainfall threshold at eight of the nine gauges (two gauges had data gaps at this time; Fig. S7), and debris flows were observed throughout most of the canyon (Fig. 7b).
Field observations continued through the second year postfire to determine the applicability of the year-2 rainfall threshold (). Despite a relatively active monsoon season in 2022 producing high rainfall rates during some storms, no debris flows were observed in 2022 (Fig. 8b). Field observations showed evidence of fluvial reworking of 2021 debris-flow deposits (Fig. 12a and b). The 2022 rainfall data suggest that the P75 rainfall intensity threshold predicted by the USGS hazard assessment was exceeded during eight storms (Fig. 8b). However, because no debris flows were observed, it appears that the rainfall threshold associated with the 75 % likelihood may have been too conservative for the second monsoon season. We conclude that the rate of vegetation recovery by the second year along with sediment depletion (Fig. S8) from debris flows in 2021 had greatly reduced runoff and sediment yield by the 2022 monsoon. By contrast, only four of the 2022 storms exceeded the Landsat modified threshold based on the revised dNBR for 2022 (Fig. 8b), but this still does not eliminate all of the false positives. Consequently, more research may be needed to accurately estimate for year 2.
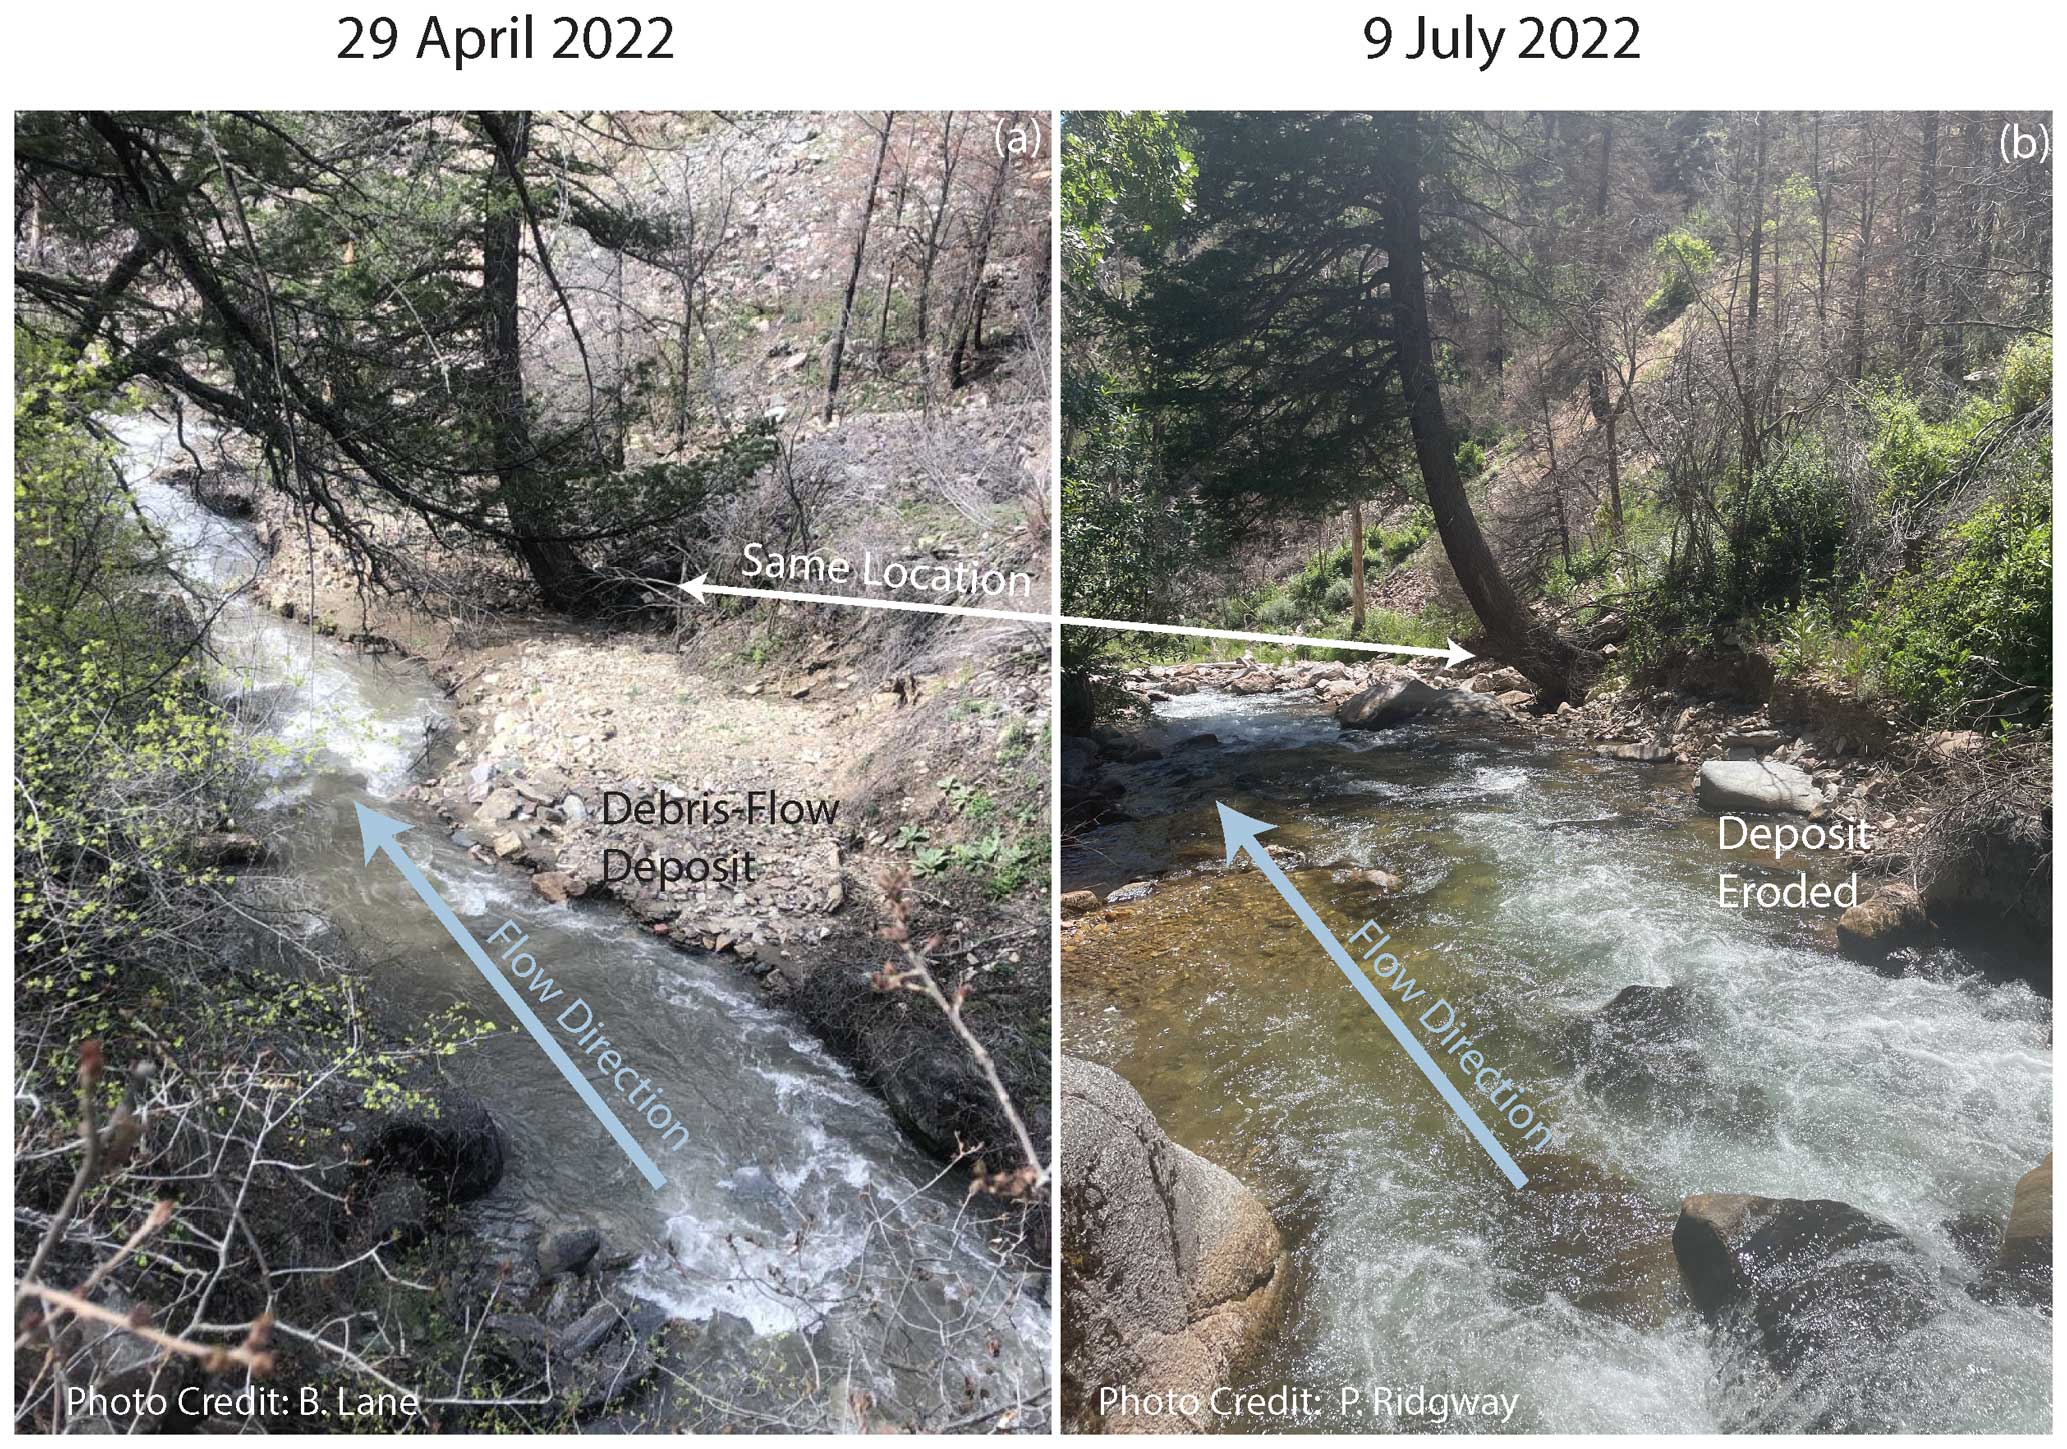
Figure 12(a) Small debris-flow fan in Grizzly Creek at the beginning of the 2022 snowmelt season. (b)Vertical and horizontal incision of the same fan after the snowmelt runoff.
Qualitative field observations of vegetation recovery were aligned with remote sensing observations. After the fire the conifer-dominated stands had some of the worst soil burn severity and least vegetative recovery. Aspen stands and conifer stands with an aspen component saw vigorous recovery. The Gambel oak, which occupies many of the lower, hotter slopes, had vigorous regrowth immediately after the fire and likely played a role in stabilizing slopes for year 2. Finally, the cottonwood trees were stable points that aided in initiating debris deposition in Cinnamon Creek, French Creek, and Grizzly Creek.
The operational USGS volume model generally overestimated debris-flow volumes in the Grizzly Creek burn area by a median value of 4.4 times. The deviation between the model and the observations could likely result from differences between the calibration dataset used to develop Eq. (2) and the present study area. Equation (2) was calibrated using data from the Transverse Ranges of southern California, which contains oversteepened hillslopes due to ongoing tectonic activity (DiBiase et al., 2012) and contributes large amounts of sediment to channels through dry ravel (DiBiase et al., 2017; DiBiase and Lamb, 2013; Lamb et al., 2011). By comparison, the Glenwood Canyon formed during the White River Uplift, part of the Laramide Orogeny, where tectonism ceased at 55–35 Ma (Allen and Shaw, 2008). The volume of sediment eroded by the Grizzly Creek Fire debris flows increased as a function of upstream drainage area (Fig. 7), similar to the original observations used to develop Eq. (2) (Gartner et al., 2014). Finally, the general trend of larger observed erosional volumes compared to depositional volumes, suggests that future estimates of the erosional volumes can provide a conservative approach for estimating the resulting depositional volume.
Postfire debris-flow volumes from the South Canyon and Coal Seam fires are of similar magnitude to observed volumes from Grizzly Creek. The volumes from the two historic fires might be expected to be larger than those from Grizzly Creek because the South Canyon and Coal Seam debris flows were triggered within a few months of the wildfire, and the sediment was derived from both hillslope and channel sources (Cannon et al., 2001, 2008). Moreover, the South Canyon Fire sourced sediment from the Maroon formation, which produces landslides and debris flows even without the influence of wildfire (Mejía-Navarro et al., 1994). However, the Grizzly Creek debris-flow volumes showed a similar magnitude to the historic volumes even when normalizing by upstream contributing drainage area (Fig. 9b), suggesting that there are regional controls on postfire debris-flow volume. The Coal Seam debris-flow volumes were overestimated between 1.8–35 times by Eq. (2). Nevertheless, because of the linear nature of the offset in the volume estimate (Fig. 9), it may be possible to apply a linear correction to the estimated volumes to obtain a regionally corrected volume estimate.
A few large drainages with contributing areas >9 km2, French Creek, Dead Horse Creek, Tie Gulch, and Grizzly Creek, stored sediment internally without depositing large fans in the Colorado River (Fig. 5). In the case of French Creek, a debris-flow fan with signs of incision at a drainage area of 15.3 km2 existed prior to the 2021 debris flows. During debris-flow activity in 2021, this fan aggraded (Video S1). The location of the debris-flow deposition may have been influenced by a large concrete retaining wall constructed for a bike path bridge, without which sediment may have moved into the Colorado River (Fig. 5). By contrast, the deposits in Grizzly Creek and Tie Gulch appear to be controlled by natural sediment depositional dynamics. A wide, low-gradient valley reach allowed for in-channel deposition in Grizzly Creek at a drainage area of 9.8 km2. Similarly, a low-sloping channel section fostered deposition in Tie Gulch at a drainage area of 9.6 km2 (Fig. 5). Deposition was also evident at the outlet of Tie Gulch where it debouched onto I-70, but deposition did not reach the Colorado River. Dead Horse Creek showed a mix of minor erosion and deposition throughout the drainage and minor fan development upstream of the confluence with the Colorado River at a drainage area of 26 km2. The differences in Dead Horse Creek may be related to the karst geology in the watershed, and Hanging Lake on the East Fork Dead Horse Creek tributary should have reduced the energy of any flows. The internal deposition shown in these larger drainages suggest there may be a drainage area threshold around approximately 10–20 km2, where the morphology of valley floors promotes internal deposition and a transition from debris-flow to debris-flood or hyperconcentrated-flow conditions. This is consistent with observations from prior datasets showing debris-flow initiation only in drainage areas <8 km2 (Staley et al., 2016).
In prior studies, some postfire debris flows source sediment primarily from hillslope erosion and some by channel erosion, and some are more balanced by both (Alessio et al., 2021; Nyman et al., 2020; Pelletier and Orem, 2014; Rengers et al., 2021; Tang et al., 2019b). DoDs and field observations suggest that the source of sediment for debris flows in Glenwood Canyon (Fig. 2) appeared to be primarily derived from channels. Unlike sites where sediment is sourced primarily from hillslope erosion (e.g., Rengers et al., 2021), debris flows in the Glenwood Canyon study area initiated primarily in channels at small drainage areas and steep slopes (Fig. 4). These differences are likely related to the timing of the debris flows with respect to the wildfire. That is, the fire happened in the fall of 2020, allowing time for partial recovery of soil hydrology during the winter freeze–thaw cycles and vegetation regrowth during the spring and early summer of 2021 (Fig. 4). While hillslope rilling was observed in select areas (Fig. S5), most hillslopes were partially covered with herbaceous vegetation by the 2021 monsoon based on remote sensing data and field observations (Fig. 9). As a result, flow velocities sufficient to initiate debris flows would likely have only been reached in channels.
The overall impact of the debris flows on infrastructure following the Grizzly Creek Fire was substantial. There was no loss of life due to any of the debris flows, although there were near-miss instances where people escaped cars surrounded by sediment (Otarola, 2021). At least 30 people in cars were forced to shelter overnight in a tunnel (Stroud, 2021b). Infrastructure damage included buried railroad lines (Union Pacific), road and bridge damage on I-70, and damage and flooding on the bike path that parallels the highway (Fig. 11b–d). Substantial sedimentation in the Colorado River impacted whitewater rafting tourism (Stroud, 2022) and increased overbank flood potential by filling in the riverbed (Fig. 11a). The debris-flow response following the Grizzly Creek Fire illustrates how debris flows can affect multiple locations during many different storm events, putting different types of critical infrastructure at risk.
An inventory of postfire debris flows from 2021 and 2022 following the 2020 Grizzly Creek Fire was used to test operational USGS models and methods used for estimating rainfall thresholds and debris-flow volumes. We found that during the first year following the wildfire, the rainfall threshold was successful for the wildfire perimeter as a whole. During the second year following wildfire, no debris flows were observed. The second-year rainfall threshold was exceeded by eight storms using the current operational approach, but when remote sensing data of recovered vegetation were used in the M1 model to generate a second-year threshold, only four storms exceeded the threshold. The observed volumes were lower than the model volume estimates by a factor of ∼0.2, and a comparison with historic postfire debris flows in the region suggests that reducing modeled volumes by this factor could aid in more realistic volume predictions across the region.
The data used in this study have been released in two separate data repositories (https://doi.org/10.5066/P99OT77K, Rengers et al., 2023a, and https://doi.org/10.5066/P9Z7RROL, Rengers et al., 2023b).
The supplement related to this article is available online at: https://doi.org/10.5194/nhess-24-2093-2024-supplement.
FKR prepared the manuscript, performed fieldwork, and performed analyses; SB mapped volumes; AK helped develop the debris-flow inventory; JWK and DMS performed fieldwork; DWV, MAT, and JK performed satellite imagery analysis of vegetation recovery; KRB performed and developed analysis methods for depositional volume; MB, SBD, JEG, and MH helped to obtain, process, and plan the analysis of the lidar; JA and EKR performed field investigations of vegetation and debris-flow initiation; and BL, PR, and BPM investigated field changes in fluvial channels from year 1 to year 2 and used remote sensing.
The contact author has declared that none of the authors has any competing interests.
Any use of trade, product, or firm names is for descriptive purposes only and does not imply endorsement by the U.S. Government.
Publisher's note: Copernicus Publications remains neutral with regard to jurisdictional claims made in the text, published maps, institutional affiliations, or any other geographical representation in this paper. While Copernicus Publications makes every effort to include appropriate place names, the final responsibility lies with the authors.
Any use of trade, firm, or product names is for descriptive purposes only and does not imply endorsement by the U.S. Government. We are grateful for internal USGS reviews from Andrew Graber and Jacob Woodard, and peer reviews from Paul Santi and two anonymous reviewers.
This paper was edited by Paolo Tarolli and reviewed by Paul Santi and two anonymous referees.
Abatzoglou, J. T., Juang, C. S., Williams, A. P., Kolden, C. A., and Westerling, A. L.: Increasing synchronous fire danger in forests of the western United States, Geophys. Res. Lett., 48, e2020GL091377, https://doi.org/10.1029/2020GL091377, 2021.
Adams, D. K. and Comrie, A. C.: The North American Monsoon, B. Am. Meteorol. Soc., 78, 2197–2213, https://doi.org/10.1175/1520-0477(1997)078<2197:TNAM>2.0.CO;2, 1997.
Alessio, P., Dunne, T., and Morell, K.: Post-wildfire Generation of Debris-flow Slurry by Rill Erosion on Colluvial Hillslopes, J. Geophys. Res.-Earth, 126, e2021JF006108, https://doi.org/10.1029/2021JF006108, 2021.
Allen, J. L. and Shaw, C. A.: Proterozoic geology and Phanerozoic reactivation of the newly recognized Grizzly Creek shear zone, Glenwood Canyon, Colorado, Geological Society of America, https://doi.org//10.1130/2007.fld010(03), 2008.
Arcement, G. J. and Schneider, V. R.: Guide for selecting Manning's roughness coefficients for natural channels and flood plains, USGS, https://doi.org/10.3133/wsp2339, 1989.
Barnhart, K. R., Jones, R. P., George, D. L., McArdell, B. W., Rengers, F. K., Staley, D. M., and Kean, J. W.: Multi-Model Comparison of Computed Debris Flow Runout for the 9 January 2018 Montecito, California Post-Wildfire Event, J. Geophys. Res.-Earth, 126, e2021JF006245, https://doi.org/10.1029/2021JF006245, 2021.
Blevins, J.: The final phase of restoration in Glenwood Canyon turns to debris-choked Colorado River, The Colorado Sun, 6 December 2021, https://coloradosun.com/2021/12/06/cdot-glenwood-canyon-colorado-river-restoration-i70/#:~:text=The final phase of restoration,Glenwood Canyon in July deluge (last access: 11 December 2021), 2021.
Brogan, D. J., Nelson, P. A., and MacDonald, L. H.: Reconstructing extreme post-wildfire floods: a comparison of convective and mesoscale events, Earth Surf. Proc. Land., 42, 2505–2522, https://doi.org/10.1002/esp.4194, 2017.
Brooks, A. P., Shellberg, J. G., Knight, J., and Spencer, J.: Alluvial gully erosion: an example from the Mitchell fluvial megafan, Queensland, Australia, Earth Surf. Proc. Land., 34, 1951–1969, https://doi.org/10.1002/esp.1883, 2009.
Cannon, S., Kirkham, R. M., and Parise, M.: Wildfire-related debris-flow initiation processes, Storm King Mountain, Colorado, Geomorphology, 39, 171–188, https://doi.org/10.1016/S0169-555X(00)00108-2, 2001.
Cannon, S., Gartner, J. E., Holland-Sears, A., Thurston, B. M., and Gleason, J. A.: Debris-flow response of basins burned by the 2002 Coal Seam and Missionary Ridge fires, Colorado, Engineering Geology in Colorado–Contributions, Trends, and Case Histories, in: Engineering Geology in Colorado – Contributions, Trends, and Case Histories: Association of Engineering Geologists Special Publication 14, Colorado Geological Survey Special Publication 55, on CD-ROM, edited by: Boyer, D. D., Santi, P. M., and Rogers, W. P., AEG Special Publication, 2003.
Cannon, S., Gartner, J. E., Wilson, R. C., Bowers, J. C., and Laber, J. L.: Storm rainfall conditions for floods and debris flows from recently burned areas in southwestern Colorado and southern California, Geomorphology, 96, 250–269, https://doi.org/10.1016/j.geomorph.2007.03.019, 2008.
Castellano, C., Kalansky, J., and Ralph, F. M.: 2021 North American Monsoon Recap, https://cw3e.ucsd.edu/2021-north-american-monsoon-recap/, last access: 5 June 2023.
De Graff, J. V., Shelmerdine, B., Gallegos, A., and Annis, D.: Uncertainty associated with evaluating rockfall hazard to roads in burned areas, Environ. Eng. Geosci., 21, 21–33, https://doi.org/10.2113/gseegeosci.21.1.21, 2015.
DeBano, L. F.: The role of fire and soil heating on water repellency in wildland environments: a review, J. Hydrol., 231, 195–206, https://doi.org/10.1016/S0022-1694(00)00194-3, 2000.
DeBano, L. F., Rice, R. M., and Conrad, C. E.: Soil heating in chaparral fires: effects on soil properties, plant nutrients, erosion, and runoff, U. S. Forest Service Research Paper (RP-145), 1979.
Dennison, P. E., Brewer, S. C., Arnold, J. D., and Moritz, M. A.: Large wildfire trends in the western United States, 1984–2011, Geophys. Res. Lett., 41, 2928–2933, https://doi.org/10.1002/2014GL059576, 2014.
DiBiase, R. A. and Lamb, M. P.: Vegetation and wildfire controls on sediment yield in bedrock landscapes, Geophys. Res. Lett., 40, 1093–1097, https://doi.org/10.1002/grl.50277, 2013.
DiBiase, R. A., Heimsath, A. M., and Whipple, K. X.: Hillslope response to tectonic forcing in threshold landscapes, Earth Surf. Proc. Land., 37, 855–865, https://doi.org/10.1002/esp.3205, 2012.
DiBiase, R. A., Lamb, M. P., Ganti, V., and Booth, A. M.: Slope, grain size, and roughness controls on dry sediment transport and storage on steep hillslopes, J. Geophys. Res.-Earth, 122, 941–960, https://doi.org/10.1002/2016JF003970, 2017.
Ebel, B. A.: Simulated unsaturated flow processes after wildfire and interactions with slope aspect, Water Resour. Res., 49, 8090–8107, https://doi.org/10.1002/2013WR014129, 2013.
Erku, R.: Railway reopens through Glenwood Canyon to freight travel following debris flows, https://www.postindependent.com/ news/railway-reopens-through-glenwood-canyon-to-freight-travel-following-debris-flows/, last access: 4 August 2021a.
Erku, R.: Silt water treatment plant feeling effects of Glenwood Canyon mudslides months later, https://www.postindependent. com/news/silt-water-treatment-plant-feeling-effects-of-glenwood-canyon-mudslides-months-later/, last access: 20 December 2021b.
Erku, R.: Steady revegetation on Glenwood Canyon burn scar is a ray of sunshine for interstate commerce, https://www. postindependent.com/news/steady-revegetation-on-glenwood-canyon-burn-scar-a-ray-of-sunshine-for-interstate-commerce/, last access: 22 April 2023.
Gartner, J. E., Cannon, S., and Santi, P. M.: Empirical models for predicting volumes of sediment deposited by debris flows and sediment-laden floods in the transverse ranges of southern California, Eng. Geol., 176, 45–56, https://doi.org/10.1016/j.enggeo.2014.04.008, 2014.
Graber, A. and Santi, P.: Inferring rockfall frequency-magnitude relationships and talus accumulation times from lichenometric study of talus deposits, Glenwood Canyon, CO, USA, Geomorphology, 408, 108253, https://doi.org/10.1016/j.geomorph.2022.108253, 2022.
Graber, A. and Santi, P.: UAV-photogrammetry rockfall monitoring of natural slopes in Glenwood Canyon, CO, USA: background activity and post-wildfire impacts, Landslides, 20, 229–248, https://doi.org/10.1007/s10346-022-01974-9, 2023.
Guasti, G. U., Caprinali, A., and Majorca, L.: Rockfall and Debris Flow Hazards After Summer Wildfires in Cerreto Sannita, Benevento, Italy, in: Landslide Science and Practice, edited by: Margottini, C., Canuti, P., and Sassa, K., Springer, Berlin, Heidelberg, https://doi.org/10.1007/978-3-642-31337-0_28, 2013.
Hoch, O. J., McGuire, L. A., Youberg, A. M., and Rengers, F. K.: Hydrogeomorphic Recovery and Temporal Changes in Rainfall Thresholds for Debris Flows Following Wildfire, J. Geophys. Res.-Earth, 126, e2021JF006374, https://doi.org/10.1029/2021JF006374, 2021.
Kean, J. W., Staley, D. M., and Cannon, S.: In situ measurements of post-fire debris flows in southern California: Comparisons of the timing and magnitude of 24 debris-flow events with rainfall and soil moisture conditions, J. Geophys. Res.-Earth, 116, F04019. https://doi.org/10.1029/2011JF002005, 2011.
Kean, J. W., McGuire, L., Rengers, F. K., Smith, J. B., and Staley, D. M.: Amplification of postwildfire peak flow by debris, Geophys. Res. Lett., 43, 8545–8553, https://doi.org/10.1002/2016GL069661, 2016.
Kean, J. W., Staley, D. M., Lancaster, J. T., Rengers, F. K., Swanson, B. J., Coe, J. A., Hernandez, J. L., Sigman, A. J., Allstadt, K. E., and Lindsay, D. N.: Inundation, flow dynamics, and damage in the 9 January 2018 Montecito debris-flow event, California, USA: Opportunities and challenges for post-wildfire risk assessment, Geosphere, 15, 1140–1163, https://doi.org/10.1130/GES02048.1, 2019.
Kirkham, R. M., Streufert, R. K., Cappa, J. A., Shaw, C. A., Allen, J. L., and Schroeder, T. J. I.: Geologic Map of the Glenwood Springs Quadrangle, Garfield County, Colorado, https://coloradogeologicalsurvey.org/publications/geologic-map-glenwood-springs-quadrangle-garfield-colorado-2 (last access: 12 June 2024), 2009.
Klock, G. O. and Helvey, J. D.: Debris flows following wildfire in north central Washington, PB US Natl. Tech. Inf. Serv., 1976.
Lamb, M. P., Scheingross, J. S., Amidon, W. H., Swanson, E., and Limaye, A.: A model for fire-induced sediment yield by dry ravel in steep landscapes., J. Geophys. Res., 116, F03006, https://doi.org/10.1029/2010JF001878, 2011.
Larsen, I. J., MacDonald, L. H., Brown, E., Rough, D., Welsh, M. J., Pietraszek, J. H., Libohova, Z., de Dios Benavides-Solorio, J., and Schaffrath, K.: Causes of post-fire runoff and erosion: water repellency, cover, or soil sealing?, Soil Sci. Soc. Am. J., 73, 1393–1407, https://doi.org/10.2136/sssaj2007.0432, 2009.
Mejía-Navarro, M., Wohl, E. E., and Oaks, S. D.: Geological Hazards, Vulnerability, and Risk Assessment Using GIS: Model for Glenwood Springs, Colorado, Geomorphol. Nat. Hazards, 1994, 331–254, https://doi.org/10.1016/b978-0-444-82012-9.50025-6, 1994.
Melzner, S., Shtober-Zisu, N., Katz, O., and Wittenberg, L.: Brief communication: Post-wildfire rockfall risk in the eastern Alps, Nat. Hazards Earth Syst. Sci., 19, 2879–2885, https://doi.org/10.5194/nhess-19-2879-2019, 2019.
Meyer, G. A., Pierce, J. L., Wood, S. H., and Jull, A. T.: Fire, storms, and erosional events in the Idaho batholith, Hydrol. Process., 15, 3025–3038, https://doi.org/10.1002/hyp.389, 2001.
Moody, J. A. and Ebel, B. A.: Hyper-dry conditions provide new insights into the cause of extreme floods after wildfire, Catena, 93, 58–63, https://doi.org/10.1016/j.catena.2012.01.006, 2012.
Mueller, S. E., Thode, A. E., Margolis, E. Q., Yocom, L. L., Young, J. D., and Iniguez, J. M.: Climate relationships with increasing wildfire in the southwestern US from 1984 to 2015, Forest Ecol. Manag., 460, 117861, https://doi.org/10.1016/j.foreco.2019.117861, 2020.
Murphy, B. P., Yocom, L. L., and Belmont, P.: Beyond the 1984 perspective: Narrow focus on modern wildfire trends underestimates future risks to water security, Earths Future, 6, 1492–1497, https://doi.org/10.1029/2018EF001006, 2018.
Murphy, B. P., Czuba, J. A., and Belmont, P.: Post-wildfire sediment cascades: A modeling framework linking debris flow generation and network-scale sediment routing, Earth Surf. Proc. Land., 44, 2126–2140, https://doi.org/10.1002/esp.4635, 2019.
National Oceanic and Atmospheric Administration: Climate at a glance: National Centers for Environmental Information (NCEI), https://www.ncei.noaa.gov/, last access: 31 July 2023.
Neary, D. G., Gottfried, G. J., and Ffolliott, P. F.: Fires and floods: post-fire watershed responses, in: Proceedings of the 4th International Conference on Forest Fire Research: Forest Fire Research and Wildland Fire Safety, 18–23 November 2002, Rotterdam, the Netherlands, Millpress, https://www.frames.gov/catalog/2454 (last access: 12 June 2024), 2002.
NRCS Soils: Natural Resources Conservation Service, Citing Web Soil Survey as a Source of Soils Data, http://websoilsurvey.sc.egov.usda.gov/, last access: 22 December 2021.
Nyman, P., Sheridan, G., Smith, H. G., and Lane, P. N. J.: Evidence of debris flow occurrence after wildfire in upland catchments of south-east Australia, Geomorphology, 125, 383–401, https://doi.org/10.1016/j.geomorph.2010.10.016, 2011.
Nyman, P., Box, W. A., Stout, J. C., Sheridan, G. J., Keesstra, S. D., Lane, P. N., and Langhans, C.: Debris-flow-dominated sediment transport through a channel network after wildfire, Earth Surf. Proc. Land., 45, 1155–1167, https://doi.org/10.1002/esp.4785, 2020.
Otarola, M.: “The Whole Car Went Black:” What It Was Like Being Trapped In The I-70 Glenwood Canyon Mudslide, https://www.cpr.org/2021/08/03/i-70-glenwood-canyon-mudslide-trapped-tunnel/, last access: 3 December 2021.
Parise, M. and Cannon, S.: Wildfire impacts on the processes that generate debris flows in burned watersheds, Nat. Hazards, 61, 217–227, https://doi.org/10.1007/s11069-011-9769-9, 2012.
Parsons, A., Robichaud, P. R., Lewis, S. A., Napper, C., and Clark, J. T.: Field guide for mapping post-fire soil burn severity, Gen. Tech. Rep. RMRS-GTR-243, US Department of Agriculture, Forest Service, Rocky Mountain Research Station Fort Collins, CO, 49 pp., https://doi.org/10.2737/RMRS-GTR-243, 2010.
Pelletier, J. D. and Orem, C. A.: How do sediment yields from post-wildfire debris-laden flows depend on terrain slope, soil burn severity class, and drainage basin area? Insights from airborne-LiDAR change detection, Earth Surf. Proc. Land., 39, 1822–1832, https://doi.org/10.1002/esp.3570, 2014.
Planet Application Program Interface: In Space for Life on Earth: https://api.planet.com, last access: 10 December 2021.
Prochaska, A. B., Santi, P. M., and Higgins, J. D.: Debris basin and deflection berm design for fire-related debris-flow mitigation, Environ. Eng. Geosci., 14, 297–313, https://doi.org/10.2113/gseegeosci.14.4.297, 2008.
Rengers, F. K., Tucker, G. E., and Mahan, S. A.: Episodic bedrock erosion by gully-head migration, Colorado High Plains, USA, Earth Surf. Proc. Land., 41, 1574–1582, https://doi.org/10.1002/esp.3929, 2016.
Rengers, F. K., McGuire, L. A., Kean, J. W., Staley, D. M., and Youberg, A. M.: Progress in simplifying hydrologic model parameterization for broad applications to post-wildfire flooding and debris-flow hazards, Earth Surf. Proc. Land., 44, 3078–3092, https://doi.org/10.1002/esp.4697, 2019.
Rengers, F. K., McGuire, L. A., Kean, J. W., Staley, D. M., Dobre, M., Robichaud, P. R., and Swetnam, T.: Movement of sediment through a burned landscape: Sediment volume observations and model comparisons in the San Gabriel Mountains, California, USA, J. Geophys. Res.-Earth, 126, e2020JF006053, https://doi.org/10.1029/2020JF006053, 2021.
Rengers, F. K., Bethel, M., Group, R., Vessely, M., and Anderson, S.: Airborne Lidar Data (2016 and 2021) Airborne Lidar Data (2016 and 2021) Capturing Debris Flow Erosion and Deposition after the Grizzly Creek Fire in Glenwood Canyon, Colorado, U.S. Geological Survey data release [data set], https://doi.org/10.5066/P99OT77K, 2023a.
Rengers, F. K., Bower, S. J., Knapp, A., Kean, J. W., Staley, D. M., Banta, J. R., and Williams, C.: Debris Flow, Precipitation, and Volume Measurements in the Grizzly Creek Burn Perimeter June 2021–September 2022, Glenwood Canyon, Colorado, U.S. Geological Survey data release [data set], https://doi.org/10.5066/P9Z7RROL, 2023b.
Rutter, A. J., Kershaw, K. A., Robins, P. C., and Morton, A. J.: A predictive model of rainfall interception in forests. 1. Derivation of the model from observations in a plantation of Corsican pine, Agr. Meteorol., 9, 367–384, 1971.
Rutter, A. J., Morton, A. J., and Robins, P. C.: A predictive model of rainfall interception in forests. II. Generalization of the model and comparison with observations in some coniferous and hardwood stands, J. Appl. Ecol., 12, 367–380, https://doi.org/10.2307/2401739, 1975.
Santi, P. M. and Macaulay, B.: Water and sediment supply requirements for post-wildfire debris flows in the western United States, Environ. Eng. Geosci., 27, 73–85, 2021.
Santi, P. M. and Rengers,F. K.: 9.32 – Wildfire and Landscape Change, in: Treatise on Geomorphology, 2nd Edn., edited by: Shroder, J. (J.) F., Academic Press, 765–797, ISBN 9780128182352, https://doi.org/10.1016/B978-0-12-818234-5.00017-1, 2022.
Santi, P. M., deWolfe, V. G., Higgins, J. D., Cannon, S. H., and Gartner, J. E.: Sources of debris flow material in burned areas, Geomorphology, 96, 310–321, https://doi.org/10.1016/j.geomorph.2007.02.022, 2008.
Schwartz, G. E. and Alexander, R. B.: Soils Data for the Conterminous United States Derived from the NRCS State Soil Geographic (STATSGO) Database, U. S. Geological Survey, https://doi.org/10.5066/P94JAULO, 1995.
Sentinel Hub: Citing Sentinel Hub EO Browser as a Source of Landsat and Sentinel Data, https://docs.sentinel-hub.com/api/latest/data/ (last access: 14 December 2023), 2023.
Staley, D. M., Kean, J. W., Cannon, S., Schmidt, K. M., and Laber, J. L.: Objective definition of rainfall intensity–duration thresholds for the initiation of post-fire debris flows in southern California, Landslides, 10, 547–562, https://doi.org/10.1007/s10346-012-0341-9, 2013.
Staley, D. M., Negri, J. A., Kean, J. W., Laber, J. M., Tillery, A. C., and Youberg, A. M.: Updated logistic regression equations for the calculation of post-fire debris-flow likelihood in the western United States, US Department of the Interior, US Geological Survey, https://doi.org/10.3133/ofr20161106, 2016.
Staley, D. M., Negri, J. A., Kean, J. W., Laber, J. L., Tillery, A. C., and Youberg, A. M.: Prediction of spatially explicit rainfall intensity–duration thresholds for post-fire debris-flow generation in the western United States, Geomorphology, 278, 149–162, https://doi.org/10.1016/j.geomorph.2016.10.019, 2017.
Stroud, J.: Glenwood Canyon assessment sets course for limited I-70 reopening “in days, not weeks,” after debris removal, basic repairs, https://www.postindependent.com/news/glenwood- canyon-assessment-sets-course-for-limited-i-70-reopening-after-debris-removal-basic-repairs/, last access: 20 August 2021a.
Stroud, J.: Travelers stranded during second Glenwood Canyon closure Thursday night, hole up at tunnels until they could be escorted out safely, https://www.vaildaily.com/news/travelers- stranded-during-second-glenwood-canyon-closure-thursday-night-hole-up-at-tunnels-until-they-could-be-escorted-out-safely/, last access: 13 December 2021b.
Stroud, J.: Where are all those rocks going? Glenwood Canyon work progresses to debris removal after completion of roadway repairs this month, https://www.postindependent.com/news/ where-are-all-those-rocks-goingglenwood-canyon-work-progresses-to-debris-removal-after-completion-of-roadway-repairs-this-month/, last access: 25 December 2021c.
Stroud, J.: Legacy of Grizzly Creek Fire, 2021 rains reshape recreation in Glenwood Canyon, https://www.postindependent. com/news/legacy-of-grizzly-creek-fire-2021-rains-reshape-recreation-in-glenwood-canyon/, last access: 13 July 2022.
Tang, H., McGuire, L. A., Rengers, F. K., Kean, J. W., Staley, D. M., and Smith, J. B.: Developing and Testing Physically Based Triggering Thresholds for Runoff-Generated Debris Flows, Geophys. Res. Lett., 46, 8830–8839, https://doi.org/10.1029/2019GL083623, 2019a.
Tang, H., McGuire, L. A., Rengers, F. K., Kean, J. W., Staley, D. M., and Smith, J. B.: Evolution of debris flow initiation mechanisms and sediment sources during a sequence of post-wildfire rainstorms, J. Geophys. Res., 124, 1572–1595, https://doi.org/10.1029/2018JF004837, 2019b.
Thomas, M. A., Rengers, F. K., Kean, J. W., McGuire, L. A., Staley, D. M., Barnhart, K. R., and Ebel, B. A.: Postwildfire soil-hydraulic recovery and the persistence of debris flow hazards, J. Geophys. Res.-Earth, 126, e2021JF006091, https://doi.org/10.1029/2021JF006091, 2021.
Thomas, M. A., Lindsay, D. N., Cavagnaro, D. B., Kean, J. W., McCoy, S. W., and Graber, A. P.: The Rainfall Intensity-Duration Control of Debris Flows After Wildfire, Geophys. Res. Lett., 50, e2023GL103645, https://doi.org/10.1029/2023GL103645, 2023.
Tillery, A. C. and Rengers, F. K.: Controls on debris-flow initiation on burned and unburned hillslopes during an exceptional rainstorm in southern New Mexico, USA, Earth Surf. Proc. Land., 45, 1051–1066, https://doi.org/10.1002/esp.4761, 2019.
United States Forest Service: Grizzly Creek Fire Burned Area Report, U. S. Department of Agriculture, Forest Service, 2020.
U.S. Geological Survey: Grizzly Creek (White River National Forest, CO) Post-Wildfire Debris Flow Hazard Assessment, https://landslides.usgs.gov/hazards/postfire_debrisflow/detail.php?objectid=294 (last access: 12 January 2021), 2020.
Warrick, J. A., Vos, K., East, A. E., and Vitousek, S.: Fire (plus) flood (equals) beach: coastal response to an exceptional river sediment discharge event, Sci. Rep., 12, 1–15, https://doi.org/10.1038/s41598-022-07209-0, 2022.
Wells, W. G.: The effects of fire on the generation of debris flows in southern California, Reviews in Engineering Geology, 7, 105–114, https://doi.org/10.1130/REG7-p105, 1987.
Westerling, A. L.: Increasing western US forest wildfire activity: sensitivity to changes in the timing of spring, Philos. T. Roy. Soc. B, 371, 20150178, https://doi.org/10.1098/rstb.2015.0178, 2016.
Westerling, A. L., Hidalgo, H. G., Cayan, D. R., and Swetnam, T. W.: Warming and earlier spring increase western US forest wildfire activity, Science, 313, 940–943, https://doi.org/10.1126/science.1128834, 2006.
Williams, C. H., Silins, U., Spencer, S. A., Wagner, M. J., Stone, M., and Emelko, M. B.: Net precipitation in burned and unburned subalpine forest stands after wildfire in the northern Rocky Mountains, Int. J. Wildland Fire, 28, 750–760, https://doi.org/10.1071/WF18181, 2019.
Wohl, E. E. and Pearthree, P. P.: Debris flows as geomorphic agents in the Huachuca Mountains of southeastern Arizona, Geomorphology, 4, 273–292, https://doi.org/10.1016/0169-555X(91)90010-8, 1991.