the Creative Commons Attribution 4.0 License.
the Creative Commons Attribution 4.0 License.
 | 24 Jan 2024
Identifying vulnerable populations in urban society: a case study in a flood-prone district of Wuhan, China
Makoto Takahashi
Weifu Li
In the context of unprecedented extreme weather and climatic events, the internal structural factors of society play a decisive role in determining the extent to which human beings are affected by disasters and their ability to respond to them. In the past few decades, rapid urbanization in developing countries, such as China, has greatly increased social vulnerability. This process has generated uneven living conditions and created many vulnerable groups, including urban poverty, migrants, and socially and geographically marginalized groups. These groups face difficulties in living conditions, education, livelihood stability, and more.
This study sets up indicators from a micro-perspective: three indicators of exposure, four indicators of sensitivity, and eight indicators of adaptive capacity. Based on this evaluation index system, this study conducted a social vulnerability assessment of the population in Hongshan District, Wuhan, China, through individual questionnaire surveys. K-means cluster analysis was used to determine high, medium, and low levels of social vulnerability, which were used to compare different community types and identify vulnerable groups.
The results showed close interrelationships between different types of communities in terms of physical and built environments as well as varying levels of social vulnerability to disasters. The high-vulnerability group accounted for 12.9 % of the 599 samples, the medium-vulnerability group accounted for 48.4 %, and the low-vulnerability group accounted for 38.7 %. The higher-vulnerability groups exhibited characteristics such as low education, poor health, low annual income, unstable work, and insufficient social security. Quantitative understanding of the degree of dissimilarity in social vulnerability among different communities and populations is significant in reducing social vulnerability and disaster risk specifically and effectively.
- Article
(2250 KB) - Full-text XML
- BibTeX
- EndNote


1.1 Urbanization, disaster risks, and social vulnerability
Warming has emerged as a dominant aspect of Earth's climate, leading to shifts in precipitation patterns and an uptick in extreme weather events such as heat waves, droughts, forest fires, heavy rains, and floods. In recent years, these events have disproportionately impacted vulnerable populations, resulting in substantial global disaster losses. Analyzing the socio-factors contributing to these losses allows us to predict the potential impact of future disasters on society (Vincent, 2004). Since the 1960s, research on vulnerability has played a pivotal role in reducing disaster losses and enhancing disaster prevention capabilities. Noteworthy programs such as the International Biological Program (IBP), the International Geosphere-Biosphere Programme (IGBP), the International Human Dimensions Programme on Global Environmental Change (IHDP), and the Intergovernmental Panel on Climate Change (IPCC) have extensively studied vulnerability (Zhang et al., 2008).
In urban areas, social vulnerability is primarily determined by the instability of the local society, especially in the context of rapid urbanization. The continuous increase in population mobility poses significant challenges to local infrastructure, the environment, and social structures. Socioeconomic inequalities among inhabitants manifest as a “mosaic” in the geographical space due to urban transformation. This mosaic results in social spatial isolation and leads to a redistribution of risk. Numerous studies on extreme events show that disastrous consequences are not only dependent on the hazard risk itself but also closely related to the physical environments, social structures, and demographic characteristics of a geographic location (Perrow, 2007; Bolin, 2007). If one place is physically exposed to a hazard risk, it will impact the population living there in uneven ways (Huang et al., 2020). Although urban population mobility itself does not lead to vulnerability (Donner and Rodriguez, 2008), the population becomes marginalized when the market and/or government fails to provide adequate employment, water and sanitation facilities, housing, or medical services.
The result of population dynamics and diverse demands for locations has led to a gradual decrease in the availability of safer lands, making it almost inevitable for human endeavors to be located in potentially dangerous places (Lavell, 2003). For example, in Jakarta, Indonesia, many migrants live in informal settlements called “Kampung” that are prone to flooding (Alzamil, 2018). In Ghana's capital, Accra, 92 % of migrants live in Old Fadama, a slum area that lacks tap water or sanitation facilities (Awumbila, 2014). In China, the push to commercialize urban housing over the past 40 years of urbanization has widened disparities in living conditions. While existing old communities with poor living environments have not seen much improvement, the living quality in newly developed gated communities has significantly increased. This process has also created many marginal places, which are a hybrid of rural and urban systems characterized by high building density, unclear management rights and duties, and insufficient social infrastructure. People living in these areas bear the brunt of many urban disasters. The spatial and social differentiation in cities results in the formation of new socially vulnerable groups based on various types of local communities.
China is currently one of the most disaster-plagued countries in the world, experiencing various types of disasters. In recent years, the frequency, intensity, spatial scope, and duration of these disasters have further expanded. Rapid urbanization in China has led to land expansion and the creation of different types of communities within and around the cities. This, coupled with the structural changes in population, economy, and society, has made the society unstable. It is crucial to mitigate the impact of disasters on urban populations and communities, and case studies can provide the policy bases for disaster risk reduction. The main purpose of this study was to determine the degree of social vulnerability at the local level and identify the most vulnerable groups by focusing on the characteristics of social vulnerability within Chinese urban society from a micro-perspective.
This paper aims to solve the following three groups of questions:
-
Differences in vulnerabilities.
What disparities exist in vulnerabilities among various urban communities? How do these differences correlate with established theories, and what factors contribute to their variation?
-
Urban mosaics and vulnerable populations.
What mosaics can be observed in urban areas concerning the distribution of vulnerable populations? In essence, how are vulnerable groups dispersed across communities, and what factors underlie this distribution?
-
Identification of most vulnerable groups.
Who constitutes the most vulnerable groups within the city, and what distinctive characteristics define them? We analyze these characteristics in the context of broader societal dynamics to understand their vulnerability.
1.2 Indicator-based research on social vulnerability
Social vulnerability is a crucial indicator for evaluating uneven regional developments. It refers to the ability to withstand adverse effects, the possibility of damage, and the degree of loss caused by disasters (Timmerman, 1981; Turner et al., 2003; Cutter, 1996). Meanwhile, a disaster is not solely caused by a hazardous event but also by its combination with social vulnerability, a widely accepted argument by disaster researchers (Alexander, 2006; Cannon, 2008). Although there is no universally approved definition of social, it has gradually developed into a widely accepted concept that includes several dimensions such as exposure, sensitivity, and adaptive capacity (IPCC, 2007, 2014; Adger, 2006) or exposure, resistance, and resilience (Pelling, 2003).
Currently, there is increasing attention being paid to vulnerability in the context of climate change and urbanization. In quantitative terms, a significant goal is to create an overall index using a range of indicators (Rygel et al., 2006). Parris and Kates (2003) state that numerous attempts have been made to develop such indicators, with Cutter et al. (2003) providing important guidance through their research on Georgetown County, South Carolina. They used county-level socioeconomic and geographic statistics to divide the social vulnerability index (SoVI) into multiple dimensions, including gender, race, age, occupation, family structure, and educational level. This revealed the vulnerability of people residing in high-risk areas. The following year, Vincent (2004) created an index to assess the relative vulnerability of social systems to climate-change-induced variations on a cross-national scale, using a weighted average of five sub-indices.
In recent years, there has been a growing focus on quantitative assessment of vulnerability due to social and environmental changes in cities. Research including that of Rygel et al. (2006), Flanagan et al. (2011), Zhang and You (2014), Rufat et al. (2015), Teng et al. (2018), and Xu et al. (2019) has evaluated social vulnerability from various perspectives, with different areas and scopes, taking into account the diverse ecological environments and sociopolitical structures. During their research, these scholars explored the relationships between vulnerability and disasters and testing potential risks by examining the impact of hazards on local populations. Over the past 2 decades, other vulnerability indicators have been developed, including the Environmental Vulnerability Index (EVI) (SOPAC, 2004), coastal vulnerability index (CVI) (Hegde and Reju, 2007), oil vulnerability index (OVI) (Gupta, 2008), and flood vulnerability index (FVI) (Balica, 2007; Balica et al., 2012). Unlike previous studies that had mainly focused on disaster losses, these studies aimed to assess social vulnerability before a disaster to identify the underlying causes of loss. By constructing indicators to quantify vulnerability, they have improved communication efficiency with non-expert decision-makers. Their key findings align with disaster reduction measures providing a stronger foundation for policy recommendations regarding disaster mitigation and preparedness.
However, most current social vulnerability assessments rely on official statistics, typical at the administrative territory level. Although these macroscopic indicators of vulnerability are significant for regional-level disaster risk reduction, they often fail to capture the specific conditions of communities or individuals (You and Zhang, 2013). Barnett et al. (2008) argued that vulnerability indices lose their meaning when applied to large-scale systems and should instead focus on smaller scales. In current Chinese society, which is still controlled by the household registration (hukou) system, the large-scale floating population is not adequately represented in macro-level data. Even though existing macro-level findings have been fruitful (Teng et al., 2018), future research should prioritize micro-level indicators of urban vulnerability, expanding beyond traditional scopes to obtain more comprehensive and in-depth results (Mao et al., 2017). Therefore, based on previous research, this study selects indicators from a micro-perspective to identify the characteristics of urban social vulnerability and to evaluate specific groups of social vulnerability.
The remaining parts of this paper are organized as follows. Section 2 provides an overview of the study area including its geographic location, urban development, and historical disasters. This is followed by Sect. 3, which outlines the methodology used to that constructs social vulnerability indicators, employing the expert scoring method and the analytic hierarchy process (AHP). K-means cluster analysis is then used to analyze the social vulnerability of the target communities. Section 4 presents the results and discussion including a comparison of different communities and the identification of vulnerable groups. Some of the findings might not align exactly with previous research, highlighting the importance of specific social structural factors in shaping social vulnerability. Finally, Sect. 5 concludes the paper with suggestions for reducing social vulnerability and addressing inequality in urban China resulting from urbanization.
Wuhan is a city in central China that serves as an important economic, scientific, and educational center, as well as a national transportation hub for canals, trains, highways, and flights (Fig. 1). Originally, it was divided into three towns: Wuchang, Hankou, and Hanyang. After 1949, the three towns were united into the city of Wuhan, which became the capital of Hubei Province in 1954. Later, to accommodate the city's growing development and population inflow, Wuhan expanded into the surrounding rural areas and was then divided into 13 districts (Fig. 2).
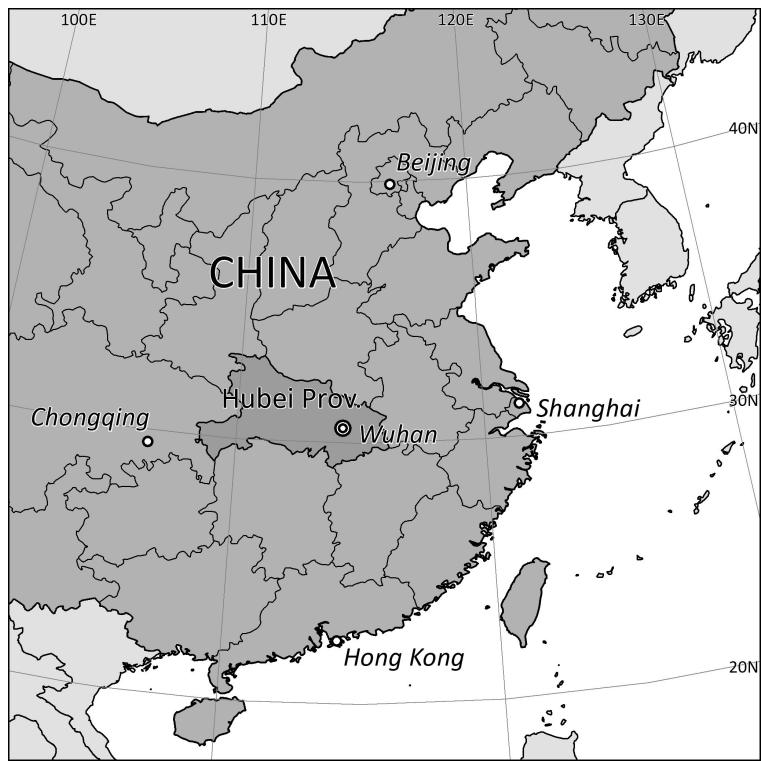
Figure 1The geographical location of Wuhan.
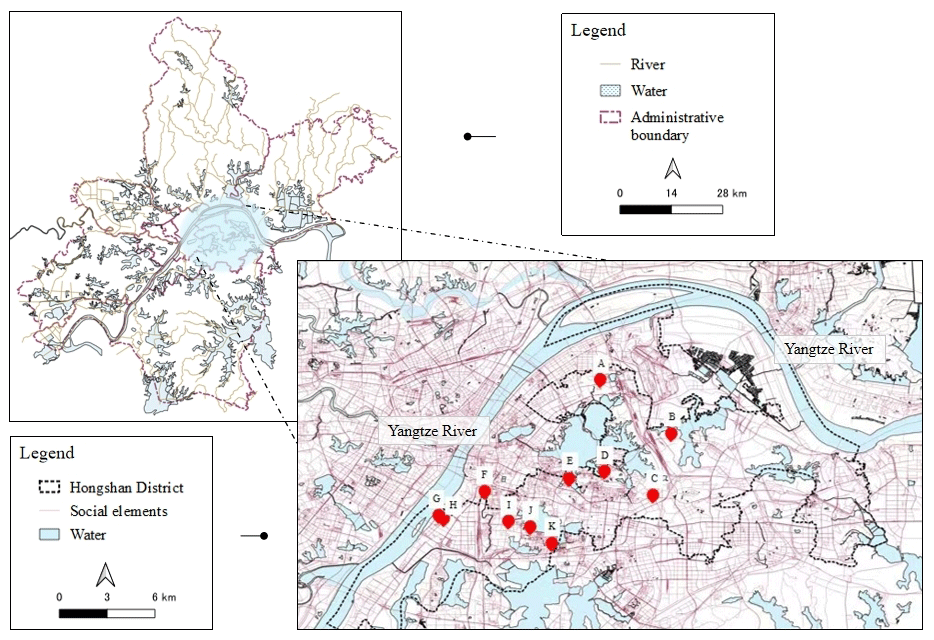
Figure 2Geographical features and administrative boundaries of Wuhan and Hongshan District. The points A–K show the locations of the communities where the questionnaire surveys were conducted.
Wuhan's urban population has risen steadily over the last 40 years, with the urbanization rate increasing from 47.4 % in 1978 to 80.04 % in 2017. Thus the potential for population absorption continues to increase. The city's permanent population has steadily increased in recent years, from 9.8 million in 2010 to 12.3 million in 2020, an average yearly increase of 250 000 (Wuhan Municipal Bureau of Statistics, 2021).
Wuhan is also one of the cities most vulnerable to natural disasters. High temperatures, drought, heavy rain, waterlogging, freezing damage from cold temperatures, and strong winds are the most common natural catastrophes. Wuhan is particularly prone to extreme rain and flooding because it has a complex internal river network, a low and flat core region, and a subtropical monsoon climate.
Hongshan District, a key area in Wuhan's major metropolitan area, encompasses six districts. The Yangtze River, China's longest river, flows through Hongshan District for 75 km to the southwest, maintaining a water level of 14.57–20.05 m. Historically, floods resulting from Yangtze River bursts have posed significant threats to human lives and property in the district, particularly before 2000. Between 1951 and 1980, Hongshan District experienced 114 severe rainstorms, with notable flood events in 1931, 1949, 1954, 1983, 1998, and 1999, documented as some of the most severe recorded (Records of Hongshan District, 2009). On 21 July 1998, the region faced an unprecedented rain event, resulting in catastrophic flooding that disrupted production and caused home collapses. This event impacted 526 households and 103 800 people, leading to a direct economic loss of CNY 182 million for the district (Records of Hongshan District, 2009).
In addition to the Yangtze River, Hongshan District is surrounded by several lakes (Fig. 2), with 14 lakes covering 113 km2 and accounting for 22.2 % of the district's total area. Each year, the number of rainy days gradually increased from March to August. The lake level increased rapidly when the rainy season began in May and culminated in July and August. Changes in lake water levels have had a weaker relationship with the Yangtze River since 2000, when the dam was completed. However, the main effects were precipitation and industrial, agricultural, and household water use. As a result, the flooding induced by the rising water level of the inner lakes was the primary hazard risk in Hongshan District.
The targeted communities were chosen to represent geographical and social distinctions. In terms of geographic location, all target communities were close to lakes and rivers and were exposed to potential flood risks. Furthermore, within China's metropolitan regions, the housing reform policy has brought about a spatial division of labor in terms of the community's socioeconomic status. Based on explanations of the district housing plan of Wuhan, we divided the target communities into four categories (Table 1): the communities with high-grade residences (Type I), the newly demolished and rebuilt communities (Type II), the old demolished and reconstructed communities (Type III), and the urban villages (Type IV). Additionally because of urbanization and land expansion, many communities are at different stages of development, resulting in spatial differentiation in scenery, public facilities, and administrative management levels.
Table 1The types of communities.
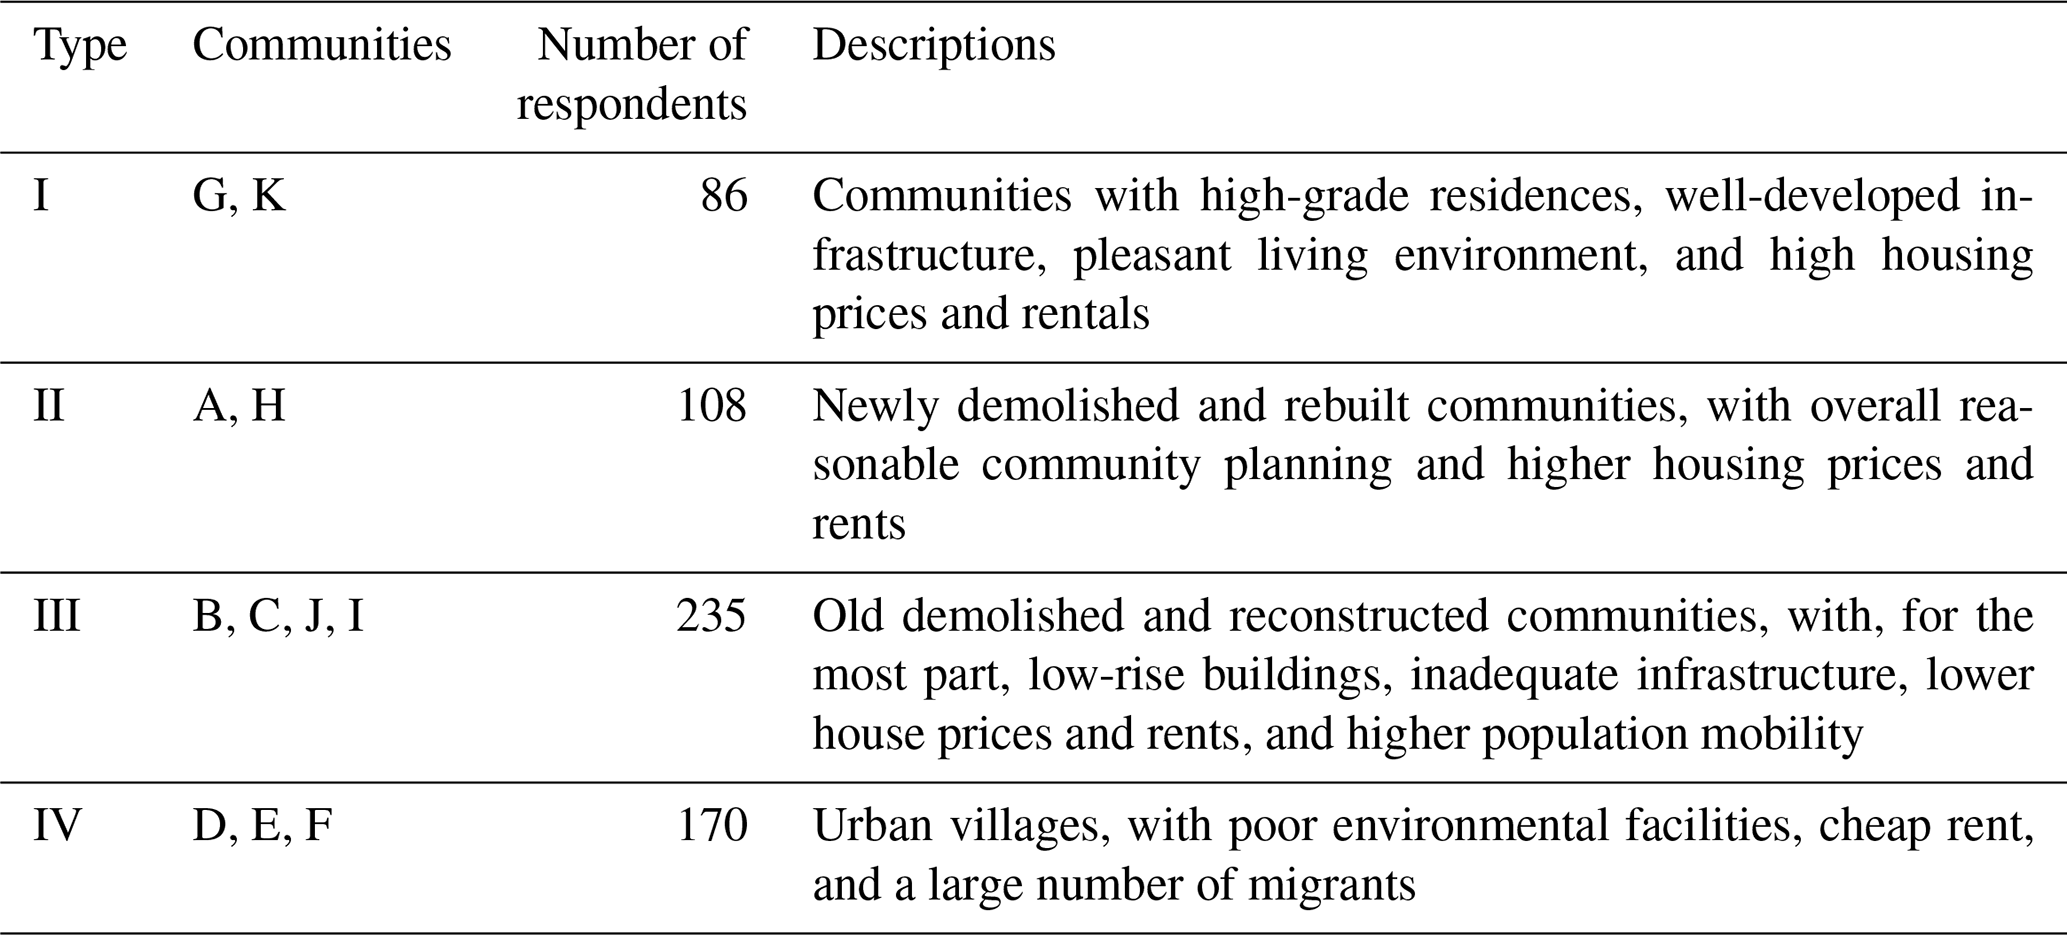
Sources: Records of Wuhan (2000) and Records of Hongshan District (2009).
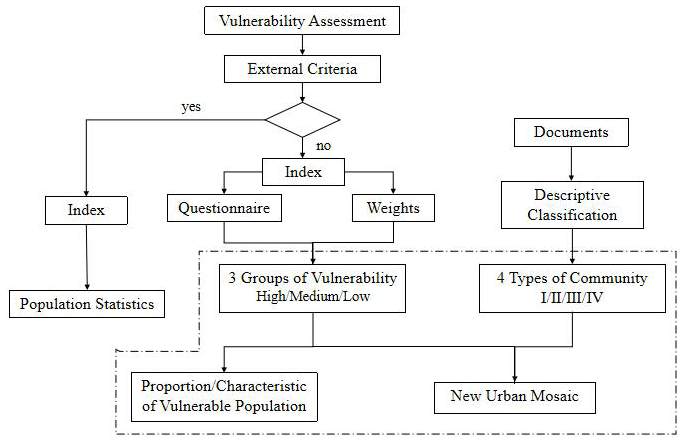
Identifying indicators is the first step in a quantitative analysis of vulnerability. In many previous studies, as mentioned above, it is common to select indicators based on external criteria, such as regional economic level and infrastructure supply level. However, there is a certain limitation that it is quite difficult, if not impossible, for such external criteria to grasp all aspects of the individual characteristics in any given group. Therefore, this study focuses primarily on the individual ability and/or capacity to withstand and recover from disasters to create a more accurate analysis of the entire spectrum of characteristics of the community.
After identifying the indicators, the next step was to weigh the indicators while analyzing the vulnerable population using the data acquired from the questionnaire survey with sampled households, calculating the proportion of the high-, medium-, and low-vulnerability populations in each type of community. Vulnerable populations often interact with dangers in their places of residence. Finally, we discuss the relationships between the vulnerabilities at the community level that are induced through the calculated three-group proportions in each of the community types and their social characteristics that are provided by the explanations of the community typology to obtain the distribution characteristics of the vulnerable population and to examine the new urban mosaic in Wuhan (see Fig. 3).
3.1 Selection and description of indicators
This study selected indicators based on the concept of vulnerability, partly following historical disaster cases and the specific conditions of China's urban development. It adopts the IPCC's “exposure–sensitivity–adaptive capacity” conceptual framework (IPCC, 2007), as exemplified by Füssel and Klein (2006), Füssel (2007), O'Brien et al. (2008), Coulibaly et al. (2015), Weis et al. (2016), and Fischer and Frazier (2018), to construct an evaluation index system (Table 2) and to design the questionnaire. Although recent vulnerability assessments following the IPCC (2014) framework have adopted a new paradigm of vulnerability that excludes exposure, this study argues that some factors of exposure are related to the internal state of the social system.
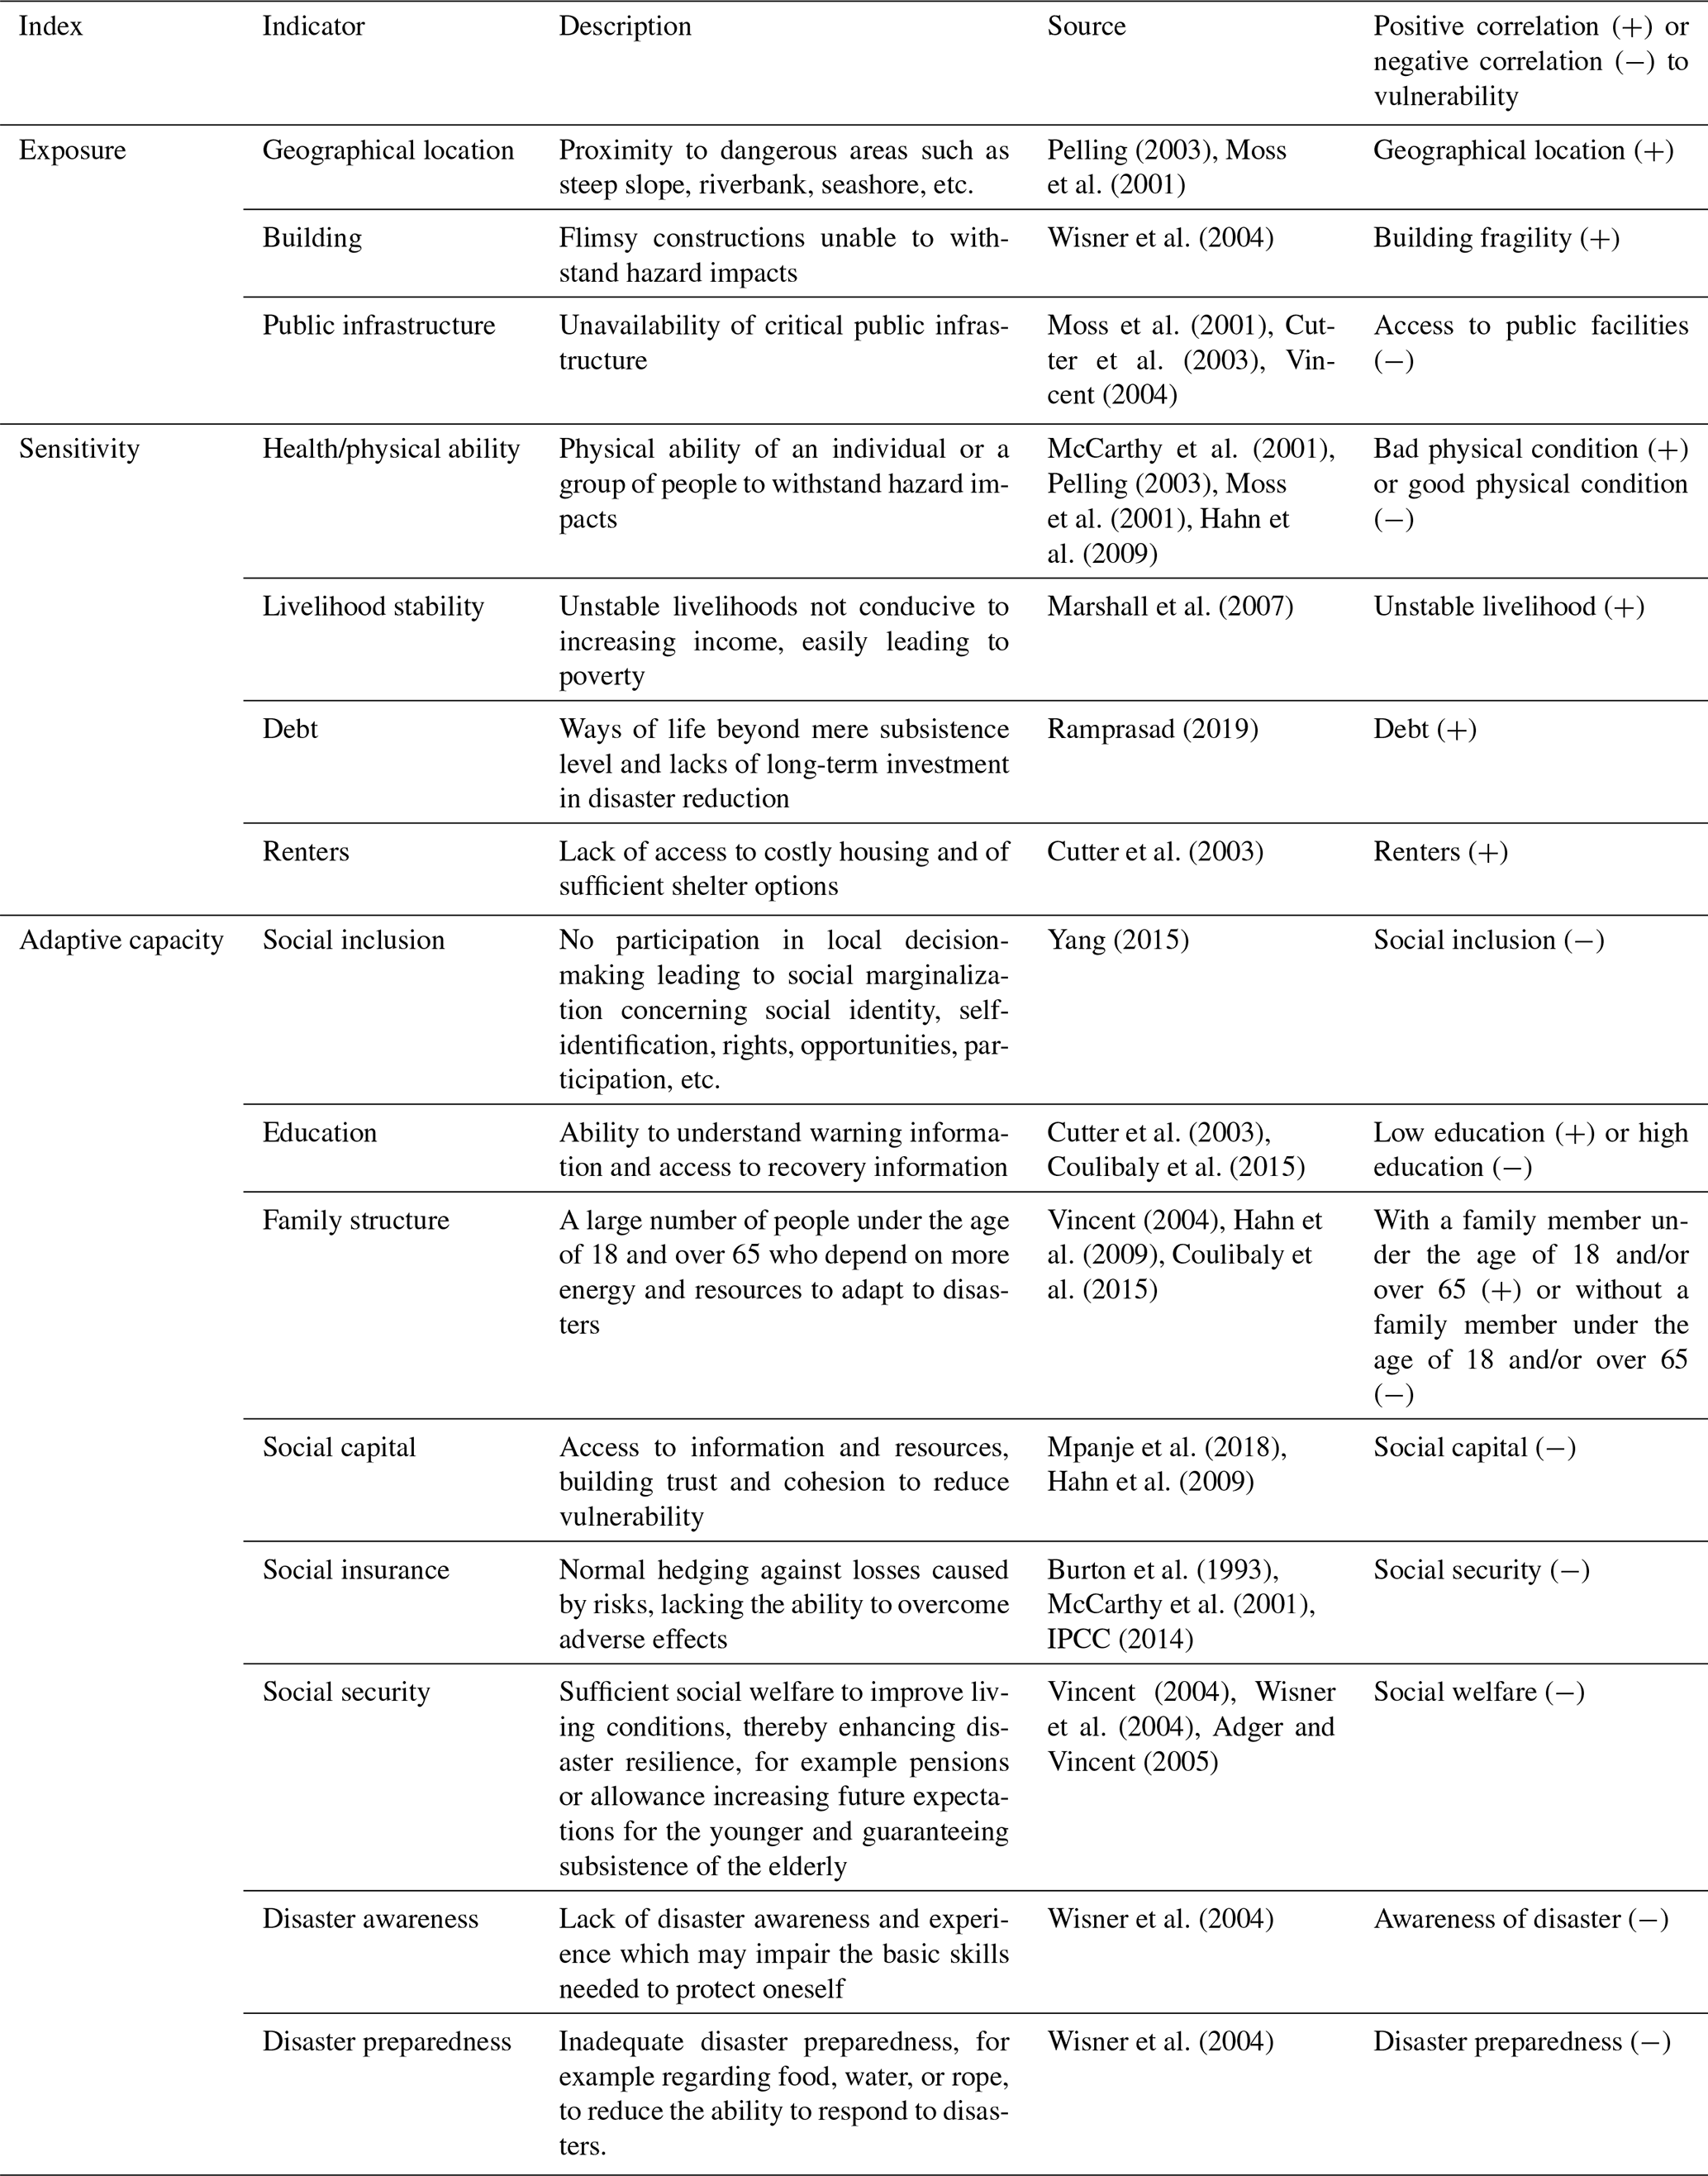
According to previous studies, social vulnerability exists in certain areas prior to a disaster (Adger, 2006; Bolin, 2007). This status is closely related to a lack of resources, poverty, and marginalization (Hewitt, 1983), as well as to the adaptability of human beings to cope with immediate or anticipated disaster pressures (Cutter, 2003). As such, the vulnerability index parameters vary depending on the object and region of evaluation.
Exposure is primarily determined by physical location as well as the characteristics of the surrounding built and natural environments (Pelling, 2003; Perrow, 2007). This study discards certain factors when choosing exposure indicators, such as the frequency of natural disasters and disaster losses, and instead concentrates on the locations of houses, buildings, and infrastructure. This is because locations and built environments are interconnected with social attributes, such as social class and income.
Previous studies have shown that the poor may be driven to reside in hazardous regions owing to a lack of options for location and construction, because such places are less expensive (McEntire, 2011). For example, tens of thousands of low-income African Americans who lived near Lake Pontchartrain were forced to fend for themselves when Hurricane Katrina attacked the Gulf Coast of the United States in 2005 and flooded the city of New Orleans due to breached levees (Bolin, 2007). The experts indicated that strengthening the dike and flood control systems could have lessened economic losses and saved many lives, as mentioned later. It can be seen that living in unsafe geographical locations and buildings and a lack of a complete public facility will increase potential exposure.
Sensitivity is the degree to which a system or species is affected by climate variability or change, either adversely or beneficially according to the IPCC (2014). In summary, sensitivity refers to the degree to which the evaluated item or human is sensitive to risk and indicates the likelihood of harm. It is dependent on the inherent characteristics of the targets (Huang et al., 2014), particularly those related to livelihood and health (Pelling, 2003). Hence, to illustrate the sensitivity of the urban population, we primarily employed population structure and economic characteristics. Previous case studies (Adger, 1999; Xu and Takahashi, 2021) also showed that unstable livelihoods and poor health are more sensitive to external disturbances or changes.
Adaptive capacity is the ability of systems, institutions, and humans to anticipate or reduce risk, adjust to potential damage, take advantage of opportunities, or respond to consequences (McCarthy et al., 2001). It is the result of the amount of intentional preparation done in light of prospective danger, as well as spontaneous or premeditated adjustments performed in response to perceived threats (Pelling, 2003). It also represents the social system, through the continuous adjustment of coping strategies and measures to adapt to the surrounding environment (Klein et al., 2003). It is often influenced by educational attainment, social capital, and social networks (Hahn et al., 2009; Huang et al., 2014; Aldrich, 2019). Individuals or groups with poor adaptability are more likely to suffer damage and find recovery difficult.
In current Chinese urban society, due to the influx of large numbers of migrants, social integration, including social identity and self-identification, has become a key indication of rights, opportunities, and participation. It determines individual opportunities to access resources and information. At the same time, disaster awareness and education are required to build disaster resilience, as evidenced by past disasters.
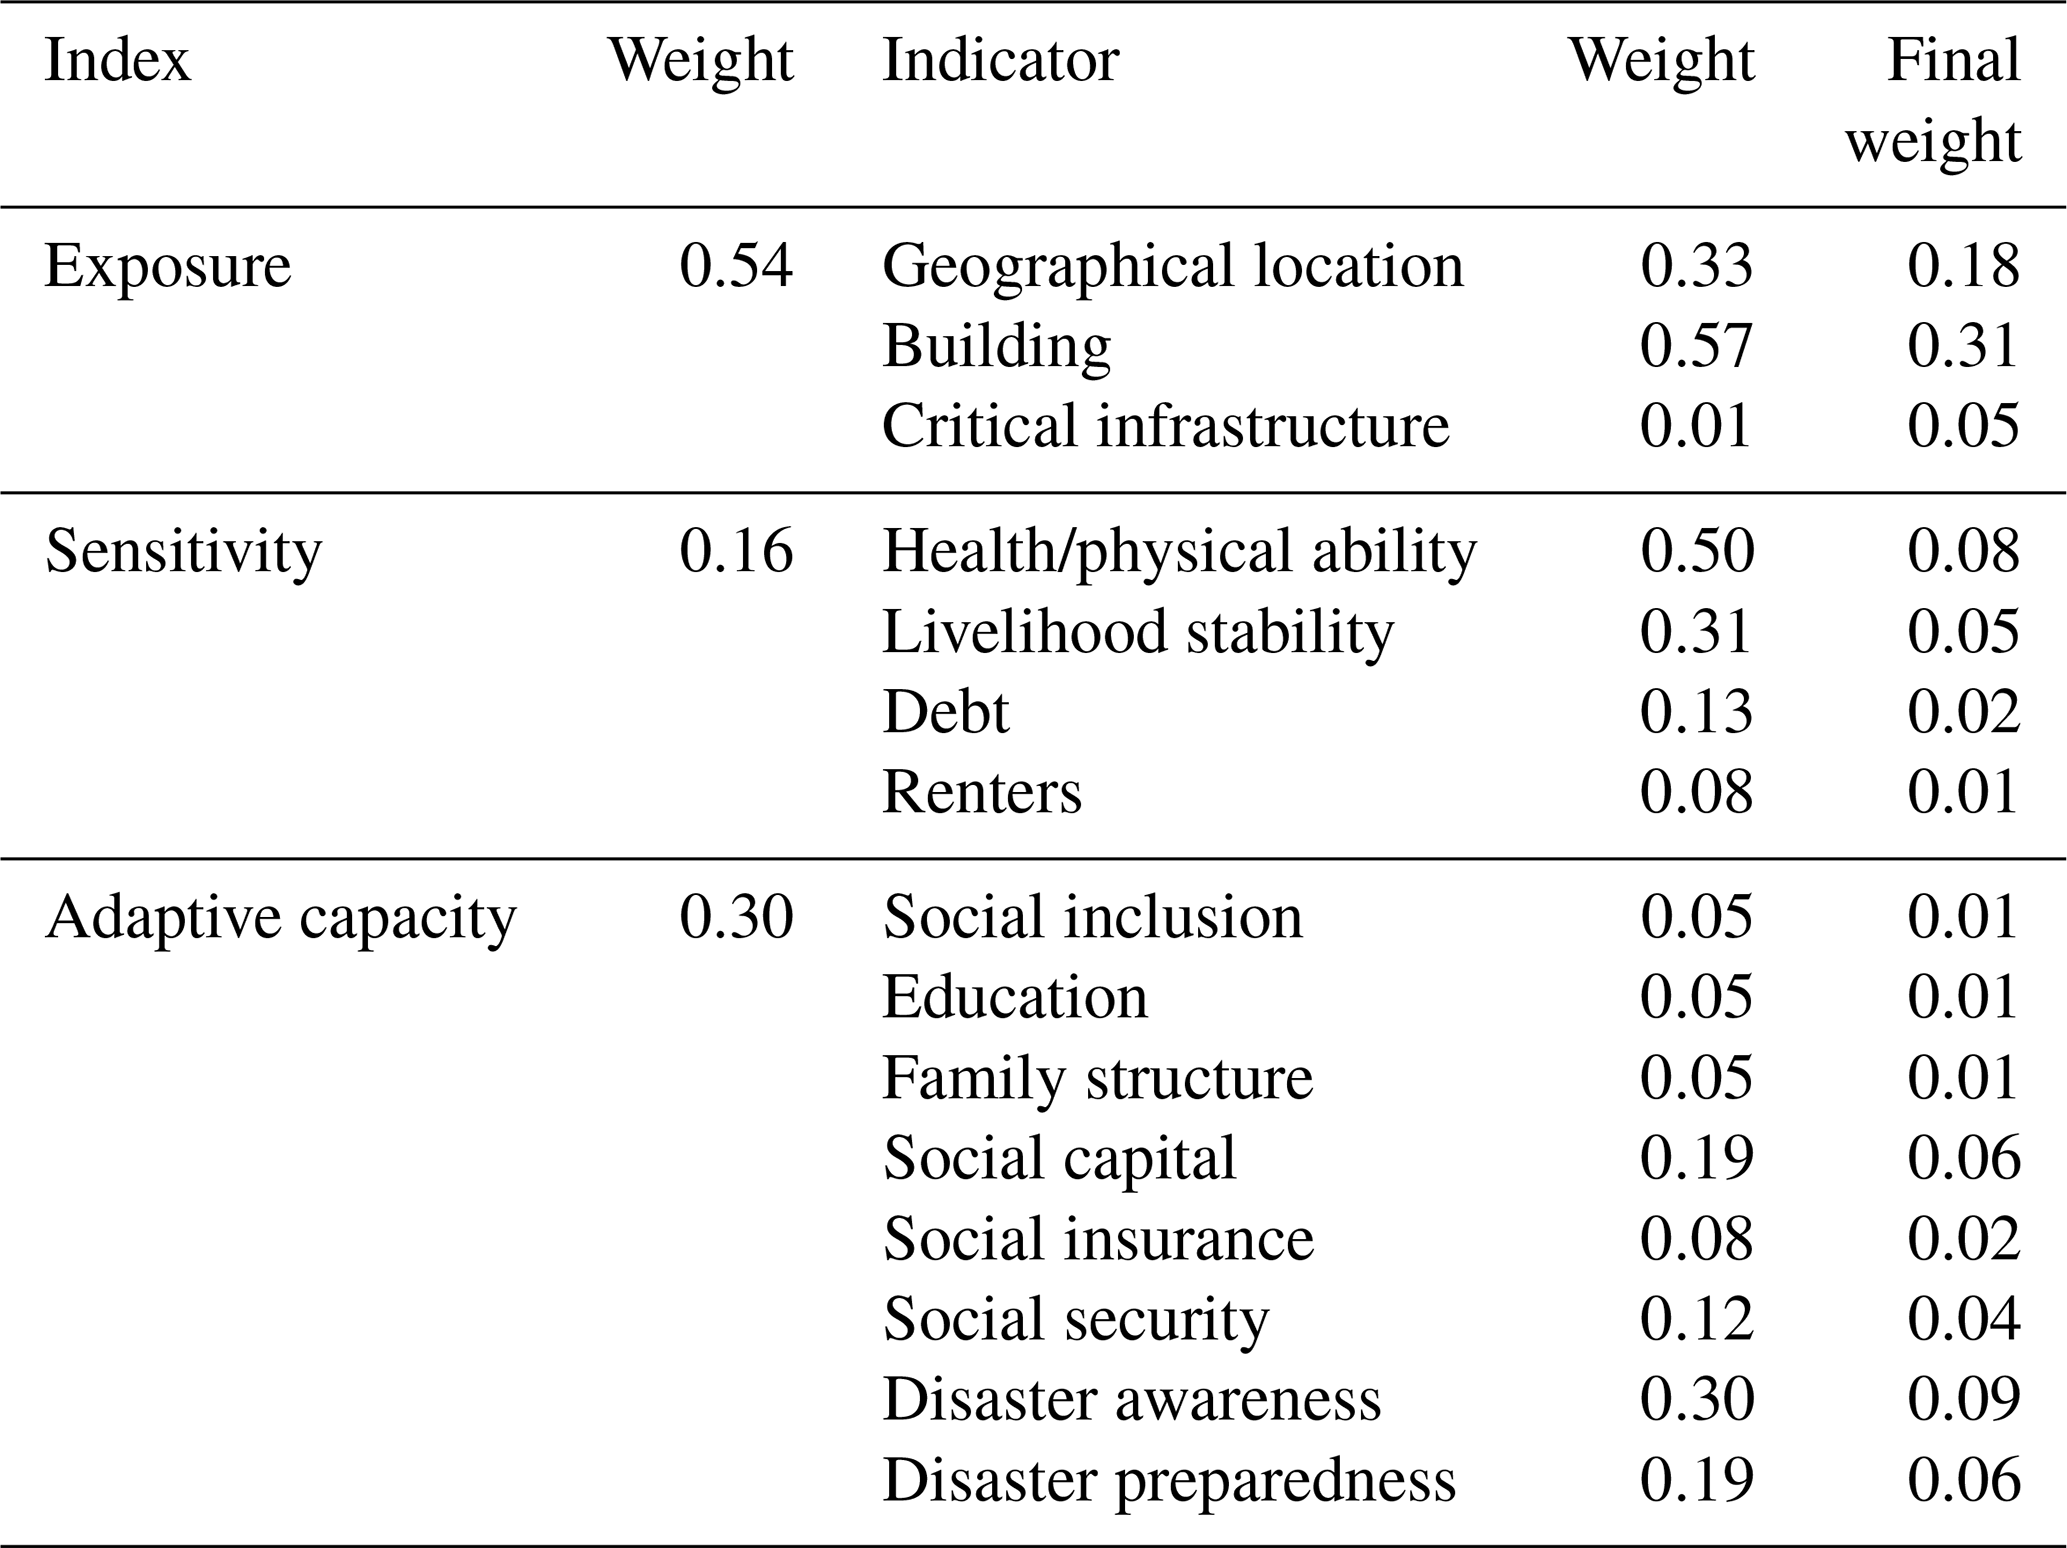
3.2 Determination of weight
The weight is the relative importance of each indicator in the overall evaluation. Currently, methods for determining weights can be roughly divided into subjective methods, including the expert scoring method, analytic hierarchy process (AHP), and fuzzy comprehensive evaluation (FCE), and objective methods, including the entropy method, principal component analysis (PCA), and factor analysis. Given the uncertainty in system dynamics (Villa and McLeod, 2002; Vincent, 2004), vulnerability indices cannot be genuinely tested because they aim to provide information about the risks of future events. To be credible, the vulnerability index must either match what people actually observe in some way or at least have some intuitive resonance with experts (Sagar and Najam, 1998). Therefore, this study adopted a combination of the expert scoring method and AHP to determine the weight of each indicator.
In utilizing snowball sampling, we initially contacted 10 external experts from China, Japan, and Indonesia via email. These experts encompassed local individuals with disaster experience, scholars specializing in disaster studies, and researchers in sociology and geography. The feedback process involved sharing Table 2, inclusive of indicator explanations, in a Word file. We outlined steps for scoring 15 variables related to social vulnerability based on importance levels (very important, 5; more important, 4; generally important, 3; less important, 2; not important, 1). The response rate from all experts was 100 %, with no additional prompts provided. We then computed the weight using AHP with the following steps:
-
Use the judgment matrix to calculate the weight of each indicator (including the first-level and second-level indices), and check the consistency of the judgment matrix.
In the consistency test (Saaty, 1980; Lane and Verdini, 1989; Lin et al., 2013), the random consistency ratio in the judgment matrix is
where CR is the consistency ratio, CI is the consistency index, and RI is the random consistency index.
The results of CR in all the matrices are less than 0.10.
-
The final weight for each indicator underwent a rigorous calculation process. To enhance scientific rigor, we employed the arithmetic average, geometric average (Dvořák, 2016), and eigenvalue (Golub and Van der Vorst, 2000) methods. Subsequently, we considered the average derived from these calculations the final weight for each indicator (refer to Table 3).
3.3 Data collection and analysis
Preliminary interviews and questionnaire surveys were conducted in June and July 2021, respectively. First, we designed questionnaires using the social vulnerability index (Table 4) and conducted preliminary interviews with local residents. In addition, when selecting the sampling method, it was taken into account that many urban migrants, especially low-skilled and low-secured representatives of migrant workers, were not fully included in the urban population list. Therefore, we adopted a quota-sampling method to determine the sample size for each community based on official data, preliminary research, and interview data. Then, the required quantity for each community was determined in advance through mutual control quota analysis of the age, gender, and household registration characteristics of the surveyed samples, and next surveys were distributed face-to-face until the target quantity was collected. A total of 620 questionnaires (including 599 valid responses, an effective rate of 96.6 %) were collected from 11 communities (A to K) in eight streets of Hongshan District, Wuhan (see Table 1).
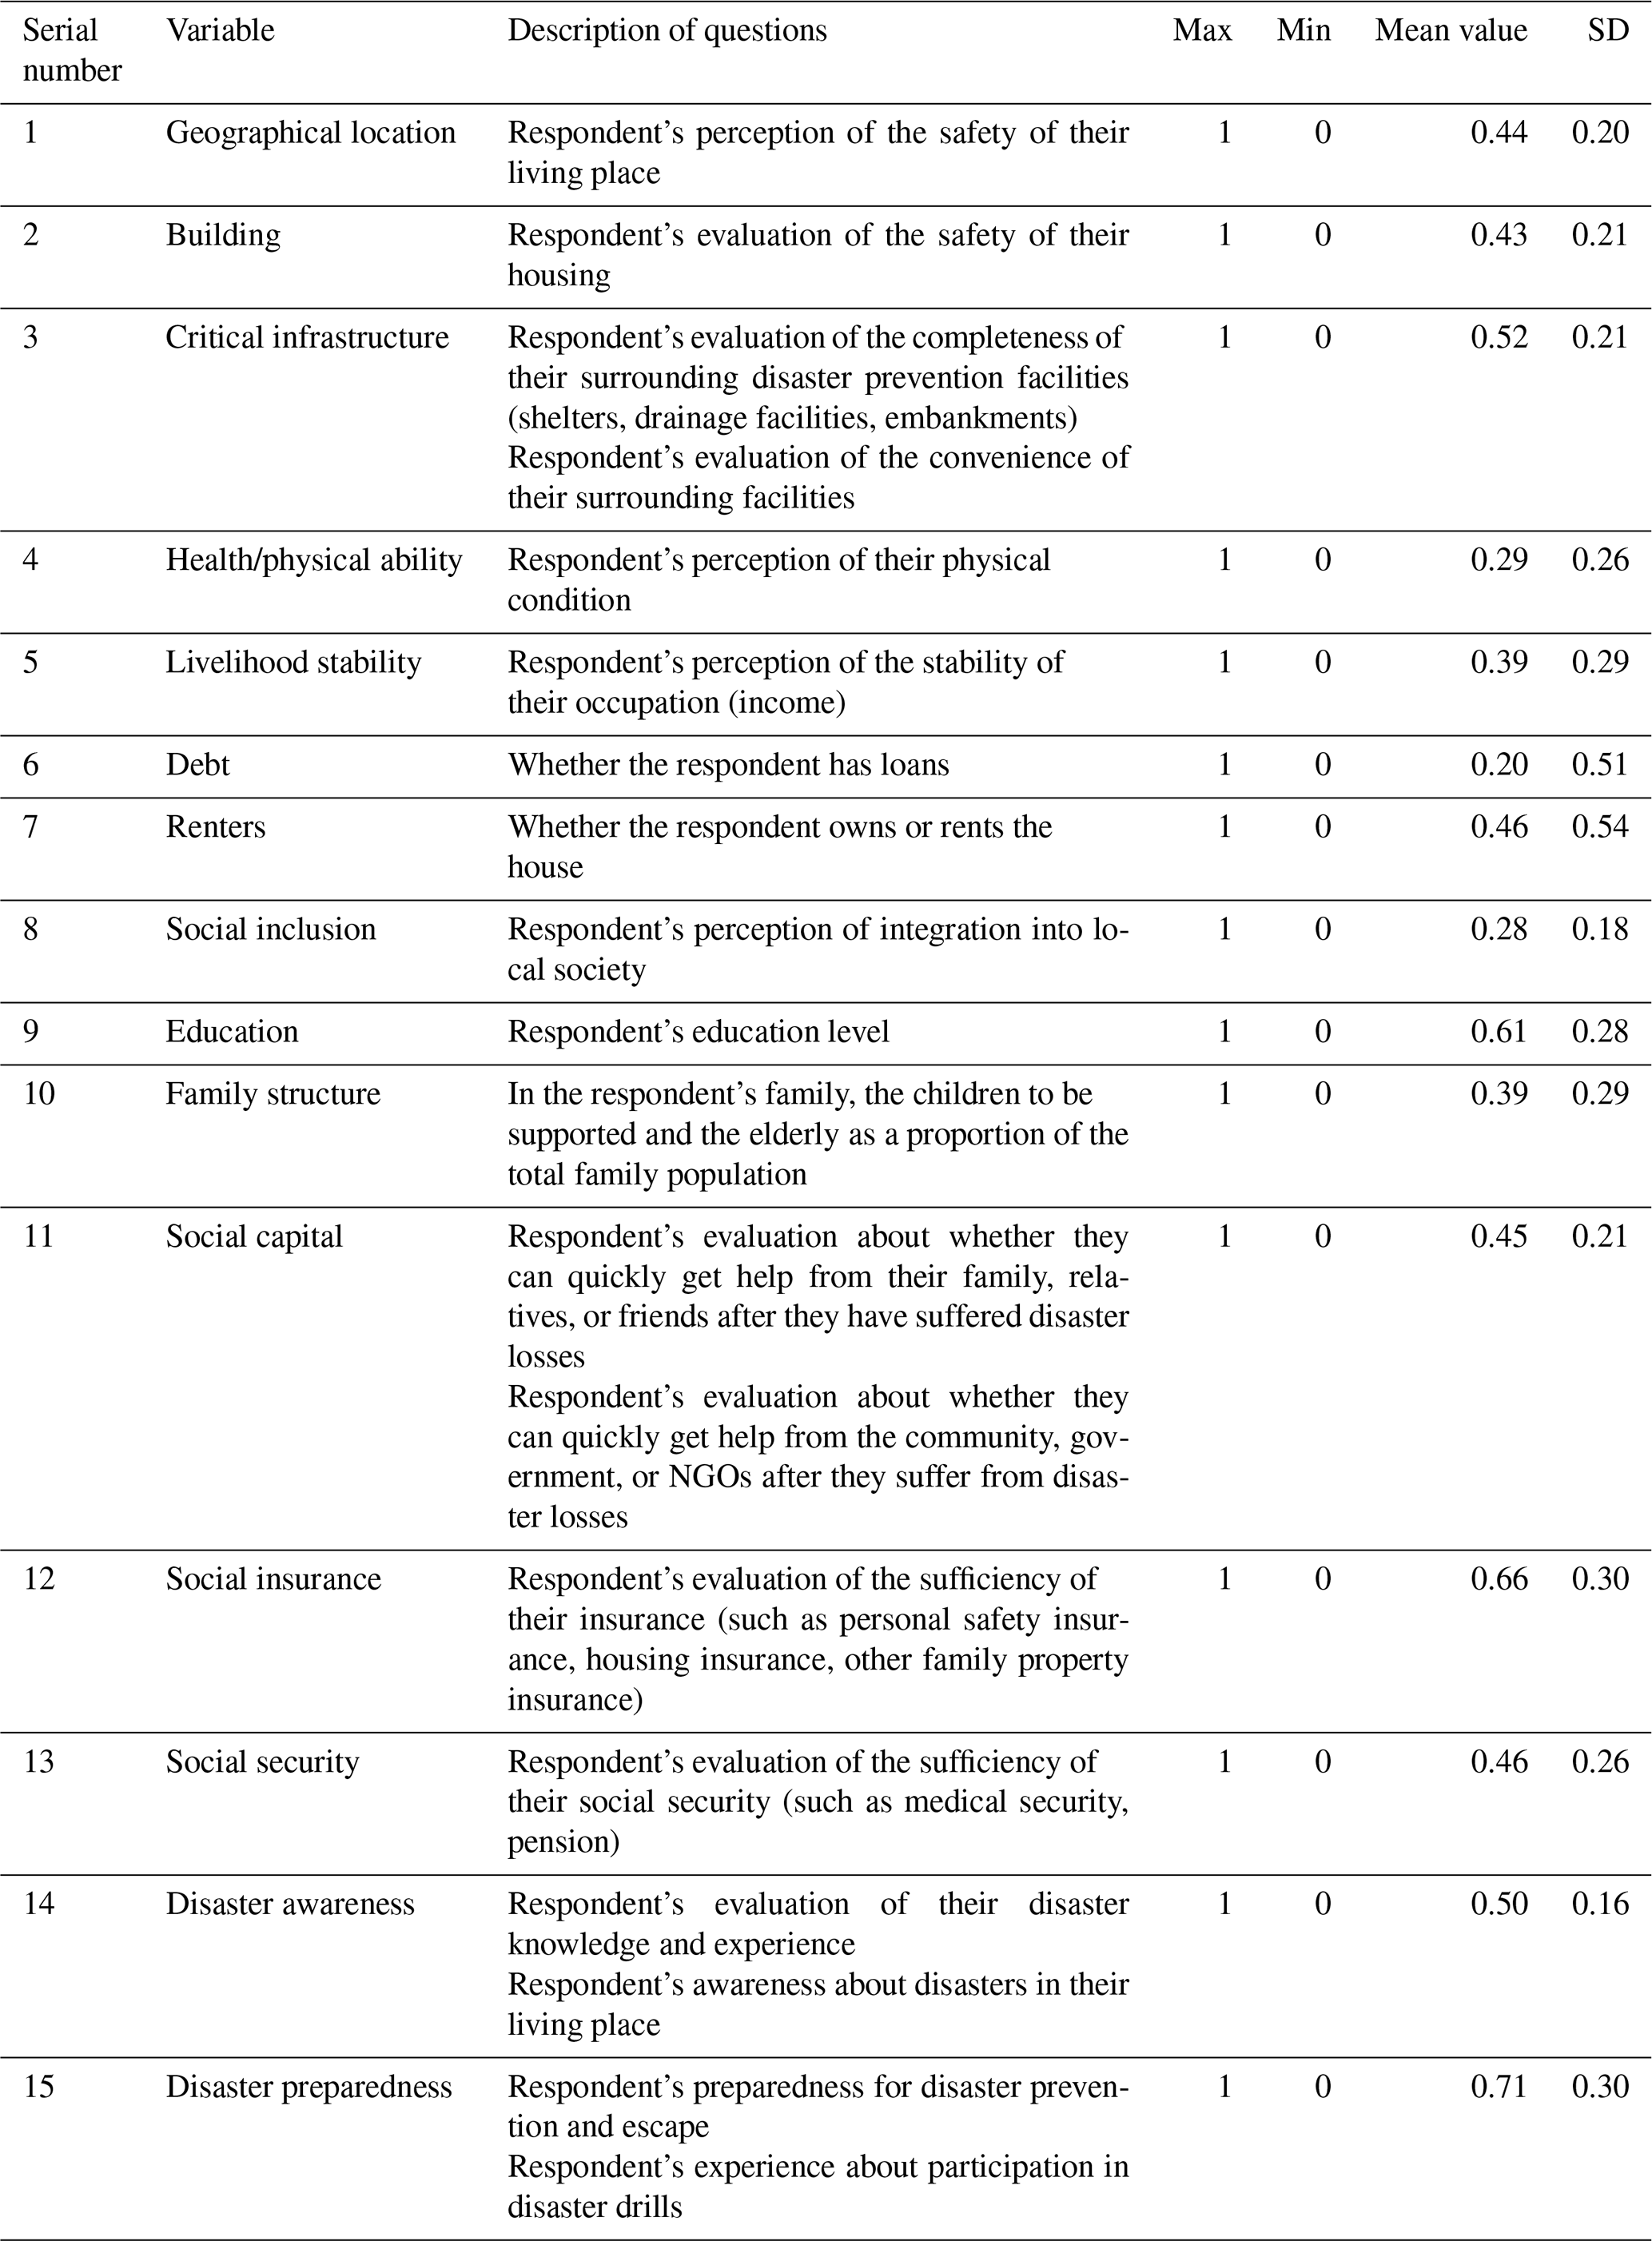
To eliminate the influence of different dimensions and orders of magnitude, we adopted normalization for each index. Min–max normalization was used to obtain the numerical values of all indices between 0 and 1.
Normalization for positive indicators is as follows:
Normalization for negative indicators is as follows:
Here xij represents the value of the jth index of the ith surveyed object and min{xj} and max{xj} represent the minimum and maximum values of the jth index of all surveyed objects, respectively. The vulnerability value was calculated after normalization.
To compare the social vulnerability of target communities and identify the characteristics of vulnerable groups, K-means cluster analysis was adopted to divide vulnerability values into three categories: high, medium, and low. Cluster analysis is a statistical method that divides research objects into homogeneous groups. The same cluster of levels of social vulnerability reflects a similar ability of individuals and communities to withstand risks, and its level directly indicates the possibility of individuals or communities succumbing to disasters. Quantitative (discrete and continuous) variables reveal the current vulnerability of Wuhan communities as well as the probability that they may be affected by disasters in the future.
4.1 Comparison of different communities' social vulnerability
Within the ambit of our study, 11 communities, labeled A to K, were systematically categorized into Types I to IV (refer to Sect. 2), based on their states of development in terms of built environments, demographic compositions, housing prices, and other features. The social vulnerability of these four types of communities was calculated, and it was found that there were significant disparities in vulnerability between them (Fig. 4).
Type-I communities had the lowest social vulnerability, followed by Types II and III, whereas Type-IV communities had the highest. Moreover, the four community types showed statistically significant differences in their vulnerability levels (see Fig. 4).
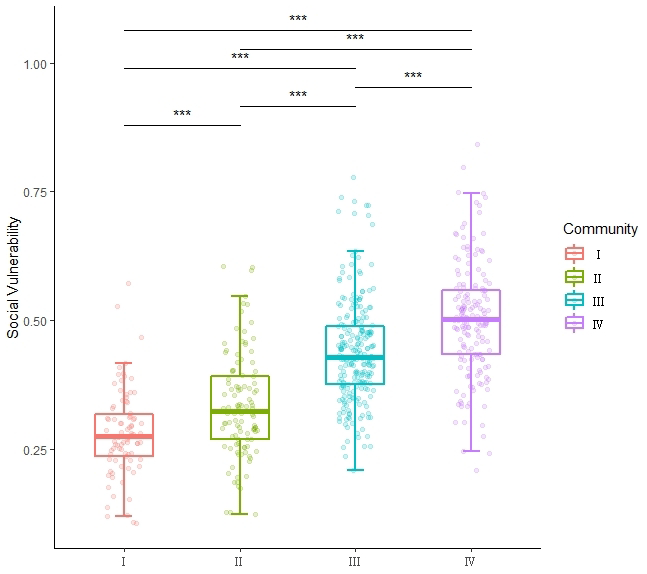
Figure 4Social vulnerability boxplot of the four community types. The boxplot is used to represent the central location and distribution range of vulnerability data for the four types of communities and to compare them. The four colors shown in the legend represent four different community types, each consisting of multiple communities (see Table 1). There is a line in the middle of the box representing the median of the data; the top and bottom of the box are the upper quartile (Q3) and the lower quartile (Q1) of the data, respectively; the top and bottom lines represent the maximum and minimum values of the group of data, respectively. Some points distributed outside the boxes represent outliers in the data. This figure shows not only the distribution, outlier, fluctuation and stability of each type of community vulnerability, but also a comparison of the difference in distribution and value of different types of community vulnerability. Note: (= 0.000).
Figure 4 also shows that Type-I communities had the most concentrated distribution of vulnerability, implying that the vulnerability gap among individuals in each Type-I community was the smallest. According to the survey data, residents are homogeneous in socioeconomic traits such as educational attainment and income stability.
The most dispersed data of Type-IV communities indicate that the disparity of individuals' vulnerabilities in Type-IV communities is relatively large, and this is related to the high rate of floating populations in urban villages, as well as the heterogeneity of population attributes and social characteristics. Type-II and Type-III communities were rebuilt after demolition and relocation and are referred to as Huanjianfang in Chinese. Huanjianfang refers to the government's demolition of the original houses of farmers in suburban areas for municipal construction and accommodating new houses. New dwellings were reallocated to residents who demolished their original houses as compensation. It is a unique process of dwelling in China's urbanization process and is subject to restrictions related to circulation. Furthermore, developers frequently use inferior building materials to reduce costs. The main difference between the two types was that Type-II communities were superior to Type-III communities in terms of housing density, construction quality, infrastructure, and greenery. As a result, despite the fact that both types were rebuilt following the renewal of former villages in the rural–urban fringes, there was still a significant disparity in the characteristics and vulnerabilities of the people between the two types.
Compared with sensitivity and adaptability, which are dimensions of vulnerability, exposure fluctuated the most. Type-I and Type-II communities were significantly less exposed than Types III and IV, with the fourth type seeing the most exposure, namely, in dangerous geographical and physical conditions. The difference in sensitivity across the four types is minor, with most of the people in Types I and II being somewhat less sensitive than those in Types III and IV; but individuals within each group, on the other hand, differ significantly. A previous study (Turner et al., 2003) found that social vulnerabilities vary not only between societies, communities, and groups, but also among residents in the same area or community. We have verified this by using quantitative analysis to give similar findings (see Fig. 5).
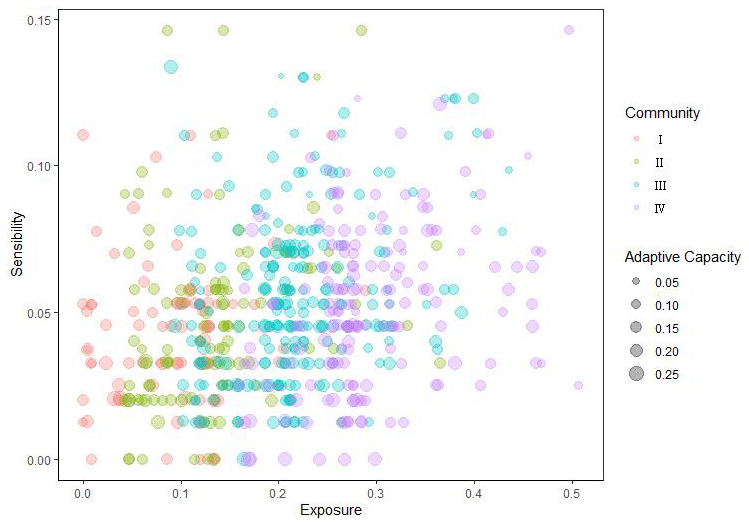
Figure 5Exposure, sensitivity, and adaptive capacity of four types of communities. The bubble chart shows three variables (exposure, sensitivity, and adaptability) for four types of communities. Exposure and sensitivity correspond to values on the x axis and y axis, respectively, and adaptability is represented by the size of the bubble. The four different colors in the legend represent four types of communities, and the dot size is used to explain the size of adaptability. Through Fig. 5, not only can the overall exposure, sensitivity, and adaptability of the study area be displayed, but also the differences in exposure, sensitivity, and adaptability of different types of communities can be compared.
Although the majority of highly exposed and highly sensitive individuals also showed poor adaptive capacity, the four types of communities showed very little variation in individual adaptability, and the aggregate values were not all high, according to the bubble chart (Fig. 5). Furthermore, Fig. 5 shows that overall sensitivity and adaptability have a negative relationship. Individuals who were more sensitive were less adaptive. Adaptability, on the other hand, improves when sensitivity decreases.
4.2 Social vulnerability and residential segregation
As a result of the cluster analysis, three categories of high, medium, and low groups for individual vulnerabilities were obtained. The group with high vulnerability accounted for 12.9 % of the 599 samples investigated, medium vulnerability for 48.4 %, and low vulnerability for 38.7 %. Ultimately, the social vulnerability in the study area was moderate for almost half, with a much lower proportion of high vulnerability.
Table 5The distribution of individuals' social vulnerability.
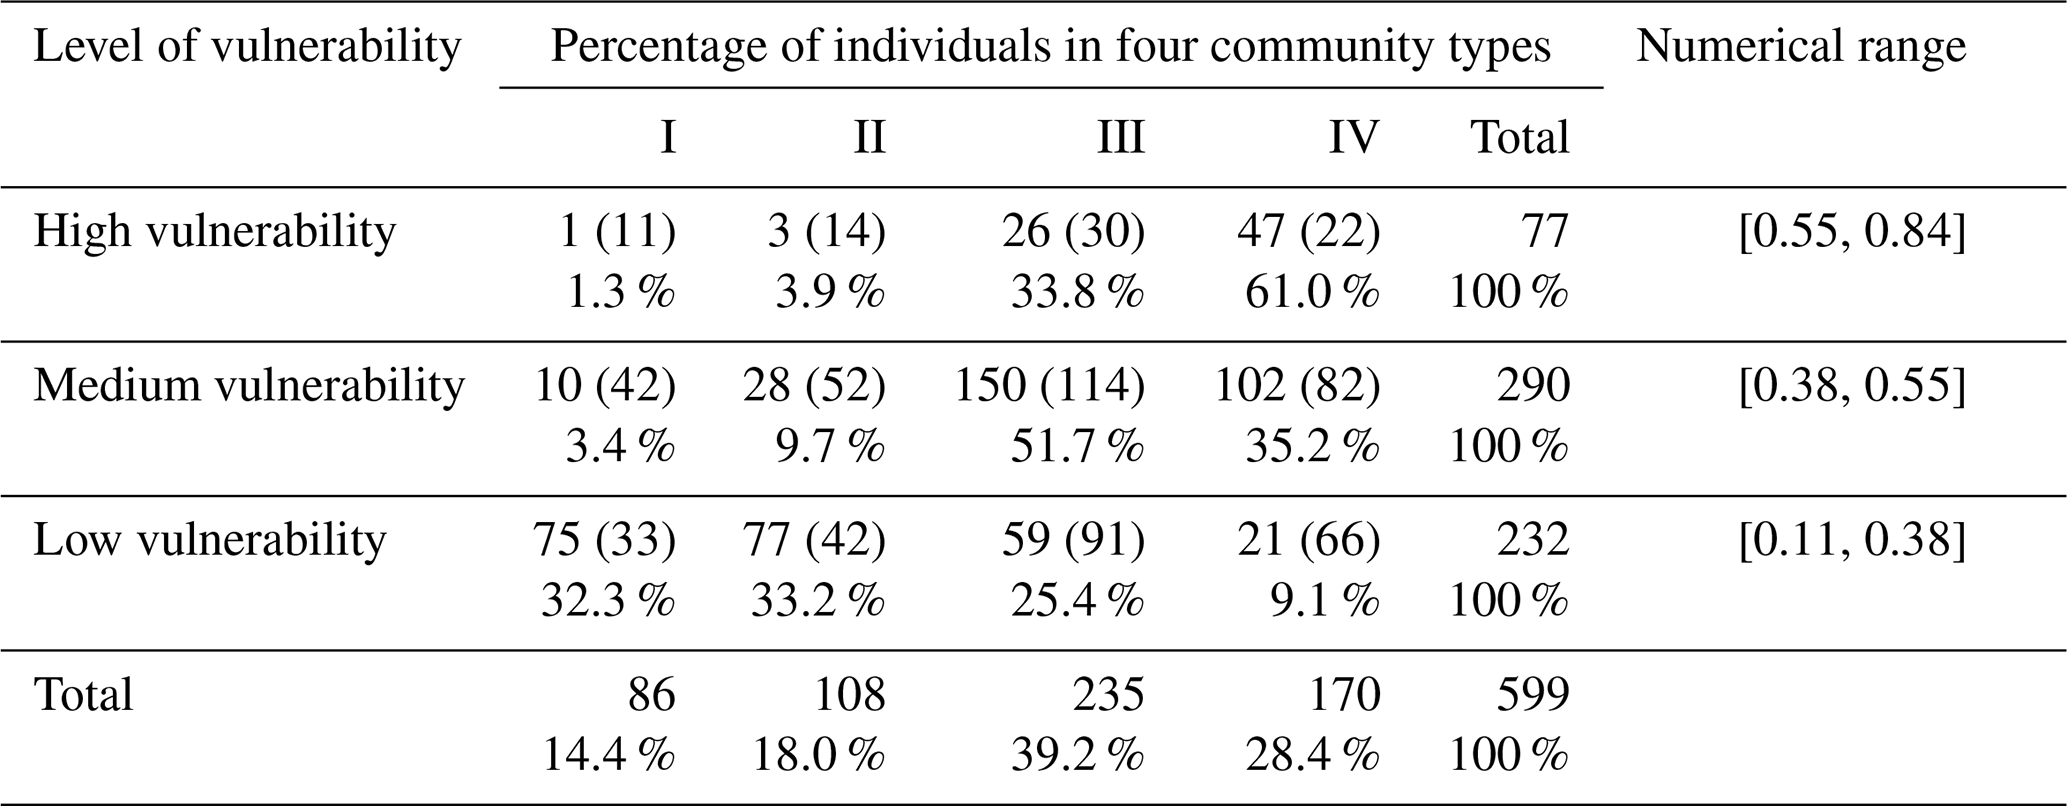
X2 (6, N= 599) = 222, (= 0.000); the figures in round parentheses are expected values.
Table 5 shows that there were a few individuals classified into high- and medium-vulnerability groups in the communities of Types I and II. More than 90 % of the highly vulnerable groups and more than 85 % of the moderately vulnerable groups were concentrated in Type-III or Type-IV communities. Almost half of the moderately vulnerable groups are in Type III; the communities of Type IV, thought of as urban villages, are mainly composed of individuals classified into the high-vulnerability group and a few individuals in the low-vulnerability group.
Furthermore, when comparing the vulnerability characteristics between the community types (Fig. 6), it is not difficult to see that, while communities of Type III have lower scores than those of Type IV in terms of exposure and adaptive capacity, they are more sensitive. Type-III communities are transitioning from urban villages to communities. The population here is confronted with many unpredictable circumstances, and changes in expectations for the future may affect their ability and stability, leading to an increase in sensitivity and loss of potential for adaptation (Fig. 6). Moreover, when a twilight district, such as an urban village, is demolished, its communities quickly lose their relative geographical and environmental advantages, and the people are compelled to relocate. Their low income will not provide many options for where to reside; thus they are forced into more exposed neighborhoods with a high likelihood of becoming a high-vulnerability population.
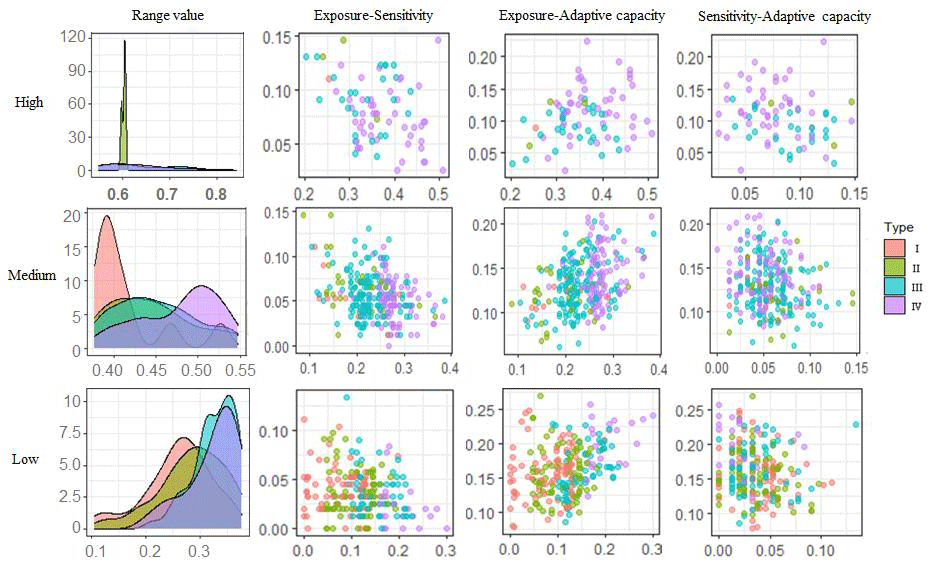
Figure 6The distribution and characteristics of high-, medium-, and low-level vulnerability. The figure horizontally represents the distribution of high-, medium-, and low-vulnerability populations in the four types of communities. Vertically, (a) the range value is the nuclear density curve of the vulnerable population, with a higher peak indicating a more concentrated level of vulnerability (with smaller differences in vulnerability). Conversely, a lower peak indicates a more dispersed level of vulnerability (with larger differences in vulnerability). At the same time, the concentration range of its vulnerability values can be determined. (b) Exposure–sensitivity represents the correlation between the exposure and sensitivity of vulnerable populations in the four types of communities, with the x axis indicating exposure and the y axis indicating sensitivity. (c) Exposure–adaptive capacity represents the correlation between the exposure and adaptability of highly vulnerable populations in the four types of communities, with the x axis indicating exposure and the y axis indicating adaptability. (d) Sensitivity–adaptive capacity represents the correlation between sensitivity and adaptability of vulnerable populations in the four types of communities, with the x axis indicating sensitivity and the y axis indicating adaptability.
The disparity in social vulnerability among inhabitants in various neighborhoods implies “residential segregation” in the metropolitan environments. An urban community is not just a “geographic location” but also a physical and social environment. Urban residents' occupations, incomes, household registrations (hukou), and educational backgrounds differ accordingly, as do the affordability and need for living space and supporting public service facilities.
The rapid urbanization of Chinese cities over the past 4 decades has generated new sociospatial disparities. This sociospatial disparity shattered the initial social homogeneity that existed before the reform and opening of the 1980s. There is a growing tendency to polarize urban districts and increase the degree of intra- and inter-neighborhood segregation. Low-income groups and the floating population frequently relocate to cities to find better jobs and affordable housing. Only when they can gain access to economically favorable environments with lower rent by moving to dangerous places can they relocate to such places, regardless of disaster risks (Hardoy and Satterthwaite, 1989). Households' or individuals' financial capacity to afford minimum standard housing is compromised, often by a preference for food for the family and education for children (Hardoy and Satterthwaite, 1987).
Even though Type-I and Type-II communities are geographically close to lakes and rivers, these types of communities outperform other communities in terms of the built environment, which also influences vulnerability (Pelling, 2003). On one hand, a high-quality building environment, comprising solid housing, appropriate provisions for waste collection and sanitary disposal, and a full fire protection system, results in expensive housing prices, which exclude the majority of low-income groups. The increase in rent caused by the successive demolition and reconstruction of twilight urban districts in municipal planning has forced the low-income groups to find affordable housing. This is why high- and medium-vulnerability residents are concentrated in Type-III and Type-IV communities. However, unfavorable conditions in housing, medical care, job opportunities, and public services may hinder or limit residents' access to high-quality resources and opportunities, exacerbate their precarious situation, and weaken their ability to withstand disasters. This is why the overall social vulnerability of residents in the third and fourth community types was higher than that of residents in the other community types.
In this sense, such social segregation is projected onto space (Cassiers and Kesteloot, 2012) and implies an overlap of dual marginalization in spatial and social terms. Social vulnerability develops through a process of socio-spatial and intraurban heterogeneity. Many factors such as poverty, poor housing, and infrastructure have led to disparities in the social vulnerability of diverse communities and groups. They may suffer different shocks and losses in the event of future calamities.
4.3 Identification of vulnerable populations
The difference in the social vulnerability of different communities is an indirect reflection of socio-spatial divergence and a manifestation of the polarization between the urban affluent and poor groups. The social vulnerabilities of differentiated groups are caused by structural factors in society derived from the features of the system (Clark et al., 2000). Residents in cities belong to different groups, owing to their different economic statuses, cultural backgrounds, living conditions, and other comprehensive factors. The relevant factors of social vulnerability are helpful in identifying vulnerable groups and implementing particular attention and protective strategies.
Table 6Social characteristics of individuals with different vulnerabilities.
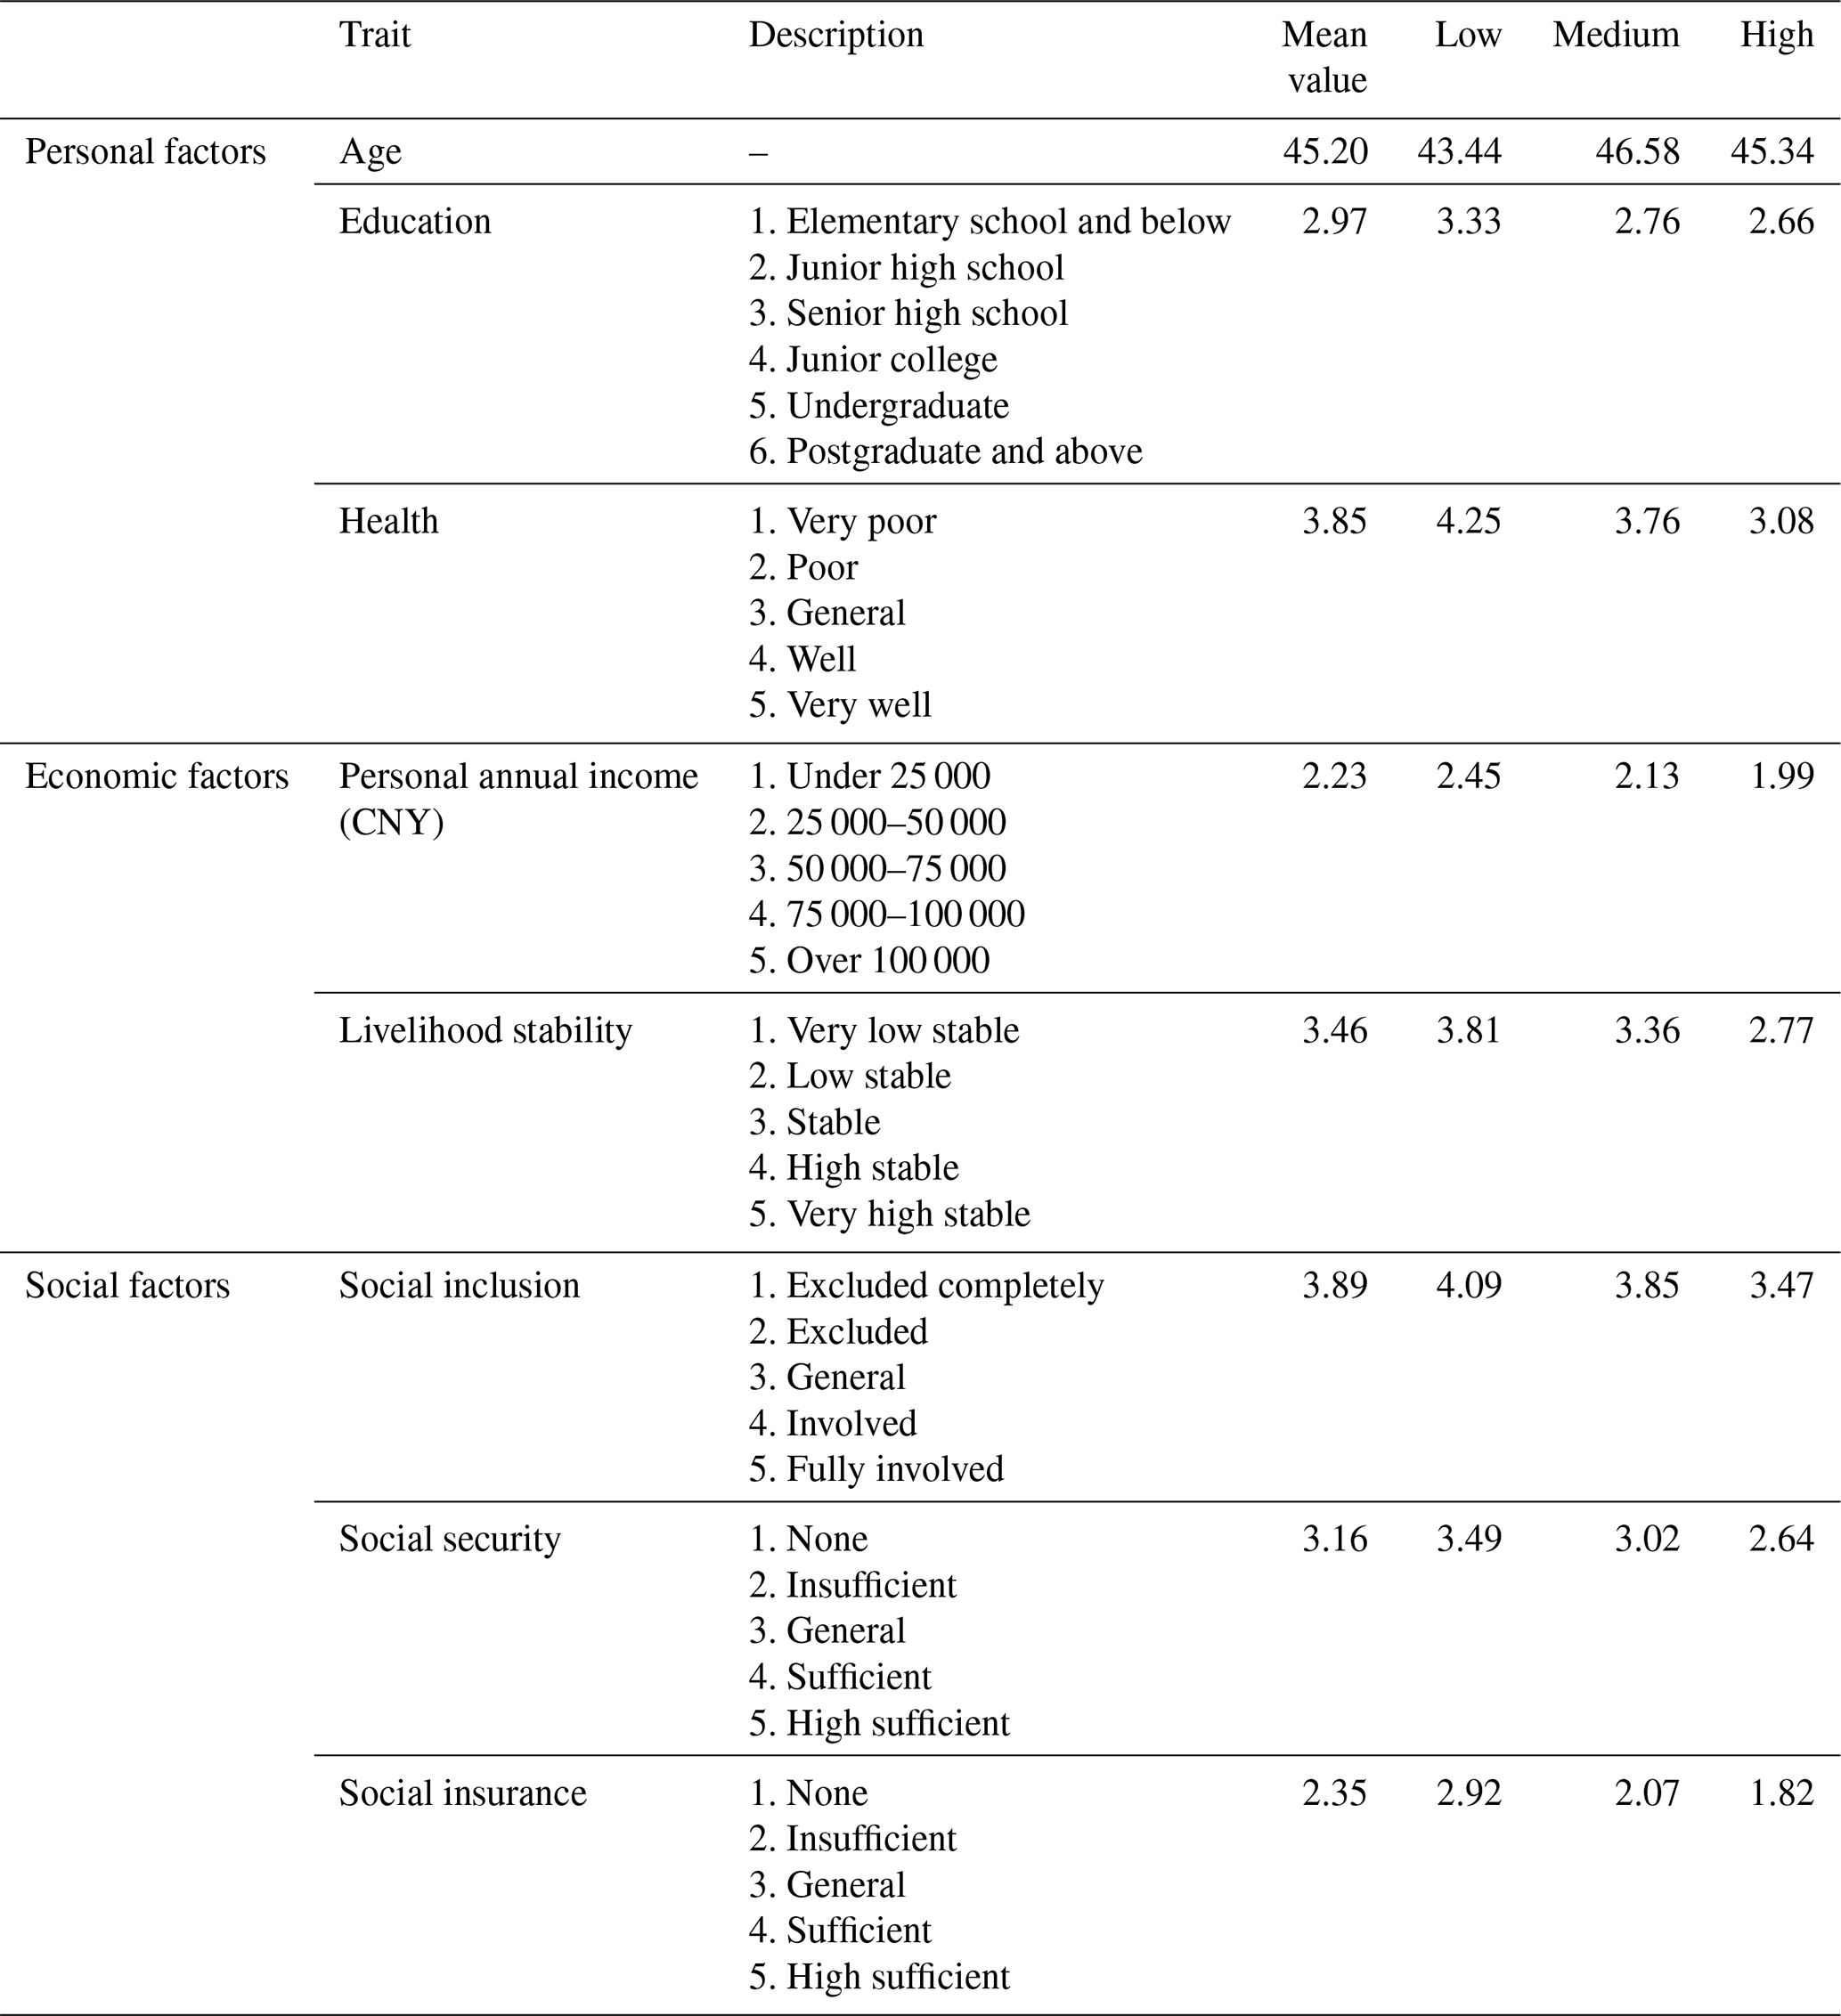
Judging from the mean values of the characteristics in Table 6, individuals with high vulnerability have traits such as low levels of education and health, low annual income, and unstable work. In particular, there were substantial discrepancies between the high- and low-vulnerability groups in terms of health status, job stability, and social insurance.
There is a small gap between the medium- and high-vulnerability groups in terms of education, annual income, and social insurance; however, there is a large discrepancy in health status and employment stability. This indicates a relatively high sensitivity for medium-vulnerability populations. They are more prone to high vulnerability if their physical health and livelihood security are jeopardized by external pressure.
The average age of the low-vulnerability group was lower than the sample average but was somewhat higher than that of the medium-vulnerability group, showing no clear interrelationships. Despite the physical challenges faced by the elderly, their social security, wealth accumulation, income stability, and living conditions in urban China can surpass those of many younger individuals. This advantage, however, may not be applicable to the circumstances in rural China. Analyzing these disparities requires a balanced consideration of the multifaceted aspects of the elderly population, encompassing both advantages and disadvantages and acknowledging potential variations between urban and rural contexts. Consequently even if previous research has pointed out that higher vulnerability is observed in older groups, the findings of this study differ. It is indispensable to make judgments based on the social backdrop and development level when developing indices of vulnerability assessment.
There are other categorical factors such as occupation, household registration, gender, and debt in addition to the continuous variables listed above. As the values of these variables cannot reflect variations in individual social vulnerability, they must be examined independently (see Fig. 7). In addition, the results did not reflect a correlation between gender, debt, and vulnerability. Therefore, this aspect is not discussed in this article.
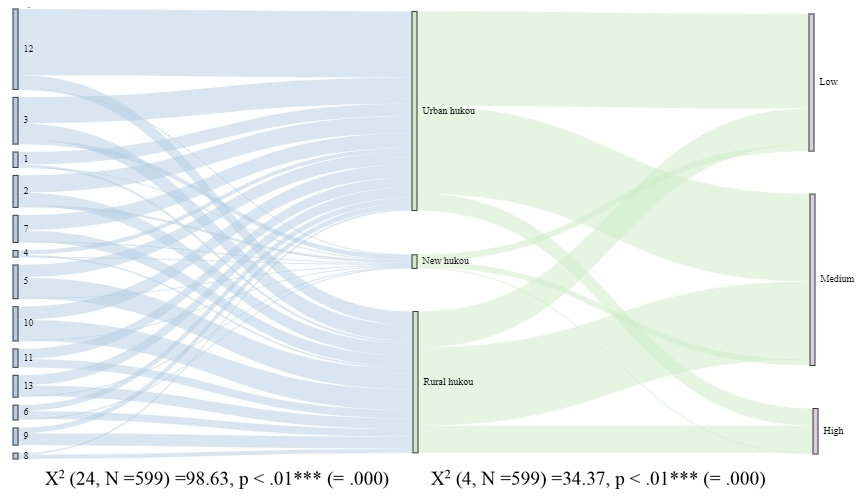
Figure 7Correspondence between occupation (on the left bar), household registration (hukou) (on the middle bar), and social vulnerability level (on the right bar). Occupation (on the left bar): 1, staff of governmental departments and institutions; 2, professional and technical personnel; 3, company employees; 4, business people; 5, service personnel in the tertiary sector; 6, industrial workers; 7, students; 8, agricultural workers; 9, homemakers; 10, private business owner; 11, unemployed; 12, retired person; and 13, other.
From Fig. 7, in terms of the type of hukou, the high vulnerability can be seen more frequently in the group of rural hukou holders than in the group of urban hukou. Among the high-vulnerability groups, approximately 60 % held rural hukou, accounting for half of the medium-vulnerability group. People primarily employed in service industries, the self-employed, and low-skilled workers make up the majority of rural-to-urban migrants seeking better employment prospects. Low-skilled workers lack adequate social security, and their income stability has always been in jeopardy. As for the self-employed and those in the service industry, such as receptionists, waiters, and call-center employees, it is likely that their livelihoods have also fallen into instability, as seen in the impacts of the recent pandemics and the following city lockdowns in Wuhan. Most have low incomes, live in densely populated poor communities or urban villages, and lack comprehensive social welfare programs. This is the main reason for their higher vulnerability.
Although there are also some low-vulnerability individuals with rural household registration, an analysis of their occupational types reveals that they are mainly engaged in state-owned enterprises, including public service units. These jobs are highly stable in terms of income and social security. Enterprises and units with better social welfare may provide opportunities for urban hukou holders (called Luohu in Chinese). Moreover, higher education, stable wealth accumulation, social status, and so on can contribute to the transformation from rural hukou to urban hukou as the origin of the urban hukou of a new citizen. Following the acquisition of a local urban hukou, they benefit in the same manner as local urban residents.
China's household registration system, hukou, an institution controlling population movement, to a certain extent represents social and economic outcomes at the individual level (Liu, 2005). Entitlements to state-supplied social benefits and opportunities, including education and medical services, and social security benefits, including unemployment, endowment, and housing security, are still rationed based on household registration. Therefore, migrants without local urban hukou usually face difficulties in accessing local public services and social security benefits in a city. Thus, megacities present a particular challenge. However, a decline in hukou's influence on career choices can also be seen in Fig. 7. Indeed, many rural-to-urban migrants with rural hukou are no longer engaged in low-end labor and temporary jobs, as they came approximately 20 years ago (see Chan and Zhang, 1999), and now they have more career choices. However, there remains a problem that they are still unable to enter high-paying and stable industries, and the impact of hukou on individual social vulnerability cannot be ignored.
The results also show that approximately 50 % of urban registration holders are at high and medium levels of social vulnerability. Many studies have argued that China has an unequal distribution of resources between urban and rural areas at the national level and that urban residents have advantages in the acquisition and utilization of various resources (Sicular et al., 2007; Liu et al., 2019). Relatively, inequality within urban populations has received little attention. In fact, for various reasons resulting in poverty and lack of opportunity, a large part of the urban population exhibits insufficient resilience and resistance to disasters when facing dangers, shocks, and pressures. Although social vulnerability cannot be read directly from poverty (Chambers and Conway, 1992), the former is often highly interrelated with the latter (Wisner et al., 2004), causing such inequality.
At present, most of the urban poor in China are relatively poor, and the gap between the rich and poor is constantly widening. China's Gini coefficient1 from 2003 to 2017 was between 0.462 and 0.491 (National Bureau of Statistics (China), 2018), indicating increasing income inequality. In addition to the income gap, the differences in assets create greater inequality. With the development of urbanization, the poor will become poorer in urban areas and the rich will become richer. There is no opportunity for upward mobility in the lower classes of the city, and mobility between various strata of Chinese society has significantly reduced, implying hierarchical social consolidation. With the widening income gap, poverty and vulnerability may spread rapidly throughout cities. Some societal systems have inherent forces that create inequalities (Mehretu et al., 2003), and macro-data may hide these inequalities, underestimating the scale and depth of urban vulnerability.
This study utilized micro-individual social vulnerability indicators and cluster analysis to evaluate the social vulnerability levels of 599 residents across 11 communities in Wuhan's Hongshan District. The findings categorize social vulnerability into three levels: high, medium, and low. Quantitative assessments enable specific comparisons between different units, highlighting significant variations in social vulnerability among various community types. Residents in affluent communities, possessing more resources and opportunities, opt to live in areas with superior conditions, resulting in lower exposure and sensitivity but higher adaptability to disaster risks. In contrast, urban village inhabitants face distinct challenges, with residential segregation emerging as a crucial factor in assessing social vulnerability. A key discovery is that higher-vulnerability groups exhibit characteristics such as low education, poor health, low annual income, unstable work, and insufficient social security. Enhancing livelihood stability, wealth accumulation, and social security positively contributes to reducing individual social vulnerability. Additionally, this study reveals two unique findings in contrast to prior research. Firstly, contrary to the prevailing notion that urban registered residents in China possess greater resources and opportunities, enhancing their resilience to risks, our findings suggest that around 50 % of urban registration holders experience high and medium levels of social vulnerability. Secondly, the assumption that elderly individuals are inherently more vulnerable finds no support in the results. Despite the physical challenges faced by the elderly, their social security, wealth accumulation, income stability, and living conditions in urban China can exceed those of many younger individuals.
The socio-spatial disparities mentioned extend beyond Wuhan and Chinese cities, manifesting globally in developed metropolises like New York and emerging urban centers such as Jakarta. When inequality reaches a critical threshold, it precipitates a social crisis. Structural inequality becomes apparent during crises, adversely affecting those already vulnerable and defenseless (Sharma, 2020), irrespective of a nation's economic strength. Although climate change and urbanization are worldwide phenomena, their impact disproportionately burdens impoverished individuals and disadvantaged groups, stemming from factors like poverty, overreliance on natural resources, and inadequate infrastructure. Addressing the underlying inequalities within Chinese cities is crucial to mitigating the social vulnerability arising from the urbanization process. Firstly, ensuring the availability of housing and social security is imperative. This can be achieved by implementing measures such as controlling housing prices and developing public housing. Rectifying the hukou issue, which creates benefit disparities between residents with and without urban hukou, can promote social security justice. Secondly, for effective hazard risk management and reduced disaster losses, inclusive consideration of various groups is necessary in the formulation of climate adaptation and urban development policies. This is particularly vital for marginalized individuals at the societal bottom, who often lack a voice in decision-making processes.
The importance of this research in terms of practical application is twofold. First, it constructs individual-scale indices and analyzes vulnerability using existing indicators for different spatial scales and groups, which contributes to the research on micro-vulnerability indicators in China's cities lacking basic micro-level statistics. The second quantitative analysis properly assessed and comprehended the most vulnerable groups, allowing for community comparisons. This will help policies support the most vulnerable communities and populations.
This study examines collective vulnerability at the community level. It compares the differences in vulnerability among different communities. However, the communities referred to were limited to administrative institutions with Chinese characteristics (Shequ). Although it also includes geographical and social meanings to some extent, it is more inclined towards administrative dominion in the Chinese context. Therefore, the discussion is mainly based on administrative jurisdiction and does not involve the discussion of social networks or social capital.
The second limitation is indicator selection and weight determination. The selection of different indicators and the adoption of different methods to calculate weights produce different vulnerability results. Because there is still a lack of unified standards in the academic community, this study, although the selection is based on previous studies, cannot avoid adding subjective judgments. Future studies should explore suitable methods for determining indicators and weights.
We must acknowledge that social vulnerability in the context of urbanization is a complex issue that results from numerous variables that interact with and impact one another. It is also a major development issue that affects economic and social progress as well as human security and well-being. More microscopic social vulnerability indicators representing reality should be explored in future studies. Therefore, it is equally important to investigate how social vulnerability is (re)produced. The most essential aspect of humanistic care is to focus on poor neighborhoods and vulnerable populations. Passive avoidance is not an option for regular people or the government. Actions must be taken to safeguard them and reduce their vulnerability.
This Appendix gives detailed calculation for the correspondence between occupation, household registration (hukou), and social vulnerability level (see Fig. 7).
Table A1Hukou and social vulnerability.
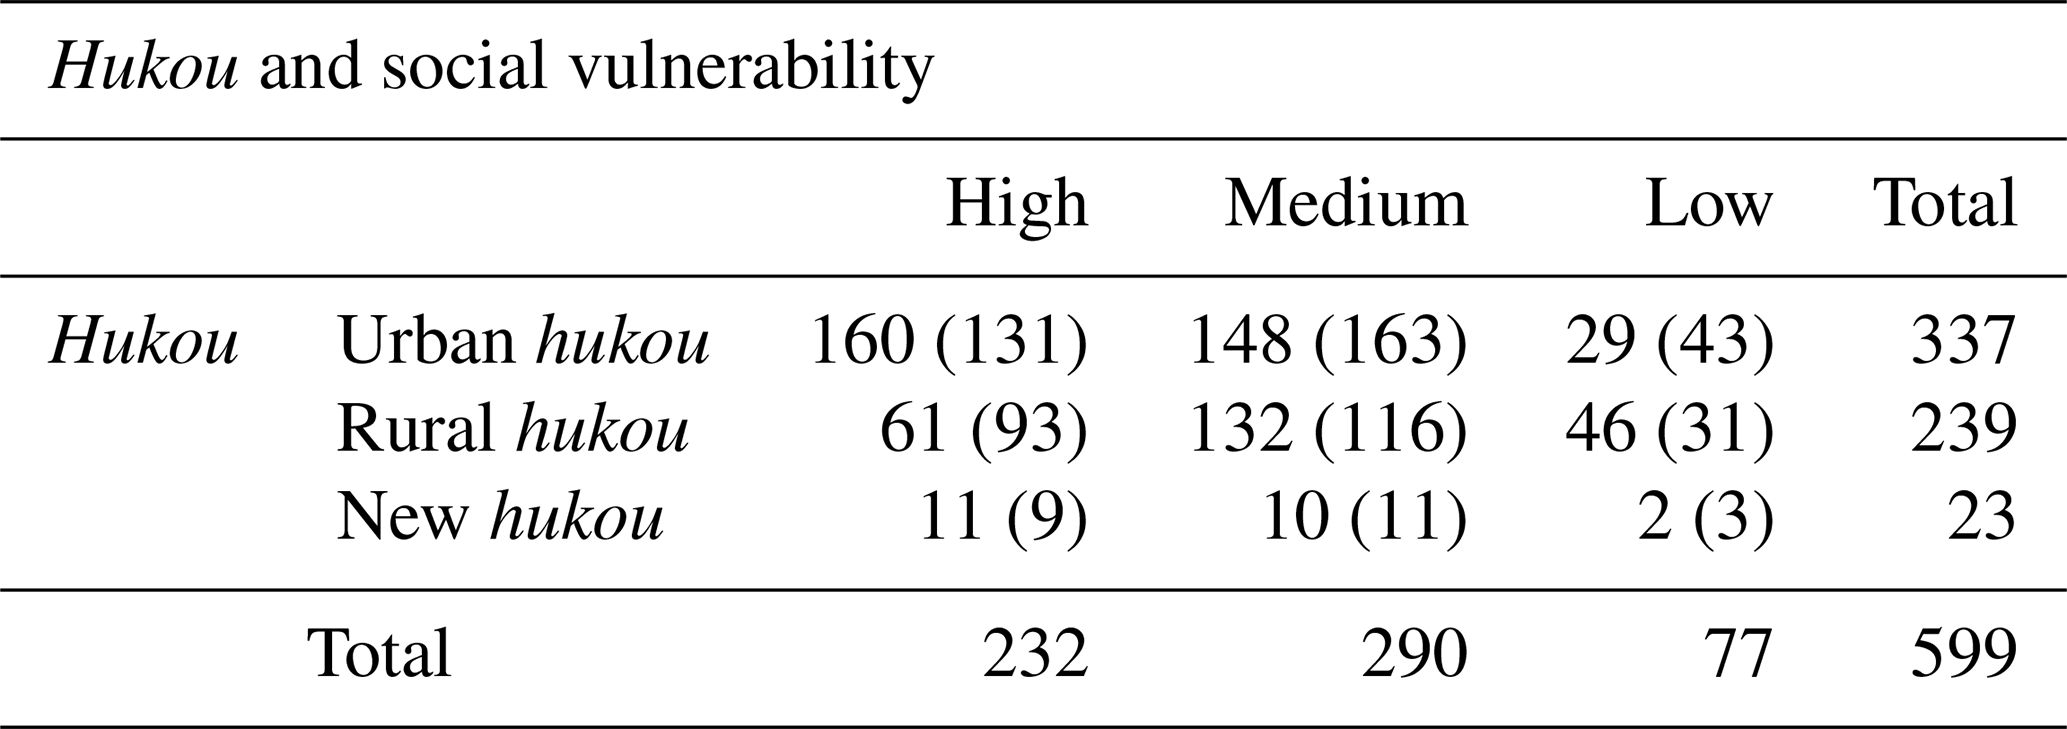
X2 (4, N= 599) = 34.37, (= 0.000).
Table A2Occupation and hukou.
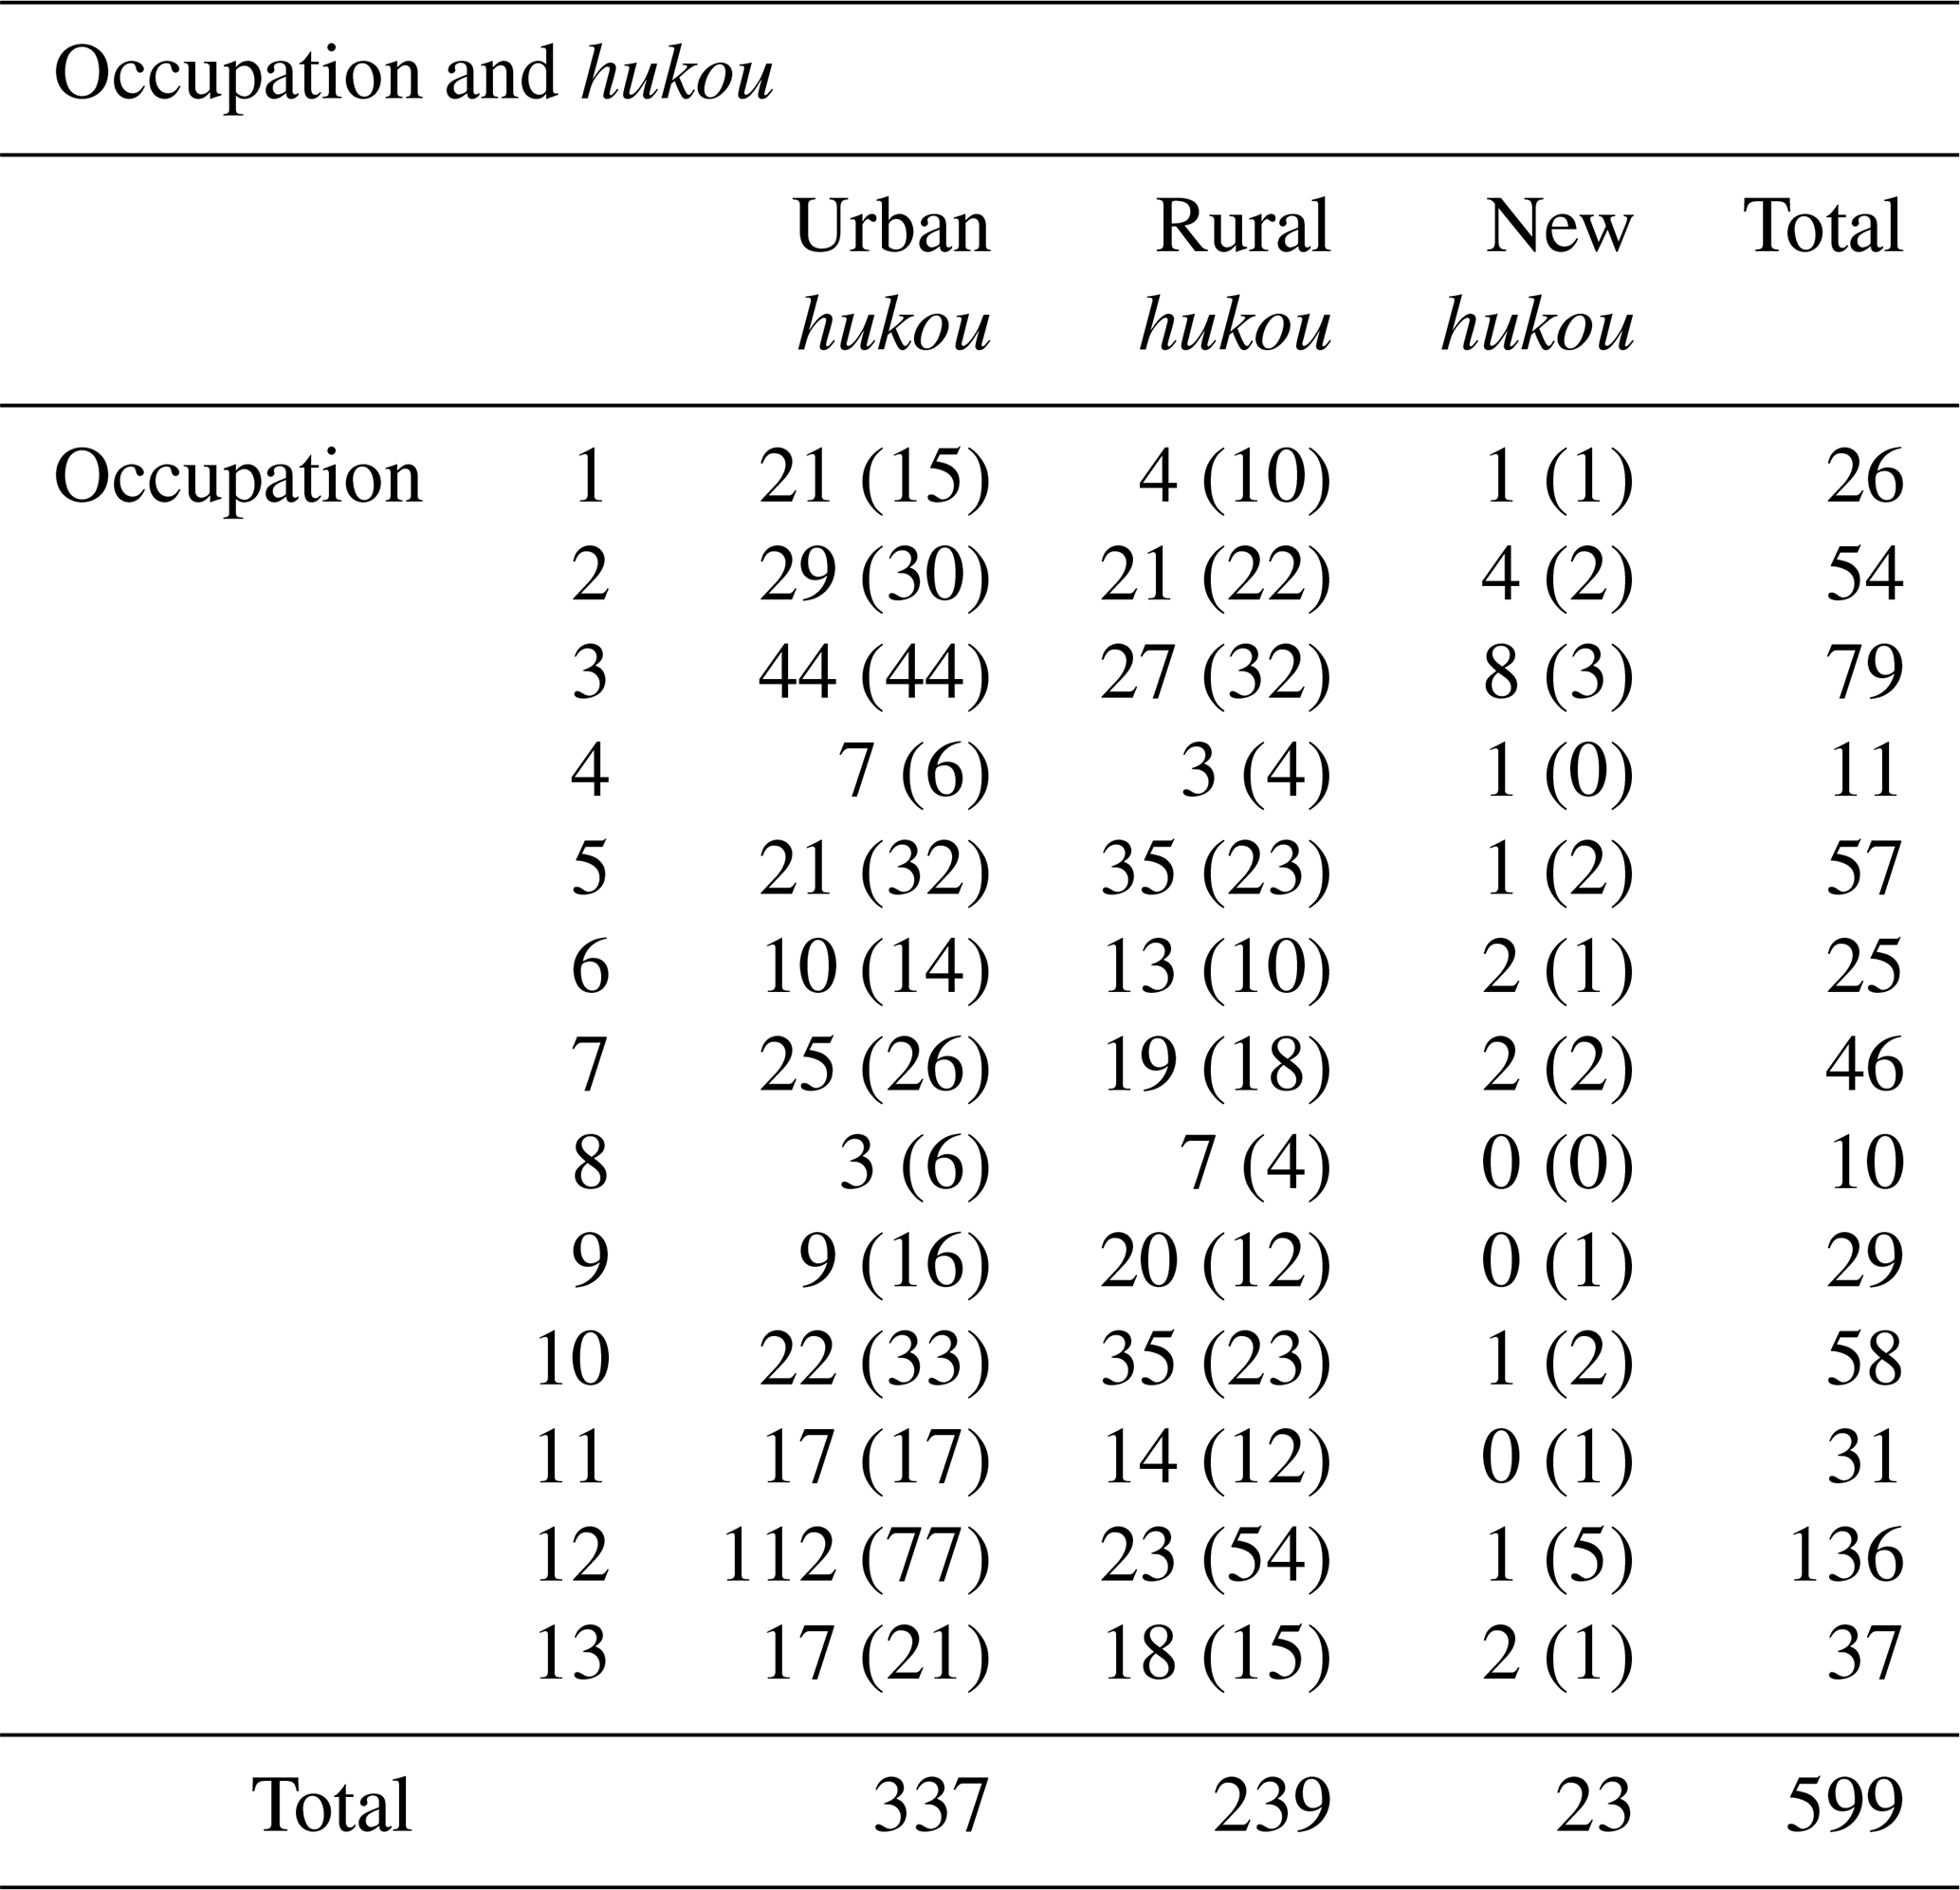
X2 (24, N= 599) = 98.63, (= 0.000). Notes: 1, staff of governmental departments and institutions; 2, professional and technical personnel; 3, company employees; 4, business people; 5, service personnel in the tertiary sector; 6, industrial workers; 7, students; 8, agricultural workers; 9, homemakers; 10, private business owner; 11, unemployed; 12, retired person; 13, other.
The data and analysis code are available by contacting the corresponding author.
JX and MT conceptualized the work. JX, MT, and WFL developed the model. WFL and JX organized the questionnaire survey and conducted the quantitative analysis. The project administration and funding acquisition were by MT. JX prepared the original draft. JX and MT reviewed and edited the paper. All authors visualized the data.
The contact author has declared that none of the authors has any competing interests.
Publisher's note: Copernicus Publications remains neutral with regard to jurisdictional claims made in the text, published maps, institutional affiliations, or any other geographical representation in this paper. While Copernicus Publications makes every effort to include appropriate place names, the final responsibility lies with the authors.
The authors would like to express their gratitude to students of Huazhong Agricultural University for their participation in the questionnaire survey. We are also thankful for the feedback from all the respondents.
The research is mainly supported by a JSPS Grant-in-Aid for Scientific Research (B), project number 19H01381, with the second author as a principle investigator. The first author was materially supported by Fundamental Research Funds for the Central Universities of China under grant DUT22RC(3)089, the Social Science Foundation of Liaoning Province (grant no. L22CGL010), the Liaoning Provincial Federation of Social Sciences (grant no. 2024lslqnkt-025), and the Major Program of Philosophy and Social Science of the Chinese Ministry of Education (grant no. 21JZD034). Technical support is partly from Fundamental Research Funds for the Central Universities of China under grant 2662020LXQD002, with the third author as a principle investigator.
This paper was edited by Daniela Molinari and reviewed by Ioana Popescu and two anonymous referees.
Adger, W. N.: Social vulnerability to climate change and extremes in coastal Vietnam, World Dev., 27, 249–269, https://doi.org/10.1016/S0305-750X(98)00136-3, 1999.
Adger, W. N.: Vulnerability, Global Environ. Chang., 16, 268–281, https://doi.org/10.1016/j.gloenvcha.2006.02.006, 2006.
Adger, W. N. and Vincent, K.: Uncertainty in Adaptive Capacity, C. R. Geosci., 337, 399–410, https://doi.org/10.1016/j.crte.2004.11.004, 2005.
Aldrich, D. P.: Black wave: How networks and governance shaped Japan's 3/11 disasters, Chicago, The University of Chicago Press, the United States, ISBN 9780226638263, 2019.
Alexander, D.: Globalization of disaster: trends, problems and dilemmas, Journal of International Affairs Editorial Board, 59, 1–22, https://api.semanticscholar.org/CorpusID:6665233 (last access: 21 June 2021), 2006.
Alzamil, S. W.: Evaluating Urban Status of Informal Settlements in Indonesia: A Comparative Analysis of Three Case Studies in North Jakarta, Journal of Sustainable Development, 11, 148–173, https://doi.org/10.5539/jsd.v11n4p148, 2018.
Awumbila, M., Owusu, G., and Teye, J. K.: Can Rural-Urban Migration into Slums Reduce Poverty? Evidence from Ghana, Migrating out of Poverty project, DFID, Working Paper 13, http://www.migratingoutofpoverty.org/files/file.php?name=wp-13—awumbila-owusu-teye-2014-can-rural-urban-migration-into-slums-reduce-poverty-final.pdf&site=354 (last access: 21 June 2021), 2014.
Balica, S. F.: Development and Application of Flood Vulnerability Indices for Various Spatial Scales, Water Science and Engineering, Delft, UNESCO-IHE MSc, http://unihefvi.free.fr/files/MSc_FVI_Stefania_Florina_BALICA.pdf (last access: 12 June 2021), 2007.
Balica, S. F., Wright, N. G., and van der Meulen, F.: A flood vulnerability index for coastal cities and its use in assessing climate change impacts, Nat. Hazards, 64, 73–105, https://doi.org/10.1007/s11069-012-0234-1, 2012.
Barnett J., Lambert S., and Fry I.: The Hazards of Indicators: Insights from the Environmental Vulnerability Index, Ann. Assoc. Am. Geogr., 98, 102–119, https://doi.org/10.1080/00045600701734315, 2008.
Bolin, B.: Race, Class, Ethnicity, and Disaster Vulnerability, in: Handbook of Disaster Research, edited by: Rodríguez, H., Quarantelli, E. L., and Dynes, R. R., 113–129, Springer, New York, ISBN 10 3319632558, 2007.
Burton, I., Kates, R. W., and White, G. F.: The Environment as Hazard, New York, Guilford Press, the United States, ISBN 10 0898621593, ISBN 13 978-0898621594, 1993.
Cannon, T.: Vulnerability, “innocent” disasters and the imperative of cultural understanding, Disast. Prev. Manag., 32, 350–357, https://doi.org/10.1108/09653560810887275, 2008.
Cassiers, T. and Kesteloot C.: Socio-Spatial Inequalities and Social Cohesion in European Cities, Urban Stud., 49, 1909–1924, https://doi.org/10.1177/0042098012444888, 2012.
Chambers, R. and Conway, G. R.: Sustainable Rural Livelihoods: Practical Concepts for the 21st Century, https://opendocs.ids.ac.uk/opendocs/bitstream/handle/20.500.12413/775/Dp296.pdf (last access: 15 May 2021), 1992.
Chan, K. W. and Zhang, L.: The Hukou System and Rural-Urban Migration in China: Processes and Changes, China Quart., 160, 818–855, https://doi.org/10.1017/S0305741000001351, 1999.
Clark, W. C., Jager, J., Corell, R., Kasperson, R., McCarthy, J. J., Cash, D., Cohen, S. J., Desanker, P., Dickson, N. M., Epstein, P., Guston, D. H., Hall, J. M., Jaeger, C., Janetos, A., Leary, N., Levy, M. A., Luers, A., MacCracken, M., Melillo, J., Moss, R., Nigg, J. M., Parry, M. L., Parson, E. A., Ribot, J. C., Schellnhuber, H. J., Schrag, D. P., Seielstad, G. A., Shea, E., Vogel, C., and Wilbanks, T. J.: Assessing Vulnerability to Global Environmental Risks, Report of the Workshop on Vulnerability to Global Environmental Change: Challenges for Research, Assessment and Decision Making, https://www.belfercenter.org/sites/default/files/files/publication/Assessing Vulnerability to Global Environmental Risks 2000.pdf (last access: 18 July 2021), 2000.
Coulibaly, J. Y., Mbow, C., Sileshi, G. W., Beedy, T., Kundhlande, G., and Musau, J.: Mapping vulnerability to climate change in Malawi: Spatial and social differentiation in the Shire River basin, American Journal of Climate Change, 4, 282–294, https://doi.org/10.4236/ajcc.2015.43023, 2015.
Cutter, S. L.: Vulnerability to environmental hazards, Prog. Human Geog., 20, 529–539, https://doi.org/10.1177/030913259602000407, 1996.
Cutter, S. L., Boruff, B. J., and Shirley, W. L.: Social vulnerability to environmental hazards, Soc. Sci. Quart., 84, 242–261, https://www.jstor.org/stable/42955868 (last access: 20 May 2021), 2003.
Donner, W. and Rodriguez, H.: Population Composition, Migration and Inequality: The Influence of Demographic Changes on Disaster Risk and Vulnerability, Soc. Forces, 87, 1089–1114, https://doi.org/10.1353/sof.0.0141, 2008.
Dvořák, M.: Measuring Yields: Arithmetic, Geometric and Horizon-Consistent Average. Prague Economic Papers, Prague University of Economics and Business, 2016, 335–353, https://doi.org/10.18267/j.pep.563, 2016.
Flanagan, B. E., Gregory, E. W., Hallisey, E. J., Heitgerd, J. L., and Lewis, B.: A Social Vulnerability Index for Disaster Management, J. Homel. Secur. Emerg., 8, 1–22, https://doi.org/10.2202/1547-7355.1792, 2011.
Fischer, A. P. and Frazier, T. G.: Social vulnerability to climate change in temperate forest areas: New measures of exposure, sensitivity, and adaptive capacity, Ann. Am. Assoc. Geogr., 108, 658–678, https://doi.org/10.1080/24694452.2017.1387046, 2018.
Fussel, H.: Vulnerability: A generally applicable conceptual framework for CC research, Global Environ. Chang., 17, 155–167, https://doi.org/10.1016/j.gloenvcha.2006.05.002, 2007.
Füssel, H. M. and Klein, R. J. T.: Climate change vulnerability assessments: An evolution of conceptual thinking, Climate Change, 75, 301–329, https://doi.org/10.1007/s10584-006-0329-3, 2006.
Gupta, E.: Oil vulnerability index of oil-importing countries, Energ. Policy, 36, 1195–1211, https://doi.org/10.1016/j.enpol.2007.11.011, 2008.
Golub, G. H. and Van der Vorst, H. A.: Eigenvalue computation in the 20th century, J. Comput. Appl. Math., 1135–1165, https://doi.org/10.1016/S0377-0427(00)00413-1, 2000.
Hahn, M. B., Riederer A. M., and Foster S. O.: The livelihood vulnerability index: A pragmatic approach to assessing risks from climate variability and change: A case study in Mozambique, Global Environ. Chang., 19, 74–88, https://doi.org/10.1016/j.gloenvcha.2008.11.002, 2009.
Hardoy, J. E. and Satterthwaite, D.: Third world cities and the environment of poverty, World Health Forum, 8, 86–93, https://apps.who.int/iris/handle/10665/47357 (last access: 25 July 2021), 1987.
Hardoy, J. E. and Satterthwaite, D.: Squatter Citizen: Life in the Urban Third World, London, Earthscan, the United Kingdom, ISBN 10 1853830208, 1989.
Hegde, V. A. and Reju, R. V.: Development of Coastal Vulnerability Index for Mangalore Coast, India, J. Coastal Res., 23, 1106–1111, https://doi.org/10.2112/04-0259.1, 2007.
Hewitt, K.: Interpretations of Calamity from the viewpoint of human ecology, London, Allen and Unwin, the United Kingdom, ISBN 0-04-301160-8, 1983.
Huang, X. J., Huang, X., and Cui, C. L.: The concept, analytical framework and assessment method of social vulnerability, Progress in Geography, 33, 1512–1525, 2014.
Huang, X. J., Wang, B., Liu, M. M., Guo, Y. H., and Li, Y. Y.: Characteristics of urban extreme heat and assessment of social vulnerability in China, Geogr. Res., 39, 1534–1547, https://doi.org/10.11821/dlyj020190608, 2020.
IPCC: Climate Change 2007, Impacts, Adaptation and Vulnerability, Contribution of Working Group II to the Fourth Assessment Report of the Intergovernmental Panel on Climate Change, edited by: Parry, M. L., Canziani, O. F., Palutikof, J. P., Van Der Linde, P. J., and Hanson, C. E., Cambridge University Press, Cambridge, UK, 7–22, ISBN 978 0521 70597-4, 2007.
IPCC: Climate Change 2014: Synthesis Report. Contribution of Working Groups I, II and III to the Fifth Assessment Report, Geneva, Switzerland: Intergovernmental Panel on Climate Change, 2014, 151, ISBN 978-92-9169-143-2, 2014.
Klein, R. J. T., Nicholls, J. R., and Thomalla, F.: Resilience to natural hazards: How useful is this concept?, Environ. Hazards, 5, 35–45, https://doi.org/10.1016/j.hazards.2004.02.001, 2003.
Lane, F. E. and Verdini, A. W.: Consistency Test for AHP Decision Makers, Decision Sci., 9, 575–590, 1989.
Lavell, A.: Local level risk management: concept and practices. CEPREDENAC-UNDP, Quito, Ecuador, https://www.desenredando.org/public/articulos/2003/llrmceca/llrmceca_abr-24-2003.pdf (last access: 25 July 2021), 2003.
Lin, C. S., Kou, G., and Ergu ,D.: Improved statistical approach for consistency testing in AHP, Ann. Oper. Res., 211, 289–299, https://doi.org/10.1007/s10479-013-1413-5, 2013.
Liu, C., Valentine, G., Vanderbeck, R. M., Diprose, K., and McQuaid, K.: Rural-urban inequality and the practice of promoting sustainability in contemporary China, Geo Journal, 84, 1187–1198, https://doi.org/10.1007/s10708-018-9915-y, 2019.
Liu, Z.: Institution and inequality: the hukou system in China, J. Comparat. Econ., 33, 133–157, https://doi.org/10.1016/j.jce.2004.11.001, 2005.
Mao, Y. H., Yu, D. L., Zheng, J. H., and Wang, H. L.: Progress and research of urban vulnerability, Environ. Sci. Technol., 40, 97–103, 2017.
Marshall, N. A., Fenton, D. M., Marshall, P. A., and Sutton, S. G.: How resource dependency can infuence social resilience within a primary resource industry, Rural Sociol., 72, 359–390, https://doi.org/10.1526/003601107781799254, 2007.
McCarthy, J. J., Canziani, O. F., Leary, N. A., Dokken, D. J., and White, K. S.: Climate Change 2001: Impacts, Adaptation, and Vulnerability, Cambridge,Cambridge University Press,the United Kingdom, ISBN 0-521-01500-6, ISBN 0-521-80768-9, 2001.
McEntire, D.: Understanding and reducing vulnerability: From the approach of liabilities and capabilities, Disast. Prev. Manag., 20, 294–313, https://doi.org/10.1108/09653561111141736, 2011.
Mehretu, A., Pigozzi, B. W., and Sommers, L. M.: Concepts in social and spatial margin, Geogr. Ann. B, 82, 89–101, https://doi.org/10.1111/j.0435-3684.2000.00076.x, 2003.
Moss, R. H., Brenkert, A. L., and Malone, E. L.: Vulnerability toclimate change, A quantitative approach, https://www.ipcc.ch/apps/njlite/ar5wg2/njlite_download2.php?id=9186 (last access: 25 July 2021), 2001.
Mpanje, D., Gibbons, P., and McDermott, R.: Social capital in vulnerable urban settings: An analytical framework, Journal of International Humanitarian Action, 3, 4, https://doi.org/10.1186/s41018-018-0032-9, 2018.
National Bureau of Statistics (China): Report for Gini Coefficient, https://www.stats.gov.cn (last access: 18 October 2021), 2018.
O'Brien, G., O'Keefe, P., Meena, H., Rose, J., and Wilson, L.: Climate adaptation from a poverty perspective, Clim. Policy, 8, 194–201, https://doi.org/10.3763/cpol.2007.0430, 2008.
Parris, T. and Kates, R.: Characterizing and measuring sustainable development, Annu. Rev. Env. Resour., 28, 559–586, https://doi.org/10.1146/annurev.energy.28.050302.105551, 2003.
Pelling, M.: The vulnerability of cities: natural disasters and social resilience, London, Earthscan Publications Ltd., the United Kingdom, ISBN 1-85383-830-6, 2003.
Perrow, C.: Disasters ever more? Reducing U.S. vulnerabilities, in: Handbook of Disaster Research, edited by: Rodríguez, H., Quarantelli, E. L., and Dynes, R. R., 113–129, Springer, New York, 2007.
Ramprasad, V.: Debt and vulnerability: indebtedness, institutions and smallholder agriculture in South India, J. Peasant Stud., 46, 1286–1307, https://doi.org/10.1080/03066150.2018.1460597, 2019.
Records of Hongshan District: Natural hazards, http://szfzg.wuhan.gov.cn/book/dfz/bookread/id/1016/category_id/375404.html (last access: 3 September 2021), 2009.
Records of Wuhan: Urban development, http://szfzg.wuhan.gov.cn/book/dfz/bookread/category_id/447308/id/1124.html (last access: 3 September 2021), 2000.
Rufat, S., Tate, E., Burton, C. G., and Maroof, A. S.: Social vulnerability to floods: Review of case studies and implications for measurement, Int. J. Disast. Risk Re., 14, 470–486, https://doi.org/10.1016/j.ijdrr.2015.09.013, 2015.
Rygel, L., Sullivan, D. O., and Yarnal, B.: A method for constructing a social vulnerability index: An application to hurricane storm surges in a developed country, Mitig. Adapt. Strat. Gl., 11, 741–764, https://doi.org/10.1007/s11027-006-0265-6, 2006.
Saaty, T. L.: Analytic Hierarchy Process, New York, McGraw-Hill, ISBN 10 0070543712, 1980.
Sagar, A. D. and Najam, A.: The human development index: A critical review, Ecol. Econ., 25, 249–264, https://doi.org/10.1016/S0921-8009(97)00168-7, 1998.
Sharma K.: The pandemic: Mirroring our fragilities, https://courier.unesco.org/en/articles/pandemic-mirroring-our-fragilities (last access: 3 May 2021), 2020.
Sicular, T., Yue, X. M., Gustafsson, B., and Li, S.: The urban-rural income gap and inequality in China, Rev. Income Wealth, 53, 93–126, https://doi.org/10.1111/j.1475-4991.2007.00219.x, 2007.
SOPAC: The Environmental Vulnerability Index, http://gsd.spc.int/sopac/evi/Files/EVI 2004 Technical Report.pdf (last access: 10 March 2021), 2004.
Teng, W. X., Xia, J. W., and Wan, B. L.: On Rainstorm Vulnerability Assessment of Urban Community: A Case Study on Yangpu District in Shanghai, Journal of Guangzhou University (Social Science Edition), 17, 20–26, 2018.
Timmerman, P.: Vulnerability, resilience and collapse of society, Toronto, Institute of Environmental Studies, Canada, https://www.ilankelman.org/miscellany/Timmerman1981.pdf (last access: 29 July 2021), 1981.
Turner, B. L., Kasperson, R. E., and Matson, P. A.: A Framework for vulnerability analysis in sustainability science, P. Natl. Acad. Sci. USA, 100, 8074–8079, https://doi.org/10.1073/pnas.1231335100, 2003.
Villa, F. and McLeod, H.: Environmental vulnerability indicators for environmental planning and decision-making: guidelines and applications, Environ. Manage., 29, 335–348, https://doi.org/10.1007/s00267-001-0030-2, 2002.
Vincent, K.: Creating an index of social vulnerability to climate change for in Africa, https://www.researchgate.net/publication/228809913_Creating_an_Index_of_Social_Vulnerability_to_Climate_Change_in_Africa (last access: 19 October 2021), 2004.
Weis, S. M., Agostini, V., Roth, L., Gilmer, B., Schill, S. R., Knowles, J., and Blyther, R.: Assessing vulnerability: An integrated approach for mapping adaptive capacity, sensitivity, and exposure, Climatic Change, 136, 615–629, https://doi.org/10.1007/s10584-016-1642-0, 2016.
Wisner, B., Blaikie, P., Cannon, T., and Davis, I.: At Risk: Natural Hazards, People's Vulnerability and Disasters, London, Routledge, the United Kingdom, ISBN 9780415084772, 2004.
Wuhan Municipal Bureau of Statistics: Bulletin of the Seventh National Population Census, https://tjj.wuhan.gov.cn/tjfw/tjgb/202105/t20210528_1707390.shtml (last access: 3 September 2021), 2021.
Xu, J. and Takahashi, M.: Progressing vulnerability of the immigrants in an urbanizing village in coastal China, Environ. Dev. Sustain., 23, 8012–8026, https://doi.org/10.1007/s10668-020-00914-8, 2021.
Xu, J., Li, S. Z., Wu, Z., and Liu, W.: The vulnerability assessment of family support for the elderly in rural China: An empirical study based on data from Anhui, Population Research, 43, 91–101, https://rkyj.ruc.edu.cn/CN/Y2019/V43/I1/91 (last access: 20 May 2021), 2019.
Yang, J. H.: Research on the social Integration of China’s floating population, http://www.bjsci.ruc.edu.cn/xsyj/a582e5c2e67d43bd9af676838ac76c35.htm (last access: 16 June 2021), 2015.
You, W. J. and Zhang, Y. L.: Research on index system of social vulnerability for flood hazard, Journal of Catastrophology, 28, 215–220, 2013.
Zhang, Y. L. and You, W. J.: Assessment of social vulnerability to natural disasters of cities based on TOPSIS: A case study of Shanghai City, Journal of Catastrophology, 29, 109–114, 2014.
Zhang Z. S., Sun W., and Zhou Y. Z.: Quantitatively assessment of eco-environmental vulnerability in tropic coastal arid area: a case study of Leizhou peninsula, Journal of Desert Research, 28, 125–130, https://www.cnki.net/KCMS/detail/detail.aspx?dbcode=CJFD&dbname=CJFD2008&filename=ZGSS200801021&uniplatform=OVERSEA&v=u5P53eeUjRDZ54jkpm0N_E7BcF3FWlMd0lCepEzRt9qqGZHQf2LSyBuY1XVcEg65 (last access: 8 September 2021), 2008.
It is commonly held that residents' income is deemed quite evenly distributed when the Gini coefficient is below 0.2, moderately evenly distributed between 0.2 and 0.3, and reasonably distributed between 0.3 and 0.4. However, the disparity becomes significant in the range of 0.4 to 0.5, and when exceeding 0.5, the income gap is considered substantial.