the Creative Commons Attribution 4.0 License.
the Creative Commons Attribution 4.0 License.
 | 21 May 2024
AutoATES v2.0: Automated Avalanche Terrain Exposure Scale mapping
John Sykes
Andrew Schauer
Jordy Hendrikx
Audun Hetland
Avalanche risk assessment is complex and challenging, with terrain assessment as one of the most fundamental factors. To aid people's terrain assessment, Parks Canada developed the Avalanche Terrain Exposure Scale (ATES), a system that classifies the severity of avalanche terrain into five classes from non-avalanche terrain to extreme terrain. Manual classification is laborious and dependent on expert's assessments. To ease the process Larsen et al. (2020) developed an automated ATES model (AutoATES v1.0). Although the model allowed large-scale mapping, it had some significant limitations. This paper presents an improved AutoATES v2.0 model improving the potential release area (PRA) model, utilizing the new Flow-Py runout simulation package. Furthermore, it incorporates forest density data in the PRA, in Flow-Py, and in a newly developed post-forest-classification step. AutoATES v2.0 has also been rewritten in open-source software, making it more widely available. The paper includes a validation of the model measured against two consensus maps made by three experts at two different locations in western Canada. For Bow Summit, the F1 score (a measure of how well the model performs) improved from 64 % to 77 %. For Connaught Creek, the F1 score improved from 40 % to 71 %. The main challenge limiting large-scale ATES classification is the determination of optimal input parameters for different regions and climates. In areas where AutoATES v2.0 is applied, it can be a valuable tool for avalanche risk assessment and decision-making. Ultimately, our goal is for AutoATES v2.0 to enable efficient, regional-scale, and potentially global ATES mapping in a standardized manner rather than based solely on expert judgment.
- Article
(5042 KB) - Full-text XML
- Companion paper
- BibTeX
- EndNote


Snow avalanches lead to a yearly average of 140 fatal accidents in Europe and North America (Techel et al., 2016, 2018; Birkeland et al., 2017). More than 90 % of fatal avalanche accidents are related to recreational activity and triggered by the victim or someone in their party (Schweizer and Lütschg, 2001; Techel and Zweifel, 2013; Engeset et al., 2018). This means that avalanche accidents are not random but rather a result of less-than-optimal decisions. Strengthening people's ability to make better decisions by raising awareness and providing information and education is important and may ultimately save lives. To do so, many countries have established avalanche forecasting services (Engeset et al., 2018). However, despite access to updated avalanche forecast, the complexity and variability of the of the snowpack still leaves avalanche risk management a complex task. The inherent lack of feedback from the environment also turns avalanche terrain into a wicked learning environment (Fisher et al., 2022). Reliable information and decision-making support are therefore crucial. The most efficient method to mitigate the avalanche hazard is to choose appropriate terrain for the given avalanche conditions (Thumlert and Haegeli, 2018).
Assessing avalanche terrain may be intuitive for avalanche professionals (Landrø et al., 2020); however, this may not be the case for recreational users of avalanche terrain. To aid non-professional terrain assessment Parks Canada developed the Avalanche Terrain Exposure Scale (ATES v1.0). This is a terrain classification system to communicate the potential exposure to avalanches and thus how difficult avalanche management would be in different types of terrain (Statham et al., 2006). The complexity of avalanche terrain is the result of interactions of multiple release areas, tracks, and deposition areas. Within these three areas, other factors like, for example, terrain traps or forest density, could make terrain management more complex due to a more severe outcome.
Originally, ATES v1.0 categorized popular backcountry routes into three levels: simple (1), challenging (2), and complex (3). With the growing adoption of ATES, its application expanded beyond individual routes to spatial zones, such as the initiative by Avalanche Canada, which mapped several thousand square kilometers of avalanche terrain (Campbell and Gould, 2013). An update to the system led to ATES v2.0, which introduced two new classes: non-avalanche terrain (0) and extreme (4). This revised version also expanded the scope of ATES to include spatial representations like zones, areas, and corridors. The updated scale is referred to as ATES v2.0, and a more thorough description can be found in Statham and Campbell (2023). ATES classification has been used to provide guidelines for terrain use linked to people's specific avalanches management skills (CAA, 2016) or for recreational purposes (Campbell and Gould, 2013; Thumlert and Haegeli, 2018; Larsen et al., 2020; Schumacher et al., 2022). ATES mapping has also been used to describe backcountry users' terrain preferences recorded by GPS (i.e., Hendrikx et al., 2022; Johnson and Hendrikx, 2021; Sykes et al., 2020).
The development of ATES maps for Avalanche Canada from 2009 through 2012 was done using a combination of manual mapping and a GIS-assisted workflow (Campbell and Gould, 2013). ATES zoning was labor intensive, relied heavily on expert judgment, and as a result ATES maps were typically only available in high-use areas. Campbell and Gould (2013) identified the limitations of this method and presented a more quantifiable zonal model that could leverage GIS tools for more systematic terrain classification. An automated model to classify avalanche terrain would need the following components: (1) a model of potential release areas (PRAs) for avalanches and (2) a runout simulation, which is an estimation of where and how far an avalanche would slide.
The first attempt at a fully automated ATES model was made by Larsen et al. (2020) using a combination of the zonal and technical model of ATES (Campbell and Gould, 2013; Statham et al., 2006). Larsen et al. (2020) developed an automated ATES (AutoATES v1.0) model that was able to make ATES zones for all of Norway, using only a digital elevation model (DEM) as input. This simple approach to terrain characteristics does not take overhead exposure into account, and the performance of the simple avalanche runout simulation is also insufficient in flatter terrain. In addition, the model did not account for forest density, which has been found to be one of the most important factors for ATES classification (Delparte, 2008; Schumacher et al., 2022). A final challenge was that the model was heavily dependent on proprietary software (Larsen et al., 2020), thereby increasing the monetary and computing costs to operate the model and limiting open-source access.
1.1 Improving potential release areas (PRA) model
The PRA establishes the baseline for where avalanches may release and is used as an input for the avalanche runout simulations. In AutoATES v1.0, Larsen et al. (2020) utilized the PRA model by Veitinger et al. (2016), which outputs a continuous range of values between 0 and 1. This model considers factors such as wind shelter, terrain roughness, slope angle, and forest density. Originally, forest density was only a binary input, effectively categorizing areas as either “forested” or “non-forested”. In the binary approach, any “forested” area was not further processed by the PRA model and was simply labeled as non-PRA. Sharp (2018) improved the PRA model by including the forest density parameter in what is known as a fuzzy logic operator. Fuzzy logic, unlike binary, does not restrict inputs to yes-or-no values; instead, it allows for degrees of truth (continuous). This method recognizes the differences in forest density and treats it with equal importance to other factors like roughness, slope angle, and wind shelter.
1.2 Improvements for runout simulations
There are several avalanche runout simulation models available to estimate the potential track and deposition area, given specific start zone inputs from the PRA model (Christen et al., 2010; Sampl and Zwinger, 2004; Tarboton, 1997; D'Amboise et al., 2022). In principle, these runout models can be divided into two categories: (1) process-based, which attempt to calculate all the physical properties involved, or (2) empirical models, which are driven by data-based observations. Selecting an appropriate modeling approach depends on the problem to be solved, data availability, the required accuracy, and the spatial scale (D'Amboise et al., 2022). Given access to highly detailed data and unlimited computational power, the process-based models outperform the data-based empirical models. However, given the limitations in computational power when processing large areas and the need for more accurate digital elevation models (DEMs) in many countries, the data-based model is more suitable for large-scale mapping applications.
Two of the most common process-based simulation tools for avalanche hazard assessment are the RAMMS (Christen et al., 2010) and Samos-AT (Sampl and Zwinger, 2004) models. Both models are made to simulate an accurate prediction of avalanche runout distances, flow velocities, and impact pressures in a 3-dimensional space. These models are typically calibrated towards known avalanches with long return periods and define potential avalanche terrain. These models are suitable for avalanche terrain zoning, where the aim is to divide the potential avalanche terrain into different zones. Across large spatial areas such as regional forecast areas or entire countries, these models are less suitable. Even though the computational power required to apply the process-based models over large areas is a factor, it could be done at regional scales (e.g., Bühler et al., 2022).
In contrast to the process-based models, data-based models are computationally inexpensive and can more easily be applied to large geographic areas. A common data-based method to delineate avalanche runout is applying the classical runout angle concepts and path routing in 3-dimensional terrain (D'Amboise et al., 2022). Comparison of the model results to more computationally expensive simulation type models shows that they respond adequately for the delineation of broad-scale terrain classification.
In prior automated ATES mapping work, Larsen et al. (2020) used the multiple flow direction model D-infinity (Tarboton, 1997). This model is coupled with the alpha angle (also known as travel angle). The D-infinity model identifies the cells downslope of the starting cell for each PRA cell. The model spreads downslope until a defined alpha angle is reached from the starting cell (as per Heim, 1932; Lied and Bakkehøi, 1980; Toft et al., 2023). While used in hydrology applications, a substantial weakness of the D-infinity model is that it cannot appropriately model avalanche movement, which may occasionally flow in flat and uphill terrain.
Recently, D'Amboise et al. (2022) presented a new customizable simulation package (Flow-Py) to estimate the runout distance and intensity of dense core avalanches (not considering powder clouds). The model utilizes persistence-based routing instead of terrain-based routing, enabling the simulation to respond appropriately to flat or uphill terrain. Where the D-infinity model only considers flow direction, the Flow-Py model also considers flow process intensity. Both models use the same stopping criteria to estimate the runout distance by defining the alpha angle from the initial starting cell.
The main objective of the AutoATES v2.0 model is to improve large-scale spatial ATES mapping, update the mapping to reflect recent changes in ATES v2.0, and improve the model workflow. For AutoATES v2.0 to be a viable option for large-scale ATES classification, the model performance should be at least as accurate as manual mapping.
2.1 Implementation
To secure a broad adaptation of the new AutoATES model, it is important that the model is open-source and easy to use. The v1.0 model was written using proprietary software. We have resolved this by rewriting the entire v2.0 model into the programming language Python using widely available and open-source modules. The AutoATES v2.0 model is available on GitHub (Toft et al., 2024).
2.2 Input data
The minimum input data required to run the full AutoATES v2.0 are a DEM and forest density raster (a digital representation of the terrain/elevation and forest density) using the GeoTIFF format. It is also possible to run the model with only a DEM as input, but the output would then only be valid for open, non-forested terrain. Both rasters must have a matching spatial resolution and extent and be defined using a projected coordinate system. The model has been tested with spatial resolutions ranging from 5 to 30 m (cell sizes), but it should be possible to run other spatial resolutions.
Our parameterization for forest density allows for various metrics of forest density inputs. The model is designed to work with stem density, percent canopy cover, basal area, or no forest (only for mapping of open terrain). The forest type must be defined in the beginning of the Python script. Forest density influences snow accumulation and snowpack stability, with denser forests generally reducing the risk of avalanches (Bebi et al., 2009).
2.2.1 Percent canopy cover
Canopy cover has a direct relationship with radiation balance and can impact formation of persistent weak layers as well as give an estimate of the degree of snowfall intercepted by trees prior to falling onto the snowpack (Bebi et al., 2009). Forest canopy also impedes wind transport of snow reducing the formation of wind slabs. Percent canopy cover is a widely used metric that quantifies the extent of forest density by measuring the proportion of the ground area obscured by tree canopies when viewed from above. Percent canopy cover can be estimated using various methods including aerial photography, satellite imagery, remote sensing techniques, and ground-based measurements. The resultant parameter used in our model has a value ranging from 0 to 100.
2.2.2 Stem density
Stem density is a metric used to quantify the number of tree stems (trunks) per unit area, typically expressed as stems per hectare or stems per square meter, which provides insight into forest structure and composition. Stem density can influence the snowpack stability and avalanche initiation, as a higher stem density generally results in more trees obstructing and anchoring the snow, thereby reducing the likelihood of avalanche occurrence (Bebi et al., 2009). Stem density can be measured through various techniques, including field surveys, aerial imagery analysis, or remote sensing data. The resultant parameter used in our model can have a value ranging from zero to a couple of thousands (depending on minimum stem diameter) and is stated in number of stems per hectare.
2.2.3 Basal area
The basal area is a unit used to describe the sum of the cross-sectional areas of all trees within a given space, specifically those in the dominant, co-dominant, and high intermediate positions within the forest canopy. It is a measure of the density of trees and is quantified in square meters per hectare (Sandvoss et al., 2005). The advantage with basal area over canopy cover and stem density is that it incorporates the size of trees in addition to the number of trees and is a more direct measurement of the density of the forest vegetation.
The basal area value can have any value starting from zero upwards. While theoretically, there is no upper limit to this value, practically it is generally capped at around 60 m2 ha−1 to reflect realistic forest conditions.
2.3 Model components
The AutoATES v2.0 model is split into two main components: (1) pre-processing and (2) the AutoATES classifier. In the pre-processing step, the DEM and forest density rasters are used as input for the start zone PRA model. When the PRA calculations are complete, the PRA and DEM are used to calculate the avalanche runout using the Flow-Py component. When all the key components are calculated, they are used as input for the AutoATES classifier, which assigns the final ATES classes for each raster cell (Fig. 1).
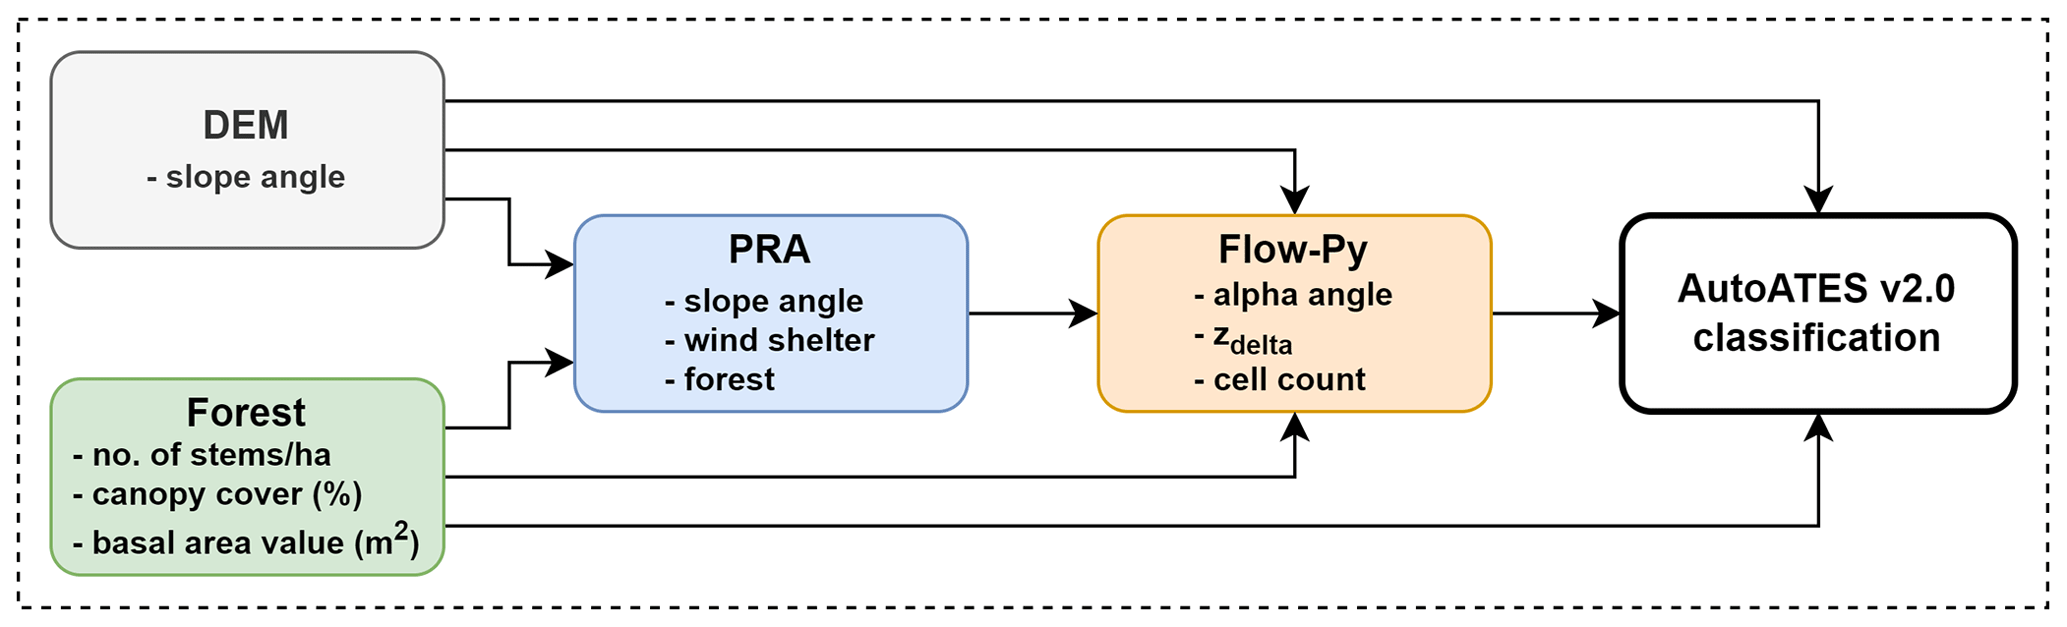
Figure 1The main components of the AutoATES v2.0 model. First, a pre-processing step is completed to calculate all the necessary raster layers using PRA and Flow-Py. Finally, the AutoATES classifier is used to assign the final ATES classifications.
2.3.1 PRA
The PRA model uses a Cauchy membership function to determine the importance of each parameter. A Cauchy membership value reflects how strongly an input variable belongs within a certain set (Jang and Sun, 1997). A Cauchy membership value must be defined for each input variable (Eq. 1).
where μ(x) is the Cauchy membership value; x is an input variable (e.g., slope angle, wind shelter, or forest); and a, b, and c are parameters which control the weight of each input variable. We use the membership values suggested by Veitinger et al. (2016) for slope angle and wind shelter while using the value suggested by Sharp (2018) for stem density (Fig. 2). In our modified version of the PRA model (v2.0), we have chosen to remove the roughness parameter due to the scale issues with 5–30 m cell sizes (the original PRA model was made to work with a 2 m cell size). The removal of roughness makes it less ideal for higher-resolution DEMs (<5 m cell sizes); see Sect. 4.1.4 for a discussion around this. We have also defined new membership functions for canopy cover and basal area based on input from Parks Canada avalanche experts and through testing of the AutoATES model on our two study areas. These values could be fine-tuned for specific datasets and applications to improve the performance of the PRA model.
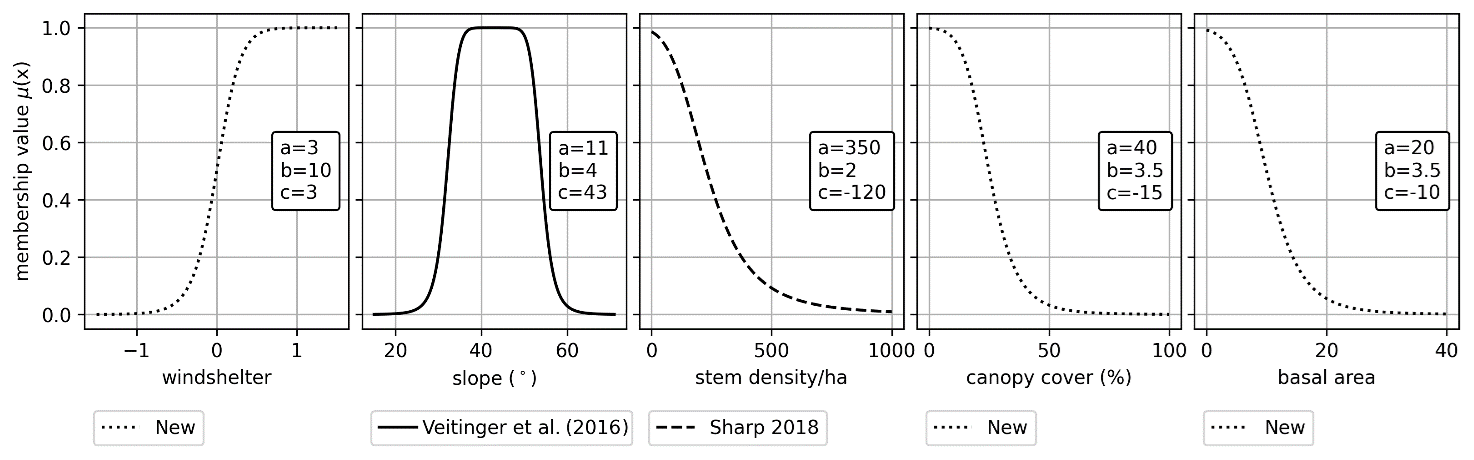
Figure 2The different Cauchy functions used by Veitinger et al. (2016) and Sharp (2018) for slope angle and stem density. The values a, b, and c are inputs for the Cauchy membership value (Eq. 1). We have suggested new membership values for wind shelter, canopy cover (%), and basal area. We recommend that these values are fine-tuned for specific datasets and applications. Read a more in-depth discussion of this in Sect. 4.3.
The Cauchy membership values from slope angle, wind shelter, and forest density are used as inputs for the fuzzy operator. We use the same “fuzzy AND” operator used by both Veitinger et al. (2016) and Sharp (2018), originally defined by Werners (1988). The PRA value is therefore defined as follows in Eq. (2):
with three fuzzy sets slope angle μst(x), wind shelter μw(x), forest density μf(xt), and with γ defined in Eq. (3) as
The PRA output is a continuous layer ranging between 0 (not likely) to 1 (very likely). Most data-based runout models need release areas in a binary format where 0 is no potential release areas, while the potential release areas are encoded as 1. To convert the PRA layer to a binary format, we select a cutoff threshold (PRAthreshold) where all pixels above this value are included in the potential release area for the runout modeling. We found the PRAthreshold from Larsen et al. (2020) to be too conservative for our study areas and have therefore increased the value to 0.15. The PRAthreshold could be adjusted depending on whether frequent or more extreme avalanche scenarios are of interest.
We have also adjusted how the wind shelter index is calculated. Using a 2 m DEM, Veitinger et al. (2016) resampled the DEM by a factor of 5 (from 2 to 10 m) and applied a 11×11 sliding window (a technique where a fixed-size segment of data moves over the entire dataset one step at a time). This is according to the recommendations of Plattner et al. (2006), who found the optimal radius to be 60 m, followed by a secondary optimal radius of 250 m. To achieve the same results, we removed the down sampling factor of 5 and used the 10 m DEM directly to calculate the wind shelter index. If other DEM resolutions are to be used, the wind shelter index should be adjusted accordingly to use either 60 m (recommended) or 250 m as the radius around each cell. This could be done by either resampling the spatial resolution or changing the size of the sliding window.
2.3.2 Avalanche simulation
The Flow-Py model developed by D'Amboise et al. (2022) is used for the avalanche simulation of the potential track and deposition area. Flow-Py is a dense core model; thus AutoATES v2.0 is based on dense core runout extents and does not consider powder clouds. It is similar to the TauDEM model utilized in AutoATES v1.0, which uses the alpha angle to limit the flow (Larsen et al., 2020; Tarboton, 1997). Flow-Py also includes a flow process intensity parameter, which makes it able to handle mass movement in flat and uphill terrain, significantly improving the output compared to AutoATES v1.0. Another advantage of the Flow-Py model is the additional output layers, which represent the overhead exposure. We utilize the cell count and zdelta layer by scaling the two layers from 0–100 and taking their average value, which represents the overhead exposure layer. In the AutoATES v2.0 model it is possible to select cell count, zdelta, or both to represent the overhead exposure. The layer enables us to quantify the exposure from different release areas at every raster cell. We use the forest detrainment module of Flow-Py, which makes it possible to use forest density as an input layer to limit spreading and runout distance. An in-depth description of the Flow-Py simulation package can be found in D'Amboise et al. (2022).
2.3.3 AutoATES classifier
When the pre-processing of PRA and Flow-Py is completed, the AutoATES classifier uses a set of map algebra equations to define each ATES class. The following raster layers from the pre-processing step are used as input in the AutoATES classifier:
Table 1The recommended input parameters for AutoATES according to Sykes et al. (2023). The encoding describes the name of each parameter in the AutoATES model.
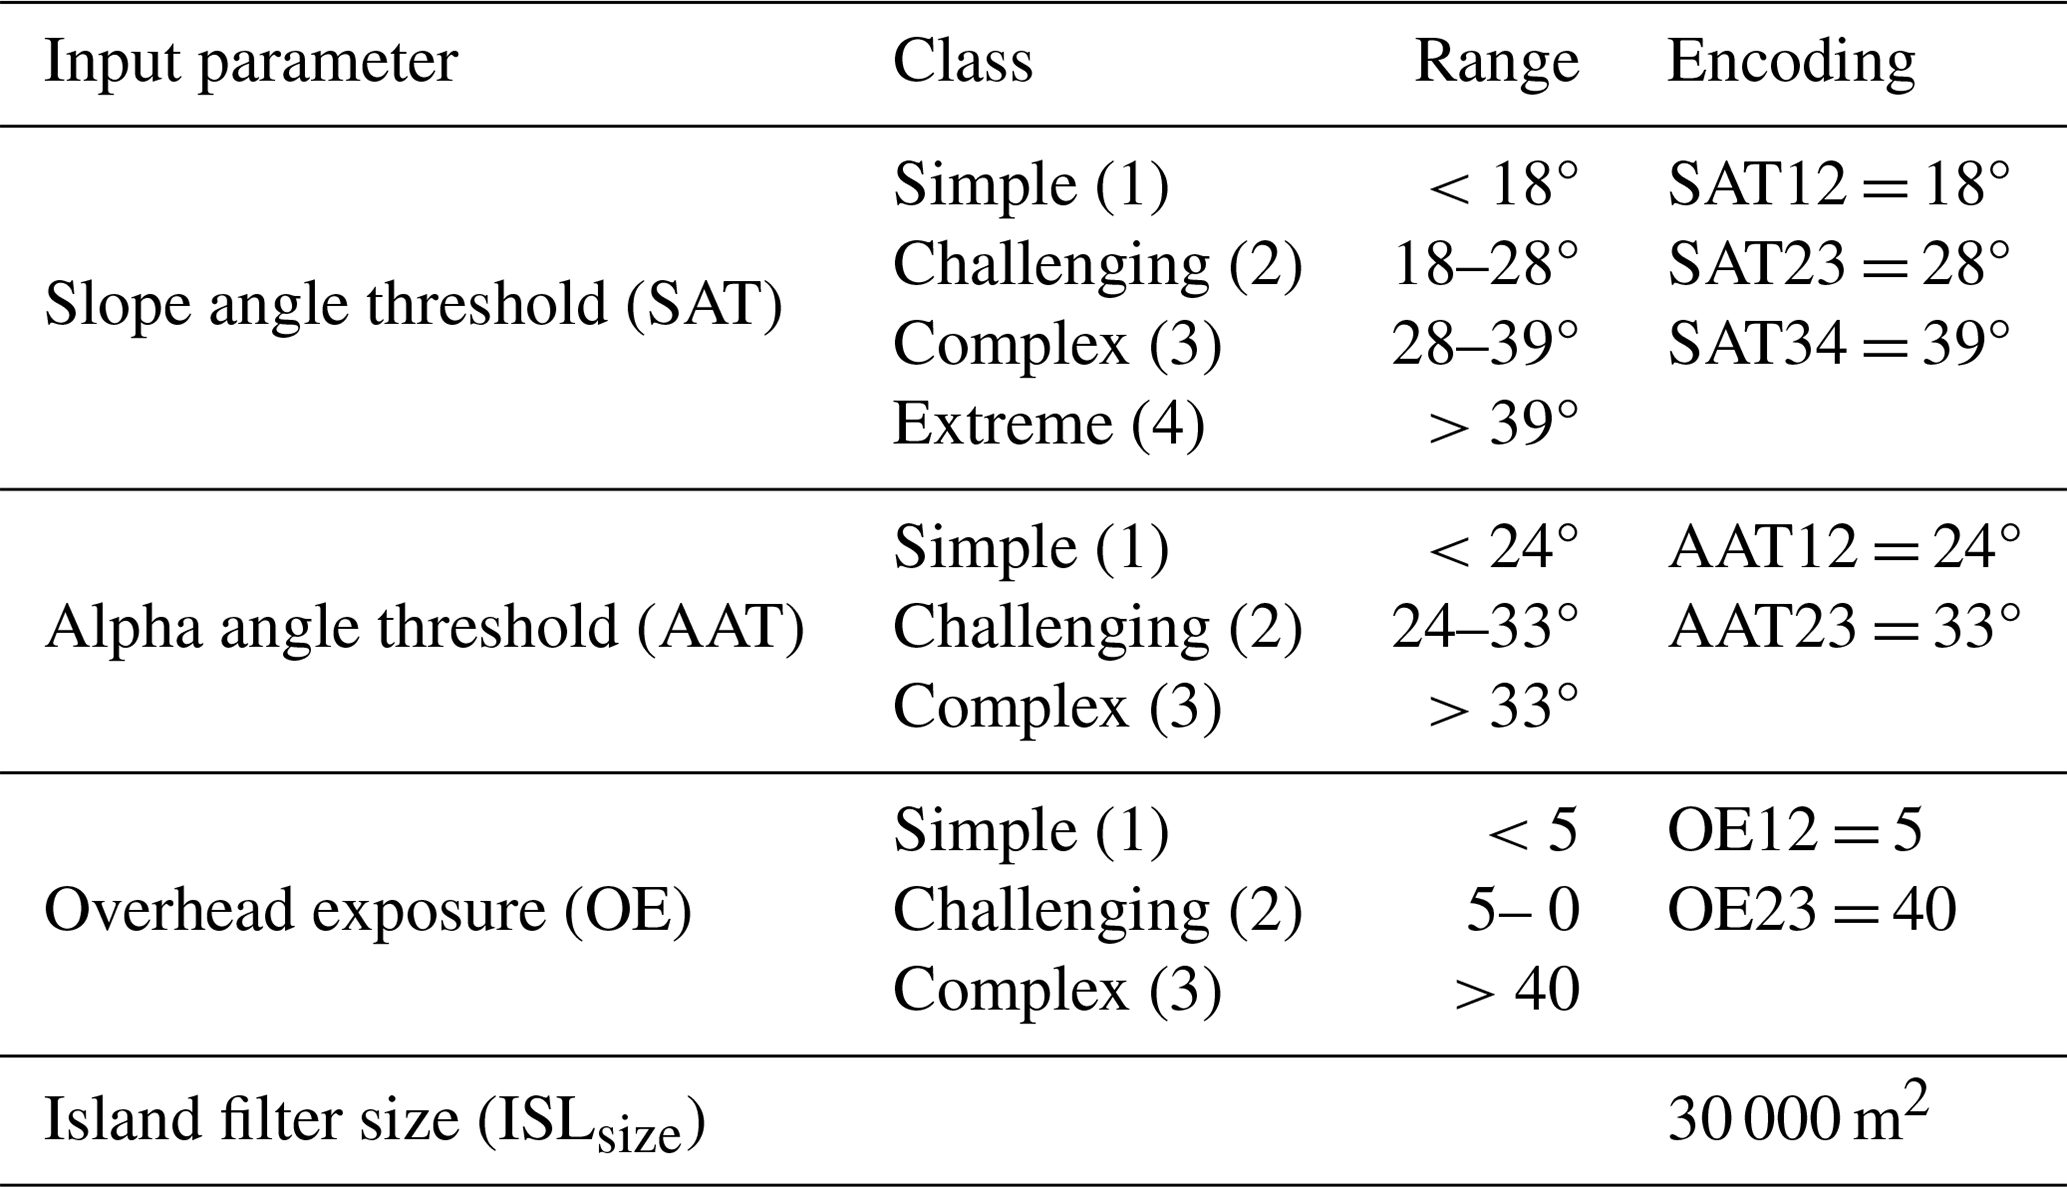
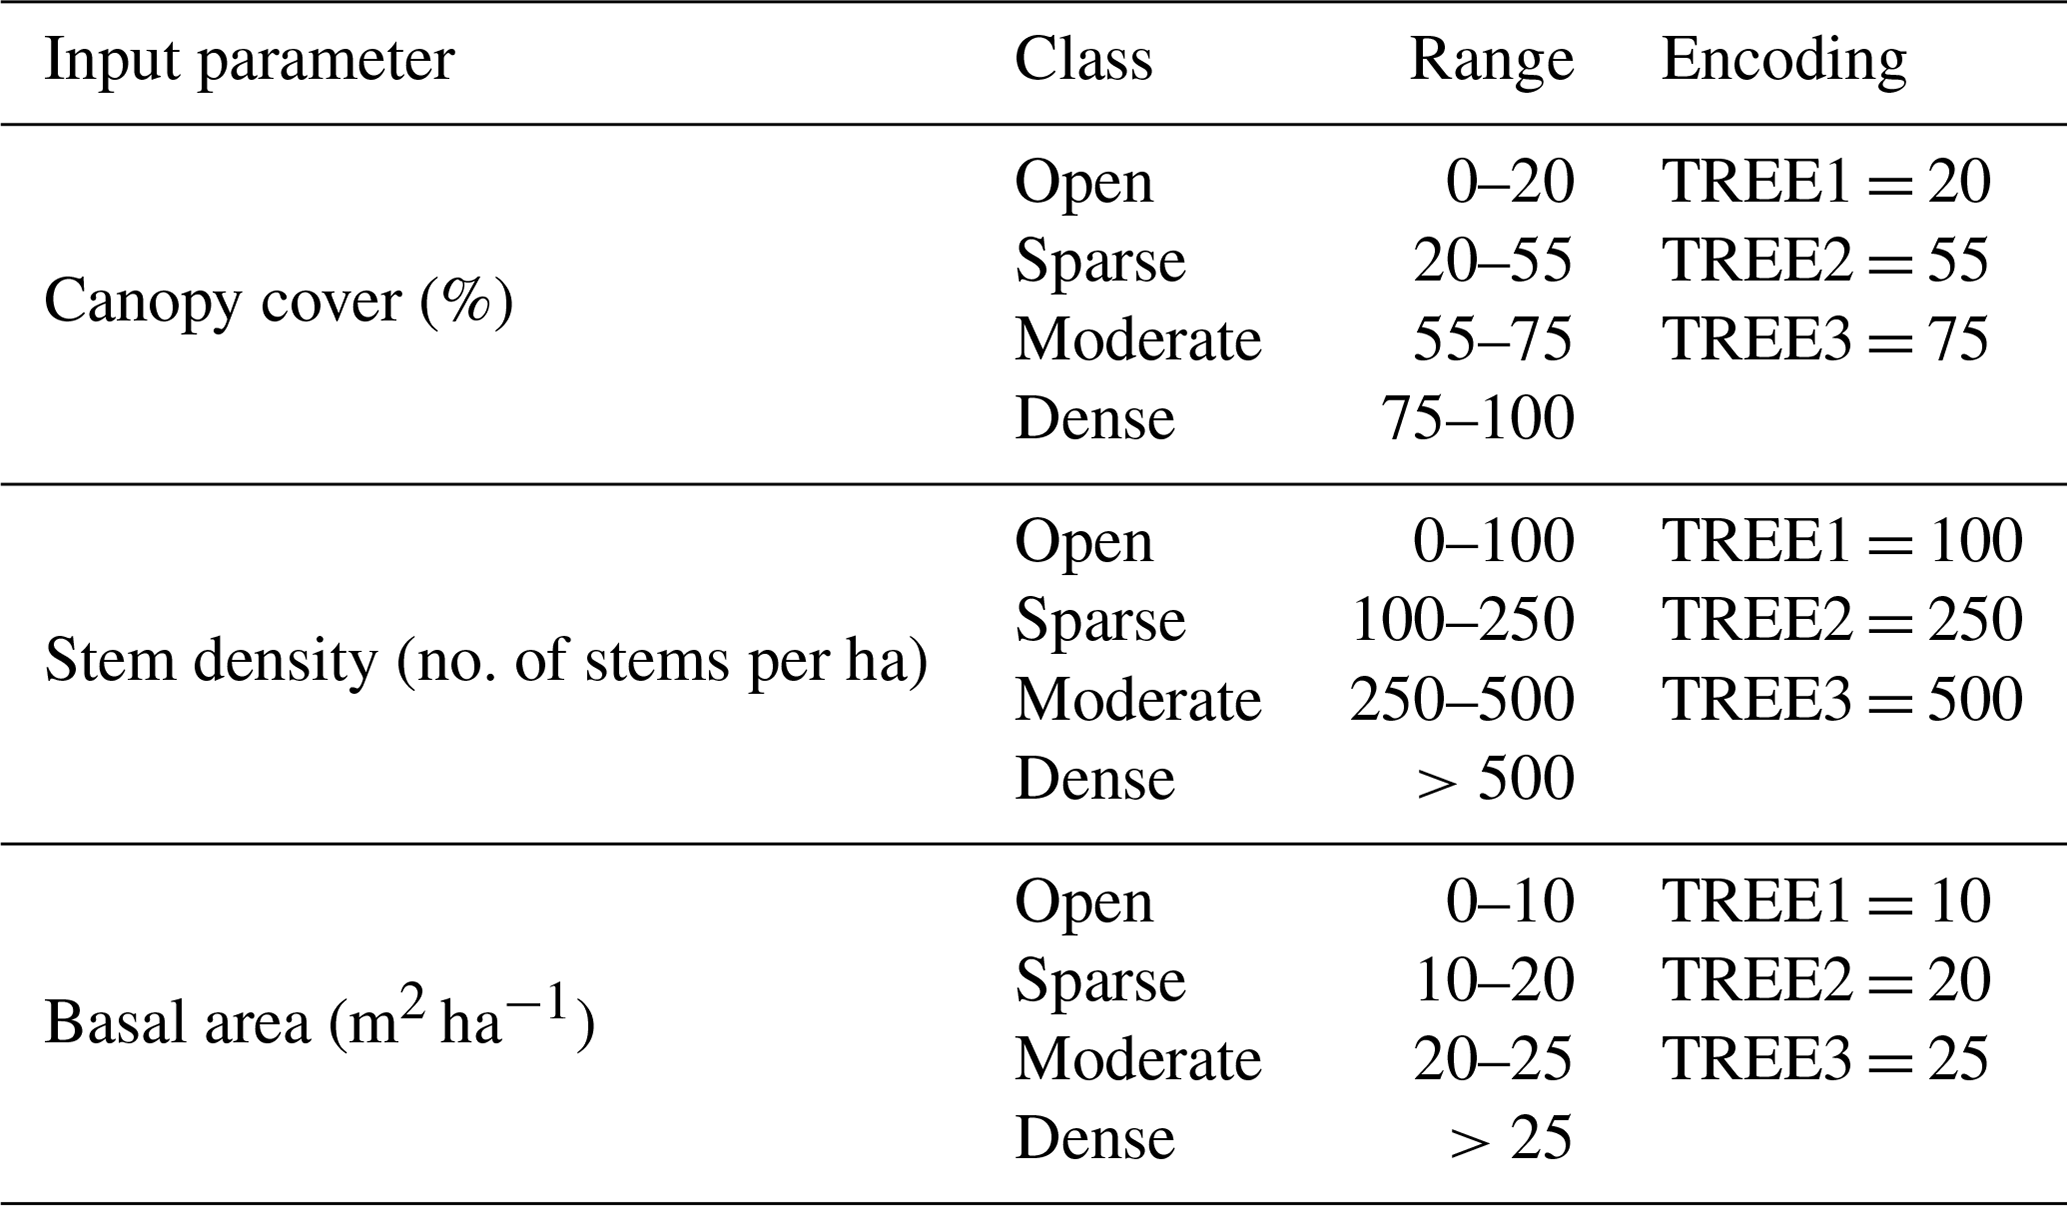
Table 2The recommended input parameters for AutoATES according to Sykes et al. (2023). The encoding is the same for all three forest types, but the forest input type can be defined by a string in the AutoATES script.
-
slope angle (calculated from the DEM)
-
forest density (provided by the user, as per Sect. 2.3.1–2.3.3)
-
PRA (calculated from the DEM and forest data)
-
runout distance as a function of alpha angle (calculated from PRA and Flow-Py)
-
overhead exposure (cell count, zdelta or both) (calculated from PRA and Flow-Py).
The first step of the AutoATES classifier is controlled by adjustable thresholds for slope angle, runout distance, overhead exposure, and island filter size (Table 1). Using these parameters, the AutoATES model outputs a preliminary, and conservative, layer with the categorical classes (1) simple, (2) challenging, (3) complex, and (4) extreme terrain by keeping the maximum value of the three input rasters.
The second step of the AutoATES classifier is to reduce the exposure in certain ATES classes depending on forest density. The forest density is applied in a secondary step to increase the importance of the forest density criteria. The forest density layers are divided into four different categories with different thresholds for each forest density input (Table 2).
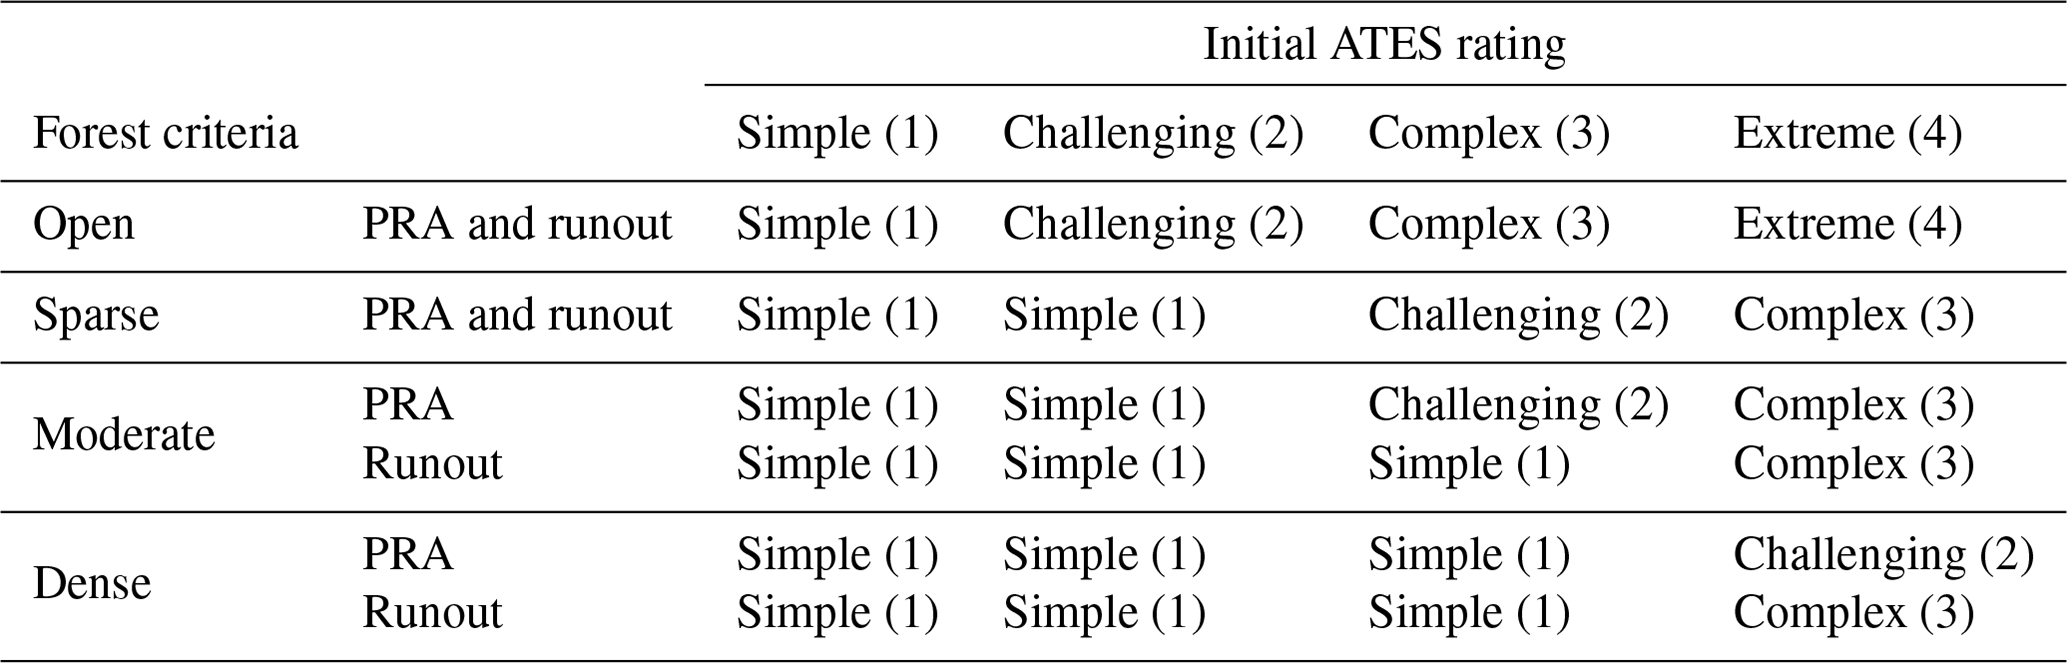
Once the forest density parameter has been coded into the four classes of forest density (i.e., open, sparse, moderate, and dense), as a function of the forest density input parameter used, we mapped these categorical descriptors on to ATES classes (Table 3).
Table 3Forest criteria applied to the second step of the AutoATES.
Finally, the island filter size is applied removing clusters smaller than a specified area and incorporating it to the surrounding class. The filter size is not a new addition to the model as it is a part of the v1.0 model, but Sykes et al. (2023) found that a filter size of 30 000 m2 (Table 1) was the optimal filter size for all the spatial resolutions tested.
2.4 AutoATES outputs
The outputs from AutoATES v2.0 have the same spatial resolution as the input. The following outputs are available:
-
continuous PRA
-
Flow-Py raw outputs (D'Amboise et al., 2022)
-
preliminary ATES classification of slope angle
-
preliminary ATES classification of runout distance
-
preliminary ATES classification of overhead exposure
-
forest density criteria
-
AutoATES v2.0
-
AutoATES v2.0 with island size filter.
2.5 Model validation
To evaluate the performance of AutoATES v2.0, we use two Canadian benchmark maps made explicitly for Connaught Creek (British Colombia) and Bow Summit (Alberta), Canada (Fig. 3). These are the only locations that have manually mapped maps using the ATES v2.0 model (Sykes et al., 2023). The benchmark maps were made by combining individual maps from a panel of three experts, utilizing methodologies such as a geographic information system (GIS), remote sensing imagery, local knowledge, and field-based investigations. Sykes et al. (2023) provide an in-depth description of how the benchmark maps were developed.
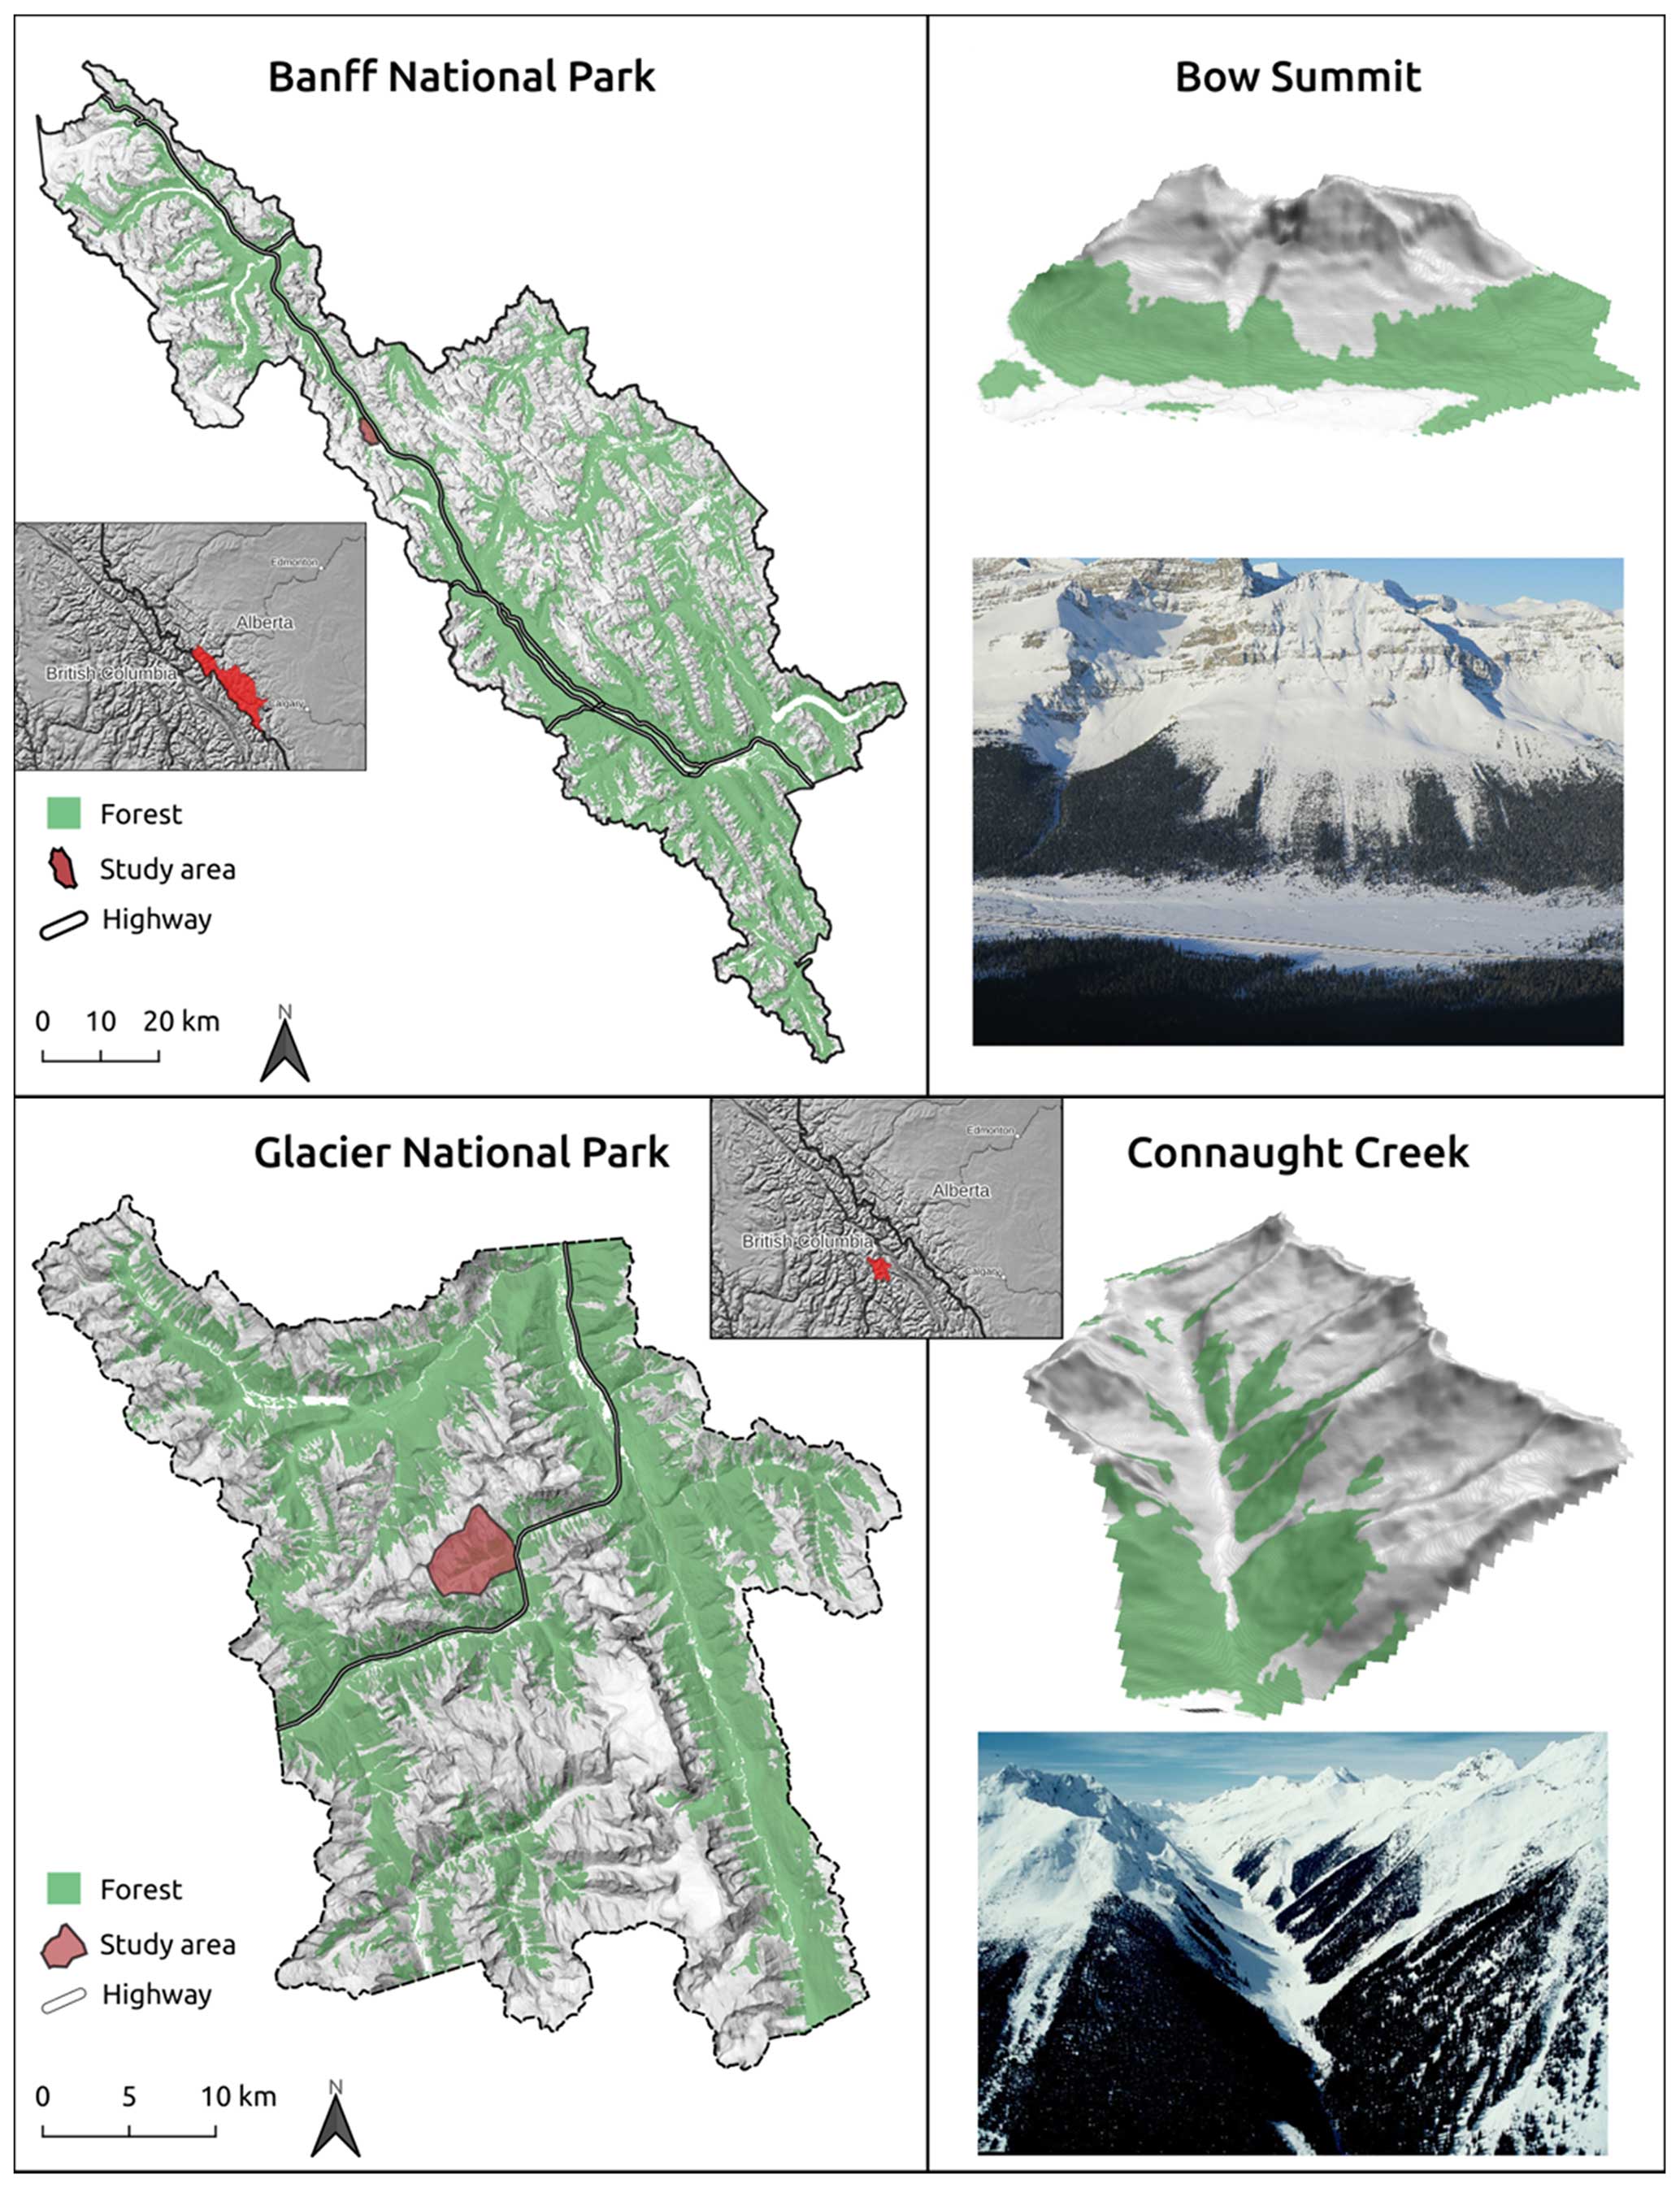
Figure 3Two areas where benchmark maps for the updated ATES are available in Glacier National Park and Banff National Park. An overview of the greater area with the study areas in 3D view and overview photo (adapted from Sykes et al., 2023).
For the model validation, the benchmark maps are compared against the AutoATES v2.0 model described above using the optimized parameters from Sykes et al. (2023). Input data for the validation model are a 26 m ALOS DEM combined with forest density data (basal area) from the British Columbia Vegetation Resource Inventory (BC VRI). For more information about the input data, see Sykes et al. (2023).
We use the metrics accuracy, precision, recall, and F1 score to evaluate the performance of the model. These metrics provide a more detailed assessment, accounting for class imbalance and varying prediction results. They have been widely used in various fields, including avalanche literature (e.g., Keskinen et al., 2022). For a more in-depth understanding of these metrics and their sources, see Liu et al. (2012), who provides a comprehensive review of evaluation metrics for classifiers.
3.1 Model accuracy
There is no true validation dataset for AutoATES due to differences in scale between automated and manual methods, but we believe the new benchmark maps made by Sykes et al. (2023) provide the best spatial validation maps to date. In Fig. 4, we visualize the differences between AutoATES v1.0, v2.0, and the ATES benchmark maps for Connaught Creek and Bow Summit.
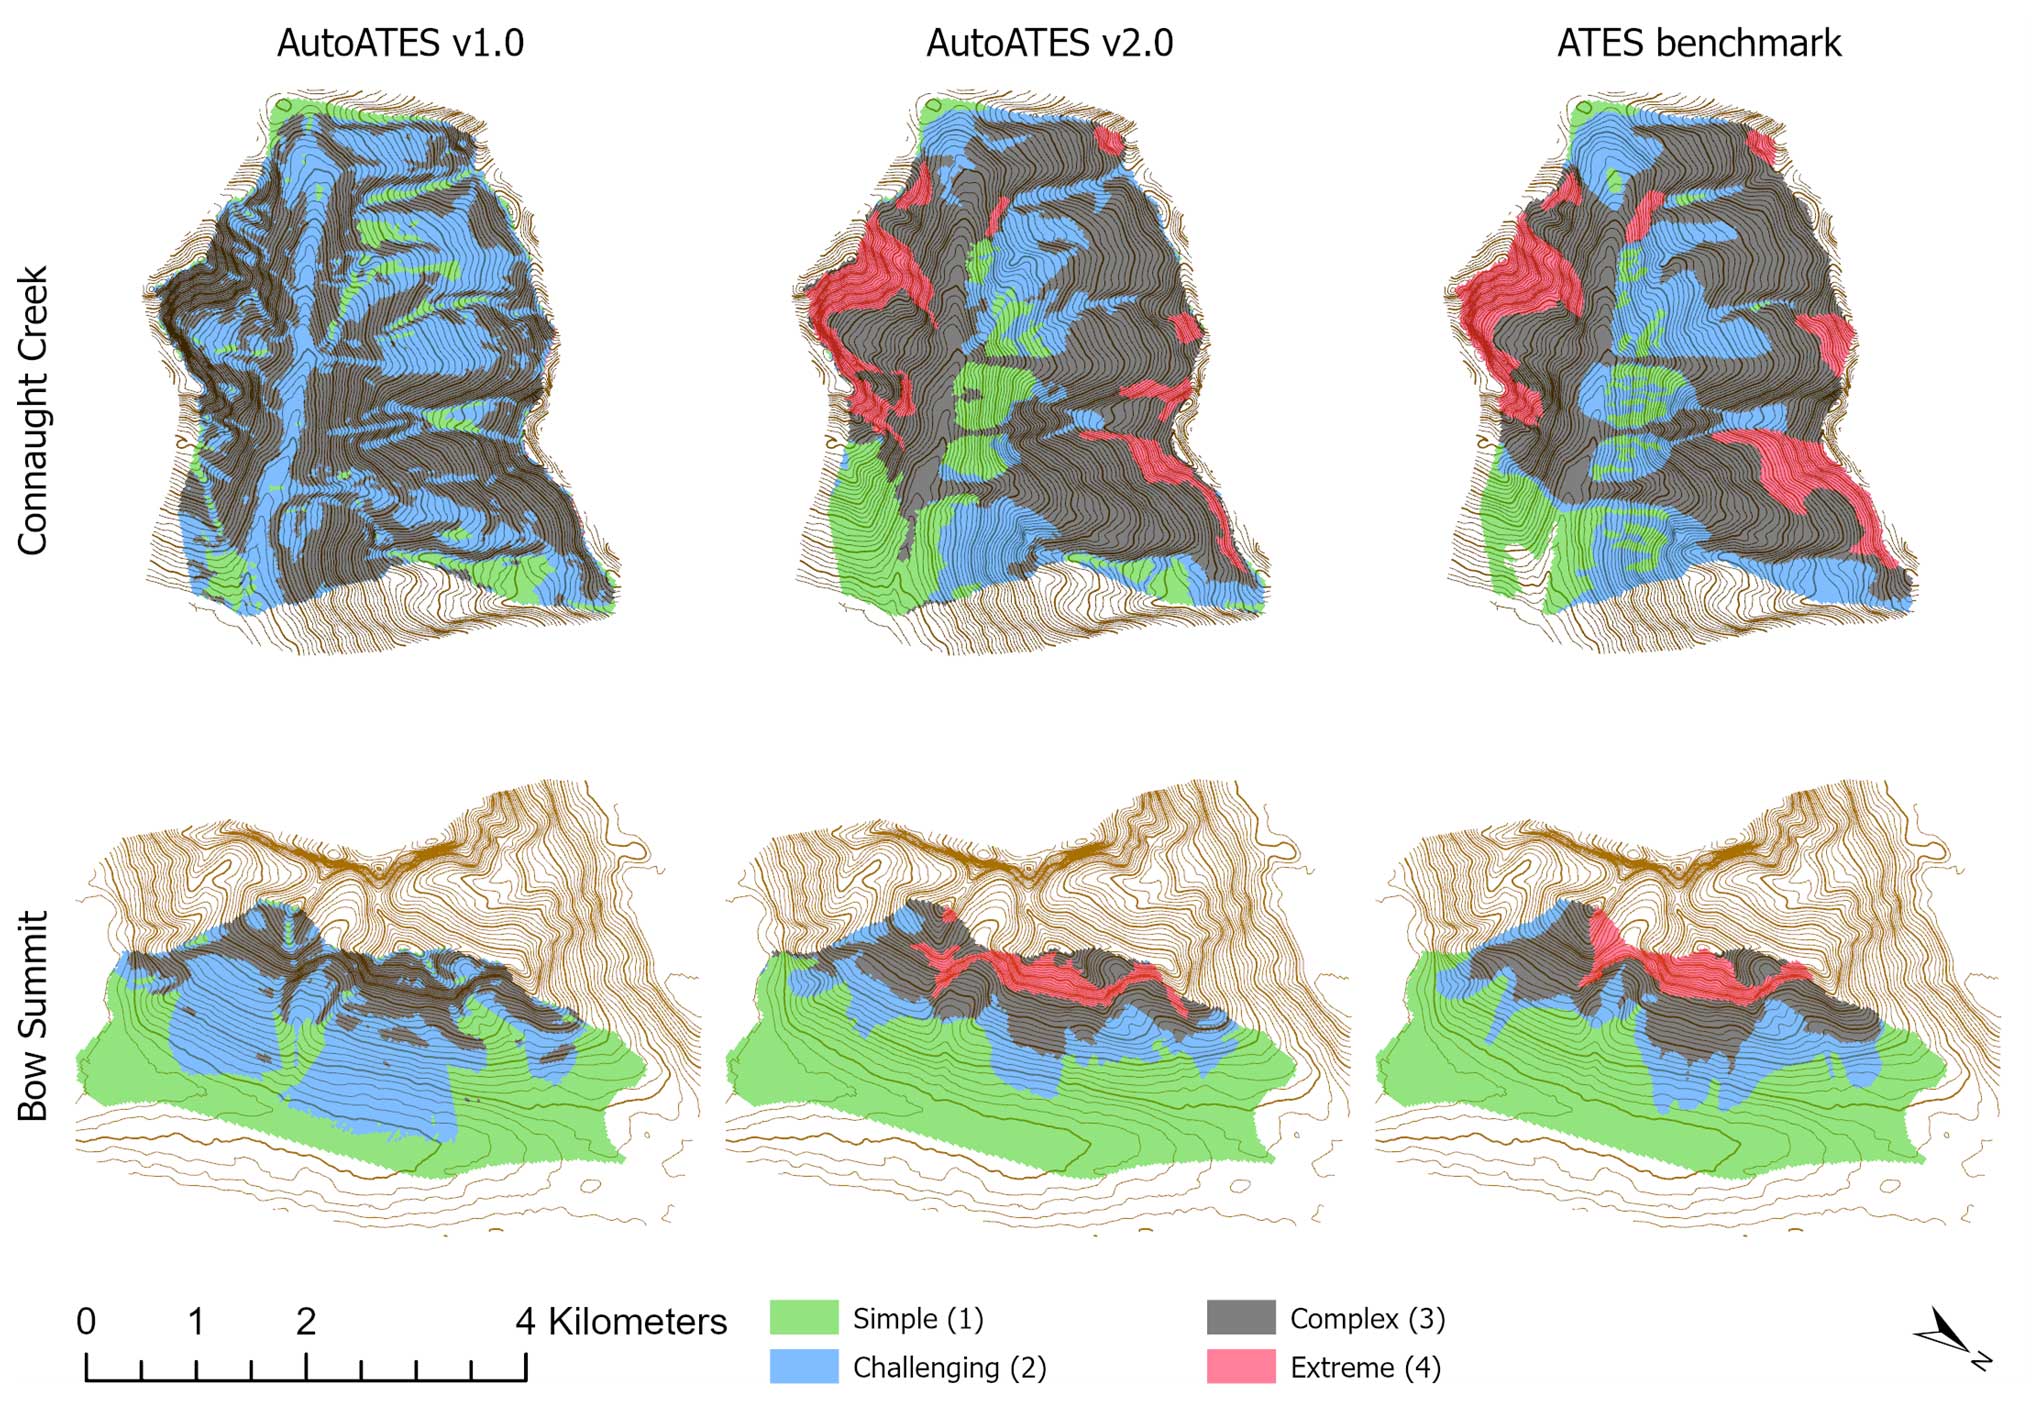
Figure 4A visual comparison between AutoATES v1.0, v2.0, and the ATES benchmark maps for Connaught Creek and Bow Summit using the European ATES color scheme (Statham and Campbell, 2023). AutoATES v1.0 does not use the extreme (4) class.
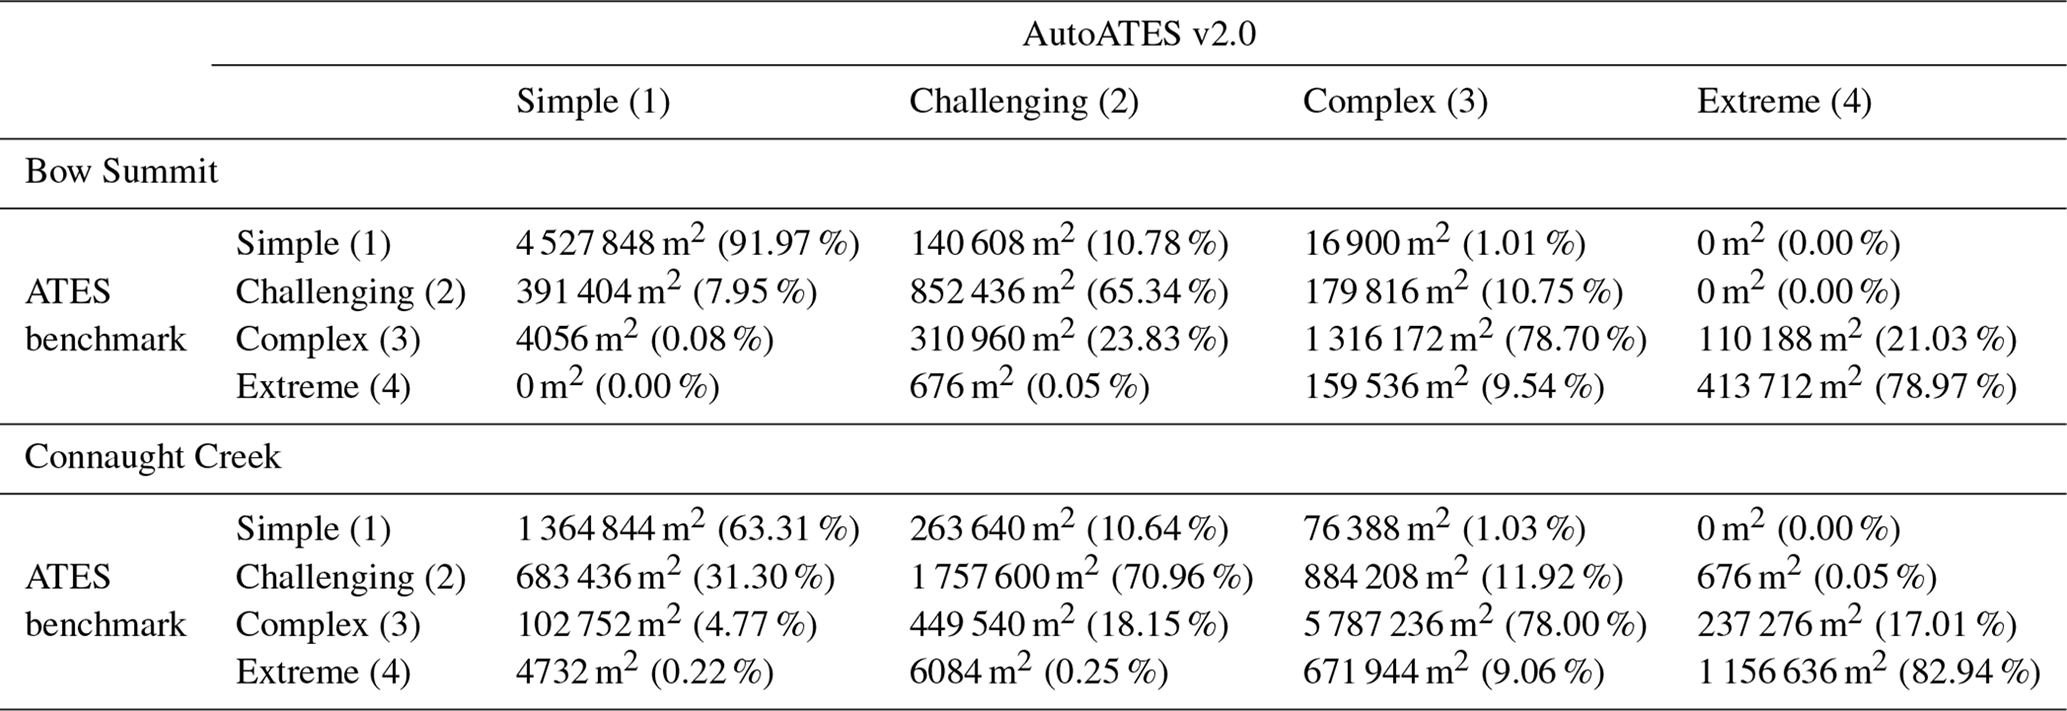
We use a confusion matrix for each study area to compare the ATES benchmark, which serves as the ground truth, against the results generated by the AutoATES v2.0 model (Table 4). The confusion matrices enable us to evaluate the performance of the AutoATES v2.0 model by calculating various metrics, such as accuracy, precision, recall, and F1 score. For Bow Summit, the model performs well for simple terrain with 91.97 % accuracy, but the accuracy for challenging terrain is much lower at 65 %. Complex terrain and extreme terrain are closer to the average, both with an accuracy of 79 % (Table 4). The accuracy distribution between the four classes is slightly different for Connaught Creek. The v2.0 model performs the worst in simple terrain with an accuracy of 63 %. Challenging terrain has an accuracy of 71.0 %, complex has an accuracy of 78.0 %, and extreme terrain has an accuracy of 83 % (Table 4).
Table 4A confusion matrix is used to compare the ATES benchmark maps with AutoATES v2.0. Bow Summit is presented above, while Connaught Creek is presented below. The accuracy of each terrain class is marked out with gray shading (area or percent of pixels correctly identified).
3.2 Ablation study
The performance of the AutoATES v2.0 model has improved compared to the AutoATES v1.0. The transition from v1.0 to v2.0 has been marked by numerous internal iterations, featuring improvements such as an optimized PRA model accounting for forest data, incorporating the Flow-Py runout model, considering forest data in the final terrain class model, and more. To fully understand the underlying factors behind the improvements of AutoATES v2.0, it is crucial to examine each of the components that have been modified. This will help clarify how each modification contributes to the overall performance of the model.
To do this, we utilize the concept of an ablation study, which is a common method used to evaluate the importance or contribution of individual components within a system or model. It is a type of sensitivity analysis that aims to understand the impact of removing or ablating specific components on the overall performance or output of the system. Ablation studies are commonly employed in machine learning, computational neuroscience, and other scientific disciplines to analyze and understand the roles and relationships of different elements in a complex system (Meyes et al., 2019).
The general procedure for an ablation study involves the following steps:
-
Train or develop the full model or system with all its components and parameters intact and measure its performance on a given task or dataset.
-
Systematically remove or disable one component or parameter at a time, keeping the rest of the model unchanged.
-
Measure the performance of the modified model without the removed component or parameter.
-
Compare the performance of the modified model to the performance of the original, complete model.
-
Repeat steps 2–4 for each component or parameter of interest.
Table 5The results from the ablation study where different components are removed to measure the effect for Bow Summit. The term dev1–6 defines the development model being evaluated, SAT34 is the slope angle threshold between complex and extreme terrain, and AAT23 is the α angle threshold between challenging and complex terrain.
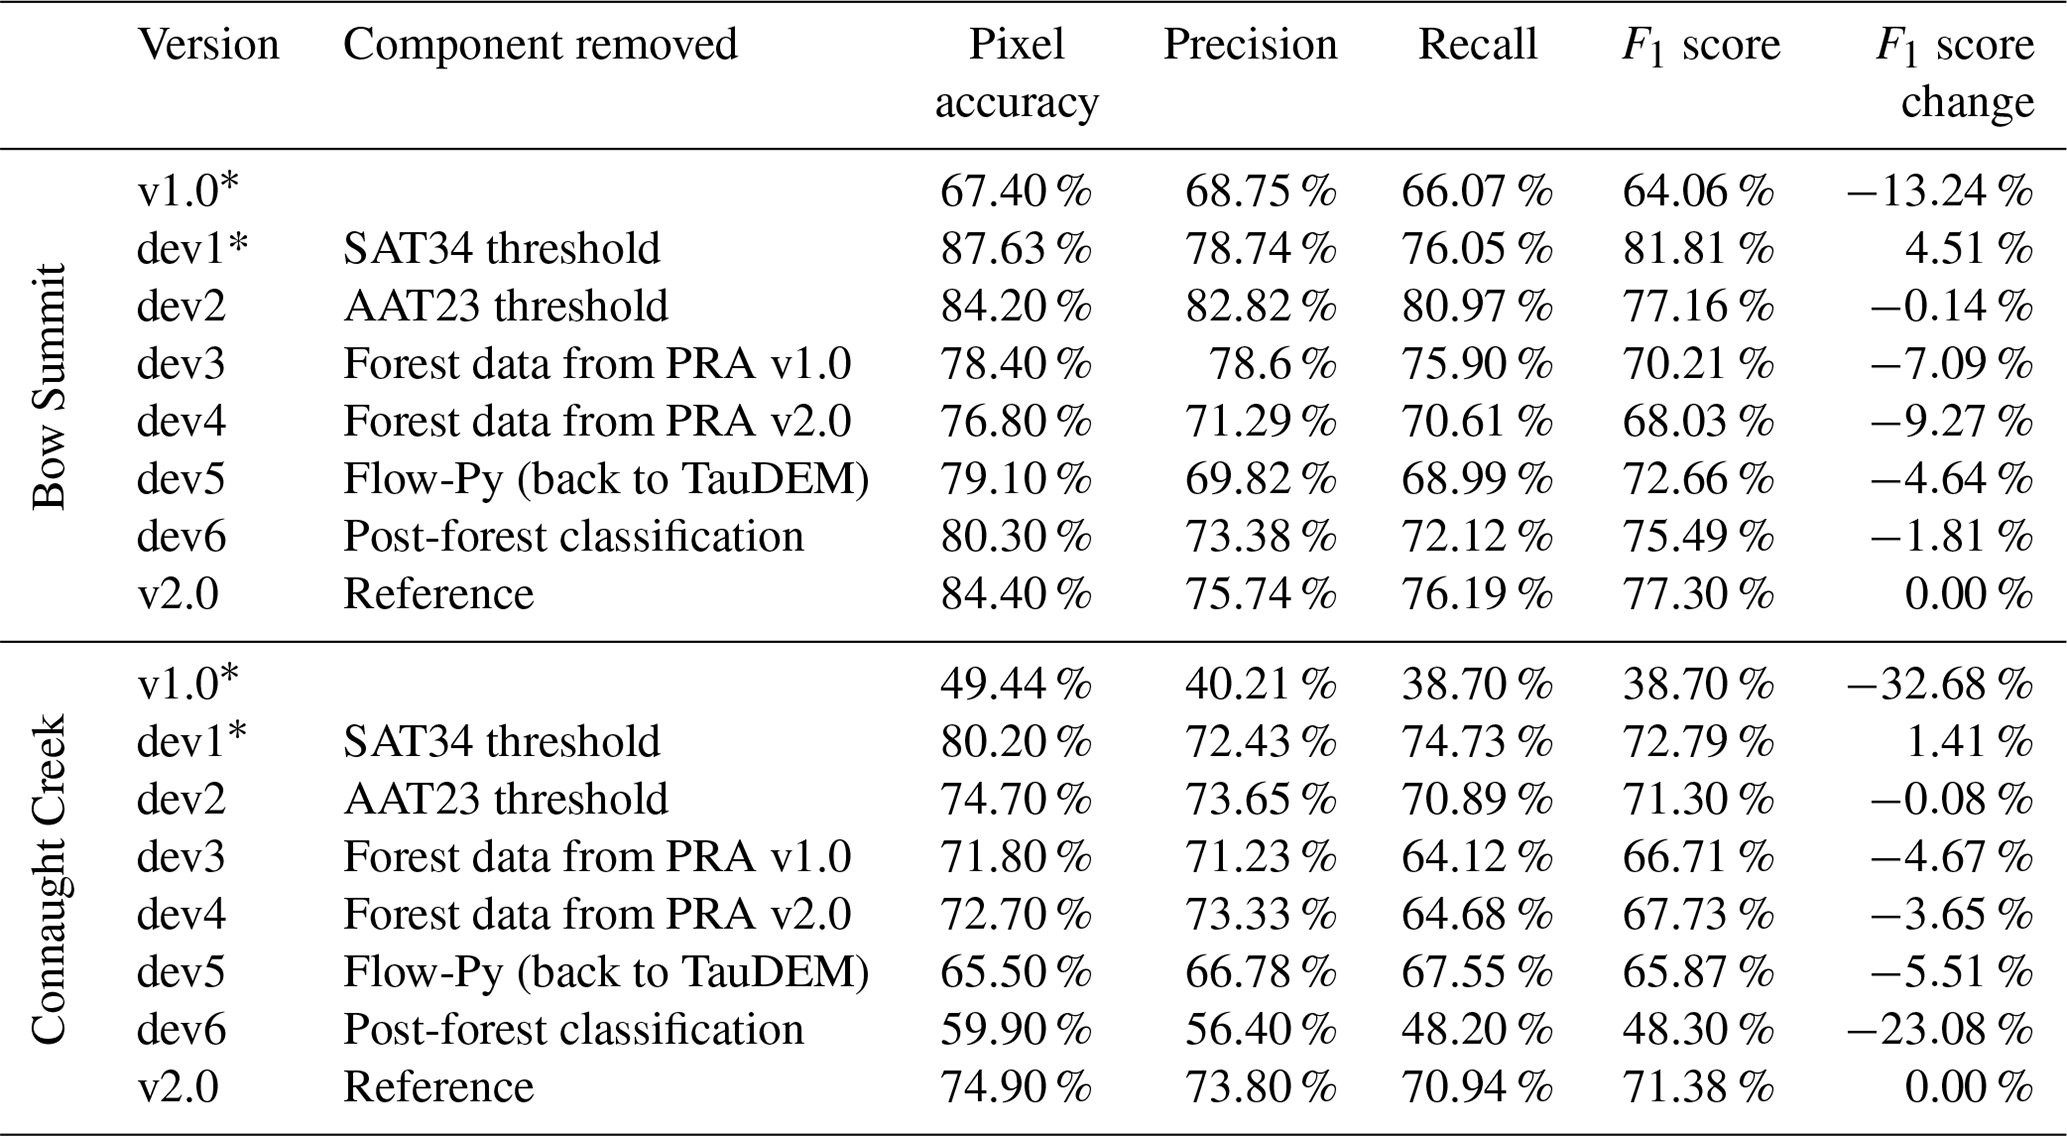
* AutoATES v1.0 and dev1 use the old ATES v1.0 framework with three terrain classes, which could lead to higher F1 scores. See Sect. 4.1.1 for an in-depth discussion.
For AutoATES v2.0, we have identified six components of the model that have been developed since v1.0. Using the concepts of an ablation study approach, we have calculated the precision, recall, and F1 score by removing different components of the model (Table 5). The reference model is the final AutoATES v2.0. A lower F1 score for a model compared to the reference indicates that an important component has been removed. In Bow Summit, the most important component is the inclusion of forest data in the PRA model (dev4). In Connaught Creek, the most important factor is the post-forest classification (dev6). In general, all new components in AutoATES v2.0 improve the model by several percent, except the inclusion of the alpha angle threshold between challenging and simple terrain (dev2), which only improves by 0.08 %–0.14 % for the two study areas.
One of the primary challenges when developing AutoATES v2.0 has been to create a robust process for validating the output. Initial attempts by Larsen et al. (2020) compared AutoATES v1.0 to available linear and spatial ATES ratings in Norway; however the validity of these ratings was uncertain because they were developed with limited peer review and could be biased.
In contrast, the approach by Sykes et al. (2023) attempts to address these deficiencies and create benchmark maps for two regions in Canada. Their approach – which used three experts to map each study area and then create benchmark maps based on their individual output – is a more comprehensive methodology to address this issue. For the purpose of our analysis, we consider these benchmark ATES maps as the standard to which we will measure any AutoATES models.
While the benchmark maps provide the best available validation dataset, there are still fundamental differences in how terrain rating experts create ATES maps versus AutoATES. The scale of analysis for terrain rating experts is generally focused on terrain features, classifying an entire ridgeline, bowl, or gulley as a single unit of analysis. In contrast, AutoATES is a raster-based model which operates on a pixel-by-pixel analysis scale. The size of the pixels depends on the DEM data available for a given study area. Variability in DEM resolution and quality is one of the biggest challenges of applying AutoATES in data-sparse regions (e.g., western Canada). The scale mismatch between terrain rating experts and AutoATES is a persistent difference and an issue that needs to be thoroughly considered with further validation efforts. The optimal scale of use for AutoATES is outside the scope of this current work, but detailed analysis by Sykes et al. (2023) has considered the impact of DEM resolution on AutoATES and notes that there is no real difference in performance using DEM datasets with a spatial resolution ranging from 5–26 m. We therefore recommend that the spatial resolution of the DEM and forest data is between 5 and 30 m.
4.1 Model performance
We investigated the performance of the AutoATES v2.0 model compared to the v1.0 model both designed to identify potential release and runout areas. Although the underlying concept remains consistent between the two versions, numerous components have been altered or refined in the latest iteration.
4.1.1 Extreme terrain (dev1)
The first modification to the AutoATES v2.0 model was to include the extreme terrain class from ATES v2.0. We incorporated the new class by including another slope angle threshold (SAT). We measured the importance of this change by using the results from the ablation study (Table 5, dev1). The result is that the ablated model performs better with regards to F1 score (e.g., 4.51 % improvement for Bow Summit and 1.41 % for Connaught Creek) than the reference model. This means that excluding the SAT34 threshold (e.g., complex/extreme threshold) increases the accuracy of the model. However, without it, the model would be using the old ATES v1.0 classification excluding extreme terrain. This implies that excluding the SAT34 threshold enhances the model's numerical accuracy. Nonetheless, its absence would cause the model to employ the outdated ATES v1.0 classification, which does not account for extreme terrain and therefore diminishes its value for ATES v2.0.
When working with classification problems, decision boundaries are the borders or thresholds that separate different classes (Lee and Landgrebe, 1993). The complexity of the decision boundaries often depends on the number of classes. When there are fewer classes, the decision boundaries tend to be simpler, as there are fewer regions to separate in the feature space. With simpler decision boundaries, the model may have an easier time making accurate predictions, as there is less chance of overfitting or incorrectly assigning data points to the wrong class. This could lead to higher precision, recall, and ultimately higher F1 scores. We believe the fewer classes in the ATES v1.0 is the reason why it performs better than the ATES v2.0 reference model.
4.1.2 Terrain traps (dev2)
To improve the model's ability to identify terrain traps such as depressions and gullies, another alpha angle threshold (AAT) was added to be included in complex terrain. The previous model only had AAT thresholds, which defaulted terrain into simple and challenging terrain. The extra component was added in the early stages of the development of AutoATES v2.0. The ablation analysis shows that this change has very little effect on the overall performance of the model (Table 5, dev2) with a 0.14 % decrease for Bow Summit and 0.08 % for Connaught Creek. This method would not help in modeling other common terrain traps such as cliffs, crevasses, and forests. We have not made any attempts to model other types of terrain traps because we believe it would have a very limited effect on the overall performance given our spatial resolution.
4.1.3 Forest data in PRA (dev3 and dev4)
Forest density is one of the most important parameters for ATES classification. In the original PRA v1.0 from Veitinger et al. (2016) it was not possible to include forest density as one of the inputs. The modified PRA v2.0 used in the AutoATES v2.0 model builds on the work from Sharp (2018).
When comparing the importance of PRA v1.0 (dev3) and PRA v2.0 (dev4) to the reference model, we see that the forest density into PRA is among one of the most important components (Table 5, dev3-4) (e.g., 7.09 %–9.27 % decrease for Bow Summit and 3.65 %–4.67 % for Connaught Creek). Comparing the results between PRA v1.0 and PRA v2.0, we can measure the difference between the two models without forest input. We found that the PRA v1.0 performed better than v2.0 in Bow Summit, but the opposite is the case in Connaught Creek. However, given that Larsen et al. (2020) did not adapt the PRA v1.0 model according to the recommendations of Veitinger et al. (2016), we believe the changes are conceptually still important even though there are no substantial differences between the two in the ablation validation.
4.1.4 Roughness in PRA
The PRA was initially developed and optimized for a 2 m DEM, while we utilize a 10 m DEM as the default. If roughness were calculated using a 10 m DEM, it would measure the roughness at basin scale, instead of the roughness at the slope scale (Blöschl, 1999; Blöschl and Sivapalan, 1995). The roughness is also dependent of a snow depth value, which is impossible to define without assessing the snowpack properties at a given time. Sykes et al. (2023) demonstrate minimal value in running AutoATES v2.0 using high-resolution DEMs (<5 m). Sykes et al. (2023) further illustrate the impact of DEM scale on ATES mapping. We have therefore chosen to remove the roughness parameter from our version of the PRA model.
4.1.5 Flow-Py (dev5)
The previous iteration of AutoATES had some severe issues with the runout simulation of avalanches where avalanches were simulated using a flow model for water. The Flow-Py simulation works in a similar fashion where the flow is limited by an alpha angle threshold, but the flow model has been changed to give more realistic outputs in terms of snow avalanches. Some other advantages with the Flow-Py simulation suite are that there are additional outputs such as cell count and zdelta, which makes it possible to account for the exposure of multiple overlapping paths and avalanche paths with high kinetic energy. When we compare the Flow-Py outputs compared to the TauDEM, we see a substantial improvement when using the Flow-Py outputs (Table 5, dev5), with a 4.64 % decrease for Bow Summit and 5.51 % for Connaught Creek.
4.1.6 Post-forest classification (dev6)
Even though the inclusion of forest density in the PRA model improved the performance of AutoATES, we found the need to reclassify sections that were obviously densely forested and resulted in a higher ATES rating than needed. To improve this, we added a post-forest classification criterion. This was efficient for Connaught Creek but less efficient for Bow Summit (Table 5, dev6) (1.81 % decrease for Bow Summit and 23.08 % for Connaught Creek). The forest impact of dev6 is minimal at Bow Summit but important for Connaught Creek. The reason for this is unclear, but one hypothesis is that there is more steep forested terrain in Connaught Creek, and the model therefore relies more on the post-forest classification. Connaught Creek also has more large runouts and overhead hazard that rely on the post-forest classification.
In the future, we hope to be less reliant on the post-forest classification criteria by optimizing the forest detrainment module in Flow-Py. This module of Flow-Py makes it possible to reduce the runout length in areas with dense forest.
4.1.7 Discrepancies
The discrepancy in accuracy scores between the two study areas is mainly attributed to the complex terrain of Connaught Creek with many smaller topographical features and the limitations of the BC VRI forest data resolution in capturing local forest characteristics (Sykes et al., 2023). This issue significantly affects the assessment of overhead hazards and the delineation of boundaries between ATES classes, with challenging (2) terrain showing the lowest accuracy and high rates of underprediction errors. Sykes et al. (2023) provide an extended discussion of the differences between the two study sites.
4.2 Application
AutoATES v2.0 is meant to be a stand-alone tool for mapping large-scale areas, but it should first be validated for a smaller area by experts to assess whether there is a need to make some changes to the input parameters. When the user is confident with their maps, the parameters could be used to generate ATES maps for a larger surrounding area.
While it is possible to run the presented version of AutoATES v2.0 without making any changes, we recommend a workflow where the optimal parameters are first identified. The suggested parameters in this paper are valid for the two test areas in western Canada. When applying AutoATES v2.0 for other areas, the parameters will likely need to be re-evaluated. Applying the parameters presented in this document to other regions without site-specific calibration risks inaccurate ATES mapping and potentially catastrophic outcomes. Users should apply this model at their own risk. We therefore urge all future users of our code to conduct a local validation before proceeding with the generation of large-scale ATES maps. This is especially important when the target group is the general public.
Begin with a relevant test area which should include a variety of terrain and all terrain classes. We recommend a workflow where the PRA model and Flow-Py are processed independent of the AutoATES classifier. The output from PRA and Flow-Py is easier to validate by local experts compared to the AutoATES output. It is more intuitive as avalanche experts have more tangible experience with identifying start and runout zones. In our experience, we complete approximately 1–3 iterations of PRA and Flow-Py before moving on to the AutoATES classifier. In general, we have experienced that the “c” parameter in the Cauchy function for slope angle combined with the max alpha angle for Flow-Py is the most effective for customizing the output. We also recommend fine-tuning all parameters in the Cauchy function for PRA when using forest density data that are different than what we used in this validation. This could be done by using a local avalanche terrain expert to review the output from each Cauchy membership value and adjusting it until the output is appropriate.
When these steps are done in advance, our experience is that the output of the AutoATES classifier tends to be much more accurate. The final AutoATES could then be shared among local experts who provide further feedback. Changes could then be made to the AutoATES classifier parameters and improved during an iterative process. When the final input parameters are set, they could be used to generate larger areas. A description of the input parameters used should be shared as metadata with the resulting spatial maps.
Large-scale application
We have used the DEM from ALOS at a spatial resolution of 26 m. This dataset is available worldwide and could enable large-scale application of AutoATES v2.0 in the future. The main limitation right now is that to our knowledge, there are no global forest data available that have a suitable accuracy and resolution. In all countries we have tested AutoATES (Norway, Canada, USA) there has been a considerable testing period to determine the best available forest data and fine tuning of model parameters to work well with local forest data. This is the rationale for providing multiple “default” settings for the input forest data including stem density, canopy cover, and basal area. The PRA parameters used for each of these are unique and need to be locally tested before large-scale application of AutoATES v2.0.
4.3 Limitations
Despite the notable improvements of the AutoATES v2.0 model, there are still some limitations that should be acknowledged.
In the context of large-scale ATES classification (e.g., Norway, 385 207 km2), Flow-Py becomes computationally heavy, which may present challenges when processing large datasets or applying the model in real-time applications. We executed the Flow-Py algorithm across all of Norway on an Amazon Web Services Elastic Cloud Compute Instance (AWS EC2 c6g.metal), which took 30 d to complete at a cost of USD 1600. This could potentially limit the scalability and accessibility of the model for certain use cases and users with limited computational resources.
Determining the optimal input parameters for the AutoATES model is important to get the best performance possible. The suitability of these parameters across different snow climates and terrain types remains an open question. Further research and validation are needed to ensure that the chosen parameters provide accurate and reliable results in various contexts. Users should not adopt the input parameters stated in this paper.
The model does not account for changes in vegetation over time such as natural events like landslides or forest fires. Therefore, it is important to update the ATES mapping periodically to account for major changes in the landscape.
Due to the limited sample size of mapped class 0 terrain in the validation datasets that we used to develop AutoATESv2.0, we do not feel that there has been sufficient research on this topic to warrant publication at this time. AutoATES is a promising tool for estimating areas with no exposure to avalanche terrain; however there is significant liability associated with deeming an area safe from avalanche hazard. Further development of the autoATESv2.0 model and consultation with avalanche community stakeholders is necessary before delving into automated mapping of class 0 terrain.
Addressing these limitations in future work could enhance the performance, applicability, and reliability of the AutoATES model, ensuring its effectiveness across a wide range of climates and terrain characteristics.
In conclusion, the development of AutoATES v2.0 has focused on creating a more robust and accurate model for mapping avalanche terrain into ATES ratings by incorporating new components to improve the model. This has been achieved by integrating new components that enhance the model's performance, including the addition of an extreme terrain class, improved PRA with support for multiple forest density types, Flow-Py, and a post-forest classification criterion. Moreover, a significant portion of the code has been rewritten to increase efficiency and eliminate dependency on proprietary software.
However, limitations related to the determination of optimal input parameters for different regions and climates need to be considered for future model development. By addressing these limitations and continuing to refine the model through iterative testing and expert feedback, AutoATES v2.0 can serve as a valuable tool for avalanche risk assessment and decision-making in a wide range of snow climates and terrain types. Ultimately, our goal is for AutoATES v2.0 to enable efficient, large-scale, and potentially global ATES mapping in a standardized manner.
To reproduce the results from this study, please find the AutoATES v2.0 model and validation data from the ablation study in the OSF repository (https://doi.org/10.17605/OSF.IO/ZXJW5, Sykes et al., 2023. For future application of AutoATES v2.0, a GitHub repository (https://github.com/AutoATES, Toft et al., 2024) will be maintained with future iterations of the model available (Toft et al., 2024).
HBT was the developer of the first version of automated ATES. The model improvement has been led by HBT with substantial contributions from JS and AS. The ablation study has been carried out by HBT with inputs from JS. HBT prepared the final manuscript with input from AS and JS. JH and AH contributed with review and edits as their role as supervisors. All authors contributed to the final manuscript.
The contact author has declared that none of the authors has any competing interests.
Publisher's note: Copernicus Publications remains neutral with regard to jurisdictional claims made in the text, published maps, institutional affiliations, or any other geographical representation in this paper. While Copernicus Publications makes every effort to include appropriate place names, the final responsibility lies with the authors.
This paper was edited by Sven Fuchs and reviewed by Scott Thumlert and one anonymous referee.
Bebi, P., Kulakowski, D., and Rixen, C.: Snow avalanche disturbances in forest ecosystems – State of research and implications for management, Forest Ecol. Manage., 257, 1883–1892, https://doi.org/10.1016/j.foreco.2009.01.050, 2009.
Birkeland, K. W., Greene, E. M., and Logan, S.: In Response to Avalanche Fatalities in the United States by Jekich et al, Wildern. Environ. Med., 28, 380–382, https://doi.org/10.1016/j.wem.2017.06.009, 2017.
Blöschl, G.: Scaling issues in snow hydrology, Hydrol. Process., 13, 2149–2175, https://doi.org/10.1002/(SICI)1099-1085(199910)13:14/15<2149::AID-HYP847>3.0.CO;2-8, 1999.
Blöschl, G. and Sivapalan, M.: Scale issues in hydrological modelling: A review, Hydrol. Process., 9, 251–290, https://doi.org/10.1002/hyp.3360090305, 1995.
Bühler, Y., Bebi, P., Christen, M., Margreth, S., Stoffel, L., Stoffel, A., Marty, C., Schmucki, G., Caviezel, A., Kühne, R., Wohlwend, S., and Bartelt, P.: Automated avalanche hazard indication mapping on a statewide scale, Nat. Hazards Earth Syst. Sci., 22, 1825–1843, https://doi.org/10.5194/nhess-22-1825-2022, 2022.
CAA: Technical Aspects of Snow Avalanche Risk Management – Resources and Guidelines for Avalanche Practitioners in Canada, edited by: Campbell, C., Conger, S., Gould, B., Haegeli, P., Jamieson, B., and Statham, G., Canadian Avalanche Association, ISBN 978-1-926497-00-6, https://www.researchgate.net/publication/326271708_Technical_Aspects_of_Snow_Avalanche_Risk_Management (last access: 15 January 2024), 2016.
Campbell, C. and Gould, B.: A proposed practical model for zoning with the Avalanche Terrain Exposure Scale, in: International Snow Science Workshop Proceedings, 7 October 2013, Grenoble, Chamonix Mont-Blanc, 385–391, https://arc.lib.montana.edu/snow-science/item.php?id=1985 (last access: 20 May 2024), 2013.
Christen, M., Kowalski, J., and Bartelt, P.: RAMMS: Numerical simulation of dense snow avalanches in three-dimensional terrain, Cold Reg. Sci. Technol., 63, 1–14, https://doi.org/10.1016/j.coldregions.2010.04.005, 2010.
D'Amboise, C. J. L., Neuhauser, M., Teich, M., Huber, A., Kofler, A., Perzl, F., Fromm, R., Kleemayr, K., and Fischer, J.-T.: Flow-Py v1.0: a customizable, open-source simulation tool to estimate runout and intensity of gravitational mass flows, Geosci. Model Dev., 15, 2423–2439, https://doi.org/10.5194/gmd-15-2423-2022, 2022.
Delparte, D. M.: Avalanche terrain modeling in Glacier National Park, Canada, PhD thesis, Library and Archives Canada, 1–195, ISBN 978-0-494-38204-2, 2008.
Engeset, R. V., Pfuhl, G., Landrø, M., Mannberg, A., and Hetland, A.: Communicating public avalanche warnings – what works?, Nat. Hazards Earth Syst. Sci., 18, 2537–2559, https://doi.org/10.5194/nhess-18-2537-2018, 2018.
Fisher, K. C., Haegeli, P., and Mair, P.: Exploring the avalanche bulletin as an avenue for continuing education by including learning interventions, J. Outdoor Recreat. Tourism, 37, 100472, https://doi.org/10.1016/J.JORT.2021.100472, 2022.
Heim, A.: Bergsturz und Menschenleben, Fretz und Wasmuth, Zurich, https://books.google.no/books/about/Bergsturz_und_Menschenleben.html?id=7GkhAQAAMAAJ&redir_esc=y (last access: 20 May 2024), 1932.
Hendrikx, J., Johnson, J., and Mannberg, A.: Tracking decision-making of backcountry users using GPS tracks and participant surveys, Appl. Geogr., 144, 102729, https://doi.org/10.1016/J.APGEOG.2022.102729, 2022.
Jang, J.-S. R. and Sun, C.-T.: Neuro-fuzzy and soft computing: a computational approach to learning and machine intelligence, Prentice-Hall, Inc., Upper Saddle River, NJ, USA, ISBN 0-13-261066-3, 1997.
Johnson, J. and Hendrikx, J.: Using Citizen Science to Document Terrain Use and Decision-Making of Backcountry Users, Citiz. Sci., 6, 8, https://doi.org/10.5334/cstp.333, 2021.
Keskinen, Z., Hendrikx, J., Eckerstorfer, M., and Birkeland, K.: Satellite detection of snow avalanches using Sentinel-1 in a transitional snow climate, Cold Reg. Sci. Technol., 199, 103558, https://doi.org/10.1016/j.coldregions.2022.103558, 2022.
Landrø, M., Hetland, A., Engeset, R. V., and Pfuhl, G.: Avalanche decision-making frameworks: Factors and methods used by experts, Cold Reg. Sci. Technol., 170, 102897, https://doi.org/10.1016/j.coldregions.2019.102897, 2020.
Larsen, H. T., Hendrikx, J., Slåtten, M. S., and Engeset, R. V.: Developing nationwide avalanche terrain maps for Norway, Nat. Hazards, 103, 2829–2847, https://doi.org/10.1007/s11069-020-04104-7, 2020.
Lee, C. and Landgrebe, D. A.: Decision boundary feature extraction for nonparametric classification, IEEE Trans. Syst. Man Cybern., 23, 433–444, https://doi.org/10.1109/21.229456, 1993.
Lied, K. and Bakkehøi, S.: Empirical calculations of snow avalanche run-out distances based on topographic parameters, J. Glaciol., 26, 165–177, 1980.
Liu, Y., Wang, Y., and Zhang, J.: New Machine Learning Algorithm: Random Forest, in: Information Computing and Applications, ICICA 2012, Lecture Notes in Computer Science, vol. 7473, edited by: Liu, B., Ma, M., and Chang, J., Springer, Berlin, Heidelberg, https://doi.org/10.1007/978-3-642-34062-8_32, 2021.
Meyes, R., Lu, M., de Puiseau, C. W., and Meisen, T.: Ablation studies in artificial neural networks, arXiv [preprint], https://doi.org/10.48550/arXiv.1901.08644, 2019.
Plattner, C., Braun, L., and Brenning, A.: The spatial variability of snow accumulation at Vernagtferner, Austrian Alps, in winter 2003/2004, Z. Gletscherk. Glazialgeol., 39, 43–57, 2006.
Sampl, P. and Zwinger, T.: Avalanche simulation with SAMOS, Ann. Glaciol., 38, 393–398, https://doi.org/10.3189/172756404781814780, 2004.
Sandvoss, M., McClymont, B., and Farnden, C.: User's Guide to VRI, Timberline Forest Inventory Consultants, https://www.for.gov.bc.ca/hfd/library/documents/bib106996.pdf (last access: 4 March 2024), 2005.
Schumacher, J., Toft, H., McLean, J. P., Hauglin, M., Astrup, R., and Breidenbach, J.: The utility of forest attribute maps for automated Avalanche Terrain Exposure Scale (ATES) modelling, Scand. J. Forest Res., 37, 264–275, https://doi.org/10.1080/02827581.2022.2096921, 2022.
Schweizer, J. and Lütschg, M.: Characteristics of human-triggered avalanches, Cold Reg. Sci. Technol., 33, 147–162, https://doi.org/10.1016/S0165-232X(01)00037-4, 2001.
Sharp, E.: Evaluating the exposure of heliskiing ski guides to avalanche terrain using a fuzzy logic avalanche susceptibility model, University of Leeds, Leeds, https://doi.org/10.13140/RG.2.2.18673.94567, 2018.
Statham, G. and Campbell, C.: The Avalanche Terrain Exposure Scale v2, in: International Snow Science Workshop Proceedings, 8 October 2023, Bend, Oregon, 597–605, https://arc.lib.montana.edu/snow-science/item.php?id=2939 (last access: 20 May 2024), 2023.
Statham, G., McMahon, B., and Tomm, I.: The Avalanche Terrain Exposure Scale, in: International Snow Science Workshop Proceedings, Telluride, Colorado, 491–497, https://arc.lib.montana.edu/snow-science/item.php?id=970 (last access: 20 May 2024), 2006.
Sykes, J., Hendrikx, J., Johnson, J., and Birkeland, K. W.: Combining GPS tracking and survey data to better understand travel behavior of out-of-bounds skiers, Appl. Geogr., 122, 102261, https://doi.org/10.1016/j.apgeog.2020.102261, 2020.
Sykes, J., Toft, H. B., and Haegeli, P.: Automated Avalanche Terrain Exposure Scale (ATES) mapping – Local validation and optimization in Western Canada, OSF [code], https://doi.org/10.17605/OSF.IO/ZXJW5, 2023.
Tarboton, D. G.: A new method for the determination of flow directions and upslope areas in grid digital elevation models, Water Resour. Res., 33, 309–319, https://doi.org/10.1029/96WR03137, 1997.
Techel, F. and Zweifel, B.: Recreational avalanche accidents in Switzerland: Trends and patterns with an emphasis on burial, rescue methods and avalanche danger, in: International Snow Science Workshop Proceedings, 7 October 2013, Grenoble-Chamonix, 1106–1112, https://arc.lib.montana.edu/snow-science/item.php?id=1844 (last access: 20 May 2024), 2013.
Techel, F., Jarry, F., Kronthaler, G., Mitterer, S., Nairz, P., Pavšek, M., Valt, M., and Darms, G.: Avalanche fatalities in the European Alps: long-term trends and statistics, Geogr. Helv., 71, 147–159, https://doi.org/10.5194/gh-71-147-2016, 2016.
Techel, F., Mitterer, C., Ceaglio, E., Coléou, C., Morin, S., Rastelli, F., and Purves, R. S.: Spatial consistency and bias in avalanche forecasts – a case study in the European Alps, Nat. Hazards Earth Syst. Sci., 18, 2697–2716, https://doi.org/10.5194/nhess-18-2697-2018, 2018.
Thumlert, S. and Haegeli, P.: Describing the severity of avalanche terrain numerically using the observed terrain selection practices of professional guides, Nat. Hazards, 91, 89–115, https://doi.org/10.1007/s11069-017-3113-y, 2018.
Toft, H. B., Müller, K., Hendrikx, J., Jaedicke, C., and Bühler, Y.: Can big data and random forests improve avalanche runout estimation compared to simple linear regression?, Cold Reg. Sci. Technol., 211, 103844, https://doi.org/10.1016/j.coldregions.2023.103844, 2023.
Toft, H. B., Sykes, J. M., and Schauer, A.: AutoATES-v2.0, GitHub [code], https://github.com/AutoATES (last access: 19 January 2024), 2024.
Veitinger, J., Purves, R. S., and Sovilla, B.: Potential slab avalanche release area identification from estimated winter terrain: a multi-scale, fuzzy logic approach, Nat. Hazards Earth Syst. Sci., 16, 2211–2225, https://doi.org/10.5194/nhess-16-2211-2016, 2016.
Werners, B.: Aggregation models in mathematical programming, Math. Model. Decis. Support, 48, 295–305, 1988.