the Creative Commons Attribution 4.0 License.
the Creative Commons Attribution 4.0 License.
 | 14 May 2024
Assessing landslide damming susceptibility in Central Asia
Carlo Tacconi Stefanelli
William Frodella
Francesco Caleca
Zhanar Raimbekova
Ruslan Umaraliev
Veronica Tofani
Central Asia regions are characterized by active tectonics, high mountain chains with extreme topography with glaciers, and strong seasonal rainfall events. These key predisposing factors make large landslides a serious natural threat in the area, causing several casualties every year. The mountain crests are divided by wide lenticular or narrow, linear intermountain tectonic depressions, which are incised by many of the most important Central Asia rivers and are also subject to major seasonal river flood hazard. This multi-hazard combination is a source of potential damming scenarios, which can bring cascading effects with devastating consequences for the surrounding settlements and population. Different hazards can only be managed with a multi-hazard approach coherent within the different countries, as suggested by the requirements of the Sendai Framework for Disaster Risk Reduction.
This work was carried out within the framework of the Strengthening Financial Resilience and Accelerating Risk Reduction in Central Asia (SFRARR) project as part of a multi-hazard approach with the aim of providing a damming susceptibility analysis at a regional scale for Central Asia. To achieve this, a semi-automated GIS-based mapping method, centered on a bivariate correlation of morphometric parameters defined by a morphological index, originally designed to assess the damming susceptibility at basin/regional scale, was modified to be adopted nationwide and applied to spatially assess the obstruction of the river network in Central Asia for mapped and newly formed landslides. The proposed methodology represents an improvement to the previously designed methodology, requiring a smaller amount of data, bringing new preliminary information on damming hazard management and risk reduction, and identifying the most critical area within the Central Asia regions.
- Article
(23608 KB) - Full-text XML
- Companion paper
- BibTeX
- EndNote


The mountainous areas of the Dzungaria, Tien Shan, Pamirs, and Kopet Dag in Central Asia territories are characterized by complex and active tectonics and are the sources of most of Central Asia rivers. A rugged topography along with complex geological structure and high seismicity are an ideal setting for large slope failures. In general, when landslides completely obstruct a river channel, they generate a landslide dam whose consequences can be a serious hazard, forming upstream backwater and causing catastrophic downstream flooding, changes in the riverbed, and embankment instability, triggering other landslides with a cascading effect (Swanson et al., 1986; Costa and Schuster, 1988; Casagli and Ermini, 1999). The effects of impounded water and anomalous flood waves, resulting from a dam breach, have significant economic and social impacts in upstream and downstream areas with economic and human losses (King et al., 1989; Dai et al., 2005; Chen and Chang, 2016). Rebuilding costs can be extensive, as they are direct (e.g., infrastructure and building reconstruction, safety measures) and indirect (e.g., loss in real estate value and damage caused to industrial and agricultural production), which is harder to estimate.
Most landslide dams have a short life, as about 40 % of them collapse within 24 h after formation and about 80 % within 1 year (Costa and Schuster, 1988; Tacconi Stefanelli et al., 2015; Fan et al., 2020). Given the limited time available, a complete and reliable analysis of the risks, requiring in-depth study of the phenomenon, is not achievable during the event, and only rapid assessments of the dam stability are suitable. When the people that need to be evacuated are too many or the related risk is too high, engineering measures for the hazard reduction are attempted: among these are for example modification of slope geometry, drainage, retaining structures, and internal slope reinforcement (Popescu and Sasahara, 2009; Schuster and Evans, 2011). Therefore, part of the effects from landslide damming can be avoided or at least reduced thanks to mitigation and prevention measures (e.g., slope stabilization or re-profiling) if the most critical areas with the highest damming probability are known. Consequently, planning and prevention tools, such as risk and susceptibility mapping, are essential to reduce the costs of natural hazards and improve the efficiency of environmental management.
Reactivation of ancient landslides triggered during different climatic and environmental conditions may often generate new mass movements (Casagli and Ermini, 1999; Canuti et al., 2004; Dikau and Schrott, 1999; Borgatti and Soldati, 2010; Crozier, 2010). Landslides generated in the past are often dormant, with strength parameters of the sliding surface close to the residual ones, and difficult to recognize because vegetation, erosion, and superficial alteration hide their morphology. Natural causes, such as earthquakes, river undercutting, rainfall, and snowmelt, or even anthropic activity can reactivate these ancient phenomena. Therefore, all dormant landslides capable of reaching a river along their pathway can potentially dam it and should be investigated. New landslides, instead, may develop wherever suitable conditions along the slopes are present. The spatial occurrence probability is commonly assessed by landslide susceptibility analysis, highly dependent on landslide volume (Catani et al., 2016), which is difficult to accurately predict.
Landslides in Central Asia are quite common, and a considerable number of them have huge dimensions, often induced by strong earthquakes but also by floods, heavy rainfall, and snowmelt (Behling et al., 2014; Golovko et al., 2015; Havenith et al., 2015a, b; 2006b; Kalmetieva et al., 2009; Rosi et al., 2023; Saponaro et al., 2014; Strom and Abdrakhmatov, 2017, 2018). Concerning landslide dam events, in Central Asia regions several mass movements of considerable size produced the obstruction of a river section, of which more than 100 are still existing with a lake (Strom, 2010). Although many of these could be considered stable (Strom, 2010), the occurrence of devastating outburst floods in the last century shows that their potential hazard should never be overlooked considering the seismicity of the region as well. In the Rushan and Murghab districts of the Gorno-Badakhshan Autonomous Oblast (Pamirs, Tajikistan) along the Murghab River, the Usoi landslide dam is one of the most famous of the many cases in these regions. Its impounded lake, called Sarez Lake, is 60 km long with a depth of 500 m and a stored volume of about 17 km3, representing the world's deepest landslide-dammed lake (Costa and Schuster, 1991; Fan et al., 2020). It originated on 18 February 1911, when a Mw 7.2 earthquake triggered a giant wedge failure of about 2.2 km3 of rock (mainly quartzite, schist, shale, and dolomite) and debris that blocked the Murghab River and a tributary valley, forming the 560 m high, 5 km long, and 4 km wide Usoi dam, impounding Sarez Lake, also creating the smaller Lake Shadau (Strom, 2010).
Landslide dam evolution, according to some studies (Swanson et al., 1986; Ermini and Casagli, 2003; Dal Sasso et al., 2014; Tacconi Stefanelli et al., 2016), can be estimated through geomorphological indexes, which require parameters characterizing the landslide (or the dam) and the river (or the lake). Geomorphological indexes are a powerful classification tool, but their prediction power depend mainly on long studies and a large amount of data and measurement efforts given their empirical nature. Many of these indexes need parameters that are not always available and easy to acquire, such as grain size distribution (Liao et al., 2022) or landslide velocity (Swanson et al., 1986).
In this work, we propose a simple semi-automatic GIS-based mapping methodology to verify the damming susceptibility of river networks at national scale from existing and neo-formed landslides through a geomorphological index. This activity research was carried out in the framework of the Strengthening Financial Resilience and Accelerating Risk Reduction in Central Asia (SFRARR) project as part of a multi-hazard approach (Peresan et al., 2023).
The proposed mapping methodology represents innovation in terms of the application simplicity, availability of data, and extension of the analyzed area, bringing new information on the damming hazard in the Central Asia regions where the landslide susceptibility is quite high (Rosi et al., 2023), and a set of input data required for the methodology application has also been made available.
Central Asia is a region of vast diversity encompassing high mountain chains, deserts, and steppes (Fig. 1). The southern and eastern parts of the region are predominantly occupied by the mountainous areas of Dzungaria, Tien Shan, Pamirs, Kopet Dag, and a small part of western Altai, with peaks exceeding 7000 m above sea level (a.s.l.) (Strom, 2010). These intraplate mountain systems, developed in the Cenozoic as a result of the India–Asia collision, is located between the Tarim Basin and the Kazakh Shield (Molnar and Tapponier 1975, Abdrakhmatov et al., 1996; 2003; Zubovich et al., 2010; Ullah et al., 2015). This study focuses on the territories of Central Asia that include Turkmenistan, Kazakhstan, the Kyrgyz Republic, Uzbekistan, and Tajikistan, covering a surface of more than 4×10⁶ km2. Mountain building began in the Oligocene (Chedia, 1980) or later (Abdrakhmatov et al., 1996), resulting in a complex system of basement folds interrupted by several thrusts and reverse faults with lateral offset of important amounts (Delvaux et al., 2001).
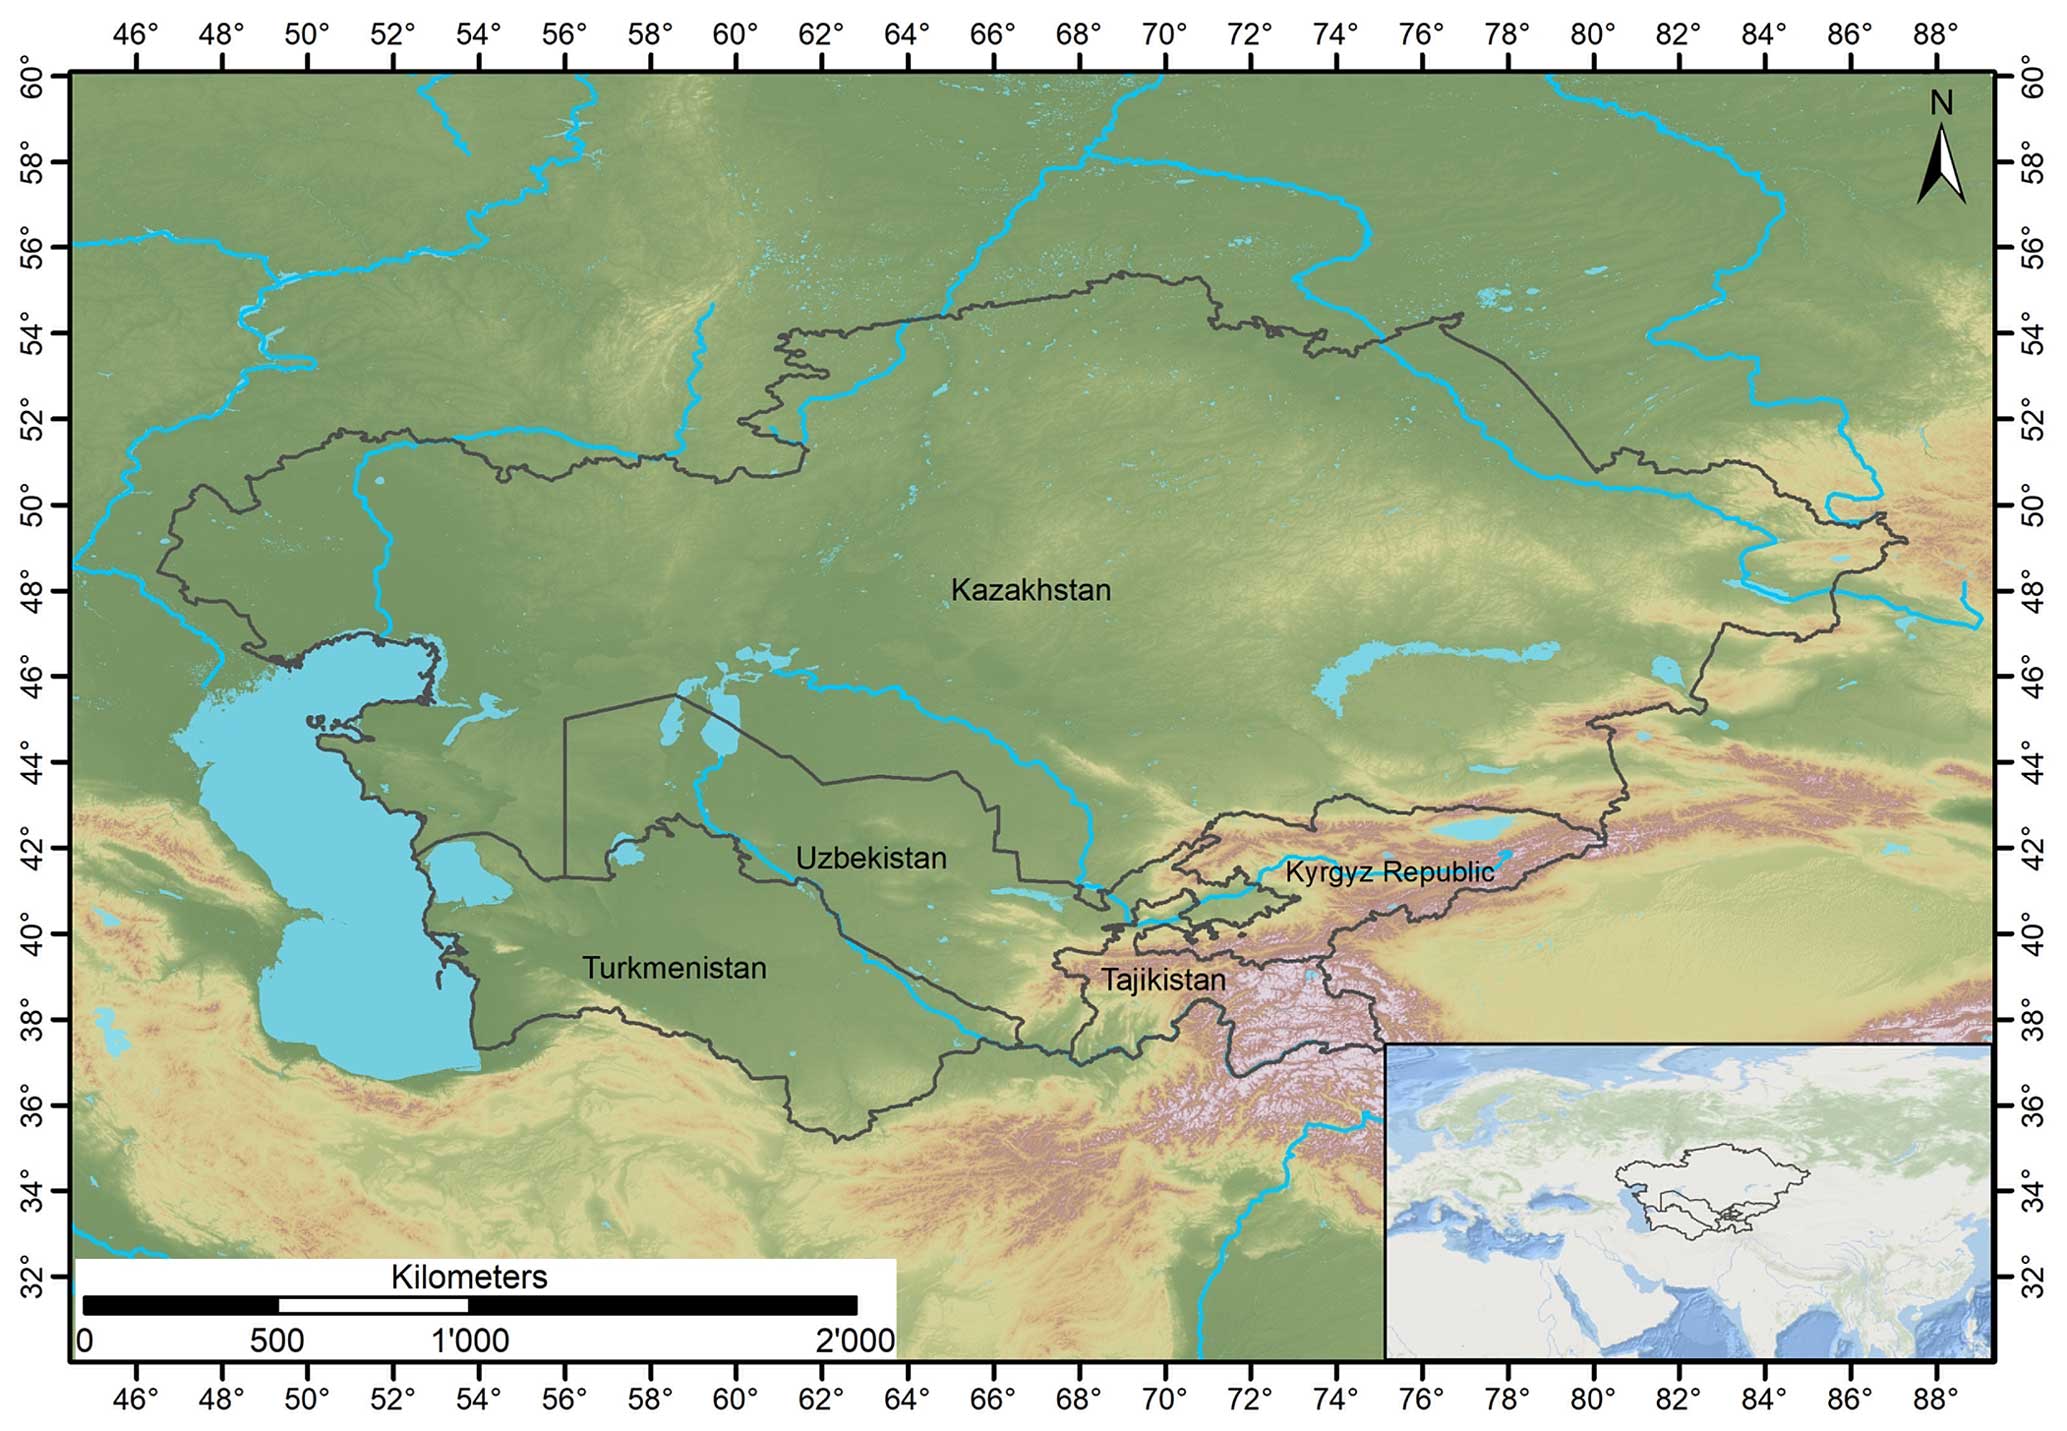
Figure 1Geographical framework of the study area. The lake's polygons are from Esri, Garmin International, Inc.; the topographic base is from NASA's Shuttle Radar Topography Mission (SRTM) project (Farr and Kobrick, 2000).
The mountain belts contain several regional fault zones (Fig. 2), and others cross the mountain systems with a NW–SE axis (Trifonov et al., 1992). Paleozoic crystalline rocks form, for the most part, the mountain ridges, which correspond to a neotectonic anticline and are separated by tectonic depressions, with lenticular or linear shapes. These intermountain depressions host the primary river valleys and are filled by Neogene and Quaternary deposits, principally sandstones, siltstones interbedded by gypsum, and conglomerates (Strom and Abdrakhmatov, 2017). Lithologies from the Mesozoic Era and Paleogene Period are characteristic of the areas at the foot of the mountain ranges (Fig. 2). This main deeply incised river network, fed by glaciers, snowmelt water, and rain, is linked by narrow deep gorges up to 1–2 km deep (Strom and Abdrakhmatov, 2018) and is the origin of most of the rivers in Central Asia.
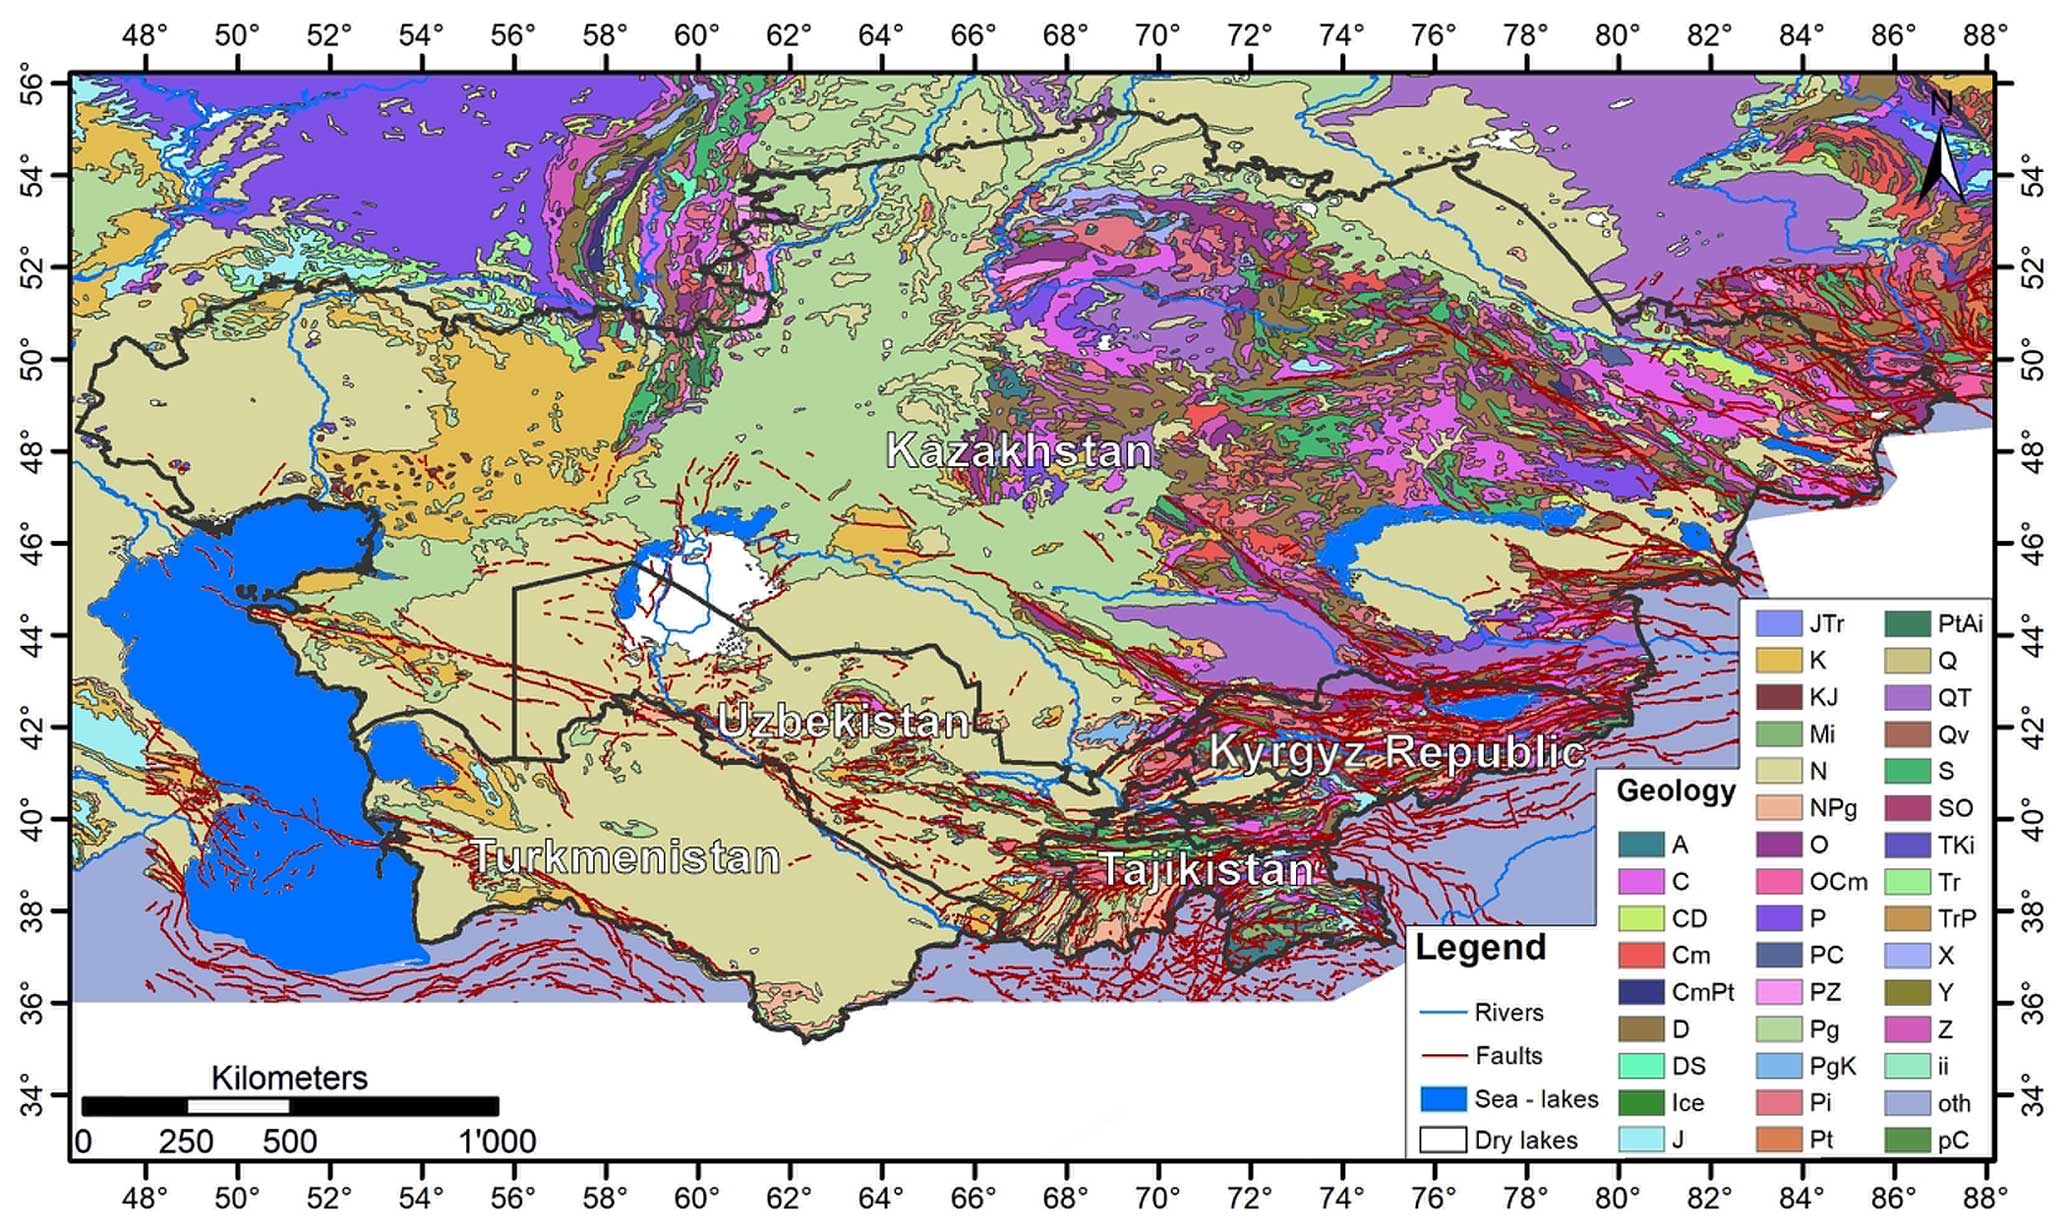
Figure 2Geological map of the area. The geological formation data are from the United States Geological Survey (USGS) (Persits et al., 1997; https://doi.org/10.3133/ofr97470E, for the legend), and faults are from the Active Faults of Eurasia Database (AFEAD) (Styron and Pagani, 2020).
The retreat and shrinkage of glaciers in Central Asia regions induced by global warming produce a seasonal variation in river discharge and consequently an increase in its induced hazards such as glacial lake outburst floods (GLOFs) (Falátková, 2016), resulting in countless losses of human life and destroyed infrastructure (Kropáček et al., 2021; Petrov et al., 2017; Wang et al., 2013). The high seismicity, frequent floods, and a complex geological and topographical structure (such as lithological predisposition, faulting zones, steep slopes) contribute to the predisposition of the region to frequent landslides which can potentially obstruct the narrow valleys of the mountain ranges and in turn be the cause of chain risks (CAC DRMI, 2009; Havenit et al., 2017).
The Morphological Obstruction Index (MOI) (Tacconi Stefanelli et al., 2016) is a bivariate index able to evaluate the potential hazard posed by landslide dams that requires only simple morphometrical parameters which are easily extracted from common digital elevation models. The MOI is based on the interpolation of 351 documented cases and has been used in several studies, such as in Italy and Peru (Tacconi Stefanelli et al., 2016, 2018), to assess landslide damming susceptibility, showing better results than other popular indexes (Swanson et al., 1986). This empirical index is a useful tool for identifying high-risk areas and for prioritizing mitigation efforts in landslide-prone regions.
The MOI is calculated by dividing the volume of the landslide, Vl (m3), by the width of the river valley, Wv (m), at the dam location.
The MOI is based on the principle that the higher the ratio of the landslide volume to the river width, the greater the potential for dam formation. It is important to point out that river width, Wv, is defined as the width of the river valley which can potentially be obstructed, creating a dammed lake, and not of just the channel where the river flows, as is often misinterpreted, although in narrow mountain valleys these often coincide.
Landslide dams analyzed by the index can be grouped within three evolutionary classes: formed (the red area, where the plotted landslides have completely blocked their river), not formed (the blue area, where only cases of unobstructed rivers are found), and uncertain evolution (the purple area, in which both cases of formed and unformed dams can be found). The limits of these domains are depicted by two lines, the lower red “non-formation” line and the upper blue “formation” line (Fig. 3) obtained by the interpolation of the cases analyzed by Tacconi Stefanelli et al. (2018).
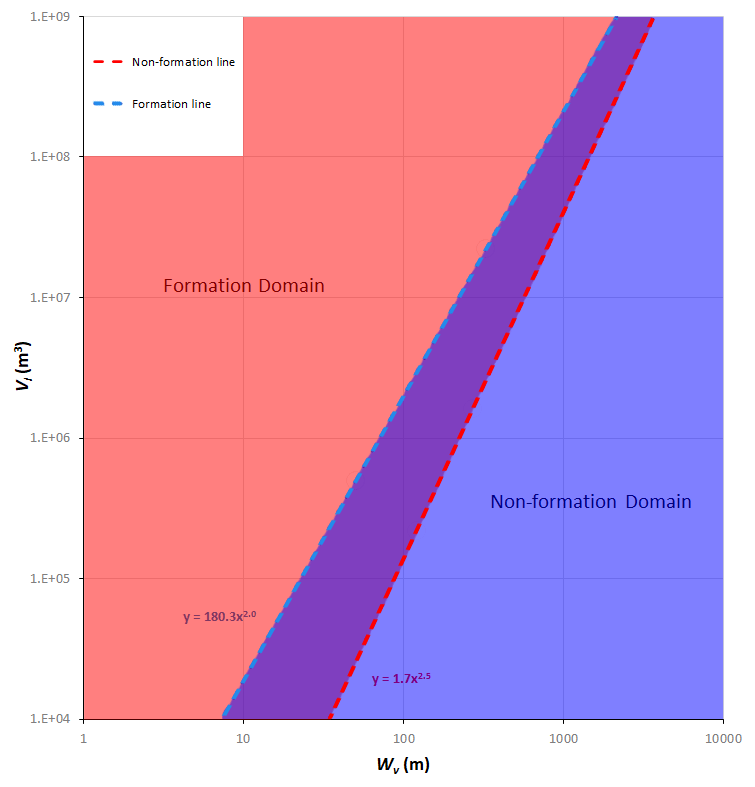
The equation of the former is expressed as follows:
where is the non-formation volume and the minimum landslide volume able to potentially block a river with a given width Wv. Smaller volumes cannot completely dam the river. The latter expression draws the upper limit for unformed dams and is expressed as follows:
where is the formation volume and the minimum landslide volume able to dam the river valley, with a confidence of 99 %, and the inferior boundary of the formation domain (which includes only formed dams). Intermediate cases that fall between the two lines cannot confidently be identified as formed or unformed and are therefore classified as having uncertain evolution.
As originally proposed by Tacconi Stefanelli et al. (2020), these two equations, Eqs. (2) and (3), can be used to apply a simple semi-automatic methodology in order to verify at basin scale the damming susceptibility from existing and neo-formed landslides. The following semi-automated procedure, inspired by the one of Tacconi Stefanelli et al. (2020) of which this represents an improvement, is applied on a national scale and can be reproduced entirely in a geographic information system (GIS) environment. However, the method, initially designed for analysis at basin/region scale, applied to such a small scale (national) will not be able to provide detailed information. For this reason, this study represents a preliminary phase of investigation, which will allow us to concentrate further detailed analysis on the areas identified as more critical.
Within an even medium–long time interval the valley width in each river stretch does not change significantly and can be considered an immutable factor in the MOI equation (Eq. 1). Starting from this assumption, along with Eqs. (2) and (3), if the average river width Wv of each river stretch can be assessed, the two threshold landslide volumes (non-formation volume) and (formation volume) can be estimated for each river stretch.
Landslides that cause river obstruction are in many cases reactivations of ancient movements that are still in a condition of partial instability and that have not reached a potential equilibrium reaching the valley floor. Therefore, with a landslide inventory it is possible to assess, with some assumptions and simplifications, which among the mapped landslides are able to dam the river section. Each landslide that is not already lying in the valley floor with a volume bigger than V′ and V′′ is identified as potentially prone to block the river in the future in that point. Following this, a map of damming susceptibility for reactivation of existing landslides can be generated.
The likelihood prediction for new landslides, with a volume bigger than and , is a much more difficult task as the volume is a complex value to be estimated (Catani et al., 2016). The exceeding probability of landslide volume used by Tacconi Stefanelli et al. (2020) was reached thanks to the knowledge of the alpha exponent of the statistical frequency distribution of the landslide volumes in the whole study area. To achieve this, a database of landslides with a very high number of events (tens or even hundreds of thousands) should be available (Catani et al., 2016), which in our study area unfortunately is not. To have an assessment of the damming susceptibility for neo-formed landslides, the two volume threshold values, evaluated for all the river networks, can be used as well. After estimating the river width of every river stretch, the and values of each of them can be computed through the corresponding two equations. In this way there will be two reference values to be able to assess whether the volume of a new landslide can potentially obstruct an affected river stretch.
The input data needed for the procedure are a digital elevation model, a vector layer of the river network, and an updated landslide inventory. The data quality and resolution, such as the landslide inventory completeness, the river network reliability, and the DEM's pixel size, heavily affect the quality of the result (Tacconi Stefanelli et al., 2020). Thus, it was decided to use the DEM with a higher resolution, freely available from NASA's SRTM project (Far and Kobrick, 2000) with 1 arcsec or about 30 m resolution. The river network came from Coccia et al. (2023). The latter input data are a database of 8910 landslides, which is a compilation of several different inventories collected through decades of field surveys, studies, and remote sensing analysis in the study area, shown in Fig. 4.
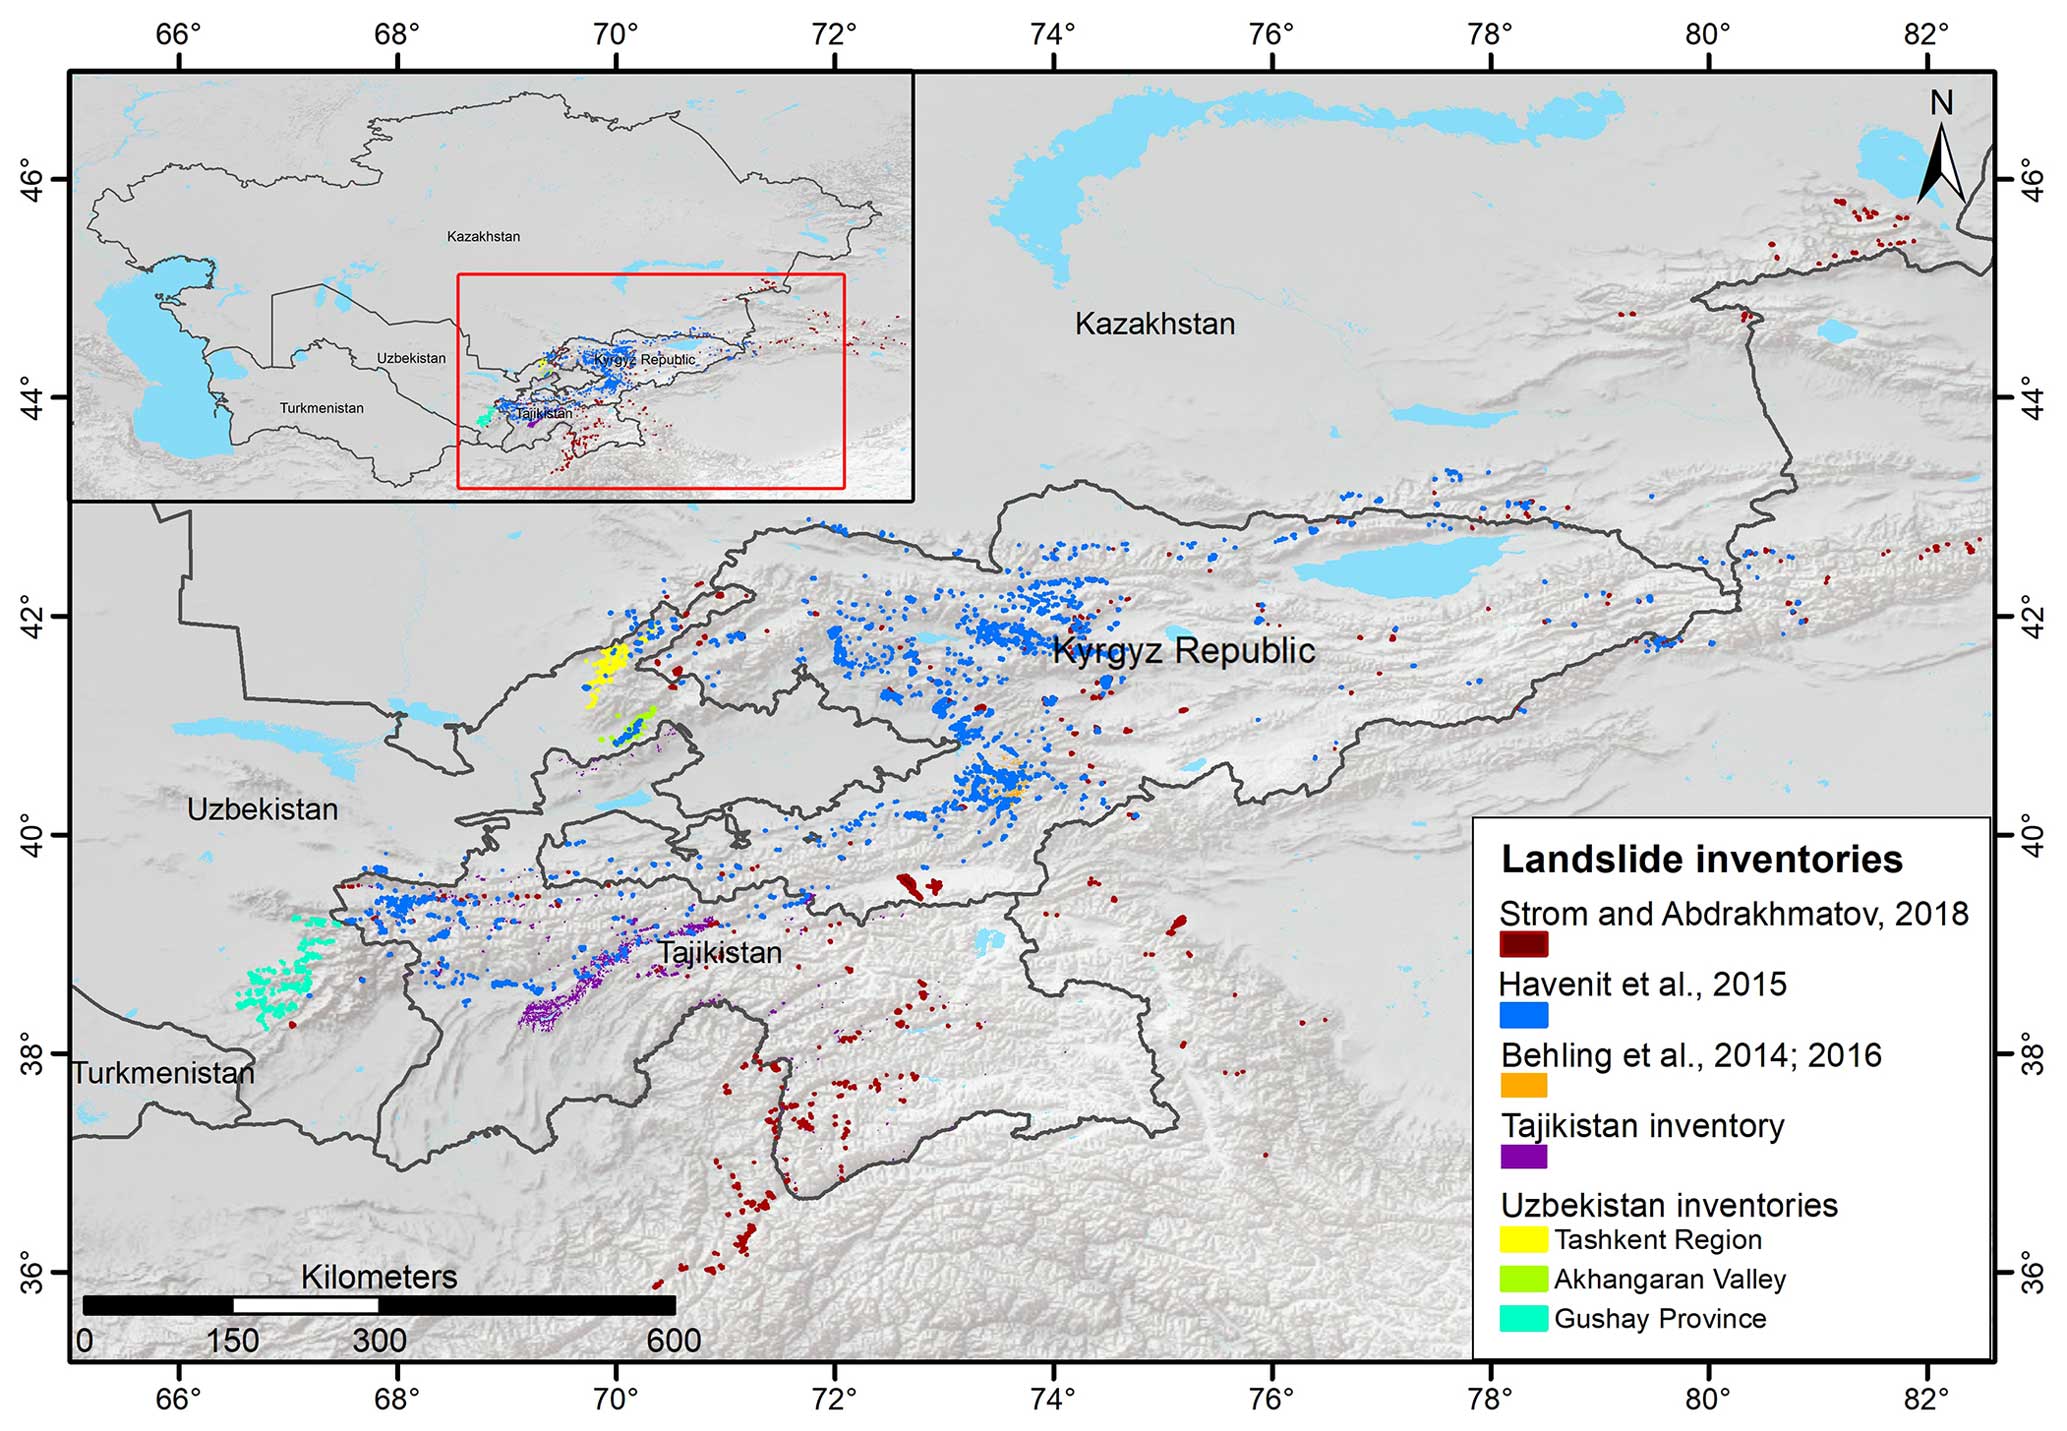
Figure 4Map of the landslide inventories in the study area. The lake's polygons are from Esri, Garmin International, Inc.; the basemap is from Esri, USGS, and NOAA.
A description of each inventory is given below:
-
The rockslides and rock avalanches of Central Asia (Strom and Abdrakhmatov, 2018) includes more than 1000 very big (>= 106 m3) rockslides and rock avalanches, covering central Asian countries (excluding Turkmenistan and Altai), the Chinese Tien Shan and Pamirs, and Afghan Badakhshan. Collected throughout decades of field surveys and analysis of aerial/satellite imaging, the inventory also includes information on morphometric parameters (runout, area), dammed lakes, head scarps, and quantitative characteristics (such as area, volume) for about 600 cases.
-
The Tien Shan landslide inventory (Havenith et al., 2015a) is the biggest database in the study area. Assembled through field work and remote sensing and geophysical data interpretation, it includes the elements of the previous inventory alongside other smaller landslides in soft sediments (Havenith et al., 2006a; Schlögel et al., 2011) for a total of 3462 landslide polygons, including information on landslide length and area.
-
The multi-temporal landslide inventory for a study area in southern Kyrgyz Republic derived from RapidEye satellite time series data (2009–2013) (Behling et al., 2014, 2016; Behling and Roessner, 2020) includes 1582 landslide polygons mapped from multi-sensor optical satellite time series data (from 1986 to 2013) over an area of 2500 km2 in the Fergana Valley rim in southern Kyrgyz Republic and includes information on landslide activity (area and year of trigger).
-
The Tajikistan landslide database was produced by the Institute of Water Problems, Hydropower, Engineering and Ecology of Tajikistan (IWPHE), with 2710 landslide polygons and 114 landslide-prone areas, including information on landslide length and area.
-
The Institute of Seismology of the Academy of Sciences of Uzbekistan (ISASUZ) provided an inventory which covers the Tashkent Province and is composed of a point inventory (Niyazov, 2020) and a polygon inventory (345 landslide) digitized from the maps in Juliev et al. (2017).
The methodology adopted to obtain the maps of damming susceptibility, derived from Tacconi Stefanelli et al. (2020), is summarized in the following main steps displayed in Fig. 5. According to the literature (Swanson et al., 1986; Fan et al., 2014, 2020, 2021; Tacconi Stefanelli et al., 2015, 2018), river obstructions occur most of the time within hilly or mountainous areas and especially along steep slopes. Therefore, considering the extension of the study area, in order to reduce the time of elaboration and improve the visualization of the results, in step I of Fig. 5 a series of unnecessary data was removed from the calculations during some preliminary operations. For this reason, rivers that flow in flat areas (with less than 4° slopes) were not considered in the elaborations, since their damming probability is certainly very low with an extremely wide valley width. Additionally, to have maps that are easier to manage and display, the river network was split into consecutive 5 km long river stretches.
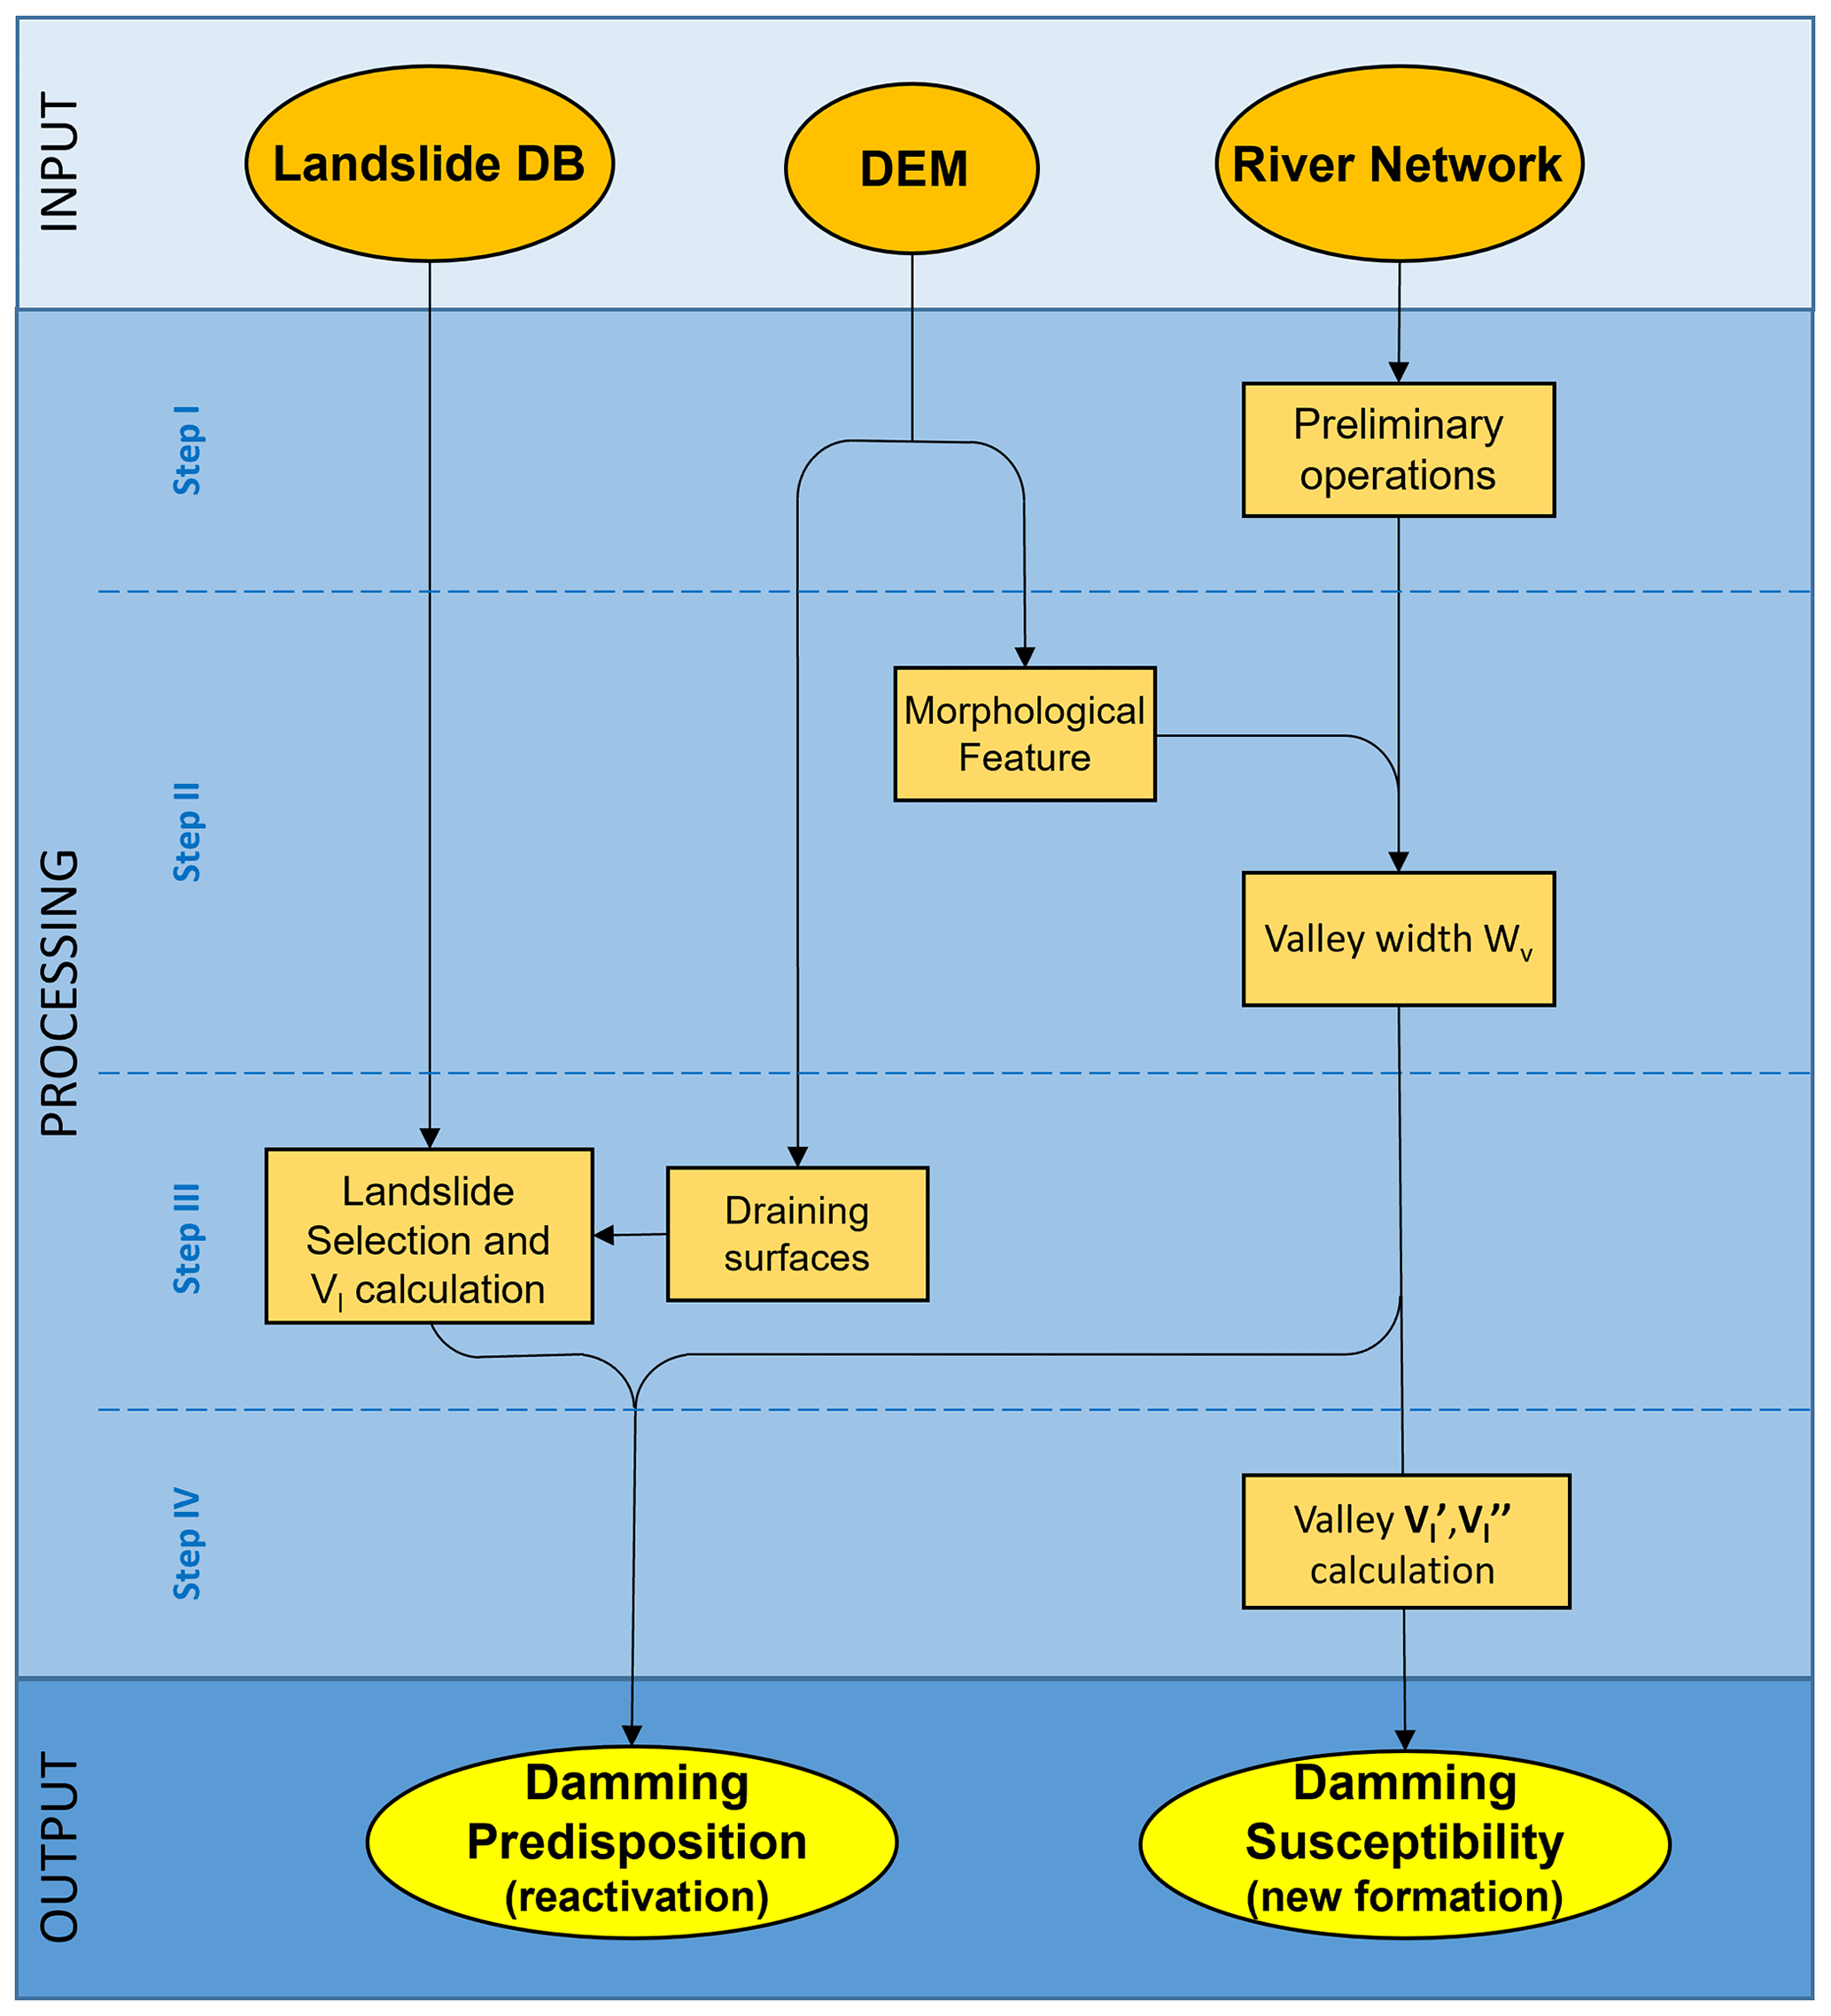
In applied geomorphology and natural science studies, the analysis and characterization of the landscape have evolved during the last few decades with the increasing accessibility of remote sensing data and the development of different algorithms that are able to automatically extract morphological features and landform information even at broad scales (Drăguţ and Dornik, 2016; Maxwell and Shobe, 2022; Righini and Surian, 2018; Wang et al., 2010).
As already mentioned, the clear definition of the width of a river can be subjective and its measurement difficult to repeat, especially if performed by different operators. In step II of Fig. 5, an objective automatic method to extract morphometrical parameters has been chosen for this reason as well. Wood (2009) implemented LandSerf software (already incorporated in SAGA GIS and QGIS software), designed to automatically classify landforms from DEMs. Similarly to pattern detection and texture analysis within image processing, the software extracts land-surface parameters (e.g., slope, aspect, and curvature) from DEMs through a multi-scale approach. During the processing, the algorithm performs a classification of the landscape, grouping the landforms with homogeneous morphometric characteristics (pits, channels, peaks, ridges, passes, and planes) as shown in Fig. 6. Thanks to this algorithm of morphological form analysis proposed by Wood (2009), the polygons representing the morphological unit of the river valley can automatically be defined objectively, even in a large area, and extracted.
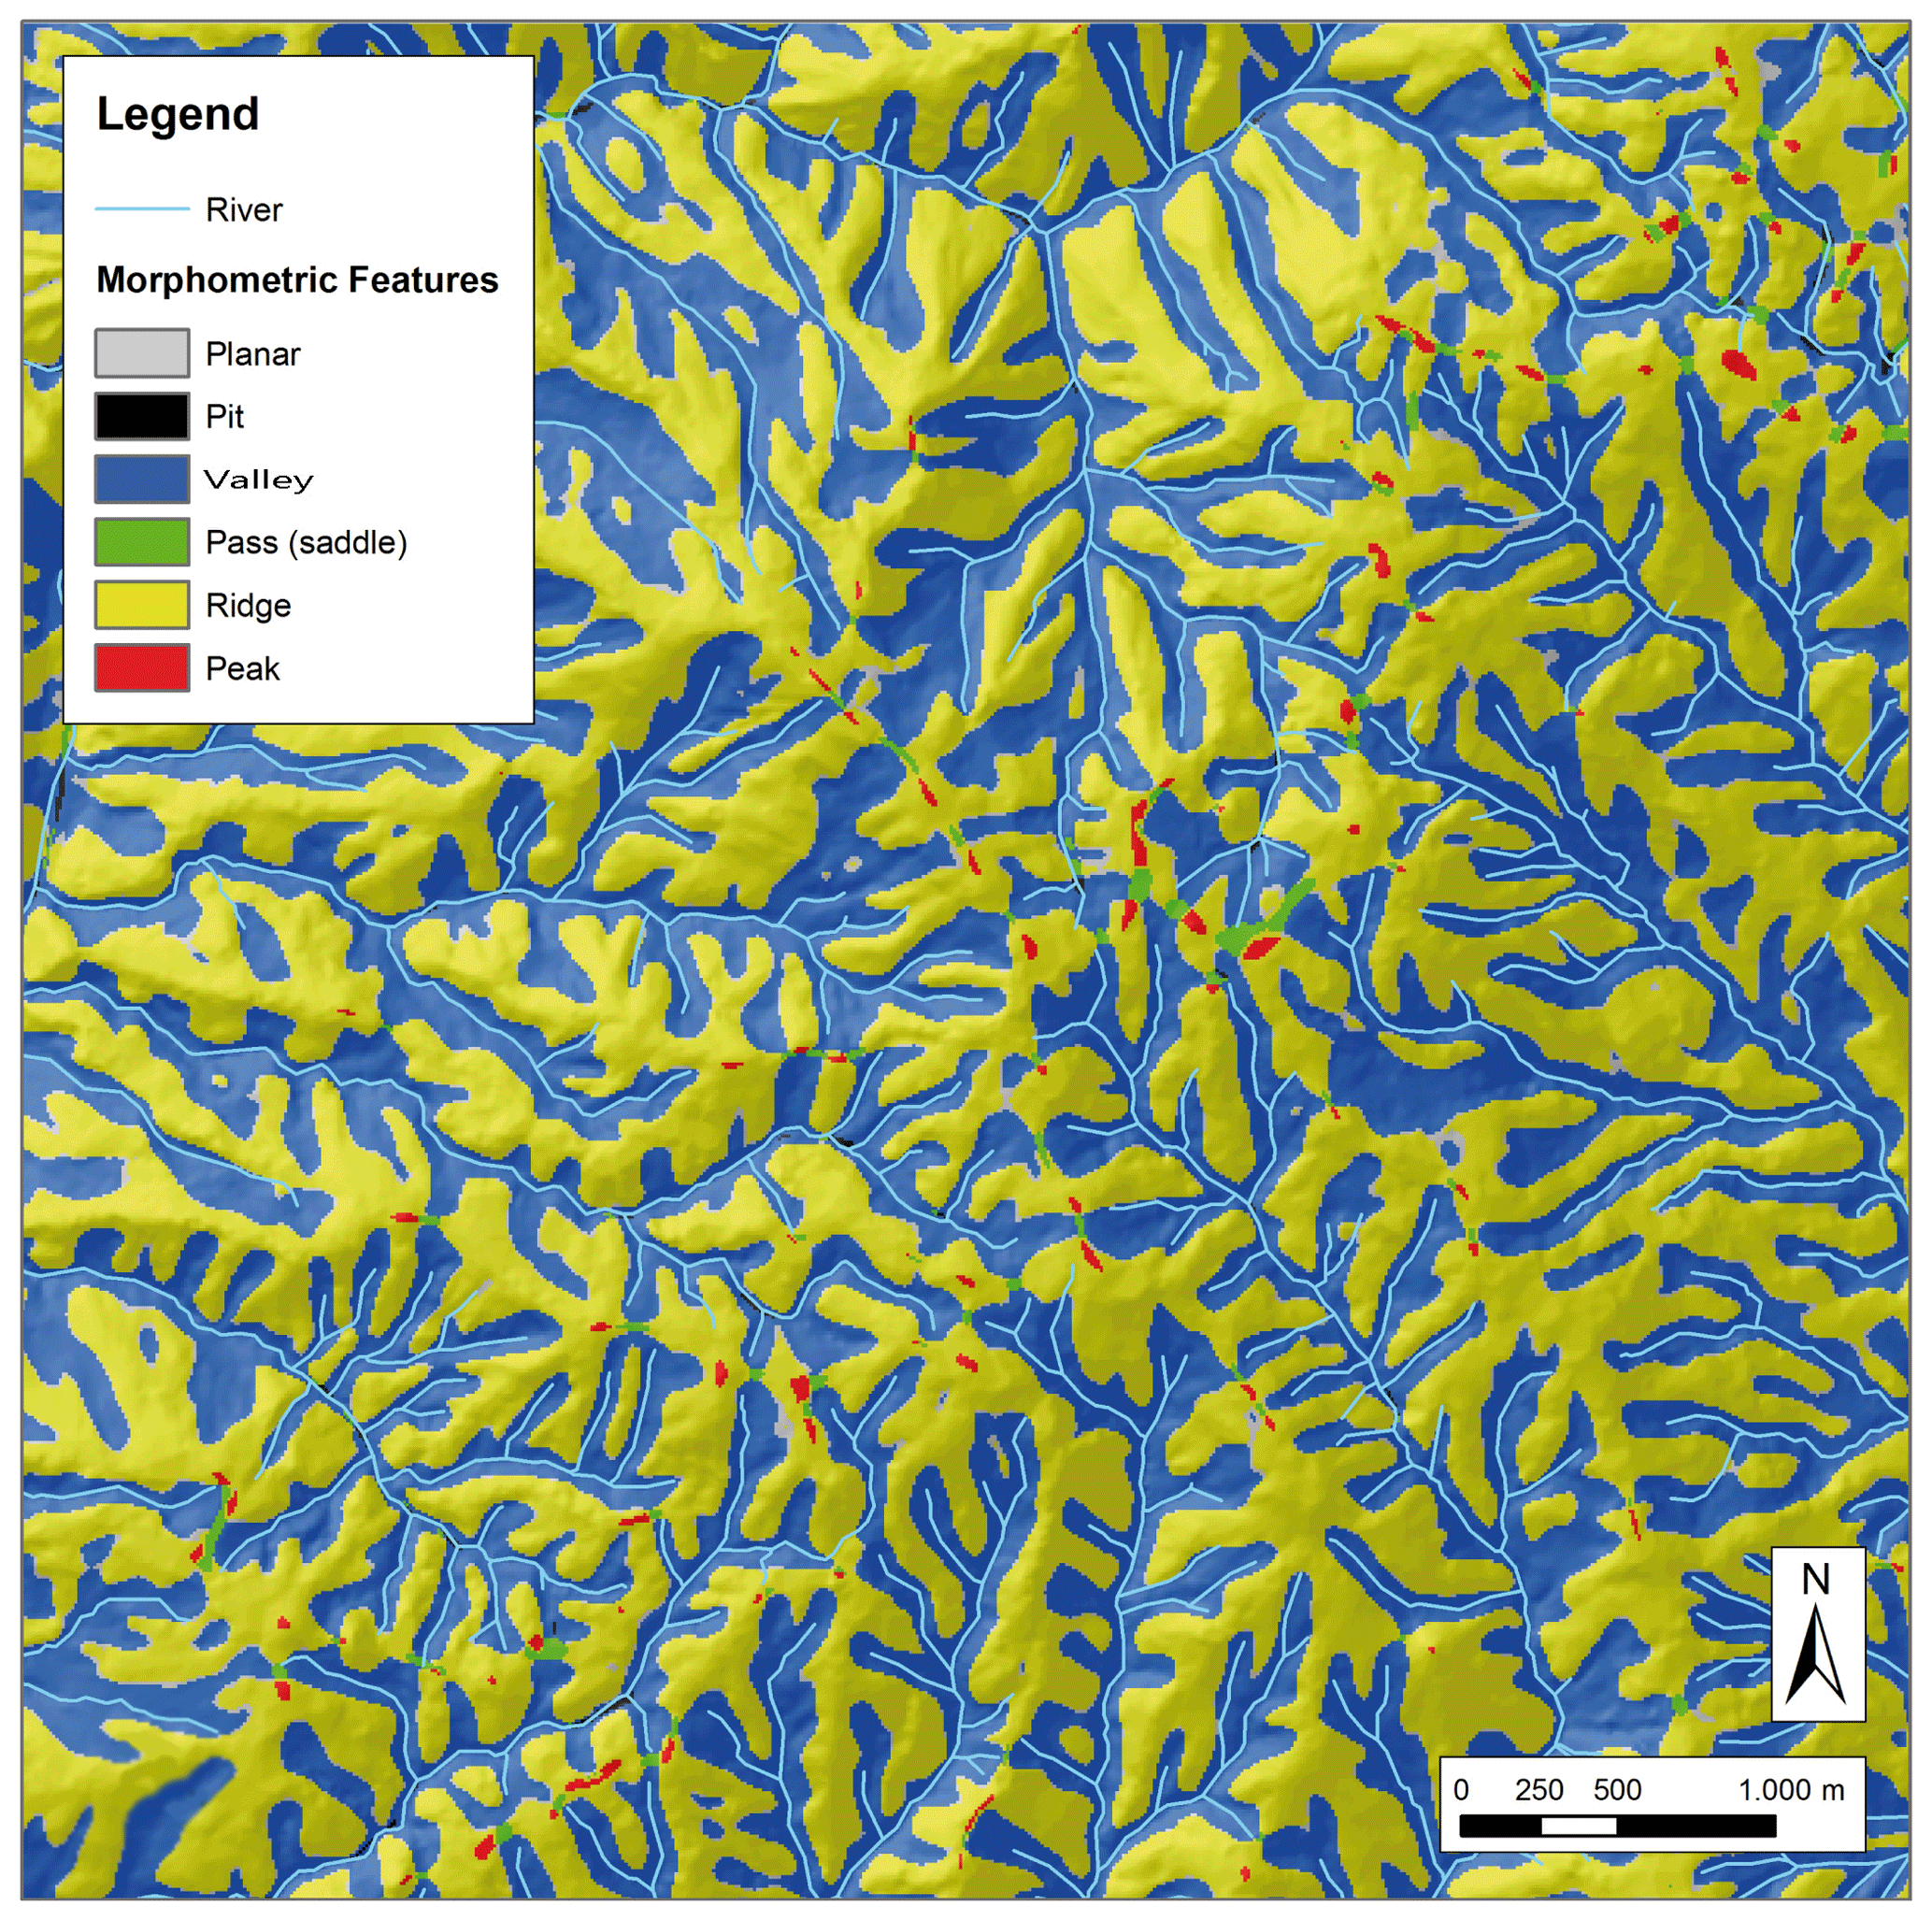
Figure 6Classification of the landscape into morphological classes according to Wood (2009) (modified from Tacconi Stefanelli et al., 2020).
The effectiveness of distinguishing different morphological landforms of this automatic tool is greater in mountainous regions characterized by significant differences in elevation compared to flat areas where distinctions between landforms are less evident. The accuracy of the output is directly correlated with the resolution of the DEM, which should ideally be about a few meters. Coarser resolutions result in landslide volumes with a corresponding level of uncertainty.
The following phase is to provide to each river stretch a value of a valley width, Wv. A series of 1 km long lines (hereafter “transects”) is generated, perpendicular to the stretches of the river network, outdistanced 500 m apart from each other. The created river valley polygons are used to “cut” the transects and then to measure the distance between the two river valley borders through the length of the cut transects.
Next, the valley widths (Wv) for each segment of the river are determined by assigning them an average value based on N perpendicular transects, excluding the extreme values (maximum and minimum, respectively Wmax and Wmin), as in the following equation:
By utilizing an updated database of landslide polygons, in the step III of Fig. 5 it is possible to determine if a reactivated landslide is big enough to cause a complete river blockage thanks to the comparison with the boundary volumes of (below which a landslide cannot completely block the river) and (above which the river valley is certainly dammed). A reactivated landslide should follow a downhill path akin to the flow of surface water. Within each slope, the drainage directions can easily be determined along the river network using GIS software. Each mass movement can then be linked to the corresponding river stretch it would reach if it was reactivated based on their corresponding draining surfaces.
For the purpose of calculating the landslide volumes, the areas of the landslide polygons were chosen as input data, since it is the most common data within the heterogeneous inventories. An experimental statistical relationship between areas and volumes was applied:
where Vl and Al are the volume and the area of a landslide respectively, and ε and α are respectively the constant and the exponent of the power law describing the landslide volume frequency distribution. Various experimental relations of ε and α have been employed for landslide volume calculations by researchers located in different countries. After an evaluation of these relations in the study area, the parameter proposed by Guzzetti et al. (2009) has been selected because of the number of the studied cases (667) and the magnitude range of the landslide area investigated (from 101 to 109 m2). The landslide volume computed using this procedure is based on some approximations, since they use geometric simplifications, but it does still reflect the magnitude of the process. The result of the computation in Fig. 7 shows an almost-bimodal distribution, in which most landslides (83 %) have moderate volumes, lower than 10 million m3 (with 63 % lower than 1 million m3), but 4 % have values higher than 100 million m3.
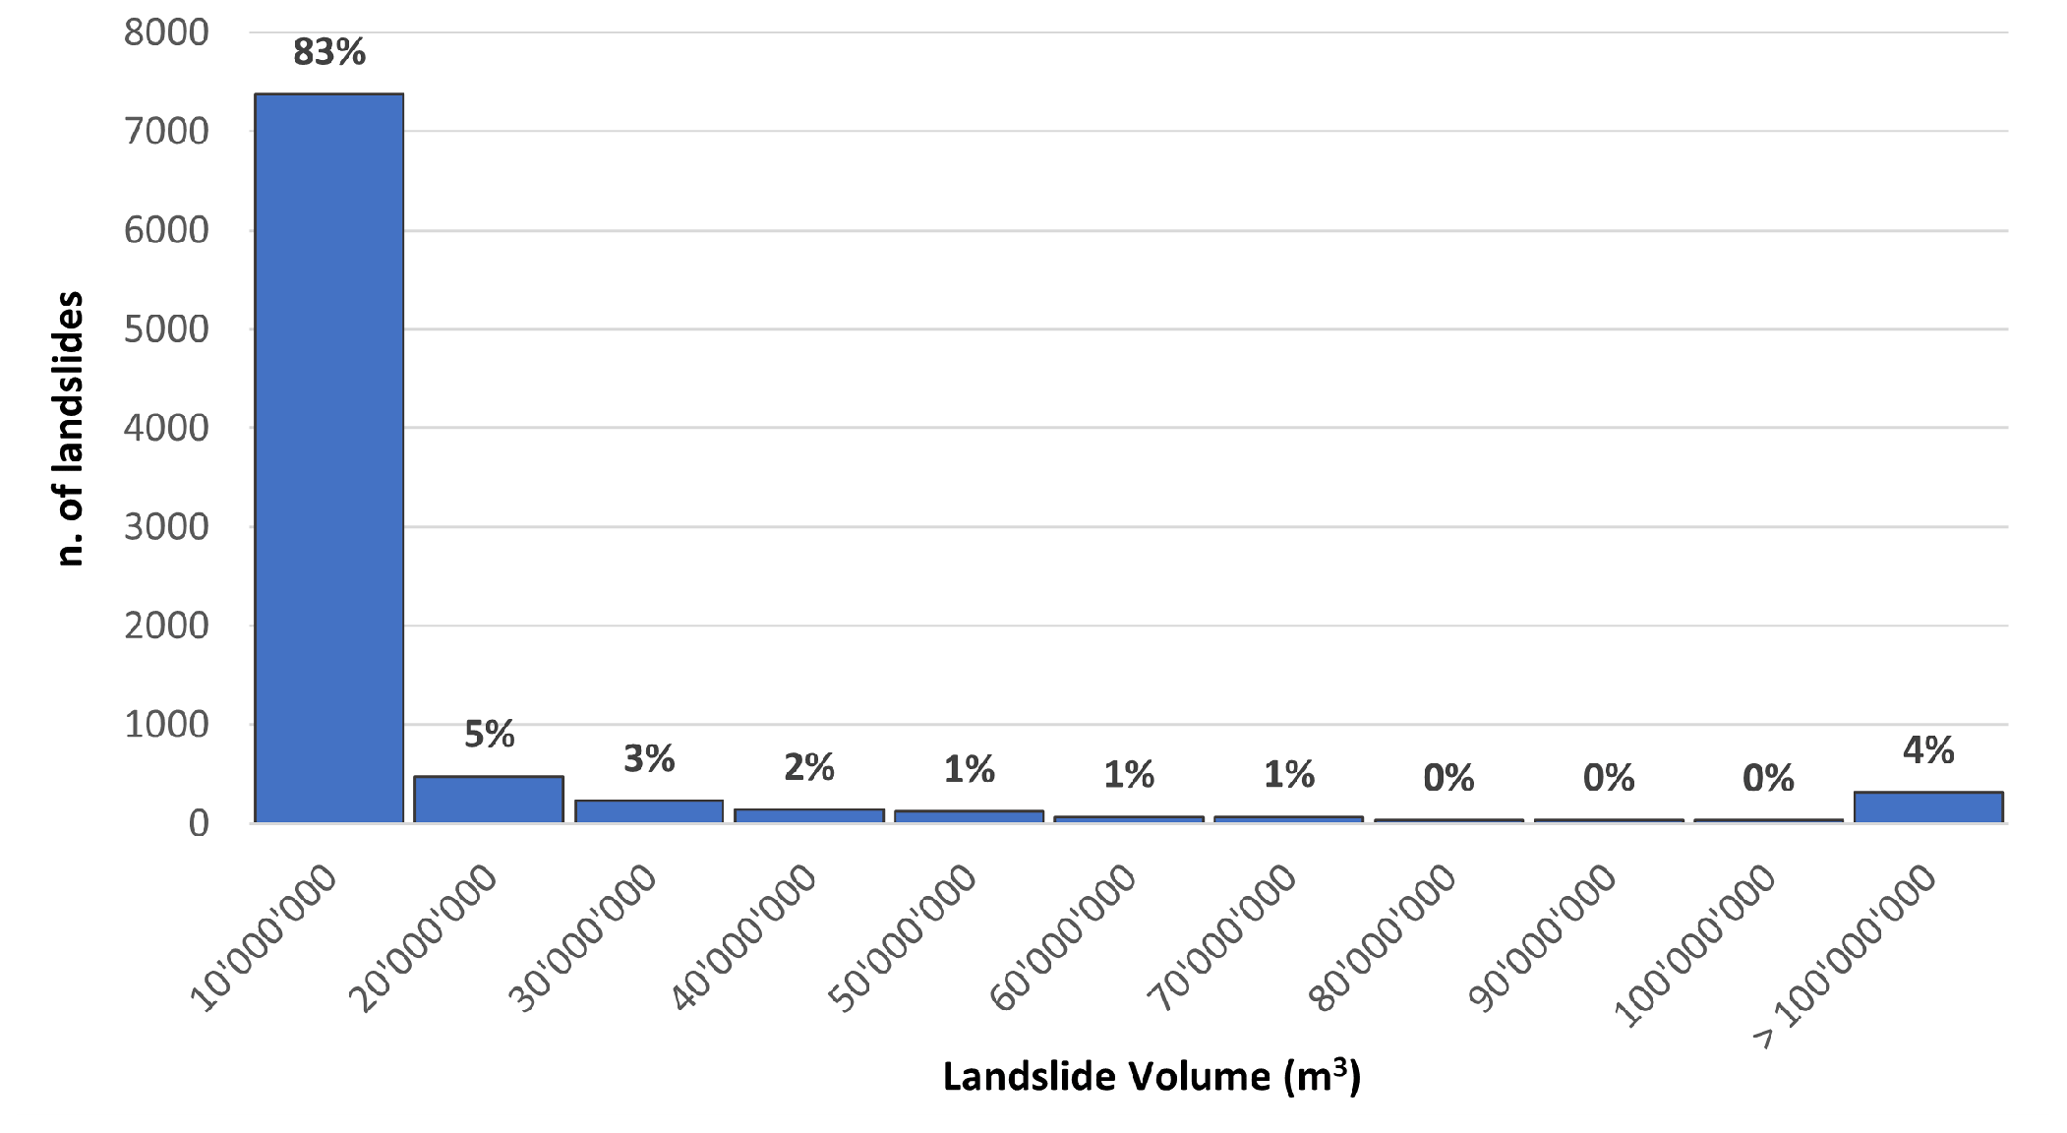
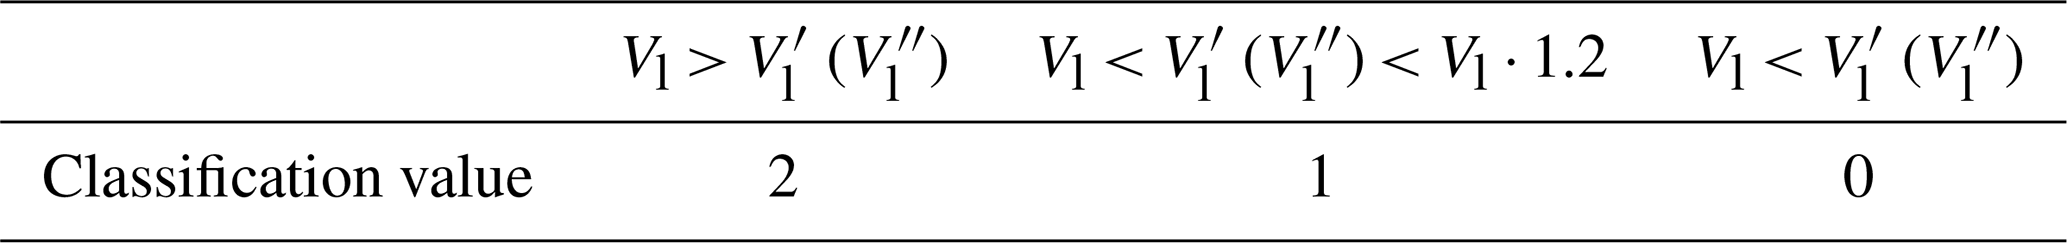
Table 1 is used to assign a classification to each landslide of the inventory based on the comparison with the boundary volumes and , with a value of 2 if the calculated landslide volume, Vl, is bigger than (or ) or 0 if it is smaller. To be more cautious, the Vl values are increased by an arbitrary value of 20 % (Vl ⋅ 1.2) to avoid any potential underestimation during volume estimation and even the possible increase in landslide size with the reactivation due to the mechanism of material entrainment (Hungr and Evans, 2004). For each landslide, if the computed boundary volume (or ) is bigger than the estimated landslide volume Vl but smaller than Vl ⋅ 1.2, then a classification value of 1 is attributed.
Table 1Comparison table between the landslide calculated volume, Vl, with the boundary volume of non-formation and formation, and (after Tacconi Stefanelli et al., 2020).
The damming susceptibility of each mapped landslide is assigned by integrating the two comparative classification values from the intensity matrix illustrated in Fig. 8. The matrix establishes five qualitative classes on a scale of severity for damming susceptibility, ranging from very low (dark green) to low (light green), moderate (yellow), high (orange), and very high (red). The combination of a high value (1 or 2) and a lower value (0 or 1) symbolized by gray squares is not possible according to their respective formulations.
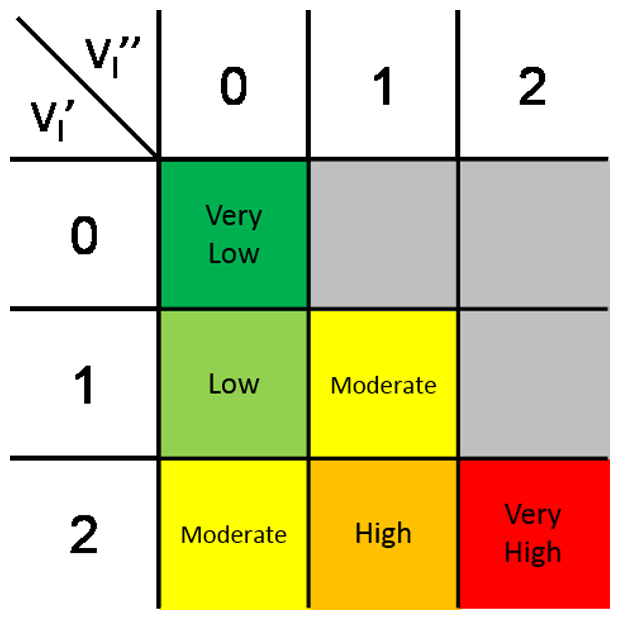
Figure 8Predisposition matrix used for the assignment of the damming predisposition intensity to the mapped landslides (adapted from Tacconi Stefanelli et al., 2020).
Even if the proposed method is objective, it is certainly not free from uncertainties and errors. The 20 % increase applied to mapped landslide volumes to reduce underestimation errors can in turn produce false positives for overestimation errors. While a false positive is preferable to a false negative (according to the principle of prudence), too many high-risk false positive cases can “spread” an unreal risk throughout the area instead of concentrating it in sites of real risk. Therefore, it can be assumed that the landslide bodies which have previously reached the valley floor have already generated most of their effect on the river network (Strom, 2010) or have had no effect, spending their potential risk component. These landslides, also with a volume higher than and and therefore classified with very high dam predisposition, even if reactivated probably will not produce any further effect in the future. For these reasons, it was decided to downgrade the classification of the landslides that intersect the river network by reducing its position of the classification of damming predisposition by one class.
Using the Wv value for each river stretch estimated during step III of Fig. 5, in the last step (IV) the two boundary landslide volumes, namely the non-formation volume and formation volume ( and ), can be estimated by applying the equations of the non-formation (Eq. 2) and formation lines (Eq. 3). These two values can be used to classify the damming susceptibility of both the river network (for new landslides) and the landslide inventory (for their reactivation). For the first case, the computed volume values and embody the required volumes of a new landslide to have a potential or certain (with 99 % confidence) obstruction for each river stretch.
The mapping methodology was applied to all the studied territories of the Central Asia region in order to analyze and evaluate the results. Two smaller basins, the upper Pskem River and the Fergana Valley, were selected to verify the reliability at a catchment scale of the results obtained from a methodology applied on a national scale. The assessment of damming predisposition on the available landslide inventory in the Central Asia regions is shown in the map of Fig. 9, while closer details are reported in Fig. 10 showing the Kyrgyz Republic territory. The number of landslides (644 cases) classified as having a very high damming predisposition from the whole inventory before the class reduction due to the river intersection was unjustifiably and unreasonably large, posing excessive concern and risk perception. After the change, this number decreased by 75 % to up to 166 cases, a high number but more reasonable concerning such a large area. In the class distribution of the damming predisposition, the most frequent class is the very low class, with 81 % of the whole database classified as having very low predisposition, followed by the low and high classes, both with 6 %, and the remaining percentage divided among moderate (5 %) and very high (2 %) classes.
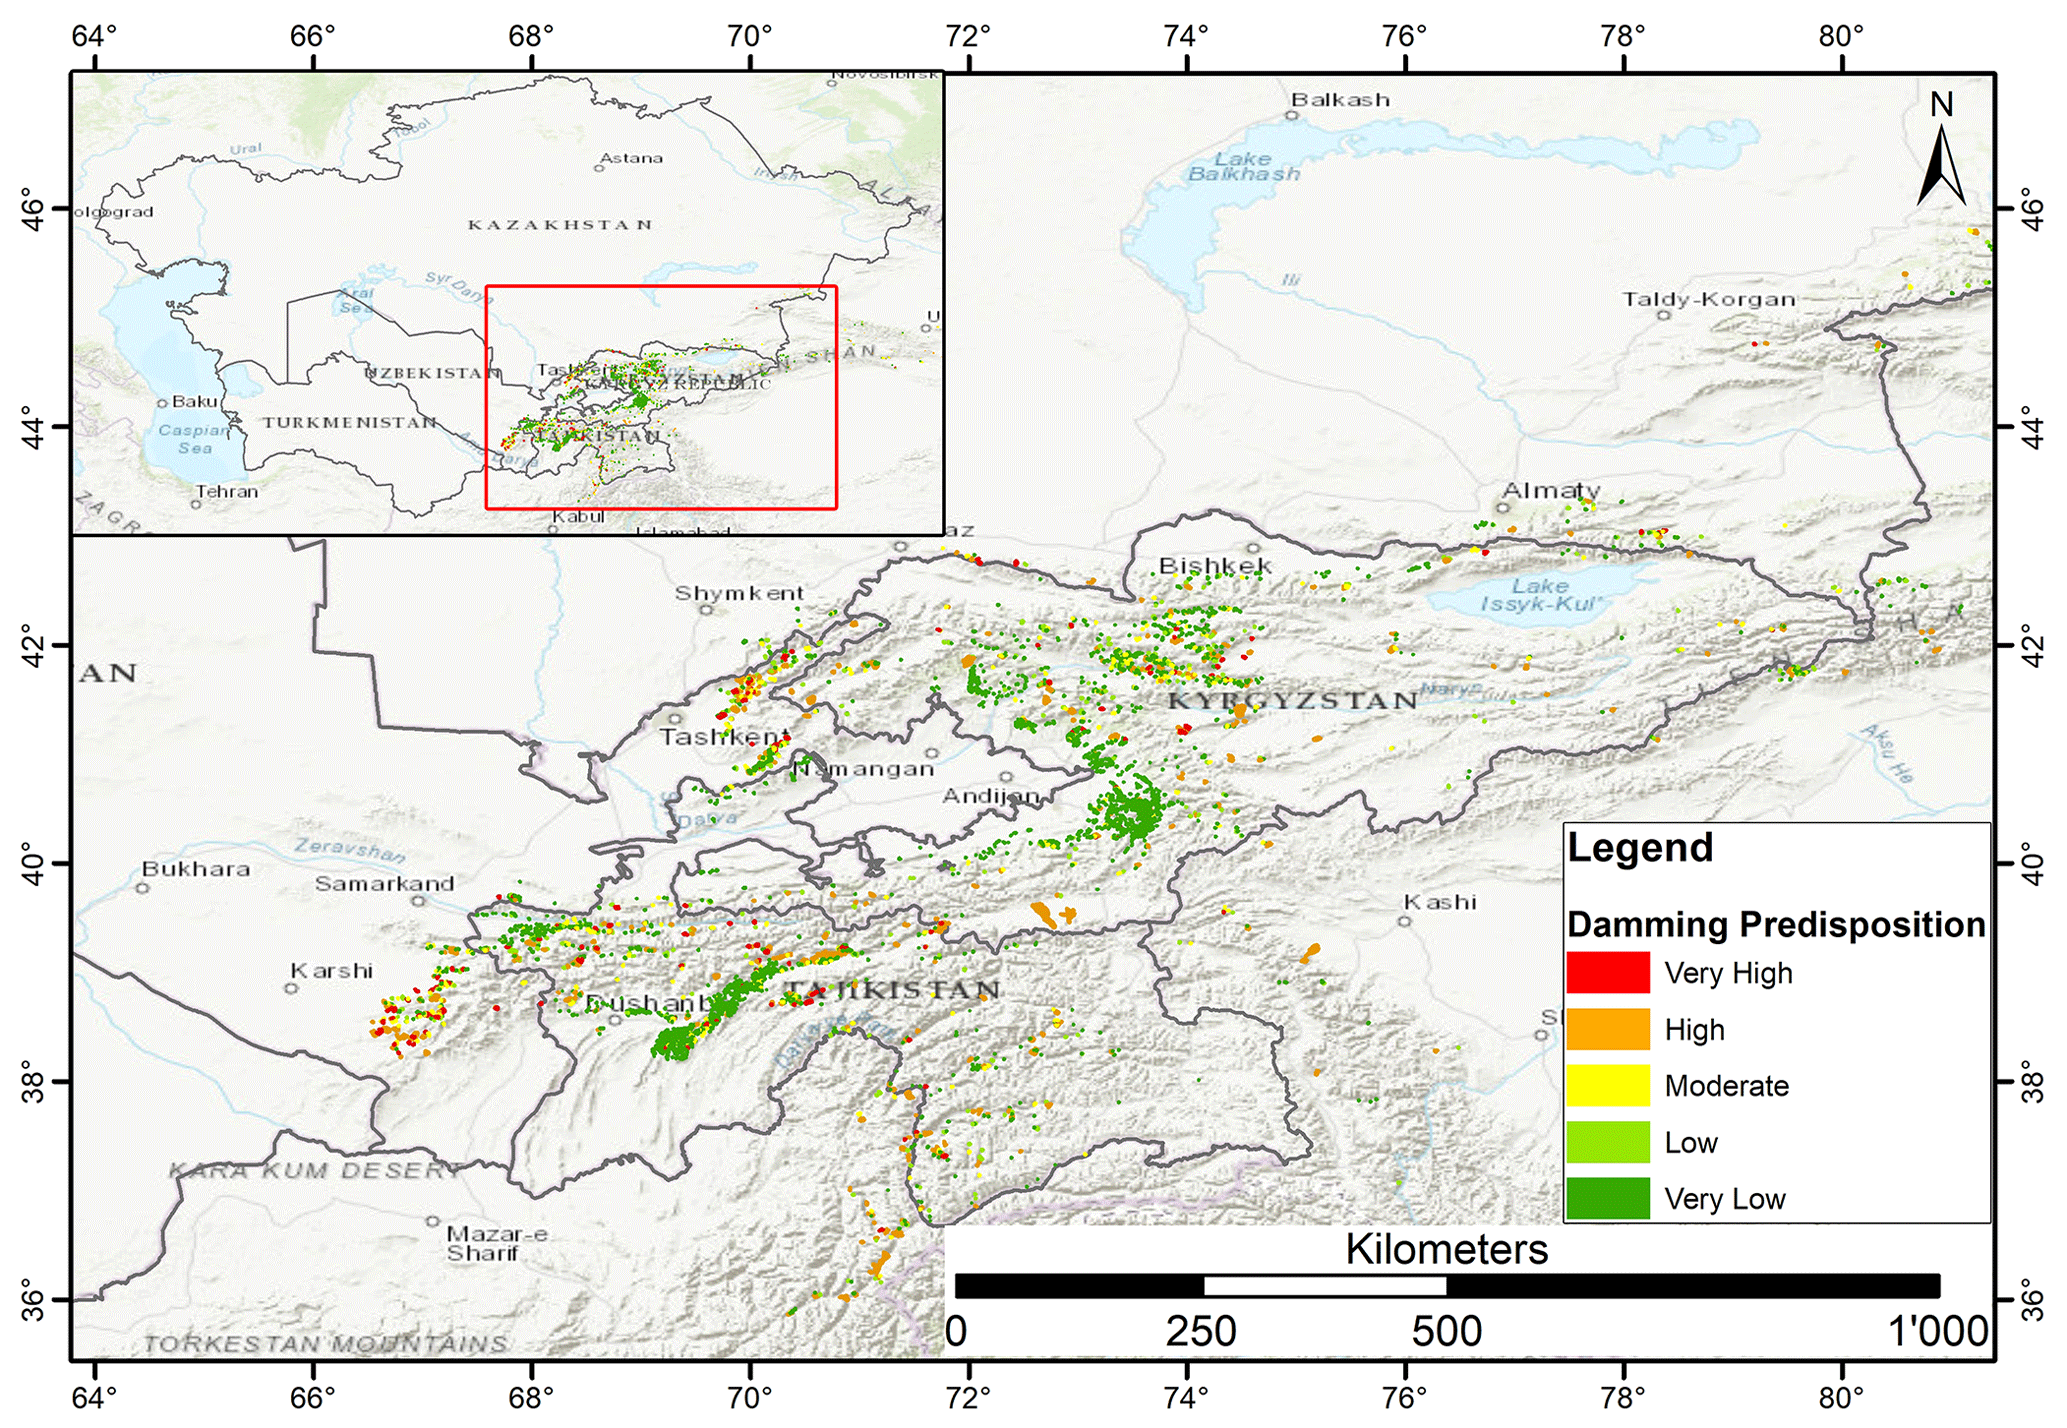
Figure 9Map of Central Asia landslide damming predisposition. Basemap sources: Esri, HERE, Garmin Intermap, Increment P Corp, GEBCO, USGS, FAO, NPS, NRCAN, GeoBase, IGN, Kadaster NL, Ordnance Survey, Esri Japan, METI, Esri China (Hong Kong), © OpenStreetMap contributors, and the GIS user community. OpenStreetMap contributors 2023. Distributed under the Open Data Commons Open Database License (ODbL) v1.0.
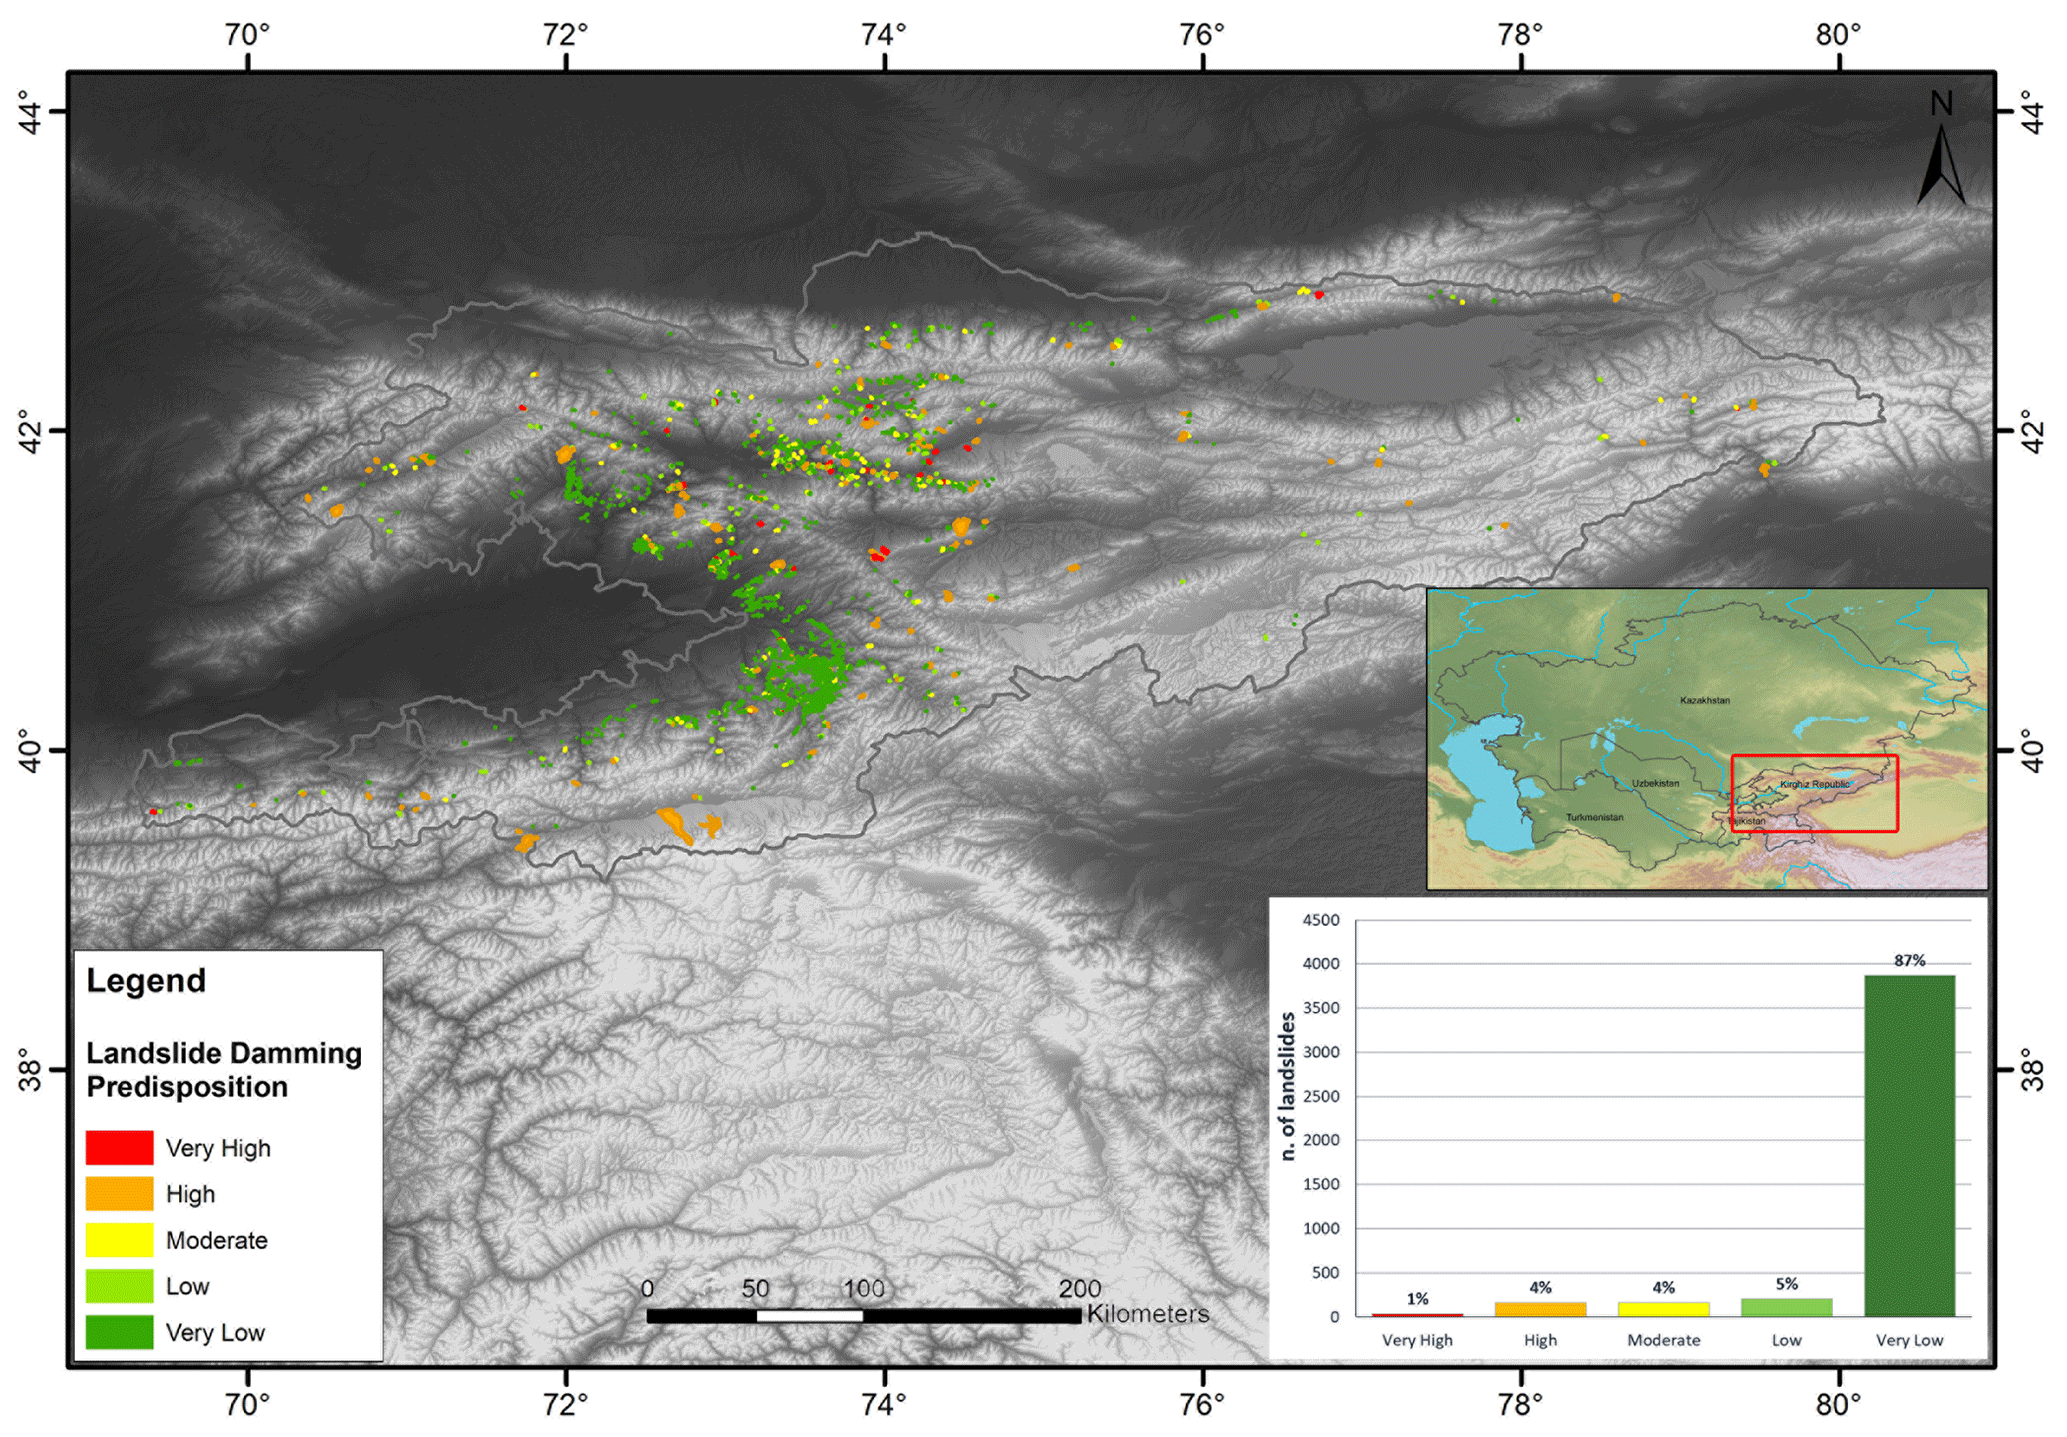
Figure 10Map of damming predisposition by landslide reactivation in the Kyrgyz Republic territory. The topographic base is from NASA's SRTM project (Farr and Kobrick, 2000).
This distribution is in fair agreement with the landslide volume frequency distribution since it is reasonable to associate landslides with a very low volume (83 %, shown in Fig. 7) with those classified as having a very low susceptibility (81 %). The landslides classified as having higher values of susceptibility (moderate, high, and very high with a total of 13 %) instead do not only include landslides with higher volumes (more than 100 million m3, representing 4 % of the total), meaning that even smaller landslides can potentially block narrow river stretches in these regions.
Concerning the damming susceptibility caused by new landslides along all the river networks in the study area, two different maps of the river networks have been produced using the non-formation and formation volume values. Although counterintuitive at first glance, these maps provide complementary information. The former provides the volumes of landslides that surely create an obstruction, while the latter provides the volumes below which landslides definitely do not form. According to the preliminary steps of the described methodology, in the river stretches running in flat areas (slope degree less than 4°, representing 88.4 % of the entire river network), the analysis has not been applied due to the extreme unlikelihood that a complete obstruction will occur in such areas. The magnitude of the damming susceptibility of the river networks has been classified in five classes and is shown in Figs. 11 and 13. The five volume intervals describing damming susceptibility were decided according to the general value distribution of landslide volumes and expert judgment. Since small landslides are more frequent than large ones, as reported in Fig. 7, the lower the landslide volume required to realize an obstruction, the higher the magnitude. In the map of damming susceptibility related to the non-formation, reported in Fig. 11, 88.4 % of the regional river network lie in lowland areas, while moderate and low classes are the most frequent with 4.4 % and 5.8 % respectively. This means that in most of the river stretches in the study area the minimum landslide volume able to potentially dam the riverbed is between the limit values of the two classes, from 2.5 to 25 million m3. The following most frequent class is the very low class, with 0.8 %, and only a very small portion of the river stretches is classified as high and very high, with just 0.4 % and 0.2 %, with a required landslide volume less than 2.5 million m3. An example of a close-up of the Tajikistan territory is reported in Fig. 12.
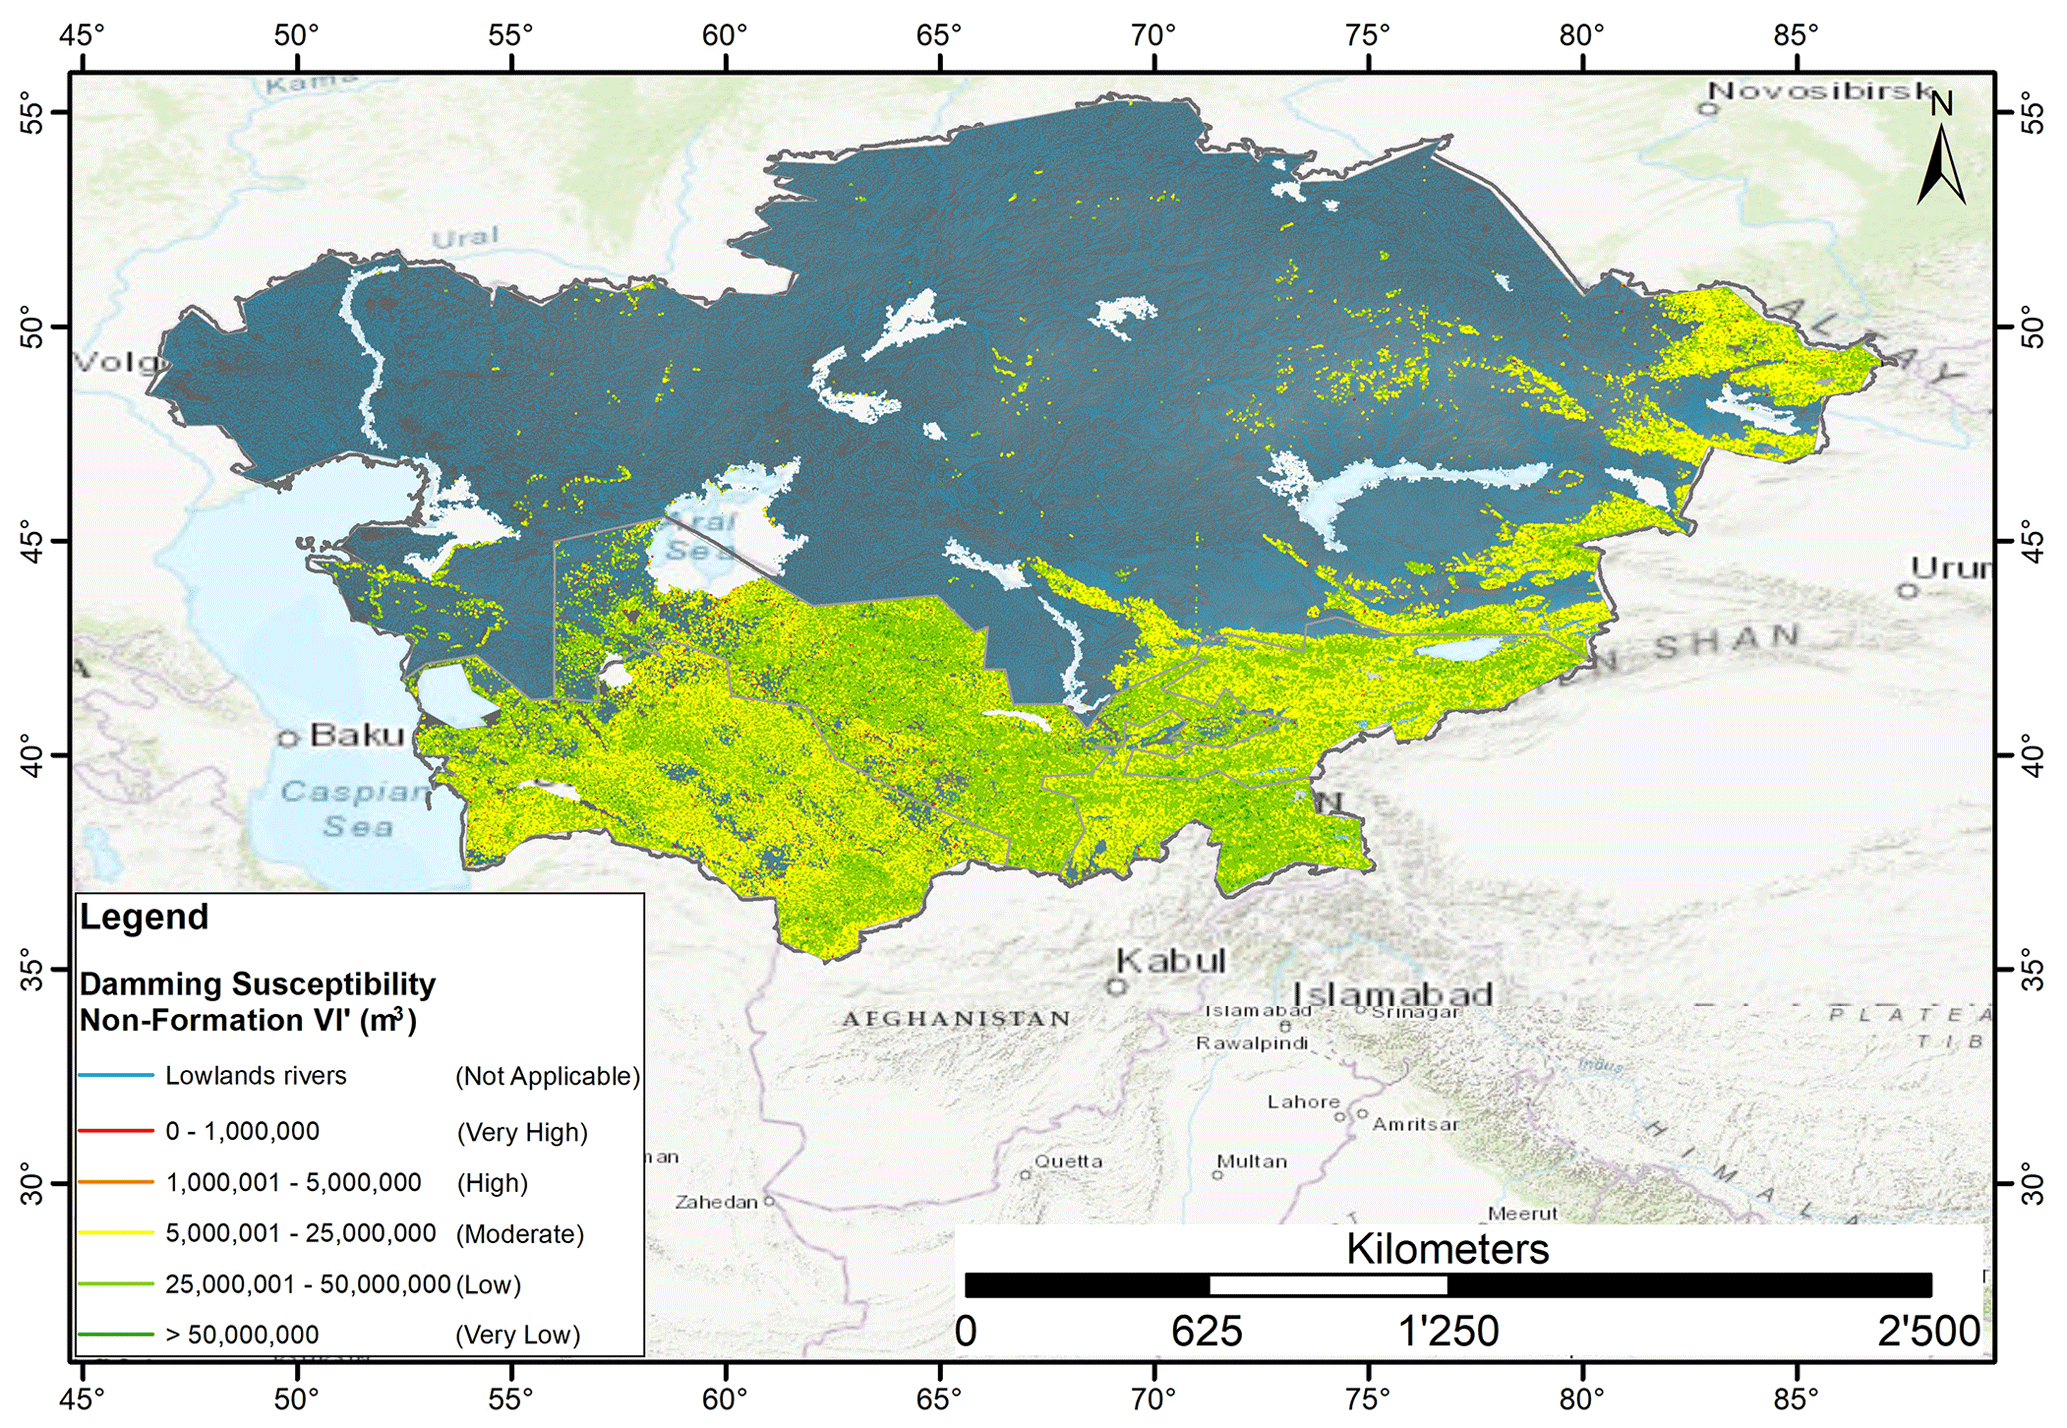
Figure 11Damming susceptibility map of non-formation of river stretches by new landslides in the region. The river network database is from Coccia et al. (2023). Basemap sources: Esri, HERE, Garmin Intermap, Increment P Corp, GEBCO, USGS, FAO, NPS, NRCAN, GeoBase, IGN, Kadaster NL, Ordnance Survey, Esri Japan, METI, Esri China (Hong Kong), ©OpenStreetMap contributors, and the GIS user community. OpenStreetMap contributors 2023. Distributed under the Open Data Commons Open Database License (ODbL) v1.0.
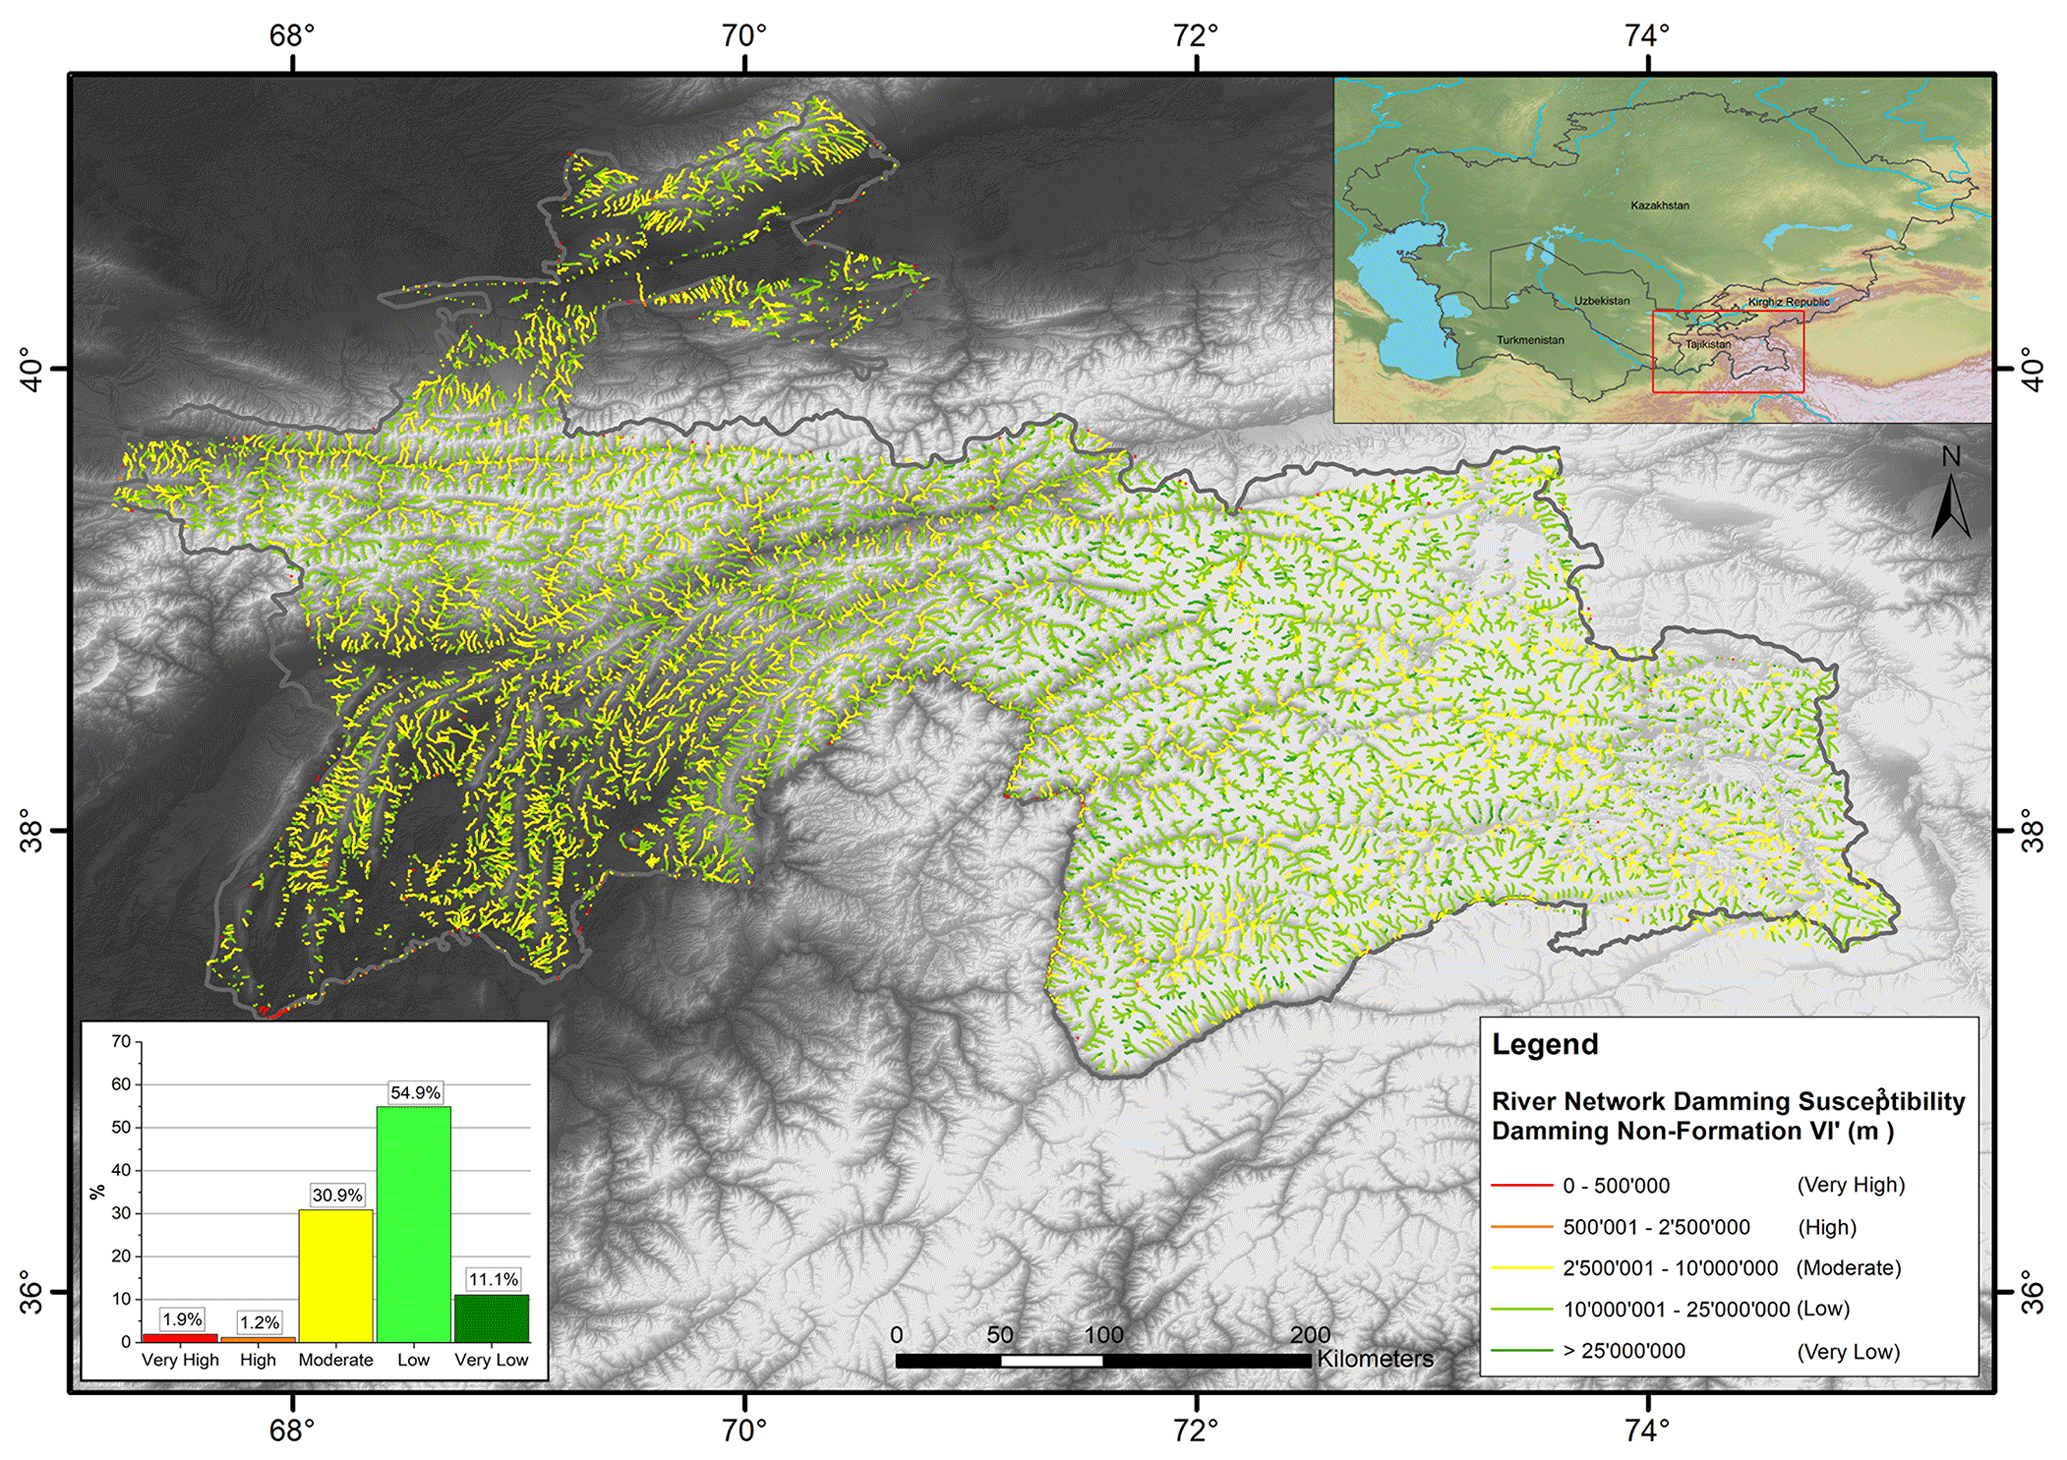
Figure 12Damming susceptibility map of non-formation of river stretches by new landslides in Tajikistan. The river network database is from Coccia et al. (2023). The topographic base is from NASA's SRTM project (Farr and Kobrick, 2000).
Regarding the map of damming susceptibility related to formation values, the map in Fig. 13 shows slightly different results. The most frequent classes are the two lower ones – low and very low – with 4.4 % and 6 % respectively. Only 0.3 % and 0.4 % fall into the very high and high damming susceptibility classes. A close-up of the Kyrgyz Republic is reported in Fig. 14.
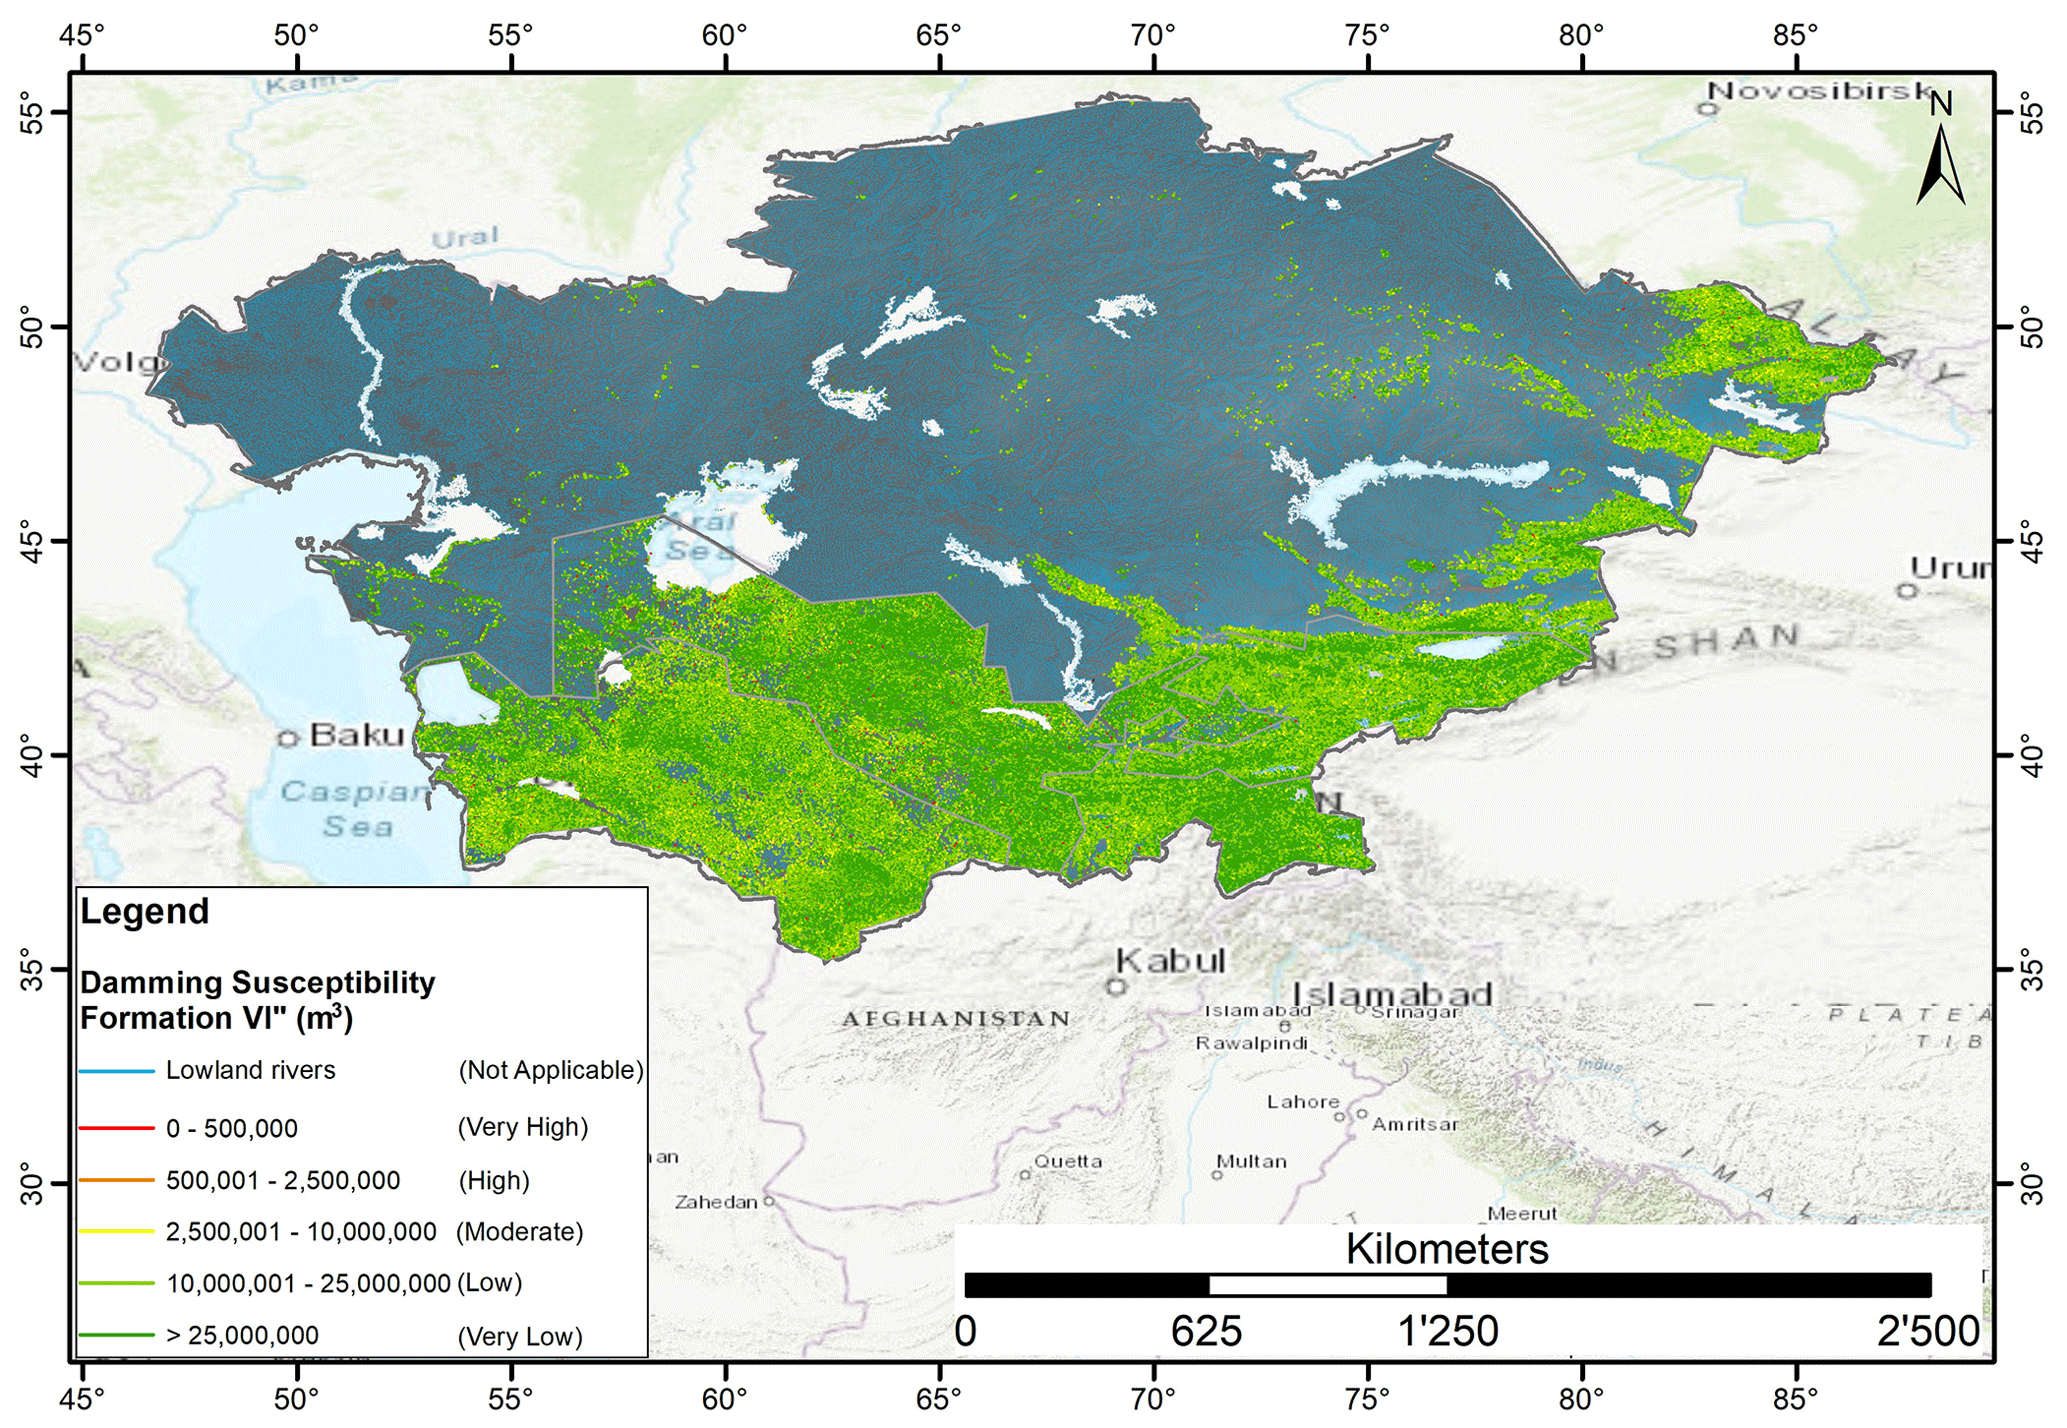
Figure 13Damming susceptibility map of formation of river stretches by new landslides in the region. The river network database is from Coccia et al. (2023). Basemap sources: Esri, HERE, Garmin Intermap, Increment P Corp, GEBCO, USGS, FAO, NPS, NRCAN, GeoBase, IGN, Kadaster NL, Ordnance Survey, Esri Japan, METI, Esri China (Hong Kong), © OpenStreetMap contributors, and the GIS user community. OpenStreetMap contributors 2023. Distributed under the Open Data Commons Open Database License (ODbL) v1.0.
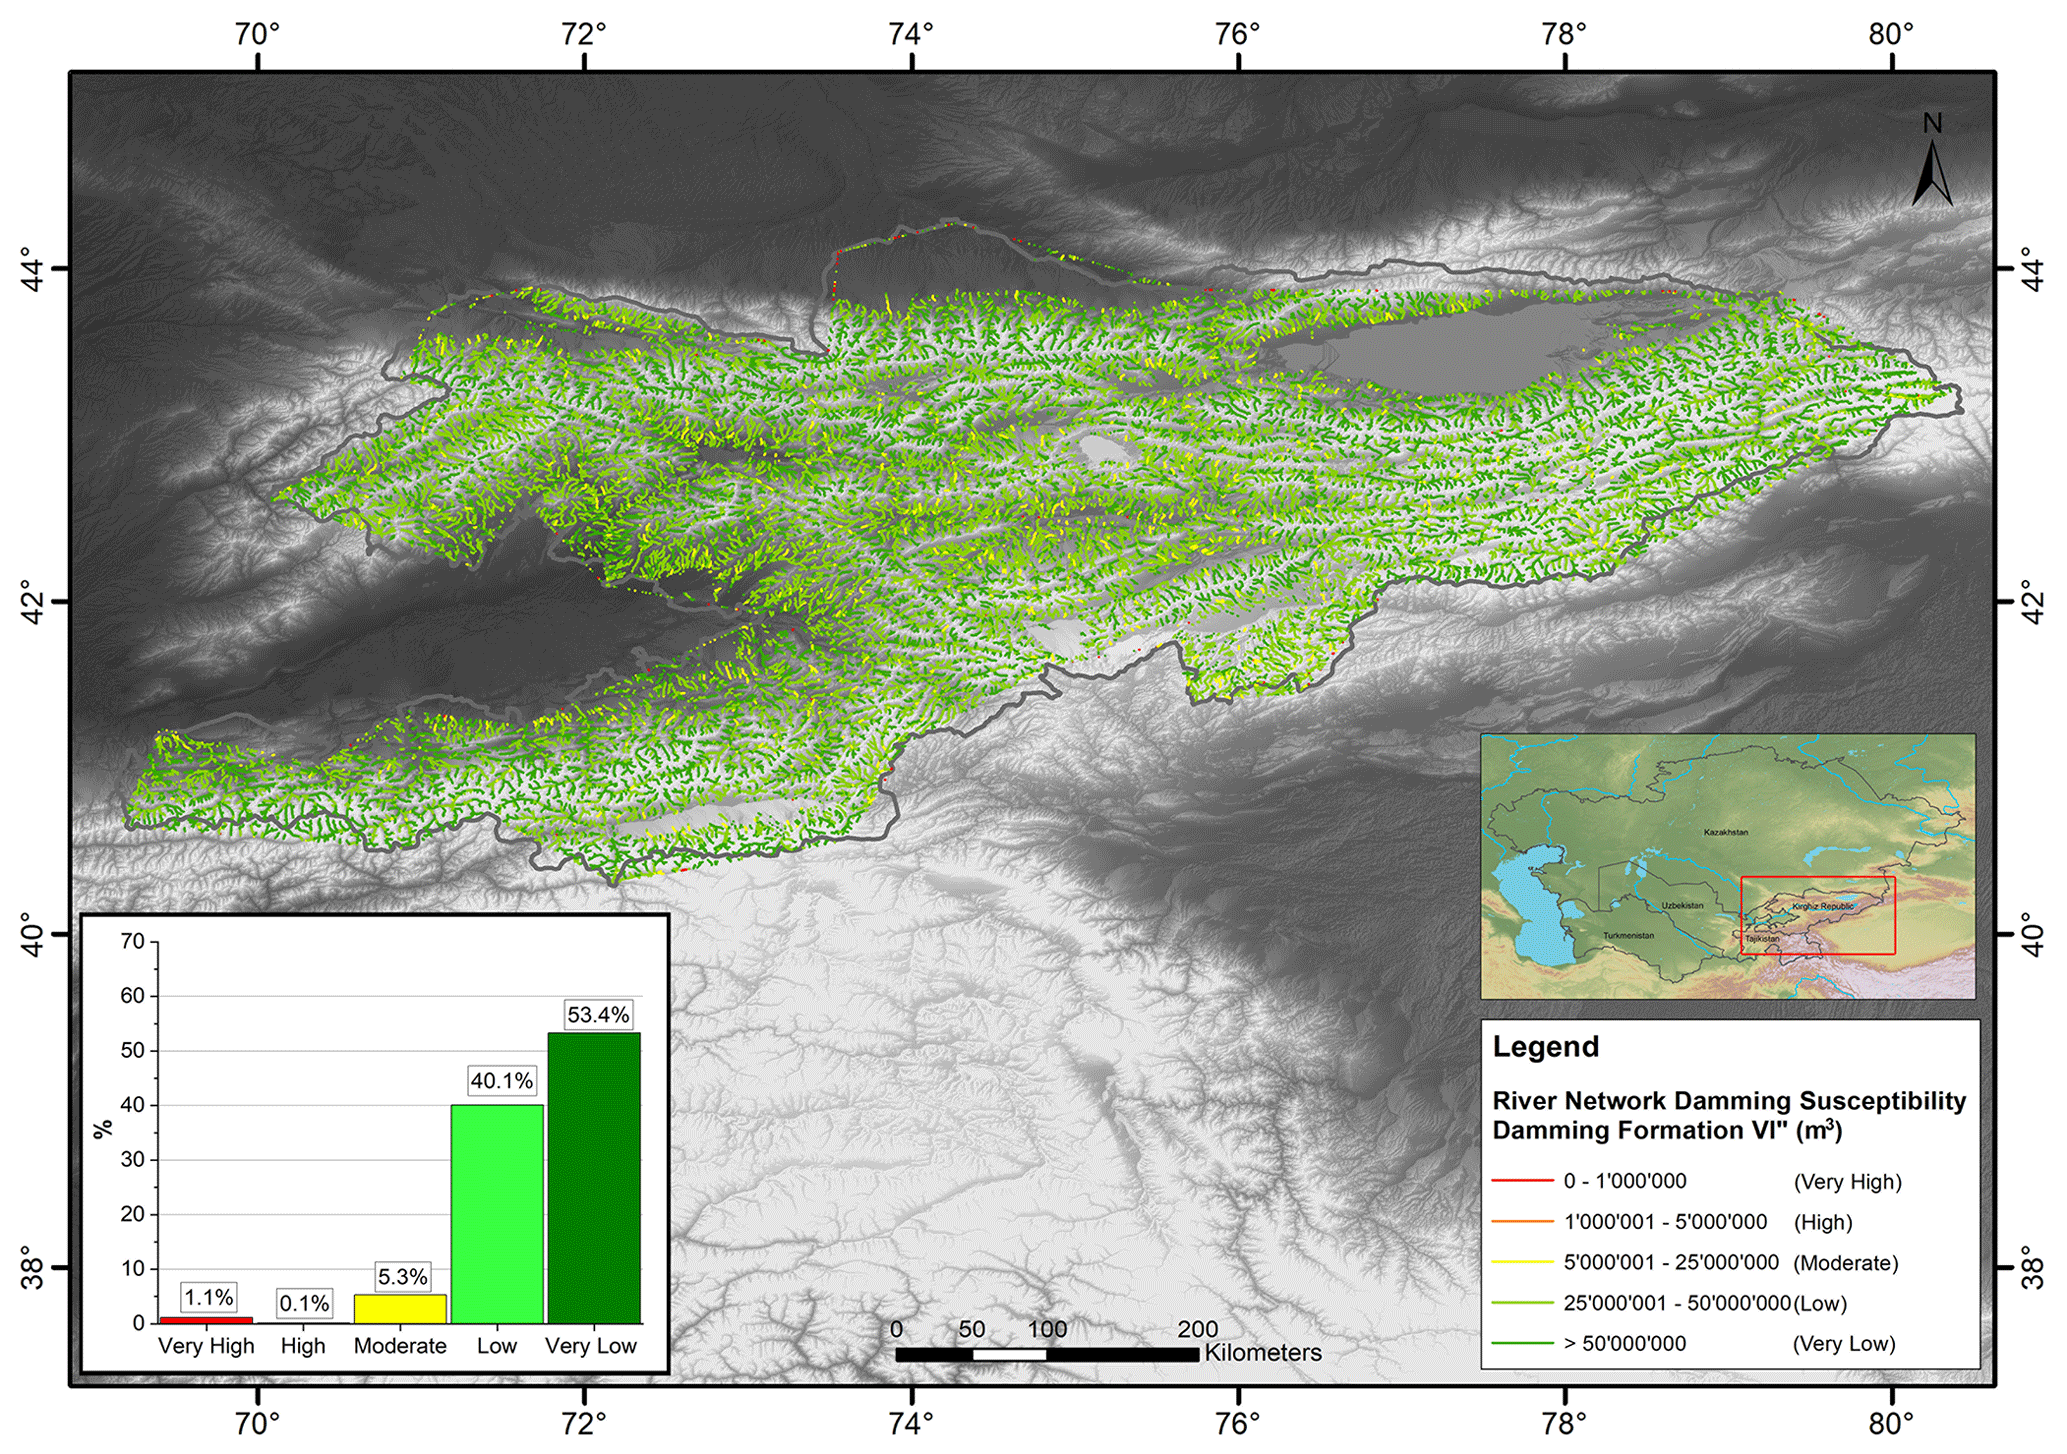
Figure 14Damming susceptibility map of formation of river stretches by new landslides in the Kyrgyz Republic territory. The river network database is from Coccia et al. (2023). The topographic base is from NASA's SRTM project (Farr and Kobrick, 2000).
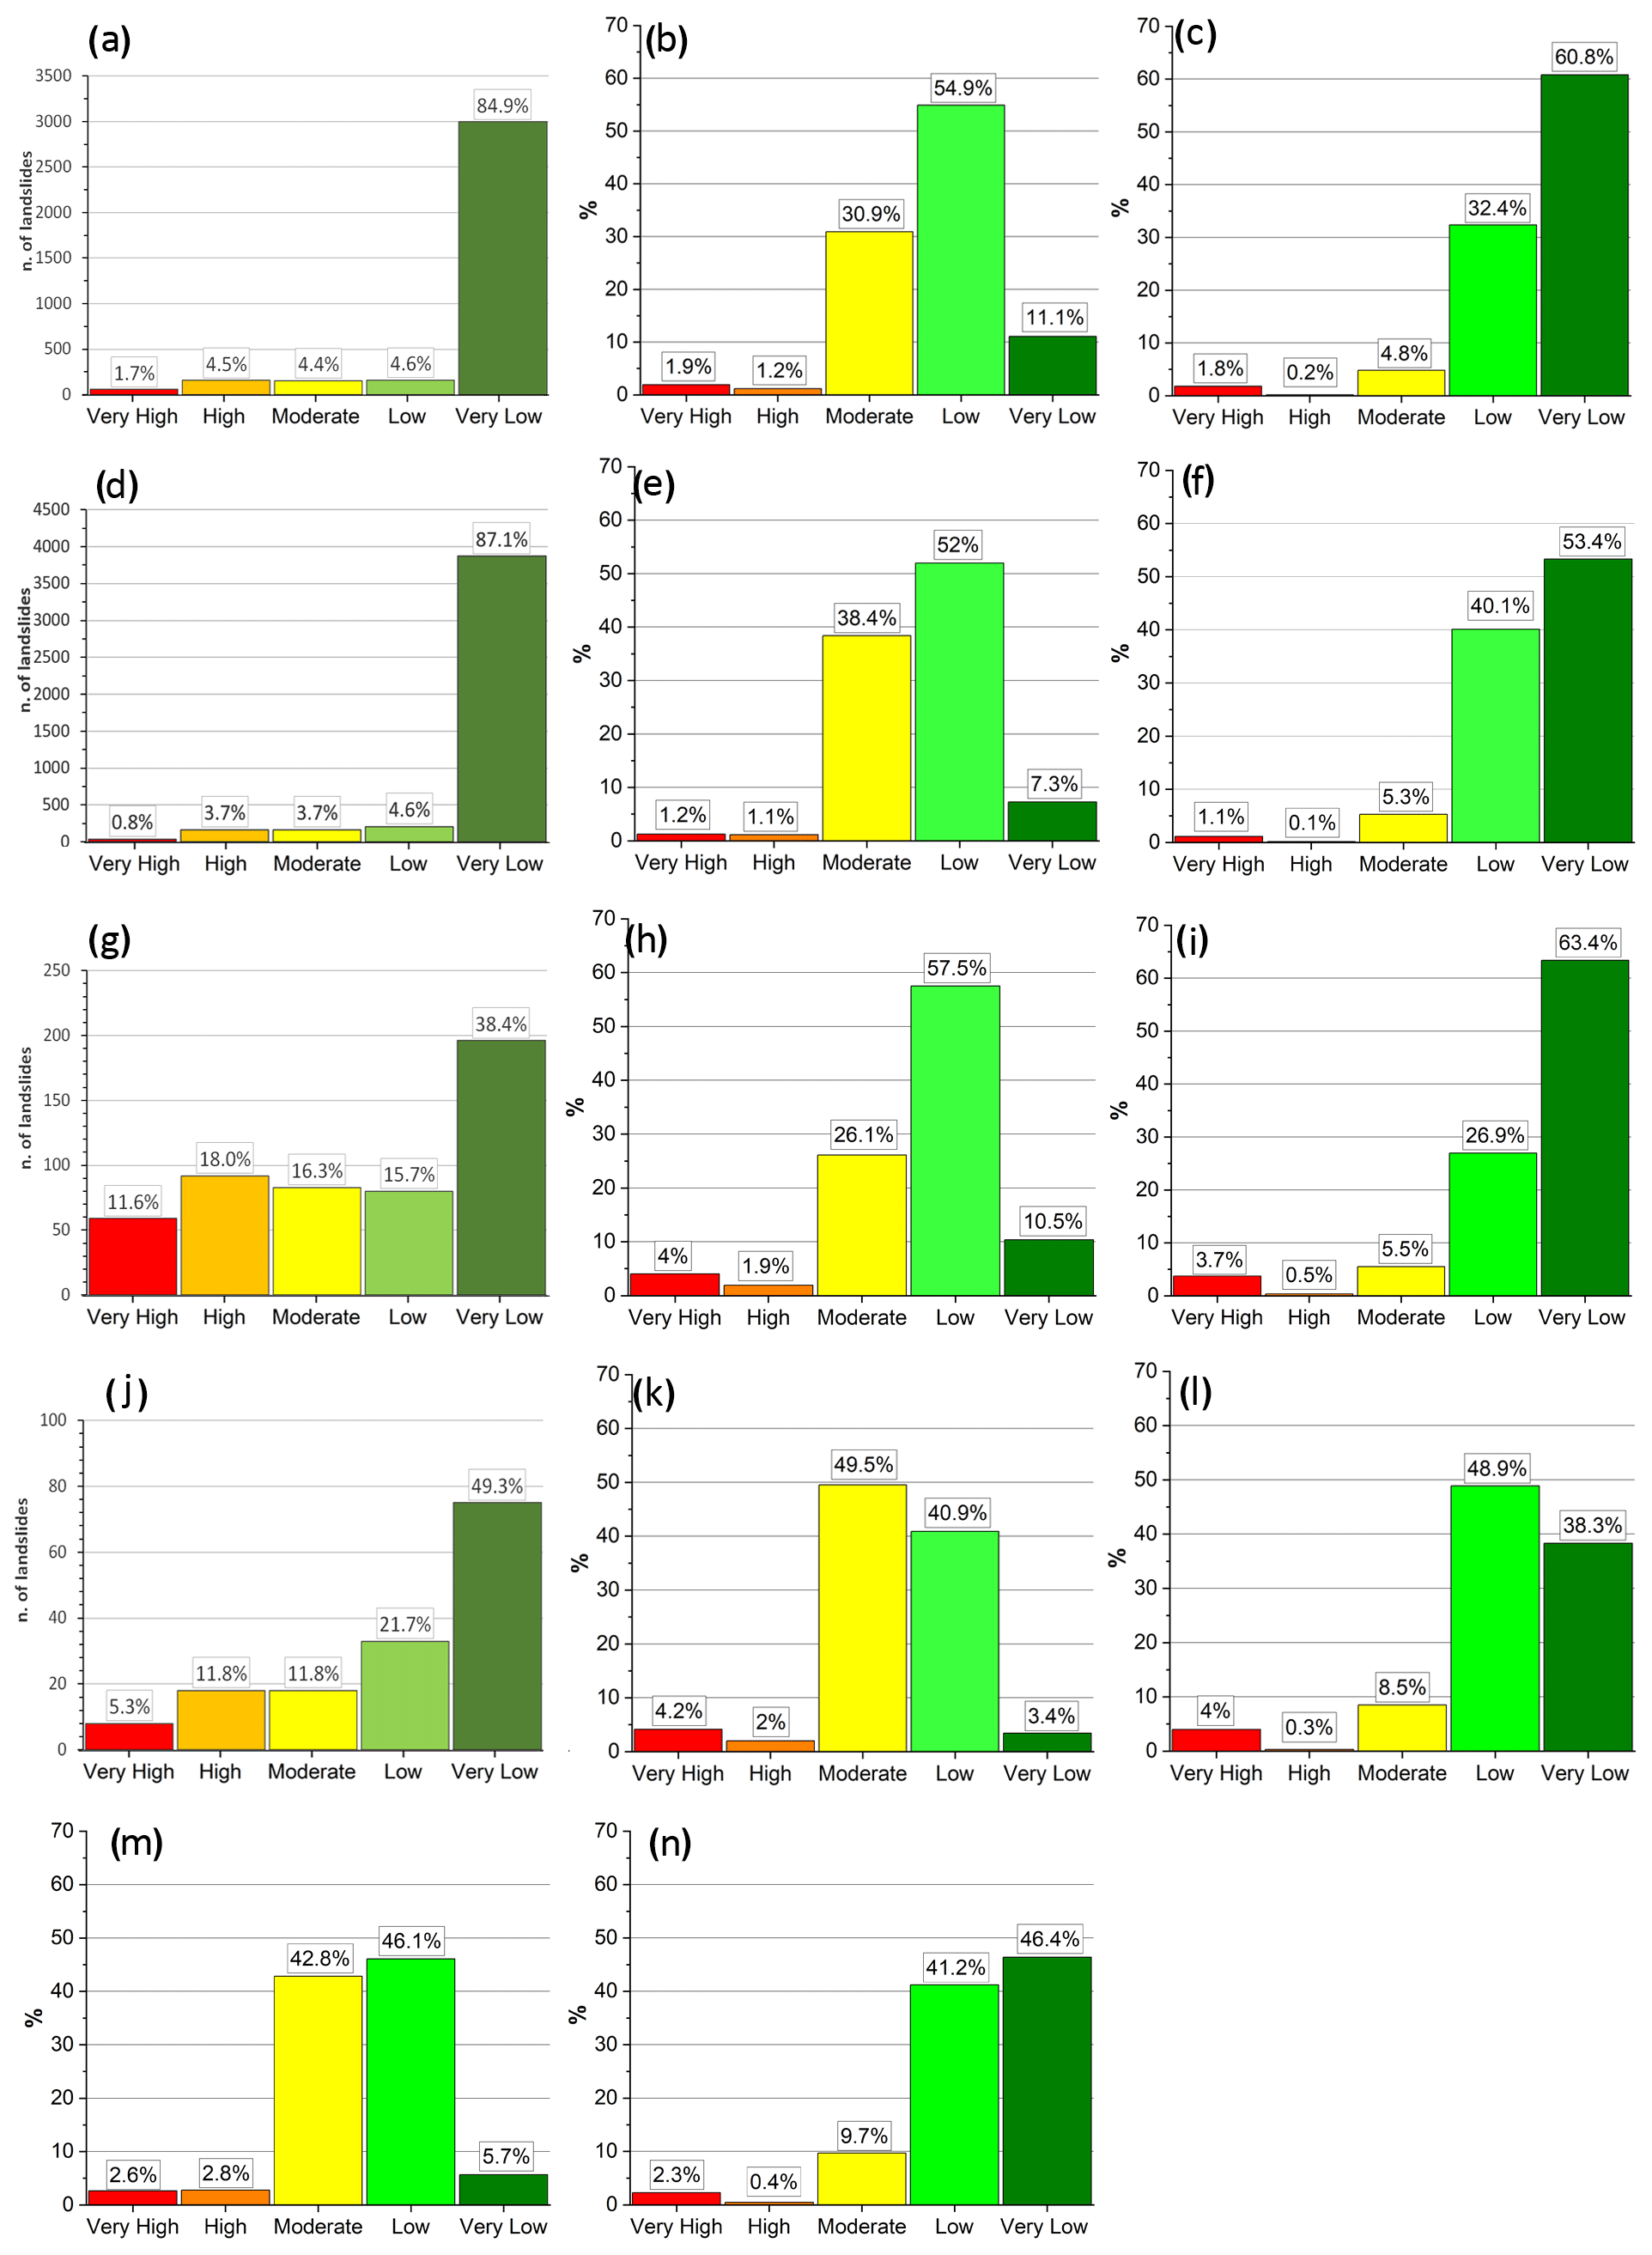
Figure 15Class distributions of the damming predisposition for landslide reactivation and the damming susceptibility of non-formation and formation for new landslides in Tajikistan (a, b, c), Kyrgyz (d, e, f), Uzbekistan (g, h, i), Kazakhstan (j, k, l), and Turkmenistan (m, n).
The results of the classification for the river networks of each state are shown in Fig. 15. The landslides of the Tajikistan, Kyrgyz Republic, Uzbekistan, and Kazakhstan regions have been classified according to damming predisposition (Fig. 15a, d, g, and j). In the Turkmenistan territory, it was not possible to assess any damming predisposition by landslide reactivation due to the absence of any available landslide inventories. The results of the Uzbekistan and Kazakhstan regions (Fig. 15g and j) are slightly different from the Kyrgyz Republic and Tajikistan regions due to the different availability of landslide inventories and a different orographic and valley morphology of the former national territories. As already mentioned, for a clearer comprehension of the damming susceptibility classification of the river network at the national level, the river stretches flowing in lowlands have not been considered in the analysis. Concerning the damming susceptibility of non-formation (Fig. 15b, e, h, k, and m), the most frequent classes are low and moderate, followed by the very low class. Fortunately, only very few river stretches have been classified as having very high and high susceptibility. For the damming susceptibility of formation (Fig. 15c, f, i, l, and n), most of the rivers fall into very low and low classes, followed by the moderate class. In this case as well, only very few river stretches have been classified as having very high and high susceptibility. The results of the Tajikistan territory are quite similar to the Kyrgyz Republic and Uzbekistan with which it shares a similar orographic distribution and morphology of the territory. Turkmenistan and Kazakhstan show a slightly different distribution, with a higher percentage of the moderate class in the damming susceptibility of non-formation and low class in the damming susceptibility of formation.
4.1 Upper Pskem River valley (Uzbekistan)
The Pskem River, located in the Tashkent region of Uzbekistan, is a right-hand tributary of the Chirchik River that is the feeder of the Syr Darya River basin (in the western Tien Shan). The river originates from the confluence of the Maidantal and Oygaing rivers and is one of the main tributaries of the Charvak Lake (Semakova et al., 2016). This artificial lake is central to the local economy due to its function as a reservoir for fishing and water as well as a source of hydroelectric energy. Because of this, various villages have been established around the lake and downstream of it. The formation of a natural obstruction and an upstream impoundment in the Pskem Basin could be a serious threat due to the possible instability of the earthfill dam and the possible catastrophic cascade effects that its collapse could have downstream on the artificial basins and their 168 m high earthfill dam.
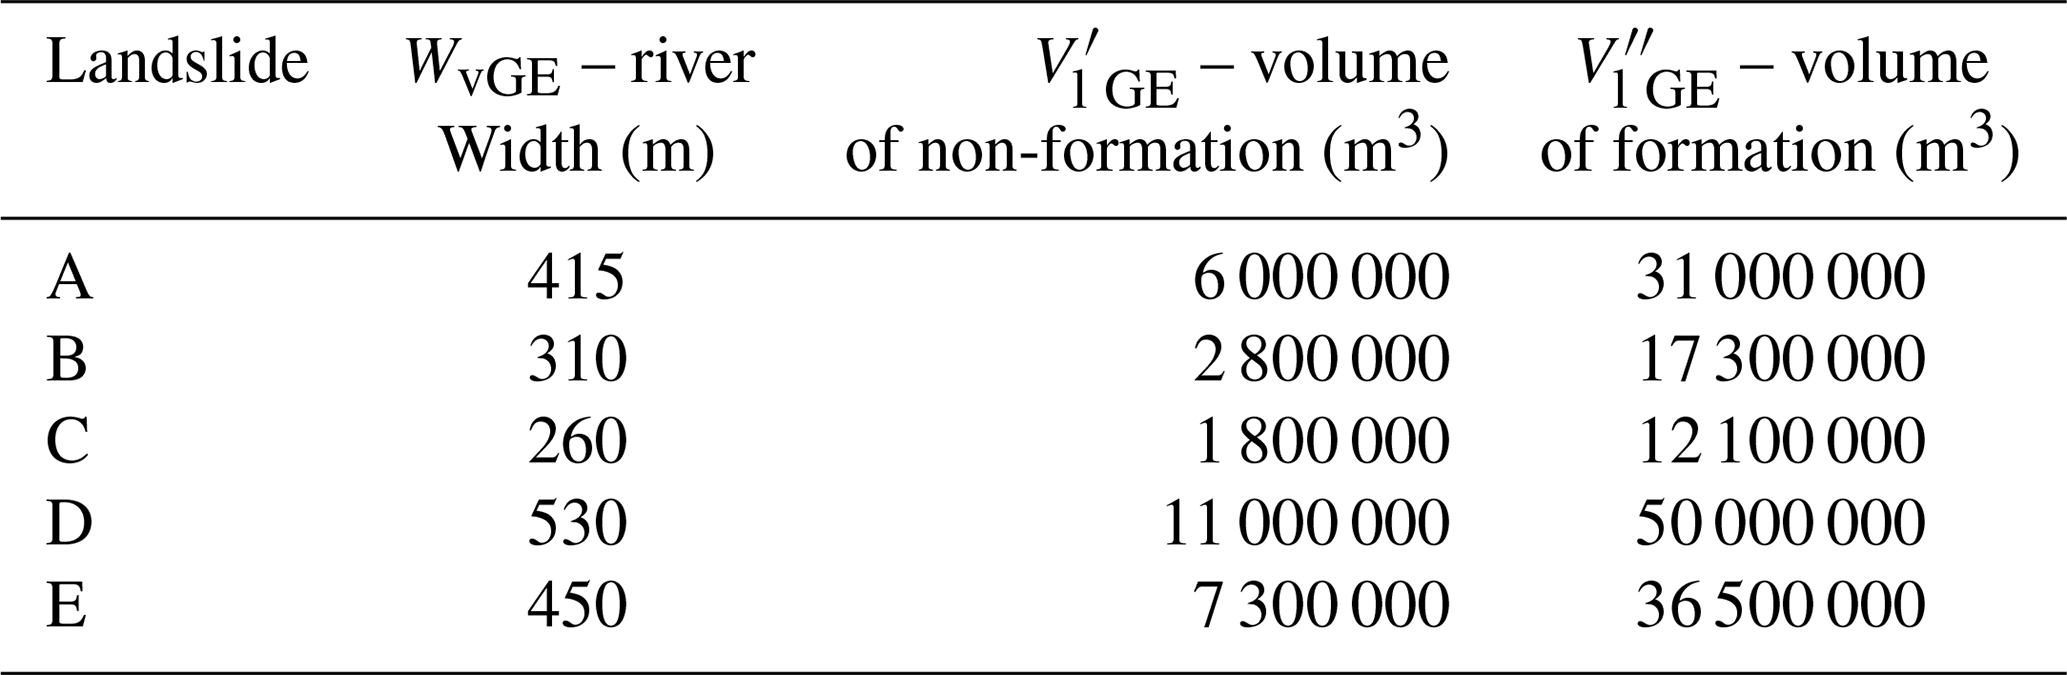
With a careful observation of the map of damming predisposition by landslide reactivation in the lower Pskem Basin in an area of 443 km2 (Fig. 16), some of the 53 mapped landslides should be subjected to further study. Among all, most landslides were classified with a very low and low predisposition value, totaling 21 and 11 cases (39.6 % and 20.8 %) respectively, and only 4 landslides were classified with a very high value (7.5 %), 10 with a high value (18.9 %), and 7 with a moderate value (13.2 %). The landslides named A, B, C, D, and E in Fig. 16, if reactivated, will potentially cause an obstruction of the main river section of the Pskem, with the first three and the last two being classified with high and very high damming predisposition respectively. As shown in Table 2, the volumes of all these landslides are way bigger than the boundary volume of non-formation and formation from Figs. 17 and 18. It is important to note that landslides A, B, and C are situated on the valley floor, meaning that in the past they may have already dammed the river at that point, and the classification of their damming predisposition has been reduced by 1, from very high to high. Due to the considerable volumes of the landslides in the basin and the presence of landslides that have probably already blocked the river in the past, this relatively small area is certainly worthy of attention.
Table 2Landslide volumes and damming parameters Wv, , and of the landslides in Fig. 16 computed using the described method.
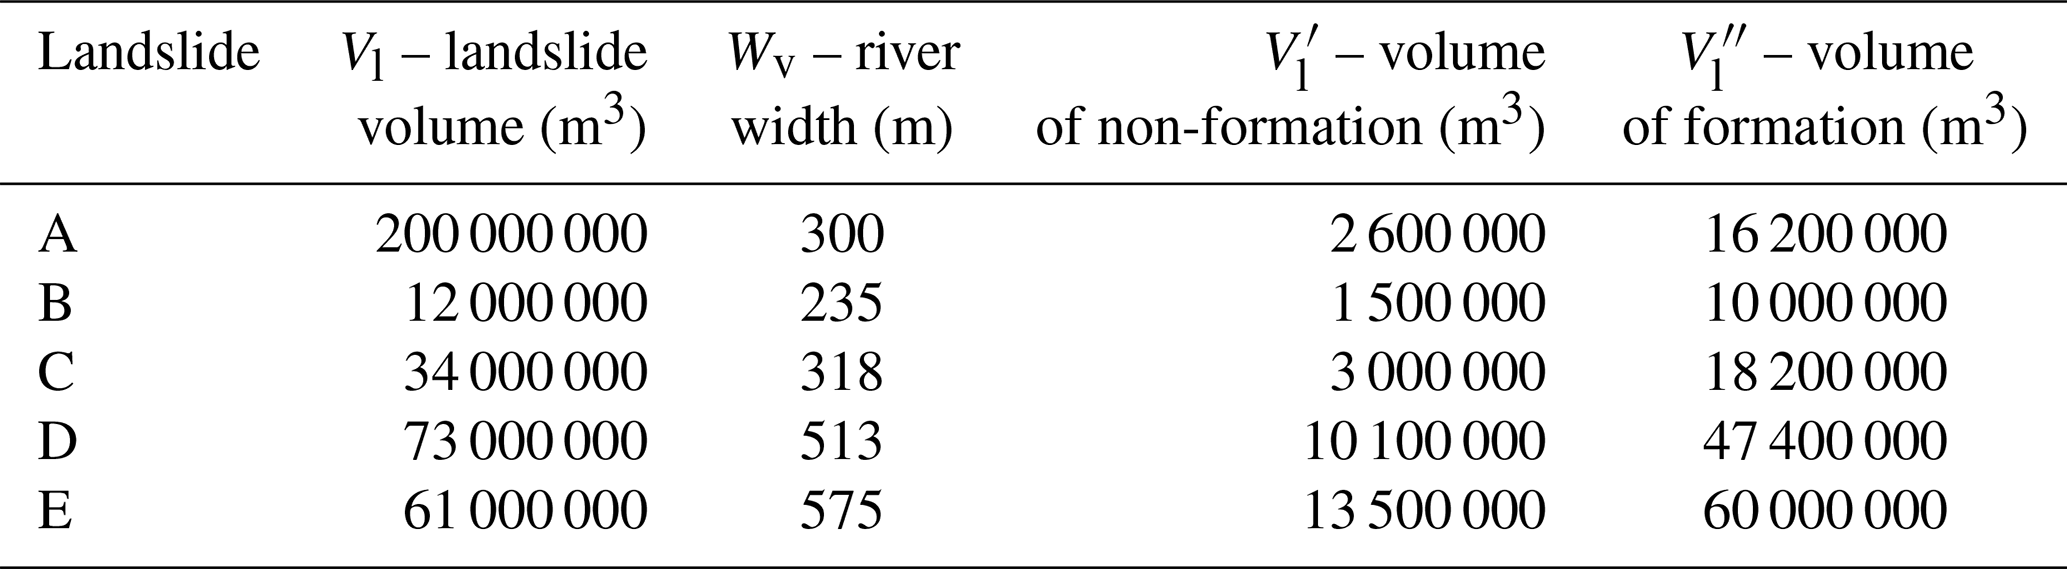
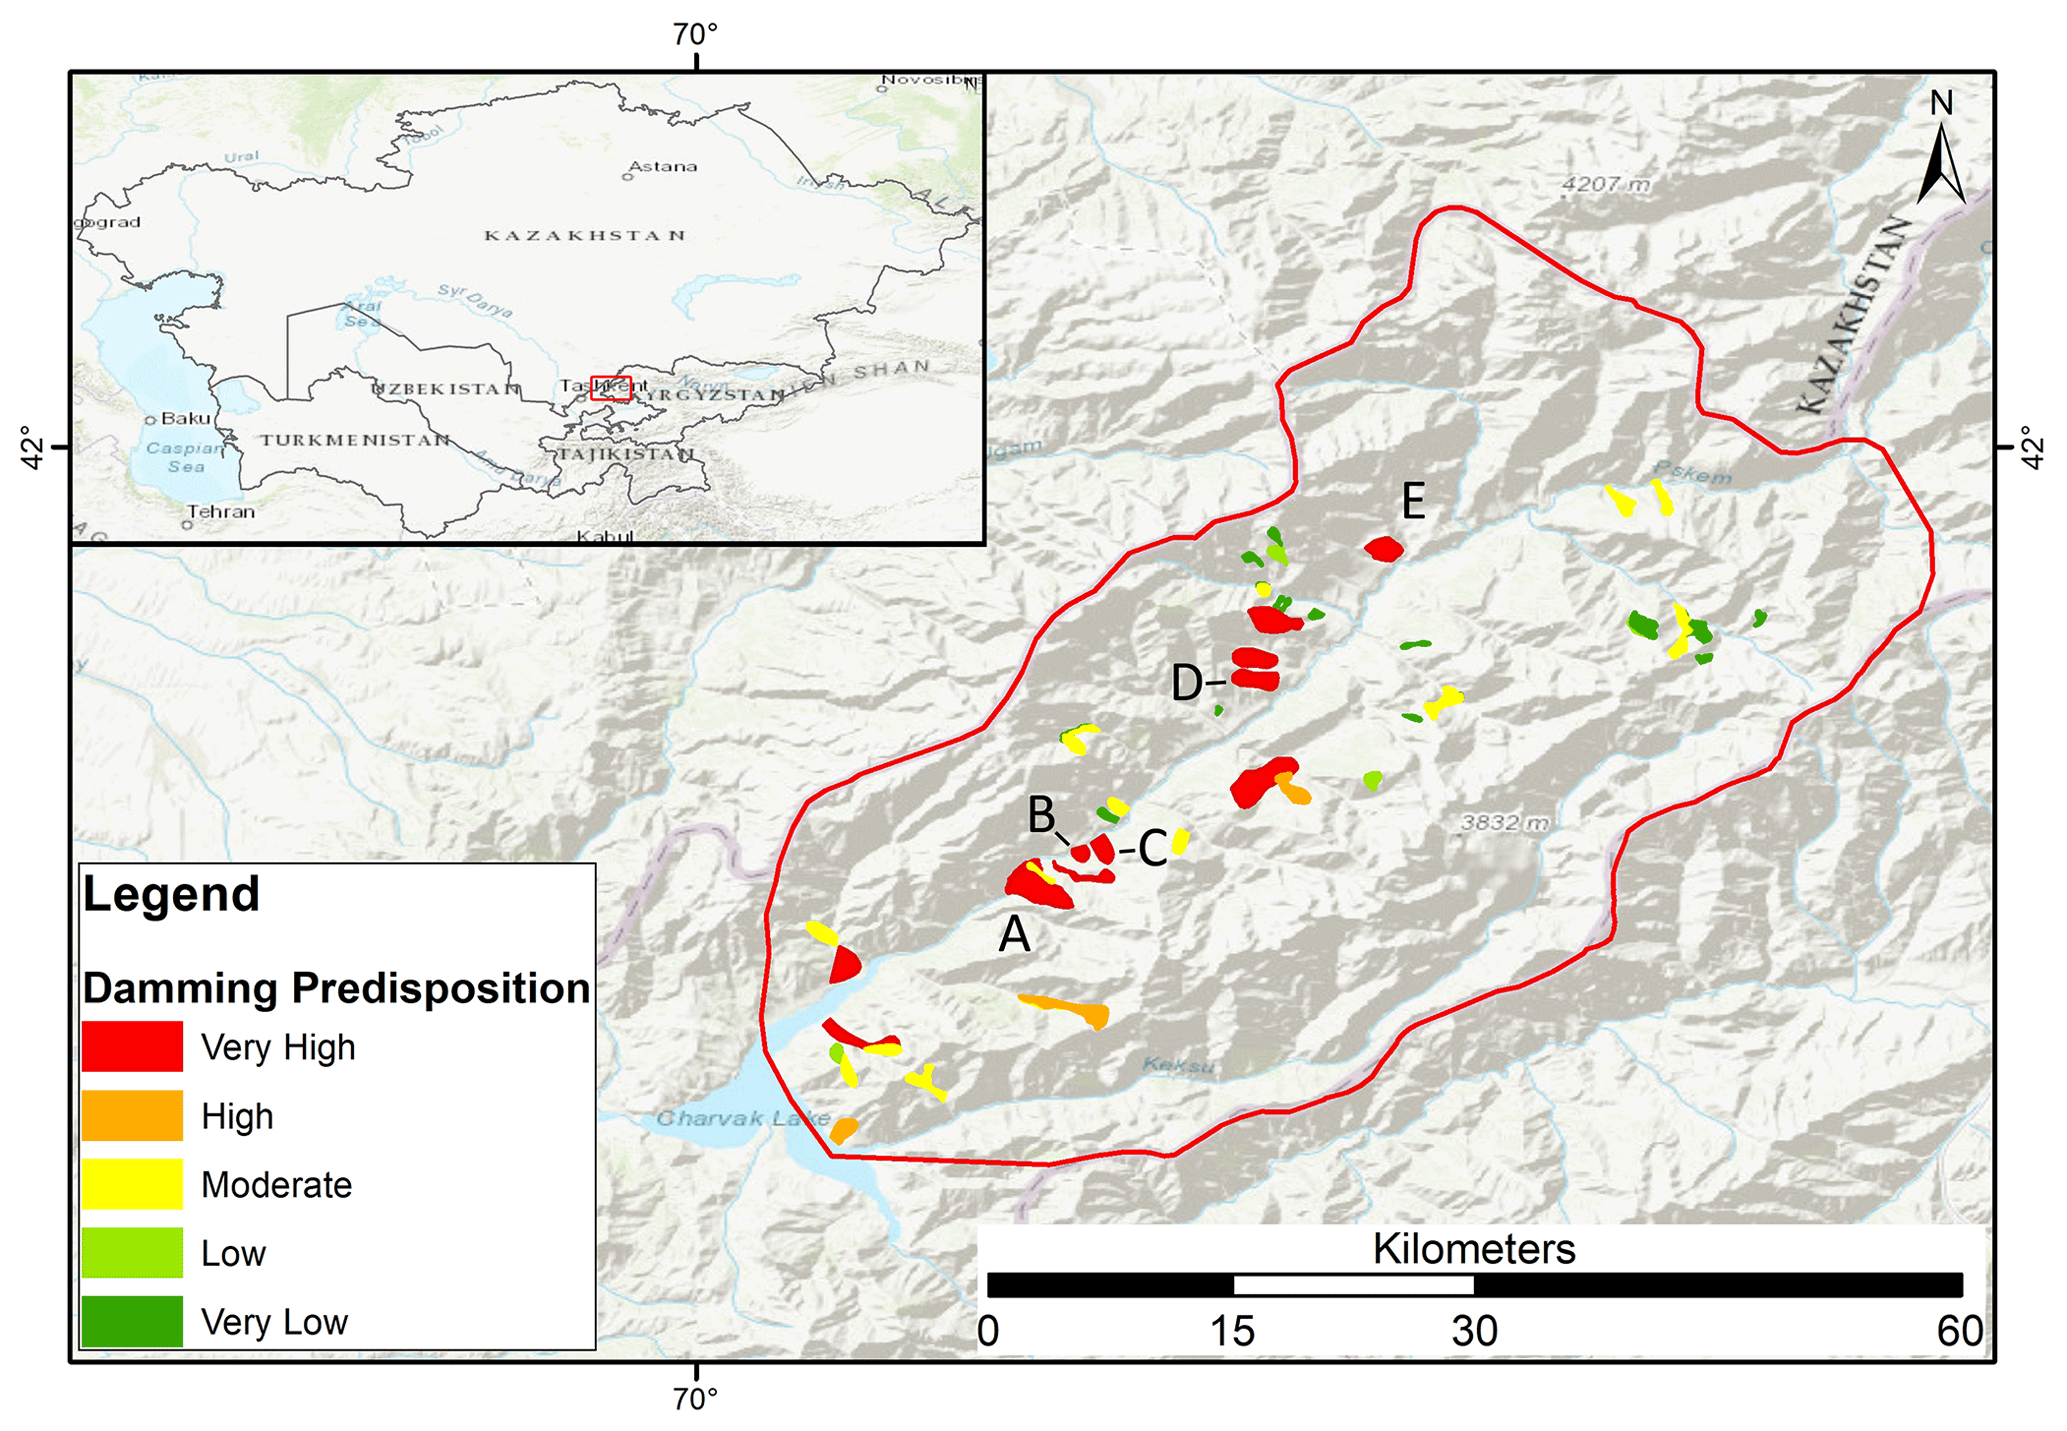
Figure 16Map of damming predisposition by landslide reactivation in the lower Pskem Basin. Basemap sources: Esri, HERE, Garmin Intermap, Increment P Corp, GEBCO, USGS, FAO, NPS, NRCAN, GeoBase, IGN, Kadaster NL, Ordnance Survey, Esri Japan, METI, Esri China (Hong Kong), ©OpenStreetMap contributors, and the GIS user community. OpenStreetMap contributors 2023. Distributed under the Open Data Commons Open Database License (ODbL) v1.0.
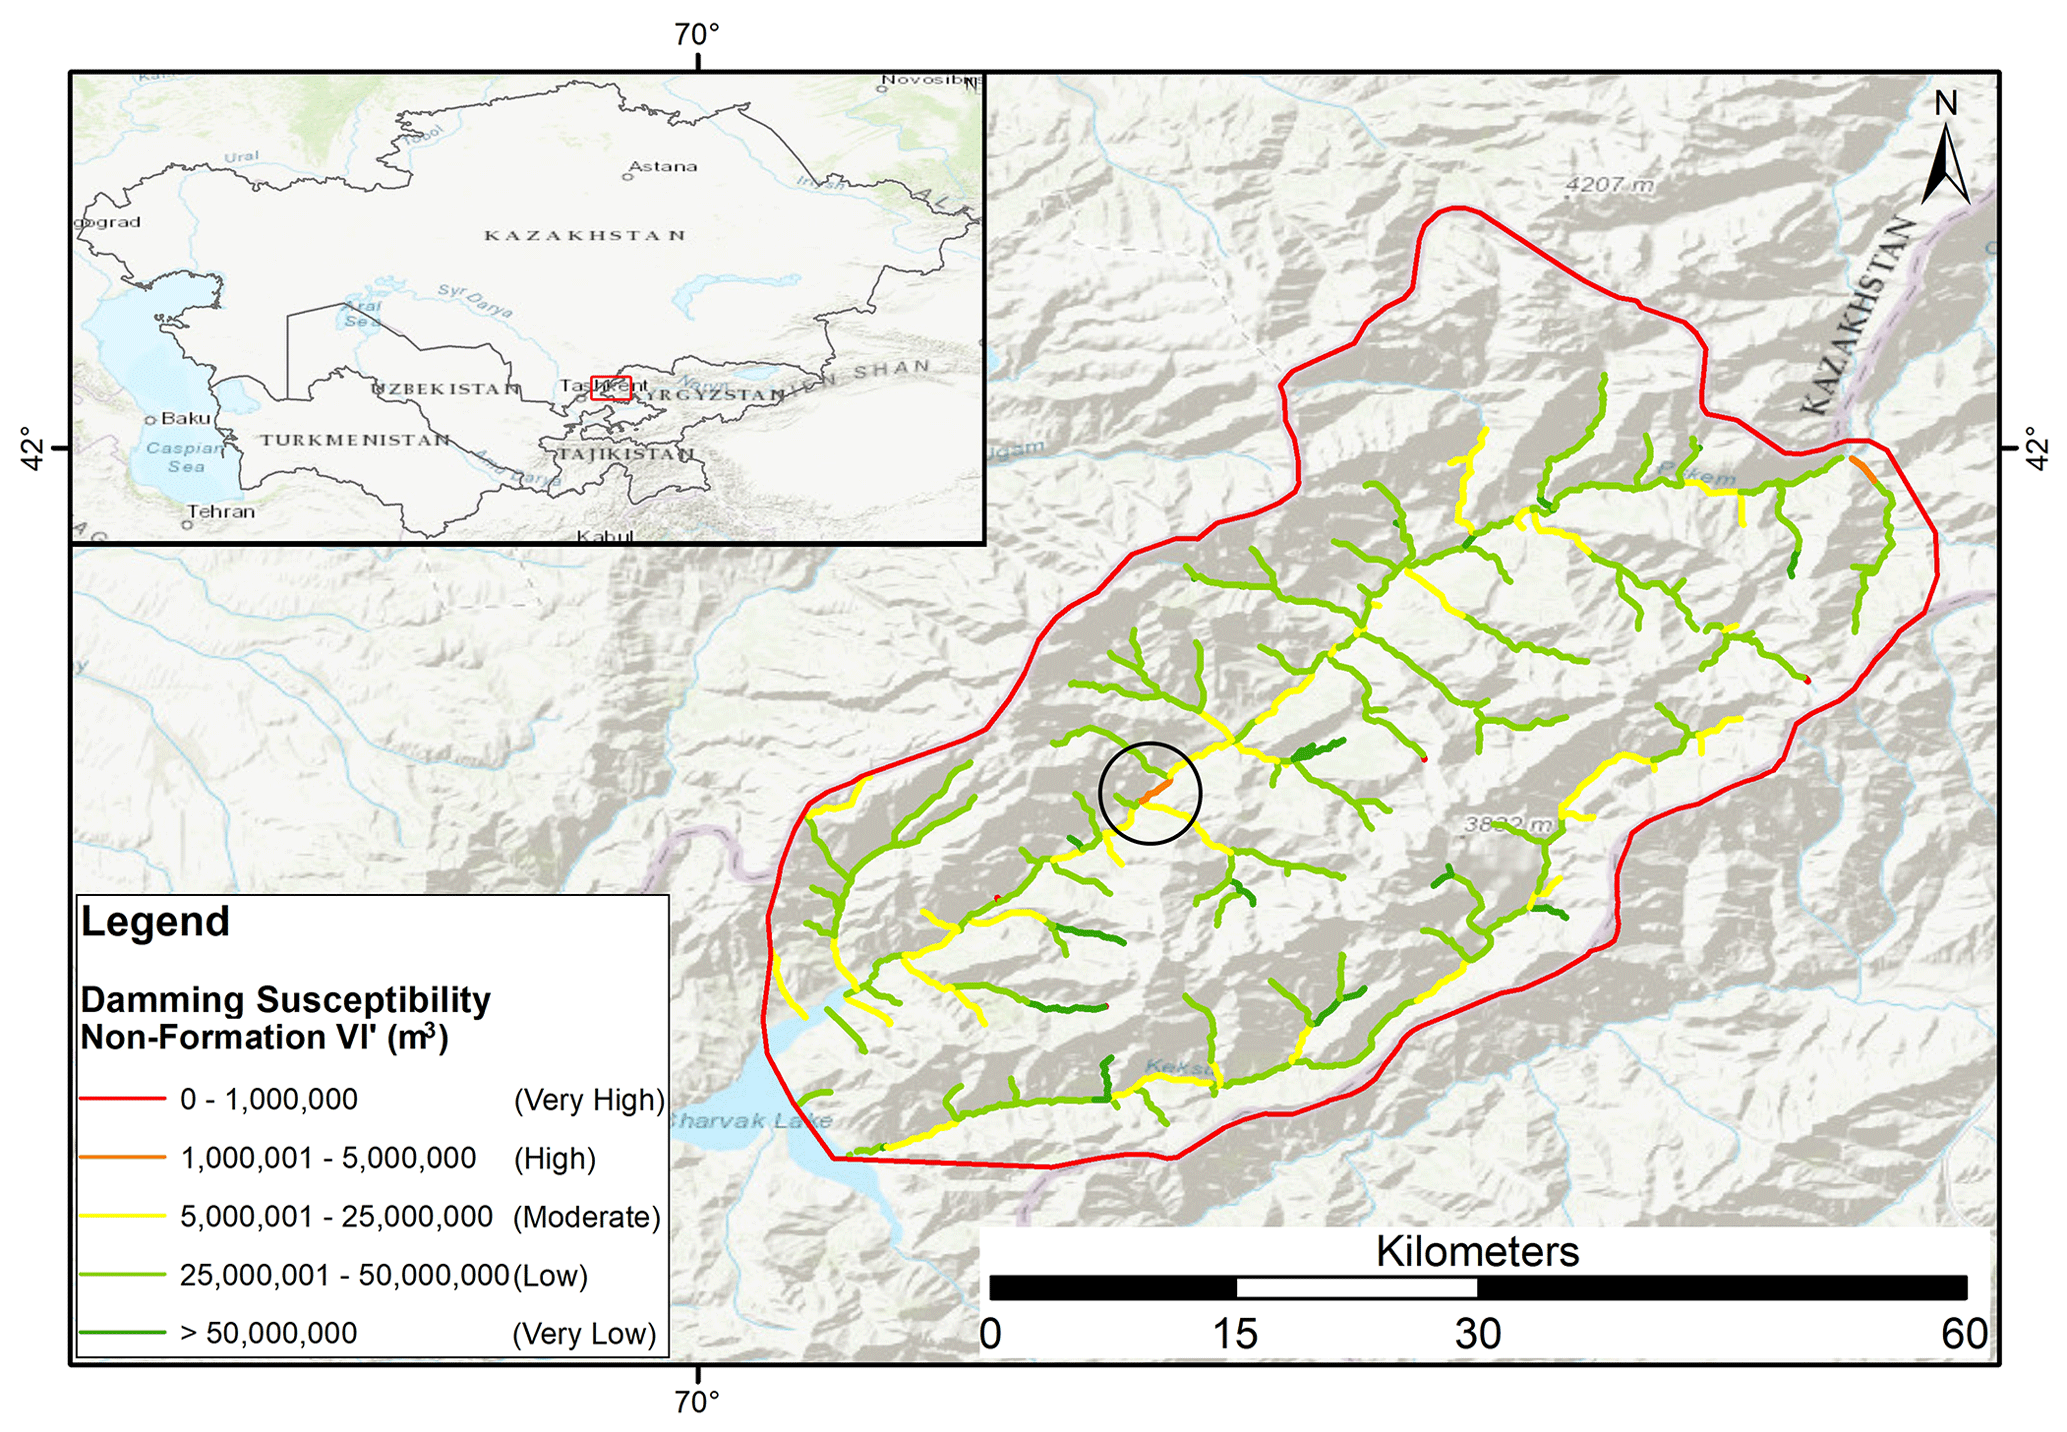
Figure 17Damming susceptibility map of non-formation of river stretches by new landslides in the lower Pskem Basin. The black circle highlights a river stretch with unusually high values. The river network database is from Coccia et al. (2023). Basemap sources: Esri, HERE, Garmin Intermap, Increment P Corp, GEBCO, USGS, FAO, NPS, NRCAN, GeoBase, IGN, Kadaster NL, Ordnance Survey, Esri Japan, METI, Esri China (Hong Kong), © OpenStreetMap contributors, and the GIS user community. OpenStreetMap contributors 2023. Distributed under the Open Data Commons Open Database License (ODbL) v1.0.
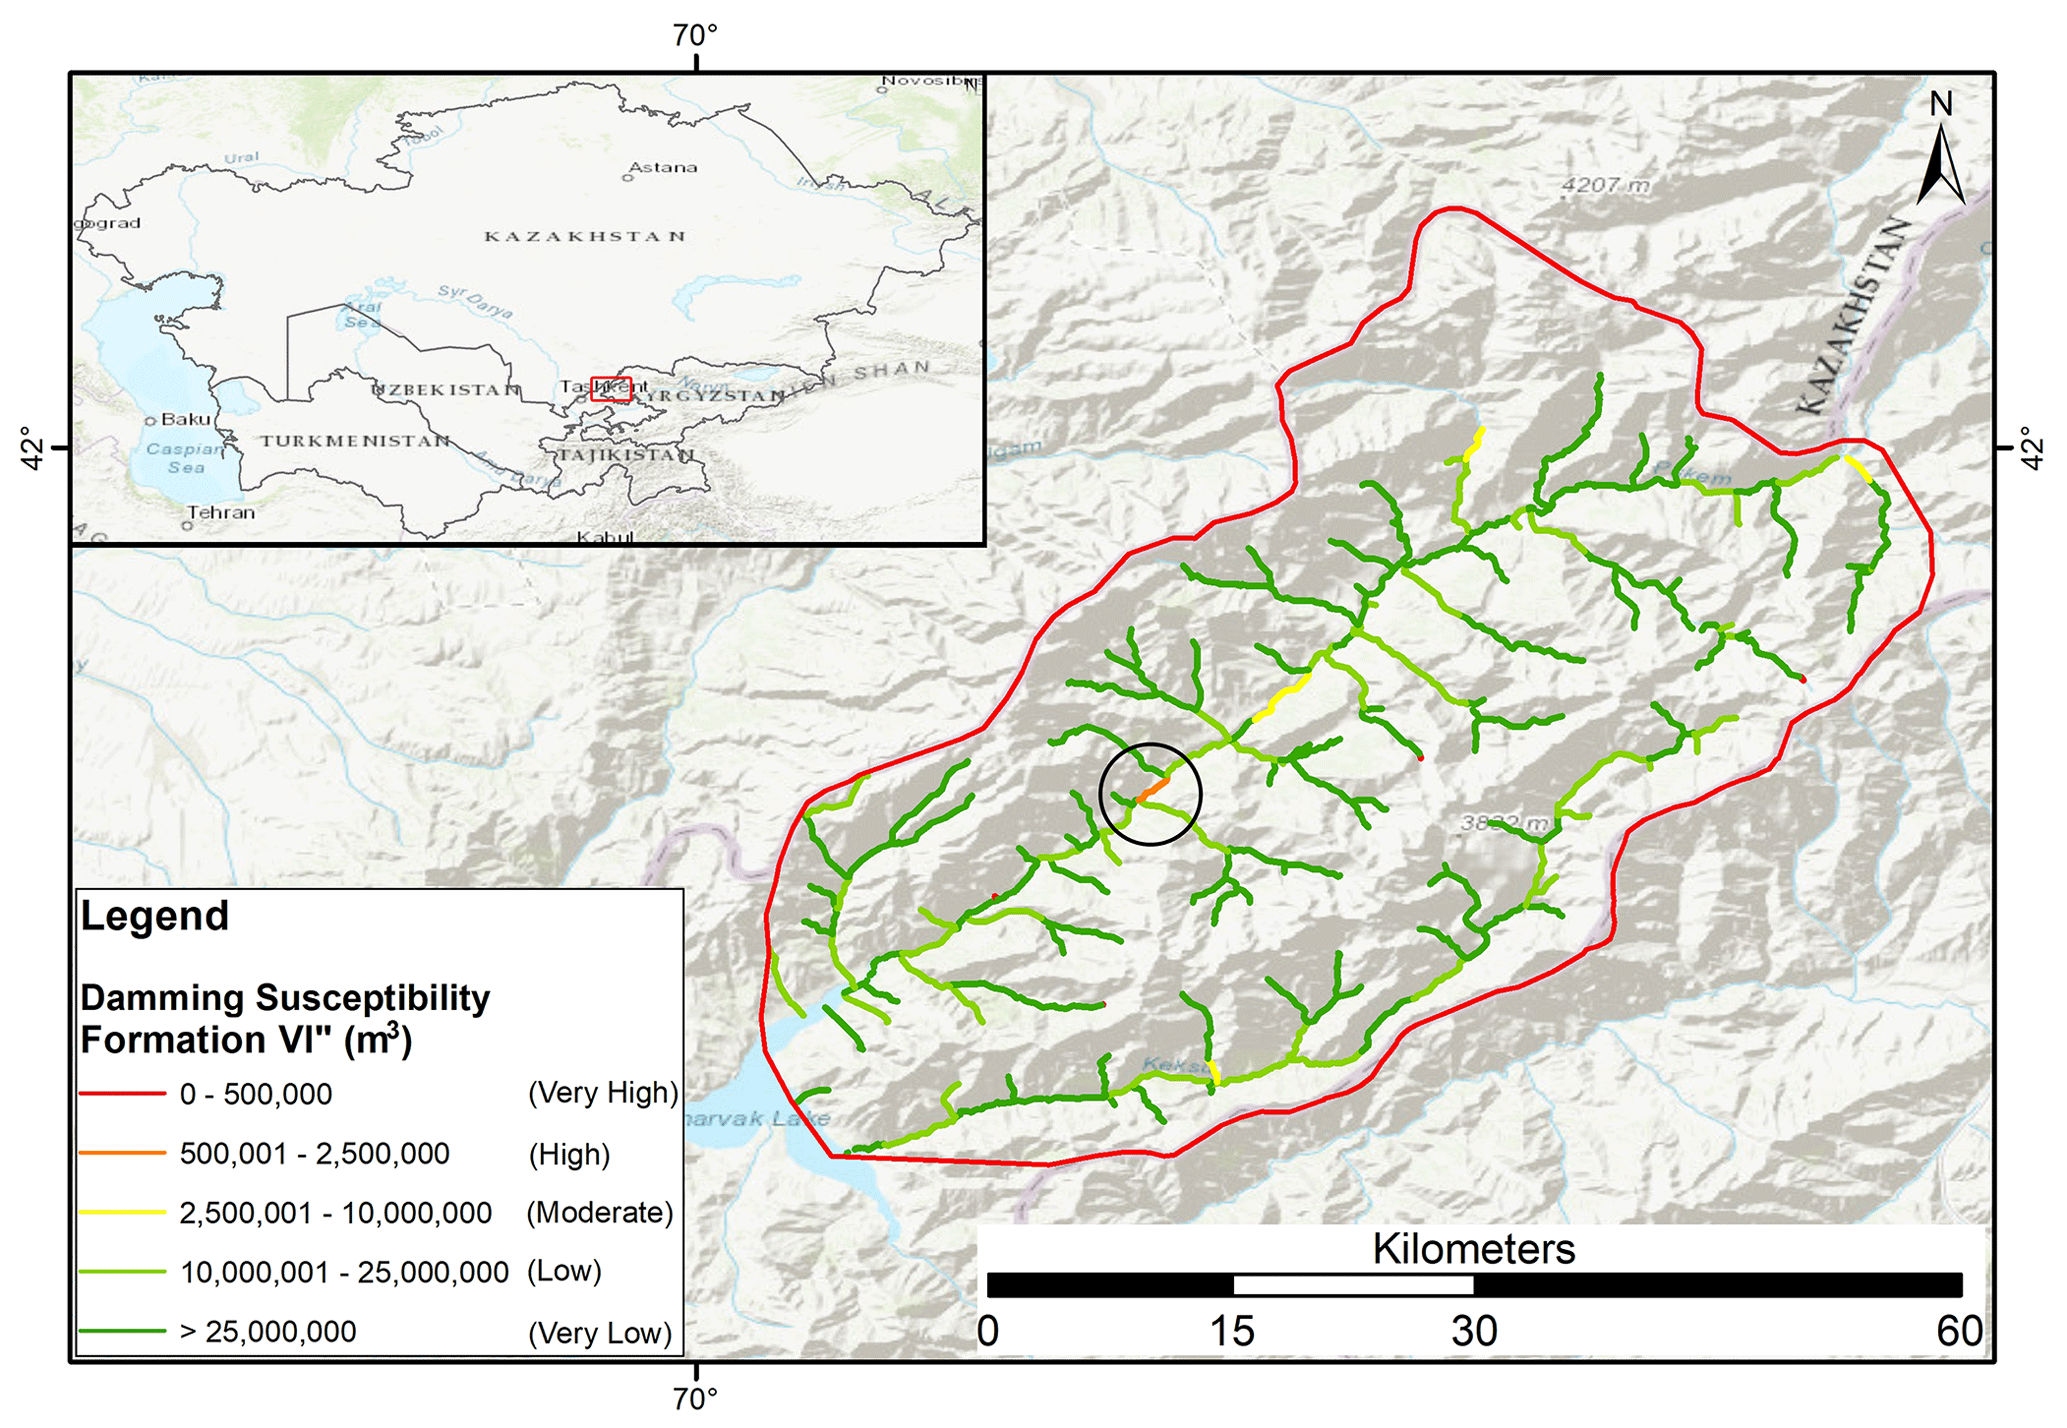
Figure 18Damming susceptibility map of formation of river stretches by new landslides in the lower Pskem Basin. The black circle highlights a river stretch with unusually high values. The river network database is from Coccia et al. (2023). Basemap sources: Esri, HERE, Garmin Intermap, Increment P Corp, GEBCO, USGS, FAO, NPS, NRCAN, GeoBase, IGN, Kadaster NL, Ordnance Survey, Esri Japan, METI, Esri China (Hong Kong), © OpenStreetMap contributors, and the GIS user community. OpenStreetMap contributors 2023. Distributed under the Open Data Commons Open Database License (ODbL) v1.0.
The obstruction of the Pskem River by one of these landslides would cause an upstream impoundment with a surface from 2 to 10 km2 or more, depending on the dam position and height. The dam collapse could release a catastrophic flooding wave with destructive effects in the downstream areas. In the worst scenario, even the earthfill dam located a few kilometers downstream could be seriously damaged with unpredictable effects. Since the reliability of this mapping method is strictly correlated to the quality of the input data, when the DEM used has a coarse resolution, in similar cases of possible risk to peoples' lives, it is always advisable to do a second “manual check”, even using free satellite imaging services like Google Earth. In fact, when the DEM resolution is too rough, the GIS tool used in this methodology to evaluate the extension of the riverbed morphologic unit can produce inconsistent and incorrect results, causing improper damming susceptibility evaluations. The results of the measurements on Google Earth orthophotos in Table 3 show that the difference between the river width values calculated with the mapping method (Wv) and those measured on Google Earth (WvGE) can in some cases be substantial, modifying the calculated boundary volumes V′ and V′′, although in this case they do not drastically modify the final classification of the five landslides.
Table 3Damming parameters WvGE, , and of the landslides in Fig. 16 computed with Google Earth observations.
The river network of the upper Pskem Valley has also been classified, producing the maps of damming susceptibility of non-formation and formation (Figs. 17 and 18 respectively). Concerning the damming susceptibility map of non-formation (Fig. 17), the most frequent classes are low and moderate, with 65.1 % and 22.6 % respectively, followed by the very low class with 11.1 %. Only 1.3 % have been classified as high and 0.0 % as very high. For the damming susceptibility map of formation (Fig. 18), most of the rivers fall into very low and low classes, with 69.8 % and 27.7 %, followed by the moderate class with 2.1 %. Only 0.4 % have been classified as high and 0.0 % as very high.
The general damming susceptibility of the valley is low, but a singular river stretch, marked by the black circle in Figs. 17 and 18, classified with high susceptibility in both maps, should be carefully evaluated. This river part is clearly noticeable in the middle of the area along the main river path, slightly upstream of the landslides named B and C. The high classification values mean that geographically on that point the valley width undergoes a shrinkage, and for this reason even a relatively small landslide generated from the surrounding slopes can create an obstruction; therefore it is worthy of a more detailed investigation.
4.2 The Fergana Valley mountainous rim (Tajikistan–Kyrgyz Republic–Uzbekistan)
The Fergana Valley is one of the largest intermountain depressions in Central Asia, located between Uzbekistan, the Kyrgyz Republic, and Tajikistan. It hosts two main rivers, the Naryn and the Kara Darya, which join together to form the Syr Darya. In this populated area landslide activity is recurrent, causing damage to infrastructure and loss of human life every year, and is triggered by complex interactions between multiple tectonic, geological, morphological, and meteorological factors (Danneels et al., 2008; Schlögel et al., 2011; Piroton et al., 2020). The mapping methodology has also been applied to the Fergana Valley, and a total of 3370 landslides, coming from various data sources, have been classified as shown in Fig. 19. Comparably to the classification result of the entire inventory (Fig. 9), most of the cases (94 %) have a very low damming predisposition, followed by low and moderate (with 2.5 % and 1.8 % respectively) as reported in Table 4. Very few landslides fall into high and very high classes (with 1.4 % and 0.3 % respectively). For the classification of the river network of the Fergana Valley, the maps of damming susceptibility of non-formation and formation have been produced (Figs. 20 and 21 respectively). As a method with a multi-scale approach, in such large areas, this damming susceptibility method is suitable for providing territorial planning suggestions rather than indications on single interventions at local scale. The overall damming predisposition of the Fergana Valley is quite low, considering the presence of 3370 mapped landslides in total, even if there are a few landslides (10) classified with very high damming predisposition, which should be studied with more attention through localized analysis of damming susceptibility to ensure that downstream areas are not at risk, and therefore require specific monitoring.
Table 4Distribution of damming susceptibility classes on existing landslides (Fig. 19) and on the river stretches for non-formation (Fig. 20) and formation of new landslides (Fig. 21).
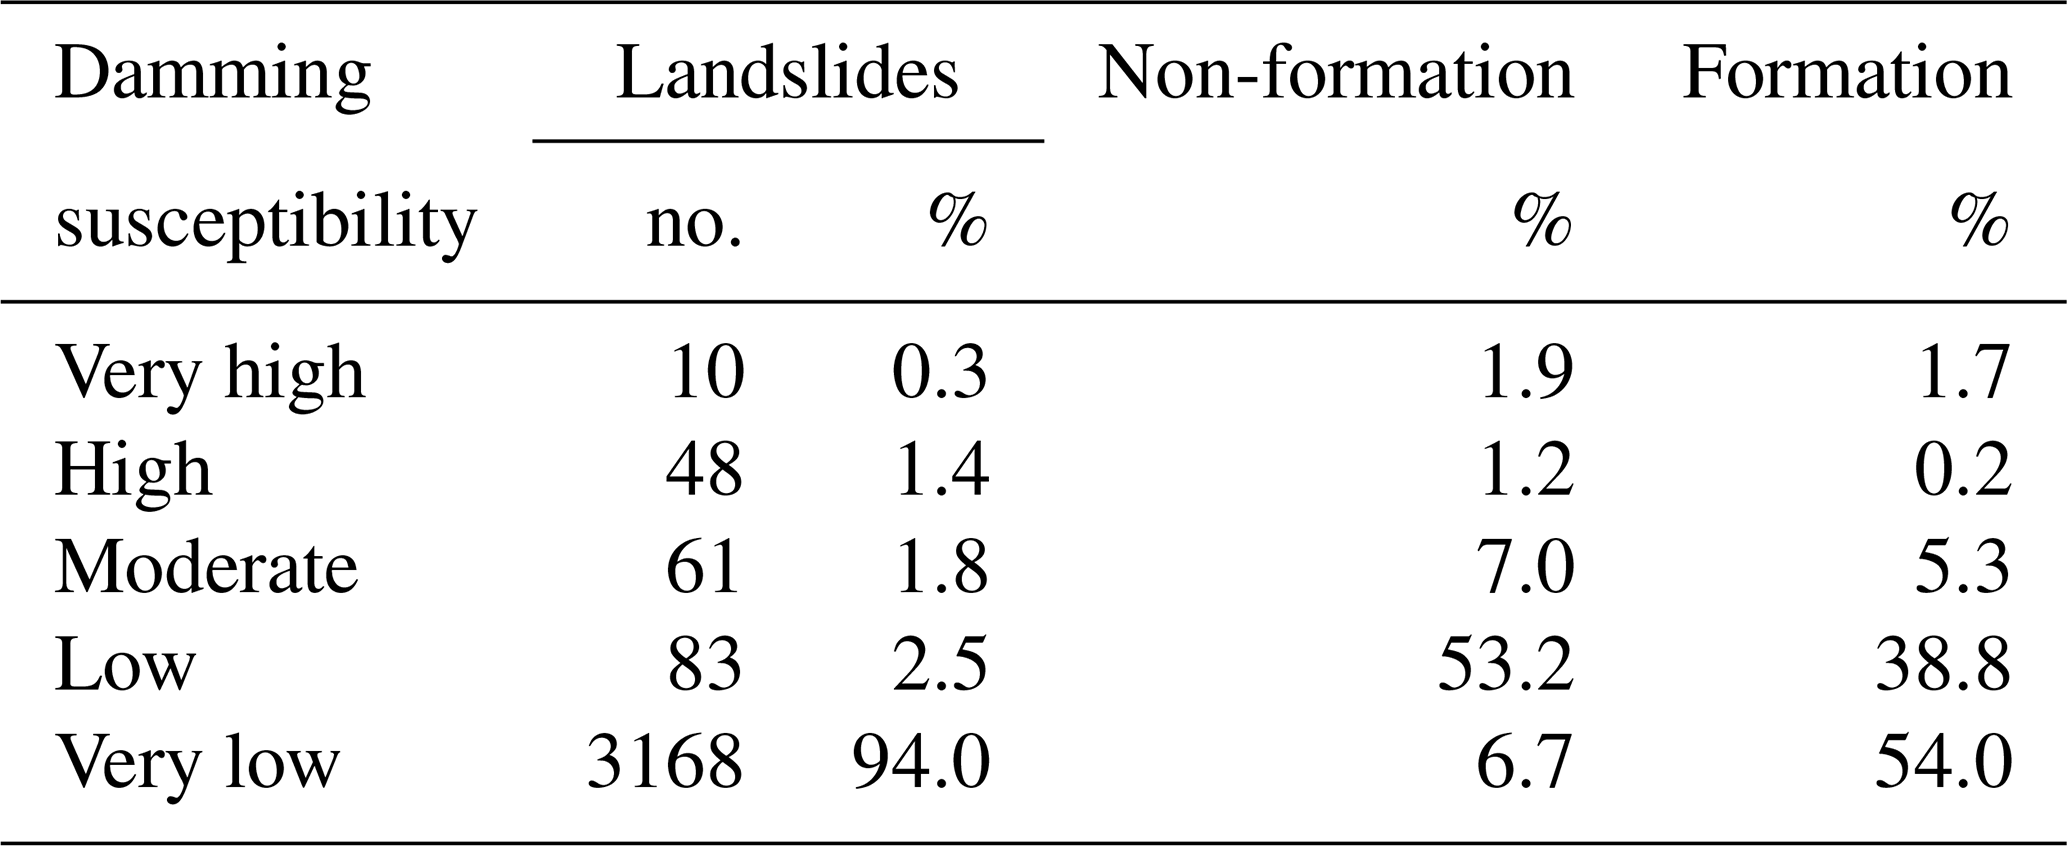
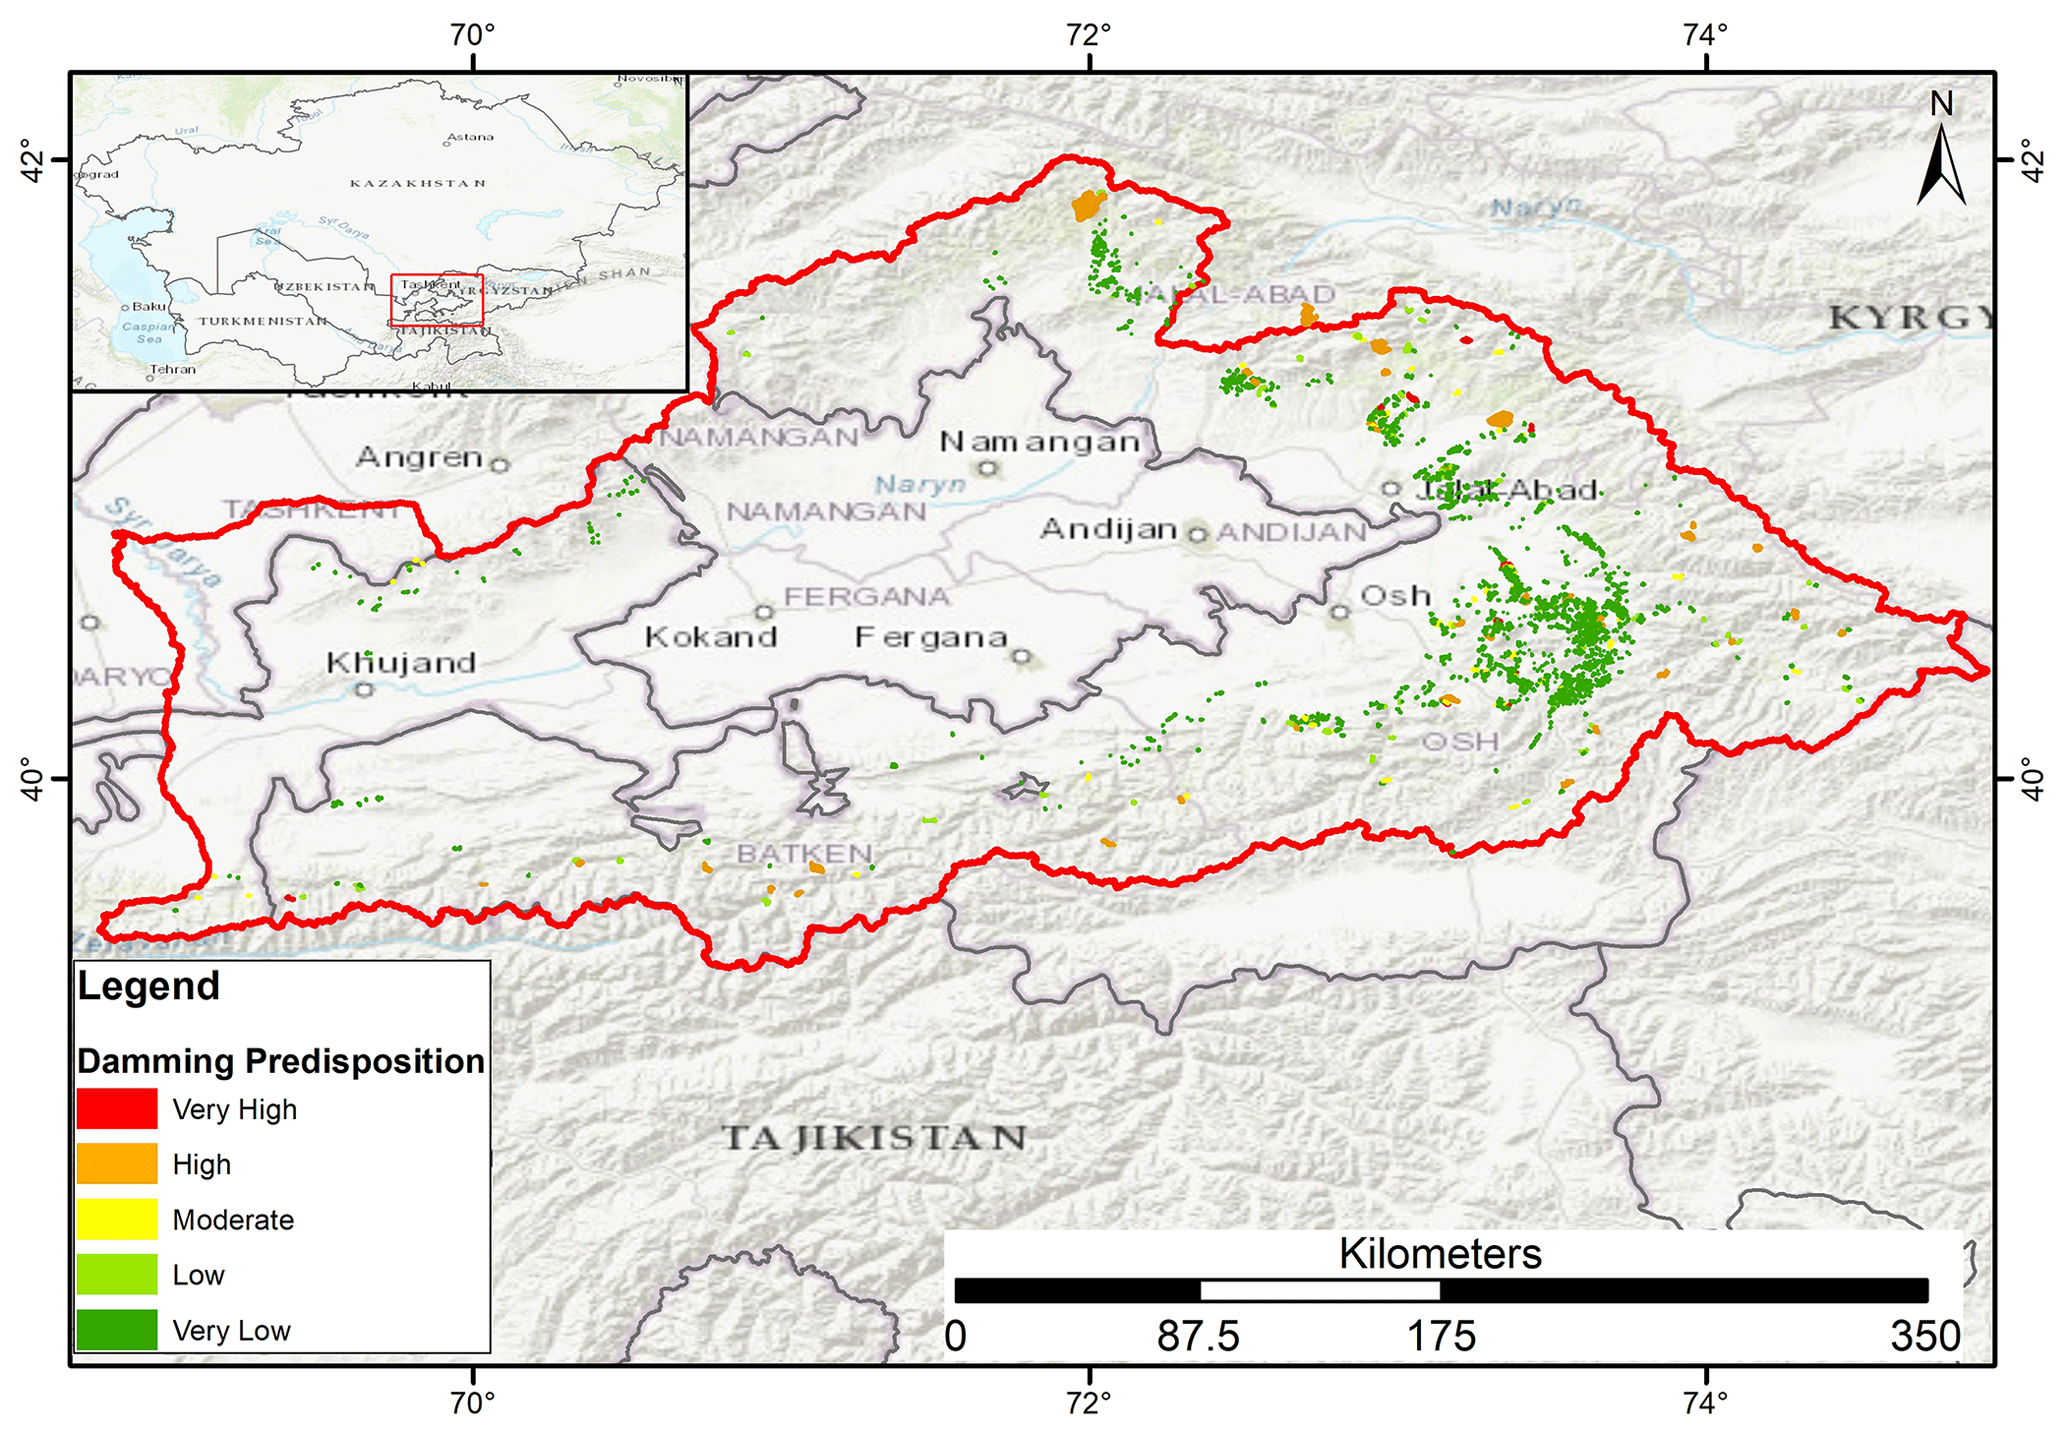
Figure 19Map of damming predisposition by landslide reactivation in the Fergana Valley. Basemap sources: Esri, HERE, Garmin Intermap, Increment P Corp, GEBCO, USGS, FAO, NPS, NRCAN, GeoBase, IGN, Kadaster NL, Ordnance Survey, Esri Japan, METI, Esri China (Hong Kong), © OpenStreetMap contributors, and the GIS user community. OpenStreetMap contributors 2023. Distributed under the Open Data Commons Open Database License (ODbL) v1.0.
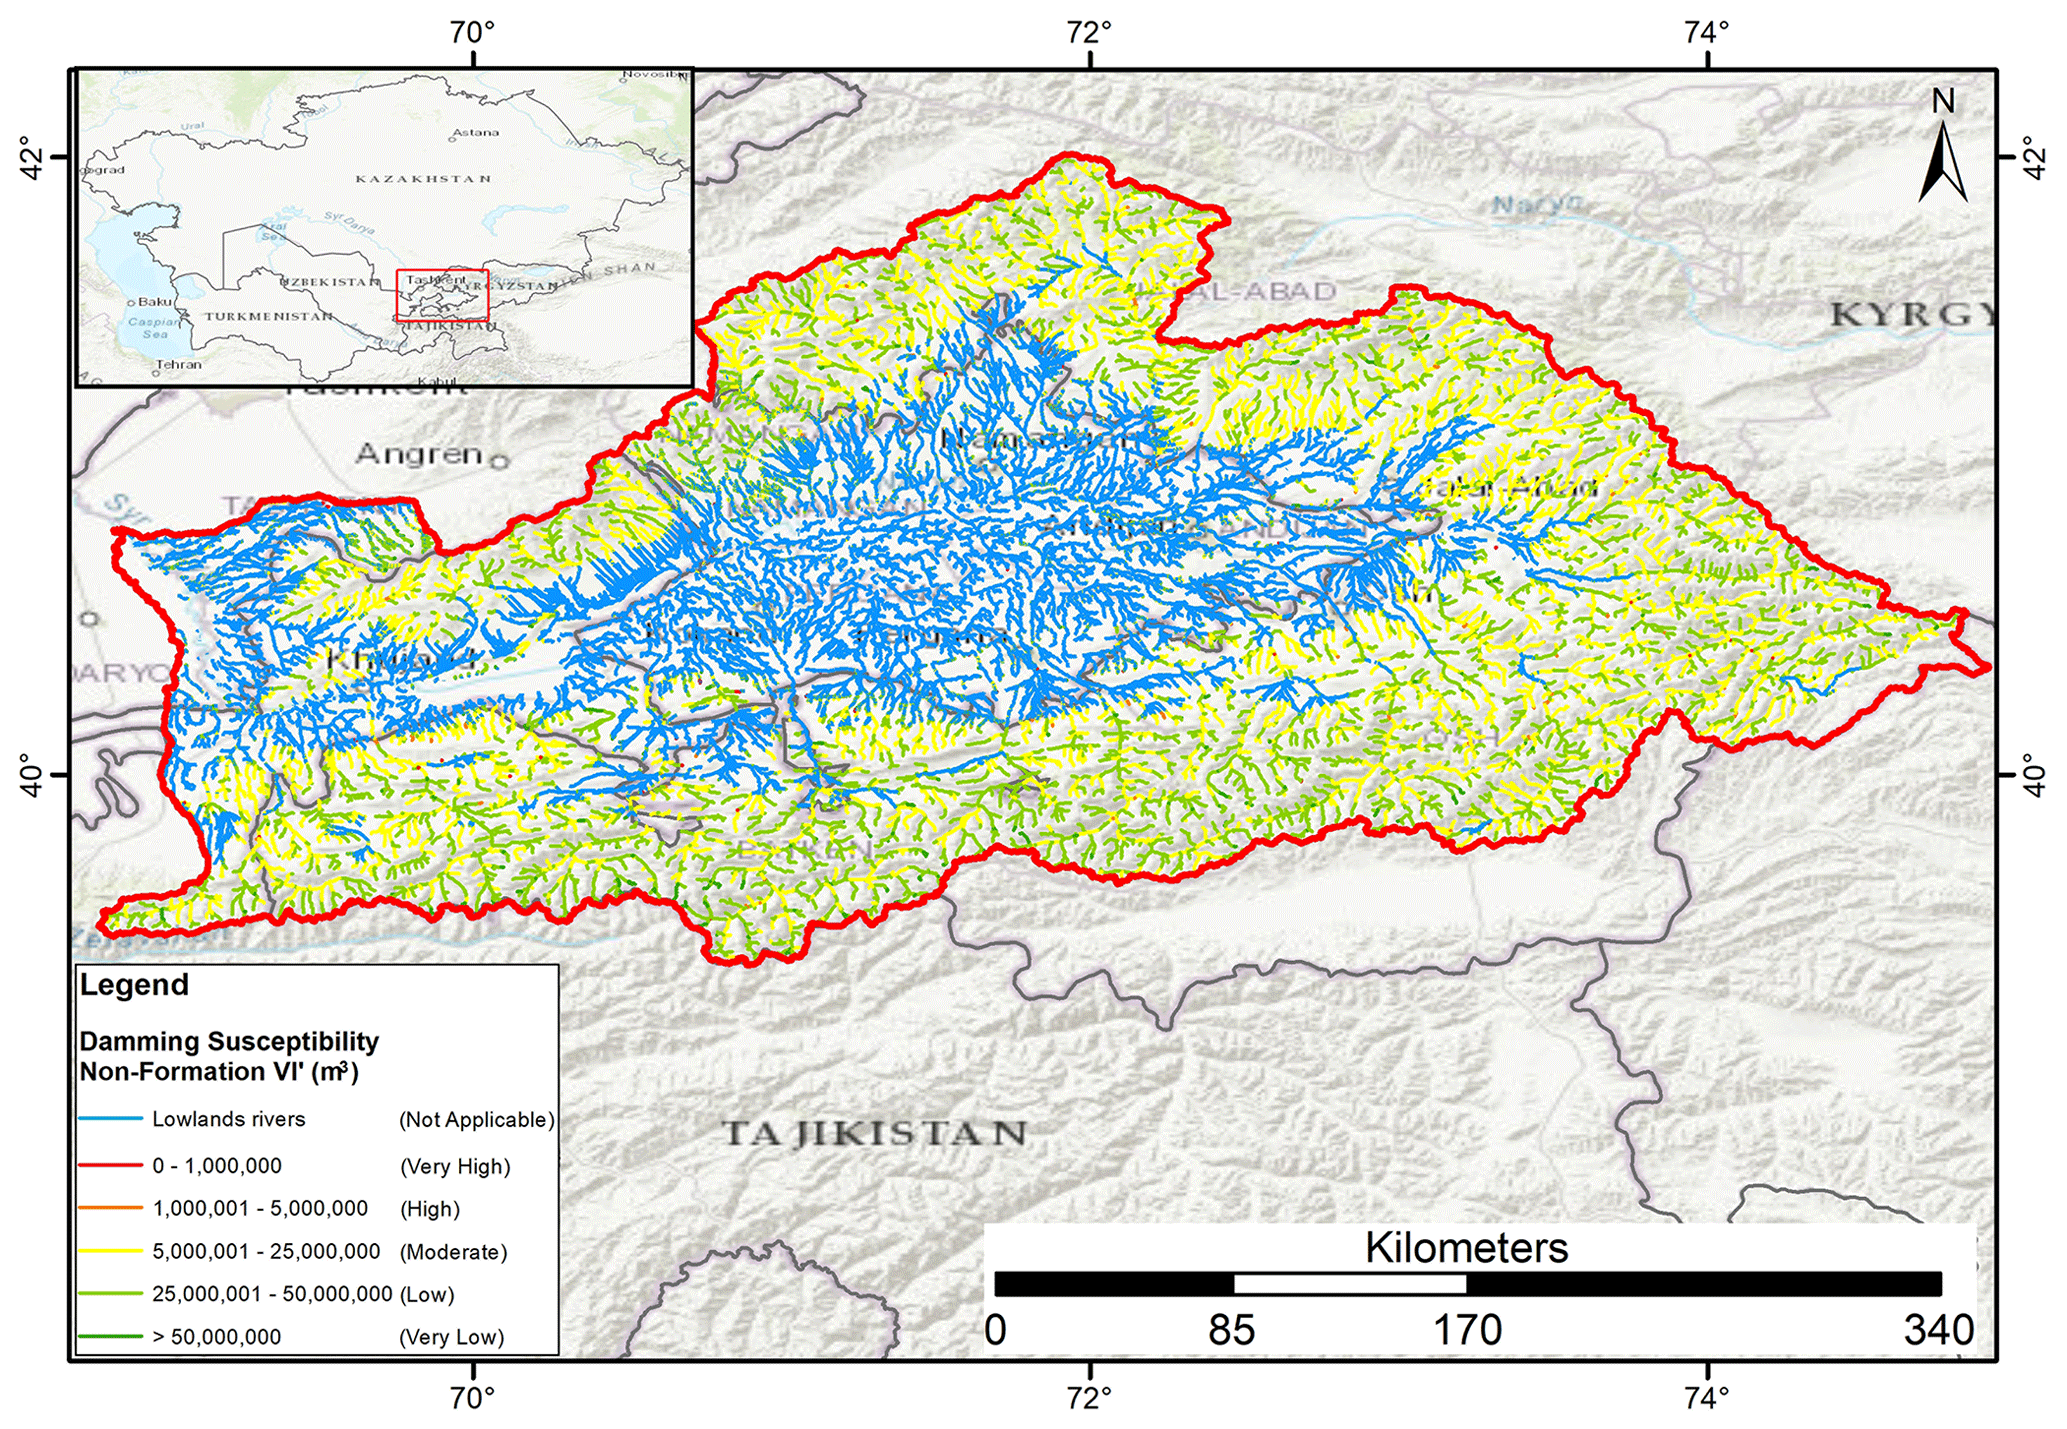
Figure 20Damming susceptibility map of non-formation of river stretches by new landslides in the Fergana Valley. The river network database is from Coccia et al. (2023). Basemap sources: Esri, HERE, Garmin Intermap, Increment P Corp, GEBCO, USGS, FAO, NPS, NRCAN, GeoBase, IGN, Kadaster NL, Ordnance Survey, Esri Japan, METI, Esri China (Hong Kong), © OpenStreetMap contributors, and the GIS user community. OpenStreetMap contributors 2023. Distributed under the Open Data Commons Open Database License (ODbL) v1.0.
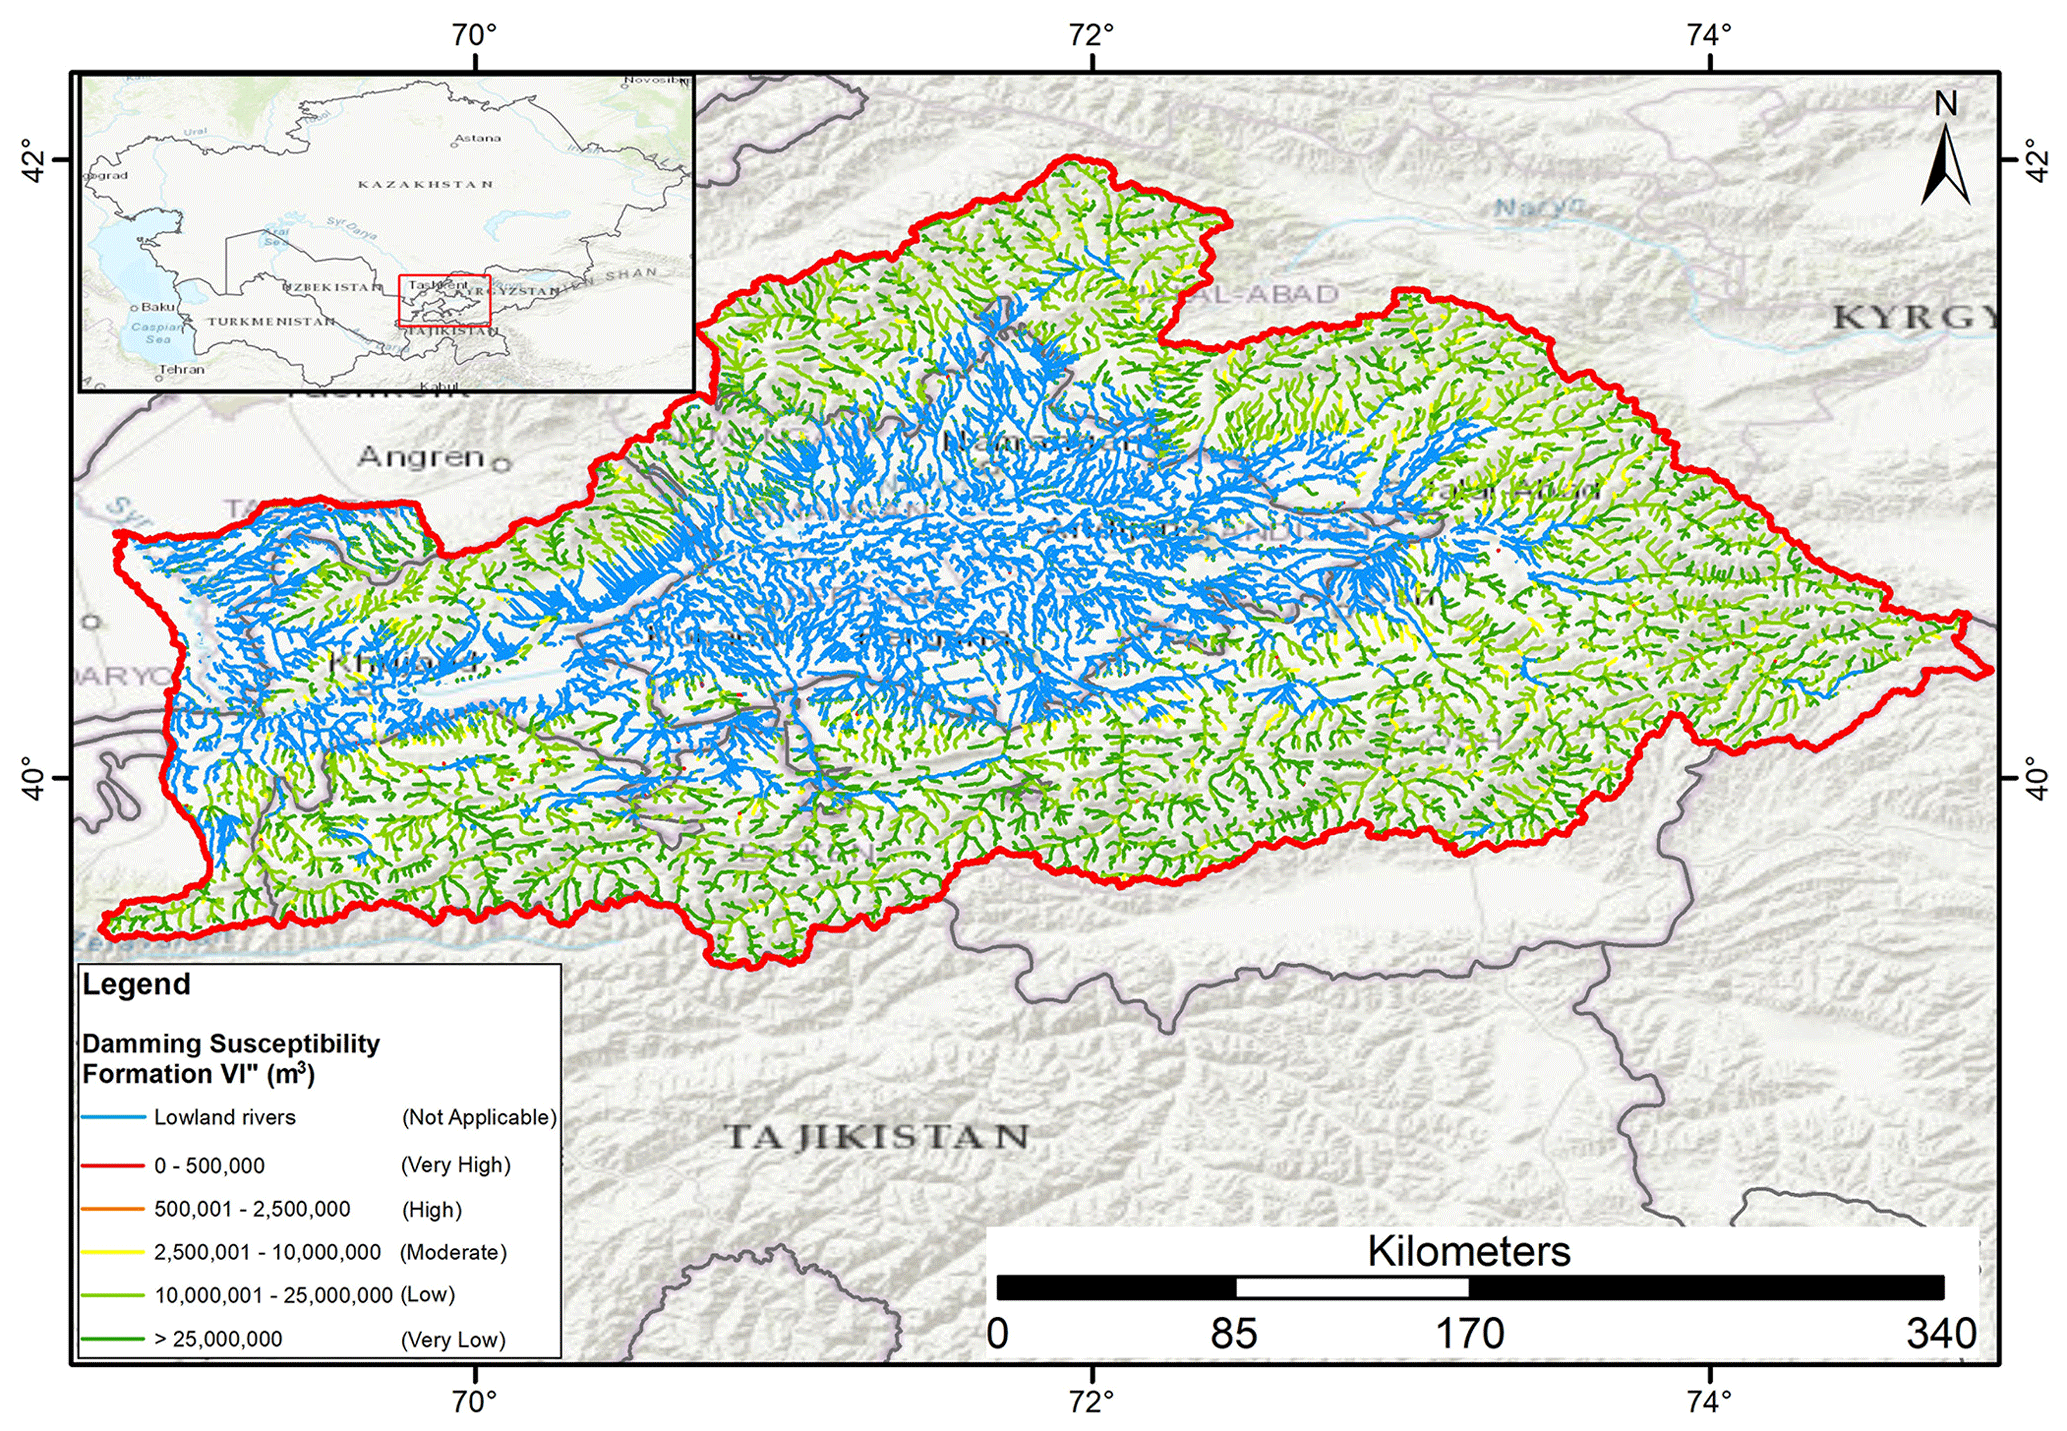
Figure 21Damming susceptibility map of formation of river stretches by new landslides in the Fergana Valley. The river network database is from Coccia et al. (2023). Basemap sources: Esri, HERE, Garmin Intermap, Increment P Corp, GEBCO, USGS, FAO, NPS, NRCAN, GeoBase, IGN, Kadaster NL, Ordnance Survey, Esri Japan, METI, Esri China (Hong Kong), © OpenStreetMap contributors, and the GIS user community. OpenStreetMap contributors 2023. Distributed under the Open Data Commons Open Database License (ODbL) v1.0.
Table 4 shows the distribution of the percentages of the damming susceptibility classes of the river stretches that are not running in flat areas, since these lowland rivers represent 53.6 % of the total. Concerning the damming susceptibility map of non-formation of the remaining river stretches (Fig. 20), the most frequent classes are low and moderate with 53.4 % and 36.2 % respectively, followed by the very low class with 7.0 %. Only 2.1 % and 1.3 % have been classified as very high and high. For the damming susceptibility map of formation (Fig. 21), most of the rivers fall into very low and low classes with 54.5 % and 38.1 %, followed by the moderate class with 5.2 %. Only 1.9 % and 0.2 % have been classified as very high and high respectively.
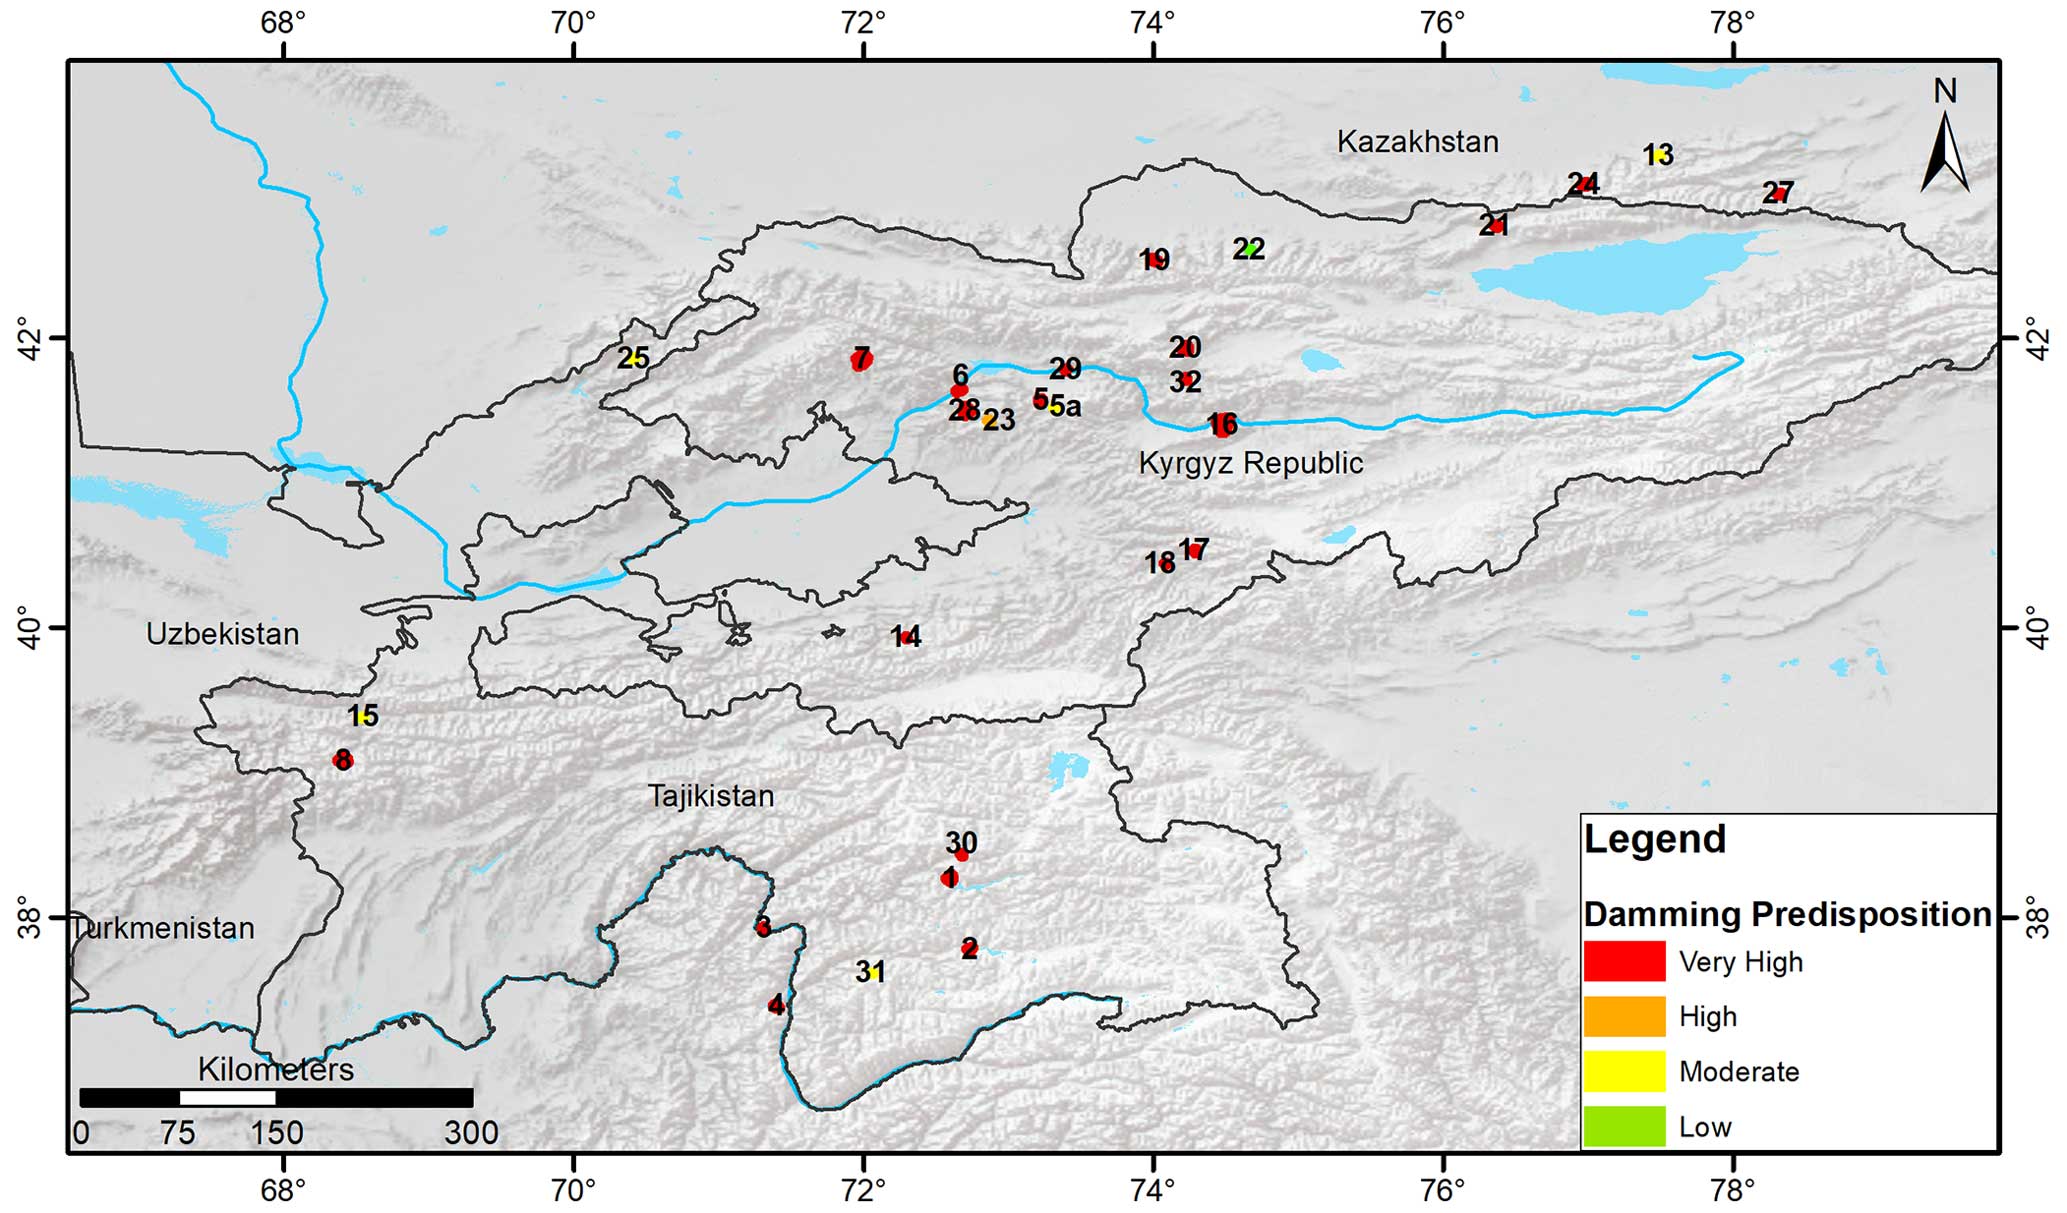
Figure 22Map of damming predisposition using landslides from Strom (2010). See Table 5 for landslide numbers. The lake's polygons are from Esri, Garmin International, Inc.; the basemap is from Esri, USGS, and NOAA.
During the application of the damming mapping methodology, the main issues encountered were the extremely wide study area, the amount of data, and the processing time required. The mapping methodology used based on the MOI equations (Eq. 1) was originally designed to assess the damming susceptibility at basin/regional scale (Tacconi Stefanelli et al., 2016, 2020), where the morphological parameters essential for the correct application of the tool proposed by Wood (2009) must be correctly found to have an accurate river width required in the MOI equations (Eq. 1). This time-consuming phase has been simplified in this research, according to the wide dimension of the study area, taking into account not the basins but the different states in the Central Asia region. This simplification certainly affected the reliability of the individual specific data while still guaranteeing an important overview of the general hazard distribution of the phenomenon in the area. Furthermore, the quality of the results is directly proportional to the resolution and quality of the input data, which on the other hand are inversely proportional to the processing time. In this regard, a further criticality of this process is the reliability on the landslide volume assessment method, since a higher quality of landslide data (sliding geometry and depth) allows for the application of a more accurate volume calculation and therefore a better final result.
Table 5Information of landslides in Fig. 22 (from Strom, 2010) and their damming predisposition assessment.
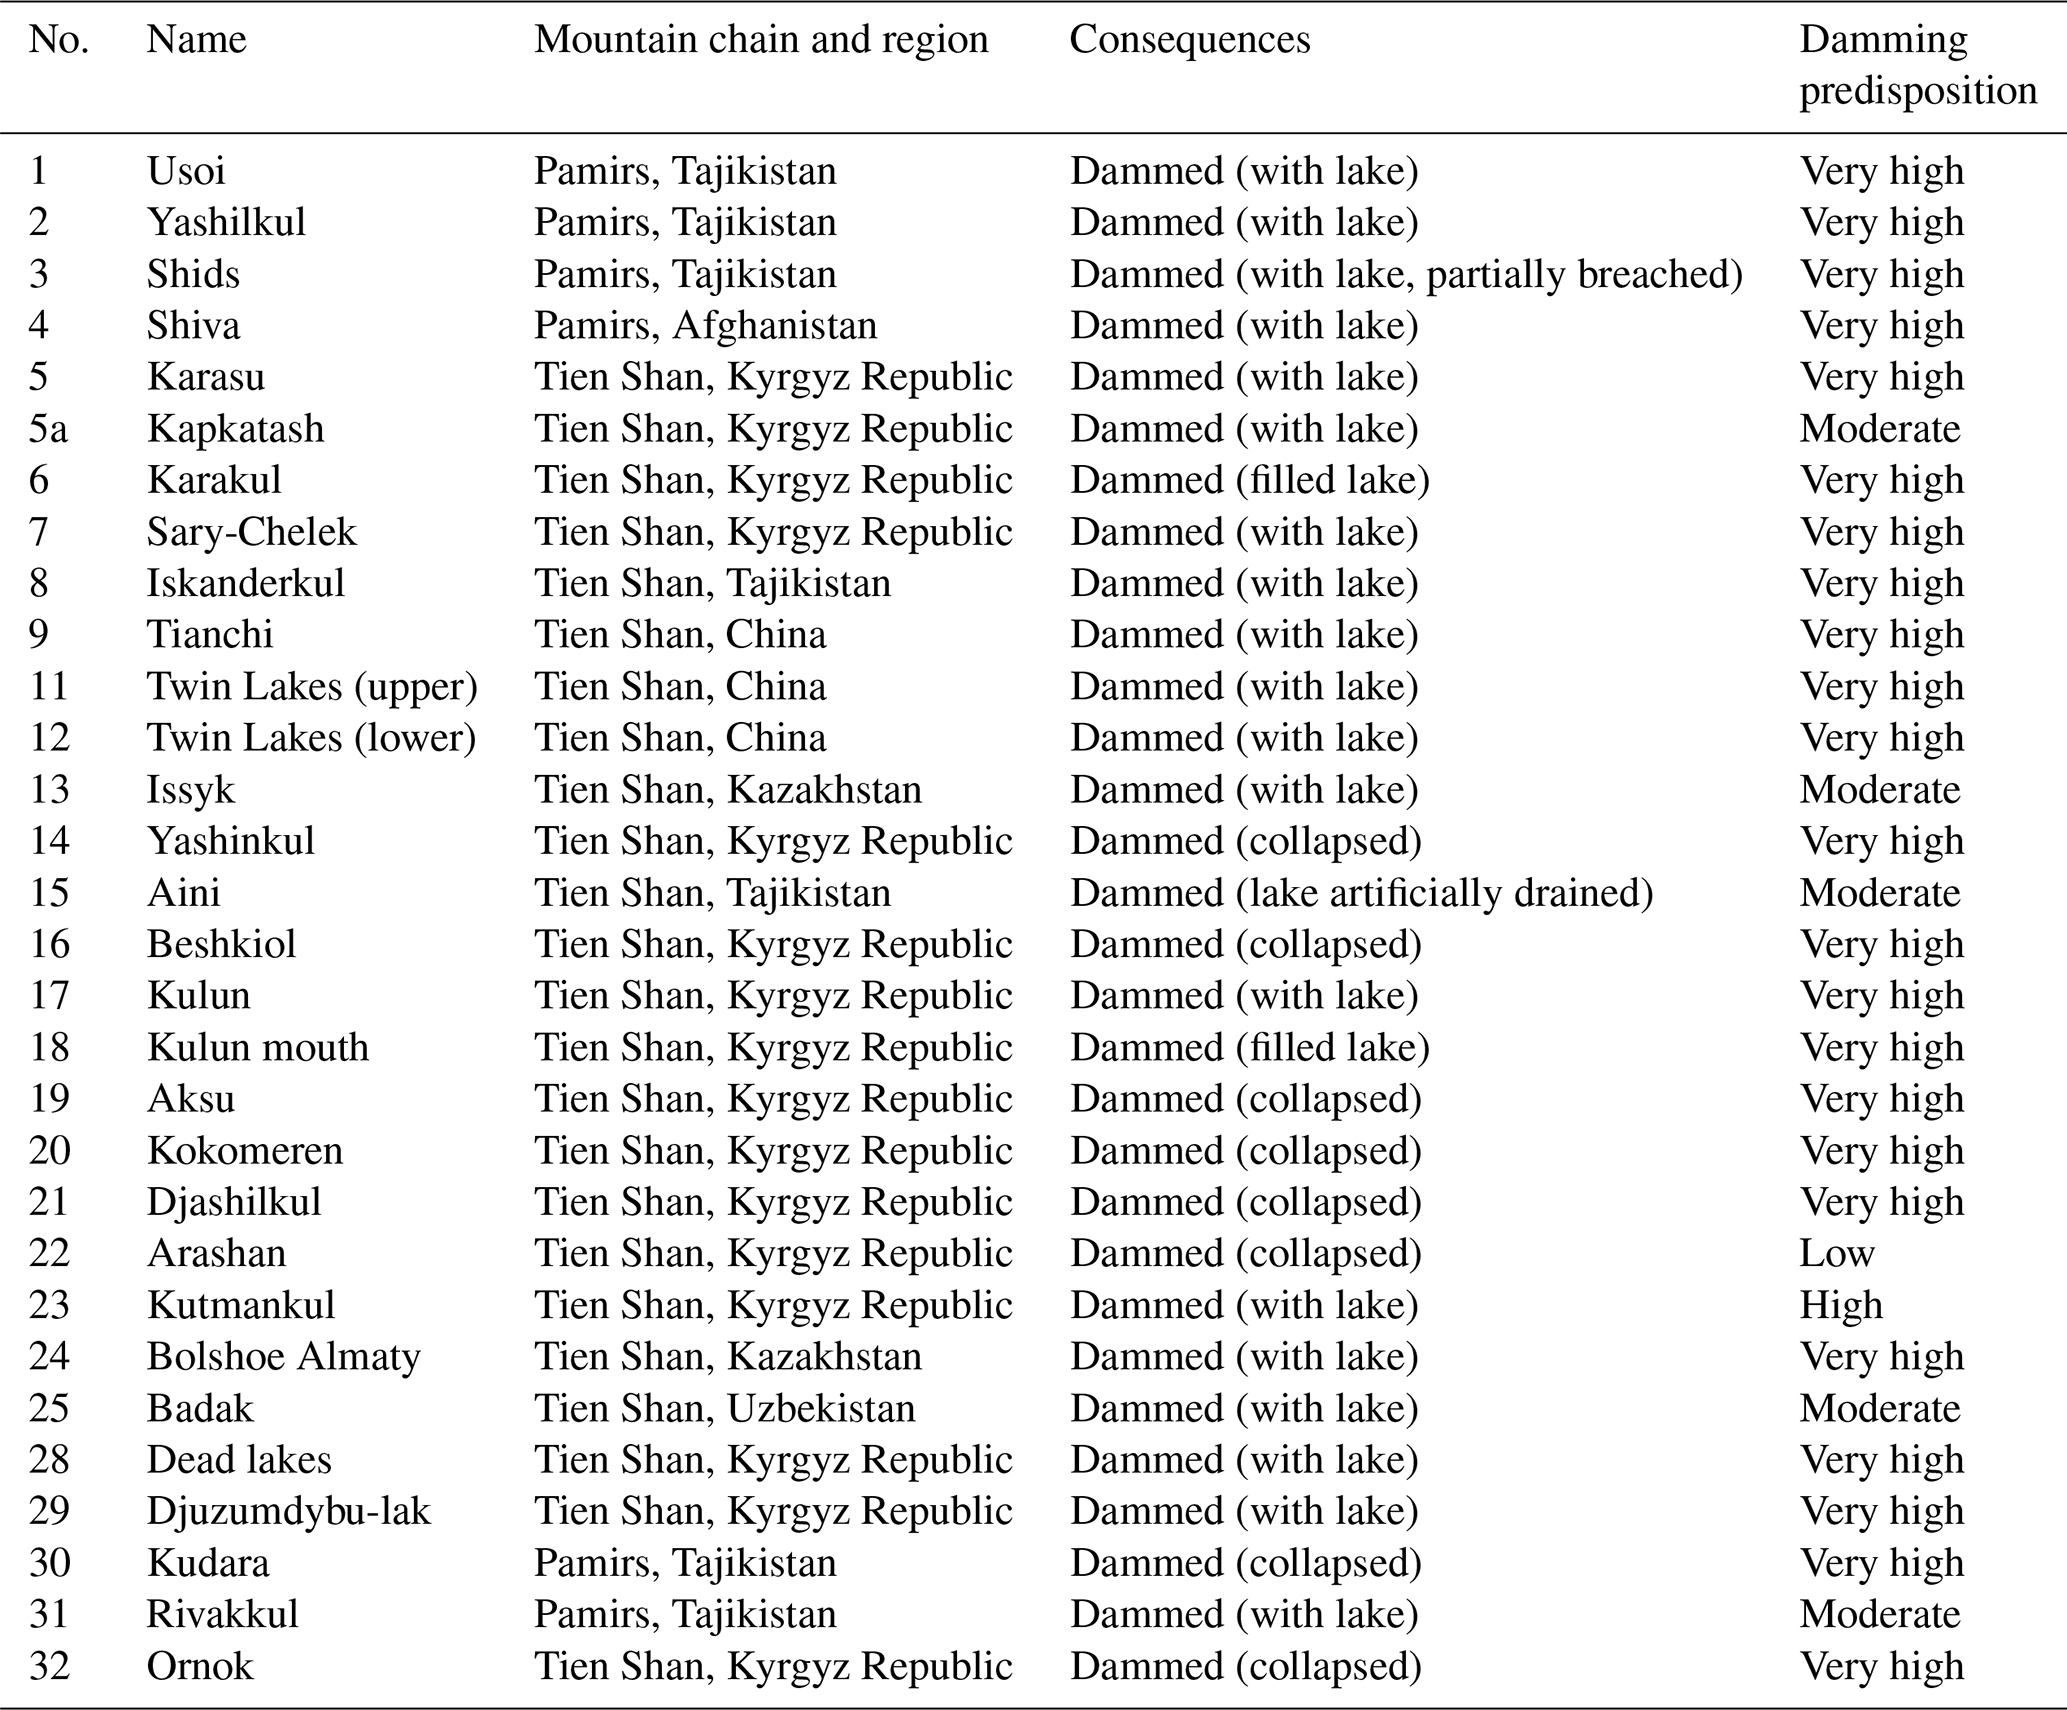
Considering the size of the area, in Fig. 9 the number of landslides classified with a very high damming predisposition (166 cases) is reasonable in absolute value, even if it is a bit high if compared with the total number of landslides present in the inventory (8910 cases). Without a detailed study it is not possible to say how many of these are false positives or not; however it is important to remember that this type of hazard mapping method gives information on if and where these events may occur, not when. Although a validation of all the results is not possible, we can verify some of these through comparison with cases known in the area, as shown in Fig. 22. These landslides have been documented in Strom (2010), who has reported several landslide dams in Central Asia regions. In Table 5 the current conditions of the landslides are compared with their damming predisposition classification using the methodology proposed here (before the intensity reduction in the classification by one class of the landslides that intersect the river network). From this information it can be observed that 23 (77 % of the total) of these landslides were correctly classified with the very high predisposition value, 1 (3 %) was correctly classified as high, and 5 (17 %) were correctly classified as moderate. Only one landslide, no. 22 called Arashan in Strom (2010), was classified as having a low predisposition despite the fact that it obstructed the Alamüdün River and then collapsed and deeply eroded. This classification error can be explained by the missing landslide volume eroded by the river, as a bigger value would probably have provided a higher predisposition. Based on this simple comparison, approximately 80 % of the landslide dams analyzed by Strom (2010) have a corrected damming predisposition value (very high) based on their volume and the width of their valley. The final classification value of the damming predisposition of all of the landslide dams has been downgraded by one class as they intersect the river network (see “Materials and methods” in Sect. 3).
The two maps of damming susceptibility (Figs. 11 and 13), while they do not provide probability values as done by Tacconi Stefanelli et al. (2020), offer information (the volumes of landslides) that can more easily be used and interpreted even by operators who are not specifically experts, and for this reason have more practical utility. Furthermore, the classification of the river stretches produced thus far, not requiring the alpha parameter (linked to the probability of landslide occurrence) as in the original method proposed by Tacconi Stefanelli et al. (2020), is much easier to obtain, and for this reason it can be considered an improvement within the view of wider usability.
The price of a river obstruction, in terms of reconstruction and losses with respect to the economy and lives, can be much higher compared with the costs of proper environmental planning and land-use management. Being able to define areas with higher risk could considerably lower costs, allowing stakeholders to focus economic resources on effective preventive interventions as well as planning and monitoring activities.
In this work a damming mapping methodology has been proposed and carried out on the regions of Central Asia as part of a multi-hazard approach in the framework of the Strengthening Financial Resilience and Accelerating Risk Reduction in Central Asia (SFRARR) project. The method used, originally developed applying the Morphological Obstruction Index at basin scale, has been modified to fit such a large study area and the available data. Over 8000 landslides and the entire river network of the studied area have been analyzed to propose a practical tool to assess where the damming susceptibility, from reactivation of mapped landslides and formation of new landslides, is higher at national scale. The improvement of the original method allows for simpler application over a wider area, as the technical knowledge and data required can also be managed by a non-expert operator, and the need for less data that are more easily available. The main limitation of the work is related to the uncertainty in the reliability of the results at local scale due to the absence of a possible validation of all results, requiring many in-depth specific studies in the areas identified with higher predisposition. This uncertainty can be improved in future studies by using data with better resolution, coverage, and quality.
Besides its limitations, this tool can be undoubtedly useful in very large countries where there is a lack of diffuse assessment of landslide activity, providing preliminary information about damming susceptibility to adopt risk reduction measures, for land management and as a starting point for future studies in specific areas potentially more subject to the damming hazard identified in this work.
The landslide dam mapping susceptibility method was implemented by using the cited landslide inventory maps, published by the following authors: Behling et al. (2014, 2016), Behling and Roessner (2020, https://doi.org/10.5880/GFZ.1.4.2020.001), Havenith et al. (2015a), and Strom and Abdrakhmatov (2018). The SRTM DEM data are available from https://doi.org/10.5067/MEaSUREs/SRTM/SRTMGL1.003 (NASA JPL, 2013). The river network and other landslide inventories were provided by the SFRARR project partners: Risk, Engineering + Development (RED; Pavia, Italy); the National Institute of Oceanography and Experimental Geophysics (OGS; the Seismological Research Centre, Trieste, Italy), the Institute of Water Problems, Hydropower, Engineering and Ecology (IWPHE; Dushanbe, Republic of Tajikistan), the Institute of Seismology of the Academy of Sciences of Uzbekistan (ISASUZ; Tashkent, Uzbekistan); and the Institute of Seismology of the Science Committee (LLP; Republic of Kazakhstan, Almaty).
CTS implemented the damming mapping method, WF and CTS conceived the article structure and collected the data, and FC supported the method application in parts of the study area. FC also performed statistical analysis involving the method results. All the aforementioned authors contributed to the writing of the article and the figure graphics. VT coordinated the work and reviewed the paper. ZR and RU provided environmental and geomorphological information and part of the landslide database for Kazakhstan and the Kyrgyz Republic.
The contact author has declared that none of the authors has any competing interests.
Publisher’s note: Copernicus Publications remains neutral with regard to jurisdictional claims made in the text, published maps, institutional affiliations, or any other geographical representation in this paper. While Copernicus Publications makes every effort to include appropriate place names, the final responsibility lies with the authors.
This article is part of the special issue “Regionally consistent risk assessment for earthquakes and floods and selective landslide scenario analysis in Central Asia”. It is not associated with a conference.
This work was developed within the World Bank-funded Strengthening Financial Resilience and Accelerating Risk Reduction in Central Asia (SFRARR) project, in collaboration with the European Union, and the Global Facility for Disaster Reduction and Recovery (GFDRR), with the goal of improving financial resilience and risk-informed investment planning in central Asian countries (Kazakhstan, the Kyrgyz Republic, Tajikistan, Turkmenistan, and Uzbekistan). This work is part of the results of the Task 7 Landslide Scenario Assessment, managed by the UNESCO Chair on the Prevention and Sustainable Management of Geo-Hydrological Hazards (University of Florence, Italy). In particular, the authors would like to thank Gabriele Coccia and Paola Ceresa from Red Risk Engineering (Pavia, Italy) for providing river network data and for their valuable coordination and constant support, as well as Alexander Strom and Hans Balder Havenith for providing landslide inventories and for their constructive advice and valuable observations. We would also like to thank the partners from Central Asia for the fruitful collaboration, in particular IWPHE (Tajikistan), ISASUZ, and the State Monitoring Service of the Republic of Uzbekistan for tracking dangerous geological processes (Uzbekistan), as well as the Institute of Seismology of the National Academy of Sciences of Kyrgyz Republic (ISNASKR) and the Institute of Seismology Limited Liability Partnership (LLP) of Kazakhstan.
This research has been supported by the World Bank Group (consulting services contract no. 8006611 – Regionally consistent risk assessment for earthquakes and floods and selective landslide scenario analysis for strengthening financial resilience and accelerating risk reduction in Central Asia).
This paper was edited by Paola Ceresa and reviewed by Corrado Cencetti and two anonymous referees.
Abdrakhmatov, K., Havenith, H. B., Delvaux, D., Jongmans, D., and Trefois, P.: Probabilistic PGA and Arias Intensity Maps of Kyrgyz Republic (Central Asia), J. Seismol., 7, 203–220, 2003.
Abdrakhmatov, K. Y., Aldazhanov, S. A., Hager, B. H., Hamburger, M. W., Herring, T. A., Kalabaev, K. B., Makarov, P., Molnar, S. V., Panasyuk, M. T., Prilepin, R. E., Reilinger, I. S., Sadybakasov, B. J., Souter, Yu. A., Trapeznikov, V. Ye., and Tsurkov Zubovich, A. V.: Relatively recent construction of the Tien Shan inferred from GPS measurements of present-day crustal deformation rates, Nature, 384, 450–45319, 1996.
Behling, R. and Roessner, S.: Multi-temporal landslide inventory for a study area in Southern Kyrgyz Republic derived from RapidEye satellite time series data (2009–2013), V. 1.0, GFZ Data Services [data set], https://doi.org/10.5880/GFZ.1.4.2020.001, 2020.
Behling, R., Roessner, S., Kaufmann, H., and Kleinschmit, B.: Automated spatiotemporal landslide mapping over large areas using rapideye time series data, Remote Sens., 6, 8026–8055, 2014.
Behling, R., Roessner, S., Golovko, D., and Kleinschmit, B.: Derivation of long-term spatiotemporal landslide activity – A multi-sensor time series approach, Remote Sens. Environ., 186, 88–104, 2016.
Borgatti, L. and Soldati, M.: Landslides as a geomorphological proxy for climate change: a record from the Dolomites (northern Italy), Geomorphology, 120, 56–64, 2010.
CAC DRMI: Risk assessment for Central Asia and Caucasus: desk study review, project report, Central Asia and Caucasus Disaster Risk Management Initiative, technical report, https://www.gfdrr.org/en/publication/central-asia-and-caucasus-disaster-risk-management-initiative (last access: 1 April 2023), 2009.
Canuti, P., Casagli, N., Ermini, L., Fanti, R., and Farina, P.: Landslide activity as a geoindicator in Italy: significance and new perspectives from remote sensing, Environ. Geol., 45, 907–919, 2004.
Casagli, N. and Ermini, L.: Geomorphic analysis of landslide dams in the Northern Apennine, Trans. Jpn. Geomorphol. Union., 20, 219–249, 1999.
Catani, F., Tofani, V., and Lagomarsino, D.: Spatial patterns of landslide dimension: a tool for magnitude mapping, Geomorphology, 273, 361–373, https://doi.org/10.1016/j.geomorph.2016.08.032, 2016.
Chedia, O. K. and Lemzin, I.N.: Seismogenerating faults of the Chatkal depression, in: Seismotectonics and seismicity of the Tien Shan, technical report, Frunze, Ilim, 18–28, 1980.
Chen, C. Y. and Chang, J. M.: Landslide dam formation susceptibility analysis based on geomorphic features, Landslides, 13, 1019–1033, 2016.
Coccia, G., Ceresa, P., Bussi, G., Denaro, S., Bazzurro, P., Martina, M., Fagà, E., Avelar, C., Ordaz, M., Huerta, B., Garay, O., Raimbekova, Z., Abdrakhmatov, K., Mirzokhonova, S., Ismailov, V., and Belikov, V.: Large-scale flood risk assessment in data scarce areas: an application to Central Asia, Nat. Hazards Earth Syst. Sci. Discuss. [preprint], https://doi.org/10.5194/nhess-2023-157, in review, 2023.
Costa, J. E. and Schuster, R. L.: Formation and failure of natural dams, B. Geol. Soc. Am., 100, 1054–1068, https://doi.org/10.0016-1988)100/0016-7606(1988)100<1054:TFAFON>2.3.CO, 1988.
Costa, J. E. and Schuster, R. L.: Documented historical landslide dams from around the world, US Geol. Surv. Open-File Report, 91, 1–486, 1991.
Crozier, M. J.: Deciphering the effect of climate change on landslide activity: a review, Geomorphology, 124, 260–267, 2010.
Dai, F. C., Lee, C. F., Deng, J. H., and Tham, L.G.: The 1786 earthquake-triggered landslide dam and subsequent dam-break flood on the Dadu River, southwestern China, Geomorphology, 65, 205-221, 2005.
Dal Sasso, S. F., Sole, A., Pascale, S., Sdao, F., Bateman Pinzòn, A., and Medina, V.: Assessment methodology for the prediction of landslide dam hazard, Nat. Hazards Earth Syst. Sci., 14, 557–567, https://doi.org/10.5194/nhess-14-557-2014, 2014.
Danneels, G., Bourdeau, C., Torgoev, I., and Havenith, H. B.: Geophysical investigation and dynamic modelling of unstable slopes: case-study of Kainama (Kyrgyzstan), Geophys. J. Int., 175, 17–34, 2008.
Delvaux, D., Abdrakhmatov, K. E., Lemzin, I. N., and Strom, A. L.: Landslides and surface breaks of the 1911 Ms 8.2 Kemin earthquake, Kyrgyzstan, Russ. Geol. Geophys., 42, 1667–1677, 2001.
Dikau, R. and Schrott, L.: The temporal stability and activity of landslides in Europe with respect to climatic change (TESLEC): main objectives and results, Geomorphology, 30, 1–12, 1999.
Drăguţ, L. and Dornik, A.: Land-surface segmentation as a method to create strata for spatial sampling and its potential for digital soil mapping, Int. J. Geogr. Inf. Sci., 30, 1359–1376, 2016.
Ermini, L. and Casagli, N.: Prediction of the behavior of landslide dams using a geomorphical dimensionless index, Earth Surf. Proc. Land., 28, 31–47, https://doi.org/10.1002/esp.424, 2003.
Falátková, K.: Temporal analysis of GLOFs in high-mountain regions of Asia and assessment of their causes, AUC Geographica, 51, 145–154, 2016.
Fan, X., Rossiter, D. G., van Westen, C. J., Xu, Q., and Görüm, T.: Empirical prediction of coseismic landslide dam formation, Earth. Surf. Proc. Land., 39, 1913–1926, 2014.
Fan, X., Dufresne, A., Subramanian, S. S., Strom, A., Hermanns, R., Tacconi Stefanelli, C., Hewitt, K., Yunus, A. P., Dunning, S., Capra, L., Geertsema, M., Miller, B., Casagli, N., Jansen, J. D., and Xu, Q.: The formation and impact of landslide dams – State of the art, Earth Sci. Rev., 203, 103116, https://doi.org/10.1016/j.earscirev.2020.103116, 2020.
Fan, X., Dufresne, A., Whiteley, J., Yunus, A. P., Subramanian, S. S., Okeke, C. A., Pánek, T., Hermanns, R., Ming, P., Strom, A., Havenith, H. B., Dunning, S., Wang, G., and Tacconi Stefanelli, C.: Recent technological and methodological advances for the investigation of landslide dams, Earth-Sci. Rev., 218, 103646, https://doi.org/10.1016/j.earscirev.2021.103646, 2021.
Farr, T. G. and Kobrick, M.: Shuttle Radar Topography Mission produces a wealth of data, Eos T. AGU, 81, 583–583, 2000.
Golovko, D., Roessner, S., Behling, R., Wetzel, H. U., and Kleinschmidt, B.: Development of multi-temporal landslide inventory information system for southern Kyrgyz Republic using GIS and satellite remote sensing, Photogrammetrie-Fernerkundung-Geoinformation, 2015, 157–172, 2015.
Guzzetti, F., Ardizzone, F., Cardinali, M., Rossi, M., and Valigi, D.: Landslide volumes and landslide mobilization rates in Umbria, central Italy, Earth Planet. Sc. Lett., 279, 222–229, 2009.
Havenith, H. B., Strom, A., Cacerez, F., and Pirard, E.: Analysis of landslide susceptibility in the Suusamyr region, Tien Shan: statistical and geotechnical approach, Landslides, 3, 39–50, 2006a.
Havenith, H. B., Torgoev, I., Meleshko, A., Alioshin, Y., Torgoev, A., and Danneels, G.: Landslides in the Mailuu-Suu Valley, Kyrgyz Republic – hazards and impacts, Landslides, 3, 137–147, 2006b.
Havenith, H. B., Strom, A., Torgoev, I., Torgoev, A., Lamair, L., Ischuk, A., and Abdrakhmatov, K.: Tien Shan geohazards database: Earthquakes and landslides, Geomorphology, 249, 16–31, 2015a.
Havenith, H. B., Torgoev, A., Schlögel, R., Braun, A., Torgoev, I., and Ischuk, A.: Tien Shan geohazards database: Landslide susceptibility analysis, Geomorphology, 249, 32–43, 2015b.
Havenith, H. B., Umaraliev, R., Schlögel, R., Torgoev, I., Ruslan, U., Schlogel, R., and Torgoev, I.: Past and Potential Future Socioeconomic Impacts of Environmental Hazards in Kyrgyz Republic. In Kyrgyz Republic: Political, Economic and Social Issues, edited by: Olivier, A. P., Nova Science Publishers, Inc., Hauppauge, NY, USA, 63–113, ISBN 978-1-53612-763-8, 2017.
Hungr, O. and Evans, S. G.: Entrainment of debris in rock avalanches: an analysis of a long run-out mechanism, Geol. Soc. Am. Bull., 116, 1240–1252, 2004.
Juliev, M., Pulatov, A., and Hubl, J.: Natural hazards in mountain regions of Uzbekistan: A review of mass movement processes in Tashkent province, International Journal of Scientific and Engineering Research, 8, 1102, https://doi.org/10.14299/ijser.2017.02.013, 2017.
Kalmetieva, Z. A., Mikolaichuk, A. V, Moldobekov, B. D., Meleshko, A. V., Janaev, M. M., and Zubovich, A. V.: Atlas of earthquakes in Kyrgyz Republic. Central-Asian Institute for Applied Geosciences and United Nations International Strategy for Disaster Reduction Secretariat Office in Central Asia, Bishkek, p. 75, ISBN 978-9967-25-829-7, 2009.
King, J., Loveday, I., and Schuster, R. L.: The 1985 Bairaman landslide dam and resulting debris flow, Papua New Guinea, Q. J. Eng. Geol. Hydroge., 22, 257–270, 1989.
Kropáček, J., Vilímek, V., and Mehrishi, P.: A preliminary assessment of the Chamoli rock and ice avalanche in the Indian Himalayas by remote sensing, Landslides, 18, 3489–3497, https://doi.org/10.1007/s10346-021-01742-1, 2021.
Liao, H. M., Yang, X. G., Lu, G. D., Tao, J., and Zhou, J. W.: A geotechnical index for landslide dam stability assessment, Geomatics, Natural Hazards and Risk, 13, 854–876, https://doi.org/10.1080/19475705.2022.2048906, 2022.
Maxwell, A. E. and Shobe, C. M.: Land-surface parameters for spatial predictive mapping and modeling, Earth-Sci. Rev., 226, 103944, https://doi.org/10.1016/j.earscirev.2022.103944, 2022.
Molnar, P. and Tapponnier, P.: Cenozoic Tectonics of Asia: Effects of a Continental Collision: Features of recent continental tectonics in Asia can be interpreted as results of the India-Eurasia collision, Science, 189, 419–426, 1975.
NASA JPL: NASA Shuttle Radar Topography Mission Global 1 arc second, NASA EOSDIS Land Processes DAAC [data set], https://doi.org/10.5067/MEaSUREs/SRTM/SRTMGL1.003, 2013.
Niyazov, R. A.: Uzbekistan landslides, Uzbekistan landslide service, Technical report, 2020.
Peresan, A., Scaini, C., Tyagunov, S., and Ceresa, P.: Capacity Building Experience for Disaster Risk Reduction in Central Asia, Nat. Hazards Earth Syst. Sci. Discuss. [preprint], https://doi.org/10.5194/nhess-2023-156, in review, 2023.
Persits, F. M., Ulmishek, G. F., and Steinshouer, D. W.: Maps showing geology, oil and gas fields and geologic provinces of the Former Soviet Union (No. 97-470-E), US Geological Survey, https://doi.org/10.3133/ofr97470E, 1997.
Petrov, M. A., Sabitov, T. Y., Tomashevskaya, I. G., Glazirin, G. E., Chernomorets, S. S., Savernyuk, E. A., Tutubalina O. V., Petrakov, D. A., Sokolov, L. S., Dokukin, M. D., Mountrakis, G., Ruiz-Villanueva, V., and Stoffel, M.: Glacial lake inventory and lake outburst potential in Uzbekistan, Sci. Total Environ., 592, 228–242, 2017.
Piroton, V., Schlögel, R., Barbier, C., and Havenith, H. B.: Monitoring the recent activity of landslides in the Mailuu-suu valley (Kyrgyz Republic) using radar and optical remote sensing techniques, Geosciences, 10, 164, https://doi.org/10.3390/geosciences10050164, 2020.
Popescu, M. E. and Sasahara, K.: Engineering Measures for Landslide Disaster Mitigation, in: Landslides – Disaster Risk Reduction, edited by: Sassa, K., Canuti, P., Springer, Berlin, Heidelberg, 609–631, https://doi.org/10.1007/978-3-540-69970-5_32, 2009.
Righini, M. and Surian, N.: Remote sensing as a tool for analysing channel dynamics and geomorphic effects of floods, Flood monitoring through remote sensing, in: Flood Monitoring through Remote Sensing, Springer International Publishing, Berlin/Heidelberg, Germany, 27–59, https://doi.org/10.1007/978-3-319-63959-8_2, 2018.
Rosi, A., Frodella, W., Nocentini, N., Caleca, F., Havenith, H. B., Strom, A., Saidov, M., Bimurzaev, G. A., and Tofani, V.: Comprehensive landslide susceptibility map of Central Asia, Nat. Hazards Earth Syst. Sci., 23, 2229–2250, https://doi.org/10.5194/nhess-23-2229-2023, 2023.
Saponaro, A., Pilz, M., Wieland, M., Bindi, D., Moldobekov, B., and Parolai, S.: Landslide susceptibility analysis in data-scarce regions: the case of Kyrgyz Republic, B. Eng. Geol. Environ., 74, 1117–1136, 2014.
Schlögel, R., Torgoev, I., De Marneffe, C., and Havenith, H. B.: Evidence of a changing size-frequency distribution of landslides in the Kyrgyz Tien Shan, Central Asia, Earth Surf. Proc. Land., 36, 1658–1669, 2011.
Schuster, R. L. and Evans, S. G.: Engineering Measures for the Hazard Reduction of Landslide Dams, in: Natural and Artificial Rockslide Dams. Lecture Notes in Earth Sciences, edited by: Evans, S., Hermanns, R., Strom, A., and Scarascia-Mugnozza, G., Springer, Berlin, Heidelberg, https://doi.org/10.1007/978-3-642-04764-0_2, 2011.
Semakova, E., Gunasekara, K., and Semakov, D.: Identification of the glaciers and mountain naturally dammed lakes in the Pskem, the Kashkadarya and the Surhandarya River basins, Uzbekistan, using ALOS satellite data, Geomat. Nat. Haz. Risk, 7, 1081–1098, 2016.
Styron, R. and Pagani, M.: The GEM Global Active Faults Database, Earthquake Spectra, 36, 160–180, https://doi.org/10.1177/8755293020944182, 2020.
Strom, A.: Landslide dams in Central Asia region, Journal of the Japan Landslide Society, 47, 309–324, 2010.
Strom, A. and Abdrakhmatov, K.: Large-Scale Rockslide Inventories: From the Kokomeren River Basin to the Entire Central Asia Region, WCoE 2014–2017, IPL-106-2, in: 4th World Landslide Forum, Ljubljana, Slovenia, 29 May–2 June 2017, Springer, Cham, 339–346, https://doi.org/10.1007/978-3-319-59469-9_28, 2017.
Strom, A. and Abdrakhmatov. K.: Rockslides and rock avalanches of Central Asia: distribution, morphology, and internal structure, Elsevier, 441 pp., ISBN 978-0-12-803204-6, 2018.
Swanson, F. J., Oyagi, N., and Tominaga, M.: Landslide dams in Japan, in: Landslide dams: processes, risk and mitigation, vol 3, edited by: Schuster R. L., Geotech. Sp., ASCE, New York, 131–145, ISBN 10 0872625249, ISBN 13 978-0872625242, 1986.
Tacconi Stefanelli, C., Catani, F., and Casagli, N.: Geomorphological investigations on landslide dams, Geoenv. Disast., 2, 1–15, https://doi.org/10.1186/s40677-015-0030-9, 2015.
Tacconi Stefanelli, C., Segoni, S., Casagli, N., and Catani, F.: Geomorphic indexing of landslide dams evolution, Eng. Geol., 208, 1–10, https://doi.org/10.1016/j.enggeo.2016.04.024, 2016.
Tacconi Stefanelli, C., Vilímek, V., Emmer, A., and Catani, F.: Morphological analysis and features of the landslide dams in the Cordillera Blanca, Peru, Landslides, 15, 507–521, https://doi.org/10.1007/s10346-017-0909-5, 2018.
Tacconi Stefanelli, C., Casagli, N., and Catani, F.: Landslide damming hazard susceptibility maps: a new GIS-based procedure for risk management, Landslides, 17, 1635–1648, https://doi.org/10.1007/s10346-020-01395-6, 2020.
Trifonov, V. G., Makarov, V. I., and Scobelev, S. F.: The Talas-Fergana active right-slip faults, Ann. Tectonicae, 6, 224–237, 1992.
Ullah, S., Bindi, D., Pilz, M., Danciu, L., Weatherill, G., Zuccolo, E., Anatoly Ischuk, A., Mikhailova, N. N., Abdrakhmatov, K., and Parolai, S.: Probabilistic seismic hazard assessment for Central Asia, Ann. Geophys., 58, S0103, https://doi.org/10.4401/ag-6687, 2015.
Wang, X., Ding, Y., Liu, S., Jiang, L., Wu, K., Jiang, Z., and Guo, W.: Changes of glacial lakes and implications in Tian Shan, central Asia, based on remote sensing data from 1990 to 2010, Environ. Res. Lett., 8, 044052, https://doi.org/10.1088/1748-9326/8/4/044052, 2013.
Wang, D., Laffan, S. W., Liu, Y., and Wu, L.: Morphometric characterization of landform from DEMs, Int. J. Geogr. Inf. Sci., 24, 305–326, 2010.
Wood, J.: Geomorphometry in LandSerf, in: Geomorphometry: Concepts, Software, Applications, edited by: Hengl, T. and Reuter, H. I., Dev. Soil. Sci., 33, 333–349, https://doi.org/10.1016/S0166-2481(08)00014-7, 2009.
Zubovich, A. V., Wang, X. Q., Scherba, Y. G., Schelochkov, G. G., Reilinger, R., Reigber, C., Mosienko, O., Molnar, P., Michajljow, W., Makarov, V. I., Li, J., Kuzikov, S. I., Herring, T. A., Hamburger, M. W., Hager, B. H., Dang, Y., Bragin, V. D., and Beisenbaev, R.: GPS velocity field for the Tien Shan and surrounding regions, Tectonics, 29, TC6014, https://doi.org/10.1029/2010TC002772, 2010.