the Creative Commons Attribution 4.0 License.
the Creative Commons Attribution 4.0 License.
 | 06 May 2024
Assessing locations susceptible to shallow landslide initiation during prolonged intense rainfall in the Lares, Utuado, and Naranjito municipalities of Puerto Rico
Dianne L. Brien
Mark E. Reid
William H. Schulz
Matthew J. Tello
Hurricane Maria induced about 70 000 landslides throughout Puerto Rico, USA, including thousands each in three municipalities situated in Puerto Rico's rugged Cordillera Central range. By combining a nonlinear soil-depth model, presumed wettest-case pore pressures, and quasi-three-dimensional (3D) slope-stability analysis, we developed a landslide susceptibility map that has very good performance and continuous susceptibility zones having smooth, buffered boundaries. Our landslide susceptibility map enables assessment of potential ground-failure locations and their use as landslide sources in a companion assessment of inundation and debris-flow runout. The quasi-3D factor of safety, F3, showed strong inverse correlation to landslide density (high density at low F3). Area under the curve (AUC) of true positive rate (TPR) versus false positive rate (FPR) indicated success of F3 in identifying head-scarp points (AUC = 0.84) and source-area polygons (0.85 ≤ AUC ≤ 0.88). The susceptibility zones enclose specific percentages of observed landslides. Thus, zone boundaries use successive F3 levels for increasing TPR of landslide head-scarp points, with zones bounded by F3 at TPR = 0.75, very high; F3 at TPR = 0.90, high; and the remainder moderate to low. The very high susceptibility zone, with 118 landslides km−2, covered 23 % of the three municipalities. The high zone (51 landslides km−2) covered another 10 %.
- Article
(28232 KB) - Full-text XML
-
Supplement
(23298 KB) - BibTeX
- EndNote


Landslide susceptibility maps are widely used to mitigate the major hazards landslides pose to people, public and private property, lifelines, utilities, and businesses. Reliable application of physically based models to landslide susceptibility assessment has been intensively researched since the 1990s. Many models and computer codes for such assessments exist (Montgomery and Dietrich, 1994; Wu and Sidle, 1995; Pack et al., 1998; Simoni et al., 2008; Baum et al., 2010; Arnone et al., 2011; Rossi et al., 2013). Nevertheless, several scientific and technical challenges complicate the application of these models over large areas. These challenges exist, in part, because many geological, hydrological, and geotechnical details of the subsurface remain unknowable except at points of direct observation. Among others, the subsurface knowledge gaps include (1) relationships between soil thickness and shallow landslide depth, (2) model parameter spatial distribution and variability, (3) pore pressure and effective stress distributions, and (4) landslide failure modes. Research has made much progress in addressing these knowledge gaps. For example, many physically based and empirical soil-depth models are available (Roering, 2008; Pelletier and Rasmussen, 2009; Ho et al., 2012; Catani et al., 2010; Nicótina et al., 2011; Gomes et al., 2016; Patton et al., 2018; Yan et al., 2021; Xiao et al., 2023), making it possible to estimate the field distribution of soil depth in landslide prone areas (Godt et al., 2008a; Segoni et al., 2009; Ho et al., 2012). Some studies have combined field or laboratory measured properties with mapped lithologic characteristics and statistical analysis to describe the spatial distribution of soil properties (Godt et al., 2008b; Tofani et al., 2017). Many other studies have applied probabilistic approaches successfully to address parameter uncertainty and improve accuracy of physically based modeling of landslide susceptibility (Raia et al., 2014; Zieher et al., 2017; Canli et al., 2018; Palacio Cordoba et al., 2020; Wang et al., 2020; Medina et al., 2021). Despite these advances, accurate assessment of landslide susceptibility using physically based methods remains difficult.
Most physically based landslide susceptibility models have relied on the one-dimensional (1D) infinite-slope analysis to model slope stability. This approximation is suitable for representing shallow landslides in raster-based topography where the resolution (grid-cell spacing) is tens of meters. However, applying the 1D analysis to high-resolution (a few meters or less) topography violates the 1D assumptions of laterally uniform stress and a planar failure surface. A few spatially distributed three-dimensional (3D) (Mergili et al., 2014a, b; Reid et al., 2015) and quasi-3D (von Ruette et al., 2013; Milledge et al., 2015) methods have become available to overcome limitations of the 1D analysis. In the quasi-3D method of von Ruette et al. (2013), soil columns interact with their neighbors and load is redistributed when driving forces at the base of a column exceed basal strength. Milledge et al. (2015) used a search algorithm to identify patches of potentially unstable grid cells by assuming driving forces acting on a group of cells exceed the resisting forces at the group's margins and that cell groups act as rigid blocks with a failure surface at the soil–bedrock interface. Mergili et al. (2014a, b) assumed 3D landslide geometry based on ellipsoidal failure surfaces and used Hovland's (1977) force-equilibrium method to analyze stability across a digital landscape. Reid et al. (2015) used spherical trial surfaces with moment-equilibrium analysis methods, which tend to be more accurate than methods based on force equilibrium alone.
The main objective of this work is to produce integrated maps of potential landslide initiation and inundation areas. Secondary objectives are to integrate soil-depth modeling, consideration of parameter variability, and quasi-3D slope stability analysis into our assessments. Our approach to soil-depth modeling achieves a good compromise between swift, simple methods (constant depth or simple empirical methods, such as DeRose et al., 1991), and the most complicated and computationally intensive (Xiao et al., 2023). Likewise, this is valid for our quasi-3D slope stability analysis. Although much progress has been made in methods for assessing landslide susceptibility (e.g., Carrara et al., 1999; Chung and Fabbri, 2003; Lee et al., 2003; Godt et al., 2008b; Baum et al., 2014; Canli et al., 2018) as well as debris-flow inundation (George and Iverson, 2014; Reid et al., 2016; Aaron et al., 2017; Bessette-Kirton et al., 2019b), combining these two types of assessments into a single map for an area of hundreds of square kilometers remains challenging (Ellen et al., 1993; Benda et al., 2007; Fan et al., 2017; Hsu and Liu, 2019; Mergili et al., 2019). As noted previously, one of the challenges is estimating potential source-area extent and depth. We addressed this challenge by modeling soil depth and using it to approximate potential source-area depth in 1D and quasi-3D slope stability models for use in assessing regional shallow-landslide susceptibility. Such an approach helps ensure that the susceptibility model accounts for variable failure depth across the landscape and that predicted areas of potential landslide sources are acceptable for use in assessing debris-flow inundation. We compared results of several soil-depth models to find the one that performed the best in our study area. The quasi-3D model uses a simplified limit-equilibrium analysis to estimate the stability of a slab- or goldpan-shaped trial landslide. Another challenge is establishing meaningful susceptibility categories, which we addressed by delimiting the categories at quasi-3D factor of safety values, F3, that enclose specific percentages of landslide sources, rather than relying on theoretical or arbitrary factor of safety values to delimit the categories. By showing similar outcomes (areas that capture specific percentages of observed landslides), maps based on this approach are directly comparable to each other.
In the aftermath of Hurricane Maria, the U.S. Geological Survey (USGS) began working with local partners to conduct detailed assessments of landslide and debris-flow hazards, both island-wide (Bessette-Kirton et al., 2017; Hughes and Schulz, 2020a, b) and more locally (this study) for three impacted municipalities (Lares Municipio, Utuado Municipio, and Naranjito Municipio) in the central mountains of Puerto Rico (Fig. 1). These municipalities were an ideal location for testing and developing methods for such assessments. Here we describe the landslide initiation (source area) part of a landslide susceptibility assessment for these municipalities. Estimating landslide initiation potential is part of a larger effort (in progress; Brien et al., 2021) to estimate overall hazard from (1) landslide initiation (ground failure), (2) landslide runout, and (3) debris-flow inundation from future extreme rainfall, including tropical cyclones (hurricanes), as well as localized storms expected to impact these areas of Puerto Rico.
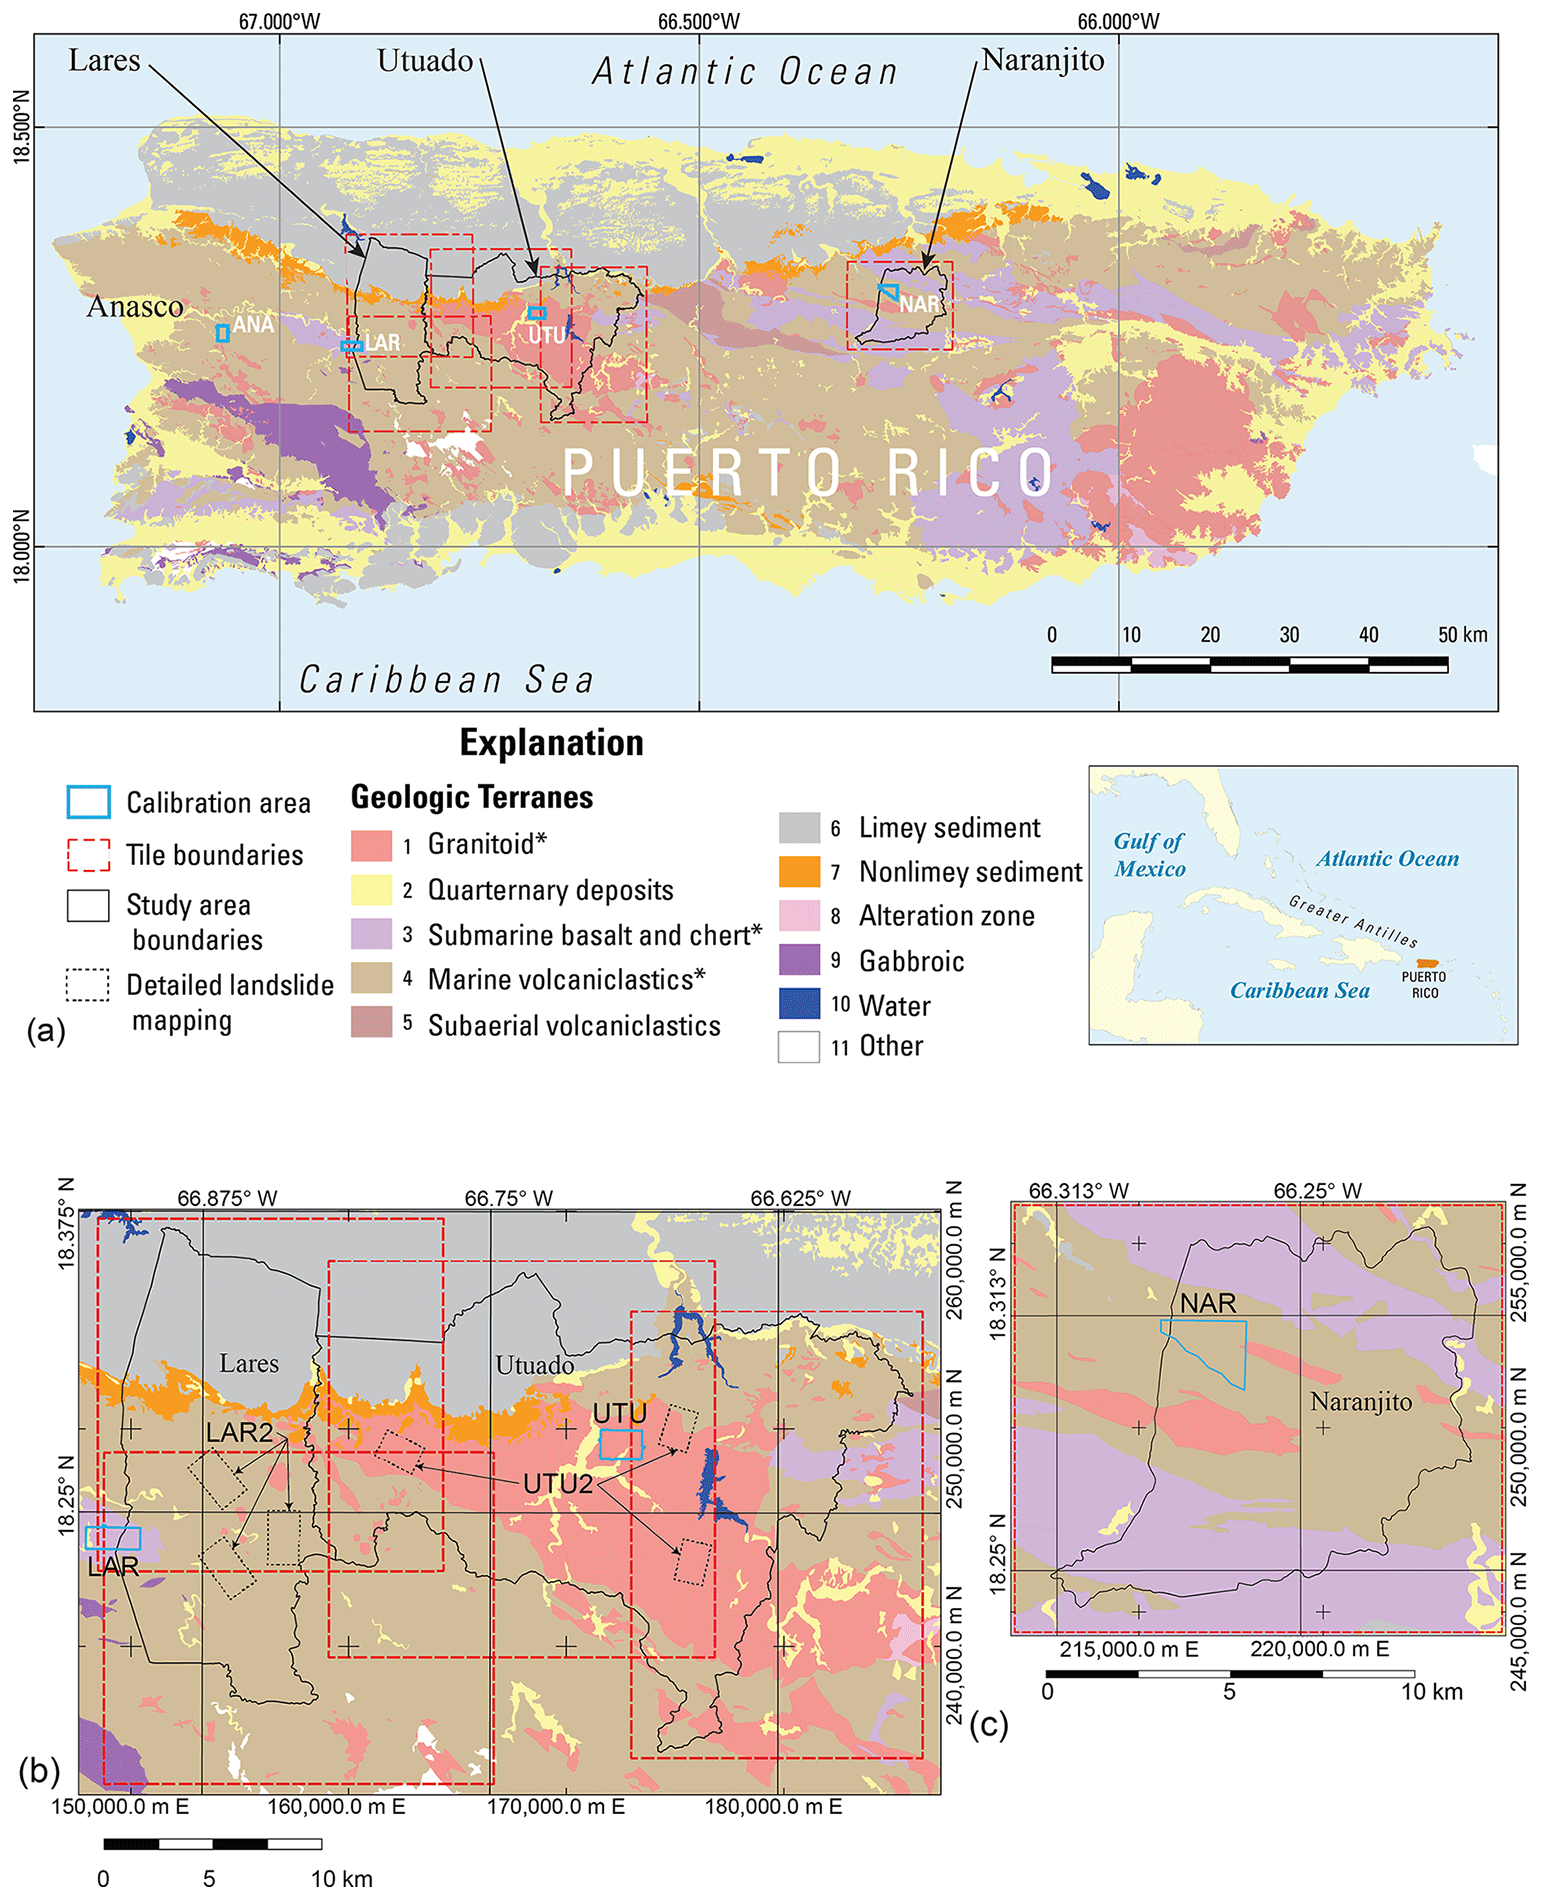
Figure 1Geologic map showing municipality boundaries, study areas, calibration areas, and major lithologies (geologic terranes) for the main island of Puerto Rico. Simplified from Bawiec (1998) by combining submarine volcaniclastic rocks of various ages into a single map unit. Primary landslide-prone lithologies indicated by an asterisk in map explanation. Municipality boundaries of Lares, Utuado, and Naranjito define study areas. Digital elevation models covering the study areas were divided into five smaller tiles. Extent of Añasco (ANA), Lares (LAR), Utuado (UTU), and Naranjito (NAR) calibration areas from landslide inventories by Bessette-Kirton et al. (2019c, 2020). (a) Overview of entire island, (b) details of Lares and Utuado study areas including outlines of areas of detailed landslide mapping in Utuado (UTU2, Einbund et al., 2021a) and Lares (LAR2, Einbund et al., 2021b), (c) details of Naranjito study area.
In the following sections, we describe characteristics of the study areas, summarize our methods and results, and discuss advantages, limitations, and implications of our approach. First, we describe the setting, geology, and landslides of Puerto Rico including details specific to the study areas. Then we describe the available topographic and geotechnical data followed by a description of the workflow for assessing landslide susceptibility. Next, we describe our methods for modeling soil depth, pressure head, and slope stability along with procedures for model calibration and details of how the calibrated models were applied to and evaluated for our study areas. Then we present results of the calibration, soil-depth modeling, 1D and quasi-3D stability analyses, and the evaluation and validation of the susceptibility analysis. These results were obtained using pre-event light detection and ranging (lidar) bare-earth digital elevation models (DEM) (U.S. Geological Survey, 2018). The DEMs, with uniformly spaced elevation values, were created from ground returns of lidar point clouds. DEMs are known in some countries as digital terrain models, a term with two definitions; throughout this paper we use DEM to avoid ambiguity (Heidemann, 2018). We reran our models using calibrated input parameters and post-event lidar (U.S. Geological Survey 2020a, b, c) to estimate susceptibility to future landslides. We finish by discussing strengths and limitations of our approach as well as some unexpected findings and ways to simplify the workflow for application to areas where limited data are available.
Puerto Rico is a US territory and lies at the east end of the Greater Antilles island chain in the Caribbean Sea (Fig. 1). The main island is characterized by rugged topography and covers an area of 8750 km2. The study areas and calibration areas lie in the east–west-trending Cordillera Central range, which spans most of the island. The range exceeds elevations of 900 m at many places, and its highest peak reaches an elevation of 1340 m. Coastal plains and broad lowlands ring most of the island. Ongoing tectonic uplift is one of the main factors creating the rugged topography across the island (Taggart and Joyce, 1991). Warm temperatures, high rainfall, and humidity contribute to deep weathering and widespread saprolite formation (Murphy et al., 2012).
This study was conducted in stages between 2018 and 2022 and involved three study areas as well as calibration areas, study-area tiles, and validation areas. We define these here to help the reader comprehend how our presentation of the study is organized. The study areas comprise three municipalities, Lares Municipio, Utuado Municipio, and Naranjito Municipio, and are the focus of our landslide initiation susceptibility maps (Figs. S1 and S2 in the Supplement; Baum et al., 2023). These municipalities were chosen because they were severely impacted by Hurricane Maria landslides and to help manage their future growth and development. We enclosed the Lares and Utuado study areas in four overlapping rectangles and enclosed Naranjito Municipio in a fifth, separate rectangle (Fig. 1a, b, and c). The rectangles extend beyond the drainage divides of basins that straddle municipality boundaries. The rectangles delimit overlapping tiles of the DEM used in the susceptibility analysis. These DEM tiles helped keep file sizes (6 gigabytes or less for ASCII input and output grids) manageable and overlap ensured that edge effects would not degrade soil-depth or slope-stability computations. The extended boundaries ensured that landslide runout and debris-flow inundation models (Brien et al., 2021) would not be impeded by municipality boundaries or other artificial barriers. The calibration areas (Fig. 1) were placed in distinct geologic terranes where high concentrations of landslides had occurred. Previous detailed mapping and characterization (Bessette-Kirton et al., 2019c, 2020) and field studies (Baum et al., 2018) in these areas provided data for testing and calibrating soil-depth and slope-stability models (Tello, 2020). From east to west, each 2 km2 calibration area was named for a nearby city: Añasco (ANA), Lares (LAR), Utuado (UTU), and Naranjito (NAR). Although ANA is about 15 km west of the study areas, it was included to provide additional calibration data in an area of high landslide density for submarine volcaniclastic lithologies because sufficient data were not available at NAR. Soils, land cover, and other characteristics (besides bedrock lithology) that influence landslide susceptibility vary between the four calibration areas (Bessette-Kirton et al., 2020; Hughes and Schulz, 2020a, b). We used six additional areas of detailed mapping (Einbund et al., 2021a, b) to help evaluate the final maps. These validation areas are designated LAR2 and UTU2, and each includes three rectangular areas of detailed landslide mapping (Fig. 1b). We combined detailed source area mapping of NAR (Baxstrom et al., 2021a) and UTU (Einbund et al., 2021a) with that in LAR2 and UTU2 for the validation.
2.1 Geology and soils
Heavily faulted basement rocks, consisting mainly of oceanic crust, volcaniclastic, and intrusive rocks, underlie the Cordillera Central range (Jolly et al., 1998). A cover sequence of carbonates and associated clastic sediments unconformably overlies the basement complex. The carbonates have weathered to form tropical karst in the lowlands north of the range (Monroe, 1976). Bawiec (1998) generalized the geology of Puerto Rico into 12 geologic terranes having related rock types. We have simplified the terranes slightly for purposes of this study (Fig. 1). Soil mapping and databases published by the U.S. Department of Agriculture's Natural Resources Conservation Service (NRCS) indicate a wide range in the textures (particle-size distributions) and hydraulic properties of soils in the study areas (Soil Survey Staff, 2018). Most hillside soils have developed by in-place chemical weathering of underlying bedrock or saprolite and locally derived colluvium. Despite the steep slopes, in many places the upper few meters of bedrock have weathered to saprolite (e.g., Jibson, 1989; Larsen and Torres-Sanchez, 1992).
2.2 Landslides
Heavy rainfall from Hurricane Maria during September 2017 produced tens of thousands of landslides on the main island of Puerto Rico, USA (Bessette-Kirton et al., 2017, 2019a; Hughes et al., 2019). Shallow, translational failures in soil or saprolite, from decimeters to a few meters deep, were the most common landslides. Deeper (up to 30 m) complex failures in soil, saprolite, and rock, as well as rock falls and rock slides, also occurred (Bessette-Kirton et al., 2017). Many landslides transformed into debris flows that commonly coalesced and flowed down channels. Landslides caused fatalities as well as widespread damage to homes, roads, and other infrastructure.
Recent and historical studies described and characterized Puerto Rico's rainfall-induced landslides. Published studies of past landslides characterized rainfall-induced landslides in southern and eastern parts of Puerto Rico (Jibson, 1989; Simon et al., 1990; Larsen and Torres-Sanchez, 1992, 1998; Pando et al., 2005; Larsen, 2012). Several post-Hurricane Maria studies documented dimensional, geologic, and topographic characteristics of landslide sources in 10 representative areas of high landslide density within and near the municipality study areas (Fig. 1): Baum et al. (2018) conducted field studies and measurements (Fig. 2), and Bessette-Kirton et al. (2019c) later mapped landslides using post-event aerial photography in the four areas denoted as ANA, LAR, NAR, and UTU (Fig. 1a). U.S. Geological Survey staff later remapped NAR (Baxstrom et al., 2021a), remapped UTU (Einbund et al., 2021a), and mapped six additional areas (UTU2 and LAR2, Fig. 1b) near UTU and LAR (Einbund et al., 2021a, b). Schulz et al. (2023) expanded on earlier field studies of Baum et al. (2018). Data from some of these studies supported recent analyses of landslide susceptibility (Bessette-Kirton et al., 2019a; Hughes and Schulz, 2020a) and runout characteristics (Bessette-Kirton et al., 2020).
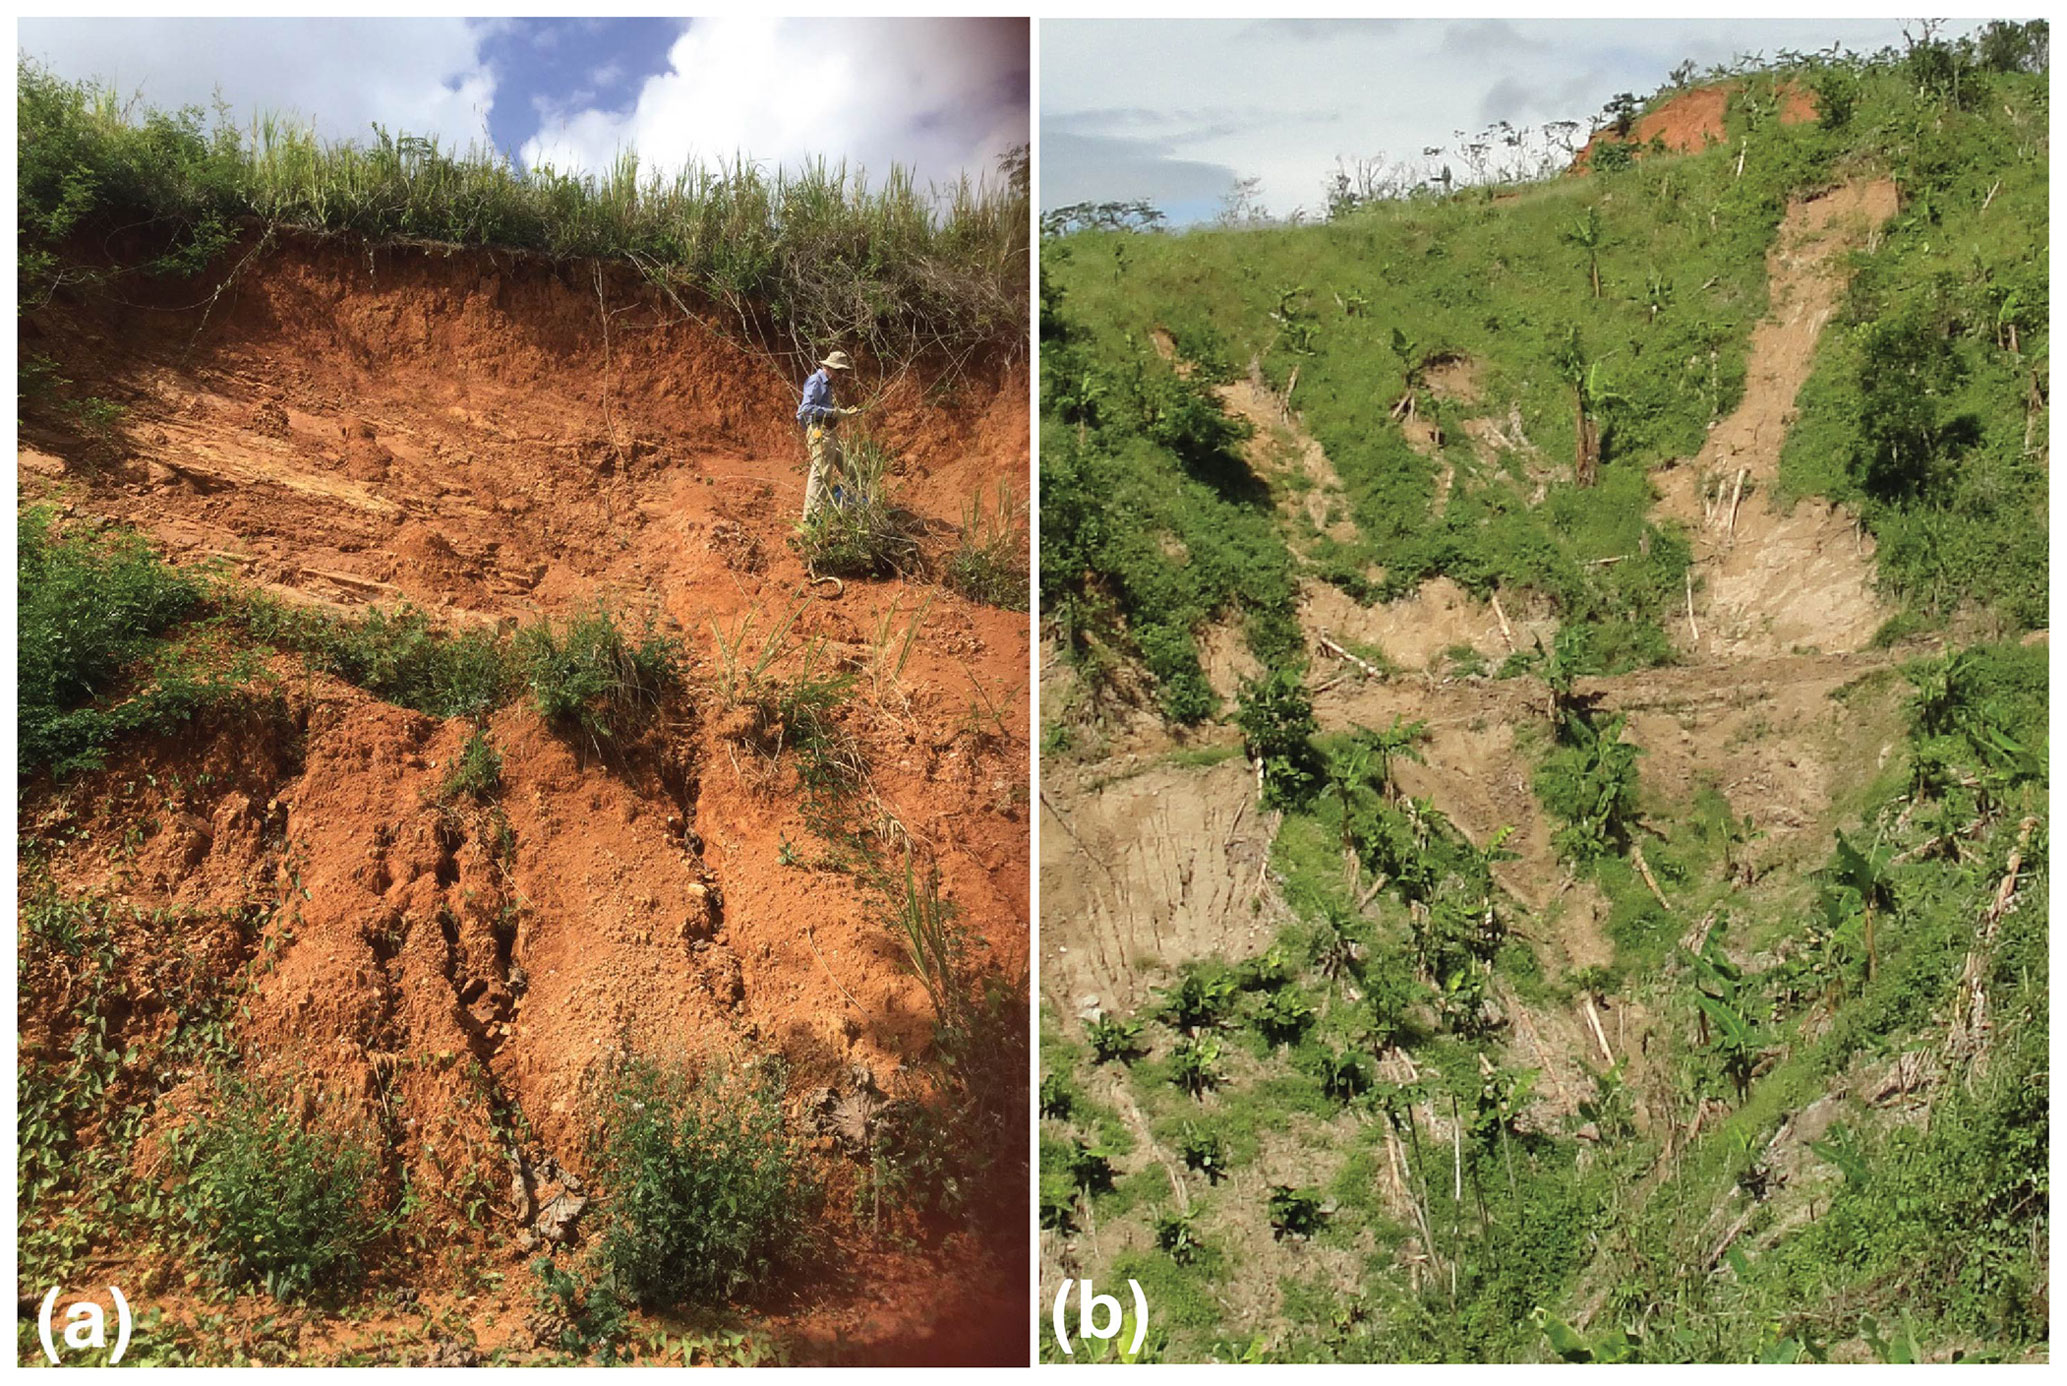
Figure 2Photographs depicting source areas of shallow landslides in (a) volcaniclastic terrane (photograph by Corina Cerovski-Darriau, U.S. Geological Survey, May 2018, public domain) and (b) granitoid terrane 1 month after Hurricane Maria (photograph by William Schulz, U.S. Geological Survey, October 2017, public domain).
The post-Hurricane Maria studies cited above indicated that most source areas were fully evacuated, and shallow translational slides appear to be the most common type of movement prior to transforming to debris flows. Nevertheless, source area shapes were consistent with translational, rotational, or complex movement. Source areas exposed soil, saprolite, and bedrock (Fig. 2). Soil matrix textures ranged from sand to clay; clast content increased with depth. Differences between the landslide source sizes and depths within the different terranes (Fig. 3) seem consistent with their different lithologies and depth of weathering (volcaniclastic rocks, weathered volcanic rocks, granitic pluton).
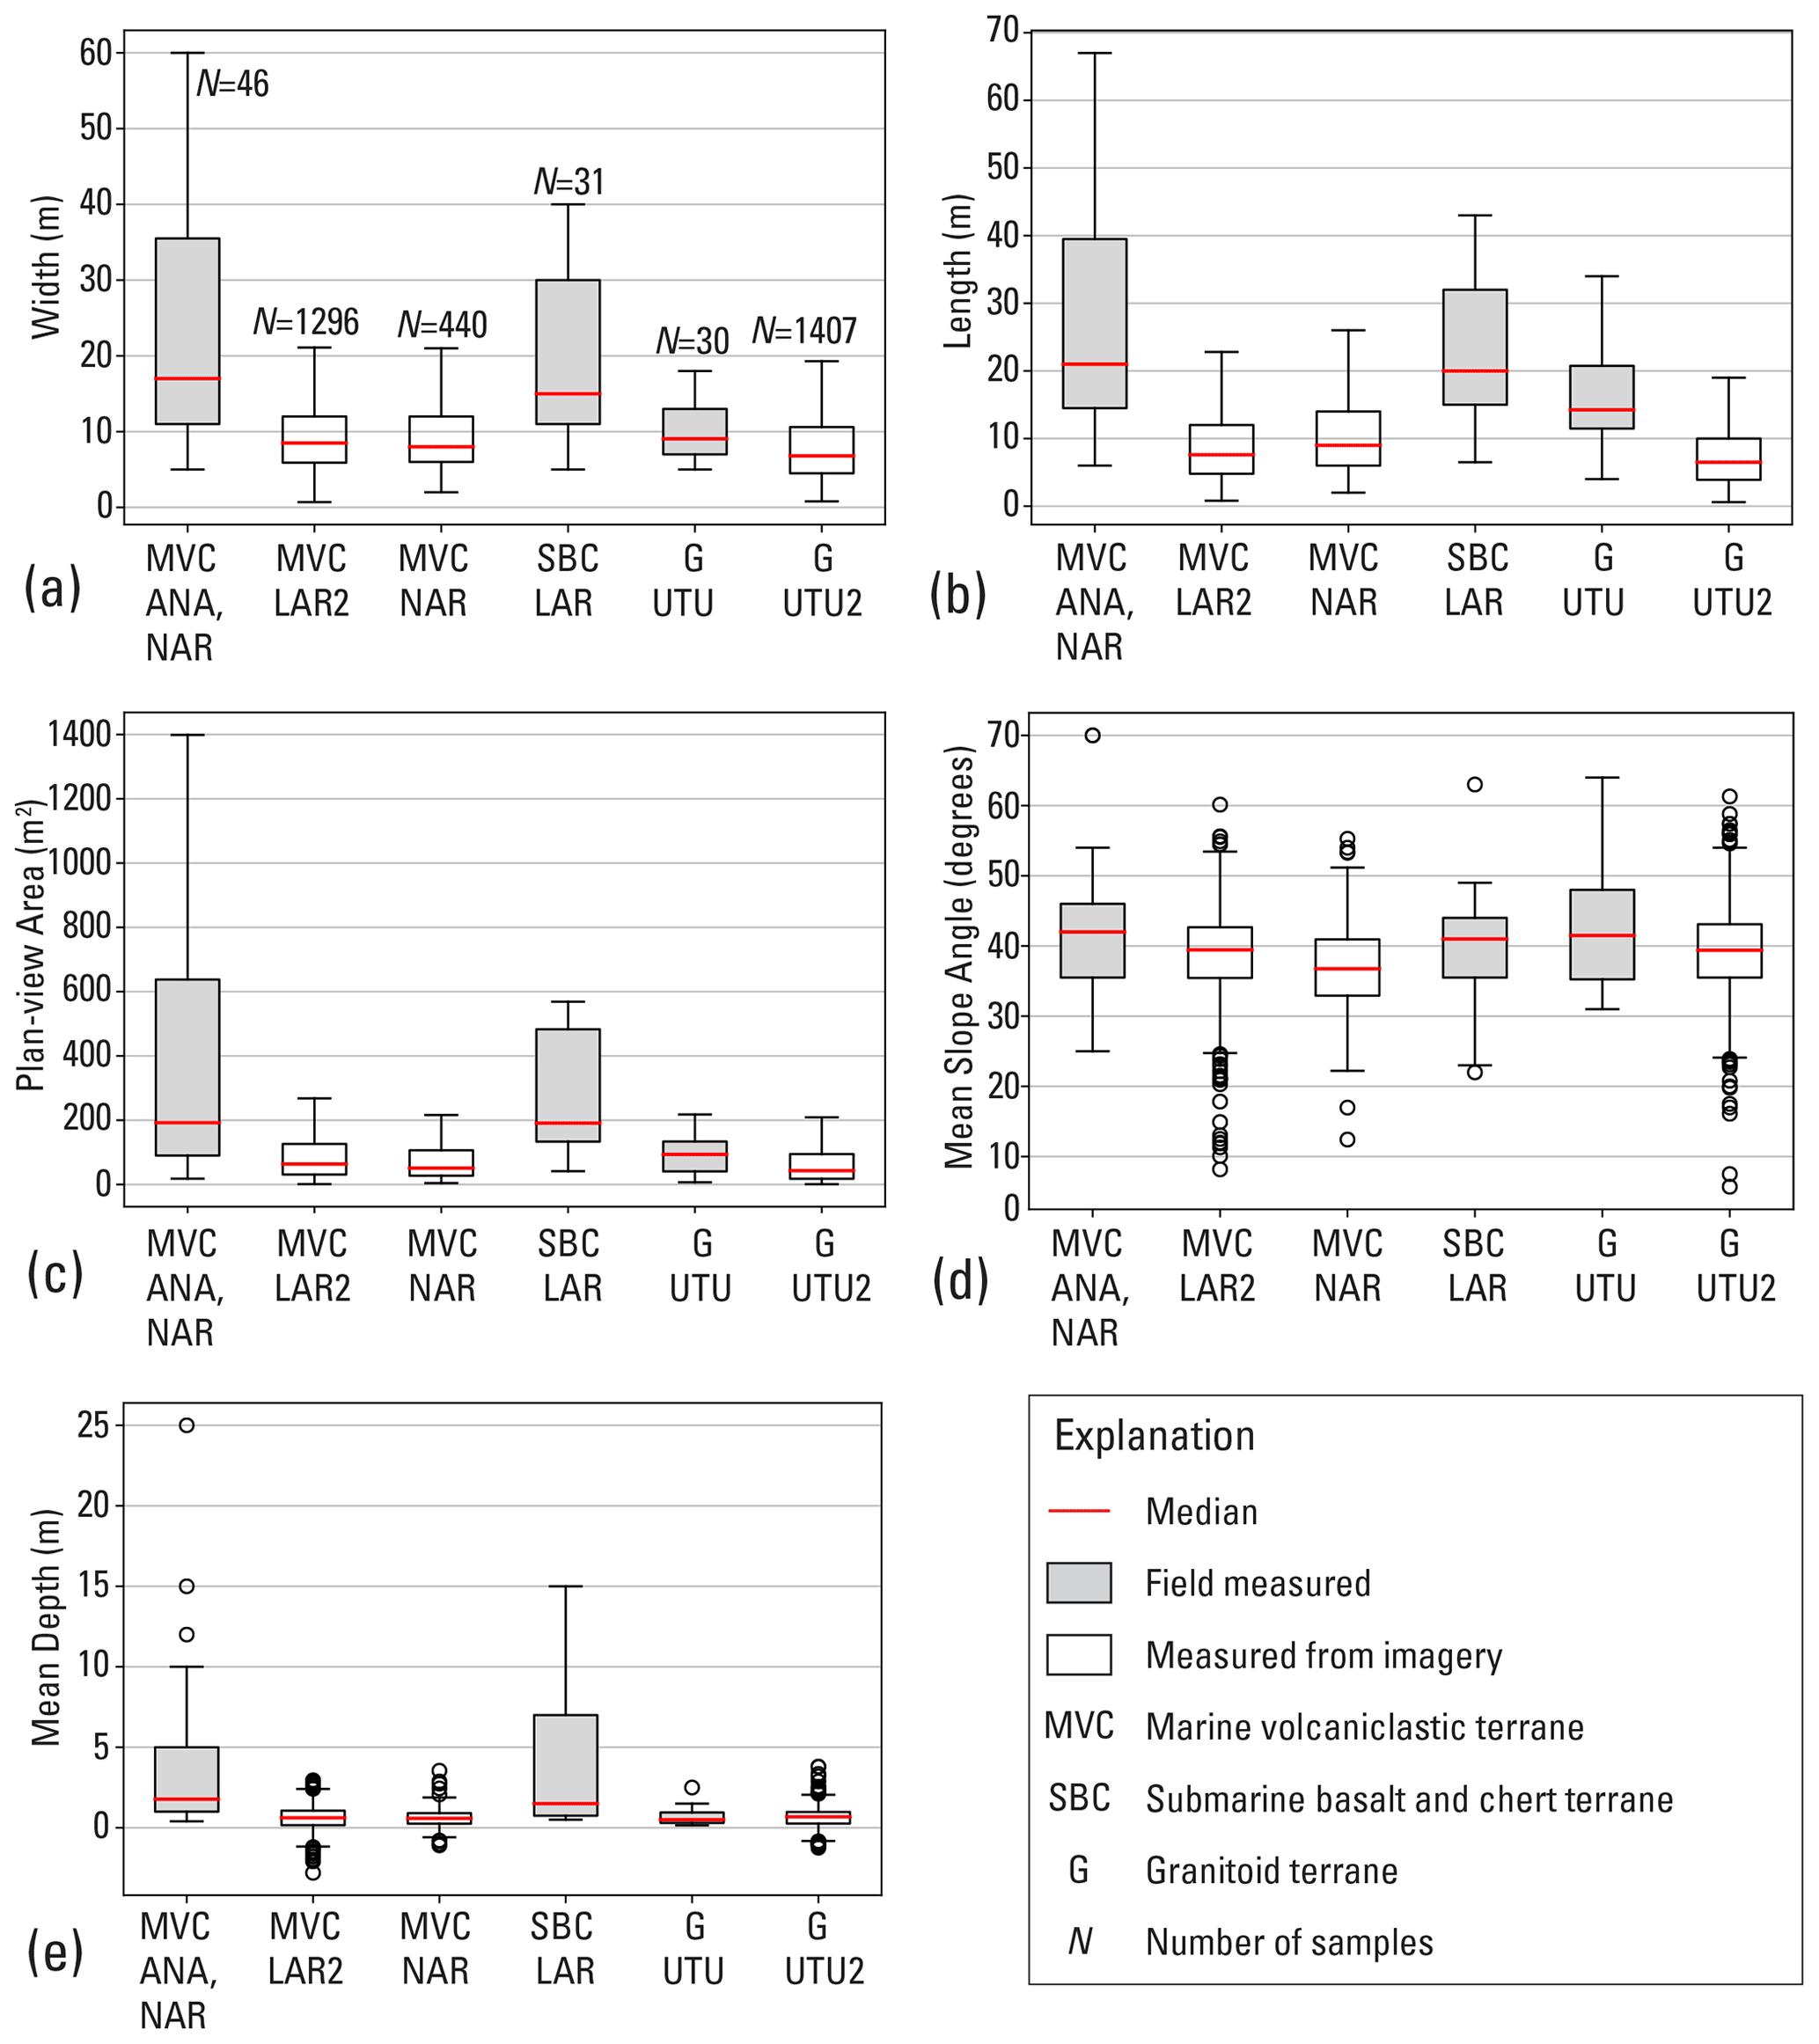
Figure 3Box plots summarizing landslide source dimensions obtained for three geologic terranes by field studies of 107 landslides (gray, Baum et al., 2018) and by mapping 3440 landslides from aerial imagery and lidar-derived digital elevation models (white, Baxstrom, 2021a; Einbund, 2021a, b). (a) Width, (b) length, (c) plan-view area calculated directly by geographic information system for mapped polygons and estimated from field measurements as an ellipse and projected to the horizontal, π × (length × width × cos (slope angle))/4, (d) mean slope angle, and (e) mean landslide source depths. Outliers of width, length, and area not shown to keep 25 %, 50 %, and 75 % quartiles legible; box length = interquartile range (IQR), whiskers = 1.5 × IQR. Locations (as shown in Fig. 1): ANA, Añasco; LAR, Lares; LAR2, Lares (Einbund et al., 2021b); UTU, Utuado; UTU2, Utuado (Einbund et al., 2021b, includes UTU); NAR, Naranjito (remapped by Baxstrom et al., 2021a).
Figure 3 summarizes landslide dimensions obtained from the post-Hurricane Maria studies for the three main geologic terranes in the study areas (Fig. 1). The field measurements (using laser range finder, tape, and clinometer; Baum et al., 2018), though biased by purposely including several large landslides (1500–6600 m2), represent the range of sizes of Hurricane Maria landslide sources. Mapping from imagery (Baxstrom et al., 2021a; Einbund et al., 2021a, b) included all landslides visible in the imagery of several 2.5 km2 target areas and represents typical dimensions of landslides triggered by the hurricane on uplands and valley side slopes. Most landslide sources had lengths and widths less than 10–15 m, with median mapped length and width among the different samples in Fig. 3a and b ranging from 6.5 to 9 m. Many landslide sources have areas less than 100 m2 (median mapped areas range from 42 to 64 m2 for the different terranes), and very few have areas greater than 1000 m2 (Fig. 3c). Although landslides occurred on a wide range of slope angles, most occurred on slopes between 30° and 50° (Fig. 3d). Median DEM-derived mean slope angles of mapped landslide sources were 37–39° (Fig. 3d). Depths computed by differencing pre-event and post-event lidar elevation data (Baxstrom et al., 2021a; Einbund et al., 2021a, b) have significant uncertainty because 14 %–19 % of the landslide sources had mean and median elevation differences indicating net gain of material (Fig. 3e). In addition, undisturbed areas outside the landslide polygons showed elevation differences that varied horizontally, consistent with inadequate swath adjustment in the pre- and post-event lidar point clouds. Data needed to correct the resulting mismatch between pre- and post-event lidar were unavailable. However, it seems unlikely that any of the mapped landslides had a mean depth much greater than 5.8 m (the span between the greatest elevation loss and gain, MVC/LAR2, Fig. 3e). Rare, large landslides had depths as great as 25 m according to field measurements (Fig. 3e).
Puerto Rico's complex geology (Fig. 1), tropical soils, rugged terrain, land use, and land cover exert strong influences on landslide susceptibility. Lepore et al. (2012) in an island-wide assessment using frequency ratio and logistic regression concluded that aspect, slope, elevation, geological discontinuities, and geology were “highly significant landslide-inducing factors”; land cover and distance from roads were also significant. Bessette-Kirton et al. (2019a) showed that antecedent soil moisture was statistically correlated to densities of Hurricane Maria-induced landslides and found that high landslide densities were “especially widespread across some geologic formations”, although the degree to which rainfall characteristics resulted in this correlation remained unclear. In a later post-Hurricane Maria, island-wide assessment using the frequency ratio method, Hughes and Schulz (2020a) found after accounting for the effects of soil moisture, there were strong correlations between landslides and slope, curvature, geologic terrane, mean annual precipitation, land cover, soil type, event soil moisture, proximity to roads, and proximity to fluvial channels for the Hurricane Maria event. Previous, more localized studies considered fewer geomorphic and geographic characteristics to classify landslide susceptibility using empirical and statistical methods (Larsen and Parks, 1998; Larsen et al., 2004). For example, Larsen and Parks (1998) classified landslide susceptibility of Comerío Municipality based on elevation, slope, aspect, and land use. Our current study uses physics based geotechnical models of slope stability to directly assess topographic, geologic, and soil controls on landslide potential and to indirectly assess effects of roads and land use through their impacts on topography and surface drainage as expressed in the DEM as local changes in the slope characteristics.
To represent the aerial extent and depths of potential landslide source areas, we undertook a multistage process to acquire data, characterize the landslides, calibrate parameters, and model potential landslide sources for both pre-Hurricane Maria and post-Hurricane Maria digital topography. In Fig. 4, bold capital letters mark the four main stages of the study: (A) data acquisition and reduction, (B) calibration, (C) susceptibility modeling on pre-storm topography, and (D) susceptibility modeling on post-storm topography. Each stage comprises multiple steps; numbers in Fig. 4 identify the section describing each major step. Most results of Stage A were published previously but are described briefly in Sects. 2.2, 3.1, and 3.2 to provide context for this study. Stages B, C, and D (Fig. 4) repeated four distinct modeling tasks: (1) soil depth, H, (2) pressure head, ψ, (3) 1D factor of safety, F1, and (4) quasi-3D factor of safety, F3. The landscapes of the calibration and study areas were represented digitally in the models as raster grids based on 1 m resolution pre-event lidar-derived DEMs. Each grid cell represented a column of potential landslide material of vertical depth, H, determined at soil-depth modeling steps of stages B, C, and D (Fig. 4). Computed soil depth from these steps became input for calculation of ψ (Fig. 4); then H and ψ became inputs for computing F1 (Fig. 4), and F3. F1 was used primarily in evaluating soil-depth models and shear-strength parameters for the calibration areas depicted in Fig. 1 using receiver operating characteristic (ROC, Metz, 1978) analysis (Fig. 4). During post-calibration slope-stability modeling of the study areas, F1 served as a rough check on the computed value of F3. The following sections outline the major steps depicted in Fig. 4.
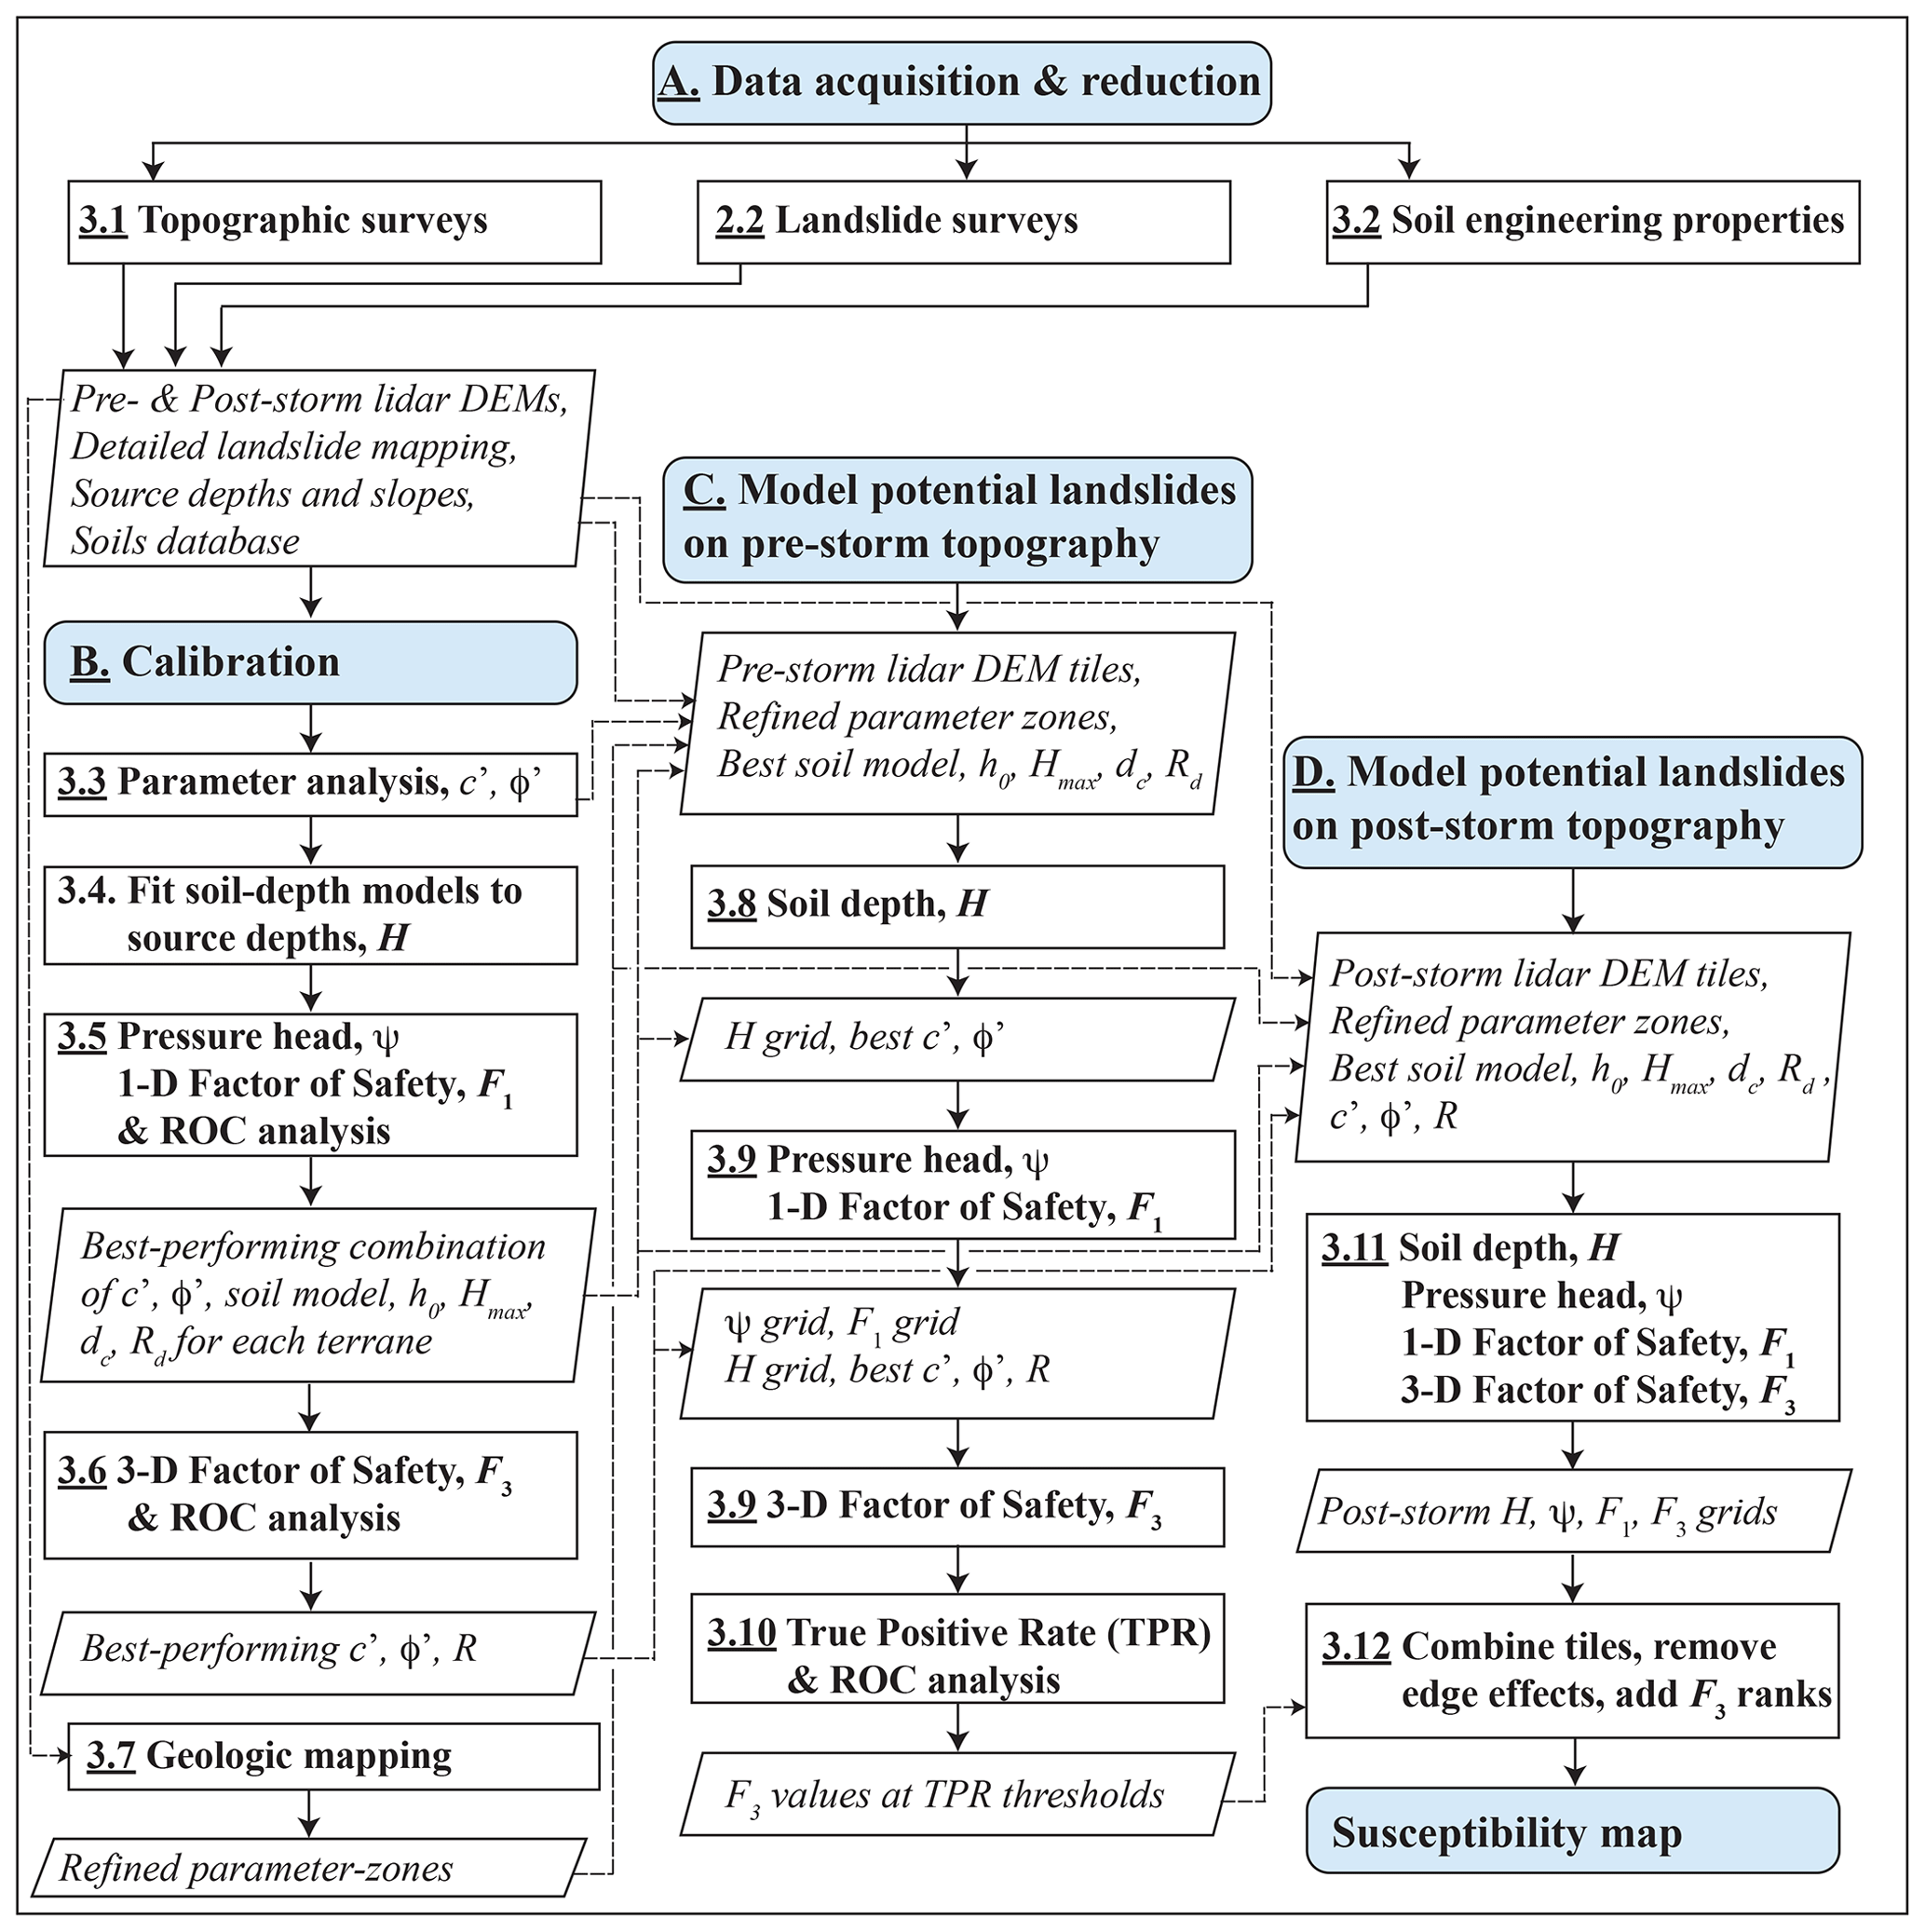
Figure 4Flow chart showing four major stages (enumerated by capital letters A, B, C, D) and steps of data acquisition, calibration, and modeling leading to the map of landslide initiation susceptibility (susceptibility map, bottom of right column). Numbers (underlined, bold) identify the corresponding sections where the steps and their outputs are described. The data acquisition stage (A, top) was performed at scales ranging from island-wide to site-specific. The calibration stage (B, left column) was performed using digital elevation models of roughly 2.5 km2 areas where detailed mapping and fieldwork had been conducted (Fig. 1). Landslide source depths approximated soil depth for soil-depth model calibration. The pre-Hurricane Maria (pre-storm) modeling stage (C, center column) was conducted using overlapping DEM tiles (Fig. 1) derived from pre-Hurricane Maria lidar data (U.S. Geological Survey, 2018). The post-Hurricane Maria (post-storm) modeling stage (for generating map of future landslide susceptibility, D, right column) used overlapping DEM tiles (Fig. 1) derived from post-Hurricane Maria lidar data (U.S. Geological Survey, 2020a, b, c). Post-Hurricane Maria steps used identical input parameters to the corresponding pre-Hurricane Maria steps. Chart symbols: light-blue rounded rectangles, terminals of each major stage; rectangles with bold text, technical or computational processes; parallelograms with italic text, inputs or outputs; dashed lines, connections between outputs and model inputs. Model outputs: H, soil depth; ψ, pressure head; F1, 1D factor of safety; F3, quasi-3D factor of safety; TPR, true positive rate; ROCs, receiver operating characteristics. Model input parameters: h0, characteristic soil depth, Hmax, maximum soil depth; δc, critical slope angle; Rd, diffusivity ratio; c′, cohesion for effective stress; φ′, angle of internal friction for effective stress; R, radius of quasi-3D trial surface.
3.1 Topographic surveys and data
In 2015 and 2016, the U.S. Geological Survey (2018) acquired airborne lidar covering the entire main island of Puerto Rico. These data were processed to create a 1 m resolution bare-earth DEM. Referred to hereafter as pre-event lidar, these data were acquired roughly 1–2 years before Hurricane Maria and constitute the best-available representation of topographic conditions before the landslides associated with the hurricane occurred. Available at the beginning of our investigation, the pre-event lidar-derived DEMs have formed the topographic mainstay for U.S. Geological Survey studies of these recent landslides. We used these data for calibration and validation of our soil depth and slope stability models. After Hurricane Maria, the U.S. Geological Survey (2020a, b, c) acquired additional lidar data covering the entire island in 2018. These data, referred to hereafter as post-event lidar, constitute the (currently) best-available representation of topographic conditions after the landslides and are useful for assessing susceptibility to future landslides. The 0.5 m post-event lidar DEMs were resampled to 1 m resolution for consistency with the pre-event lidar DEMs and computational efficiency of landslide susceptibility models. We used these post-event DEMs to run our models (using the previously calibrated and evaluated input parameters) to obtain our best estimate of susceptibility to future landslides.
3.2 Engineering data compilation
Based on findings by Bessette-Kirton et al. (2019a) and Hughes and Schulz (2020a, b) indicating strong correlation between landslide density and both bedrock and soil type, Baum (2021) compiled existing data on soil texture and engineering properties to create typical values for model calibration. Four different sources yielded soil and (or) engineering data: (1) published literature about past and recent landslides in Puerto Rico (Sowers, 1971; Jibson, 1989; Simon et al., 1990; Larsen and Torres-Sanchez, 1992, 1998; Lepore et al., 2013; Thomas and Cerovski-Darriau, 2019), (2) NRCS soil databases (Soil Survey Staff, 2018), (3) laboratory testing (Smith et al., 2020), and (4) geotechnical reports of recent landslides (Puerto Rico Department of Transportation, personal communication, 2019). The NRCS soil data and geotechnical reports were summarized in spreadsheets and then analyzed to determine means, ranges, and other basic statistics to characterize the properties of soils and geologic formations found throughout the three municipalities (Baum and Lewis, 2023). The database compiled from these sources and measured using various protocols, though inhomogeneous, brackets the probable ranges of engineering properties. Baum (2021) identified dominant soil classes of the geologic terranes that had high landslide densities (Fig. 1) and estimated expected ranges of soil strength parameters, cohesion, c′, and angle of internal friction, φ′, both for effective stress based on dominant Unified Soil Classification System (ASTM International, 2020) types in each terrane as follows: volcaniclastic, high-plasticity organic clay (OH), φ′ 17–35°, c′ 5–20 kPa; submarine basalt and chert, low-plasticity clay (CL) and high-plasticity silt (MH), φ′ 27–35°, c′ 5–20 kPa; granitoid, low-plasticity clay (CL) and silty sand (SM), φ′ 27–41°, c′ 0–20 kPa. Laboratory tests at low normal stress (Smith et al., 2020), relevant to shallow landslides, indicate higher friction ranges: volcaniclastic, high-plasticity silt (MH) to organic clay (OH), φ′ 35–46°, c′ 0–5.1 kPa; granitoid silty sand, φ′ 35–54°, c′ 0.4–4.6 kPa.
3.3 Strength parameter analysis
Using 1D slope stability analysis, Baum (2021) estimated the ranges of soil strength parameters φ′ and c′ that explain the largest number of field-observed landslide slope and depth combinations in the calibration areas (Fig. 5). Computing 1D factor of safety using the infinite slope analysis (Taylor, 1948; Iverson, 2000), F1, for 1440 possible incremental combinations of φ′ and c′ over a synthetic grid in which slope angle, δ, and landslide depth, H, varied incrementally over the observed ranges of slope (22–60°, in 0.5° increments), and depth (0.2–15 m, in 0.1 m increments) produced F1 values for more than 1.9 × 10⁷ combinations of H, δ, φ′, and c′. The best-fitting ranges (dark red in Fig. 6) included combinations of H, δ, φ′, and c′, where more than 75 % of observed landslide scarp points were successfully predicted by F1 ≥ 1 for ψ= 0 (dry, where ψ is the pressure head at the basal slip surface) and F1 < 1 for ψ=Hcos2δ (water table at the ground surface with slope-parallel flow). The example depicted in Fig. 5 had an overall success rate of 93 % for its c′–φ′ combination (c′ = 0.75 kPa and ′ = 54°) in all three geologic terranes (Figs. 1, 5a). Compiling the performance of every c′–φ′ pair considered in the analysis led to Fig. 6b, c, and d, which showed the better-performing ranges of c′ and φ′ for the granitoid (Fig. 6b), volcaniclastic (Fig. 6c), and submarine basalt and chert (Fig. 6d) terranes, respectively. Those combinations of c′ and φ′ with success rates exceeding 75 % were used as inputs for computing F1 with trial soil-depth maps in subsequent calibration studies to select a single combination of c′ and φ′ for computing F1 in each terrane.
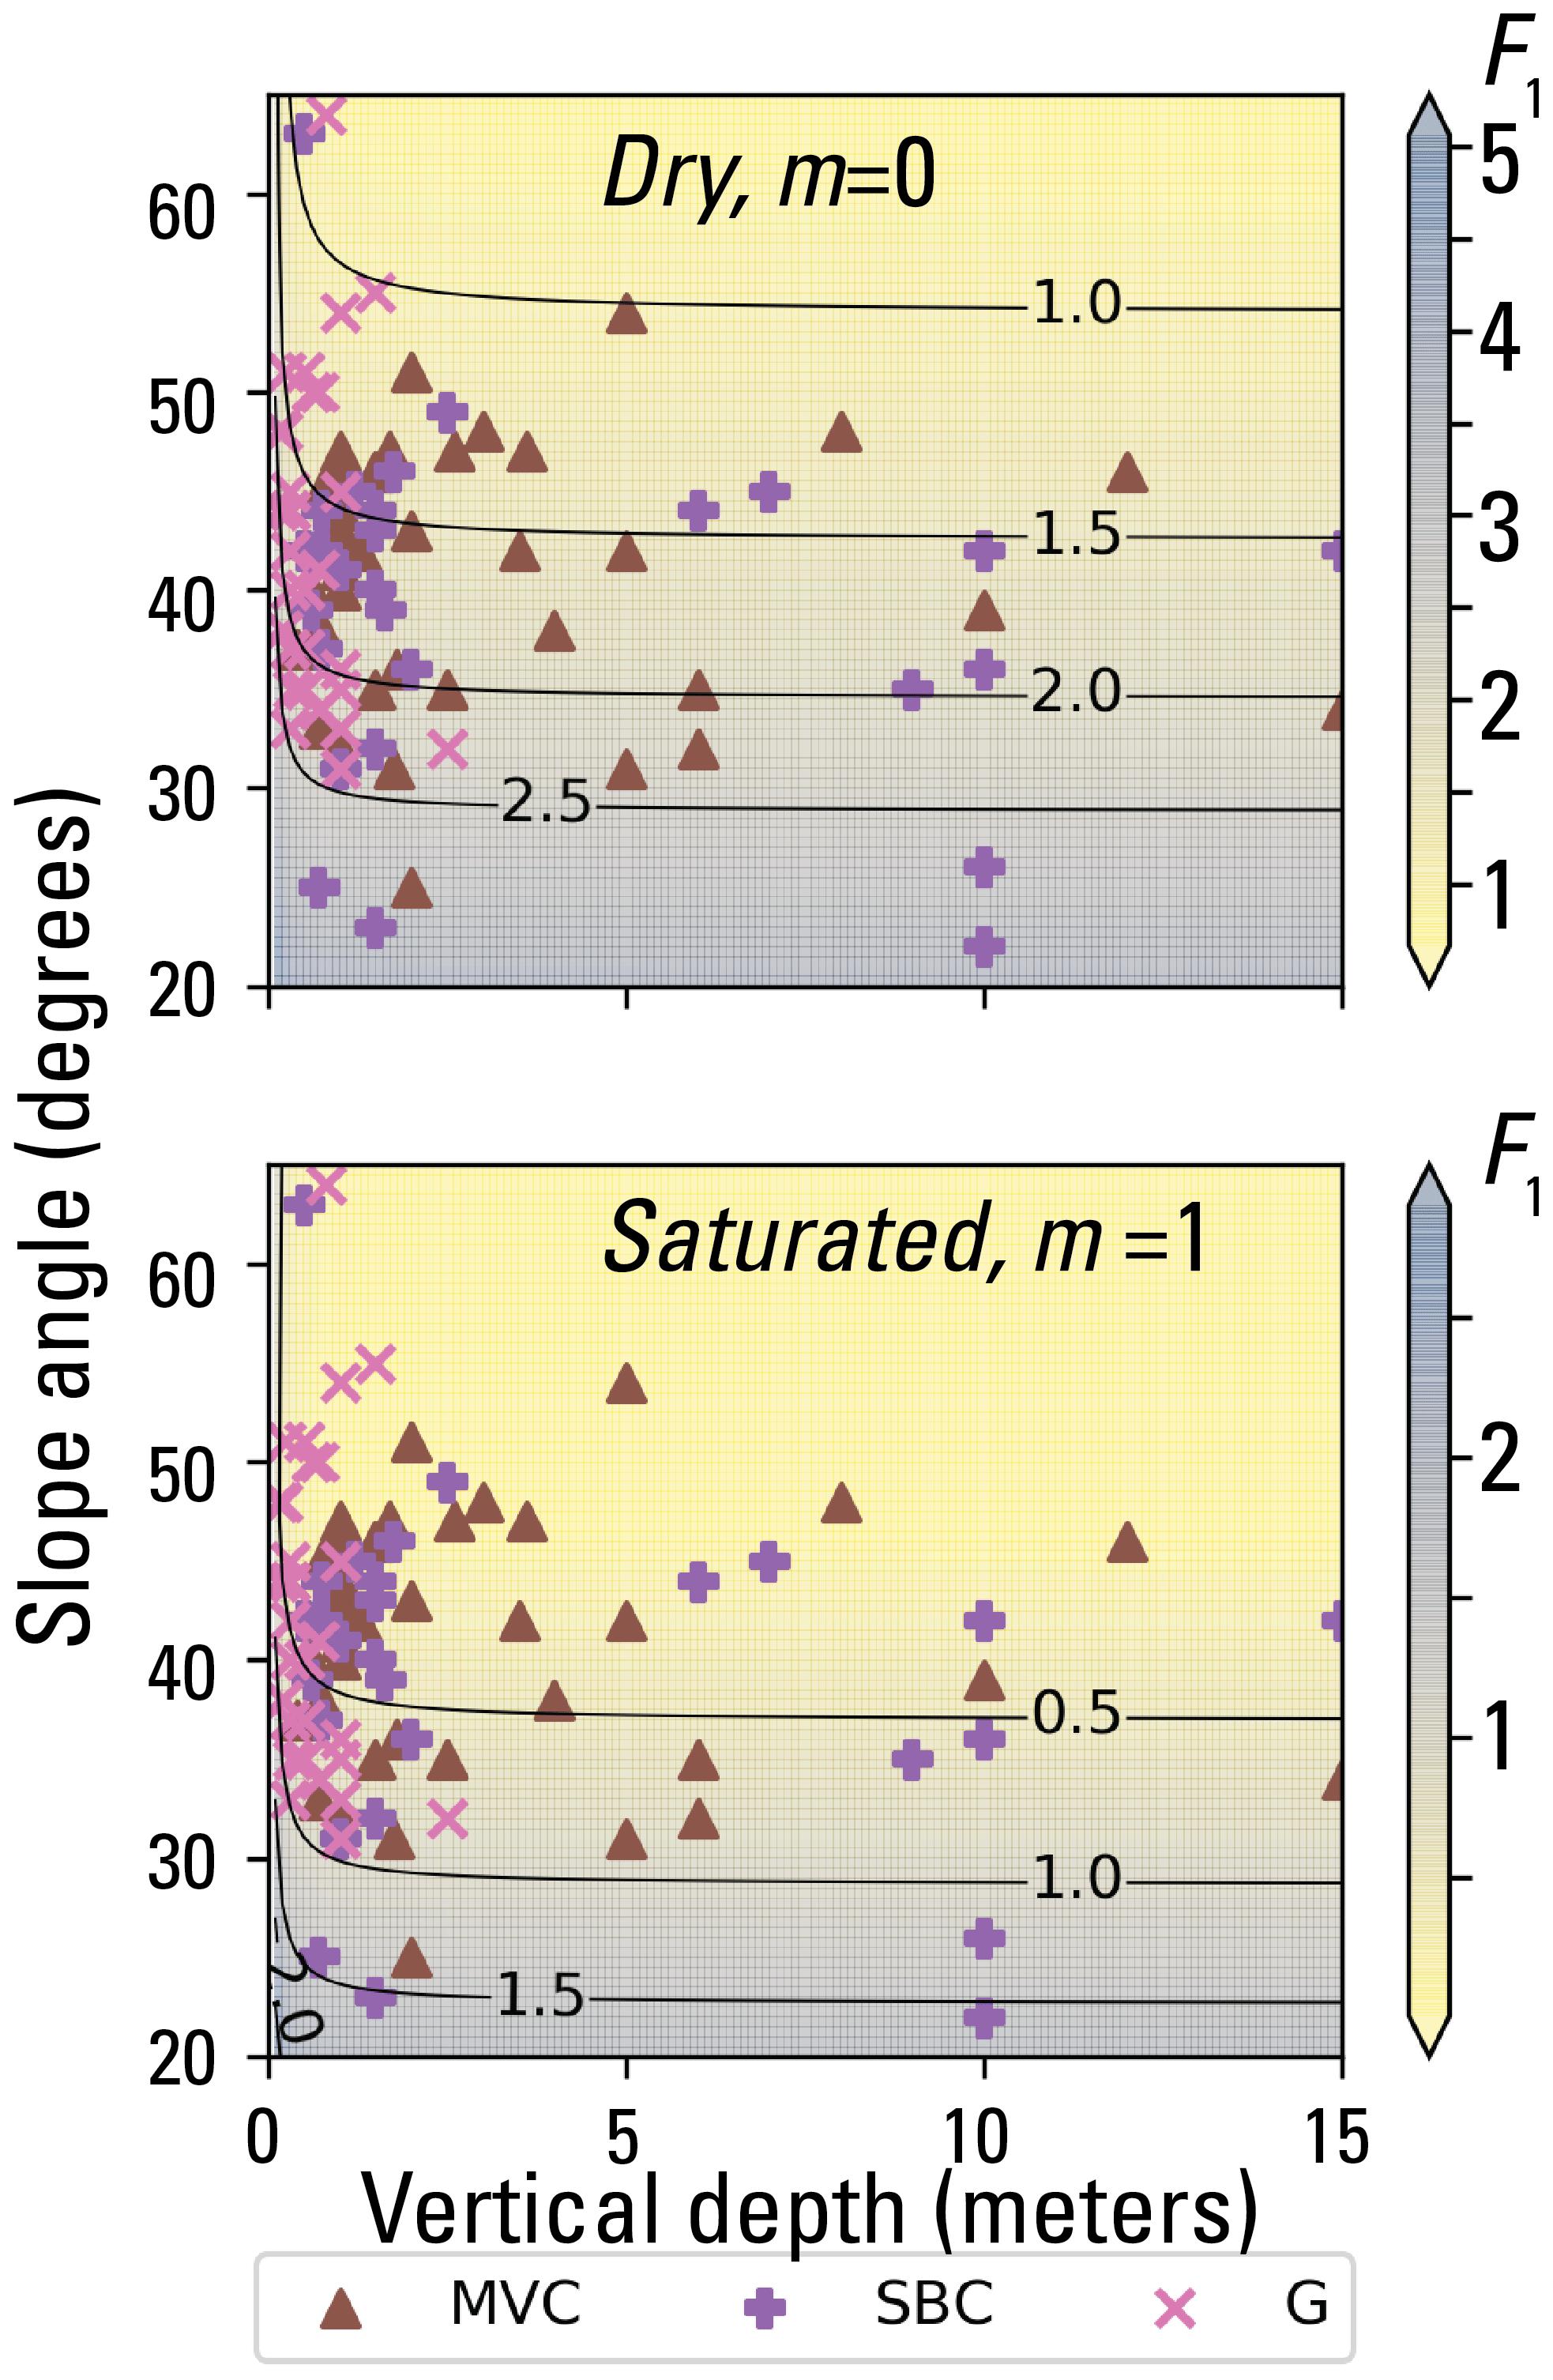
Figure 5Results of strength parameter testing for observed combinations of landslide slope and depth in three geologic terranes. Factor of safety, F1, results (indicated by color scale and contour lines) for a selected combination of cohesion, 0.75 kPa), and angle of internal friction, 54°), both for effective stress. Two scenarios for pore-pressure head (m= 0 and m= 1) are shown, where m is the ratio of pressure head to soil depth. Symbols mark observed slope angle and depth at mapped landslide sources in various geologic terranes (Fig. 1). Factor of safety, F1, at slope and depth combinations observed at marked landslide sources indicates model success (F1 < 1 if m= 1) or failure (F1 > 1 if m= 1). For the pair of c′ and φ′ values shown, F1 > 1 for dry conditions (m= 0) at about 97 % of sources and F1 > 1 at 4 % of sources for water table at the ground surface with flow parallel to the slope (m= 1). These parameters, 0.75 kPa and 54°, had an overall success rate of about 93 % (= 97 %–4 %) for all three terranes (revised from Baum, 2021).

Figure 6Fraction of field-measured landslide sources from the calibration areas (Baum et al., 2018) predicted correctly as a function of cohesion, c′, and angle of internal friction, φ′, for observed landslides in (a) all three terranes combined (modified from Baum, 2021); (b) the volcaniclastic terrane; (c) the granitoid terrane; (d) the submarine basalt and chert terrane. Each pixel summarizes the net result of a pair of analyses like that in Fig. 5. Pixel outlined by white rectangle in lower right corner of panels (a), (b), (c), and (d) indicates combination for analysis shown in Fig. 5. Pixel color and contours indicate true positive rate (TPR) of predictions for each cell. Factor of safety for dry conditions is F1m=0; factor of safety for water table at ground surface with slope-parallel flow is F1m=1. Each grid cell represents the fraction (NF1m=0 – NF, where NF1m=0 is the number of source areas for F1 ≥ 1, NF1m=1 is the number of source areas for which F1 ≥ 1, and Nt is the number of source areas in the geologic terrane.
3.4 Soil-depth model calibration
Field observations indicated that the base of most landslide sources occurred near the top of weathered bedrock (Baum et al., 2018; Baum, 2021), so we chose soil depth as a predictor of landslide source depth. We carried out soil-depth estimation from DEMs using new open-source software, REGOLITH (Baum et al., 2021), containing five empirical and four steady-state process-based soil-depth models implemented in a command-line program. Each model in REGOLITH estimates soil depth from some combination of topographic variables, including slope, upslope contributing area, and curvature, as well as a few model parameters, such as characteristic depth (the soil thickness at which bedrock lowering falls to of its maximum value), h0 [L]; critical slope (angle of stability at which the slope is capable of transporting the entire soil profile by mass movement), δc [degrees]; and the ratio of maximum bedrock lowering rate to hillslope diffusivity, Rd. These parameters may vary with conditions that influence soil formation, including bedrock and climate. Predicted soil depth is treated as equivalent to and defines column height, H, in subsequent modeling steps. We modified steady-state process-based models (Pelletier and Rasmussen, 2009), which predict soil depth only on convex topography, to estimate soil depths in both concave and convex topography. We used a smoothing algorithm available in REGOLITH to reduce abrupt changes in soil depth that may result from DEM roughness. Further details are available in the online documentation found in the code repository (Baum et al., 2021). Our soil-depth, pressure head, and slope-stability models treated roads, cut slopes, and embankments the same as other areas.
Soil-depth model calibration proceeded first by fitting soil-depth models to depth observations followed by checking how the best-fitting models performed as input for computing F1 to predict landslide locations (see Sect. 3.5). Both calibration and checking made use of pre-event 1 m bare-earth lidar digital elevation models for the four ∼ 2 km2 calibration areas representing the dominant (three) geologic terranes affected by landslides in the study areas (Fig. 1). Landslides had previously been mapped (Bessette-Kirton et al., 2019c) and characterized (Baum et al., 2018) in these four calibration areas (Sect. 2.2, Fig. 3). Tello (2020) described the soil-depth calibration procedures in detail, including parameter ranges considered in the calibration. We summarize important steps here: field-measured landslide scars on unmodified hillsides (no obvious cut or fill) served as calibration points for soil depth. Only about 7–8 such scars were available for each calibration area. Tello (2020) adjusted the GPS location of each calibration point to the center of its corresponding landslide polygon mapped from imagery by Bessette-Kirton et al. (2019c). A 5 m buffer around each point ensured adequate sampling of model depths to be compared with the field-measured maximum depth. Tello (2020) used a provisional version of the soil-depth code, REGOLITH (Baum et al., 2021), to model trial soil-depth distributions for the calibration areas. Multiple runs to incrementally sample the parameter spaces of several different soil models implemented in REGOLITH produced hundreds of trial soil depth grids for each of the four calibration areas. Soil models tested include a linear area- and slope-dependent model (LASD) (Ho et al., 2012) and modified forms of Pelletier and Rasmussen's (2009) models dependent on non-linear slope (NSD), area and slope (NASD), and slope and depth (NDSD). Testing these against the field-measured landslide-scar maximum depths resulted in optimized input parameters for each model and area (Tello, 2020).
Tello (2020) used a range of statistical metrics identified by Gupta et al. (2009) to determine predictive success of the model outputs. Most important of these was the Euclidian distance from the ideal point, ED. The ideal point is characterized by perfect correlation between observed and simulated points and by perfect agreement between the means and standard deviations of the observed and simulated point distributions:
where the ideal point is at r= 1, α= 1, β= 1 so that ED = 0. The linear correlation coefficient, r, relative variability, α, and the bias relative to the observed sample, β, define the ED in Eq. (1) (Gupta et al., 2009). In Eq. (1) the relative variability is the ratio of the standard deviation of the simulated values, σs, to the standard deviation of the observed values, σo (). Likewise, the bias is the ratio of mean of the simulated values, μs, to the mean of the observed values, μo (). The linear correlation coefficient, r, indicates the quality of a least-squares fit of the simulated values to the observed values, with r= 1 indicating a perfect fit. The model run having the lowest ED usually had the best fit, unless ED > 1 (Tello, 2020). Where ED > 1, we chose the model run with β closest to 1 so that the mean simulated depth would be as close as possible to the mean of depth observations (Gupta et al., 2009). The best-fit soil-depth distribution corresponded in turn to a best-fit parameter set for each soil-depth model type. Comparison of best scores for each model type identified the overall best fit of all models tested.
3.5 Soil model evaluation and one-dimensional slope-stability model calibration
To further evaluate the soil-depth modeling results and finish calibrating the slope-stability model, we computed ψ and F1 as implemented in TRIGRS (Baum et al., 2010; Alvioli and Baum (2016a) for dry and steady saturated soil conditions (Sects. S1 and S2) using the better performing soil-depth models for each calibration area. Previously defined better performing (true positive rate, TPR, ≥ 75 %) ranges of φ′ (38–60°) and c′ (0–4 kPa) (Baum, 2021; Fig. 6b, c, d) defined the parameter space for computing F1 with a well-performing subset of trial soil-depth distributions. In addition, we required F1 > 1 in 99.9 % of grid cells for ψ(H)= 0 to ensure slope stability under dry conditions. Computing F1 over the calibration areas using the best-fit distributions for each soil-depth model type and φ′ and c′ combinations produced many F1 grids. Receiver operator characteristic (ROC) analysis (Metz, 1978; Fawcett, 2006; Begueria, 2006) of these F1 grids against mapped landslide scarp points indicated which combinations of trial soil-depth distribution and strength parameters predicted the most observed landslides, based on the area under the ROC curve. Using parameters from the highest performing F1 distribution, we selected the preferred soil depth model and φ′ and c′ values for modeling F1 in the large study areas enclosing Lares, Utuado, and Naranjito municipalities. The calibration areas represented different geologic terranes having the highest densities of landslides in the study areas so that the calibration procedure yielded separate model and parameter values relevant to each of these terranes.
3.6 Quasi-three-dimensional slope stability calibration
After H and F1 values had been improved as much as possible by calibration, we began test calculations of F3 as implemented in the new open-source code Slabs3D (Baum, 2023; Sect. S3) and worked to further refine potential landslide source areas. We varied the size of the trial surface from a 3.5 m radius to a 10.5 m radius (Fig. 7) and used ROC analysis along with information about observed source-area sizes to determine the optimum F3 radius. In addition to these quantitative assessments, we inspected the maps to confirm that the susceptibility zones and potential source areas made sense topographically, mechanically, and geologically. These inspections helped ensure that potential landslide source areas were consistent with observations and expectations for hillsides whether they were relatively undisturbed or modified by roads, cut slopes, and embankments. The inspections led to some minor revisions of the computer code to correct map errors (such as spurious spots of low factor of safety), followed by repeated model runs.

Figure 7Sketch showing moving circle search strategy and trial surface geometry used in computing approximate 3D factor of safety, F3. All grid cells whose center is inside the circle are included in the computation of F3, and cells in the head scarp, flank, and toe areas are combined to form wedges for computational purposes. The trial surface has a map-view radius R; δg is the slope of the ground surface; δa is the apparent dip of the trial surface in the assumed direction of sliding (average slope direction of grid cells centered within the horizontal circle); H is height of a grid-cell centered column from the trial surface to the ground surface; and φ′ is the angle of internal friction of the soil for effective stress (modified from Baum et al., 2012). For the case depicted in Section A-A′ (above), H is constant and 1.5 times the horizontal width, w, of the square grid cells. As the average value of decreases and as R increases, the perimeter of the trial surface contracts toward the projection of the horizontal circle onto the ground surface. For variable soil-depth models, H may vary from cell to cell, and the value of H for the grid cell closest to the upslope or downslope edge of the horizontal circle is used in the formulas shown in the cross section for horizontal dimensions of the scarp and toe respectively.
Due to insufficient data, rigorous calibration was not possible for some areas, such as the karst areas of Bawiec's (1998) limey sediment terrane. We adjusted model parameters (reduced maximum soil depth, Hmax, and characteristic soil depth, h0, for the soil-depth model and increased c′ for computing F1 and F3) for the limey sediment terrane to account for the terrane's low landslide density during Hurricane Maria.
3.7 Geologic mapping and parameter zonation
Bawiec (1998) compiled published 1:20 000-scale geologic mapping of Puerto Rico and (as noted previously) combined related formations into geologic terranes (Fig. 1 and Bawiec, 1998). Based on the results of early studies (Bessette-Kirton et al., 2019a) and our calibration efforts, the geologic terranes became the basis for subdividing the study areas into parameter zones. The topographic base maps available at the time of geologic mapping lacked the detail of the pre-event lidar-derived topography used in this study. Trial computations of F1 and F3 on the study area DEM tiles indicated that a uniform soil depth model across the highly susceptible geologic terranes resulted in a more accurate susceptibility map than a zoned model using the calibrated soil-depth parameters. This was likely a consequence of (1) having few soil-depth observations available from unmodified hillsides in each zone (Sect. 3.4) and (2) a high degree of land surface modification from past agricultural activities, as well as road and residential construction resulting in weak calibration of the volcaniclastic and submarine basalt and chert geologic terranes. Consistent with results in Fig. 6a, uniform values of φ′ and c′ for the highly susceptible geologic terranes likewise resulted in good performance, so we used the same soil depth and strength parameters for all three terranes (Figs. S1 and S2). Consequently, slight uncertainty in locations of boundaries between these terranes had no effect on computed F1 and F3 values. However, a large difference in landslide susceptibility and model parameters (maximum soil depth, h0, c′) existed between the limey sediment terrane with its cone karst and the highly susceptible terranes of the basement complex (submarine basalt, volcaniclastic, and granitoid). Offsets as great as tens of meters in the contact between the limey sediment terrane and its neighbors along a prominent escarpment in Lares and Utuado resulted in errors in F1 and F3 along the escarpment. Consequently, Perkins et al. (2022) remapped the limey sediment contact using lidar-derived shaded relief images and optical imagery to accurately delineate the transition from high to low landslide susceptibility across the contact. The contact was discerned based on the visually distinct differences between the closed basins and rugged karst cones of the limey sediment terrane and the steep ridges and narrow branching valleys of the basement rocks.
3.8 Soil-depth modeling
After completing the calibration process, we created the overlapping rectangular tiles (described previously, Sects. 2, 3.1) from the pre-event lidar bare-earth DEMs (Fig. 4, stage C and Fig. 1b, c). We created additional input files from the lidar-derived DEM tiles: flow accumulation grids for use with the area-dependent soil-depth models and parameter-zone grids for specifying different model input parameters (Sect. 3.6, 3.7, Fig. 4). The parameter zones ensured a thinner and less continuous modeled soil mantle in the karst (limey sediment terrane) than in areas underlain by the landslide-prone geologic terranes (Fig. 1). For comparison with the soil-depth models, we also used constant soil depth equal to the average depth, 1.4 m, observed at landslide scars.
3.9 Pressure-head and slope-stability modeling
Raster grids created from the soil-depth modeling defined soil depth (H) and slope of the ground surface at each grid cell. We computed ψ and F1 using TRIGRS (Baum et al., 2010; Alvioli and Baum, 2016a), version 2.1, using the same lidar-derived DEM tiles and parameter zones as for soil-depth modeling (Fig. 4). Then, using ψ(H) computed with TRIGRS (Sect. S1) along with the same lidar tiles, parameter zones, and φ′ and c′ values used in computing F1 as input for Slabs3D, we computed F3 (Fig. 4). The radius of each trial surface, as constrained by earlier testing in the calibration areas (Sects. 3.6, 4.5), was held constant at 3.5 m for all model runs on study area tiles.
3.10 Model testing and evaluation
We used ROC analysis of F3 grids based on pre-event lidar topographic data compared to landslide head-scarp points mapped by Hughes et al. (2019) as a basis for testing performance and then defining susceptibility categories (Fig. 4). Selecting the minimum F3 value within a 3 m radius around the scarp points accounted for uncertainty in their mapped locations. Validating F3 for pre-event topography was appropriate because it most accurately portrayed conditions at the time of Hurricane Maria. We computed true positive rate (TPR), false positive rate (FPR), and area under the TPR–FPR curve (AUC) and distance to perfect classification, D2PC, (0,1) (Formetta et al., 2016), to evaluate performance of pre-event F3 as a predictor of observed landslide scarp points. Analyzing landslide density distribution across F3 provided a further check on model accuracy. We computed landslide densities in 0.1 increments of F3 to check for a general trend of decreasing observed density with increasing F3. We also continued map inspections as described in Sect. 3.6.
As an additional check we computed ROC statistics for minimum F3 values within source areas mapped by Baxstrom et al. (2021a) and Einbund et al. (2021a, b). Their detailed landslide source mapping covers only a fraction of the study areas (Fig. 1), whereas the scarp points mapped by Hughes et al. (2019) cover the entire island. However, source area polygons enclose pixels that are more relevant to testing performance of F3 than circles centered at the scarp points.
Evaluating the model to address the need for a conservative landslide susceptibility map led us to select threshold values of F3 enclosing specific percentages (or TPR) of landslide points. Our reason for doing so rather than placing the category break at F3= 1 is to account for model and parameter uncertainty. Every F3 contour on the map encloses a specific percentage of landslide points. Contours at high F3 values enclose more landslide points than low F3 contours. We selected F3 contours corresponding to TPRs of 0.75 and 0.90 of Hurricane Maria-produced landslide head-scarp points (Hughes et al., 2019) to define the limits of very high (TPR ≤ 0.75), high (0.75 ≤ TPR ≤ 0.90), and moderate (TPR > 0.90) landslide source susceptibility zones. The high and very high susceptibility zones both indicate significant danger from landslides but allow users to distinguish areas having greater potential for long runout (Brien et al., 2021). These classes include most mapped landslide points as well as the adjacent steep slopes where they occurred while limiting the overall areal extent of the very high and high susceptibility classes.
3.11 Modeling potential landslides on post-storm topography
After modeling potential source areas on pre-event topography, we recomputed the soil depth, pressure head, and factor of safety using post-event 1 m lidar topography (U.S. Geological Survey, 2020a, b, c). We generated new slope, zone, and flow-accumulation grids from the post-event lidar and then ran REGOLITH, TRIGRS, and Slabs3D in succession (Fig. 4) to indicate our best estimate of susceptibility to future landslide initiation.
3.12 Removing edge effects and applying susceptibility categories
We joined the four overlapping tiles for Lares and Utuado to create a final landslide susceptibility map (based on post-event lidar). To reduce edge effects (Fig. 4) when joining the four tiles, we first removed a 100 m buffer along all edges of each tile. At grid cells where two tiles overlapped, differences in F3 tended to be small and we retained the greater F3 value. For the single tile covering Naranjito, we removed only the 100 m buffer along all tile edges.
We then classified landslide susceptibility for post-event topography across the three municipalities using the same F3 thresholds at TPR ≤ 0.75 and TPR ≤ 0.90 determined for the pre-event topography (Fig. 4). These thresholds divide the map area into zones of varying susceptibility to landslide initiation. The resulting susceptibility zones estimate the potential for future shallow landslides (Figs. S1 and S2).
4.1 Soil-depth calibration
We calibrated soil depth to field measurements (Fig. 4, Sect. 3.4) for three (ANA, LAR, UTU) of the four calibration areas and calculated Euclidian distance from the ideal point, ED (Eq. 1), correlation coefficient, r (and other statistical parameters as outlined in Tello, 2020), to determine which models and parameter sets gave the closest match to field observations (Fig. 8a, b). No soil depth calibration was performed for NAR as depth measurements in Naranjito were mainly outside the area mapped by Bessette-Kirton et al. (2019c). Limiting the observed depths to landslide scars on relatively unmodified slopes resulted in sample sizes of only seven or eight observation points (landslide sources) per calibration area. Most soil-depth models for the Utuado calibration area (UTU) had acceptable performance as indicated by positive correlation between observed and simulated depths (0.08 ≤ r ≤ 0.78) and ED ranging from 0.28 to 0.99 (Fig. 8a; Tello, 2020). Of these, the modified nonlinear area and slope (NASD) model had the smallest ED, 0.28, and the largest r, 0.78 (Fig. 8a). Other better-performing models were a nonlinear slope-dependent model with linear area dependance (NSDA) and a linear area- and slope-dependent model (LASD) based on the wetness index (Ho et al., 2012). In contrast, most soil-depth models for the Añasco (ANA) and Lares (LAR) calibration areas performed poorly, with negative or small positive correlation (r < 0.16) and 0.69 < ED < 1.8 (Fig. 8a). The poor correlation probably resulted from the small sample sizes of observed depths in these areas. At LAR, only the nonlinear slope-dependent model (NSD; see Pelletier and Rasmussen, 2009) had acceptable performance with r= 0.78 and ED = 0.69 (Fig. 8a). The NASD model had α and β closest to 1, for both ANA and LAR (Fig. 8b).
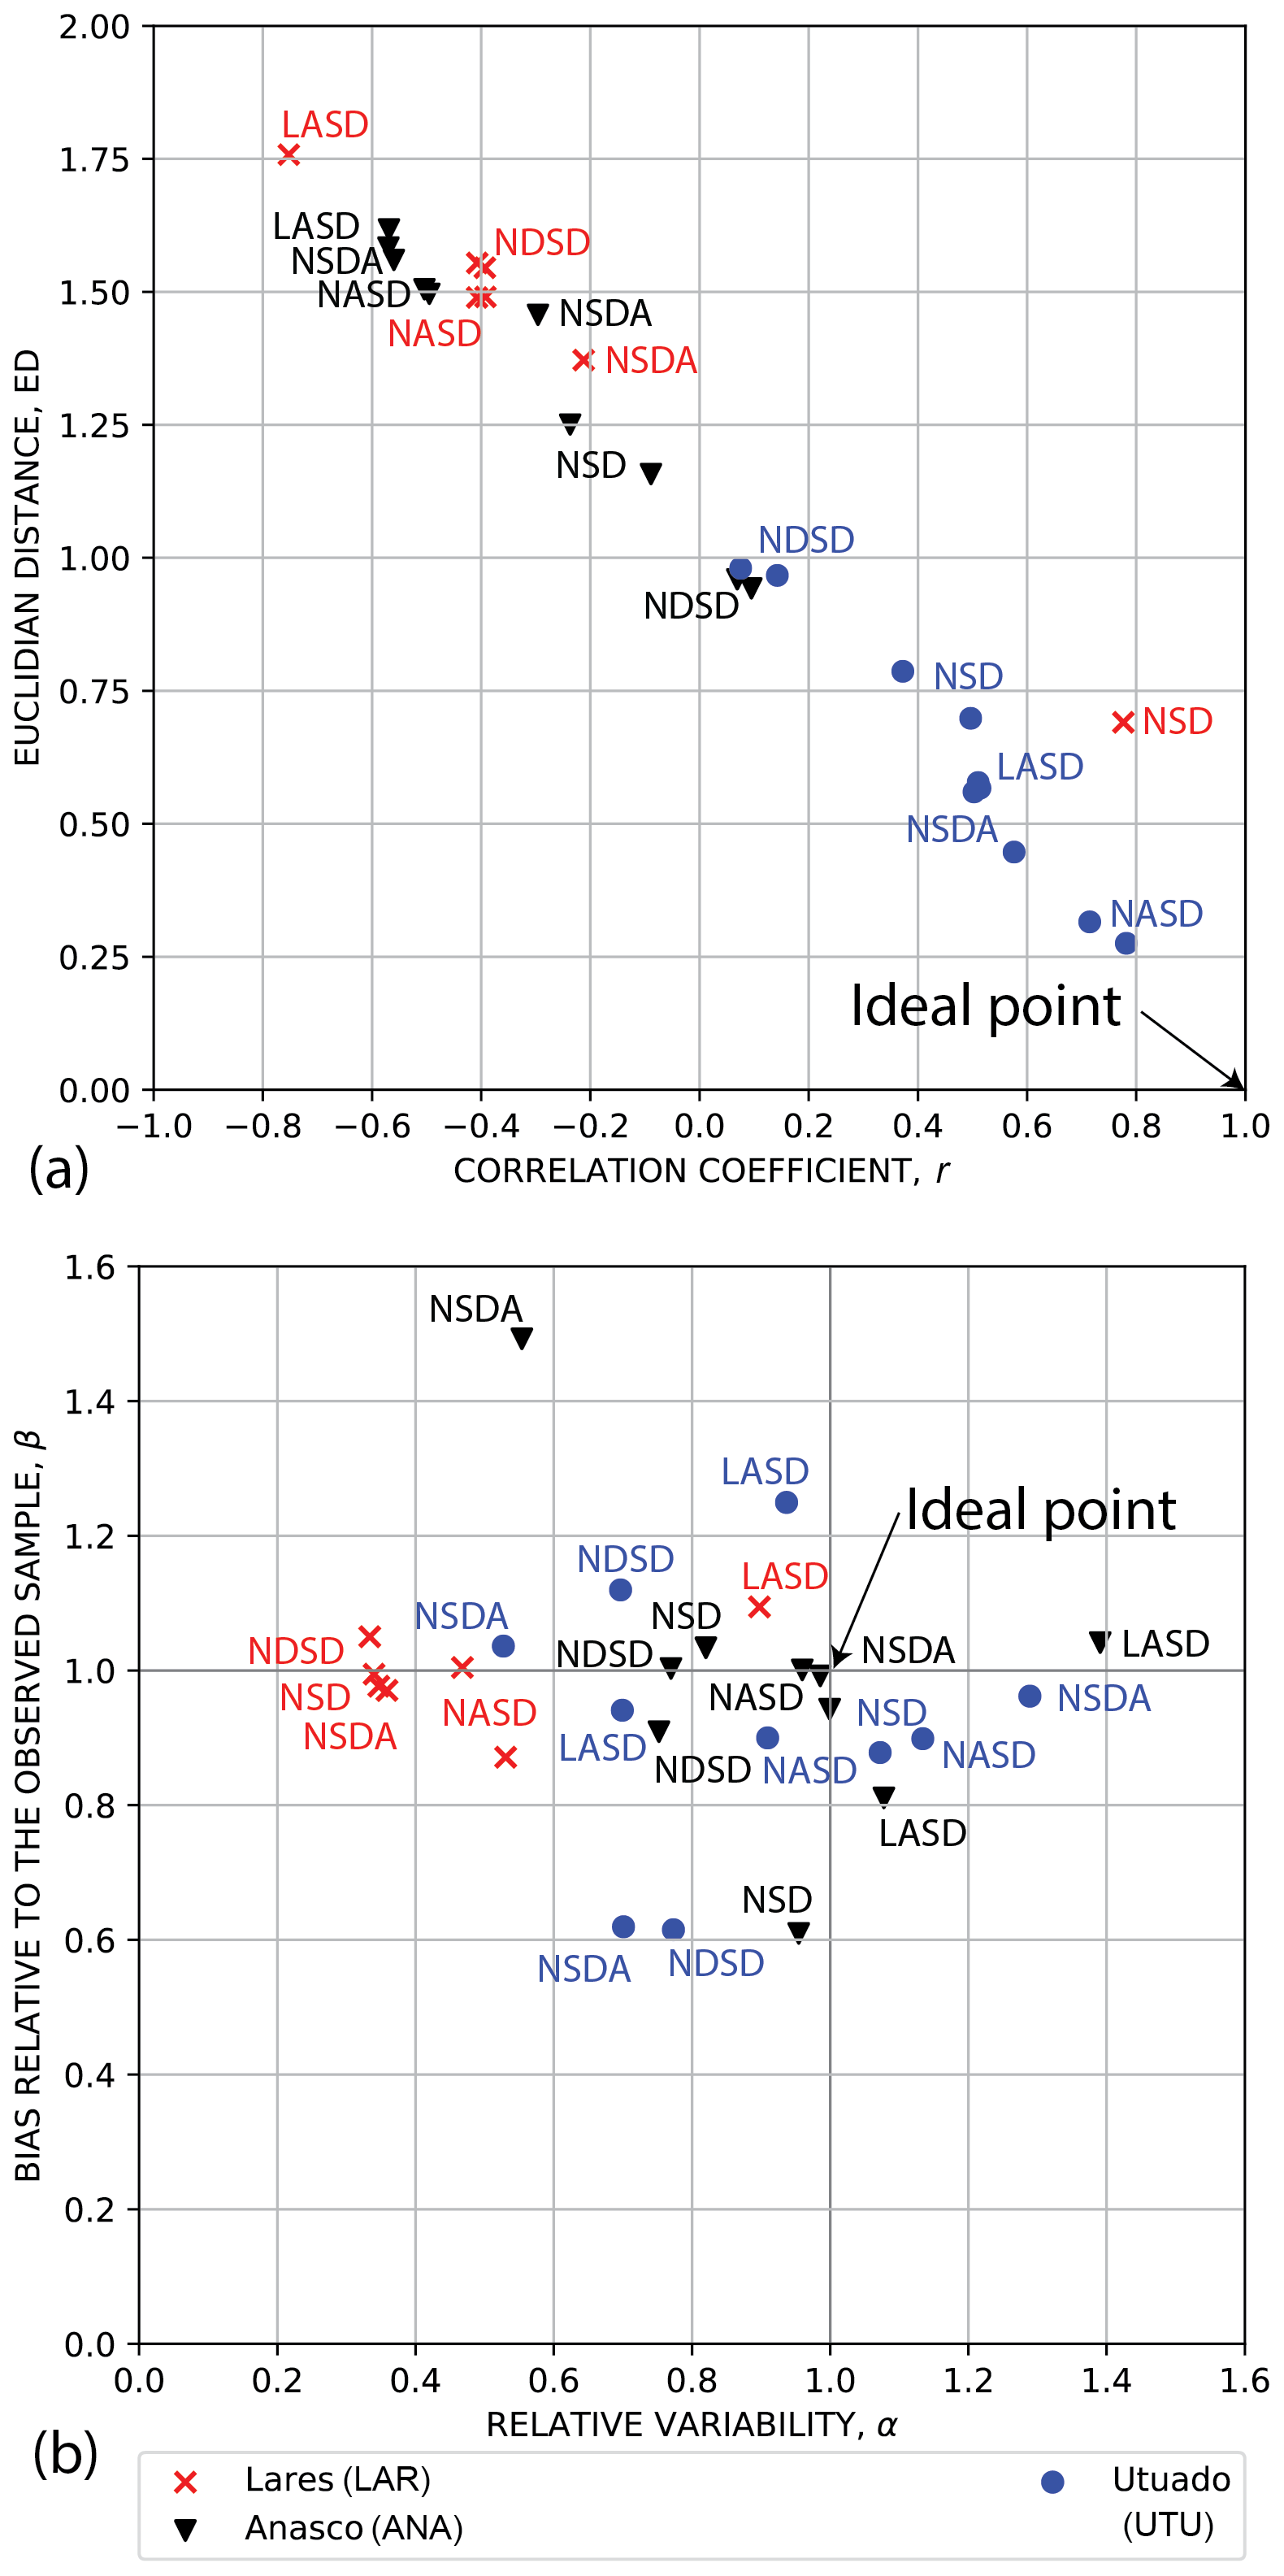
Figure 8Soil-depth model calibration measures for Añasco (ANA), Lares (LAR), and Utuado (UTU) calibration areas (Fig. 1). Performance is based on comparing maximum landslide depth at field-mapped landslide points from unmodified hillsides against modeled depths within a 5 m radius of the point for all field-mapped points in the calibration area. GPS point locations were corrected as needed by moving them to the centers of corresponding landslide polygons mapped by Bessette-Kirton et al. (2019c). (a) Primary metrics, Euclidian distance from the ideal point, ED (smaller is better), versus correlation coefficient, r. (b) Bias relative to the observed sample, β, versus relative variability, α. The ideal point is at r= 1, α= 1, β= 1. Soil-depth models: LASD, linear area- and slope-dependent model; NASD, nonlinear area- and slope-dependent model; NDSD, nonlinear depth- and slope-dependent model; NSD, nonlinear slope-dependent model; NSDA, nonlinear slope-dependent model with linear area dependence.
4.2 Soil-depth model evaluation and slope-stability calibration results
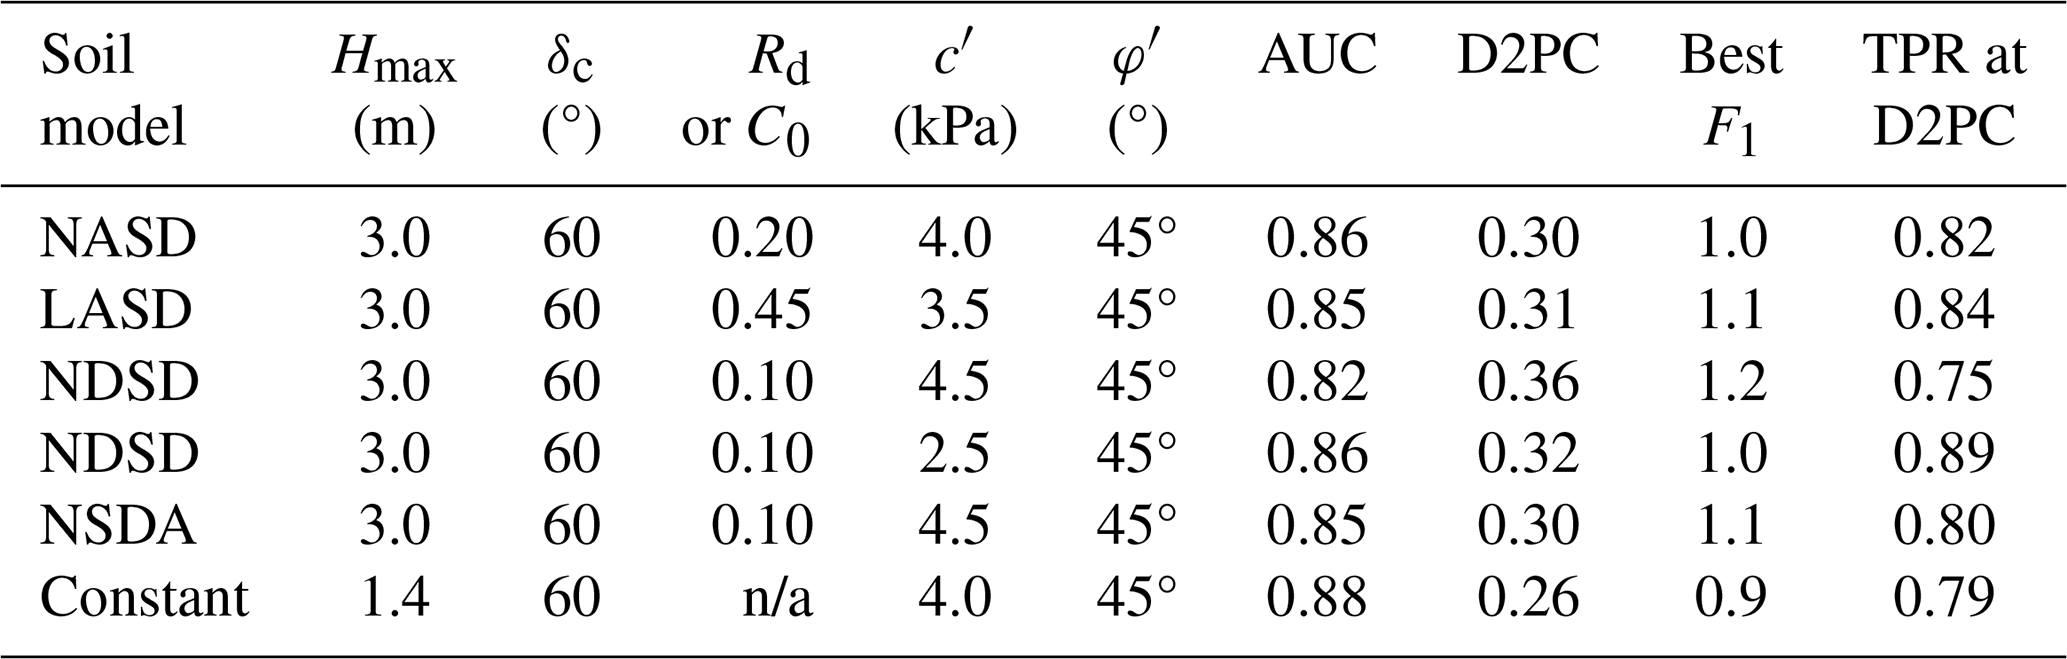
The slope stability parameter calibration compared F1 values for previously determined ranges of c′ and φ′ (Fig. 6) for each of the soil depth models to find the best-performing combination of soil model and strength parameters for predicting landslide source locations in each calibration area (Fig. 4, Sect. 3.5). For UTU, the NASD model performed best with the NSDA model close behind (Tello, 2020) based on area under the TPR–FPR curve and minimum distance of the curve from the perfect classification. Parameter combinations and ROC results for the best-performing model in each area appear in Table 1. Despite poor soil depth model performance metrics for ANA and LAR (Fig. 8), the F1 calculations for the three calibration areas indicated that the NASD soil depth model had the greatest predictive strength for locations of landslide source areas in ANA, LAR, and UTU with similar results (Table 1). Despite lack of soil-depth calibration in NAR, results in this study area were like the other three calibration areas (Table 1). Values of δc near 60° gave the best soil-depth model results (Table 1), despite variability in the steepest slopes where landslides occurred in the different terranes (Figs. 3d, 4).
Table 1Calibration results for 1D factor of safety, F1, with soil depth models by calibration area (Fig. 1). Positives and negatives in the ROC analysis based on total pixels within and outside the estimated source areas of landslide polygons mapped by Bessette-Kirton et al. (2019c) and whether the pixels have F1>1 or F1<1 (Tello, 2020). Symbols and abbreviations: NASD, non-linear area- and slope-dependent soil-depth model of Pelletier and Rasmussen (2009) as modified by Baum et al. (2021); Hmax, maximum soil depth; δc, critical slope angle; Rd, diffusivity ratio; c′, soil cohesion for effective stress; φ′, angle of internal friction for effective stress; AUC, area under the curve of true positive rate (TPR) and false positive rate (FPR) (larger is better); D2PC, distance from the perfect classification, (0,1), to nearest point on the TPR–FPR curve (smaller is better); best F1, 1D factor of safety at point on the TPR–FPR curve nearest to the ideal point, (0,1), and therefore the most accurate F1 classifier of landslide versus non-landslide grid cells for the particular model (closer to 1 is better); °, degrees.

4.3 Modeled soil depth
Having completed the soil-depth model calibration (Sect. 4.1) and testing (Sect. 4.2), we modeled soil depth in the larger map tiles preparatory to analyzing slope stability (Fig. 4, Sect. 3.8). Each tile covers hundreds of square kilometers, so we illustrate results using the NAR area, chosen to demonstrate that our susceptibility workflow can achieve very good results even with limited landslide source depth observations. As noted previously, insufficient field-measured landslide points prevented soil-depth model calibration (Sect. 4.1), but not model evaluation and slope stability calibration (Sect. 4.2) for NAR. Figure 9 shows predicted soil depth for the best-performing soil-depth model (based on the slope-stability evaluations, Sect. 4.2) in NAR (see Fig. 1 for location). The model shown in Fig. 9 predicts greater soil depth in hollows than on ridges. Other models that were tested (not shown) produced somewhat similar results. Differences in model structure produce different responses to topographic features, including flat areas, road cuts, and steep slopes. For example, the modified NASD and NSDA models predicted deep soils (≤ 3 m for parameters chosen) in convergent areas, on steep slopes, including road cuts and embankments. They also predicted thin soils on ridge crests, with thin or no soil on downslope flat areas (see large flat area on east edge of Fig. 9). In contrast, the LASD and NDSD models predicted deep soils (≤ 3 m for parameters chosen) in convergent areas and on flats and thin soils on ridge crests and steep slopes (except where they occur in strongly convergent topography). These topographic features were more distinct in the three nonlinear models, NASD, NSDA, and NDSD, than in the linear LASD model.
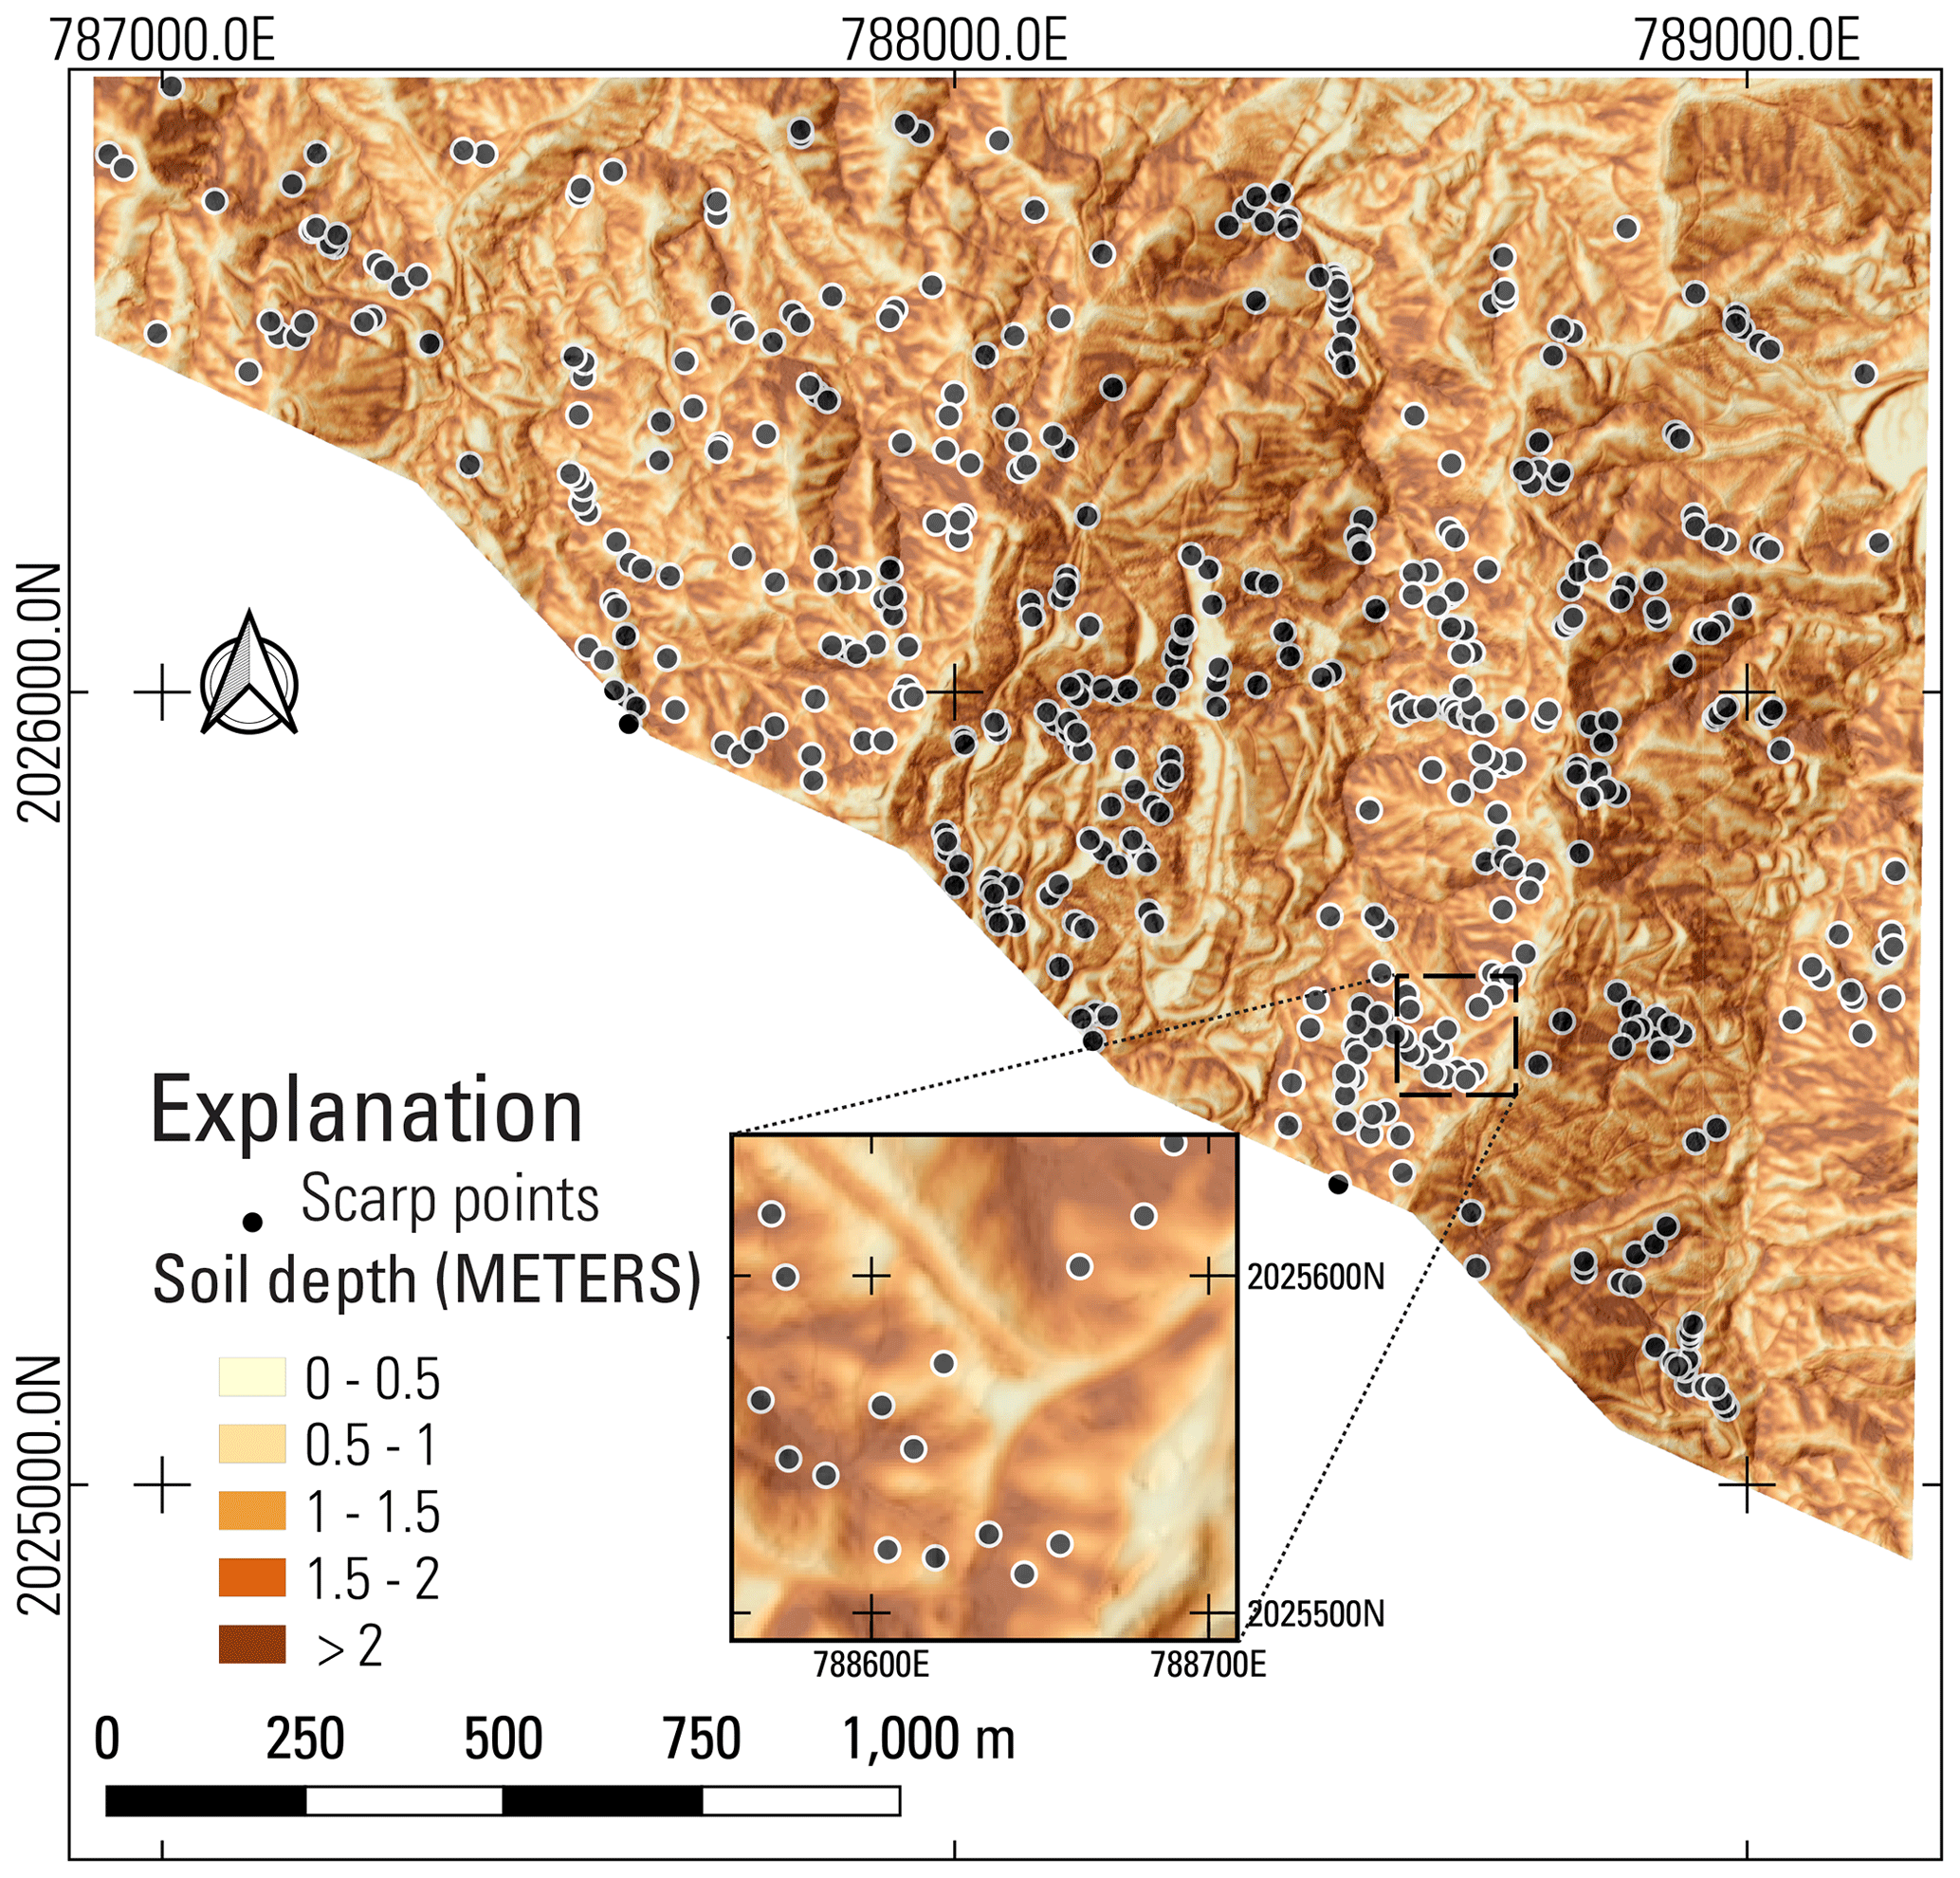
Figure 9Best-performing version of soil depth maps from soil-depth models tested for the Naranjito (NAR) calibration area in volcaniclastic terrane (Fig. 1). Topographic base derived from lidar by U.S. Geological Survey (2018), scarp points from Bessette-Kirton et al. (2019c). The modified nonlinear area- and slope-dependent (NASD) model (modified from Pelletier and Rasmussen, 2009, as implemented by Baum et al., 2021) depicted here was the overall best-fitting soil-depth model for this terrane. Inset shows details of a 150 m by 150 m area, with thicker soil accumulation in concave areas.
4.4 One-dimensional factor of safety
Figure 10 shows F1 optimized for NAR and calculated using TRIGRS and the soil model results in Fig. 9, as well as F1 for constant soil depth. Slopes steeper than 60°, the estimated critical slope angle, were treated as barren (zero or negligible soil thickness) and stable because landslides were very rare on slopes steeper than 60° (Fig. 3d). On slopes flatter than 60°, soil strength parameters are within the ranges obtained by sensitivity analysis of F1 parameters φ′ and c′ over observed ranges of slope and depth of landslides characterized in the field at ANA, LAR, UTU, and NAR (Fig. 6). The only landslide source locations available throughout the three municipalities are the scarp points of Hughes et al. (2019). Due to location uncertainty, we used a 3 m radius around the scarp points for defining true positives. Color thresholds on the maps (Fig. 10) are based on F1 at TPR of 0.75, 0.90, and 0.95. Consequently, thresholds for F1 differ for each panel in Fig. 10. The same TPR values (0.75, 0.90, 0.95) were used for picking F3 thresholds for landslide initiation susceptibility across the entire study area covering Naranjito, Utuado, and Lares municipalities in the final maps (Figs. S1 and S2).

Figure 10Maps of Naranjito (NAR) calibration area in volcaniclastic terrane (Fig. 1) showing 1D factor of safety (F1) results for (a) soil-depth model shown in Fig. 9 as well as (b) constant average soil depth. Topographic base derived from lidar by U.S. Geological Survey (2018), scarp points from Bessette-Kirton et al. (2019c). True positives determined by minimum F1 within a 3 m radius of the scarp points. (a) F1 for NASD, the modified nonlinear area- and slope-dependent soil-depth model depicted in Fig. 9, (b) F1 for constant soil depth of 1.4 m. Inset shows details of a 150 m by 150 m area.
Areas of low F1 are similar in overall pattern between the two maps shown in Fig. 10 but differ in detail. These details include small areas of low F1 unique to each model as well as variation in the extent of major areas of low F1. Many boundaries of the areas of low F1 are ragged, and small patches of yellow, indicating higher F1, occur within the larger red and orange areas of low F1. Differences in F1 between the maps are attributable mainly to variation in soil depth and partly to variation in c′. The optimum value of c′ varied depending on the characteristics of each soil model (Table 2). The results shown in Fig. 10 are for the best-performing combination of c′ and φ′ for the soil-depth model at NAR (Fig. 9 and Sect. 4.2) and for constant average depth of 1.4 m.
Table 2Key inputs and performance measures for factor of safety calculations based on the infinite slope model (F1), as implemented by TRIGRS, in the Naranjito calibration area (NAR). Performance is based on minimum F1 within a 3 m radius of landslide scarp points mapped by Hughes et al. (2019). Symbols and abbreviations: NASD, non-linear area- and slope-dependent soil-depth model of Pelletier and Rasmussen (2009) as modified by Baum et al. (2021); NSDA, non-linear slope-dependent model of Pelletier and Rasmussen (2009) modified by Baum et al. (2021) to include linear area dependence; NDSD, non-linear slope- and depth-dependent model of Pelletier and Rasmussen (2009); LASD, linear area- and slope-dependent model of Ho et al. (2012); Hmax, maximum soil depth; δc, critical slope angle; Rd, diffusivity ratio; C0, empirical constant used in LASD; c′, soil cohesion for effective stress; φ′, angle of internal friction for effective stress; AUC, area under the curve of true positive rate (TPR) and false positive rate (FPR) (higher is better); D2PC, distance from the perfect classification, (0,1), to nearest point on the TPR–FPR curve (smaller is better); best F1, 1D factor of safety at point nearest to the perfect classification, (0, 1), and therefore the most accurate F1 classifier of landslide versus non-landslide grid cells for the particular model (closer to 1.0 is better); °, degrees; n/a: not applicable.
The different F1 patterns shown in Fig. 10 correspond to slightly different levels of predictive success. The AUC and distance from the perfect classification (0,1) to the nearest point on the TPR–FPR curve, D2PC indicates that F1 for constant depth has the highest predictive skill (AUC = 0.88, D2PC = 0.26, F1 value nearest the perfect classification, F1= 0.9). Next, F1 for the NASD model performed almost as well (AUC = 0.86, D2PC = 0.30, F1 value nearest the perfect classification, F1= 1.0). When applied to the entire DEM tile covering Naranjito municipality, F1 for constant depth and NASD tied with AUC = 0.86 and D2PC = 0.30 (constant depth) and D2PC = 0.29 (NASD). Thus, the performance edge of constant depth is localized at NAR and does not extend across the entire Naranjito DEM tile. Other soil-depth models performed slightly worse (Table 2), consistent with results obtained by Tello (2020) for UTU. The slightly higher performance for F1 with constant depth at NAR comes at the cost of the area classified as very high, high, or moderate susceptibility (TPR = 0.95) being more diffuse, with more ragged boundaries, than for F1 with NASD (Fig. 10a, b). Varying the amount of cohesion used with a particular soil model caused small changes in the AUC, D2PC, and best F1 as shown by the two entries for NDSD in Table 2.
4.5 Quasi-three-dimensional factor of safety
Figure 11 shows F3 computed using the soil-depth model in Fig. 9 and constant soil depth of 1.4 m. Predictive skill for F3 is somewhat less than F1; AUC is 0.05–0.08 less for F3 than corresponding F1 (Tables 2 and 3). The only exception is for the constant soil depth model results where F3 has the highest AUC, 0.94, of all cases tested (Fig. 12a and b). Despite the overall slightly worse performance of F3, it provided smoother boundaries on the landslide susceptible areas (Fig. 11a, b), which also are more continuous than corresponding F1 landslide susceptible areas (Fig. 10). The lower AUC values resulted from the F3 susceptible areas covering slightly more land area than the corresponding F1 areas at the same TPR. Therefore, the F3 susceptibility maps are more conservative than their F1 counterparts.
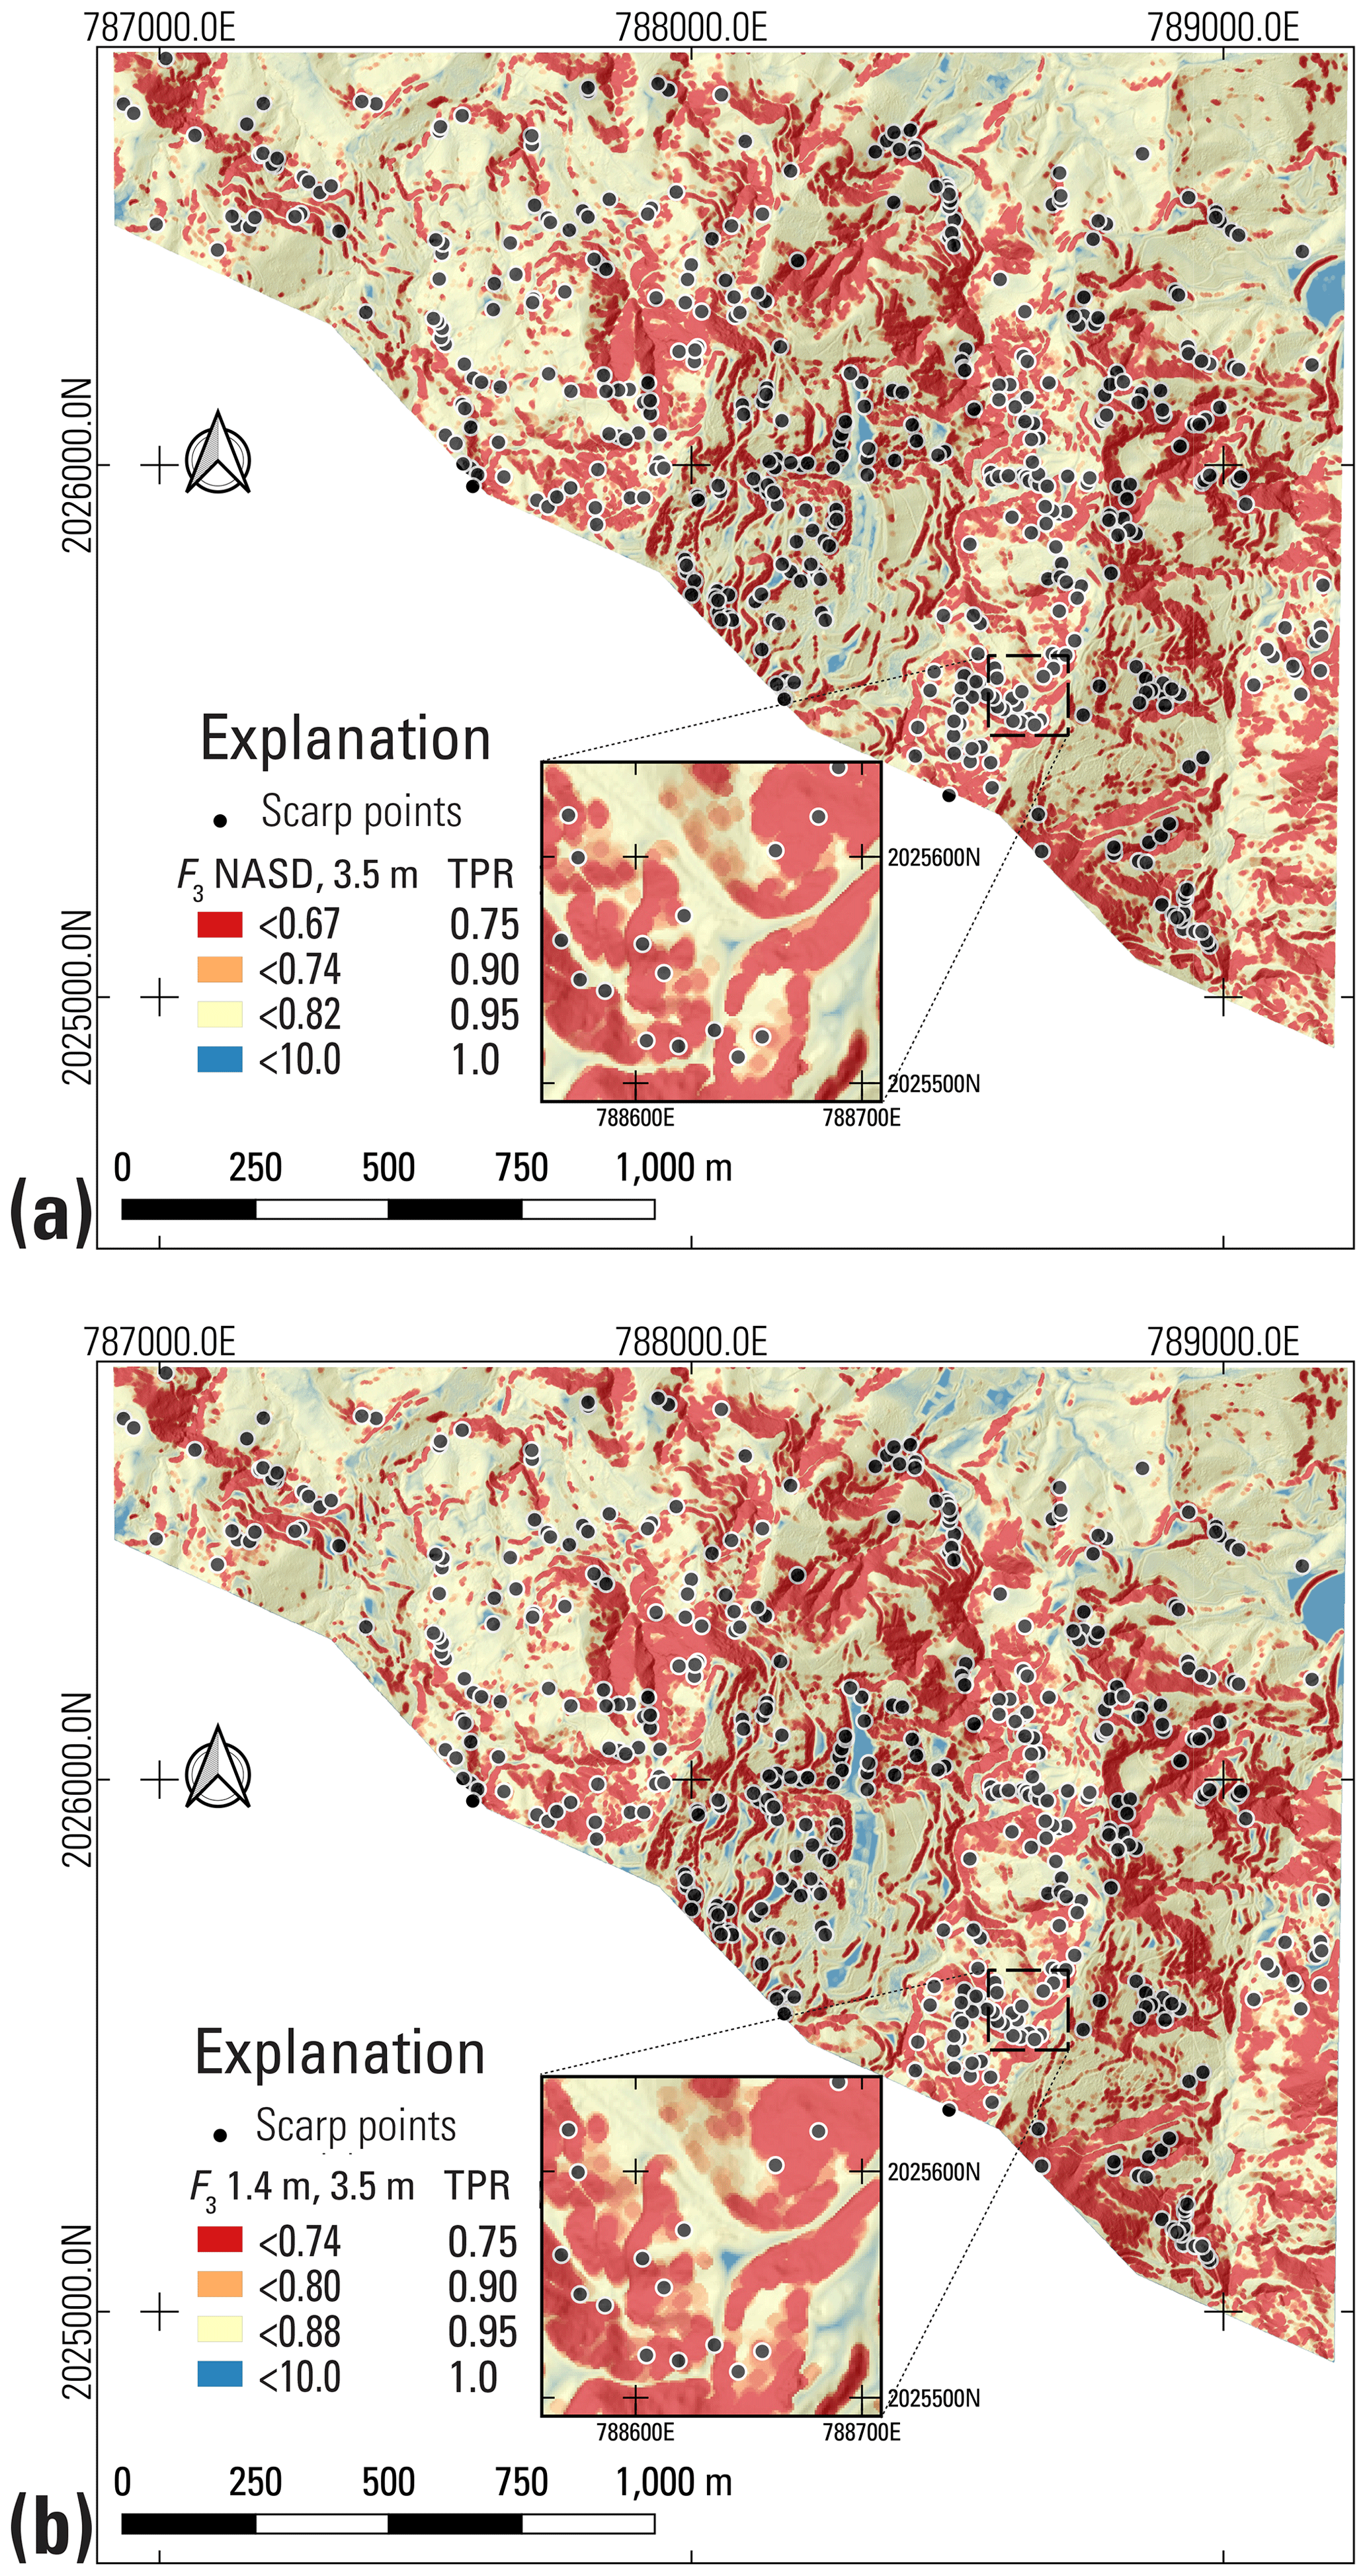
Figure 11Maps of Naranjito (NAR) calibration area in volcaniclastic terrane (Fig. 1) showing quasi-3D factor of safety, F3, results for the soil depth models shown in Fig. 9. (a) F3 for the modified nonlinear area- and slope-dependent (NASD) soil-depth model depicted in Fig. 9, (b) F3 for constant soil depth of 1.4 m. Inset shows details of a 150 m by 150 m area. The calculation of F3 used a trial surface of 3.5 m map-view radius (Fig. 7). Topographic base derived from lidar by U.S. Geological Survey (2018), scarp points from Bessette-Kirton et al. (2019c).
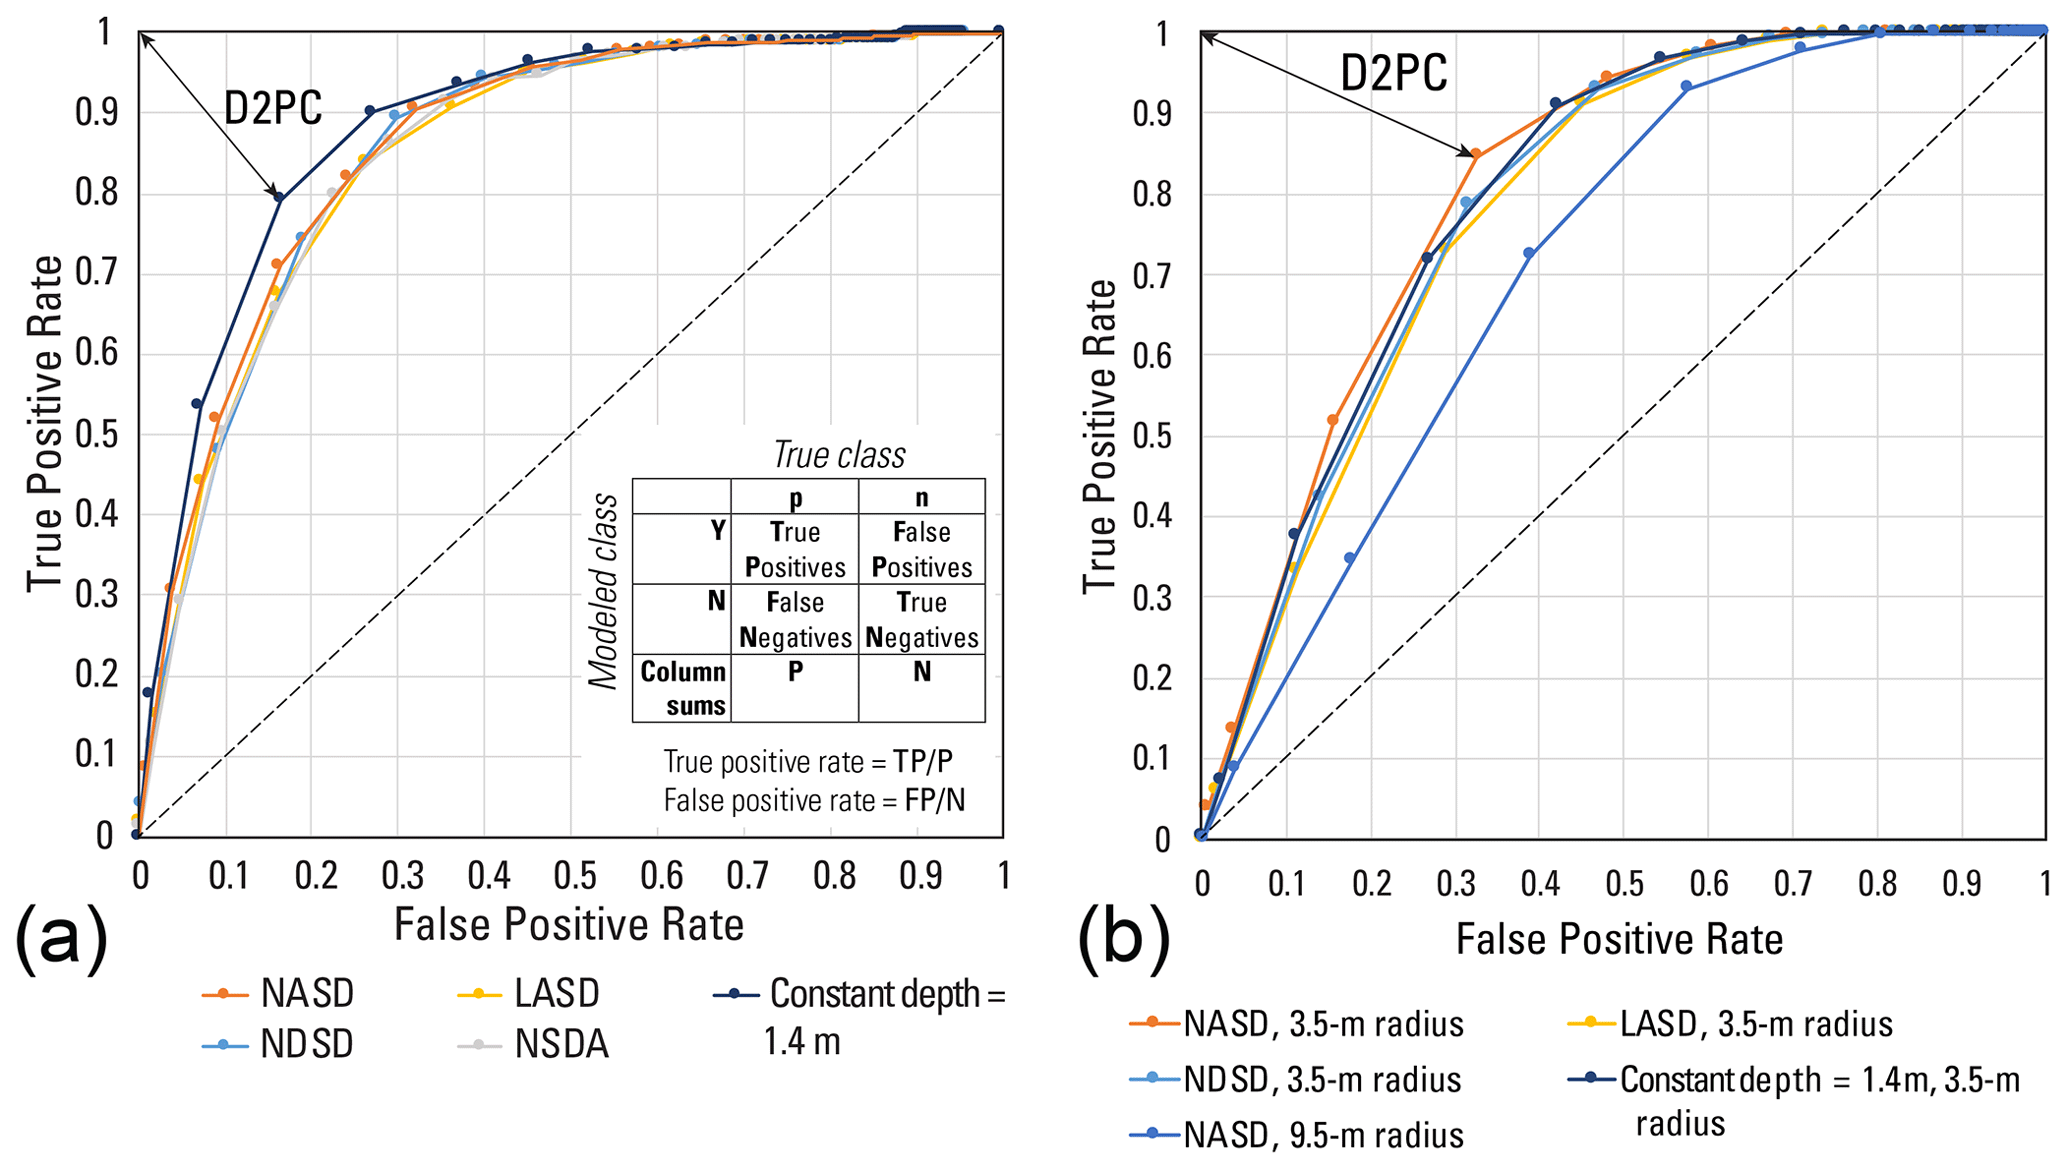
Figure 12Graphs of true positive rate (TPR) versus false positive rate (FPR) for factor of safety maps in Naranjito calibration area (NAR in Fig. 1a, c). Inset shows confusion matrix and formulas defining true positive rate and false positive rate. Double-headed arrow indicates distance to perfect classification (D2PC) for the results of the factor of safety with the smallest D2PC. (a) TPR–FPR results for 1D factor of safety (F1) in Fig. 10, as well as results for F1 using other soil-depth models that were tested during the calibration process. (b) TPR–FPR results for quasi-3D factor of safety (F3) in Fig. 11, as well as results for F3 using other soil depth models and one with a larger (NASD, 9.5 m radius) trial surface. Soil-depth models: LASD, linear area- and slope-dependent model (Ho et al., 2012); NASD, modified nonlinear area- and slope-dependent model (modified from Pelletier and Rasmussen, 2009); NDSD, nonlinear depth- and slope-dependent model (Pelletier and Rasmussen, 2009); NSD, nonlinear slope-dependent model (Pelletier and Rasmussen, 2009); NSDA, nonlinear slope-dependent model with linear area dependence (modified by Baum et al., 2021 from NSD model of Pelletier and Rasmussen, 2009).
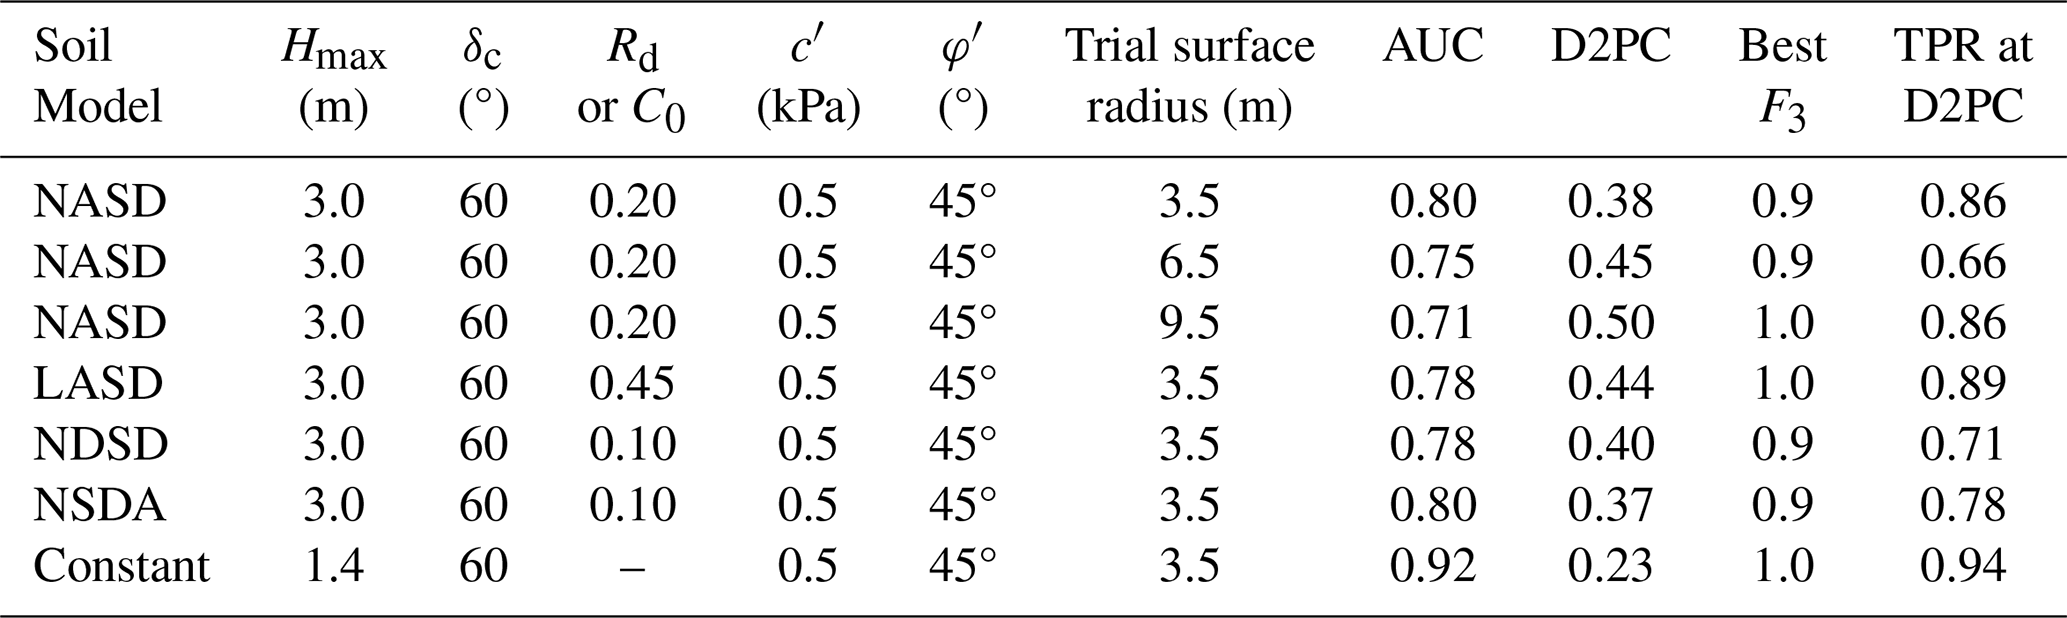
Tests indicated that trial surfaces having a map-view radius of 3.5 m provided more accurate estimates of susceptible areas than larger trial surfaces (6.5 and 9.5 m radius). Other things being equal, larger trial surfaces resulted in smaller AUC and larger D2PC (Table 3, Fig. 12b). The larger trial surfaces tended to widen the susceptible areas and smooth their boundaries, with the result that a larger percentage of the calibration area was classified as susceptible (9.5 m radius, 85 %; 6.5 m radius, 83 %; 3 m radius, 78 % for examples in Table 3). In addition, the 3.5 m radius produced a trial surface close in size (7.5–7.9 m wide, with an area of 46–48 m2 at the ground surface for 1 m depth on 30–40° slopes) to the median horizontal areas of landslide sources mapped in NAR, 51 m2, in UTU2, 42 m2, and in LAR2, 64 m2 (Fig. 3c).
Table 3Key inputs and performance measures for factor of safety calculations based on a quasi-3D limit-equilibrium slope stability model (F3) in the Naranjito calibration area (NAR). Performance is based on minimum F3 within a 3 m radius of landslide scarp points mapped by Hughes et al. (2019). Symbols and abbreviations: NASD, non-linear area- and slope-dependent soil-depth model of Pelletier and Rasmussen (2009) as modified by Baum et al. (2021); NSDA, non-linear slope-dependent model of Pelletier and Rasmussen (2009) modified by Baum et al. (2021) to include linear area dependence; NDSD, non-linear slope- and depth-dependent model of Pelletier and Rasmussen (2009); LASD, linear area- and slope-dependent model of Ho et al. (2012); Hmax, maximum soil depth; δc, critical slope angle; Rd, diffusivity ratio; C0, empirical constant used in LASD; c′, soil cohesion for effective stress; φ′, angle of internal friction for effective stress; AUC, area under the curve of true positive rate (TPR) and false positive rate (FPR); D2PC, distance from the perfect classification, (0,1), to nearest point on the TPR–FPR curve; best F3, 3D factor of safety at point nearest to the perfect classification, (0,1), and therefore the most accurate F1 classifier of landslide versus non-landslide grid cells for the particular model (closer to 1.0 is better); °, degrees.
4.6 Susceptibility categories and predictive strength
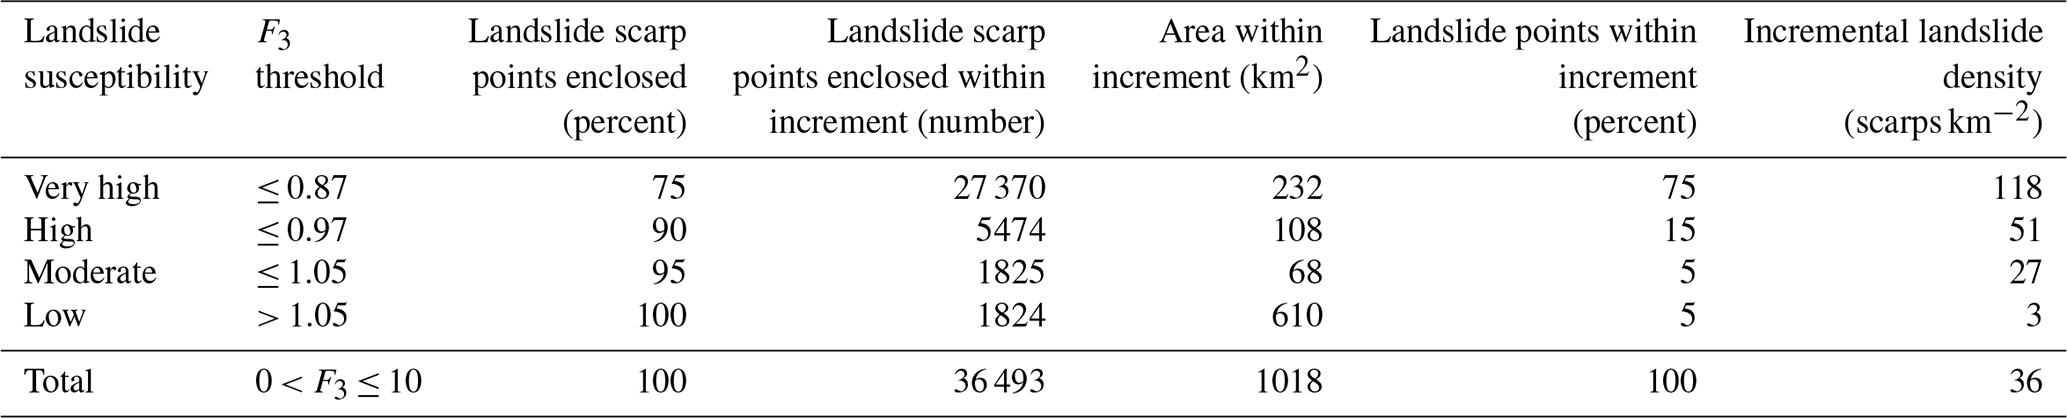
Computing F3 over the combined study areas of Lares, Utuado, and Naranjito municipalities produced somewhat different results than in the calibration areas. Calibration areas have very high landslide densities, with an average density of 182 scarps km−2 at NAR. However, landslide density varies considerably across each municipality. Based on positive correlation between low F3 and landslide scarp points mapped by Hughes et al. (2019), we established susceptibility categories based on percentages of landslides enclosed by successive susceptibility categories as noted previously and as shown in Table 4. Increasing density of observed landslides is consistent with increasing susceptibility. Very high susceptibility (typically > 118 scarp points km−2) characterizes 23 % of the total study area and 21 %, 43 %, and 45 % of the area underlain by marine volcaniclastic, submarine basalt, and granitoid rocks, respectively. Almost all karst areas underlain by limey sediments had low susceptibility (< 2 scarp points km−2) (Baxstrom et al., 2021b). Based on the information in Table 4, the AUC for the entire map area is 0.84, and D2PC is 0.34.
Table 4Landslide susceptibility categories based on minimum value of quasi-3D factor of safety, F3, within a 3 m radius of landslide scarp points mapped by Hughes et al. (2019) for all three municipalities. For consistency, F3 thresholds below are based on F3 calculated using pre-Hurricane Maria lidar topography and scarp locations of landslides induced by Hurricane Maria.
Recent detailed mapping of source areas provided an opportunity to further test performance of the pre-Hurricane Maria F3 map (Sect. 3.9, Fig. 4). Figure 13 shows TPR–FPR curves for the pre-Hurricane Maria F3 map tested against Hurricane Maria landslide source polygons (Baxstrom et al., 2021a; Einbund et al., 2021a, b) and against scarp points (Table 4). The AUC range, 0.85–0.88, is somewhat greater than obtained by testing within a 3 m radius of the scarp points, 0.84.

Figure 13Graph of true positive rate versus false positive rate for pre-Hurricane Maria susceptibility models across the study area tiles tested against head-scarp points (Hughes et al., 2019) and source polygons for Lares (Einbund et al., 2021b), Naranjito (Baxstrom et al., 2021a), and Utuado (Einbund et al., 2021a) with confusion matrix and formulas defining true positive rate (TPR) and false positive rate (FPR). Double-headed arrow indicates distance to perfect classification (D2PC) for Naranjito source polygons and F3 computed using NDSD soil depth. True positive rates are based on minimum value of the quasi-3D factor of safety, F3, within the mapped source polygons or within a 3 m radius of the scarp points. Results for scarp points cover the final pre-Hurricane Maria susceptibility maps of Lares, Utuado, and Naranjito municipalities. Results for the landslide source polygons cover parts of the component tiles (Fig. 1). Landslide source mapping for Lares and Utuado (Einbund et al., 2021a, b) are near LAR and UTU (LAR2, UTU2, Fig. 1b). The graph compares F3 performance based on the modified nonlinear area- and slope-dependent (NASD, modified from Pelletier and Rasmussen, 2009) soil-depth model and two alternates: constant depth of 1.4 m and the nonlinear depth- and slope-dependent soil-depth model (NDSD, Pelletier and Rasmussen, 2009), with strength parameters and other inputs held constant. AUC denotes area under the curve of TPR versus FPR. Np is the number of landslide source polygons, and NSc is the number of scarp points.
Our analyses presented in the previous section (Sect. 4.6) indicate that the landslide susceptibility assessment successfully identifies areas where high percentages of Hurricane Maria landslides occurred. In succeeding paragraphs, we discuss some of the strengths, limitations, and unexpected findings of our approach and results.
Optimum ranges of internal friction angles for all three terranes (Fig. 6) are higher than commonly reported but consistent with measured values of φ′ for low normal stress (Likos et al., 2010). Most reported values of φ′ for soils like those in the study area range from 17 to 41° as noted previously (Sect. 3.2) and are usually based on tests at normal stress greater than 100 kPa. In contrast, samples collected at two field monitoring sites tested at low and moderate normal stresses (Smith et al., 2020) using equipment and procedures described by Likos et al. (2010) had high friction angles for low normal stress. Smith et al. (2020) reported φ′ = 34.8–35.5° (c′ = 0–4.4 kPa) for two samples tested at effective normal stress, , less than 120 kPa, φ′ = 45.6° for a sample tested at ≤ 30 kPa, and φ′ = 53.9° for another sample tested at , ≤ 7 kPa. Significantly, shear stress was considerably higher than normal stress for nearly all individual tests at ≤ 15 kPa, and many at ≤ 30, consistent with 45° at low normal stress. In addition to evidence for high internal friction angles at low normal stress, which is particularly relevant to abundant thin (< 0.5 m) landslides in Utuado, three other factors could contribute to stability and reduce the magnitude of φ′ required to explain stability during dry conditions: (1) soil suction measured at the sites between rainfall (Smith et al., 2020) indicates that suction stress probably contributes to stability. Preliminary tests indicate that considering modest amounts of suction stress (less than a few tens of kilopascals) during dry conditions in the analysis depicted by Fig. 6 shifts the cells having high TPR toward lower ranges of φ′. For example, increasing initial suction stress by −1 kPa shifts the optimum range of φ′ to 35–40° for the submarine basalt and chert landslides compared to the 45–50° range in Fig. 6d. (2) Root resistance also likely contributes to slope stability to depths of about 0.5–0.6 m. Due to high annual rainfall, vegetation in the study areas tends to be shallow-rooted so that significant root resistance would decline rapidly below about 0.4–1.1 m depth (Simon et al., 1990; Larsen, 2012). (3) Lateral stress variation also contributes to slope stability. Even in quasi-3D limit equilibrium as used in computing F3, combined resistance of neighboring grid cells (columns) and toe wedge contributes to stability and reduces the values of φ′ and (or) c′ needed to achieve stability of a potential landslide under dry conditions (Tables 2 and 3). Quantifying the contributions of these three factors (soil suction, root resistance, and lateral stress) to slope stability could lead to greater refinement of our approach to mapping landslide susceptibility.
Our modeling workflow makes a few trade-offs to create a relatively conservative map of potential landslide sources that accounts for uncertainties. These trade-offs are between speed and simplicity of the assessment, statistical accuracy, and continuity of susceptibility zones. Some of the modeling steps (soil depth and F3) add complexity, increase time needed to model susceptibility, and slightly reduce performance metrics (AUC and D2PC) compared to F1 with constant soil depth. In exchange, soil depth and F3 create more continuous susceptibility zones, join neighboring groups of high-susceptibility pixels, and eliminate isolated, commonly errant, pixels of high landslide susceptibility (Figs. 10 and 11). The increased continuity of the susceptibility zones makes them easier to implement in land use and emergency management. In addition, the potential source areas delineated on the map by the high and very high susceptibility areas provide areas susceptible to shallow landslides for estimating potential landslide runout and debris-flow inundation (Brien et al., 2021). Much of the reduction in AUC for F3 results from using the minimum factor of safety value computed for any trial landslide that includes a grid cell. Consequently, very high and high susceptibility zones for F3 are broader than for F1 and thereby have a buffer along their edges. Nevertheless, as indicated by various performance metrics and landslide densities in the susceptibility classes, the landslide assessment successfully distinguishes areas having different levels of susceptibility to landslide initiation (Tables 3, 4) despite these trade-offs.
Although F1 for constant depth has slightly better performance metrics (the highest AUC and smallest D2PC) than F1 for any of the soil depth models calibrated to landslide source depths (Table 2, Fig. 12a) at NAR, its performance metrics are comparable to the nonlinear soil-depth models elsewhere. Our field observations indicate that depth of shallow, rainfall-induced landslides is well correlated to depth of mobile regolith (“soil”) due to strength and permeability contrasts at its base. Soil-depth models represent the distribution of soil depth more consistently with field conditions than constant depth in many settings (Pelletier and Rasmussen, 2009; Ho et al., 2012; Catani et al., 2010; Nicótina et al., 2011; Gomes et al., 2016; Patton et al., 2018). Performance metrics (ED = ; mean-squared error, MSE ) indicate average depth was a poorer predictor of observed landslide depth than any of the models Tello (2020) tested for Utuado. Despite odd differences in how the models estimate soil depth on mid-slope benches and flat valley bottoms, the models we tested (NASD, NSDA, NDSD, LASD) predict thinner soils on ridge crests and thicker soils in hillside hollows, consistent with patterns observed in Puerto Rico and elsewhere for dissected topography (Roering, 2008). For example, mean depths of landslide sources from field mapping in Puerto Rico were 3.25 m (for concave slopes), 2.5 m (for convex slopes), and 2.7 m (for planar slopes; Schulz et al., 2023). The unexpected good performance of F1 for constant soil depth at NAR points out limitations of soil depth models and may result in part from widespread modifications to the landscape resulting from agriculture, road (e.g., Ramos-Scharrón et al., 2021) and building construction, and other activities. Effects of these activities may have influenced the locations of shallow landslides sufficiently to weaken correlation between landslide location and topographic features that influence soil depth (as at LAR and ANA, Fig. 8a). The high degree of slope modification (roads and terraces) in the NAR calibration area is likely a determining factor in F1 performance there (Fig. 10). Identifying specific areas or features where constant-depth F1 classifies susceptibility differently than F1 with other soil-depth models might reveal potential improvements.
Computing F1 using the modified NASD soil-depth model resulted in the areas assigned to the moderate, high, and very high susceptibility classes being more clearly delineated with little or no loss of performance compared to using constant depth. The susceptibility zones in the constant-depth F1 susceptibility map (Fig. 10b) are more diffuse or fragmented (less continuous) than for the NASD soil depth (Fig. 10a) and other soil models we tested. Fragmentation also occurred for susceptibility zones defined by slope categories (Fig. S3a). As noted previously, this improved delineation came with only a slight reduction in AUC (0.88 to 0.86) and small increase in D2PC (0.26 to 0.30) for NAR. When applied to the entire DEM tile covering Naranjito municipality, performance metrics of F1 for constant depth, F1 for NASD, and slope categories were equal (AUC = 0.87, D2PC = 0.29–0.30). As noted previously, when checked against detailed source mapping, the performance metrics for F3 are better than when compared against the scarp points (Fig. 13). In addition, differences in performance metrics between constant depth and the NDSD model and modified NASD model are negligible.
Due to physical (subsurface conditions, ground-failure mechanisms) and conceptual (parameters, models) uncertainties, the F3 value at the boundary between high and moderate susceptibility is slightly less than 1 (0.97, Table 4). Although the strength parameters could be increased to achieve F3= 1.0 at TPR = 0.90, we also wanted to keep F3 at TPR = 0.95 relatively low while keeping F3 >1 under dry conditions for as much area as possible. Our final model parameters represent a compromise between stable slopes (F3 > 1) under dry conditions and low factor of safety (F3 < 1) for highly susceptible slopes under presumed wettest conditions.
Other things being equal, the quasi-3D stability analysis, F3, has a somewhat smaller AUC and larger D2PC, compared to F1 (Tables 2 and 3), but improves the final map. The improvements are better separation between the different susceptibility classes (Figs. 10 and 11) and a slightly more conservative map compared to F1, which is helpful for life-safety based land use planning and emergency response scenarios. With AUC = 0.80 and D2PC = 0.38 for F3 based on the modified NASD soil-depth and 3.5 m radius for the trial surface (Table 3), F3 successfully identifies potential landslide sources at NAR. For the entire map area, the AUC (0.84) and D2PC (0.33) scores are slightly better (Table 4, Fig. 13), due in part to the large area of low landslide susceptibility that is underlain by limey sediments and characterized by cone karst. By considering slope stability at the scale of representative landslide sources (median area, Fig. 3c), F3 eliminates isolated grid cells and tiny clusters of 2–4 cells that likely are classified incorrectly by F1 as highly or very highly susceptible due to locally steep slopes at the pixel scale (1 m). Such isolated cells and clusters could be eliminated after analysis, but boundaries of susceptible areas would remain somewhat ragged. In contrast our approach provides an objective method for eliminating the isolated pixels and smoothing the boundaries. F3 bridges gaps between neighboring areas of low F1 and thereby maps susceptible areas that are more continuous and with smoother, more definite boundaries than F1. Thus, F3 further improves delineation of susceptible areas beyond improvements achieved by using the modified NASD soil-depth model with F1. Maps having continuous, clearly delineated areas assigned to each susceptibility class such as those obtained by using F3 reduce guesswork in making land use and emergency management decisions by eliminating the ragged, transitional boundaries obtained with F1. For example, to compare the insets in Figs. 10 and 11 to each other as well as slope categories (Fig. S3a) and F3 based on the NDSD soil-depth model (Fig. S3d), see Fig. S3b, c, e, and f. Alternately continuous, clear delineation can be achieved by aggregating raster maps to slope units (Alvioli et al., 2016; Woodard et al., 2024). Nevertheless, an added benefit of using F3 is creation of well-defined potential landslide source areas that allow estimation of areas susceptible to potential downslope runout and downstream inundation (Brien et al., 2021). Performance metrics for F3 considering detailed source mapping (Fig. 13) are sufficiently high (0.85 ≤ AUC ≤ 0.88) to consider F3 a very successful indicator of landslide susceptibility in our study area. As the basis for our final susceptibility maps, we selected the F3 map derived from the modified NASD soil depth model (Fig. 11a) because of its high AUC combined with its well-defined source areas and the realistic modeled soil depths for estimating potential landslide volumes. Visual comparison indicates only slight differences between F3 maps based on pre-event and post-event DEMs (Fig. S4). Model input parameters for the final maps are summarized in Figs. S1 and S2.
The susceptibility analysis portrayed in Fig. 11 and our final maps (Figs. S1 and S2) are valid throughout the three municipalities despite the variable density of Hurricane Maria landslides throughout the map area (Bessette-Kirton et al., 2017; Hughes et al., 2019) and within each susceptibility class. High landslide density generally corresponds to low F3 (Table 4); however, not all susceptible areas were equally affected by Hurricane Maria. Thus, although some areas of low F3, particularly in Naranjito, had low landslide density, the low density does not invalidate the susceptibility assessment of the potential for future landslides. Factors such as antecedent soil moisture are known to have affected the density of landslides induced by Hurricane Maria (Bessette-Kirton et al., 2019a) and were addressed in the statistically based island-wide landslide susceptibility assessment of Hughes and Schulz (2020a). Notably, Naranjito had much lower root-zone soil moisture immediately after the hurricane than Utuado and Lares (Fig. 26 of Hughes and Schulz, 2020a). Variable rainfall intensity and duration are also known to affect landslide response of susceptible areas (Larsen and Simon, 1993; Pando et al., 2005). Intensity and duration are known to have varied during Hurricane Maria, causing further differences in landslide density. Our assessment considered fully saturated conditions with the water table at the ground surface to depict likely wettest-case soil moisture effects, including high antecedent soil wetness, as well as high-intensity and long-duration rainfall. Thus, it was not necessary to specifically model antecedent soil moisture conditions. Less-severe conditions may produce landslides in the same general areas as predicted by our assessment, however, in lower numbers than observed following Hurricane Maria.
Setting the boundaries between susceptibility classes based on F1 or F3 corresponding to specific values of TPR rather than setting boundaries based on theoretical values of F1 or F3 (such as F3= 1.0) reduces uncertainty and ensures correspondence between landslide density and degree of landslide susceptibility. Soil, saprolite, and bedrock are inherently heterogenous. Their hydraulic and strength properties (and corresponding parameters) vary spatially at all scales (Terzaghi et al., 1996). Other studies have applied probabilistic approaches, and sensitivity analyses have been applied successfully to address parameter uncertainty and improve accuracy of physically based modeling of landslide susceptibility (Raia et al., 2014; Zieher et al., 2017; Canli et al., 2018). Many parameter combinations (c′ and φ′) can achieve similar levels of predictive accuracy in computing F1 for observed distributions of landslide slope and depth (Baum et al., 2019; Baum, 2021). These and other uncertainties such as transient pore-water pressures, subsurface features, heterogeneity, and other factors weaken the link between theoretical values of F1 or F3 and estimated likelihood of failure for site-specific cases when applying limit-equilibrium slope stability analysis over wide areas. On the other hand, maps classified based on TPR have a strong link to susceptibility. Such maps are readily comparable to each other when F1 or F3 values are computed with different parameters, as they show similar outcomes (areas that capture 75 %, 90 % and 95 % of observed landslides in this study). Comparing similar outcomes focuses on differences and uncertainties that affect the quality of the susceptibility assessment that might be masked by comparing the maps when classified using the same F1 or F3 values. In this study, low values of F1 and F3 correspond to high observed Hurricane Maria landslide density (Table 4), as would be expected. The selected boundaries for susceptibility classes ensure a meaningful distinction between average landslide density in the successive classes (Table 4).
The susceptibility map correctly predicts locations of most landslides that are deeper than 3 m, despite the maximum modeled soil depth of 3 m more typical of shallow landslides. Ten of the landslides summarized in Fig. 3e are deeper than 3 m. Most (nine) are within the Naranjito tile (Fig. 1), and the other is in Lares. The mapped point on each landslide head scarp and adjoining or surrounding slope was within the high or very high susceptibility zone for 7 of the 10 deep landslides. The other three had head scarps on a gently sloping area (road or pad) that was set back a few meters from the steep slope, but the adjoining slope with the landslide body was within the high and very high susceptibility zones. Although the predicted locations might be right for the wrong reason (predicting a shallow translational landslide rather than a deeper, translational, or rotational landslide), it is nevertheless encouraging that the locations of even the deep landslides are identified for the sake of hazard assessment and planning. This probably occurred because the deep landslides occurred well within the same slope range as other mapped landslides (Figs. 3, 4).
Despite the simplicity of soil and water parameters, the maps successfully predicted the effects from Hurricane Maria. Calibrating with field data from the small calibration areas (ANA, LAR, UTU, and NAR, Fig. 1) and then testing with the island-wide scarp points (Hughes et al., 2019) confirmed the successes of our approach (Figs. S1 and S2). Testing with detailed landslide source maps (Baxstrom et al., 2021a; Einbund et al., 2021a, b) strengthens our results even though they cover only a fraction of the study area.
The workflow outlined in Fig. 4 can be simplified in areas where few data are available. An accurate digital elevation model and accurate landslide inventory with measurements of source area size, depth, and slope (Fig. 3) are the most critical data for a landslide susceptibility analysis. Strength parameter ranges can be estimated from landslide source depth and slope (Figs. 5, 6). Soil model calibration can be bypassed by assuming constant average landslide source depth. Strength parameters can then be refined using the procedure described in Sect. 3.5. Alternately, a soil model and strength parameters can be calibrated simultaneously to the inventory as we did for the NAR calibration area. Calculation of pressure head, F1, and F3 can then proceed as outlined in Sect. 3.4.2, 3.4.3, 3.4.4, and 3.9, followed by validation and evaluation (Sect. 3.11). Compared to a map based on the simplest of landslide susceptibility approach, slope ranges with its ragged, fragmented susceptibility zones, our procedure creates cohesive landslide susceptibility zones that have smooth, buffered boundaries with only a slightly lower AUC score (0.84) than for slope (0.87) across the entire study area.
We defined a workflow for assessing landslide susceptibility using multiple modeling stages and successfully applied it using high-resolution (1 m) topography over a large (about 1000 km2) geographic area in the central mountains of Puerto Rico (Fig. 1). The workflow includes modeling soil depth, pressure head, and limit-equilibrium slope stability (Fig. 4). Although calibration studies showed that assuming constant average soil depth as input for a 1D (infinite-slope) factor of safety against landsliding, F1, gave the best performance metrics in a 2.5 km2 calibration area, use of a soil-depth model more clearly delineated areas susceptible to landslide initiation with only a modest reduction in the AUC from 0.88 to 0.86. Using a quasi-3D limit-equilibrium slope stability analysis, the factor of safety, F3, further refined the susceptibility assessment by more clearly delineating boundaries between the different susceptibility classes and by assessing stability at the scale of the observed median-sized landslides. Despite further reduction in AUC to 0.80 for the NAR calibration area, the map based on F3 is more readily usable in certain applications than a map based on F1, and it still performs well as a classifier of landslide susceptibility. Performance metrics for the F3 map of the entire ∼ 1000 km2 study area, AUC = 0.84 and D2PC = 0.34, are slightly better than results at the NAR calibration area. Performance measured against detailed source mapping of selected areas is even better: 0.85 ≤ AUC ≤ 0.88 and 0.27 ≤ D2PC ≤ 0.33. These metrics indicate the map is suitable for planning, regulation, and emergency preparedness decisions at the municipality scale. The map may also be used to assess hazards, such as ground collapse, resulting from landslide initiation. Source area delineation as shown on maps may also be used for defining landslide starting locations and surface area needed to assess areas with potential downslope movement of sediment mobilized by future landslides.
Computer codes used in this study are available from the U.S. Geological Survey software repository as follows: TRIGRS 2.1, https://doi.org/10.5066/F7M044QS (Alvioli and Baum, 2016b); REGOLITH, https://doi.org/10.5066/P9U2RDWJ (Baum et al., 2021); and Slabs3D, https://doi.org/10.5066/P9G4I8IU (Baum, 2023).
The pre-event (2015) and post-event (2018) lidar topographic data used in this study are available through the national map at https://apps.nationalmap.gov/lidar-explorer/#/ (U.S. Geological Survey 2018, 2020a, b, c). Soil mapping databases used to estimate soil properties are available from the Natural Resources Conservation Service at https://www.nrcs.usda.gov/resources/data-and-reports/web-soil-survey (Soil Survey Staff, 2018). Other data are available from the U.S. Geological Survey ScienceBase digital repository as follows: summaries of geotechnical data, https://doi.org/10.5066/P9UXTQ4B (Baum and Lewis, 2023); model input and output raster grids and model parameter input files used to produce the large maps (Figs. S1 and S2), https://doi.org/10.5066/P9C1U0LP (Baum et al., 2023); landslide head scarp points, https://doi.org/10.5066/P9BVMD74 (Hughes et al., 2019); landslide polygons, https://doi.org/10.5066/F7JD4VRF (Bessette-Kirton et al., 2017), https://doi.org/10.5066/P9GBGA4I (Baxstrom et al., 2021a), https://doi.org/10.5066/P9YYU7W1 (Baxstrom et al., 2021b), https://doi.org/10.5066/P9EASZZ7 (Einbund et al., 2021b), and https://doi.org/10.5066/P9ZNUR1P (Einbund et al., 2021a).
The supplement related to this article is available online at: https://doi.org/10.5194/nhess-24-1579-2024-supplement.
RLB, WHS, MER, and DLB planned the study. WHS managed the project. MJT carried out model calibrations. RLB developed the model code, carried out the simulations, and computed the model performance statistics. DLB, WHS, MER, MJT, and RLB analyzed the data. RLB wrote the manuscript draft; DLB, MER, and WHS reviewed and edited the manuscript.
The contact author has declared that none of the authors has any competing interests.
Any use of trade, firm, or product names is for descriptive purposes only and does not imply endorsement by the U.S. Government.
Publisher’s note: Copernicus Publications remains neutral with regard to jurisdictional claims made in the text, published maps, institutional affiliations, or any other geographical representation in this paper. While Copernicus Publications makes every effort to include appropriate place names, the final responsibility lies with the authors.
Adrian Lewis compiled and summarized geotechnical data from published and publicly available sources. Mason Einbund extracted statistics on landslide true positives and density from pre-Hurricane Maria factor of safety grids. Emily Bedinger generated flow-accumulation raster grids and edited the model output grids to remove edge effects. Brian Collins and Lauren Schaefer reviewed an earlier version of the manuscript.
This work was supported by annual appropriations to the Landslide Hazards Program of the U.S. Geological Survey and in part by the Additional Supplemental Appropriations for Disaster Relief Requirements Act, 2018 (P.L. 115–123).
This paper was edited by Andreas Günther and reviewed by two anonymous referees.
Aaron, J., McDougall, S., Moore, J. R., Coe, J. A., and Hungr, O.: The role of initial coherence and path materials in the dynamics of three rock avalanche case histories, Geoenvironmental Disasters, 4, 5, https://doi.org/10.1186/s40677-017-0070-4, 2017.
Alvioli, M. and Baum, R. L.: Parallelization of the TRIGRS model for rainfall-induced landslides using the message passing interface, Environ. Modell. Softw., 81, 122–135, https://doi.org/10.1016/j.envsoft.2016.04.002, 2016a.
Alvioli, M. and Baum, R. L.: Serial and parallel versions of the Transient Rainfall Infiltration and Grid-Based Regional Slope-Stability Model (TRIGRS, version 2.1), U.S. Geol. Surv. software release [code], https://doi.org/10.5066/F7M044QS, 2016b.
Alvioli, M., Marchesini, I., Reichenbach, P., Rossi, M., Ardizzone, F., Fiorucci, F., and Guzzetti, F.: Automatic delineation of geomorphological slope units with r.slopeunits v1.0 and their optimization for landslide susceptibility modeling, Geosci. Model Dev., 9, 3975–3991, https://doi.org/10.5194/gmd-9-3975-2016, 2016.
Arnone, E., Noto, L., Lepore, C., and Bras, R.: Physically-based and distributed approach to analyze rainfall-triggered landslides at watershed scale, Geomorphology, 133, 121–131, https://doi.org/10.1016/j.geomorph.2011.03.019, 2011.
ASTM International: D2487-17e1, Standard Practice for Classification of Soils for Engineering Purposes (Unified Soil Classification System), https://doi.org/10.1520/D2487-17E01, 2020.
Baum, R. L.: Rapid sensitivity analysis for reducing uncertainty in landslide hazard assessments, in: Understanding and Reducing Landslide Disaster Risk, edited by: Guzzetti, F., Mihalić Arbanas, S., Reichenbach, P., Sassa, K., Bobrowsky, P. T., and Takara, K., Springer, Cham, Switzerland, 329–335, https://doi.org/10.1007/978-3-030-60227-7_37, 2021.
Baum, R. L.: Slabs3D – A Fortran 95 program for analyzing potential shallow landslides in a digital landscape, U.S. Geol. Surv. software release [code], https://doi.org/10.5066/P9G4I8IU, 2023.
Baum, R. L. and Lewis, A. C.: Engineering soil classification and geotechnical measurements in Lares, Naranjito, and Utuado, Puerto Rico: U.S. Geol. Surv. data release [data set], https://doi.org/10.5066/P9UXTQ4B, 2023.
Baum, R. L., Godt, J. W., and Savage, W. Z.: Estimating the timing and location of shallow rainfall-induced landslides using a model for transient, unsaturated infiltration, J. Geophys. Res.-Earth, 115, F03013, https://doi.org/10.1029/2009JF001321, 2010.
Baum, R. L., Godt, J. W., Coe, J. A., and Reid, M. E.: Assessment of shallow landslide potential using 1D and 3D slope stability analysis, in: Landslides and Engineered Slopes: Protecting Society through Improved Understanding, edited by: Eberhardt, E., Froese, C., Turner, A. K., and Leroueil, S., Taylor & Francis Group, London, 1667–1672, ISBN 978-0-415-62123-6, 2012.
Baum, R. L., Schulz, W. H., Brien, D. L., Burns, W. L., Reid, M. E., and Godt, J. W.: Progress in regional landslide hazard assessment – Examples from the USA, in: Landslide Science for a Safer Geoenvironment, edited by: Sassa, K., Canuti, P., and Yin, Y., Springer, Cham, Switzerland, 21–36, https://doi.org/10.1007/978-3-319-04999-1_2, 2014.
Baum, R. L., Cerovski-Darriau, C., Schulz, W. H., Bessette-Kirton, E., Coe, J. A., Smith, J. B., and Smoczyk, G. M.: Variability of hurricane María debris-flow source areas in Puerto Rico – Implications for hazard assessment, AGU Fall Meeting, Washington, DC 2018, NH14A-02, https://agu.confex.com/agu/fm18/meetingapp.cgi/Paper/412740 (last access: 10 August 2023), 2018.
Baum, R. L., Scheevel, C. R., and Jones, E. S.: Constraining parameter uncertainty in modeling debris-flow initiation during the September 2013 Colorado Front Range storm, in: Debris-flow Hazards Mitigation: Mechanics, Monitoring, Modeling, and Assessment, edited by: Kean, J. W., Coe, J. A., Santi, P. M., and Guillen, B. K., Association of Environmental and Engineering, Brunswick, Ohio, 249–256, https://doi.org/10.25676/11124/173212, 2019.
Baum, R. L., Bedinger, E. C., and Tello, M. J.: REGOLITH – A Fortran 95 program for estimating soil mantle thickness in a digital landscape for landslide and debris-flow hazard assessment, U.S. Geol. Surv. software release [code], https://doi.org/10.5066/P9U2RDWJ, 2021.
Baum, R. L., Brien, D. L., Reid, M. E., Schulz, W. H., Tello, M. J., and Bedinger, E. C.: Model input and output data covering Lares Municipio, Utuado Municipio, and Naranjito Municipio, Puerto Rico, for landslide initiation susceptibility assessment after Hurricane Maria, U.S. Geol. Surv. data release [data set], https://doi.org/10.5066/P9C1U0LP, 2023.
Bawiec, W. J.: Geologic terranes of Puerto Rico, in: Geology, geochemistry, geophysics, mineral occurrences, and mineral resource assessment for the commonwealth of Puerto Rico, edited by: Bawiec, W. J., U.S. Geol. Surv. Open-File Rep. 98–38, https://doi.org/10.3133/ofr9838, 1998.
Baxstrom, K. W., Einbund, M. M., and Schulz, W. H.: Map data from landslides triggered by Hurricane María in a section of Naranjito, Puerto Rico, U.S. Geol. Surv. data release [data set], https://doi.org/10.5066/P9GBGA4I, 2021a.
Baxstrom, K. W., Einbund, M. M., and Schulz, W. H.: Map data from landslides triggered by Hurricane María in the greater karst region of northwest Puerto Rico, U.S. Geol. Surv. data release [data set], https://doi.org/10.5066/P9YYU7W1, 2021b.
Begueria, S.: Validation and evaluation of predictive models in hazard assessment and risk management, Nat. Hazards, 37, 315–329, https://doi.org/10.1007/s11069-005-5182-6, 2006.
Benda, L., Miller, D., Andras, K., Bigelow, P., Reeves, G., and Michael, D.: NetMap: A new tool in support of watershed science and resource management, Forest Sci., 53, 206–219, https://doi.org/10.1093/forestscience/53.2.206, 2007.
Bessette-Kirton, E. K., Coe, J. A., Godt, J. W., Kean, J. W., Rengers, F. K., Schulz, W. H., Baum, R. L., Jones, E. S., and Staley, D. M.: Map data showing concentration of landslides caused by hurricane María in Puerto Rico, U.S. Geol. Surv. data release [data set], https://doi.org/10.5066/F7JD4VRF, 2017.
Bessette-Kirton, E. K., Cerovski-Darriau, C., Schulz, W. H., Coe, J. A., Kean, J. W., Godt, J. W., Thomas, M. A., and Hughes, K. S.: Landslides triggered by Hurricane María: Assessment of an extreme event in Puerto Rico, GSA Today, 29, 4–10, https://doi.org/10.1130/GSATG383A.1, 2019a.
Bessette-Kirton, E. K., Kean, J. W., Coe, J. A., Rengers, F. K., and Staley, D. M.: An evaluation of debris-flow runout model accuracy and complexity in Montecito, California: Towards a framework for regional inundation-hazard forecasting, in: Debris-flow Hazards Mitigation: Mechanics, Monitoring, Modeling, and Assessment, edited by: Kean, J. W., Coe, J. A., Santi, P. M., and Guillen, B. K., Association of Environmental and Engineering Geologists, Brunswick, Ohio, 257–264, https://doi.org/10.25676/11124/173211, 2019b.
Bessette-Kirton, E. K., Coe, J. A., Kelly, M. A., Cerovski-Darriau, C., and Schulz, W. H.: Map data from landslides triggered by Hurricane María in four study areas of Puerto Rico, U.S. Geol. Surv. data release [data set], https://doi.org/10.5066/P9OW4SLX, 2019c.
Bessette-Kirton, E. K., Coe, J. A., Schulz, W. H., Cerovski-Darriau, C., and Einbund, M. M.: Mobility characteristics of debris slides and flows triggered by Hurricane María in Puerto Rico, Landslides, 17, 2795–2809, https://doi.org/10.1007/s10346-020-01445-z, 2020.
Brien, D. L., Reid, M. E., Cronkite-Ratcliff, C., and Perkins, J. P.: Portraying runout and inundation from hurricane-induced landslides in Puerto Rico, Geological Society of America Abstracts with Programs, 53, 85-4, https://doi.org/10.1130/abs/2021AM-368632, 2021.
Catani, F., Segoni, S., and Falorni, G.: An empirical geomorphology-based approach to the spatial prediction of soil thickness at catchment scale, Water Resour. Res., 46, W05508, https://doi.org/10.1029/2008WR007450, 2010.
Canli, E., Mergili, M., Thiebes, B., and Glade, T.: Probabilistic landslide ensemble prediction systems: lessons to be learned from hydrology, Nat. Hazards Earth Syst. Sci., 18, 2183–2202, https://doi.org/10.5194/nhess-18-2183-2018, 2018.
Carrara, A., Guzzetti, F., Cardinali, M., and Reichenbach, P.: Use of GIS technology in the prediction and monitoring of landslide hazard, Nat. Hazards, 20, 117–135, https://doi.org/10.1023/A:1008097111310, 1999.
Chung, C. F. and Fabbri, A. G.: Validation of spatial prediction models for landslide hazard mapping, Nat. Hazards, 30, 451–472, https://doi.org/10.1023/B:NHAZ.0000007172.62651.2b, 2003.
DeRose, R. C., Trustrum, N. A., and Blaschke, P. M.: Geomorphic change implied by regolith-slope relationships on steepland hillslopes, Taranaki, New Zealand, Catena, 18, 489–514, https://doi.org/10.1016/0341-8162(91)90051-X, 1991.
Einbund, M. M., Baxstrom, K. S., and Schulz, W. H.: Map data from landslides triggered by Hurricane María in four study areas in the Utuado municipality, Puerto Rico, U.S. Geol. Surv. data release [data set], https://doi.org/10.5066/P9ZNUR1P, 2021a.
Einbund, M. M., Baxstrom, K. S., and Schulz, W. H.: Map data from landslides triggered by Hurricane María in four study areas in the Lares municipality, Puerto Rico, U.S. Geol. Surv. data release [data set], https://doi.org/10.5066/P9EASZZ7, 2021b.
Ellen, S. D., Mark, R. K., Cannon, S. H., and Knifong, D. L.: Map of debris-flow hazard in the Honolulu District of Oahu, Hawaii, U.S. Geol. Surv. Open-File Rep. 93-213, 28 pp., https://doi.org/10.3133/ofr93213, 1993.
Fan, L., Lehmann, P., McArdell, B., and Or, D.: Linking rainfall-induced landslides with debris flows runout patterns towards catchment scale hazard assessment, Geomorphology, 280, 1–15, https://doi.org/10.1016/j.geomorph.2016.10.007, 2017.
Fawcett, T.: An introduction to ROC analysis, Pattern Recogn. Lett., 27, 861–874, https://doi.org/10.1016/j.patrec.2005.10.010, 2006.
Formetta, G., Capparelli, G., and Versace, P.: Evaluating performance of simplified physically based models for shallow landslide susceptibility, Hydrol. Earth Syst. Sci., 20, 4585–4603, https://doi.org/10.5194/hess-20-4585-2016, 2016.
George, D. L. and Iverson, R. M.: A depth-averaged debris-flow model that includes the effects of evolving dilatancy: 2. Numerical predictions and experimental tests, P. Roy. Soc. A-Math. Phy., 470, 20130820, https://doi.org/10.1098/rspa.2013.0820, 2014.
Godt, J. W., Schulz, W. H., Baum, R. L., and Savage, W. Z.: Modeling rainfall conditions for shallow landsliding in Seattle, Washington, in: Landslides and Engineering Geology of the Seattle, Washington, Area, edited by: Baum, R. L., Godt, J. W., and Highland, L. M., Geological Society of America, Boulder, Colorado, 137–152, https://doi.org/10.1130/2008.4020(08), 2008a.
Godt, J. W., Baum, R. L., Savage, W. Z., Salciarini, D., Schulz, W. H., and Harp, E. L.: Transient deterministic shallow landslide modeling: Requirements for susceptibility and hazard assessments in a GIS framework, Eng. Geol., 102, 214–226, https://doi.org/10.1016/j.enggeo.2008.03.019, 2008b.
Gomes, G. J. C., Vrugt, J. A., and Vargas Jr., E. A.: Toward improved prediction of the bedrock depth underneath hillslopes: Bayesian inference of the bottom-up control hypothesis using high-resolution topographic data, Water Resour. Res., 52, 3085–3112, https://doi.org/10.1002/2015WR018147, 2016.
Gupta, H. V., Kling, H., Yilmaz, K. K., and Martinez, G. F.: Decomposition of the mean squared error and NSE performance criteria: Implications for improving hydrological modeling, J. Hydrol., 377, 80–91, https://doi.org/10.1016/j.jhydrol.2009.08.003, 2009.
Heidemann, H. K.: Lidar base specification (ver. 1.3, February 2018), U.S. Geological Survey Techniques and Methods, 11, 102 pp., https://doi.org/10.3133/tm11b4, 2018.
Ho, J.-Y., Lee, K. T., Chang, T.-C., Wang, Z.-Y., and Liao, Y.-H.: Influences of spatial distribution of soil thickness on shallow landslide prediction, Eng. Geol., 124, 38–46, https://doi.org/10.1016/j.enggeo.2011.09.013, 2012.
Hovland, H. J.: Three-dimensional slope stability analysis method, J. Geotech. Eng.-ASCE, 103, 971–986, https://doi.org/10.1061/AJGEB6.0000493, 1977.
Hsu, Y. C. and Liu, K. F.: Combining TRIGRS and DEBRIS-2D models for the simulation of a rainfall infiltration induced shallow landslide and subsequent debris flow, Water, 11, 890, https://doi.org/10.3390/w11050890, 2019.
Hughes, K. S. and Schulz, W. H.: Map depicting susceptibility to landslides triggered by intense rainfall, Puerto Rico, U.S. Geol. Surv. Open-File Rep. 2020–1022, 91 pp., https://doi.org/10.3133/ofr20201022, 2020a.
Hughes, K. S. and Schulz, W. H.: Results from frequency-ratio analyses of soil classification and land use related to landslide locations in Puerto Rico following Hurricane María, U.S. Geol. Surv. data release [data set], https://doi.org/10.5066/P9VK2FAL, 2020b.
Hughes, K. S., Bayouth-García, D., Martínez-Milian, G. O., Schulz, W. H., and Baum, R. L.: Map of slope-failure locations in Puerto Rico after Hurricane María, U.S. Geol. Surv. data release [data set], https://doi.org/10.5066/P9BVMD74, 2019.
Iverson, R. M.: Landslide triggering by rain infiltration, Water Resour. Res., 36, 1897–1910, https://doi.org/10.1029/2000WR900090, 2000.
Jibson, R. W.: Debris flows in southern Puerto Rico, in: Landslide processes of the eastern United States and Puerto Rico, edited by: Schultz, A. P. and Jibson, R. W., Geol. Soc. Am. Spec. Pap., 236, 29–55, https://doi.org/10.1130/SPE236-p29, 1989.
Jolly, W. T., Lidiak, E. G., Dickin, A. P., and Wu, T.-W.: Geochemical diversity of Mesozoic island arc tectonic blocks in eastern Puerto Rico, in: Tectonics and Geochemistry of the Northeastern Caribbean, edited by: Likiak, E. G. and Larue, D. K., Geol. Soc. Am. Spec Pap., 322, 67–98, https://doi.org/10.1130/0-8137-2322-1.67, 1998.
Larsen, M. C.: Landslides and sediment budgets in four watersheds in eastern Puerto Rico, in: Water Quality and Landscape Processes of Four Watersheds in Eastern Puerto Rico, edited by: Murphy, S. F. and Stallard, R. F., U.S. Geol. Surv. Prof. Paper 1789, 153–178, https://doi.org/10.3133/pp1789, 2012.
Larsen, M. C. and Parks, J. E.: Map showing landslide susceptibility in the Comerio municipality, Puerto Rico, U.S. Geol. Surv. Open-File Rep. 98-566, https://doi.org/10.3133/ofr98566, 1998.
Larsen, M. C. and Simon, A.: A rainfall intensity-duration threshold for landslides in a humid-tropical environment, Puerto Rico, Geogr. Ann. A, 75, 13–23, https://doi.org/10.1080/04353676.1993.11880379, 1993.
Larsen, M. C. and Torres-Sanchez, A. J.: Landslides triggered by hurricane Hugo in eastern Puerto Rico, September 1989, Caribb. J. Sci., 28, 113–125, 1992.
Larsen, M. C. and Torres-Sanchez, A. J.: The frequency and distribution of recent landslides in three montane tropical regions of Puerto Rico, Geomorphology, 24, 309–331, https://doi.org/10.1016/S0169-555X(98)00023-3, 1998.
Larsen, M. C., Santiago, M., Jibson, R., and Questell, E.: Map showing susceptibility to rainfall-triggered landslides in the municipality of Ponce, Puerto Rico, U.S. Geol. Surv. Scientific Investigations Map 2818, https://doi.org/10.3133/sim2818, 2004.
Lee, S., Ryu, J.-H., Min, K., and Won, J.-S.: Landslide susceptibility analysis using GIS and artificial neural network, Earth Surf. Proc. Land., 28, 1361–1376, https://doi.org/10.1002/esp.593, 2003.
Lepore, C., Kamal, S. A., Shanahan, P., and Bras, R. L.: Rainfall-induced landslide susceptibility zonation of Puerto Rico, Environ. Earth Sci., 66, 1667–1681, https://doi.org/10.1007/s12665-011-0976-1, 2012.
Lepore, C., Arnone, E., Noto, L. V., Sivandran, G., and Bras, R. L.: Physically based modeling of rainfall-triggered landslides: a case study in the Luquillo forest, Puerto Rico, Hydrol. Earth Syst. Sci., 17, 3371–3387, https://doi.org/10.5194/hess-17-3371-2013, 2013.
Likos, W. J., Wayllace, A., Godt, J., and Lu, N.: Modified direct shear apparatus for unsaturated sands at low suction and stress, Geotech. Test. J., 33, 286–298, https://doi.org/10.1520/GTJ102927, 2010.
Medina, V., Hürlimann, M., Guo, Z., Lloret, A., and Vaunat, J.: Fast physically based model for rainfall-induced landslide susceptibility assessment at regional scale, Catena, 201, 105213, https://doi.org/10.1016/j.catena.2021.105213, 2021.
Mergili, M., Marchesini, I., Rossi, M., Guzzetti, F., and Fellin, W.: Spatially distributed three-dimensional slope stability modelling in a raster GIS, Geomorphology, 206, 178–195, https://doi.org/10.1016/j.geomorph.2013.10.008, 2014a.
Mergili, M., Marchesini, I., Alvioli, M., Metz, M., Schneider-Muntau, B., Rossi, M., and Guzzetti, F.: A strategy for GIS-based 3-D slope stability modelling over large areas, Geosci. Model Dev., 7, 2969–2982, https://doi.org/10.5194/gmd-7-2969-2014, 2014b.
Mergili, M., Schwarz, L., and Kociu, A.: Combining release and runout in statistical landslide susceptibility modeling, Landslides, 16, 2151–2165, https://doi.org/10.1007/s10346-019-01222-7, 2019.
Metz, C. E.: Basic principles of ROC analysis, Semin. Nucl. Med., 8, 283–298, https://doi.org/10.1016/S0001-2998(78)80014-2, 1978.
Milledge, D. G., Bellugi, D., McKean, J. A., Densmore, A. L., and Dietrich, W. E.: A multi-dimensional stability model for predicting shallow landslide size and shape across landscapes, J. Geophys. Res.-Earth, 119, 2481–2504, https://doi.org/10.1002/2014JF003135, 2015.
Montgomery, D. R. and Dietrich, W. E.: A physically-based model for the topographic control on shallow landsliding, Water Resour. Res., 30, 1153–1171, https://doi.org/10.1029/93WR02979, 1994.
Murphy, S. F., Stallard, R. F., Larsen, M. C., and Gould, W. A.: Physiography, geology, and land cover of four watersheds in eastern Puerto Rico, U.S. Geol. Surv. Prof. Paper 1789-A, 24 pp., https://doi.org/10.3133/pp1789A, 2012.
Monroe, W. H.: The karst landforms of Puerto Rico, U.S. Geol. Surv. Prof. Paper 899, 69 pp., https://doi.org/10.3133/pp899, 1976.
Nicótina, L., Tarboton, D. G., Tesfa, T. K., and Rinaldo, A.: Hydrologic controls on equilibrium soil depths, Water Resour. Res., 47, W04517, https://doi.org/10.1029/2010WR009538, 2011.
Pack, R. T., Tarboton, D. G., and Goodwin, C. N.: The SINMAP approach to terrain stability mapping, in: International Congress of the International Association of Engineering Geology and the Environment Proceedings, 8 September 21–25 1998, Vancouver, British Columbia, Canada, A. A. Balkema, Rotterdam, Netherlands, 2, 1157–1165, https://digitalcommons.usu.edu/cee_facpub/2583/ (last access: 13 March 2024), 1998.
Palacio Cordoba, J., Mergili, M., and Aristizábal, E.: Probabilistic landslide susceptibility analysis in tropical mountainous terrain using the physically based r.slope.stability model, Nat. Hazards Earth Syst. Sci., 20, 815–829, https://doi.org/10.5194/nhess-20-815-2020, 2020.
Pando, M. A., Ruiz, M. E., and Larsen, M. C.: Rainfall-induced landslides in Puerto Rico: An overview, in: Slopes and Retaining Structures Under Seismic and Static Conditions, edited by: Gabr, M. A., Bowders, J. J., Elton, D., and Zornberg, J. G., ASCE Geotech. SP., 140, 2911–2925, https://doi.org/10.1061/40787(166)25, 2005.
Patton, N. R., Lohse, K. A., Godsey, S. E., Crosby, B. T., and Seyfried, M. S.: Predicting soil thickness on soil mantled hillslopes, Nat. Commun., 9, 3329, https://doi.org/10.1038/s41467-018-05743-y, 2018.
Pelletier, J. D. and Rasmussen, C.: Geomorphically based predictive mapping of soil thickness in upland watersheds, Water Resour. Res., 45, W09417, https://doi.org/10.1029/2008WR007319, 2009.
Perkins, J. P., Baxstrom, K. W., Einbund, M. M., and Schulz, W. H.: Modified basal contact of the Tertiary Lares Limestone in the vicinity of Utuado, Puerto Rico, USA, derived from USGS Open-File Report 98-038, U.S. Geol. Surv. data release [data set], https://doi.org/10.5066/P9NL9EZG, 2022.
Raia, S., Alvioli, M., Rossi, M., Baum, R. L., Godt, J. W., and Guzzetti, F.: Improving predictive power of physically based rainfall-induced shallow landslide models: a probabilistic approach, Geosci. Model Dev., 7, 495–514, https://doi.org/10.5194/gmd-7-495-2014, 2014.
Ramos-Scharrón, C. E., Arima, E. Y., Guidry, A., Ruffe, D., and Vest, B.: Sediment mobilization by hurricane-driven shallow landsliding in a wet subtropical watershed, J. Geophys. Res.-Earth, 126, e2020JF006054, https://doi.org/10.1029/2020JF006054, 2021.
Reid, M. E., Christian, S. B., Brien, D. L., and Henderson, S. T.: Scoops3D – Software to analyze 3D slope stability throughout a digital landscape, U.S. Geol. Surv. Techniques and Methods 14-A1 [code], 218 pp. https://doi.org/10.3133/tm14A1, 2015.
Reid, M. E., Coe, J. A., and Brien, D. L.: Forecasting inundation from debris flows that grow volumetrically during travel, with application to the Oregon coast range, USA, Geomorphology, 273, 396–411, https://doi.org/10.1016/j.geomorph.2016.07.039, 2016.
Roering, J. J.: How well can hillslope evolution models “explain” topography?, Geol. Soc. Am. Bull., 120, 1248–1262, https://doi.org/10.1130/B26283.1, 2008.
Rossi, G., Catani, F., Leoni, L., Segoni, S., and Tofani, V.: HIRESSS: a physically based slope stability simulator for HPC applications, Nat. Hazards Earth Syst. Sci., 13, 151–166, https://doi.org/10.5194/nhess-13-151-2013, 2013.
Schulz, W. H., Jensen, E. K., Cerovski-Darriau, C. R., Baum, R. L., Thomas, M. A., and Coe, J. A.: Field observations of landslides and related materials following Hurricane Maria, Puerto Rico, U.S. Geol. Surv. data release [data set], https://doi.org/10.5066/P9T9KZ6T, 2023.
Segoni, S., Leoni, L., Benedetti, A. I., Catani, F., Righini, G., Falorni, G., Gabellani, S., Rudari, R., Silvestro, F., and Rebora, N.: Towards a definition of a real-time forecasting network for rainfall induced shallow landslides, Nat. Hazards Earth Syst. Sci., 9, 2119–2133, https://doi.org/10.5194/nhess-9-2119-2009, 2009.
Simon, A., Larsen, M. C., and Hupp, C. R.: The role of soil processes in determining mechanisms of slope failure and hillslope development in a humid-tropical forest eastern Puerto Rico, Geomorphology, 3, 263–286, https://doi.org/10.1016/0169-555X(90)90007-D, 1990.
Simoni, S., Zanotti, F., Bertoldi, G., and Rigon, R.: Modelling the probability of occurrence of shallow landslides and channelized debris flows using GEOtop-FS, Hydrol. Process., 22, 532–545, https://doi.org/10.1002/hyp.6886, 2008.
Smith, J. B., Thomas, M. A., Ashland, F., Michel, A. R., Wayllace, A., and Mirus, B. B.: Hillslope hydrologic monitoring data following Hurricane María in 2017, Puerto Rico, July 2018 to June 2020, U.S. Geol. Surv. data release [data set], https://doi.org/10.5066/P9548YK2, 2020.
Soil Survey Staff: Soil Survey Geographic (SSURGO) Database for Puerto Rico, all regions, U.S. Department of Agriculture Natural Resources Conservation Service, https://www.nrcs.usda.gov/resources/data-and-reports/web-soil-survey (last access: 10 August 2023), 2018.
Sowers, G. F.: Landslides in weathered volcanics in Puerto Rico, in: Proceedings of the Fourth Pan-American Conference on Soil Mechanics and Foundation Engineering, American Society of Civil Engineers, New York, 105–115, 1971.
Taggart, B. E. and Joyce, J.: Radiometrically dated marine terraces on northwestern Puerto Rico, in: Transactions of the 12th Caribbean Geological Conference, St. Croix, U.S. Virgin Islands, 7–11 August 1989, Miami Geological Society, South Miami, Florida, 248–258, 1991.
Taylor, D. W.: Fundamentals of Soil Mechanics, John Wiley & Sons, New York, 700 pp., 1948.
Thomas, M. A. and Cerovski-Darriau, C.: Infiltration data collected post-Hurricane María across landslide source area materials, Puerto Rico, USA, U.S. Geol. Surv. data release [data set], https://doi.org/10.5066/P9SCGVF7, 2019.
Tello, M.: Optimization of landslide susceptibility modeling: A Puerto Rico case study, Master of Science Thesis, Colorado School of Mines, Golden, Colorado, https://hdl.handle.net/11124/174137 (last access: 10 August 2023), 2020.
Terzaghi, K., Peck, R. B., and Mesri, G.: Soil Mechanics in Engineering Practice, 3rd edn., John Wiley & Sons: New York, 549 pp., ISBN 978-0-471-08658-1, 1996.
Tofani, V., Bicocchi, G., Rossi, G., Segoni, S., D'Ambrosio, M., Casagli, N., and Catani, F.: Soil characterization for shallow landslides modeling: a case study in the Northern Apennines (Central Italy), Landslides, 14, 755–770, https://doi.org/10.1007/s10346-017-0809-8, 2017.
U.S. Geological Survey: 2015–2016 USGS Puerto Rico LiDAR (project PR_PuertoRico_2015) [data set], https://apps.nationalmap.gov/lidar-explorer/#/ (last access: 10 August 2023), 2018.
U.S. Geological Survey: 2018 USGS Puerto Rico – Virgin Islands LiDAR (project PR_PRVI_A_2018), https://apps.nationalmap.gov/lidar-explorer/#/ (last access: 10 August 2023), 2020a.
U.S. Geological Survey: 2018 USGS Puerto Rico – Virgin Islands LiDAR (project PR_PRVI_D_2018), https://apps.nationalmap.gov/lidar-explorer/#/ (last access: 10 August 2023), 2020b.
U.S. Geological Survey: 2018 USGS Puerto Rico – Virgin Islands LiDAR (project PR_PRVI_H_2018), https://apps.nationalmap.gov/lidar-explorer/#/ (last access: 10 August 2023), 2020c.
von Ruette, J., Lehmann, P., and Or, D.: Rainfall-triggered shallow landslides at catchment scale: Threshold mechanics-based modeling for abruptness and localization, Water Resour. Res., 49, 6266–6285, https://doi.org/10.1002/wrcr.20418, 2013.
Wang, S., Zhang K., van Beek, L. P. H., Tian, X., and Bogaard, T. A.: Physically-based landslide prediction over a large region: Scaling low-resolution hydrological model results for high-resolution slope stability assessment, Environ. Modell. Softw., 124, 104607, https://doi.org/10.1016/j.envsoft.2019.104607, 2020.
Woodard, J. B., Mirus, B. B., Wood, N. J., Allstadt, K. E., Leshchinsky, B. A., and Crawford, M. M.: Slope Unit Maker (SUMak): an efficient and parameter-free algorithm for delineating slope units to improve landslide modeling, Nat. Hazards Earth Syst. Sci., 24, 1–12, https://doi.org/10.5194/nhess-24-1-2024, 2024.
Wu, W. and Sidle, R. C.: A distributed slope stability model for steep forested hillslopes, Water Resour. Res., 31, 2097–2110, https://doi.org/10.1029/95WR01136, 1995.
Xiao, T., Segoni, S., Liang, X., Yin, K., and Casagli, N.: Generating soil thickness maps by means of geomorphological-empirical approach and random forest algorithm in Wanzhou County, Three Gorges Reservoir, Geosci. Front., 14, 101514, https://doi.org/10.1016/j.gsf.2022.101514, 2023.
Yan, Q., Wainwright, H., Dafflon, B., Uhlemann, S., Steefel, C. I., Falco, N., Kwang, J., and Hubbard, S. S.: A hybrid data–model approach to map soil thickness in mountain hillslopes, Earth Surf. Dynam., 9, 1347–1361, https://doi.org/10.5194/esurf-9-1347-2021, 2021.
Zieher, T., Rutzinger, M., Schneider-Muntau, B., Perzl, F., Leidinger, D., Formayer, H., and Geitner, C.: Sensitivity analysis and calibration of a dynamic physically based slope stability model, Nat. Hazards Earth Syst. Sci., 17, 971–992, https://doi.org/10.5194/nhess-17-971-2017, 2017.