the Creative Commons Attribution 4.0 License.
the Creative Commons Attribution 4.0 License.
 | 02 May 2024
Modelling the vulnerability of urban settings to wildland–urban interface fires in Chile
Jorge León
Constanza González-Mathiesen
Randy Román
Manuela Penas
Alonso Ogueda
Wildland–urban interface (WUI) regions are particularly vulnerable to wildfires due to their proximity to both nature and urban developments, posing significant risks to lives and property. To enhance our understanding of the risk profiles in WUI areas, we analysed seven fire case studies in central Chile. We developed a mixed-method approach for conducting local-scale analyses, which involved field surveys, remote-sensing through satellite and drone imagery, and GIS-based analysis of the collected data. The methodology led to the generation of a georeferenced dataset of damaged and undamaged dwellings, including 16 variables representing their physical characteristics, spatial arrangement, and the availability of fire suppression resources. A binary classification model was then used to assess the relative importance of these attributes as indicators of vulnerability. The analysis revealed that spatial arrangement factors have a greater impact on damage prediction than the structural conditions and fire preparedness of individual units. Specifically, factors such as dwelling proximity to neighbours, distance to vegetation, proximity to the border of dwelling groups, and distance from the origin of the fire substantially contribute to the prediction of fire damage. Other structural attributes associated with less affluent homes may also increase the likelihood of damage, although further data are required for confirmation. This study provides insights for the design, planning, and governance of WUI areas in Chile, aiding the development of risk mitigation strategies for both built structures and the broader territorial area.
- Article
(6953 KB) - Full-text XML
- BibTeX
- EndNote


1.1 General problem: fires are an increasing issue in the wildland–urban interface
Wildfires are a natural hazard that refers to an out-of-control wildland fire burning over a large area (Coppola, 2015). Every year, more than two million small wildfire events are registered worldwide, with most of them having no significant impacts and not evolving into disasters (Bowman et al., 2017). However, a small proportion of these events escalate into very large incidents that have significant ecological and socioeconomic impacts (Bowman et al., 2017; Tedim et al., 2018), including fatalities, physical and psychological injuries, property loss, and diverse environmental impacts (March et al., 2020). Furthermore, 96 % of extreme wildfire disasters are associated with anomalous meteorological or climatic conditions (Bowman et al., 2017). Climate change has already led to a worldwide increase in the severity and frequency of weather conditions conducive to fires, a trend that is expected to persist (Jones, 2020). For instance, Ellis et al. (2022) pointed out that forests in boreal and mid-latitude regions have experienced significant increases in fire activity, driven by more frequent occurrences of extreme fire-prone weather and longer fire seasons because of anthropogenic climate change.
Wildland–urban interface (WUI) areas imply a higher wildfire risk because human lives and material goods are more exposed to fire (Gill and Stephens, 2009). Wildfires in WUI areas constitute an “unresolved and growing problem given population dynamics, climate change and, in some cases, increasing forest areas” (Sarricolea et al., 2020, p. 2). In these areas, the likelihood of housing loss due to wildfires is significantly influenced by housing arrangement and location (Syphard et al., 2012). Moreover, settlement patterns, such as the expansion of low-density urban sprawl and rural-residential developments that encroach on fire-prone areas, can also affect the frequency and severity of catastrophic wildfires (Butt et al., 2009). Therefore, it is important that the current methods of WUI development be revised (Bowman et al., 2017; González-Mathiesen and March, 2018; Moritz et al., 2014).
1.2 Wildfire risk assessment
To revise the current methods of WUI development and reduce or mitigate risk, it is of foremost importance that a wildfire threat assessment precede development. The need to integrate wildfire considerations into urban planning systems is well established in the literature (e.g. González-Mathiesen and March, 2018; March et al., 2020). The first step toward integrating wildfire considerations into urban planning systems is to carry out wildfire risk analyses (AIDR, 2020), which should provide valuable insights into settlement expansion decisions, ensuring that new development does not perpetuate or increase current risks. Furthermore, conducting assessments of already-developed areas is also the first step for the targeted implementation of mitigation strategies.
Wildfire assessments can emphasize different perspectives, including risk, hazard, and vulnerability (Galiana-Martín, 2017). In its general definition, the term hazard refers to the process or phenomenon that may cause loss of life or injuries, property damage, social and economic disruption, or environmental degradation (Goldammer et al., 2017). Wildfire hazard is a combination of likelihood, defined as the annual probability of ignition in a specific location, and intensity, which refers to the expansion or energy expected from a wildfire (Wildfire Risk – Understand Risk, 2024). Usually, wildfire hazard is associated with vegetation or available fuel, topography, weather/climate conditions, ignition likelihood, and suppression capabilities (e.g. March et al., 2020). The assessment of risk aims to quantify the potential losses caused by fire and its spread (e.g. Jappiot et al., 2009) over a given period and spatial region and is therefore a product of three components: (1) the hazard; (2) exposure or an inventory of the population, the built assets, the ecosystem services, the economic activities, or other valuable elements located in hazard-prone areas (UNISDR, 2009); and (3) the vulnerability, which represents the propensity of the exposed elements to be damaged if a wildfire occurs. The vulnerability is determined for example by the socioeconomic factors, building conditions, and population demographics of exposed areas (Oom et al., 2022; Wildfire Risk – Understand Risk, 2024).
Hazard assessments have often been preferred over risk assessments in urban planning as they tend to be simpler and faster to conduct and can be easier to implement. For example, land use planning in Victoria, Australia, is determined by hazard-based zoning that identifies the wildfire hazards rather than the risk (DTPLI, 2013). However, this approach assumes that the fire hazard in urban areas is low, which could imply an underestimation of the risk in WUI areas. This suggests that risk assessment techniques that are simple to conduct and implement would promote the use of risk analysis over hazard analysis in urban planning contexts.
For the purposes of risk reduction and mitigation, wildfire risk assessments should be approached with a medium-term risk analysis perspective, considering for example time frames from 2 to 10 years (Jappiot et al., 2009). Several countries have developed WUI risk assessment methodologies at varying spatial scales (i.e. local, landscape, regional, national) and with different data inputs and information purposes, but overall the process usually follows a procedural approach similar to the one established by ISO 31000 (2018), which integrates hazard, exposure, and vulnerability components (see e.g. Oom et al., 2022; San-Miguel-Ayanz et al., 2017; Syphard et al., 2012; Mitsopoulos et al., 2015; Calkin et al., 2019; Caggiano et al., 2020; Zong et al., 2022; Sakellariou et al., 2022). Other novel approaches aim to extend probabilistic assessments to include WUI resilience; for example, Tampekis et al. (2023) propose a holistic theoretical framework based on performance-based engineering that expands the components of risk to include potential socioecological impacts and interactions and to evaluate socioecological resilience.
Spatial mapping techniques are an important part of wildfire risk analysis and management, evolving alongside technology, especially in terms of geographic information systems (GISs). These techniques aim to quantify the risk as well as its spatial magnitude (Atkinson et al., 2010). During the 1990s, these analysis methods were generally qualitative and focused on components such as hazard (involving estimates of fuel load based on vegetation) and risk (associated with ignition risk to valuable natural and humanmade assets). These components were put into a matrix and assigned low-, medium-, or high-risk values, which were then overlaid with maps to determine high-risk areas (Atkinson et al., 2010). As technology and data quality have improved, wildfire risk analysis processes have evolved and become more complex and multi-faceted. Spatial mapping techniques, such as GISs, are becoming important tools that can greatly contribute to reducing the hazards' impact on society (Chen et al., 2003). For instance, Romero-Calcerrada et al. (2008) used GIS-based spatial models to assess the main causes of wildfire ignition (and to predict ignition risk) in the south-west of Madrid, Spain. Their results indicated that proximity to urban areas and roads is the most significant causal factor. Along these lines, studies that explore ways to assess wildfire risk in WUI areas usually distinguish between land cover types. These studies record vegetated land cover classes, in addition to one or a few categories of urban land covers (such as high-density residential, low-density residential, and commercial/industrial) that cover large areas (e.g. Bar Massada et al., 2009; Zhu et al., 2012). Based on this information, researchers then construct a burn probability map to identify the probability of structures being affected by a wildfire, highlighting those at higher risk. Additionally, some studies also include housing density as one of the assessment criteria (e.g. Lu et al., 2009; Sirca et al., 2017).
The use of contemporary modelling techniques that map the fire risk for structures in WUI areas could play a significant role in improving risk reduction and mitigation through urban planning and governance. However, research that explores mapping wildfire risk in WUI areas is still in its seminal stages and is typically conducted at a territorial scale. Remarkably, the consideration of detailed-scale physical characteristics of settlements and structures, along with their nuances, remains an emerging field of research, which is commonly addressed through the examination of post-disaster scenarios with data collected through field surveys. Examples of this type of approach include, for instance, Papathoma-Köhle et al. (2022), who developed a physical vulnerability index for buildings subject to wildfire. To do this, they used data (13 building structural and surrounding features) from 423 built units affected by the Mati fire that occurred in Greece in 2018 and applied the random-forest-based Boruta algorithm to estimate the feature importance of each of those elements on the degree of damage. In turn, Dossi et al. (2022) used a similar approach (but only considering built features and not characteristics from the immediate surroundings), taking a large sample of 17 500 buildings exposed to wildfires in California, USA (between 2013 and 2017), and 1190 buildings exposed to the 2017 Pedrógão Grande fire complex in Portugal. They applied statistical dependence tests to this database to examine the possible correlations between the dependent variable (i.e. the surveyed damage level) and the independent ones (i.e. each building feature).
In comparison to the sophisticated models currently available for assessing wildfire risk in rural contexts, the understanding of the feature importance of a built unit's physical characteristics as predictors of wildfire damage is still an emerging field of research. This is evidence of a fundamental shortcoming of risk assessment and mapping techniques that requires attention, particularly for the mitigation and prevention of wildfire risk in WUI areas.
1.3 The case of Chile
Chile's fire regime is dominated by frequent, low-intensity fires and some rare but exceptionally intense events, all concentrated in the south-central territory. Fire occurrence is highly seasonal and closely associated with precipitation and temperature variations (González et al., 2011). However, the occurrence of fire weather is increasing due to climate change (Urrutia-Jalabert et al., 2018). In this respect, Sarricolea et al. (2020) underline that climate change (with increasing temperatures and decreasing precipitation) has increased the probability, intensity, and speed of wildfire propagation, especially in subtropical and Mediterranean regions like the south-central area of Chile. As they point out, this trend was demonstrated by the tragic summer wildfires of 2016–2017, where the total burnt area was more than 500 000 ha (largely exceeding the records of the previous 2 decades, with roughly 50 000 to 100 000 burnt hectares per season). Moreover, the 2022–2023 summer season proved to be equally catastrophic, with roughly 440 000 damaged hectares and approximately 5700 recorded fires (CONAF, 2023a). Historical statistics show that only a small number of fires, representing approximately 0.6 % to 0.9 % of all fires, are responsible for 60 % of the burnt areas in the country (CONAF, 2023b). Furthermore, the central and southern areas are the most impacted by wildfires in terms of the number of events and affected surface area (Castillo et al., 2014). These regions also correspond to the most populated areas of Chile, with Sarricolea et al. (2020) reporting that almost 3 million people live in WUI areas. Furthermore, fire ignition is mostly associated with human activities (CONAF, 2023b).
WUI areas impacted by wildfires are a relatively new – and increasingly common – challenge for Chile. The first recorded wildfire that impacted the WUI can be traced to an event that took place in Viña del Mar on 22 January 1968. More recently, in 2012, the Ñuble fire affected several small towns and resulted in the destruction of 162 dwellings and 24 000 burnt hectares (La Tercera, 2012). In 2014, the great Valparaíso fire impacted 11 of the 42 hills in Valparaíso, destroyed more than 2900 houses, burnt 926 ha, caused 15 fatalities, injured 500 people, and displaced over 12 500 people (Reszka and Fuentes, 2015). Furthermore, in 2017, the fire event called Tormenta de Fuego, the most devastating wildfire event recorded in Chile, burnt 546 677 ha, destroyed 2831 buildings, displaced over 8129 people, and caused 11 fatalities. These recent events have increased local awareness of the fact that most populated areas in the south-central territory might be at risk of wildfires (e.g. Castillo, 2013; Castillo et al., 2014; Úbeda and Sarricolea, 2016) and that this needs to be addressed through risk-based modelling approaches in the planning, governance, and development of WUI areas (e.g. Arana et al., 2018; Gómez-González et al., 2018; Reszka and Fuentes, 2015).
In Chile, several wildfire risk analyses have been conducted in the WUI. For example, Garfias et al. (2012) used a socioeconomic approach to analyse wildfire-prone areas within the Valparaíso Viña del Mar WUI through a semi-structured questionnaire survey that was answered by 403 households in an area of approximately 14 000 ha. The survey was focused on assessing each dwelling's basic attributes (e.g. total built area) but also on examining its occupants' perception of the surrounding natural environment, including the fire hazard it poses to them. Castillo et al. (2014) examined (using high-resolution satellite images) the fire vulnerability in the Valparaíso WUI area using a sociospatial approach that considered 15 variables that comprised the physical characteristics of buildings and settlements (e.g. number of houses per hectare, average dwelling size, construction material) and also socioeconomic variables (e.g. risk ratio of individuals in each household, average number of adults and children per household, economic loss factors) of the dwellings located there. When combined with environmental characteristics such as land slope and vegetation, this analysis allowed them to model the vulnerability of the territory in relation to forest fires. Sarricolea et al. (2020) analysed the wildfire occurrences using satellite images to identify WUI areas and determine the population residing in areas that may be affected by wildfires. In their study, they considered data regarding the monthly burnt areas, land use and land cover (LULC), and census block and population data. The LULC data distinguished land covers such as grasslands, croplands, wetlands, and diverse types of forests (at 500 m spatial resolution for the period between 2000 and 2017 and 30 m spatial resolution for the year 2014). It distinguished urban and built-up land as one type of LULC.
1.4 Research gap and questions
The aforementioned studies have contributed new and valuable insights into the wildfire threat in WUI areas in Chile and around the world. However, it should be noted that the analyses were undertaken mostly at a territorial scale that does not commonly allow for the detailed physical characteristics and distribution of buildings and settlements or their impact on wildfire risk to be distinguished; this more spatially focused approach is still an emerging field of research globally, not yet carried out in Chile. This highlights the necessity of small-scale analyses that can provide nuanced information about how the different physical characteristics of structures and settlement patterns affect the risk profiles of WUI areas vulnerable to wildfires in the Chilean context. These nuanced understandings could contribute valuable knowledge to guide the design, planning, and governance of settlements in WUI areas in order to reduce and mitigate wildfire risk. Moreover, as several WUI areas in Chile include informally developed zones, these findings could also help to inform retrofitting policies with this objective. Also, we enhance the accuracy and speed of the collection of post-fire field data by using remote sensing through satellite and drone imagery. Along these lines, this study aims to answer the following research questions: what are the main vulnerability parameters that contribute to wildfire risk in WUI areas in Chile? How can these parameters be rapidly surveyed and assessed in the aftermath of destructive wildfires?
To answer these questions, we proposed a mixed-method approach that combines remote-sensed satellite and drone imagery (captured in the field in the aftermath of destructive WUI wildfires), field reconnaissance, and GIS-based analysis of the collected data, followed by a multivariate classification analysis of this information. This approach allowed us to assess the relative importance of each parameter as an indicator of wildfire vulnerability in the examined WUI areas. In turn, these conclusions could be used to propose risk mitigation strategies for both the built structures and the larger territory.
The rest of this paper is as follows. Section 2 describes the methodology, which encompasses a GIS-based examination of seven wildfire case studies in Chile, followed by a multivariate regressive analysis of vulnerability indicators to WUI fire hazards. Section 3 presents the research results, which we discuss in Sect. 4. Lastly, Sect. 5 provides the study's main conclusions and proposes paths for future investigation.
2.1 Case studies: collection and pre-analysis of damage data for WUI fire events
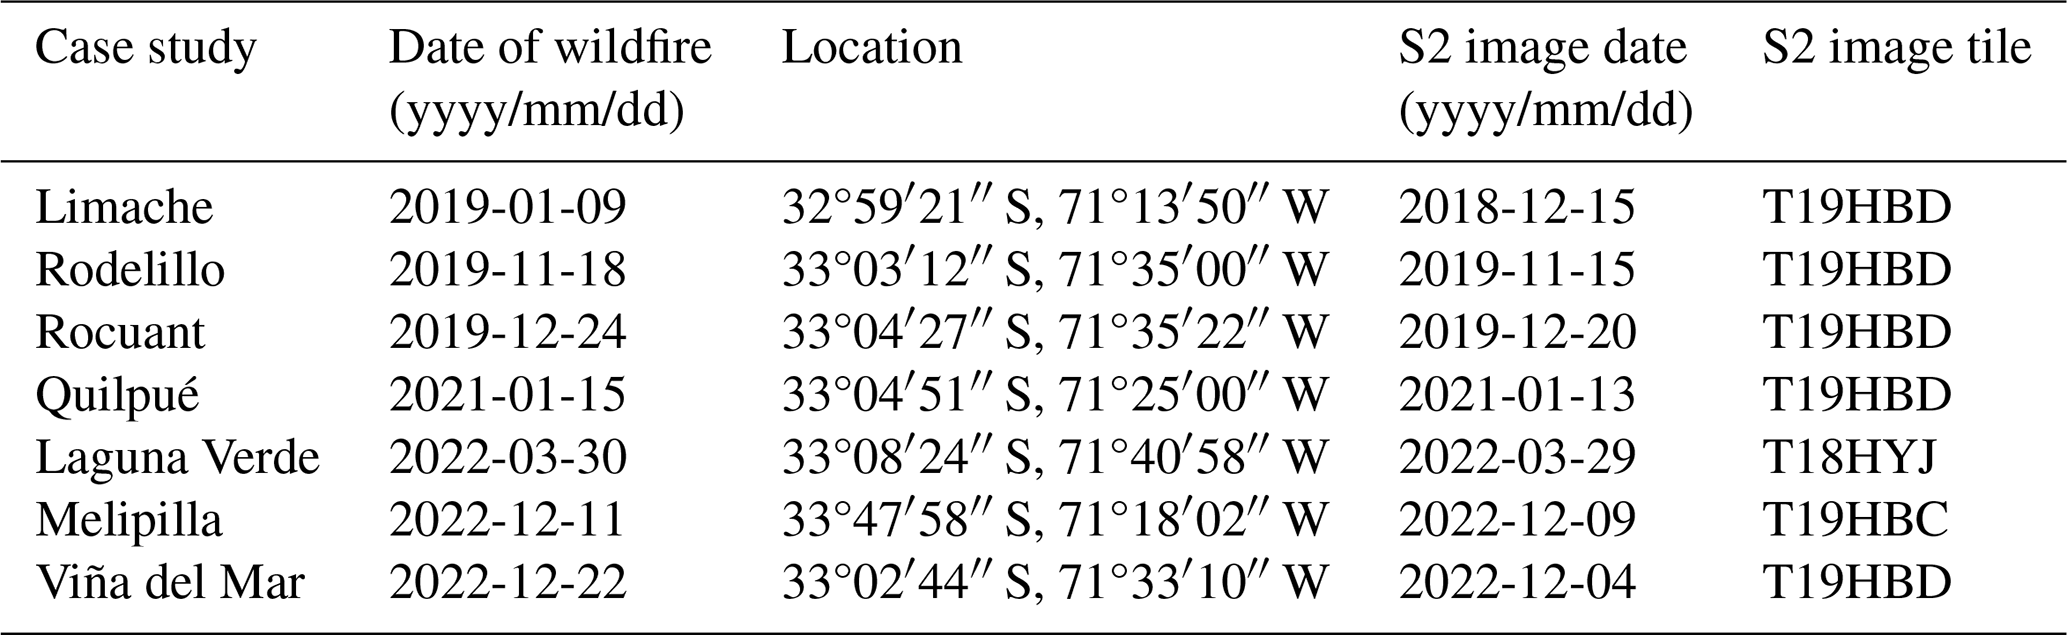
Starting in the summer fire season of 2019 and continuing until December 2022, our fieldwork team conducted data collection campaigns in the aftermath of seven WUI events that occurred in the central region of Chile. Table 1 summarizes the case studies, including information about the start date and location of each wildfire.
Each field survey (typically conducted 1 or 2 d after the fire) entailed a drone flight over the burnt WUI to obtain high-resolution optical orthomosaics and digital surface models. For this task, we used two small aircraft that could be easily operated in urban scenarios, a DJI Mavic 2 Pro and a DJI Phantom 4. We also used the PIX4Dcapture application (https://www.pix4d.com/product/pix4dcapture/, last access: 1 April 2022) for flight planning and drone operation, and all flights were conducted by a licensed pilot following the Chilean General Directorate of Civil Aeronautics guidelines. We processed the aerial images and generated the RGB orthomosaics, digital surface models (DSMs), and digital terrain models (DTMs) with the aid of PIX4Dmapper software (https://www.pix4d.com/product/pix4dmapper-photogrammetry-software/, last access: 1 April 2022). Additionally, we collected photographic evidence of affected dwellings and made in situ observations of dwelling characteristics (e.g. materials, age), urban maintenance conditions (e.g. presence of garbage dumps, road blockages), data on fire suppression resource availability (e.g. water tanks, fire hydrants), and witnesses' accounts of the origin and progression of the fire. The combination of drone imagery and direct visual inspections allowed us to examine each built unit within the study areas and to classify it into three possible categories: (1) no damage, (2) partial damage, and (3) total damage. All data were georeferenced using mobile GIS systems.
2.2 Generation of burnt area and vegetation layers
For each case study, the burnt area was manually delimited based on visual analysis of the drone RGB orthomosaics. In addition, satellite images obtained by the multispectral instrument (MSI) on board Sentinel-2 (S2) were used to characterize the distribution and density of vegetation in each study region through the normalized difference vegetation index (NDVI; Rouse et al., 1973). This index quantifies the density of plan growth as the normalized difference between reflection at near-infrared (NIR) and optical (red) wavelengths and, in the case of Sentinel-2 MSI data, is calculated as , where B8 and B4 are the NIR and optical red band, respectively, both with a spatial resolution of 10 m (Drusch et al., 2012). Pixels with NDVI > 0.6 were selected to generate a vegetation raster layer (De Fioravante et al., 2021). The details of image dates and tiles used in each case study are given in the last columns of Table 1.
2.3 Quantification of context and landscape variables in WUI fire scenarios
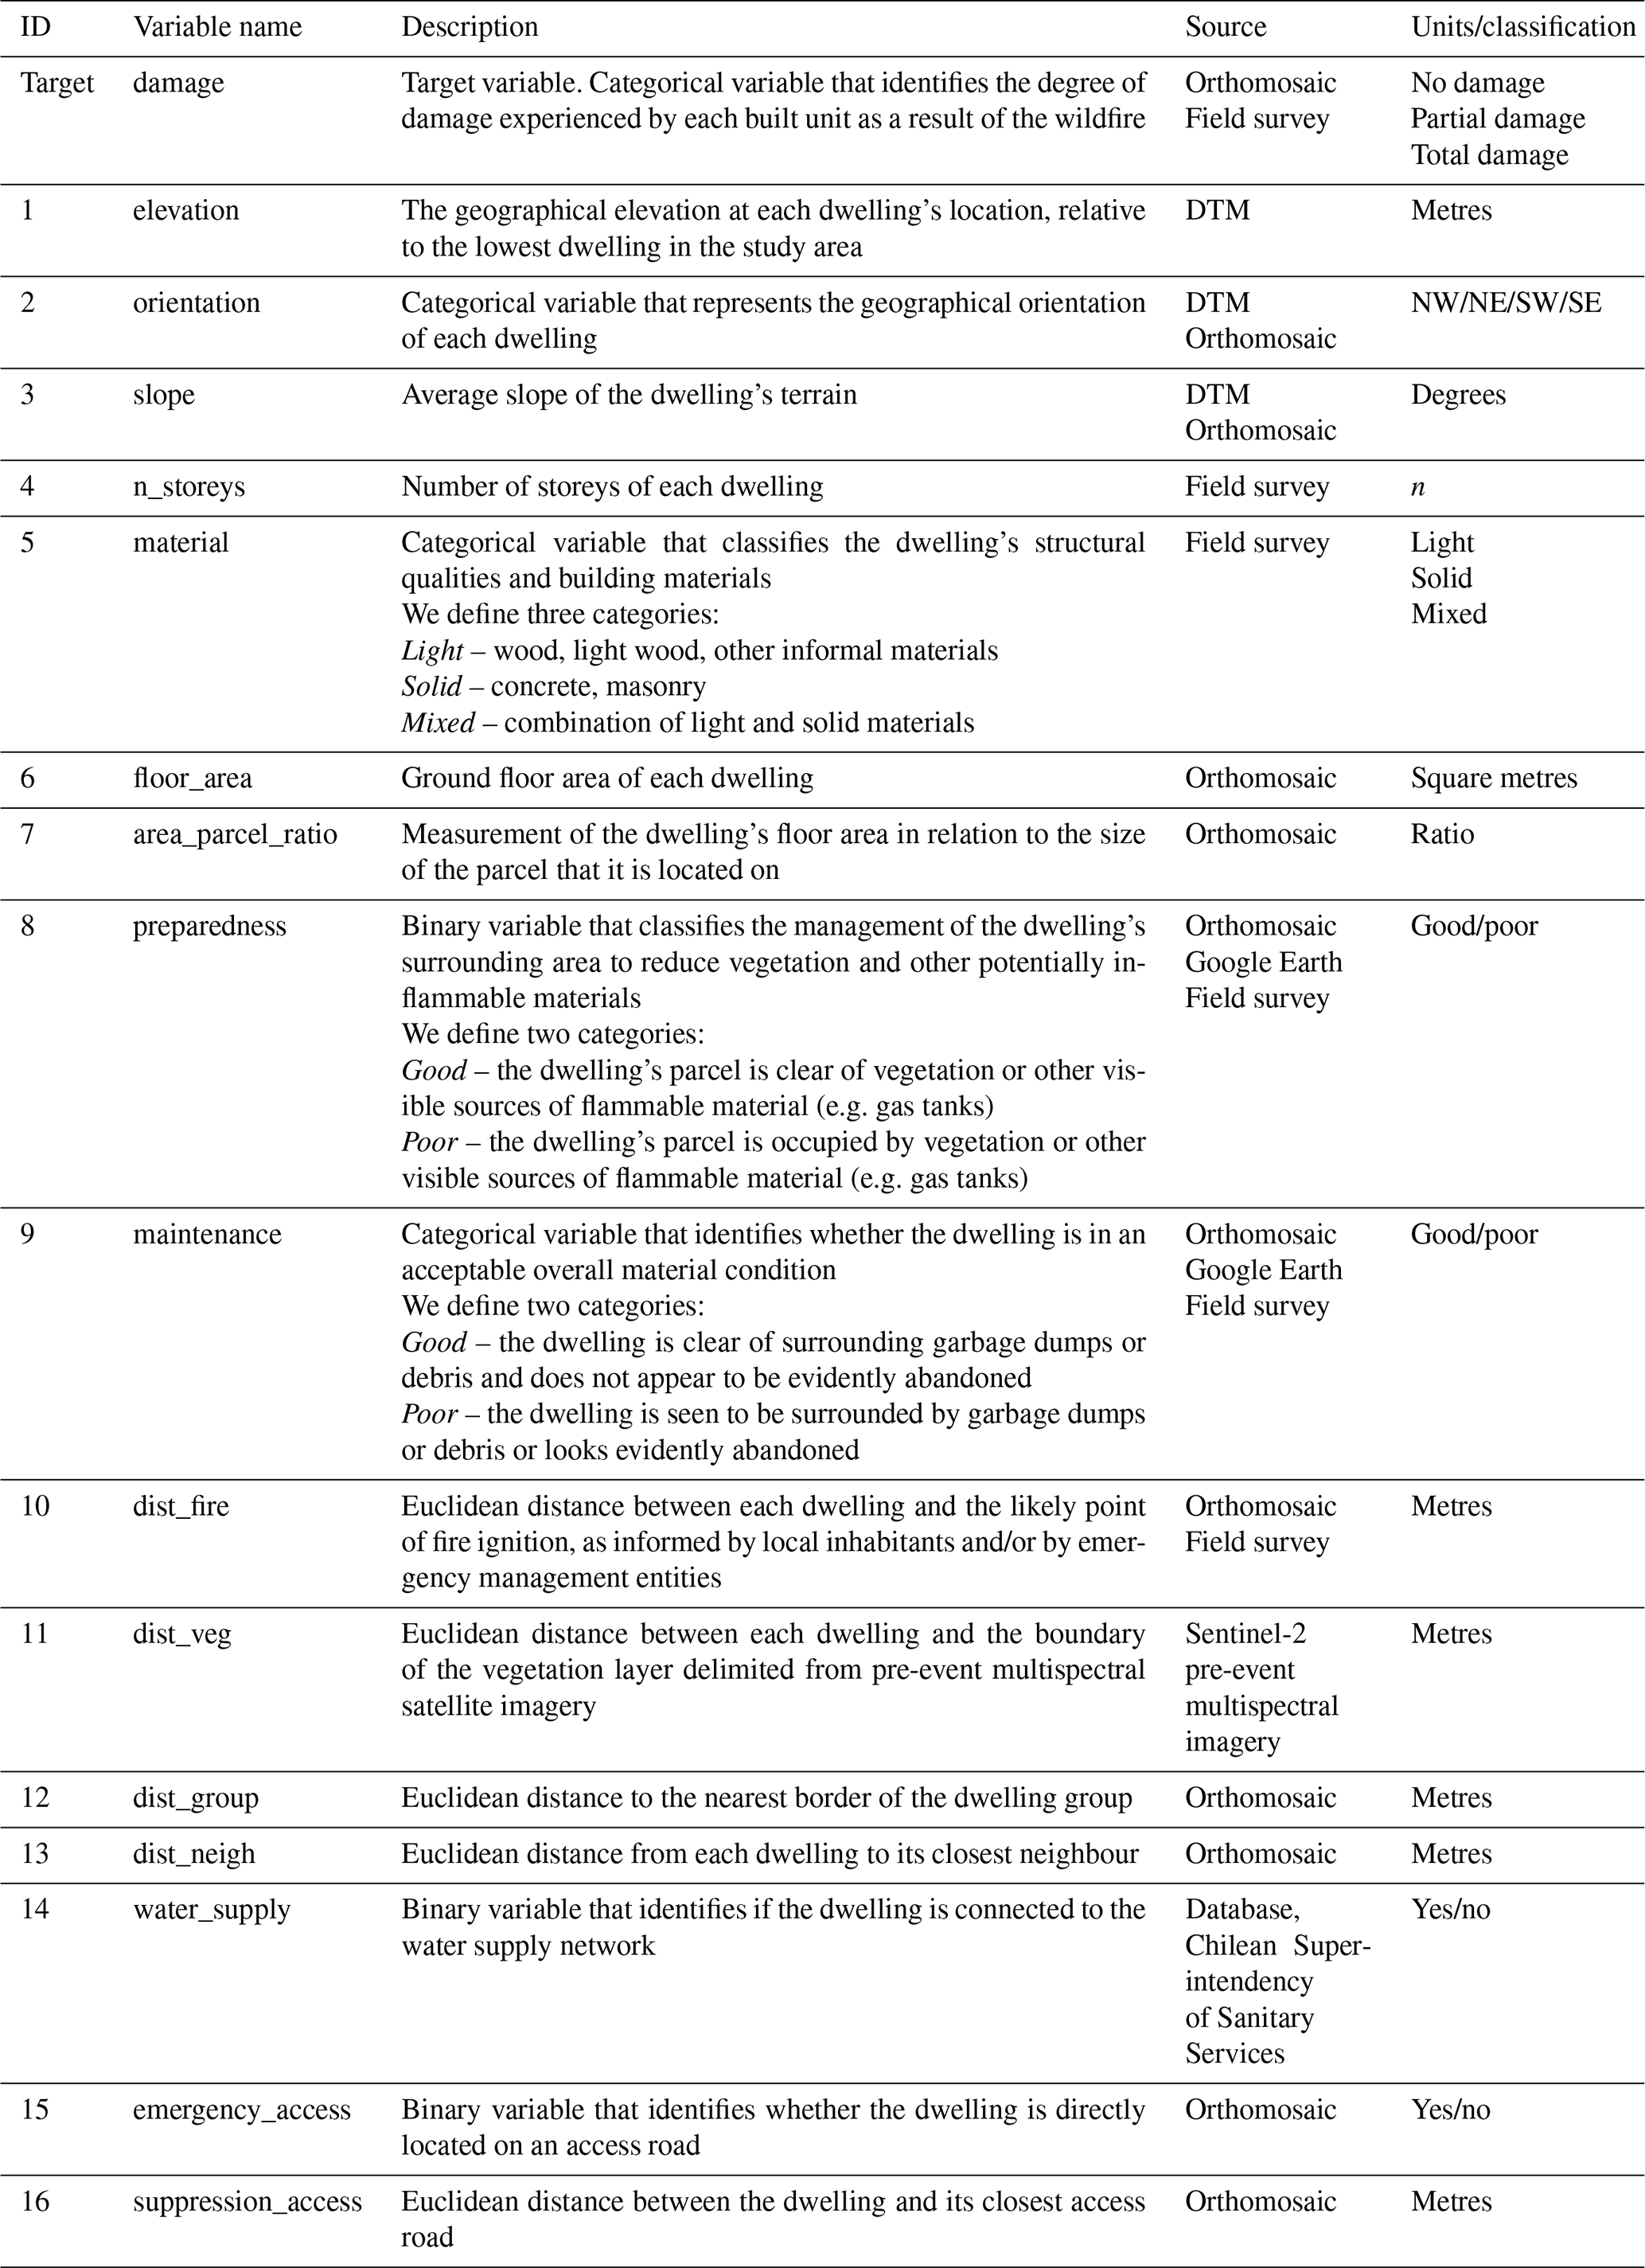
To study the vulnerability of housing units to WUI fires, we defined a set of 16 physical and spatial features to examine them as potential predictors (i.e. independent variables) of the probability of total or partial damage. These variables, summarized in Table 2, were selected to encompass both the structural and the preparedness conditions of individual units, the spatial arrangement of units relative to the surrounding landscape and to each other, and the availability and extent of fire suppression resources. To measure the variables, each built unit within the surveyed area was manually digitized from the drone-based orthomosaic maps and elevation models to obtain its geographic position, roof footprint, and ground height. The digital terrain models constructed from drone imaging were also used to generate the terrain slope and orientation layers. Building materials were inferred from a visual inspection conducted during the field visit and from pre-event street view imaging. Additionally, pre-event Sentinel-2 multispectral satellite data, public geodatabases (see Table 2), and orthomosaics were used to generate a set of vectorial layers to represent the distribution of vegetation, location of garbage dumps, evacuation roads, and availability of water supplies (e.g. water network, water hydrants). The likely point of ignition was established based on information provided by inhabitants of the burnt areas and/or by emergency management entities like the National Service for Disaster Prevention and Response (SENAPRED) and firefighters. The levels of preparedness and maintenance of dwellings within the study areas were evaluated using our survey data and high-resolution satellite and street view imaging accessed through Google Earth (2024).
Table 2Description of spatial variables evaluated for each housing unit in the study areas.
The areas surveyed by the drone encompass a larger area than the region of interest for the analysis of WUI fire vulnerability, and the generation of a control dataset of undamaged dwellings requires the spatial identification of the urban region that is effectively exposed to the hazard. Given the absence of a formal or standardized definition of the area exposed to the fire, and to avoid statistical biases, we tested six different GIS-based strategies for the selection of undamaged dwellings, considering (i) the full perimeter of the burnt area (BA) as mapped from our drone imagery and (ii) the convex hull (CH) of damaged units, as well as buffers of 50, 100, and 150 m around each boundary. These area and buffer definitions are illustrated in Fig. 1 for the Rocuant wildfire case study. By combining all the case studies, we obtained six training datasets that differ only in the number and location of undamaged units, which were used for sensitivity analysis as explained in the next section.
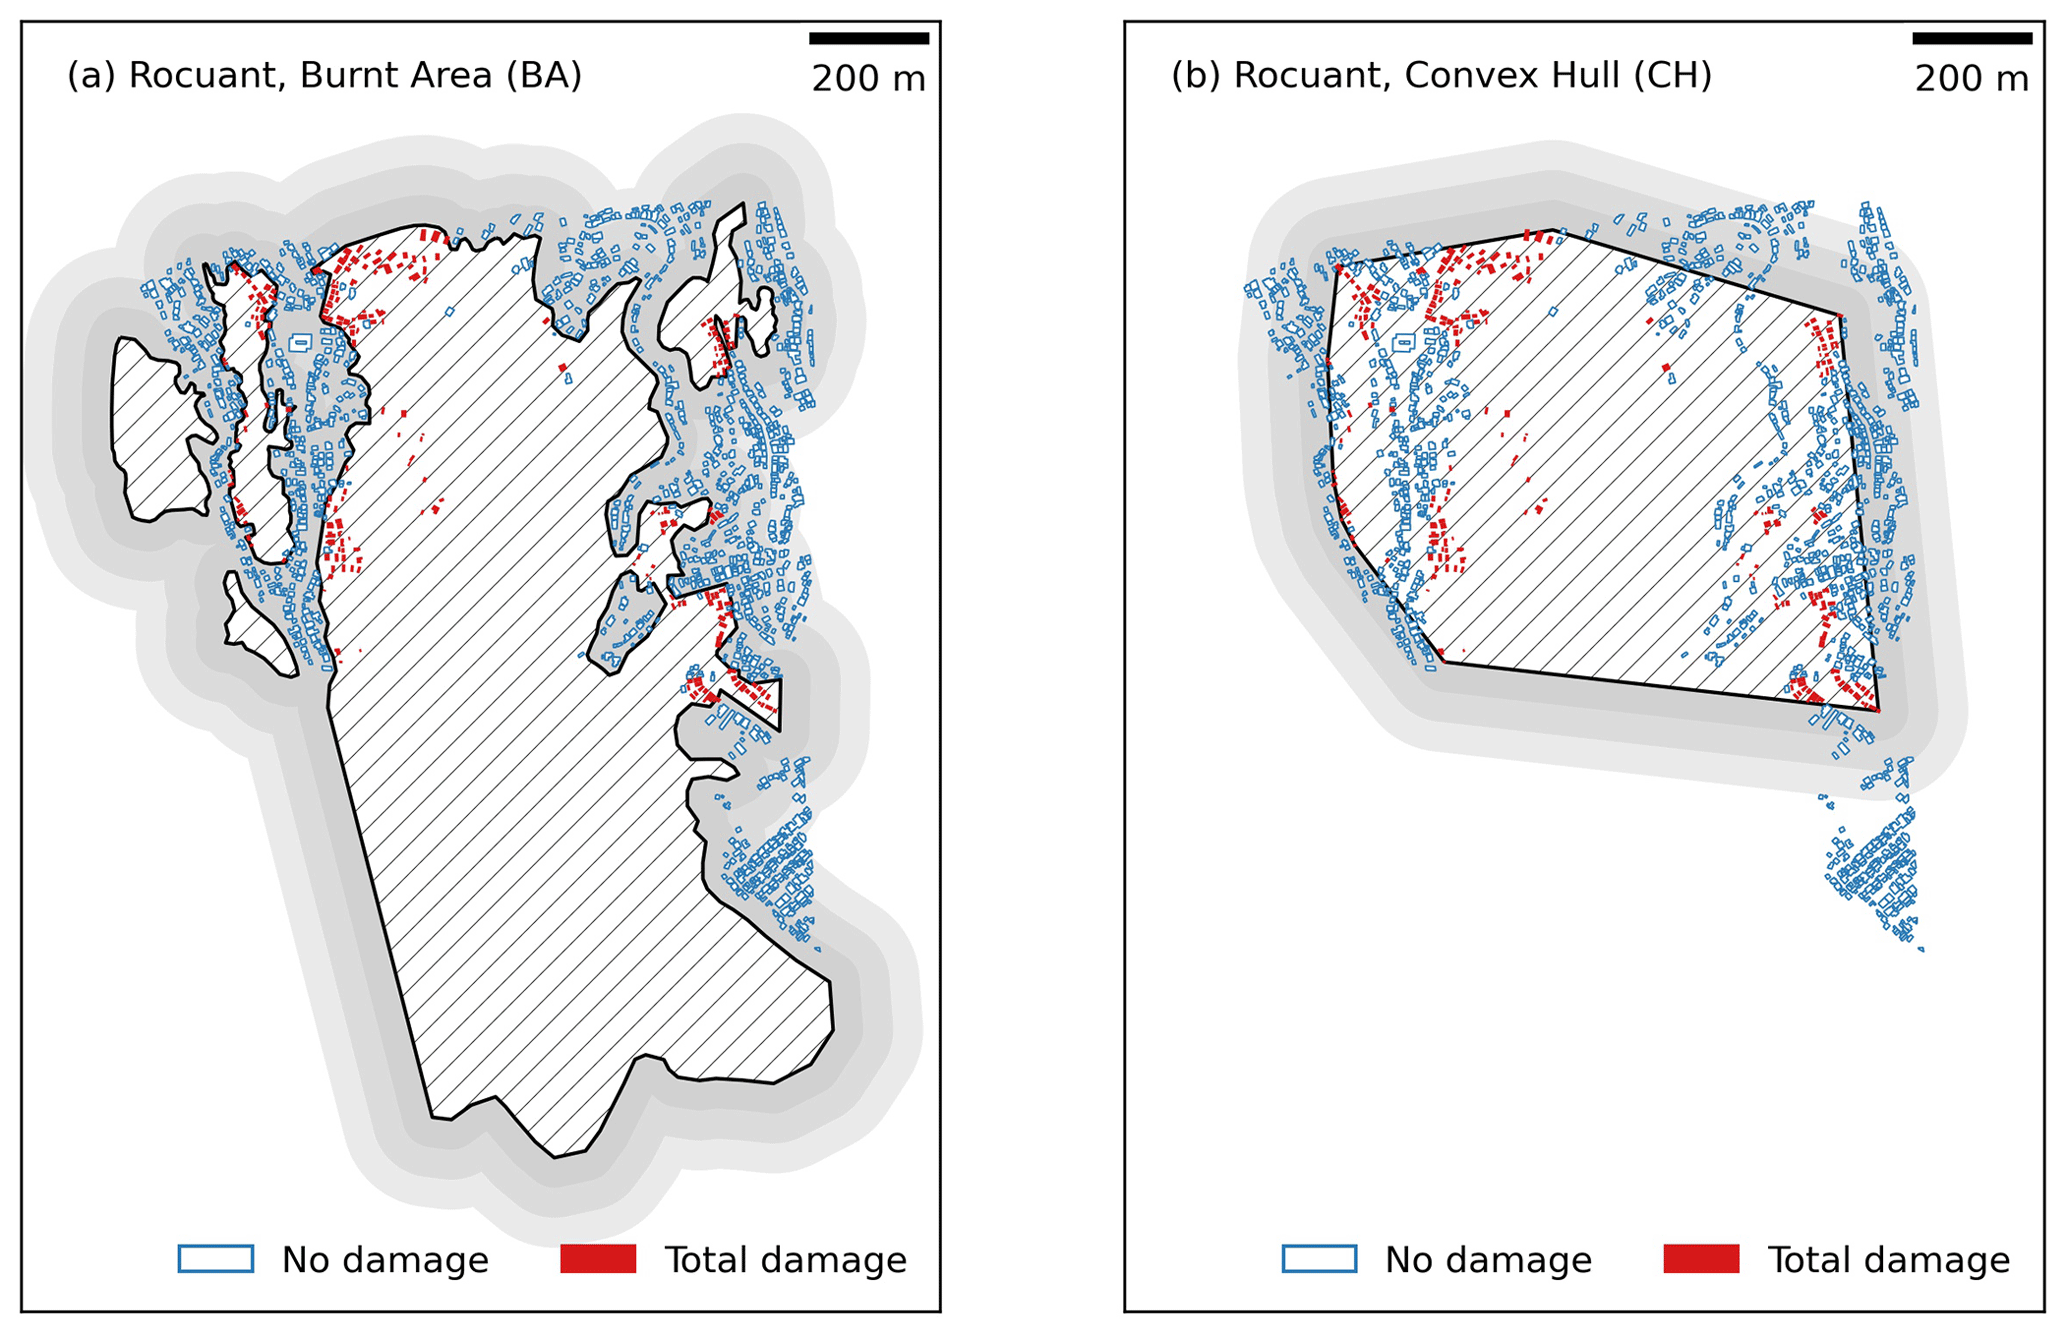
Figure 1The different spatial approaches considered to identify the areas affected by each fire and the undamaged dwellings for the Rocuant case study. (a) Identification of the burnt area (BA; hatched region) and buffers of 50, 100, and 150 m (greyscale, ranging from dark to light grey). (b) Identification of the convex hull (CH) polygon of the damaged dwellings, with its respective buffers. In both panels, filled red and non-filled blue polygons identify units with total and no damage, respectively.
In the context of vulnerability analysis, our goal was to identify attributes of built units that could affect their probability of being damaged when exposed to WUI fires. The problem can be posed as one of supervised learning and specifically of multivariate classification, where a model is trained to predict whether a given housing unit is expected to suffer total, partial, or no damage given a set of observed input variables. A trained classifier with good generalization properties can make predictions with new data, but such models also provide valuable insights into the contribution of the individual features to the model's predictive prowess. In this study, the focus was on achieving model explainability to understand the relative importance of each dwelling attribute (individual and environmental) in determining the likely damage classification.
Several of the input variables are categorical, making the data appropriate for decision tree classification models. These models divide the predictor space into several simple regions based on splitting that can be summarized in a tree scheme (James et al., 2013). In this study, we used the LightGBM classification model (Ke et al., 2017). This model was selected due to its ability to deliver shorter running times without compromising accuracy and because it is well suited for managing independent variables without extensive pre-processing. For model training and validation, we applied a k-fold cross-validation strategy (Mosteller and Tukey, 1968), stratified relative to the target variable (i.e. the damage classification of each dwelling), with 120 iterations to avoid overfitting and to assess performance uncertainties. These repetitions represent the outcome of splitting the labelled data into three training partitions and one testing partition (), with 30 crossed validations. As general performance metrics, we used accuracy and recall. The former assesses the overall fraction of correct predictions for a binary or multilabel dataset, and the latter measures the completeness of positive predictions (Pedregosa et al., 2012), i.e. the ability of the classifier to correctly identify dwellings that are likely to experience damage. Lastly, we used SHapley Additive exPlanation (SHAP) values to interpret the model's results. According to Lundberg and Lee (2017), SHAP values, which align with human intuition, contribute to explaining a model's predictions and enhancing the interpretation of its complexity. SHAP regression studies examine the importance of each independent variable in the presence of multicollinearity. To do this, a model is trained for each independent variable, both including and excluding it. Subsequently, the predictions from these two approaches are compared. Finally, an importance value can be assigned to each feature, representing its effect on the model predictions. We developed an ad hoc Python package to carry out our classification analyses, using the data analysis libraries NumPy (Harris et al., 2020), pandas (pandas Developer Team, 2020), scikit-learn (Pedregosa et al., 2012), and Lundberg and Lee (2017).
3.1 Summary of case studies
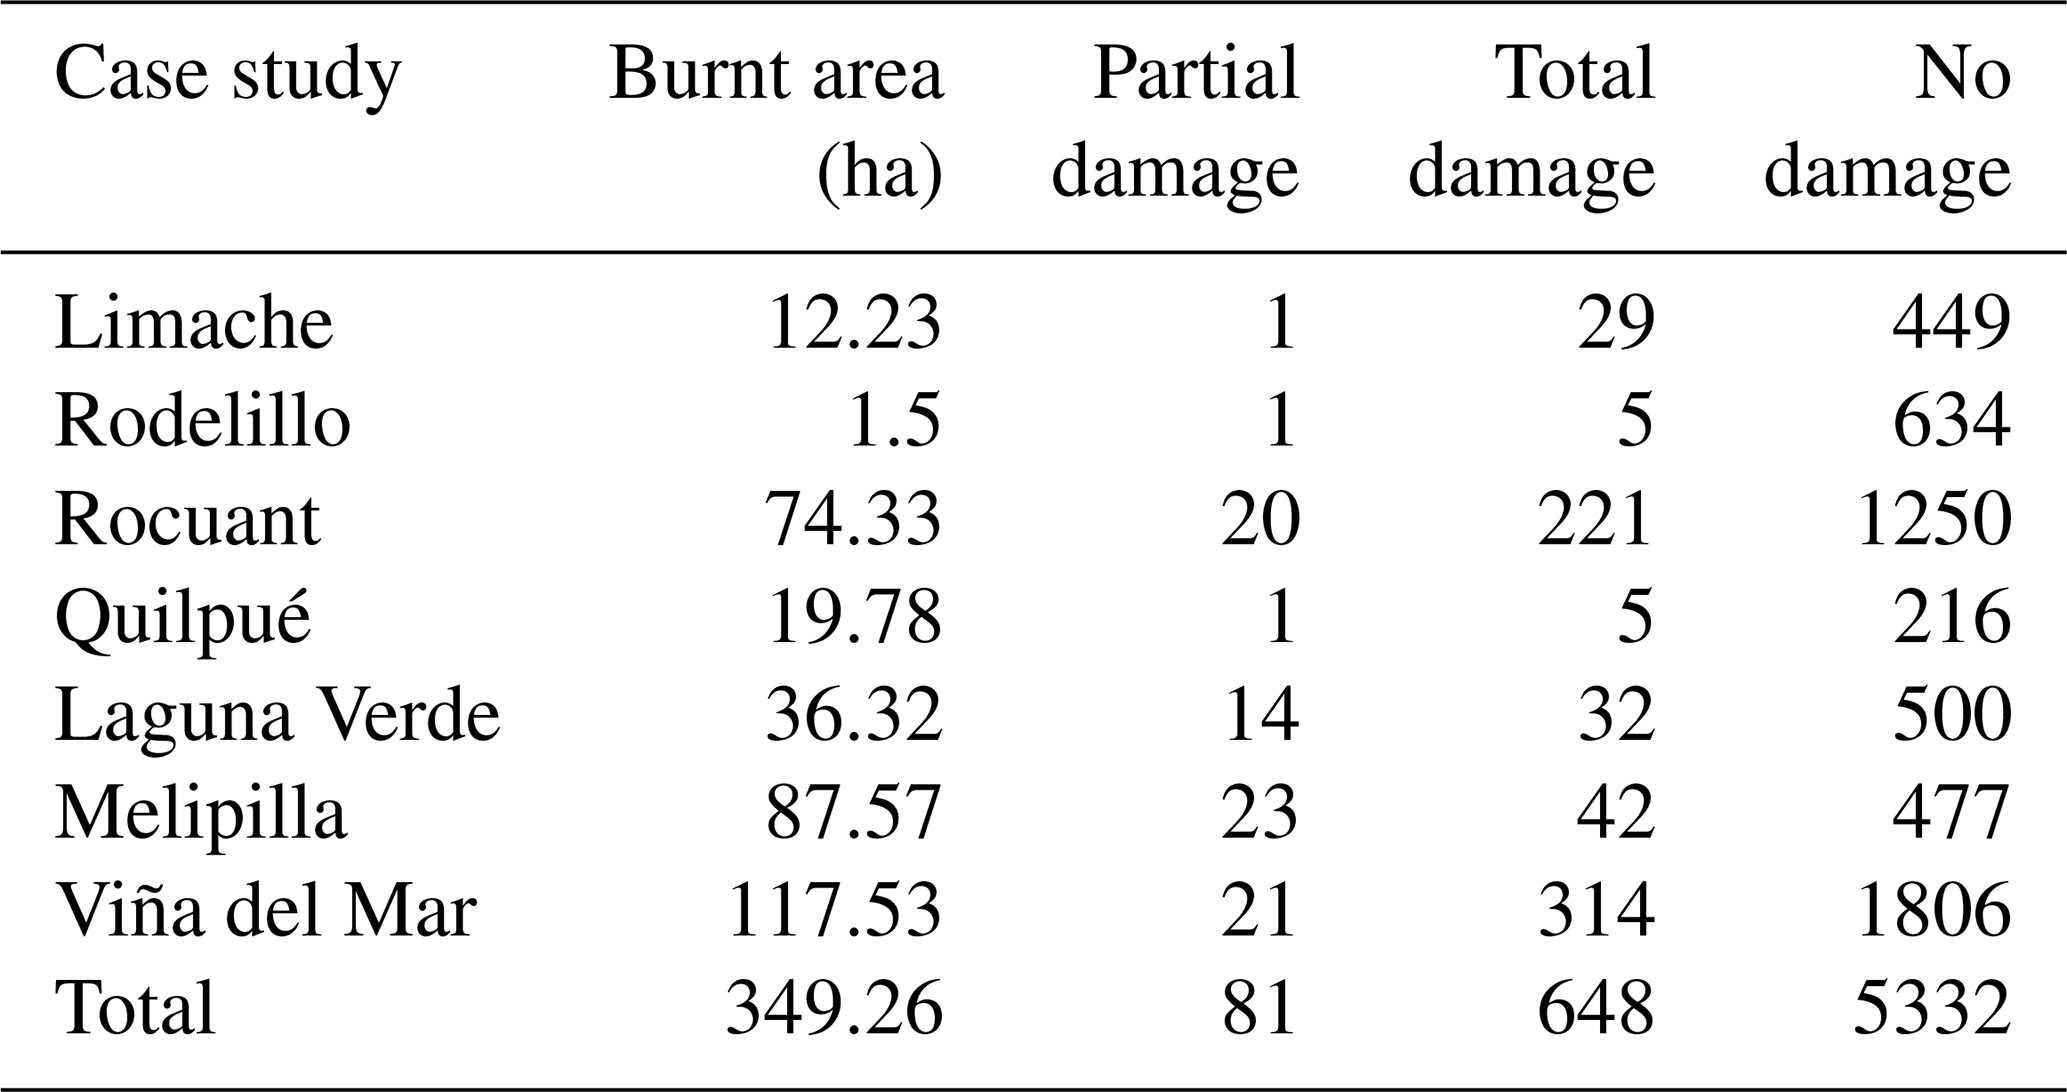
The field surveys conducted in this study allowed us to collect georeferenced damage cadastres and high-resolution drone imagery for all wildfire events, except the event that occurred in Viña del Mar. In the case of Viña del Mar, the persistence of smoke and continued fire suppression operations precluded the operation of small drones. However, we were granted access to raw imaging captured by a larger drone operated by professionals from the Ministry of Public Works. It should also be noted that in the Melipilla case study, the fire had two different focus points, so two separate flights were required to cover the affected WUI areas. The drone imagery data collected during the field surveys were used to generate 30 cm resolution orthomosaics and digital surface models for each case study. Through the analysis of these image products, we delineated the burnt areas and identified a total of 729 houses affected by fire. Of these, 648 suffered total damage, while 81 were partially damaged. Additionally, we digitized 5332 built units located within the drone survey areas but that were not impacted by the fire. In Fig. 2 we show the obtained drone imaging, the footprints of all digitized dwellings, and the delimitation of the burnt areas. The extent of the burnt areas and the distribution of damaged and undamaged dwellings for each case study are detailed in Table 3. To the best of our knowledge, there are no other georeferenced, detailed, and consistent damage cadastres for these events, so we can only compare total damage statistics to general figures reported in the national press or in communications from public institutions such as municipalities or SENAPRED. When available, these data align with the order of magnitude recorded in our results (e.g. SENAPRED, 2023; EMOL, 2022; Cooperativa.cl, 2022). Some discrepancies among public sources, as well as between these sources and the data collected in this study, are expected. These differences may be attributed to factors such as the rapid demolition and removal of debris from totally damaged dwellings, which makes them undetectable in post-event imaging. Additionally, the incompleteness of damage cadastres conducted by different governmental entities and the reluctance of informal settlers to report their losses to the authorities may also contribute to the discrepancies.
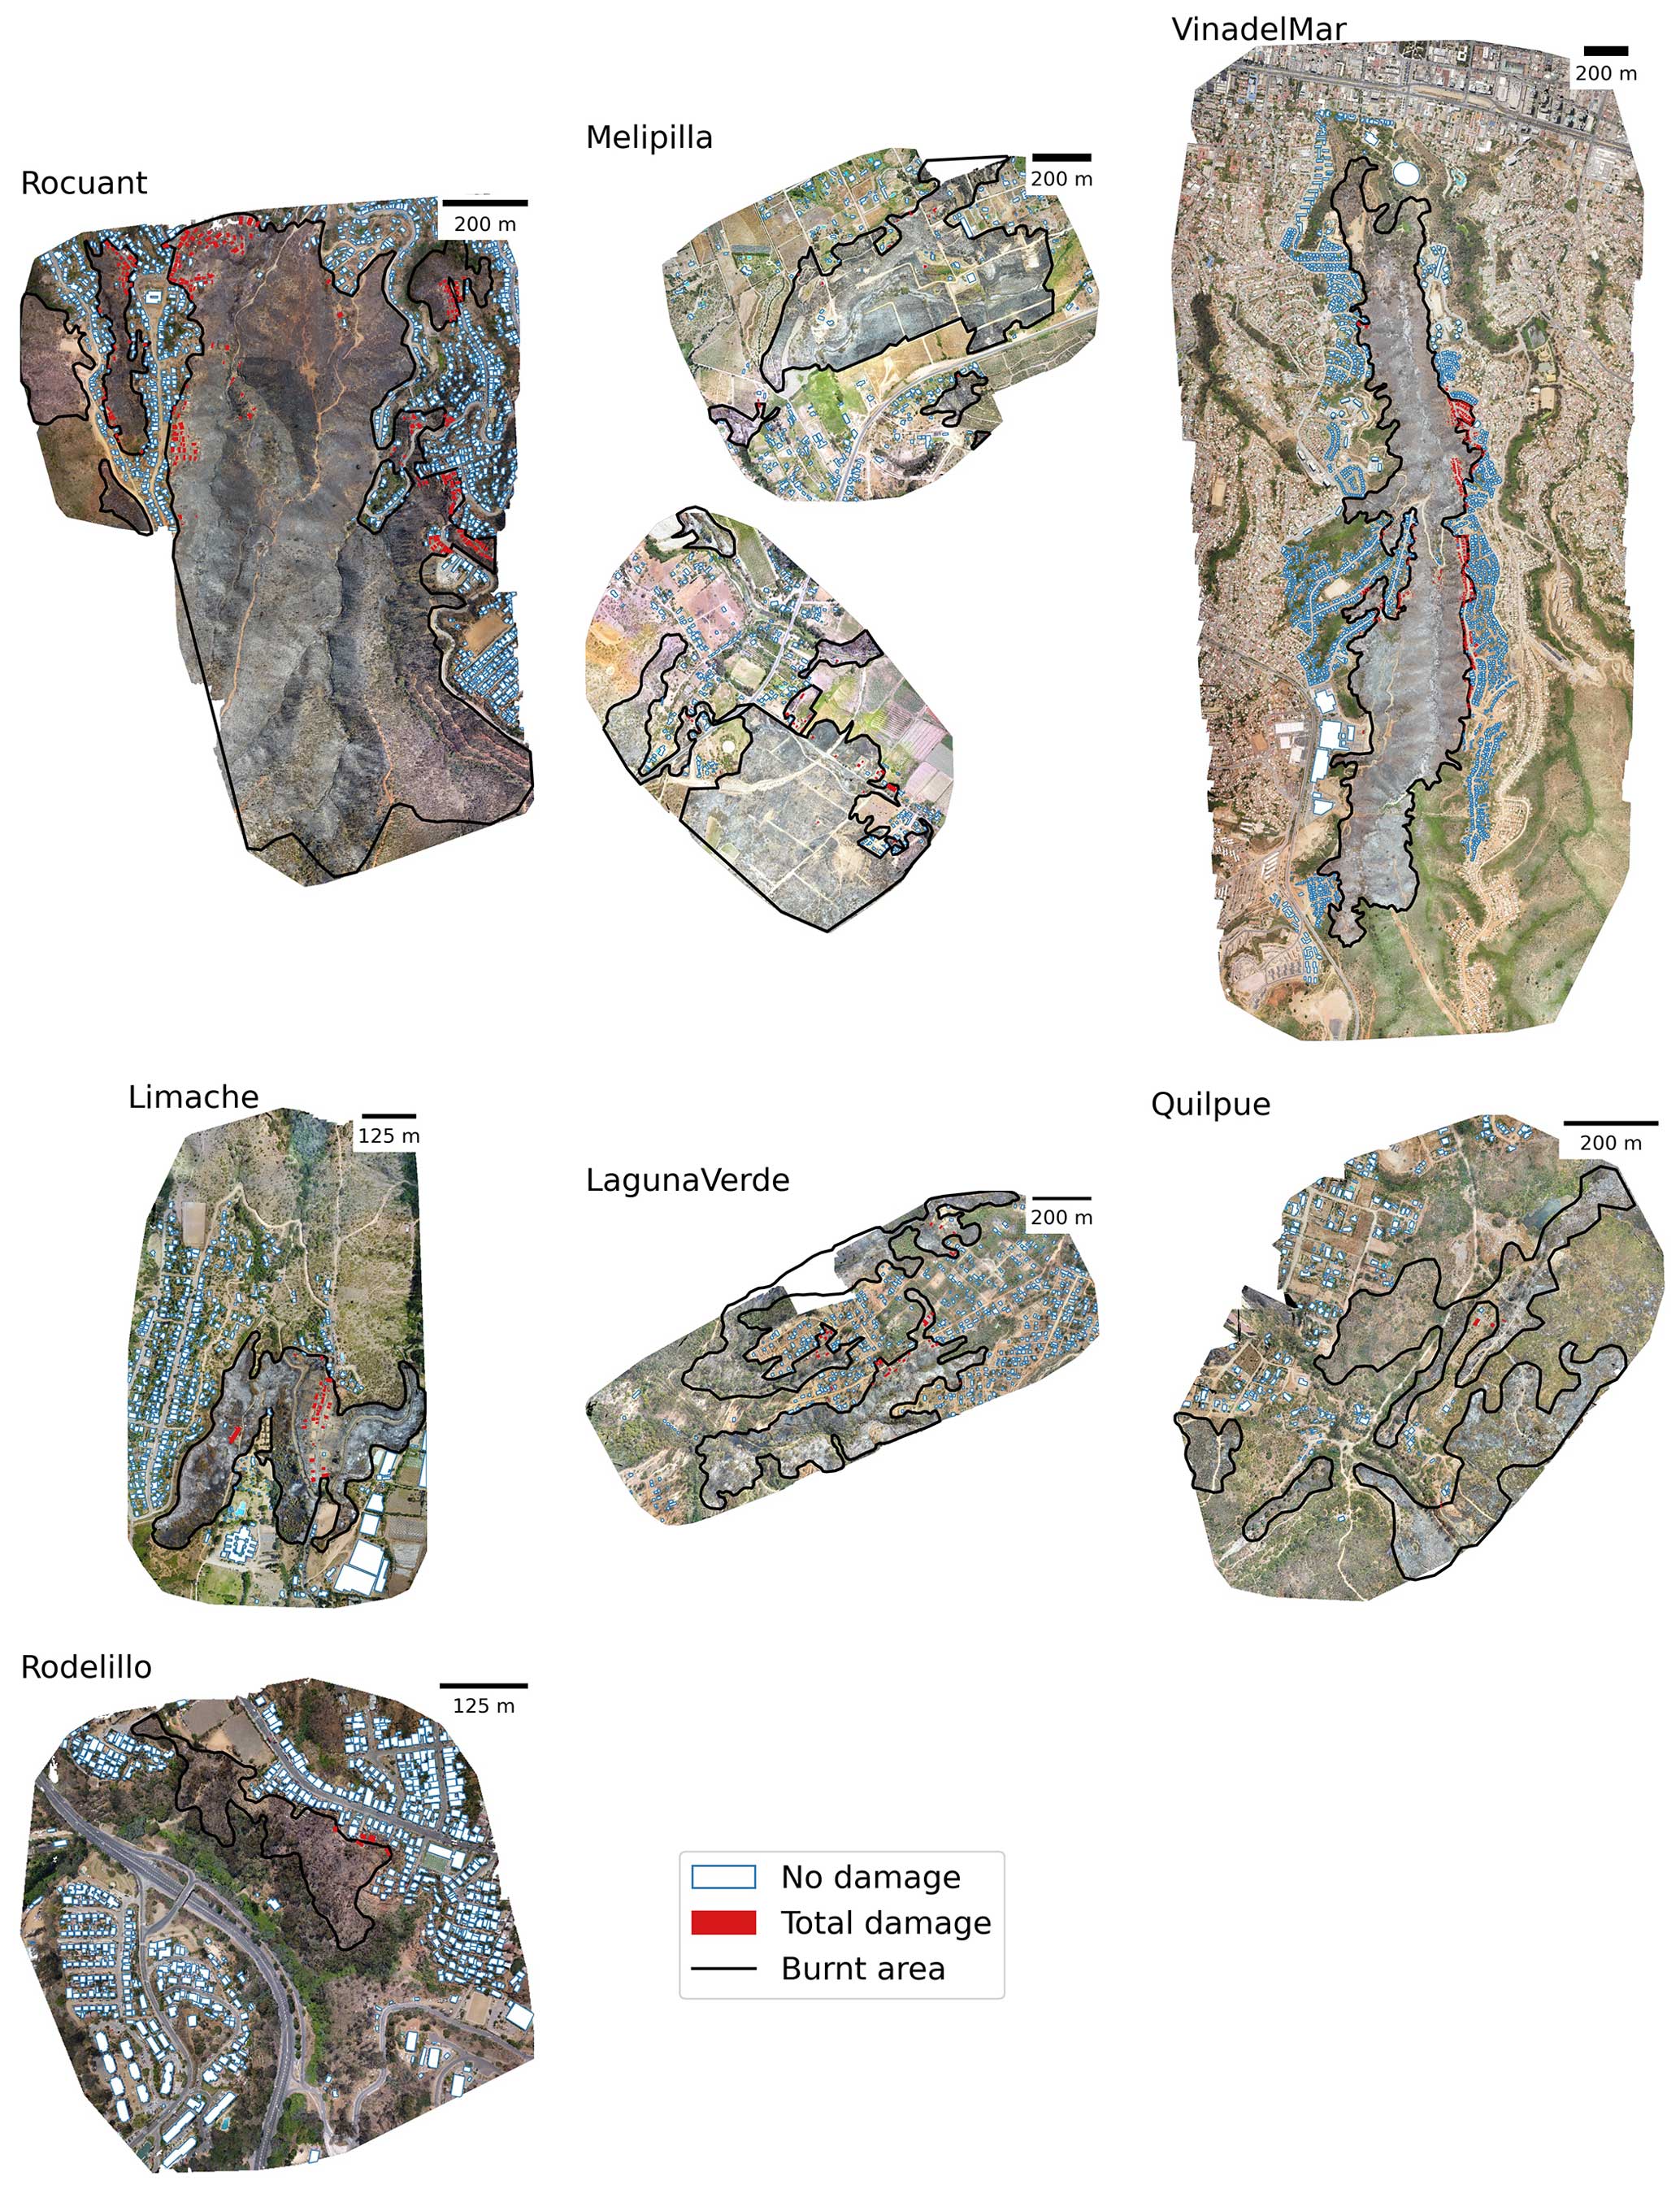
Figure 2Drone-based orthomosaics and identification of exposed and affected building units for each case study. The orthomosaics generated from drone mapping are plotted at a spatial resolution of 1 m. Damaged and undamaged units are plotted as filled red and unfilled blue polygons, respectively. The black contours delimit the total burnt area. In all images, north is up, and east is right.
Table 3Burnt areas and distribution of damaged and undamaged dwellings for each case study.
The 16 spatial variables detailed in Table 2 were evaluated for all dwellings reported in Table 3 and plotted in Fig. 2. The consolidated dataset of damaged and undamaged dwellings for all case studies is available for download (Aguirre et al., 2024).
Analysis of the attribute distribution for affected dwellings shows that most of them were built with light materials (∼ 70 %), typically had one floor (∼ 80 %), and were mostly in poor preparedness and maintenance conditions (∼ 60 %). The multivariate statistical characterizations of dwellings with partial and total damage were similar, and given that in the combined dataset the number of records with partial damage was significantly lower, the partial damage and total damage categories were merged into a single damaged category (N=729). A similar approach was adopted by Penman et al. (2019), who examined damage data from several fire seasons in Australia and found that destroyed houses outnumbered damaged ones by a ratio of 4:1 and therefore merged them into a single category.
3.2 Model training and sensitivity analysis
As described in Sect. 2.3, the number and distribution of the spatial attributes for units undamaged by the fire depend on the chosen delimitation of the study area. We defined six alternative datasets for model training considering the burnt area (BA) and convex hull (CH) boundaries, with buffers of 50, 100, and 150 m (BA50, BA100, BA150, CH50, CH100, CH150). We then carried out a sensitivity analysis to study the impact of the different delineations of the affected area on the imbalance of training datasets, the performance of the trained models, and the assessment of feature importance. As shown in Fig. 3, we found that all models yielded an accuracy range of ∼ 60 %–70 % and had recalls ranging from ∼ 80 %–90 %. We note that in all cases, the accuracy and recall values obtained in the training dataset were only slightly higher than in the test dataset, so there is no evidence of overfitting. In both the CH and the BA approaches, increasing the buffer distance naturally resulted in more imbalanced datasets with a higher proportion of no damage records, a trained model with increased median accuracy (+33 % for BA and +13 % for CH, when the buffer was increased from 50 to 150 m), and a slight decrease in recall (−5 % for BA and −3 % for CH, when the buffer was increased from 50 to 150 m). As the study region expanded, the accuracy increased, driven by a higher number of true negatives in the confusion matrix. This is misleading in terms of model performance given that its main purpose is to correctly predict and explain true positives, i.e. damage. This effect was stronger when the BA approach was used, particularly in the case of large fires (e.g. Viña del Mar and Rocuant), as it considered buildings further from the urban areas where damage effectively occurred. For example, Fig. 2 shows the groups of undamaged dwellings located on the southern margins of the burnt areas in Rocuant and Viña del Mar. On the other hand, we found that recall provides a more stable and significant criterion for the selection of the final dataset to be used as a reference for assessing feature importance. Considering the trade-off between the data imbalance, accuracy, and recall of the trained model, we chose the CH100 scenario as our working definition of the study region and labelled datasets accordingly for each wildfire.
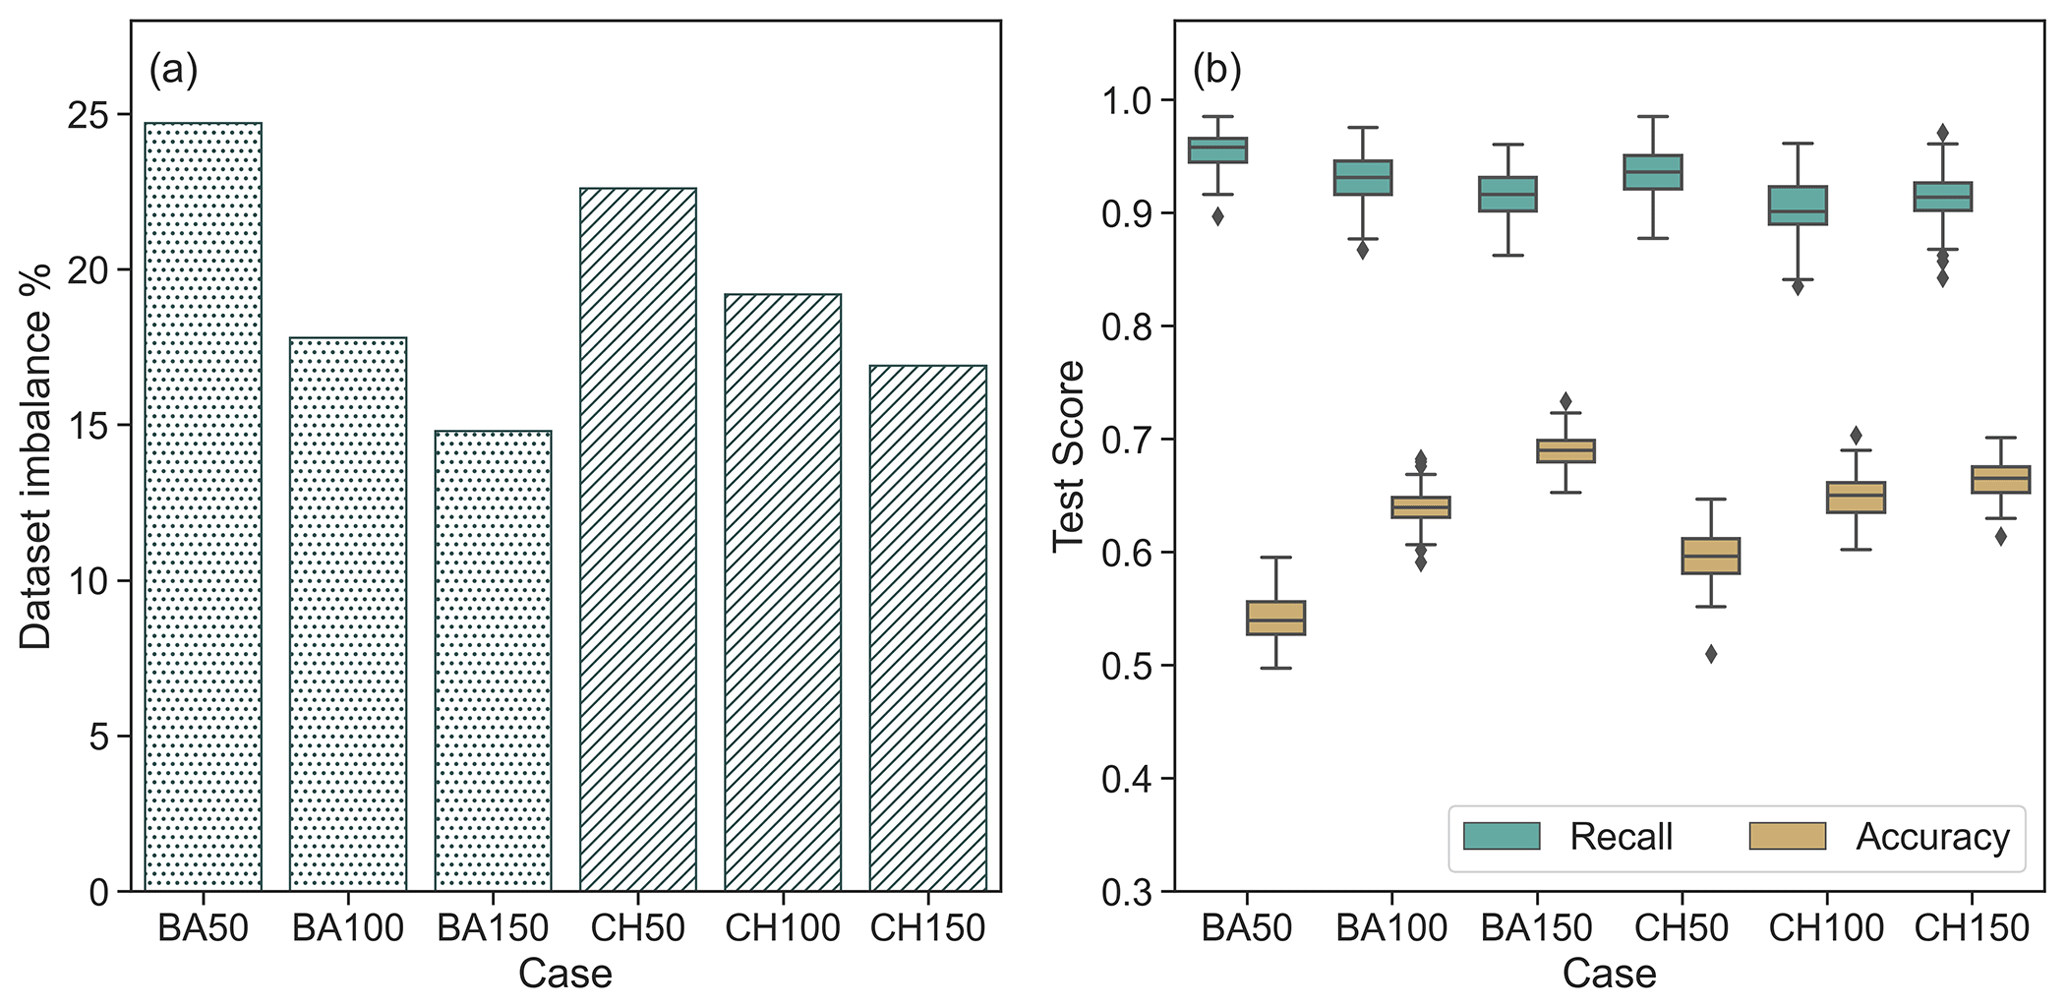
Figure 3Comparison of dataset imbalance and model performance for six different definitions of the study regions. (a) Imbalance of the labelled dataset, expressed as the percentage of undamaged records over the total dataset. (b) Boxplots of accuracy and recall scores obtained for the test datasets with a k-fold cross-validation strategy.
3.3 Analysis of feature importance
To represent the relative importance of features for the classifier trained with the CH100 dataset, we used bee swarm plots, which summarize the SHAP values of each feature for the input dataset. The plot is presented in Fig. 4. From the collection of trained models, we identified five variables that were consistently more important for predicting damage: the elevation relative to the lowest unit in the surveyed area (elevation), the distance to the closest neighbour (dist_neigh), the distance to the nearest border of the dwelling group (dist_group), the distance to the closest vegetated area (dist_veg), and the distance to the likely fire ignition point (dist_fire). On the opposite end of the bee swarm plot are six variables that have a negligible impact on the classification outcome: material, emergency_access, maintenance, suppression_access, water_supply, and orientation. The low importance of the material feature is explained by the socioeconomic context of the studied regions, which correspond to underprivileged developments where a large majority of dwellings (∼ 70 %–80 %) are built from light materials. In an intermediate tier, five variables were grouped together (n_storey, floor_area, preparedness, slope, area_parcel_ratio), whose relative order of importance for the model depends on the buffer distance used in the construction of the training dataset. To provide a more detailed analysis and qualitative interpretation of the trained classifier, Fig. 5 includes individual dependence scatterplots illustrating the effect of each feature on the model's prediction. This applies to all features except the six at the bottom of Fig. 4. In the next section, we discuss our findings for each variable in relation to previous studies in the literature.
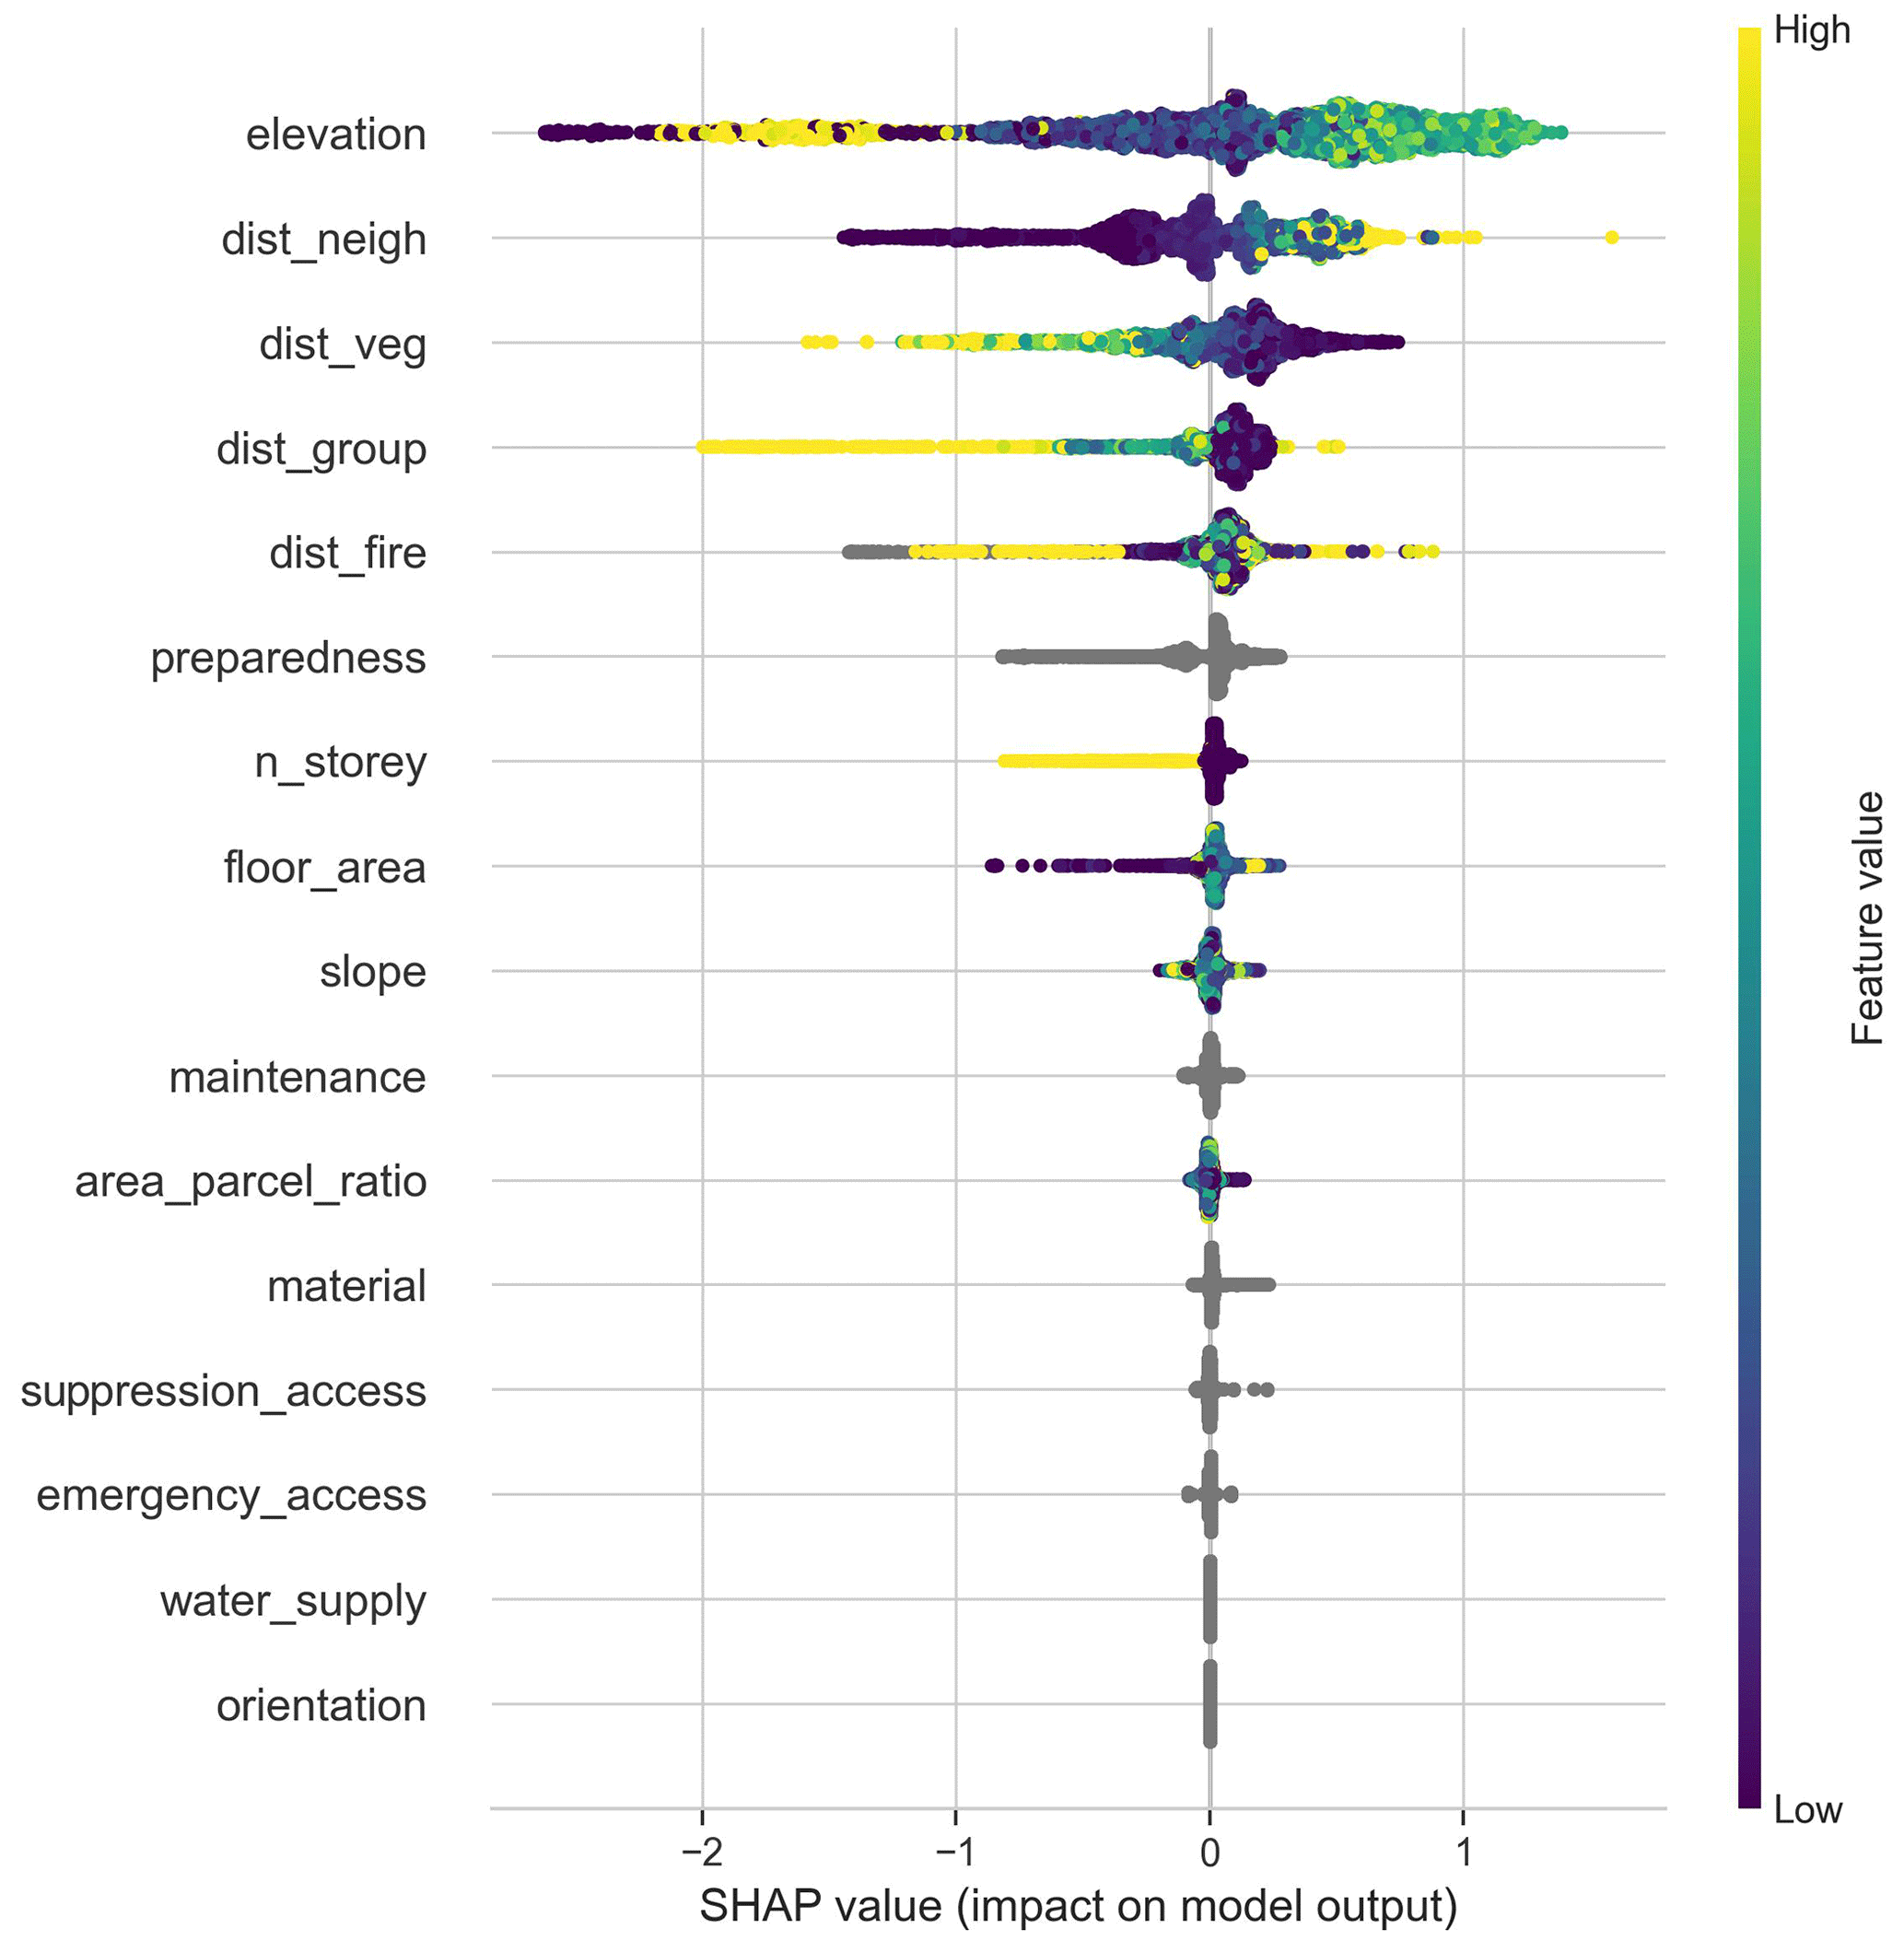
Figure 4Bee swarm summary plot for the CH100 model. The y axis indicates the feature names, ordered by importance from top to bottom, and the x axis represents the SHAP value or the change in log odds of the target variable. Each point represents a row of data from the original dataset, and the colour of each point on the graph represents the relative value of the corresponding feature, from high values (yellow) to low values (purple). Categorical variables were not classified as high/low, so they are plotted in grey.
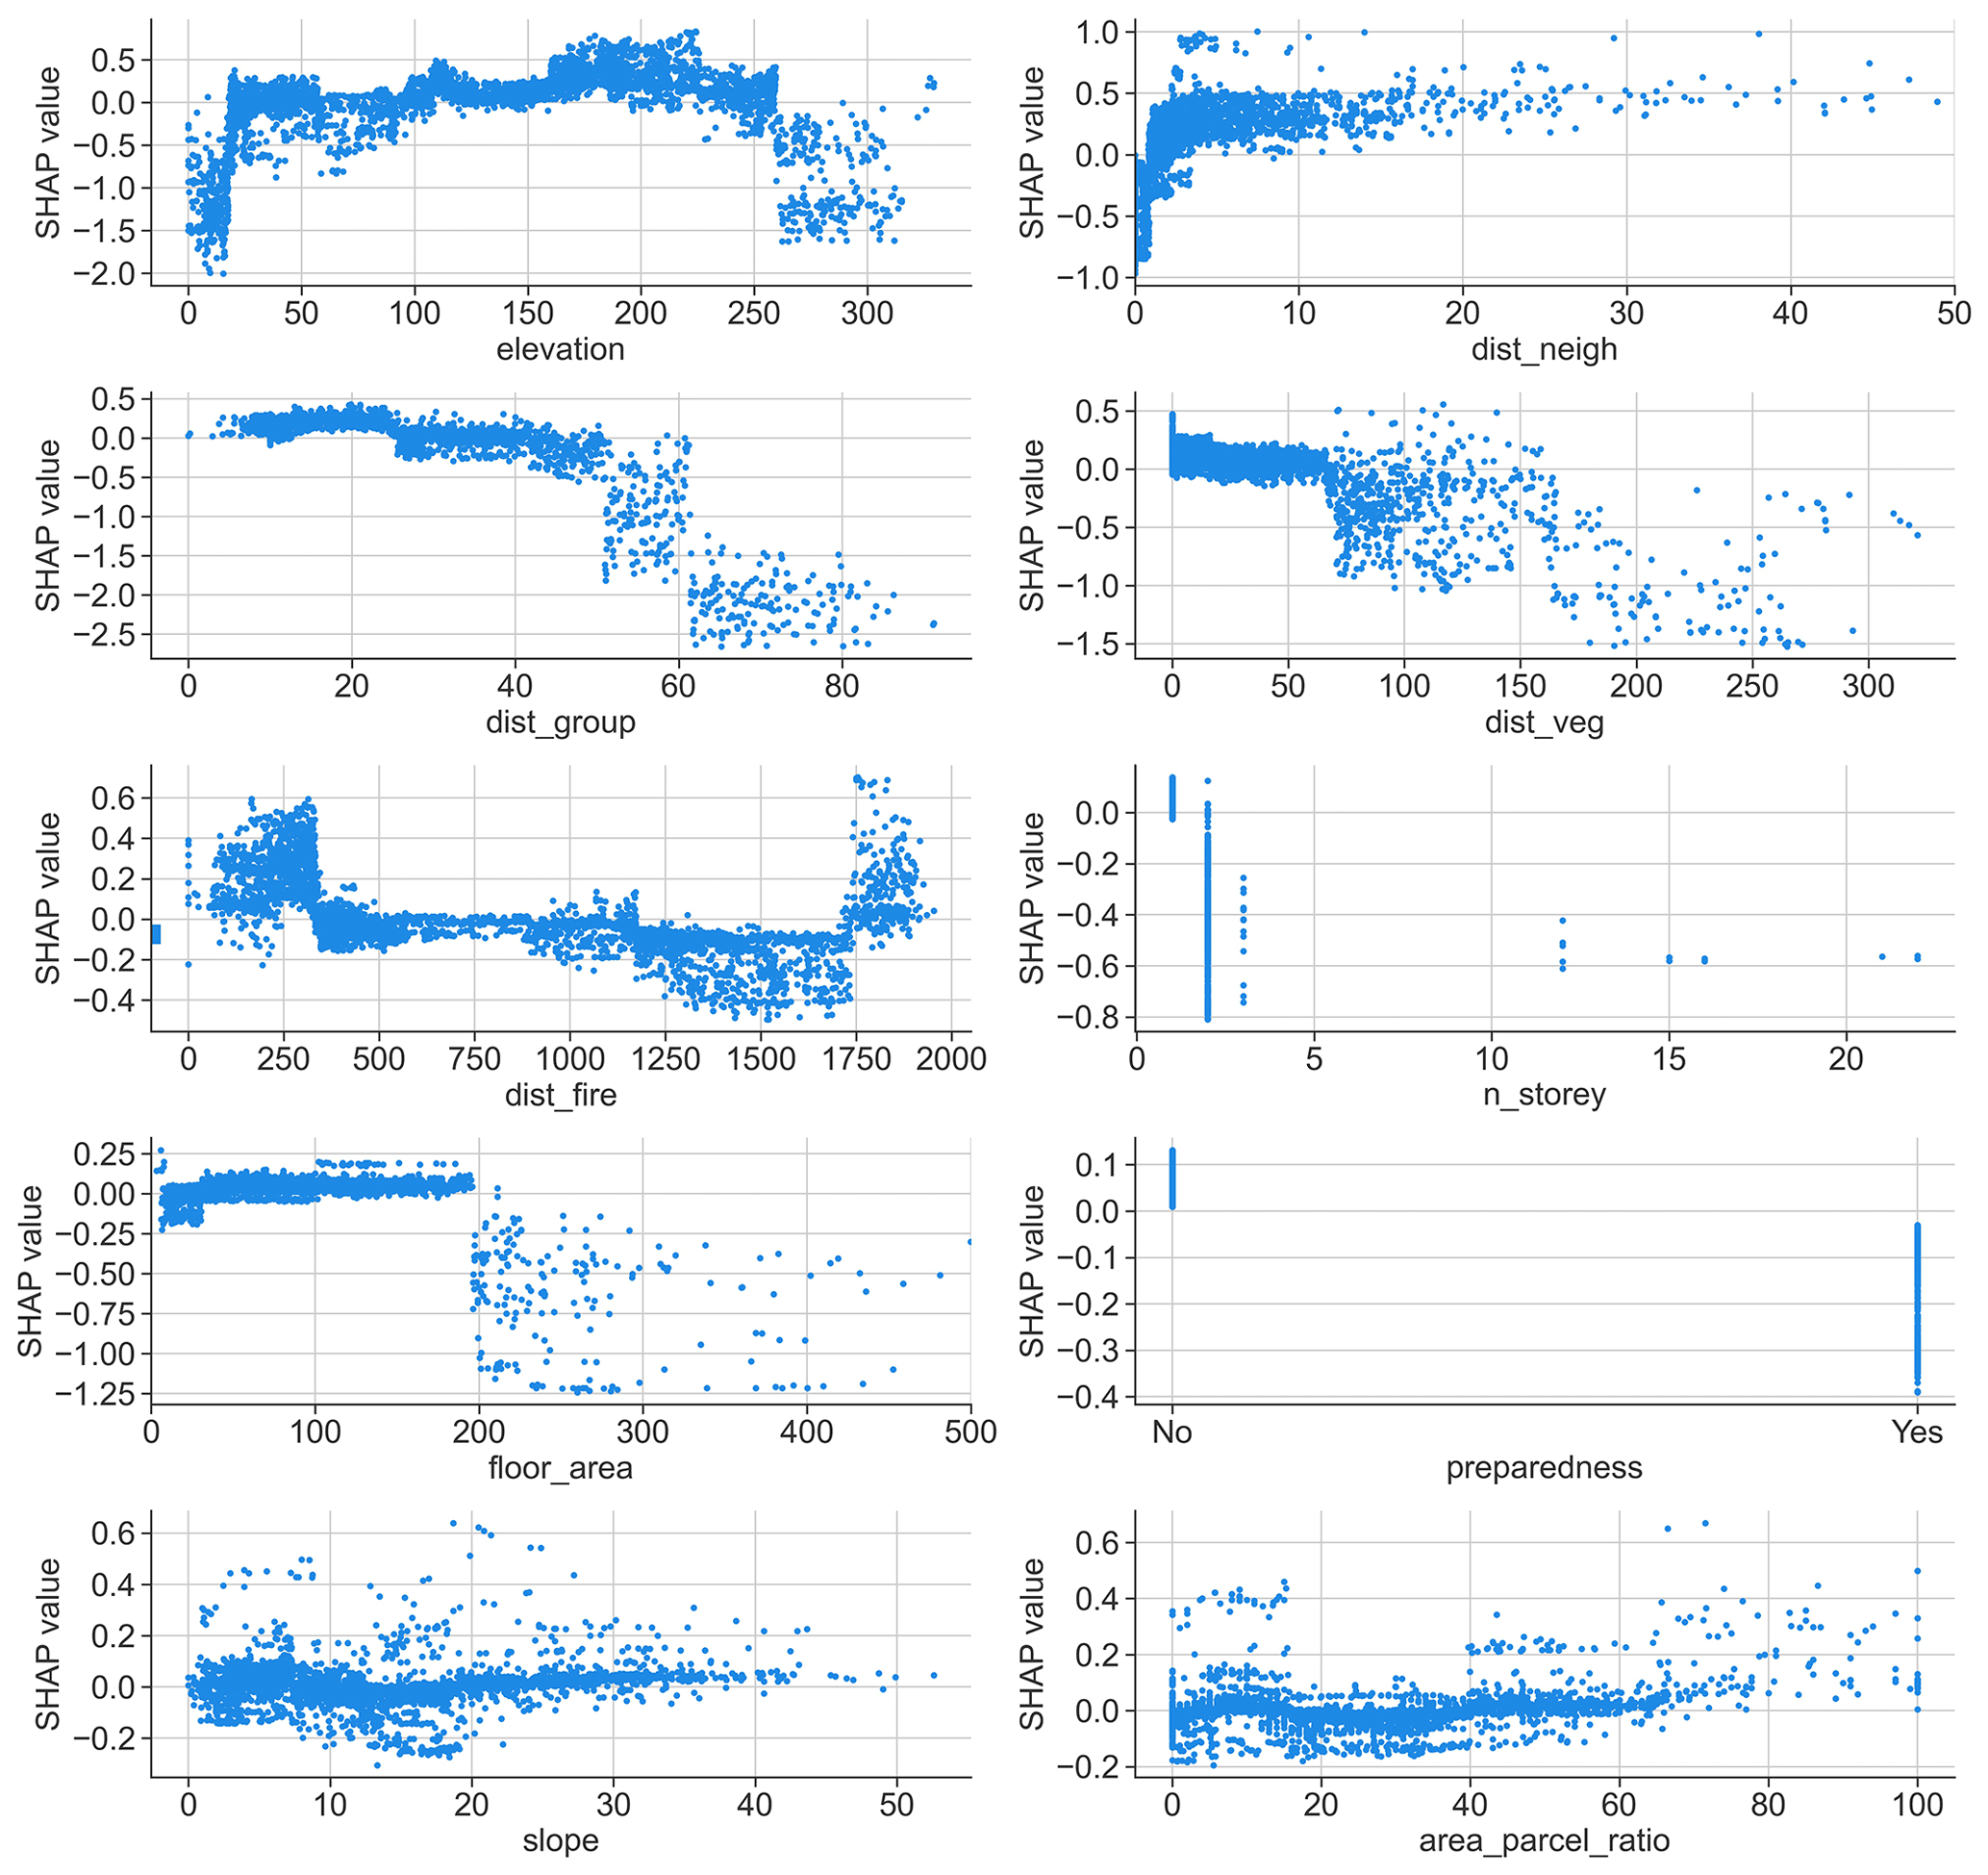
Figure 5Data scatterplots showing the distribution of SHAP values compared with the 10 most important independent variables. The x axis represents the value of the feature, using the corresponding units provided in Table 2. The y axis represents the corresponding SHAP value, in log-odd units.
Few studies have systematically examined how the physical characteristics of individual buildings relate to their vulnerability to wildfires and, furthermore, have done so systematically for several wildfire events or very large datasets. As relevant examples, Dossi et al. (2022) examined a sample of 18 690 buildings exposed to wildfires in California, USA (2013–2017), and Pedrógão Grande fire complex, Portugal (2017). Papathoma-Köhle et al. (2022) developed a physical vulnerability index based on building structural and surrounding features recorded for 423 buildings affected by the Mati fire (Greece, 2018). Penman et al. (2019) analysed building-level data for 309 units damaged by wildfires in Australia between 2001 and 2009, while Knapp et al. (2021) studied the associations between the distance to the nearest destroyed structure and vegetation for a sample of 400 dwellings in northern California affected by the 2018 Camp fire. To the best of our knowledge, no similar studies have been conducted in Latin America and Chile, so this study contributes the first unique dataset that (i) pertains to a geographical region where physical vulnerability to WUI fires has not been systematically studied; (ii) includes a set of building-level variables relative to the individual structures and their location relative to vegetation, the source of the hazard, and the urban environment, which are quantified for both damaged and undamaged dwellings; (iii) comprises several case studies that correspond to a total of 729 damaged units, which is significantly larger than most comparable studies; and (iv) was constructed through the intensive use of remote sensing and image analysis methods that could be further advanced and scaled using machine learning approaches. The construction of this dataset is based on a mixed-method approach that combines satellite and drone imagery, field survey, and a GIS-based analysis of the collected images and infrastructure data provided by public institutions. Such methods can largely be automatized and scaled by leveraging open platforms for spatial analysis such as Google Earth Engine, building databases like the Microsoft Building Footprints, and state-of-the art segmentation algorithms like the Segment Anything Model (SAM). However, high-resolution post-event imaging remains a key element that requires improvement. Our experience shows that commercially available drones are an efficient alternative for generating optical orthomosaics and digital elevation models for fires under ∼ 100 ha, but in the case of more extensively burnt areas, larger crafts are required to ensure geographical coverage and operational safety. These resources are available within different government entities that typically deploy emergency teams in the aftermath of disasters, such as municipalities and sectorial ministries. Therefore, there is a pivotal opportunity for institutions to collaborate on gathering comprehensive data for the purpose of risk assessment. As a long-term goal, a systematic mapping of the WUI based on spatially resolved aerial or satellite imagery would enable a more detailed characterization of damaged and undamaged dwellings in the case of a future fire. Additionally, this mapping could include construction dates, which can be used to assess the impact of evolving building regulations and construction practices on vulnerability (e.g. Knapp et al., 2021). This is especially relevant for informal urban developments, which cannot be traced in official databases such as property tax cadastres.
Regarding model training, the accuracies obtained for the training datasets considered were in the 65 %–70 % range, but the recall metrics were significantly higher, reaching close to 90 % in all cases. Since the purpose of the model is to identify dwellings that are more susceptible to damage when exposed to WUI fires, the consequences of type II errors (false negatives) are more undesirable than type I errors (false positives). In the former, the application of the trained model to a new urban setting would imply that a dwelling likely to be damaged is incorrectly predicted to survive a wildfire and may thus be excluded from maps of vulnerable assets used as input for risk assessment and decision-making. On the contrary, incorrectly predicting damage for a given unit that is not likely to suffer damage would only lead to redundant safety considerations. Therefore, from an operational perspective, recall provides a more appropriate performance metric for the classifier and supports using the trained model as a tool for prospective assessment of the vulnerability of urban developments close to the WUI, assuming data availability.
Moreover, the analysis of SHAP values provides a ranking of features in terms of their importance for predicting damage, which we compared to previous findings in the literature. In general, we found that the group of variables that describe the spatial arrangement of dwellings has a greater effect on damage prediction than other features, relative to the structural and preparedness conditions of the individual units or to fire suppression resources. Although the elevation of each house (relative to the lowest unit in the surveyed area) appears to be an important feature in Fig. 4, the average recorded elevation of dwellings (damaged and undamaged) from the Viña del Mar and Rocuant fires was higher than in other case studies. Since these accounted for a large fraction of damaged dwellings in the combined dataset, they may be driving the observed trend. In fact, although the summary of SHAP values suggests a correlation between higher elevations and damage, Fig. 5 shows that this relationship is inconsistent across the case studies, with several of them having a SHAP value of 0, likely influenced by their local characteristics (similar to the case of the slope variable). While elevation as a fire-vulnerability feature has been examined in the literature (see Andersen and Sugg, 2019, and Penman et al., 2019), these studies typically focus on large, geographical scales where elevation can influence fire-related factors like moisture and the type of vegetation, so their results are not directly comparable to our findings.
Regarding d_neigh (which corresponds to the distance to the closest neighbouring structure), we found that low values tend to diminish the odds of fire damage. Cohen (2000) highlighted that homes can be victims of wildland fire but also contribute to its propagation, especially when the distance between buildings is less than 40 m. This is also supported by Gibbons et al. (2012) and Penman et al. (2019), who suggested ensuring proper separation between houses (based on their findings in eastern Australia case studies). However, Papathoma-Köhle et al. (2022) stated that the presence of neighbouring buildings was not relevant in the construction of their physical vulnerability index (PVI), which was statistically developed from the outcomes of a July 2018 wildfire in Mati, Greece, and included 423 buildings. In this respect, other research shows that higher building densities might lead to a “protection” effect among houses. In line with this, our results for d_neigh can be related to Opie et al.'s (2014), which pointed out that areas with higher housing densities were less likely to be damaged during the 2009 wildfires in Bendigo, Australia. Similarly, drawing upon a study in south-eastern France, Lampin-Maillet et al. (2010) noted that fire ignition risk increased significantly when housing density decreased; therefore, they encouraged compact urban development and housing densification in the WUI.
To the best of our knowledge, the third most important feature, d_group (i.e. the distance of a housing unit to the nearest border of the dwelling group), has previously not been addressed in the literature. In this respect, our results show that shorter distances result in positive SHAP values, and the odds of material loss tend to increase if this distance is less than 40 m. This suggests that buildings located within a housing arrangement are less vulnerable than those along the perimeter. This further supports the argument of compact development as a protective measure.
Next, we focused on dist_veg, which measures the distance between each house and the closest patch of dense vegetation. As seen in Fig. 4, houses located shorter distances from vegetation have slightly higher odds of damage. A more disaggregated examination in Fig. 5 shows that this effect remains consistent up to distances of ∼ 60 m. Beyond this range, its effect on damage prediction becomes increasingly negative. This finding is consistent with the literature, which reports that reducing physical vulnerability through a “wildfire-defensible space” minimizes the probability of fire damage. Such spaces are characterized by the alteration (treatment, clearing, or reduction) of fuels and vegetation in the immediate vicinity of a structure. For example, Syphard et al. (2014), through regression analysis in their post-fire analysis of structures in San Diego county, California, suggested that defensible space distances of up to 30 m effectively prevent house destruction. Our capacity to identify this small-scale spatial effect in our data was hindered by the spatial resolution of the Sentinel-2 imagery (10 m) used in the mapping of vegetation. Additionally, Penman et al. (2019) suggested that the percentage of mapped forest within 100 m of an examined structure significantly influences the probability of fire damage. Similarly, dist_fire (i.e. the distance between an examined dwelling and the likely point of fire ignition) is an important factor. While its results appear more scattered, as shown in Fig. 5, they clearly demonstrate that proximity to the ignition point increases the probability of fire damage, which is an intuitive result. However, this variable demonstrated significant variability across our case studies, most likely due to local geophysical characteristics (topography, built environment) and the specific manner in which the fire began and spread.
As previously mentioned, in our model, the variables characterizing a dwelling's structural conditions had relatively less influence on damage classification than the spatial metrics mentioned above. Specifically, the contribution of the variable n_storeys to the SHAP values was close to zero. However, a few exceptions corresponding to high buildings (> 10 storeys) built from reinforced concrete (in compliance with the Chilean building code) consistently survived the fires. Regarding the floor_area variable, the overall trend showed a negative contribution to the damage prediction when surfaces were large (200 m2). This could be associated with higher income and therefore better construction conditions. Analogously, the analysis of the area_parcel_ratio suggests an association between the damage prediction and high ratios (i.e. dwellings with little open surrounding space), which are more typical of lower-income dwellings. Again, this is related to the concept of defensible space. However, the material variable had a negligible impact on damage classification. Although we found some indications that individual building attributes may be useful for characterizing vulnerability, the statistical analysis was hindered by the limited variability of our dataset, which predominately consisted of single-storey dwellings (∼ 88 %) built with light materials (∼ 79 %). For example, Papathoma-Köhle et al. (2022) used a more detailed characterization of structure type and roof material, which they identified as the two most relevant indicators of wildfire vulnerability. However, we were not able to confirm or test these results for the Chilean case with our current data. Regarding the number of storeys or building height, this metric has scarcely been examined in the literature, perhaps due to the same lack of data variability as in our case studies. Continued observation of WUI fires in future seasons may enable a statistically significant assessment of these features as vulnerability indicators. The preparedness variable, as per our definition (whether houses had managed surroundings to reduce vegetation and other potentially combustible materials), allowed only two answers, “yes” or “no” (see Fig. 5). Our data for this variable show that most of the houses with no preparedness had an increased likelihood of fire damage. The characteristics that we assigned to the preparedness variable relate to the definition of defensible space discussed above, for which there is a consensus regarding its importance in reducing fire vulnerability.
Lastly, the importance of the slope variable also appears to be significantly dependent on the specific study context, as shown by the scatterplot in Fig. 5. As a result, a relationship cannot be inferred between the probability of damage and the average terrain slope of each dwelling's footprint. In this regard, several authors have examined the impact of terrain slope on wildfire vulnerability. For example, Papathoma-Köhle et al. (2022) pointed out that this variable, alongside roof material and structural type, becomes the most relevant indicator for predicting wildfire vulnerability when values exceed 10°. Andersen and Sugg (2019) underlined a positive correlation between slope and wildfire risk. They also reported that the cases in which the opposite trend was observed may be related to increased exposure related to the populations' tendency to settle in terrains with gentler slopes. Finney et al. (2021) argued that wildfire can spread more rapidly on a steeper slope, implying a higher risk. These studies typically provided the source from which they extracted the slope values but did not delve into how they measured them.
In summary, our study aligns with previous research findings on the significance of different wildfire vulnerability indicators (e.g. dist_veg, dist_neigh, preparedness). However, in some cases, comparisons are limited by the volume and diversity of the data. These disparities in our analysis reveal the challenge of weighting the physical wildfire vulnerability indicators and extrapolating the selection to other regions and cases. Therefore, weighted indexes developed for specific geographic areas, whether based on one or a few large or small events, cannot be directly generalized to other regions, even if they share some geographical and environmental conditions. A first key step towards constructing consistent global or regional vulnerability indexes is to standardize the variables that may constitute them, as well as the spatial scales and methodologies applied in their measurement. This standardization could lead to the development of large and comprehensive datasets for statistical modelling purposes.
Lastly, our findings can contribute to improving current regulations for building design, construction, and urban planning in Chilean WUI areas. As González-Mathiesen and March (2018) point out, countries such as Australia, France, Spain, and the USA have implemented policies and guidelines to enhance the resilience of sites and subdivisions in wildfire-prone areas, aiming to increase both resistance and response capacities. In contrast, current Chilean spatial planning schemes do not adequately address wildfire risk reduction. While national-level planning regulations enable generic disaster risk reduction (with a focus on hazards rather than on vulnerability), it is important to note that wildfire is not explicitly included as a threat. While some municipalities do incorporate wildfire risk management in their local plans, this does not occur systematically throughout the country (González-Mathiesen and March, 2023).
This study presents a local-scale analysis of the impact of WUI fires on individual dwellings as a function of their physical characteristics, their spatial arrangement relative to the urban settlement and the natural environment, and the availability and accessibility of fire suppression and emergency management resources. The aim is to enhance our understanding of risk profiles in exposed WUI areas by identifying and measuring key parameters of physical vulnerability that can be systematically surveyed and assessed. This contribution will enable continued risk monitoring and provide insights for the design, planning, and governance of WUI areas in Chile.
To conduct this analysis, we developed a mixed-method approach that combines field surveys, remote-sensed satellite and drone imagery (captured in the field in the aftermath of destructive WUI wildfires), and GIS-based analysis of the collected data, followed by a multivariate classification analysis. The methodology was applied to seven WUI fire case studies that occurred in central Chile between 2019 and 2022 and led to the generation of a detailed georeferenced dataset of 729 dwellings that experienced partial or total damage. For each of these dwellings, we assessed 16 physical and spatial attributes that could potentially influence the damage outcome in the event of exposure to wildfires. Additionally, we constructed a similar dataset for dwellings that survived the fires with no damage. We proposed various spatial methods to select such units to test the performance of classification models for different delimitations of the exposed area. We concluded that the definition that represents the best compromise between class imbalance and recall is a 100 m buffer around the smallest convex polygon enclosing the impacted dwellings, referred to as CH100. To the best of our knowledge, these data represent the first detailed characterization of WUI settlements in Latin America and with a volume and diversity that rival or surpass similar studies conducted in Greece, the USA, and Australia.
With the CH100 labelled dataset as input, we trained a LightGBM binary classification model (damage/no damage) and used SHAP values to explain its results and to assess the relative importance of 16 physical dwelling parameters as indicators of wildfire vulnerability. Our findings show that the group of variables describing the spatial arrangement of dwellings has more impact on damage prediction compared to other features related to the structural and preparedness conditions of the individual units or to fire suppression resources. Specifically, our results show that the odds of damage are reduced when the dwelling's distance to its closest neighbour is under 40 m, the distance to vegetation is over ∼ 60 m, when it is a long distance from the border of the dwelling group, and when it is a long distance from the likely fire ignition point. The analysis of SHAP dependence values for variables characterizing individual dwellings (n_storeys, material, floor_area, preparedness) provides some indications that attributes typically associated with less affluent homes (e.g. light material, small floor area, lack of preparedness) may increase the likelihood of damage prediction. However, more data are required to robustly confirm this association.
While our data show clear correlations between the probability of damage and some of the variables (e.g. distance to the nearest border of the dwelling group, distance to dense vegetation), others have scattered results that may be influenced by each case study's specific context.
This approach allowed us to assess the relative importance of each parameter as an indicator of wildfire vulnerability in the WUI. These findings could be used to develop risk mitigation strategies for both the built structures and the broader territorial area and to enhance current regulations for building design, construction, and urban planning in Chilean WUI areas, which are currently underdeveloped.
All code generated in this study are available upon request.
All data generated in this study are available upon request. The processed data for all case studies are available for download in Aguirre et al. (2024, https://doi.org/10.5281/zenodo.10798213).
PA: conceptualization, funding acquisition, methodology, writing of the original draft. JL: conceptualization, funding acquisition, methodology, writing of the original draft. CGM: conceptualization, writing of the original draft. RR, MP: data collection and curation, formal analysis. AO: data curation, formal analysis, software
The contact author has declared that none of the authors has any competing interests.
Publisher’s note: Copernicus Publications remains neutral with regard to jurisdictional claims made in the text, published maps, institutional affiliations, or any other geographical representation in this paper. While Copernicus Publications makes every effort to include appropriate place names, the final responsibility lies with the authors.
This article is part of the special issue “Multi-risk assessment in the Andes region”. It is not associated with a conference.
This work was funded by the National Research and Development Agency of Chile (ANID) through FONDECYT grants 1191543 and 1522A0005 FONDAP 2022 and the National Center for Artificial Intelligence (CENIA FB210017, Basal ANID).
This research has been funded by the Research Center for Integrated Disaster Risk Management (CIGIDEN), ANID/1522A0005 FONDAP 2022, and by research grant ANID/FONDECYT 1191543. Paula Aguirre also received funding from the National Center for Artificial Intelligence (CENIA FB2100017).
This paper was edited by Hannes Taubenböck and reviewed by Michael Nolde and one anonymous referee.
Aguirre, P., León, J., Román, R., and Penas, M.: Damage cadasters for wildland-urban interface fires in Chile, 2019–2022, Zenodo [data set], https://doi.org/10.5281/zenodo.10798213, 2024.
AIDR: Land Use Planning for Disaster Resilient Communities, Australia, https://knowledge.aidr.org.au/resources/handbook-land-use-planning/ (last access: 23 April 2024), 2020.
Andersen, L. M. and Sugg, M. M.: Geographic multi-criteria evaluation and validation: A case study of wildfire vulnerability in Western North Carolina, USA following the 2016 wildfires, Int. J. Disaster Risk Re., 39, 101123, https://doi.org/10.1016/j.ijdrr.2019.101123, 2019.
Arana, M. T., Casagrande, A., Cavieres, A., Espejo, S., Gilabert, H., and León, J.: Prevención de incendios forestales: propuestas para una mirada más efectiva e integral, Centro de Políticas Públicas UC, Chile, https://politicaspublicas.uc.cl/web/content/uploads/2018/12/PDF-Prevencion-de-incendios-3.pdf (last access: 23 April 2024), 2018.
Atkinson, D., Chladil, M., Janssen, V., and Lucieer, A.: Implementation of quantitative bushfire risk analysis in a GIS environment, Int. J. Wildland Fire, 19, 649, https://doi.org/10.1071/WF08185, 2010.
Bar Massada, A., Radeloff, V. C., Stewart, S. I., and Hawbaker, T. J.: Wildfire risk in the wildland–urban interface: A simulation study in northwestern Wisconsin, Forest Ecol. Manag., 258, 1990–1999, https://doi.org/10.1016/j.foreco.2009.07.051, 2009.
Bowman, D. M. J. S., Williamson, G. J., Abatzoglou, J. T., Kolden, C. A., Cochrane, M. A., and Smith, A. M. S.: Human exposure and sensitivity to globally extreme wildfire events, Nat. Ecol. Evol., 1, 58, https://doi.org/10.1038/s41559-016-0058, 2017.
Butt, A., Buxton, M., Haynes, R., and Lechner, A.: Peri-urban growth, planning and bushfire in the Melbourne city-region, in: 4th State of Australian Cities Conference, Perth, Australia, ISBN 1863081569, 2009.
Caggiano, M. D., Hawbaker, T. J., Gannon, B. M., and Hoffman, C. M.: Building Loss in WUI Disasters: Evaluating the Core Components of the Wildland–Urban Interface Definition, Fire, 3, 73, https://doi.org/10.3390/fire3040073, 2020.
Calkin, D., Owen Price, O., and Salis, M.: WUI risk assessment at the landscape level, in: Encyclopedia of Wildfires and Wildland-Urban Interface (WUI) Fires, edited by: Manzello, S. L., Springer International Publishing, Cham, 1184–1195, https://doi.org/10.1007/978-3-319-52090-2, 2019.
Castillo, M.: Integración de variables y criterios territoriales como apoyo a la protección contra incendios forestales. Area piloto: Valparaiso – Chile central, PhD thesis, Universidad de Cordoba, España, http://hdl.handle.net/10396/9284 (last access: 23 April 2024), 2013.
Castillo, M., Julio-Alvear, G., and Garfias, R.: Current Wildfire Risk Status and Forecast in Chile: Progress and Future Challenges., in: Wildfire Hazards, Risks, and Disasters, edited by: Paton, D., Shroder, J. F., McCaffrey, S., and Tedim, F., Elsevier Science, 59–75, https://doi.org/10.1016/B978-0-12-410434-1.00004-X, 2014.
Chen, K., Blong, R., and Jacobson, C.: Towards an integrated approach to natural hazards risk assessment using GIS: with reference to bushfires, Environ. Manage., 31, 546–560, https://doi.org/10.1007/s00267-002-2747-y, 2003.
Cohen, J. D.: Preventing Disaster: Home Ignitability in the Wildland-Urban Interface, J. Forest, 98, 15–21, 2000.
CONAF: Incendios forestales en Chile: Situación de incendios vigentes, https://www.conaf.cl/incendios-forestales/incendios-forestales-en-chile/estadistica-de-ocurrencia-diaria/ (last access: 31 August 2023), 2023a.
CONAF: Incendios forestales en Chile: Estadísticas históricas, https://www.conaf.cl/incendios-forestales/incendios-forestales-en-chile/estadisticas-historicas/ (last access: 31 August 2023), 2023b.
Cooperativa.cl: Incendio en Melipilla ha consumido sobre 600 hectáreas y dañado cerca de 40 casas, https://cooperativa.cl/noticias/pais/desastres-naturales/incendios-forestales/incendio-en-melipilla-ha-consumido-sobre-600-hectareas-y-danado-cerca-de/2022-12-12/110511.html (last access: 31 August 2023), 2022.
Coppola, D. P.: The management of disasters, in: Introduction to International Disaster Management, Third Edition, Elsevier, 1–39, https://doi.org/10.1016/C2014-0-00128-1, 2015.
De Fioravante, P., Luti, T., Cavalli, A., Giuliani, C., Dichicco, P., Marchetti, M., Chirici, G., Congedo, L., and Munafò, M.: Multispectral Sentinel-2 and SAR Sentinel-1 Integration for Automatic Land Cover Classification, Land (Basel), 10, 611, https://doi.org/10.3390/land10060611, 2021.
Dossi, S., Messerschmidt, B., Ribeiro, L. M., Almeida, M., and Rein, G.: Relationships between building features and wildfire damage in California, USA and Pedrógão Grande, Portugal, Int. J. Wildland Fire, 32, 296–312, https://doi.org/10.1071/WF22095, 2022.
Drusch, M., Del Bello, U., Carlier, S., Colin, O., Fernandez, V., Gascon, F., Hoersch, B., Isola, C., Laberinti, P., Martimort, P., Meygret, A., Spoto, F., Sy, O., Marchese, F., and Bargellini, P.: Sentinel-2: ESA's Optical High-Resolution Mission for GMES Operational Services, Remote Sens. Environ., 120, 25–36, https://doi.org/10.1016/j.rse.2011.11.026, 2012.
DTPLI: Bushfire Management Overlay Mapping Methodology and Criteria, Planning Advisory Note 46, Melbourne, 2013.
Ellis, T. M., Bowman, D. M. J. S., Jain, P., Flannigan, M. D., and Williamson, G. J.: Global increase in wildfire risk due to climate-driven declines in fuel moisture, Glob. Change Biol., 28, 1544–1559, https://doi.org/10.1111/GCB.16006, 2022.
EMOL: Un fallecido, 46 viviendas destruidas y 184 personas damnificadas: Balance del incendio forestal en Melipilla, https://www.emol.com/noticias/Nacional/2022/12/13/1080891/catastro-incendio-melipilla.html (last access: 23 April 2024), 2022.
Finney, M., McAllister, S., Grumstrup, T., and Forthofer, J.: Wildland Fire Behaviour, CSIRO Publishing, https://doi.org/10.1071/9781486309092, 2021.
Galiana-Martín, L.: Spatial planning experiences for vulnerability reduction in the wildland-urban interface in Mediterranean European countries, Eur. Countrys., 9, 577–593, https://doi.org/10.1515/euco-2017-0034, 2017.
Garfias, R., Castillo, M., Ruiz, F., Julio, G., Quintanilla, V., and Antúnez, J.: Caracterización socioeconómica de la población en áreas de riesgos de incendios forestales. Estudio de caso: interfaz urbano-forestal, provincia de Valparaíso. Chile central, Territorium, 19, 101–109, https://doi.org/10.14195/1647-7723_19_12, 2012.
Gibbons, P., van Bommel, L., Gill, A. M., Cary, G. J., Driscoll, D. A., Bradstock, R. A., Knight, E., Moritz, M. A., Stephens, S. L., and Lindenmayer, D. B.: Land Management Practices Associated with House Loss in Wildfires, PLoS ONE, 7, e29212, https://doi.org/10.1371/journal.pone.0029212, 2012.
Gill, A. M. and Stephens, S. L.: Scientific and social challenges for the management of fire-prone wildland–urban interfaces, Environ. Res. Lett., 4, 34014, https://doi.org/10.1088/1748-9326/4/3/034014, 2009.
Goldammer, J., Mitsopoulos, I., Mallinis, G., and Woolf, M.: Wildfire Hazard and Risk Assessment, in: Words into Action Guidelines: National Disaster Risk Assessment Hazard Specific Risk Assessment, UNISDR, 70–79, https://www.unisdr.org/files/52828_06wildfirehazardandriskassessment.pdf (last access: 23 April 2024), 2017.
Gómez-González, S., Ojeda, F., and Fernandes, P. M.: Portugal and Chile: Longing for sustainable forestry while rising from the ashes, Environ. Sci. Policy, 81, 104–107, https://doi.org/10.1016/j.envsci.2017.11.006, 2018.
González, M. E., Lara, A., Urrutia, R., and Bosnich, J.: Cambio climático y su impacto potencial en la ocurrencia de incendios forestales en la zona centro-sur de Chile (33°–42° S), Bosque (Valdivia), 32, 215–219, https://doi.org/10.4067/S0717-92002011000300002, 2011.
Gonzalez-Mathiesen, C. and March, A.: Establishing design principles for wildfire resilient urban planning, Plan. Pr. Res., 33, 97–119, https://doi.org/10.1080/02697459.2018.1429787, 2018.
González-Mathiesen, C. and March, A.: Long-established rules and emergent challenges: spatial planning and wildfires in Chile, Int. Plan. Stud., 28, 37–53, https://doi.org/10.1080/13563475.2022.2136629, 2023.
Google Earth: https://www.google.com/earth, last access: 23 April 2024.
Harris, C. R., Millman, K. J., van der Walt, S. J., Gommers, R., Virtanen, P., Cournapeau, D., Wieser, E., Taylor, J., Berg, S., Smith, N. J., Kern, R., Picus, M., Hoyer, S., van Kerkwijk, M., Brett, M., Haldane, A., Fernández del Río, J., Wiebe, M., Peterson, P., Gérard-Marchant, P., Sheppard, K., Reddy, T., Weckesser, W., Abbasi, H., Gohlke, C., and Oliphant, T.: Array programming with NumPy, Nature, 585, 357–362, https://doi.org/10.1038/s41586-020-2649-2, 2020.
ISO 31000: ISO 31000:2018, Risk management – Guidelines, https://webstore.ansi.org/standards/asse/ansiasspiso310002018? gad_source=1&gclid=CjwKCAjwuJ2xBhA3EiwAMVjkVON httgIVfdvsNAIdt0iVi3tqWkFqWDLN3Dbf6l_saw9Ou5TU-KR1RoC-L4QAvD_BwE (last access: 23 April 2024), 2018.
James, G., Witten, D., Hastie, T., and Tibshirani, R.: An Introduction to Statistical Learning, Springer US, New York, NY, https://doi.org/10.1007/978-1-0716-1418-1, 2013.
also Jappiot, M., González-Olabarria, J. R., Lampin-Maillet, C., and Borgniet, L.: Evaluación temporal y espacial del riesgo de incendios forestales, in: Convivir con los incendios forestales: Lo que nos revela la ciencia, edited by: Birot, Y., European Forest Institute, Joensuu, Finland, ISBN 978-952-5453-52-2, 2009.
Jones, M.: Climate change as an enabler of wildfire, in: The DRIVER+ Project Report, 12–17, https://online.fliphtml5.com/zjvxu/kbwq/#p=1 (last access: 23 April 2024), 2020.
Ke, G., Meng, Q., Finley, T., Wang, T., Chen, W., Ma, W., Ye, Q., and Liu, T.-Y.: LightGBM: A Highly Efficient Gradient Boosting Decision Tree, in: Advances in Neural Information Processing Systems, Curran Associates Inc., https://dl.acm.org/doi/10.5555/3294996.3295074, 2017.
Knapp, E. E., Valachovic, Y. S., Quarles, S. L., and Johnson, N. G.: Housing arrangement and vegetation factors associated with single-family home survival in the 2018 Camp Fire, California, Fire Ecol., 17, 25, https://doi.org/10.1186/s42408-021-00117-0, 2021.
Lampin-Maillet, C., Jappiot, M., Long, M., Bouillon, C., Morge, D., and Ferrier, J.-P.: Mapping wildland-urban interfaces at large scales integrating housing density and vegetation aggregation for fire prevention in the South of France, J. Environ. Manage., 91, 732–741, https://doi.org/10.1016/j.jenvman.2009.10.001, 2010.
La Tercera: Gobierno sospecha que incendio en quillon fue intencional, https://www.latercera.com/diario-impreso/gobierno-sospecha-que-incendio-en-quillon-fue-intencional/# (last access: 23 April 2024), 2012.
Lu, Y., Carter, L., and Showalter, P. S.: Wildfire Risk Analysis at the Wildland Urban Interface in Travis County, Texas, in: Geospatial Techniques in Urban Hazard and Disaster Analysis, Springe, Dordrecht, 203–227, https://doi.org/10.1007/978-90-481-2238-7_10, 2009.
Lundberg, S. M. and Lee, S.-I.: A Unified Approach to Interpreting Model Predictions, in: Advances in Neural Information Processing Systems 30, Curran Associates Inc., 31st Conference on Neural Information Processing Systems (NIPS 2017), Long Beach, CA, USA, 4765–4774, https://proceedings.neurips.cc/paper_files/paper/2017/file/8a20a8621978632d76c43dfd28b67767-Paper.pdf (last access: 23 April 2024), 2017.
March, A., Riddell, G., de Moraes, L. N., Stanley, J., van Delden, H., Beilin, R., Dovers, S., and Maier, H. R.: Urban planning capabilities for bushfire: treatment categories and scenario testing, Australian Journal of Emergency Management, 35, 32–40, 2020.
Mitsopoulos, I., Mallinis, G., and Arianoutsou, M.: Wildfire Risk Assessment in a Typical Mediterranean Wildland–Urban Interface of Greece, Environ. Manage., 55, 900–915, https://doi.org/10.1007/s00267-014-0432-6, 2015.
Moritz, M. A., Batllori, E., Bradstock, R. A., Gill, A. M., Handmer, J., Hessburg, P. F., Leonard, J., McCaffrey, S., Odion, D. C., Schoennagel, T., and Syphard, A. D.: Learning to coexist with wildfire, Nature, 515, 58–66, https://doi.org/10.1038/nature13946, 2014.
Mosteller, F. and Tukey, J. W.: Data analysis, including statistics, in: Handbook of Social Psychology, edited by: Lindzey, G. and Aronson, E., Addison-Wesley Pub. Co., Reading, Mass., ISBN 0470137495, 1968.
Oom, D., de Rigo, D., Pfeiffer, H., Branco, A., Ferrari, D., Grecchi, R., Artés-Vivanco, T., Houston Durrant, T., Boca, R., Maianti, P., Libertá, G., and San-Miguel-Ayanz, J.: Pan-European wildfire risk assessment, Publications Office of the European Union, https://doi.org/10.2760/9429, 2022.
Opie, K., March, A., Leonard, J., and Newman, G.: Indicators of Fire Vulnerability: Risk Factors in Victorian Settlements, CSIRO, Melbourne, https://msd.unimelb.edu.au/__data/assets/pdf_file/0005/2590628/Indices-report-Final-2014-April.pdf (last access: 23 April 2024), 2014.
pandas Developer Team: pandas, Zenodo [code], https://doi.org/10.5281/zenodo.3509134, 2020.
Papathoma-Köhle, M., Schlögl, M., Garlichs, C., Diakakis, M., Mavroulis, S., and Fuchs, S.: A wildfire vulnerability index for buildings, Sci. Rep., 12, 6378, https://doi.org/10.1038/s41598-022-10479-3, 2022.
Pedregosa, F., Varoquaux, G., Gramfort, A., Michel, V., Thirion, B., Grisel, O., Blondel, M., Müller, A., Nothman, J., Louppe, G., Prettenhofer, P., Weiss, R., Dubourg, V., Vanderplas, J., Passos, A., Cournapeau, D., Brucher, M., Perrot, M., and Duchesnay, É.: Scikit-learn: Machine Learning in Python, J. Mach. Learn. Res., 12, 2825–2830, 2012.
Penman, S. H., Price, O. F., Penman, T. D., and Bradstock, R. A.: The role of defensible space on the likelihood of house impact from wildfires in forested landscapes of south eastern Australia, Int. J. Wildland Fire, 28, 4–14, https://doi.org/10.1071/WF18046, 2019.
Reszka, P. and Fuentes, A.: The great Valparaiso fire and fire safety management in Chile, Fire Technol., 51, 753–758, https://doi.org/10.1007/s10694-014-0427-0, 2015.
Romero-Calcerrada, R., Novillo, C. J., Millington, J. D. A., and Gomez-Jimenez, I.: GIS analysis of spatial patterns of human-caused wildfire ignition risk in the SW of Madrid (Central Spain), Landscape Ecol., 23, 341–354, https://doi.org/10.1007/s10980-008-9190-2, 2008.
Rouse, J. W., Hass, R. H., Schell, J. A., and Deering, D. W.: Monitoring vegetation systems in the Great Plains with ERTS, Third Earth Resources Technology Satellite-1 Symposium. Volume 1: Technical Presentations, section A, NASA SP-351, https://ntrs.nasa.gov/citations/19740022614 (last access: 23 April 2024), 1973.
Sakellariou, S., Sfougaris, A., Christopoulou, O., and Tampekis, S.: Integrated wildfire risk assessment of natural and anthropogenic ecosystems based on simulation modeling and remotely sensed data fusion, Int. J. Disast. Risk Re., 78, 103129, https://doi.org/10.1016/j.ijdrr.2022.103129, 2022.
San-Miguel-Ayanz, J., Chuvieco, E., Handmer, J., Moffat, A., Montiel-Molina, C., Sandahl, L., and Viegas, D.: Climatological risk: wildfires, in: Science for disaster risk management 2017: knowing better and losing less, edited by: Poljanšek, K., Marín Ferrer, M., and De Groeve, T. C. I., Publications Office of the European Union, 294–305, https://drmkc.jrc.ec.europa.eu/portals/0/Knowledge/ScienceforDRM/ch03_s03/ch03_s03_subch0310.pdf (last access: 23 April 2024), 2017.
Sarricolea, P., Serrano-Notivoli, R., Fuentealba, M., Hernández-Mora, M., de la Barrera, F., Smith, P., and Meseguer-Ruiz, Ó.: Recent wildfires in Central Chile: Detecting links between burned areas and population exposure in the wildland urban interface, Sci. Total Environ., 706, 135894, https://doi.org/10.1016/j.scitotenv.2019.135894, 2020.
SENAPRED: Monitoreo Incendio Forestal – Comuna Viña del Mar, https://web.senapred.cl/informate_conte/monitoreo-incendio-forestal-comuna-vina-del-mar (last access: 23 April 2024), 2023.
Sirca, C., Casula, F., Bouillon, C., García, B. F., Fernández Ramiro, M. M., Molina, B. V., and Spano, D.: A wildfire risk oriented GIS tool for mapping Rural-Urban Interfaces, Environ. Modell. Softw., 94, 36–47, https://doi.org/10.1016/J.ENVSOFT.2017.03.024, 2017.
Syphard, A. D., Keeley, J. E., Massada, A. B., Brennan, T. J., and Radeloff, V. C.: Housing arrangement and location determine the likelihood of housing loss due to wildfire, PLoS One, 7, e33954, https://doi.org/10.1371/journal.pone.0033954, 2012.
Syphard, A. D., Brennan, T. J., and Keeley, J. E.: The role of defensible space for residential structure protection during wildfires, Int. J. Wildland Fire, 23, 1165, https://doi.org/10.1071/WF13158, 2014.
Tampekis, S., Sakellariou, S., Palaiologou, P., Arabatzis, G., Kantartzis, A., Malesios, C., Stergiadou, A., Fafalis, D., and Tsiaras, E.: Building wildland–urban interface zone resilience through performance-based wildfire engineering. A holistic theoretical framework, EuroMediterr J. Environ. Integr., 8, 675–689, https://doi.org/10.1007/s41207-023-00385-z, 2023.
Tedim, F., Leone, V., Amraoui, M., Bouillon, C., Coughlan, M. R., Delogu, G. M., Fernandes, P. M., Ferreira, C., McCaffrey, S., McGee, T. K., Parente, J., Paton, D., Pereira, M., Riberiro, L. M., Viegas, D. X., and Xanthopoulos, G.: Defining extreme wildfire events: Difficulties, challenges, and impacts, Fire, 1, 9, https://doi.org/10.3390/fire1010009, 2018.
Úbeda, X. and Sarricolea, P.: Wildfires in Chile: A review, Global Planet. Change, 146, 152–161, https://doi.org/10.1016/j.gloplacha.2016.10.004, 2016.
UNISDR: UNISDR terminology on disaster risk reduction, Geneva, https://www.undp.org/sites/g/files/zskgke326/files/migration/ge/GE_isdr_terminology_2009_eng.pdf (last access: 23 April 2024), 2009.
Urrutia-Jalabert, R., González, M. E., González-Reyes, Á., Lara, A., and Garreaud, R.: Climate variability and forest fires in central and south-central Chile, Ecosphere, 9, e02171, https://doi.org/10.1002/ecs2.2171,2018.
Wildfire Risk – Understand Risk: Understand Risk, https://wildfirerisk.org/understand-risk/, last access: 21 January 2024.
Zhu, Z., Woodcock, C. E., Rogan, J., and Kellndorfer, J.: Assessment of spectral, polarimetric, temporal, and spatial dimensions for urban and peri-urban land cover classification using Landsat and SAR data, Remote Sens. Environ., 117, 72–82, https://doi.org/10.1016/j.rse.2011.07.020, 2012.
Zong, X., Tian, X., and Fang, L.: Assessing wildfire risk and mitigation strategies in Qipanshan, China, Int. J. Disast. Risk Re., 80, 103237, https://doi.org/10.1016/j.ijdrr.2022.103237, 2022.