the Creative Commons Attribution 4.0 License.
the Creative Commons Attribution 4.0 License.
 | 24 Apr 2024
Characteristics of debris-flow-prone watersheds and debris-flow-triggering rainstorms following the Tadpole Fire, New Mexico, USA
Luke A. McGuire
Francis K. Rengers
Ann M. Youberg
Alexander N. Gorr
Olivia J. Hoch
Rebecca Beers
Ryan Porter
Moderate- or high-severity fires promote increases in runoff and erosion, leading to a greater likelihood of extreme geomorphic responses, including debris flows. In the first several years following fire, the majority of debris flows initiate when runoff rapidly entrains sediment on steep slopes. From a hazard perspective, it is important to be able to anticipate when and where watershed responses will be dominated by debris flows rather than flood flows. Rainfall intensity averaged over a 15 min duration, I15, in particular, has been identified as a key predictor of debris flow likelihood. Developing effective warning systems and predictive models for post-fire debris flow hazards therefore relies on high-temporal resolution rainfall data at the time debris flows initiate. In this study, we documented the geomorphic response of a series of watersheds following a wildfire in western New Mexico, USA, with an emphasis on constraining debris flow timing within rainstorms to better characterize debris-flow-triggering rainfall intensities. We estimated temporal changes in soil hydraulic properties and ground cover in areas burned at different severities over >2 years to offer explanations for observed differences in spatial and temporal patterns in debris flow activity. We observed 16 debris flows, all of which initiated during the first several months following the fire. The average recurrence interval of the debris-flow-triggering I15 is 1.3 years, which highlights the susceptibility of recently burned watersheds to runoff-generated debris flows in this region. All but one of the debris flows initiated in watersheds burned primarily at moderate or high soil burn severity. Since soil hydraulic properties appeared to be relatively resilient to burning, we attribute reduced debris flow activity at later times to decreases in the fraction of bare ground. Results provide additional constraints on the rainfall characteristics that promote post-fire debris flow initiation in a region where fire size and severity have been increasing.
- Article
(9529 KB) - Full-text XML
-
Supplement
(1014 KB) - BibTeX
- EndNote


Changes to canopy and ground cover, soil hydraulic properties, and soil erodibility following fire can promote order-of-magnitude increases in runoff and sediment yield relative to similar unburned areas (Robichaud et al., 2016). As a consequence, burned watersheds are more susceptible to debris flows (Wells, 1987; Kean et al., 2011). Post-fire debris flows (PFDFs) often initiate in the first several years following fire when runoff rapidly entrains sediment (DeGraff et al., 2015; Parise and Cannon, 2012; Graber et al., 2023). PFDFs that initiate from surface water runoff have been documented in a range of geographic and climate regions (Wall et al., 2020; Nyman et al., 2011; Gabet and Bookter, 2008; Larsen et al., 2006; Raymond et al., 2020; Kean et al., 2011; McGuire et al., 2021; Esposito et al., 2023; García-Ruiz et al., 2013; Diakakis et al., 2023; Conedera et al., 2003). Debris flows pose a hazard to people and infrastructure downstream of burned areas (Kean et al., 2019; Lancaster et al., 2021) and may also impact water quality (Langhans et al., 2016) and fish habitat (Smith et al., 2021). As the western USA, a region susceptible to PFDF hazards (Staley et al., 2020), experiences increases in both area burned (Holden et al., 2018) and the frequency of extreme precipitation (Kirchmeier-Young and Zhang, 2020), improving our ability to identify when and where debris flows are most likely to initiate within burned areas will help to better assess hazards and prioritize mitigation efforts.
One component of PFDF hazard assessments includes identifying watersheds that are most susceptible to debris flows (Tillery and Matherne, 2012). It is important to identify watersheds that are susceptible to debris flows since the high sediment concentrations and peak discharges associated with debris flows may require additional or different strategies relative to those used to mitigate negative effects of flood flows. The high sediment concentration in debris flows changes their flow behavior, resulting in coarse-grained flow fronts with peak discharges and flow depths that can exceed those expected from water-dominated flows (Kean et al., 2016). Empirical models designed to predict PFDF likelihood based on the physiographic characteristics of a burned watershed illustrate that likelihood increases with metrics related to soil burn severity, watershed steepness, and rainfall intensity (Cannon et al., 2010; Staley et al., 2017). Rainfall intensities averaged over relatively short durations (i.e., ≤ 30 min) are the best predictors of PFDF response (Staley et al., 2013). Soil burn severity is relevant since the impacts of fire on vegetation; ground cover; and soil properties, particularly soil erodibility (Vieira et al., 2015), are often most accentuated in areas burned at moderate or high severity. Such impacts may include reductions in canopy interception (Stoof et al., 2012), water storage in litter and duff layers (Robichaud et al., 2016), surface roughness (Stoof et al., 2015), soil infiltration capacity (Ebel and Martin, 2017), and critical thresholds for sediment entrainment (Moody et al., 2005). Areas burned at moderate or high severity are therefore particularly susceptible to infiltration-excess overland flow during short-duration, high-intensity bursts of rainfall, which can lead to extreme erosion and debris flow responses. Post-fire observations that identify which watersheds produce PFDFs are critical for improving conceptual and empirical models for PFDF likelihood.
In addition to identifying watersheds that are susceptible to debris flows, an additional element of many PFDF hazard assessments involves estimating the rainfall characteristics likely to produce debris flows (Staley et al., 2017). Rainfall intensity–duration (ID) thresholds, which have traditionally been defined regionally based on inventories of rainstorms that have produced debris flows, are a practical and reliable approach for determining the rainstorms likely to produce PFDFs (Cannon et al., 2008; Staley et al., 2013; Raymond et al., 2020; Esposito et al., 2023; McGuire and Youberg, 2020). The empirical models developed by Staley et al. (2017) using data from the western USA can also be used to define a watershed-specific rainfall ID threshold based on soil, terrain, and burn severity characteristics. Regardless of the methodology used to define a rainfall ID threshold, a key source of uncertainty involves the unknown timing of debris flows within rainstorms and the implications for determining debris-flow-triggering rainfall intensities. Debris flows may initiate in response to rainfall intensities that are substantially lower than the peak rainfall intensity observed during a rainstorm (Staley et al., 2013; Raymond et al., 2020). However, in lieu of real-time measurements that constrain the timing of debris flows within a storm, a common assumption is that the rainfall intensity associated with debris flow initiation is equal to the most intense rainfall observed during the debris-flow-producing storm. Developing rainfall ID thresholds assuming that peak rainstorm intensity and debris-flow-triggering intensities are equal can result in overestimates of ID thresholds (Raymond et al., 2020), which could lead to an increase in false negatives (i.e., rainfall remains below the threshold, but a debris flow is observed). Observations that constrain the timing of PFDFs within rainstorms are therefore especially valuable for improving estimates of the rainfall intensities and durations required to produce debris flow responses.
Past work demonstrates a number of similarities in the factors that promote PFDF initiation across geographic and climate regions, including the importance of rainfall intensity over durations of less than 30 min (Raymond et al., 2020; Friedman and Santi, 2019; Kean et al., 2011; Staley et al., 2013; Esposito et al., 2023; McGuire et al., 2021) and presence of steep slopes burned at moderate or high soil burn severity (Cannon et al., 2010; Staley et al., 2017), but it also highlights key differences. Site-specific fire impacts, in combination with local terrain properties and rainfall climatology, modulate a recently burned landscapes' response to rainfall, with implications for debris flow initiation. For example, dry ravel is an important driver of PFDFs in the Transverse Ranges of southern California (DiBiase and Lamb, 2020) but is generally absent in burned sites that produce debris flows in Arizona (Raymond et al., 2020) and New Mexico (McGuire and Youberg, 2020). Following wildfire in the San Gabriel Mountains, dry ravel transports sediment stored in dams behind vegetation on steep hillslopes down into the channel network where it provides a relatively fine and cohesionless source of sediment for debris flows (Florsheim et al., 1991; Lamb et al., 2011; Palucis et al., 2021; DiBiase and Lamb, 2020). PFDFs in the Transverse Ranges are often associated with cool-season precipitation, especially short-duration (≤ 30 min) bursts of intense rainfall that accompany longer-duration atmospheric-river events (Oakley et al., 2017). In contrast to sites where dry ravel plays a substantial role, McGuire and Youberg (2020) documented 24 debris flows following a fire in the Tularosa Mountains of western New Mexico, where dry ravel was not observed and sediment was eroded primarily from cohesive soils and colluvium stored in unchannelized valley bottoms during short-duration, convective rainstorms associated with the North American monsoon. Given the increases observed in the number and severity of fires in New Mexico (Singleton et al., 2019), efforts to quantify the characteristics of debris-flow-triggering rainfall in this region and explore differences and similarities with other regions of the southwestern USA would provide valuable decision-support science.
Similarly, there are complex and site-specific relationships between soil burn severity and the vegetation, ground cover, and soil properties known to affect PFDF initiation processes. While soil water repellency has received substantial attention for its potential to increase runoff, sediment yield, and debris flow activity following fire (e.g., Scott and van Wyk, 1990; Wells, 1987), increases in runoff and debris flow activity also occur in areas burned at moderate to high severity despite increases in soil infiltration capacity relative to nearby unburned soils (Raymond et al., 2020). In other cases, a combination of fire-induced changes have been implicated in contributing to increased debris flow susceptibility in areas burned at moderate to high severity, including reductions in interception, hydraulic roughness, infiltration capacity, and soil cohesion (McGuire and Youberg, 2020; McGuire et al., 2021; Peduto et al., 2022). Although the fire-related impacts that are most important are site specific, identifying fire-related impacts that most commonly increase debris flow activity supports the production of more generalizable models to assess post-fire debris flow hazards. Pairing post-fire debris flow observations with measurements of fire-related impacts in areas burned at different severities could help to identify the fire-related impacts that play the most important roles in promoting debris flow activity.
In addition to varying spatially with soil burn severity, the effects of fire on soil and vegetation change with time since fire, which in turn influences runoff and sediment transport processes, including debris flow potential (Ebel, 2020; Hoch et al., 2021; Thomas et al., 2021). The potential for PFDFs generated by runoff is greatest immediately following fire, yet effects of fire on soil hydraulic properties and vegetation may persist and continue to modify debris flow potential for years (Ebel and Martin, 2017; Hoch et al., 2021; Thomas et al., 2021). DeGraff et al. (2015) analyzed a database of 75 PFDFs throughout the western USA to determine that 71 % of PFDFs occurred within the first 6 months following fire and 85 % within 12 months. While the decrease in debris flow observations after more than 1 year of recovery is encouraging from a hazard perspective, it also means that there is a general paucity of data available for developing empirical models for PFDF likelihood throughout the recovery period. Monitoring efforts that extend beyond the first year following fire will lead to better constraints on changes in rainfall ID thresholds for PFDFs over time and will support the development of data-driven models for PFDF likelihood that extend through the window of disturbance following fire.
In this study, we take advantage of a natural experiment set up by the 2020 Tadpole Fire, which burned over steep terrain in western New Mexico, to investigate PFDF processes. The main objectives of this study were to (1) monitor a series of burned watersheds to assess spatial variations in debris flow activity and the temporal persistence of debris flow activity during the first three monsoon seasons (approximately 2.5 years) following the fire, (2) quantify differences in soil hydraulic properties and ground cover over time in areas with different soil burn severity to help explain observed differences in the spatial and temporal distribution of debris flows, and (3) constrain the timing of debris flows within rainstorms to quantify rainfall thresholds for debris flow initiation and examine rainfall characteristics of debris-flow-producing storms. An overarching goal of this work is to provide data and process insights to improve situational awareness of PFDF hazards, particularly in the southwestern USA. More broadly, data collected as part of this study add to a growing set of PFDF observations from around the world that can inform data-driven models designed to assess the potential for PFDFs (Kern et al., 2017; Staley et al., 2017; Nikolopoulos et al., 2018; Diakakis et al., 2023; Nyman et al., 2015).
The Tadpole Fire burned over 40 km2 in the Gila National Forest in June 2020 before being contained in July 2020 (Fig. 1). Vegetation is dominated by ponderosa pine (Pinus ponderosa), and the area is underlain by tertiary-aged volcanic rocks (Scholle, 2003). Dominant soil types include Mollisols, Inceptisols, and Alfisols, and the soil texture is classified as a loam (43 % sand, 45 % silt, 12 % clay) (Rengers et al., 2023). Rainfall at the site occurs primarily during the summer, as part of the North American monsoon, as well as during the winter months. Summer rainstorms during monsoon season are characterized by relatively short durations and high intensities, whereas rainstorms during the winter months tend to have greater durations and lower peak intensities over a short (< 60 min) duration. Peak 15 min rainfall intensities with recurrence intervals of 1 and 10 years correspond to storms of 50 and 99 mm h−1, respectively (Bonnin et al., 2011).
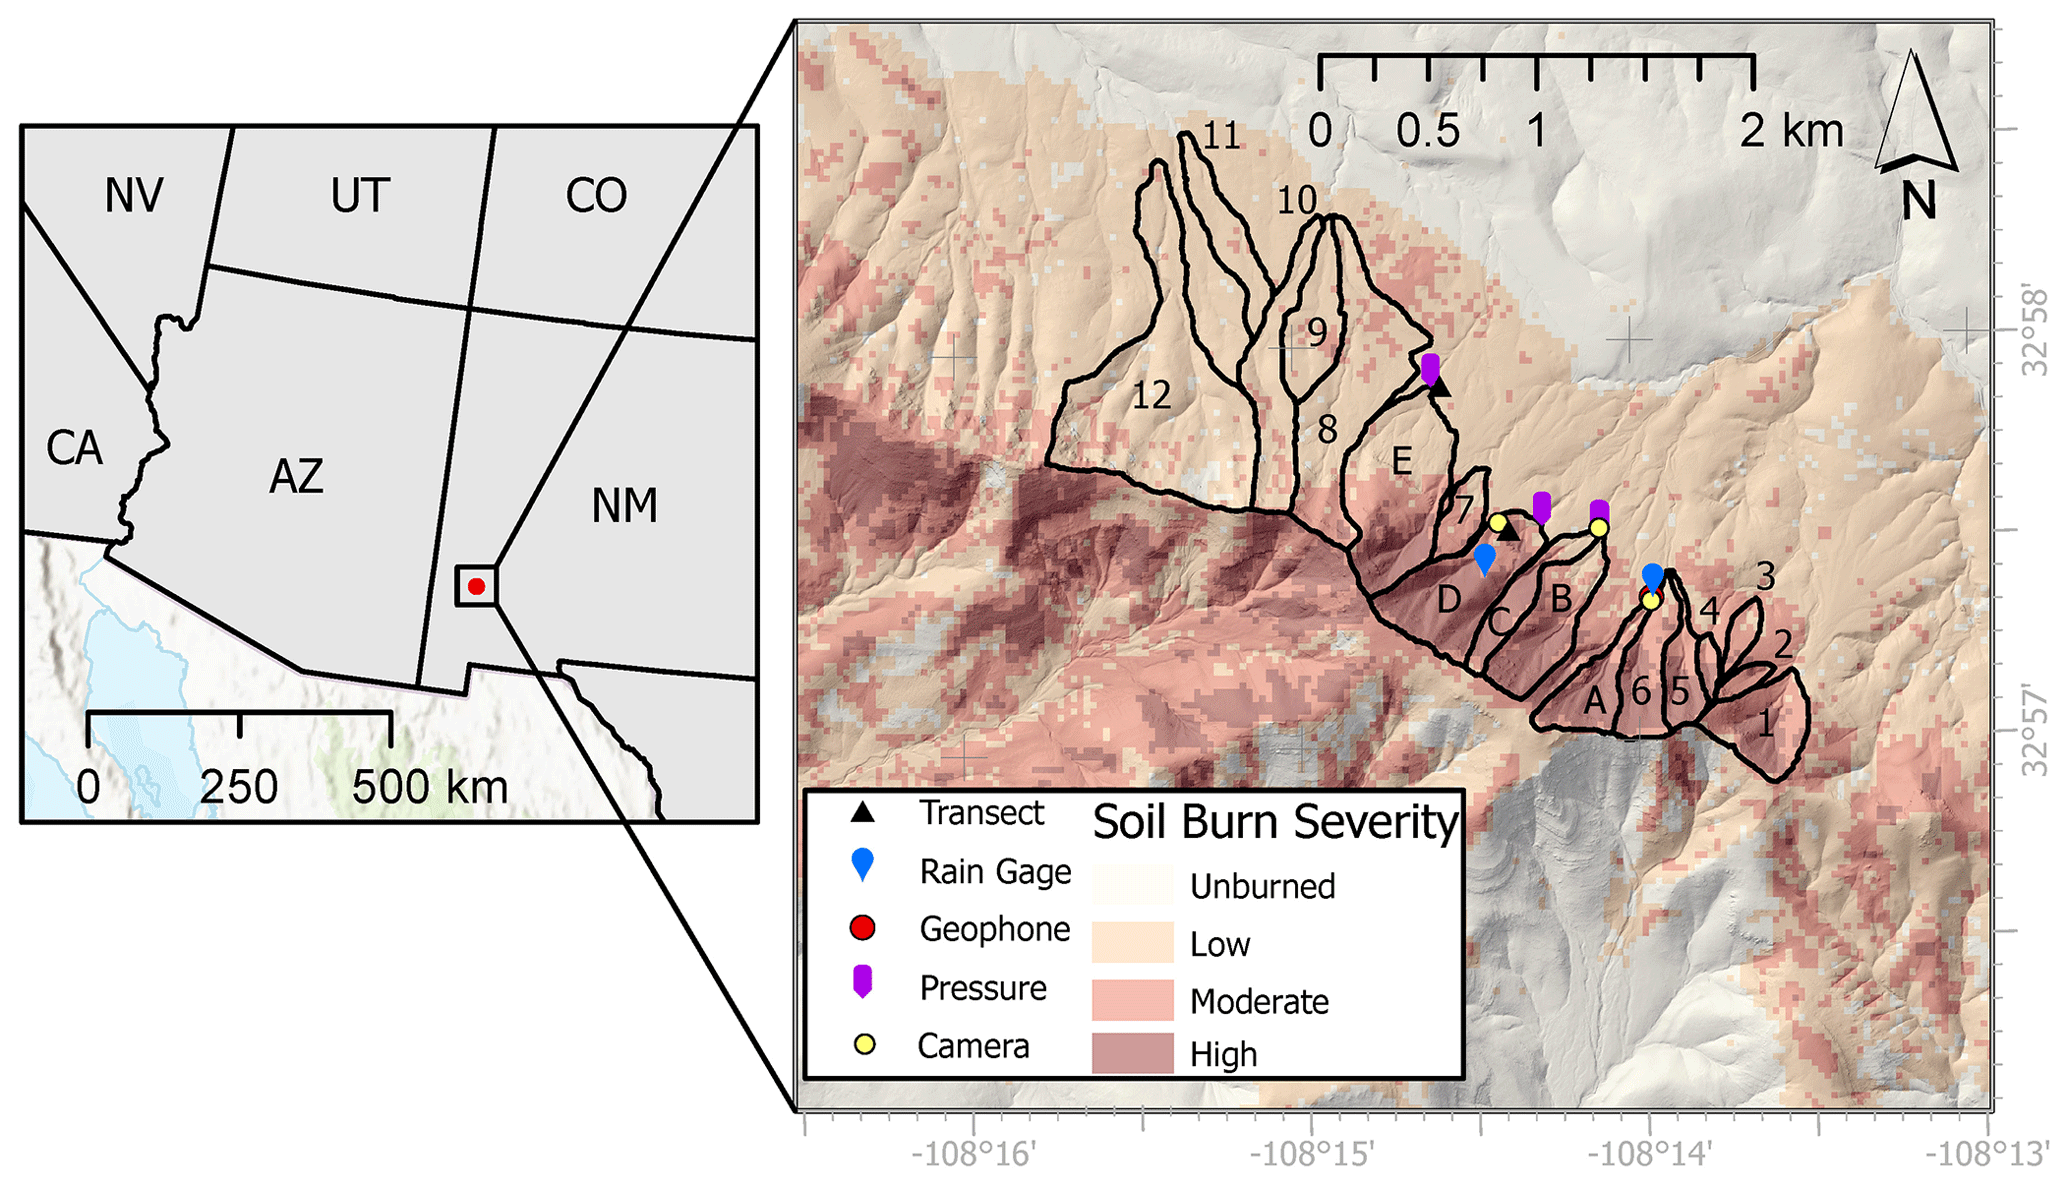
Figure 1The 2020 Tadpole Fire burned in southwestern New Mexico, USA. Monitored watersheds are outlined in black. Intensively monitored watersheds are labeled from A–E from east to west, and other monitored watersheds are labeled from 1–12 from east to west. Soil burn severity (SBS) varied throughout the study area. SBS was assessed by the Burned Area Emergency Response team using methods that rely on both field observations and the differenced normalized burn ratio (Parsons et al., 2010).
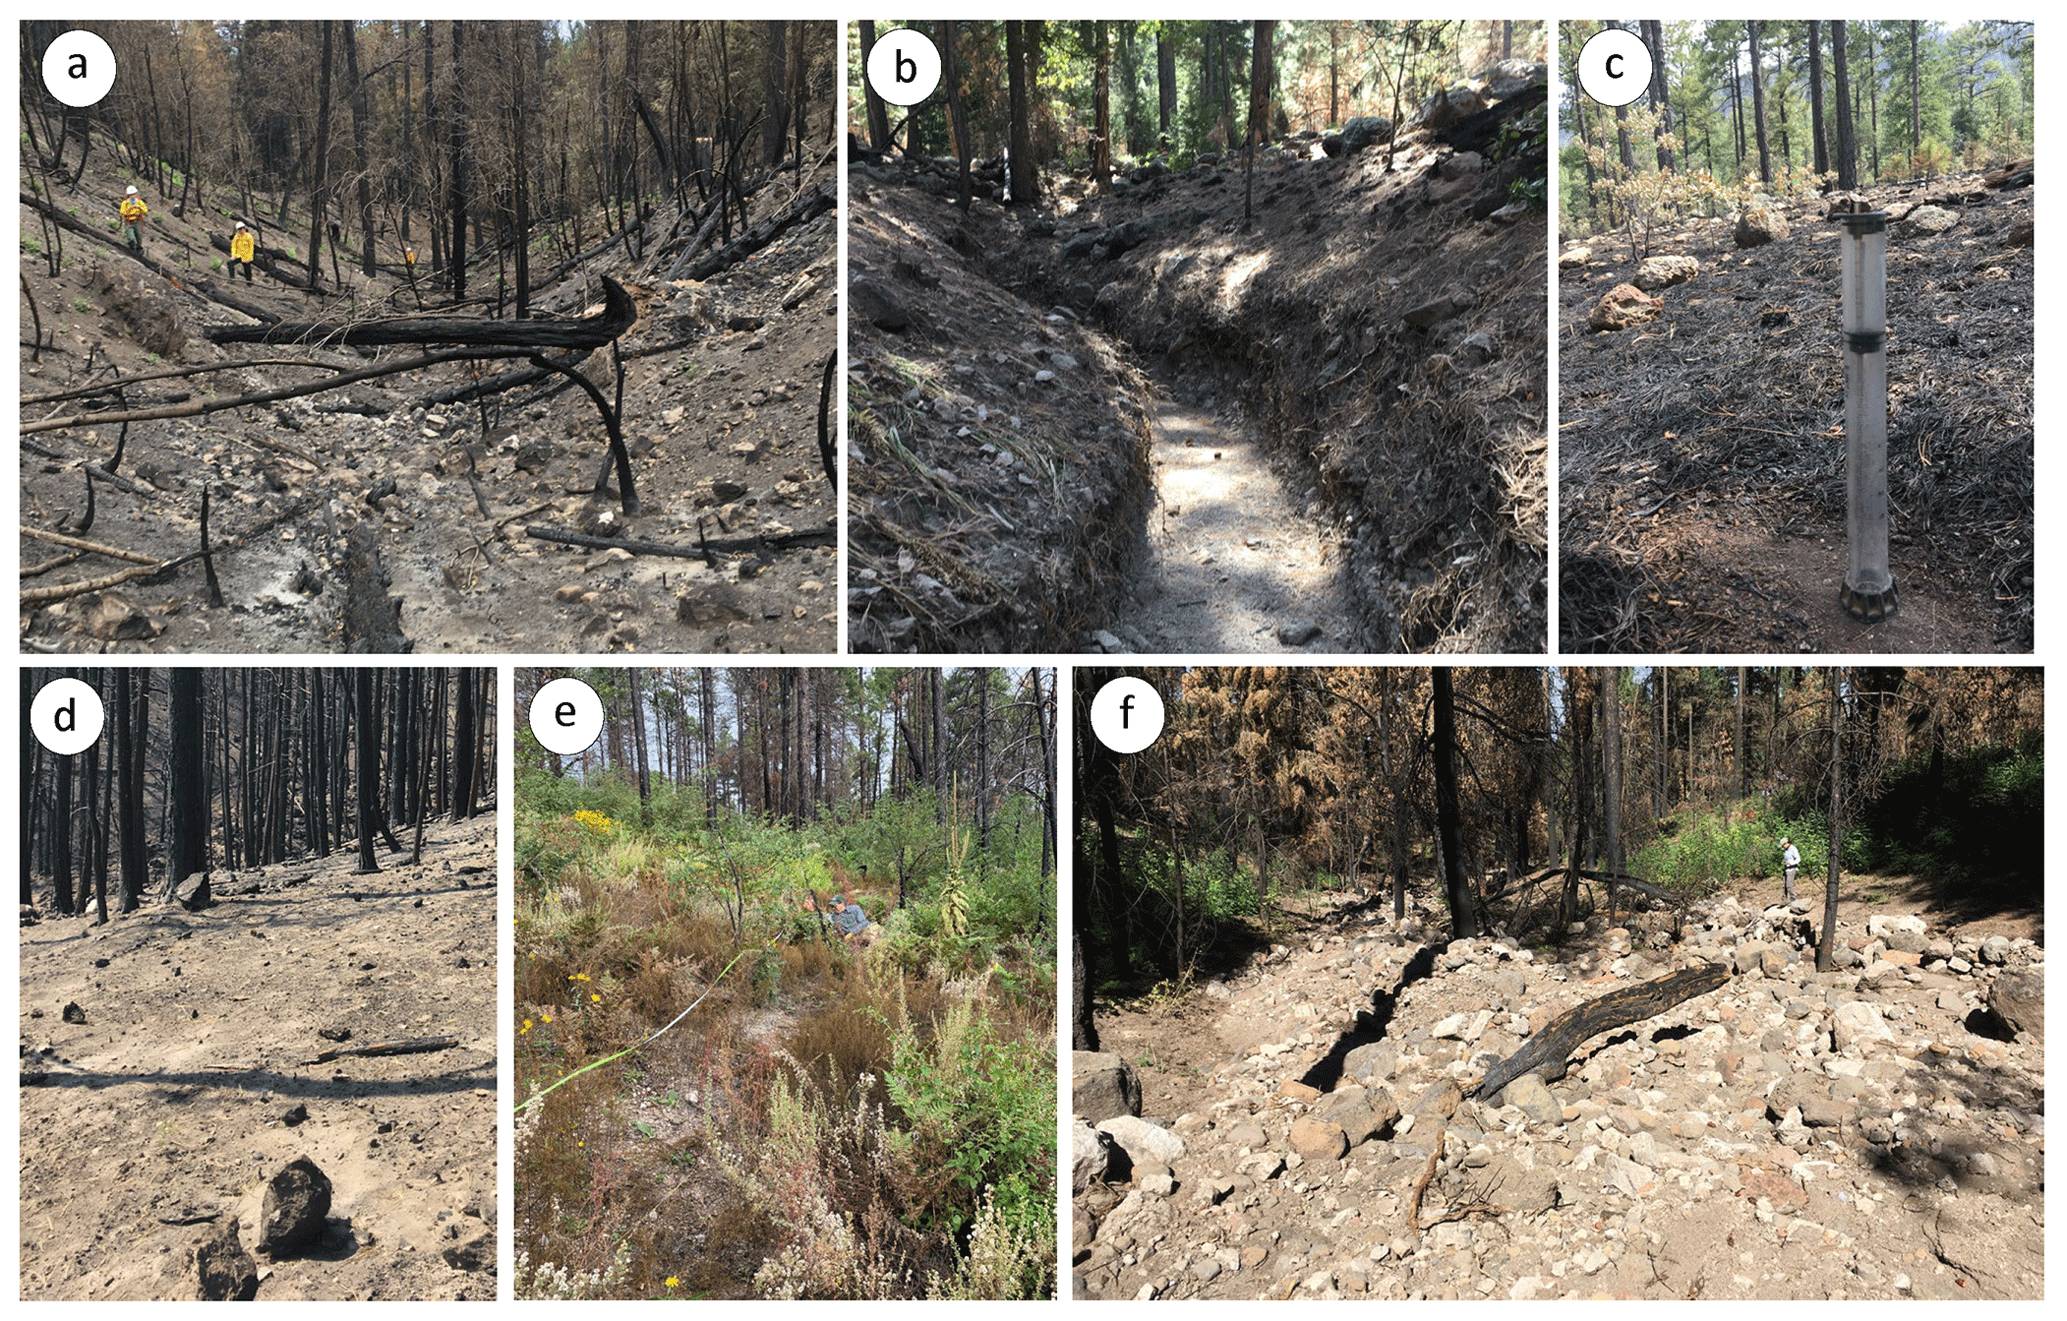
Figure 2Examples of (a) the unchannelized valley bottoms that drained the lower portions of many watersheds prior to post-fire rainfall and (b) a gully incised during post-fire rainstorms of the 2020 monsoon season. (c) A minidisk tension infiltrometer set up for a measurement at the mineral soil surface in an area with low soil burn severity. Note abundant needle cast and green canopy on trees in the background. (d) Canopy and ground cover were negligible shortly following the fire in July 2020 at the location of the moderate-/high-severity vegetation transect. (e) Understory canopy and litter cover substantially limited the fraction of bare ground at the moderate-/high-severity transect by September 2022. (f) Example of a debris flow deposit immediately upstream of Forest Road 3131A.
Bedrock-dominated channels drain portions of the steep, upper watersheds before transitioning to more moderately sloping valleys, which lacked incised channels or gullies and had limited bedrock exposure (Fig. 2). Soil burn severity, which was assessed following the fire by the Burned Area Emergency Response (BAER) team, was spatially variable across the study area. The upper, steep slopes of watersheds in our monitoring area generally burned at a higher severity relative to those at lower elevations. Soil burn severity classifications of low, moderate, and high are determined for different portions of the landscape based on a combination of field assessments and satellite-derived products, specifically the differenced normalized burn ratio (dNBR) (Key and Benson, 2006). A dNBR map was created using satellite images from before and after the fire (Miller and Thode, 2007). The dNBR thresholds for low, moderate, and high soil burn severity are then determined based on a field-based assessment of the effects of the fire on the soil in different locations (Parsons et al., 2010). The classified soil burn severity map was then created based on these thresholds. In July 2020, less than a month after the fire, we observed that canopy and ground cover were negligible in areas burned at moderate or high soil burn severity, whereas canopy and ground cover, including a substantial number of charred pine needles, were present to varying degrees in areas burned at low severity (Fig. 2).
Within 1 month, and prior to any measurable rainfall, following the start of the Tadpole Fire on 6 June 2020, we began monitoring debris flow activity and established sites within the burned area where we repeatedly made measurements to quantify soil hydraulic properties, ground cover, and understory canopy cover (Fig. 1). The monitoring period for this study extended from June 2020 through October 2022. During the first post-fire monsoon season, we monitored debris flow activity in 17 watersheds, all of which drain to the northeast from Tadpole Ridge and have elevations that range from approximately 2300 to 2600 m (Fig. 1). However, due to time and resource constraints after the first monsoon season ended in September 2020, subsequent flow-monitoring efforts throughout the remaining >2-year monitoring period focused on five intensively monitored watersheds (Fig. 1).
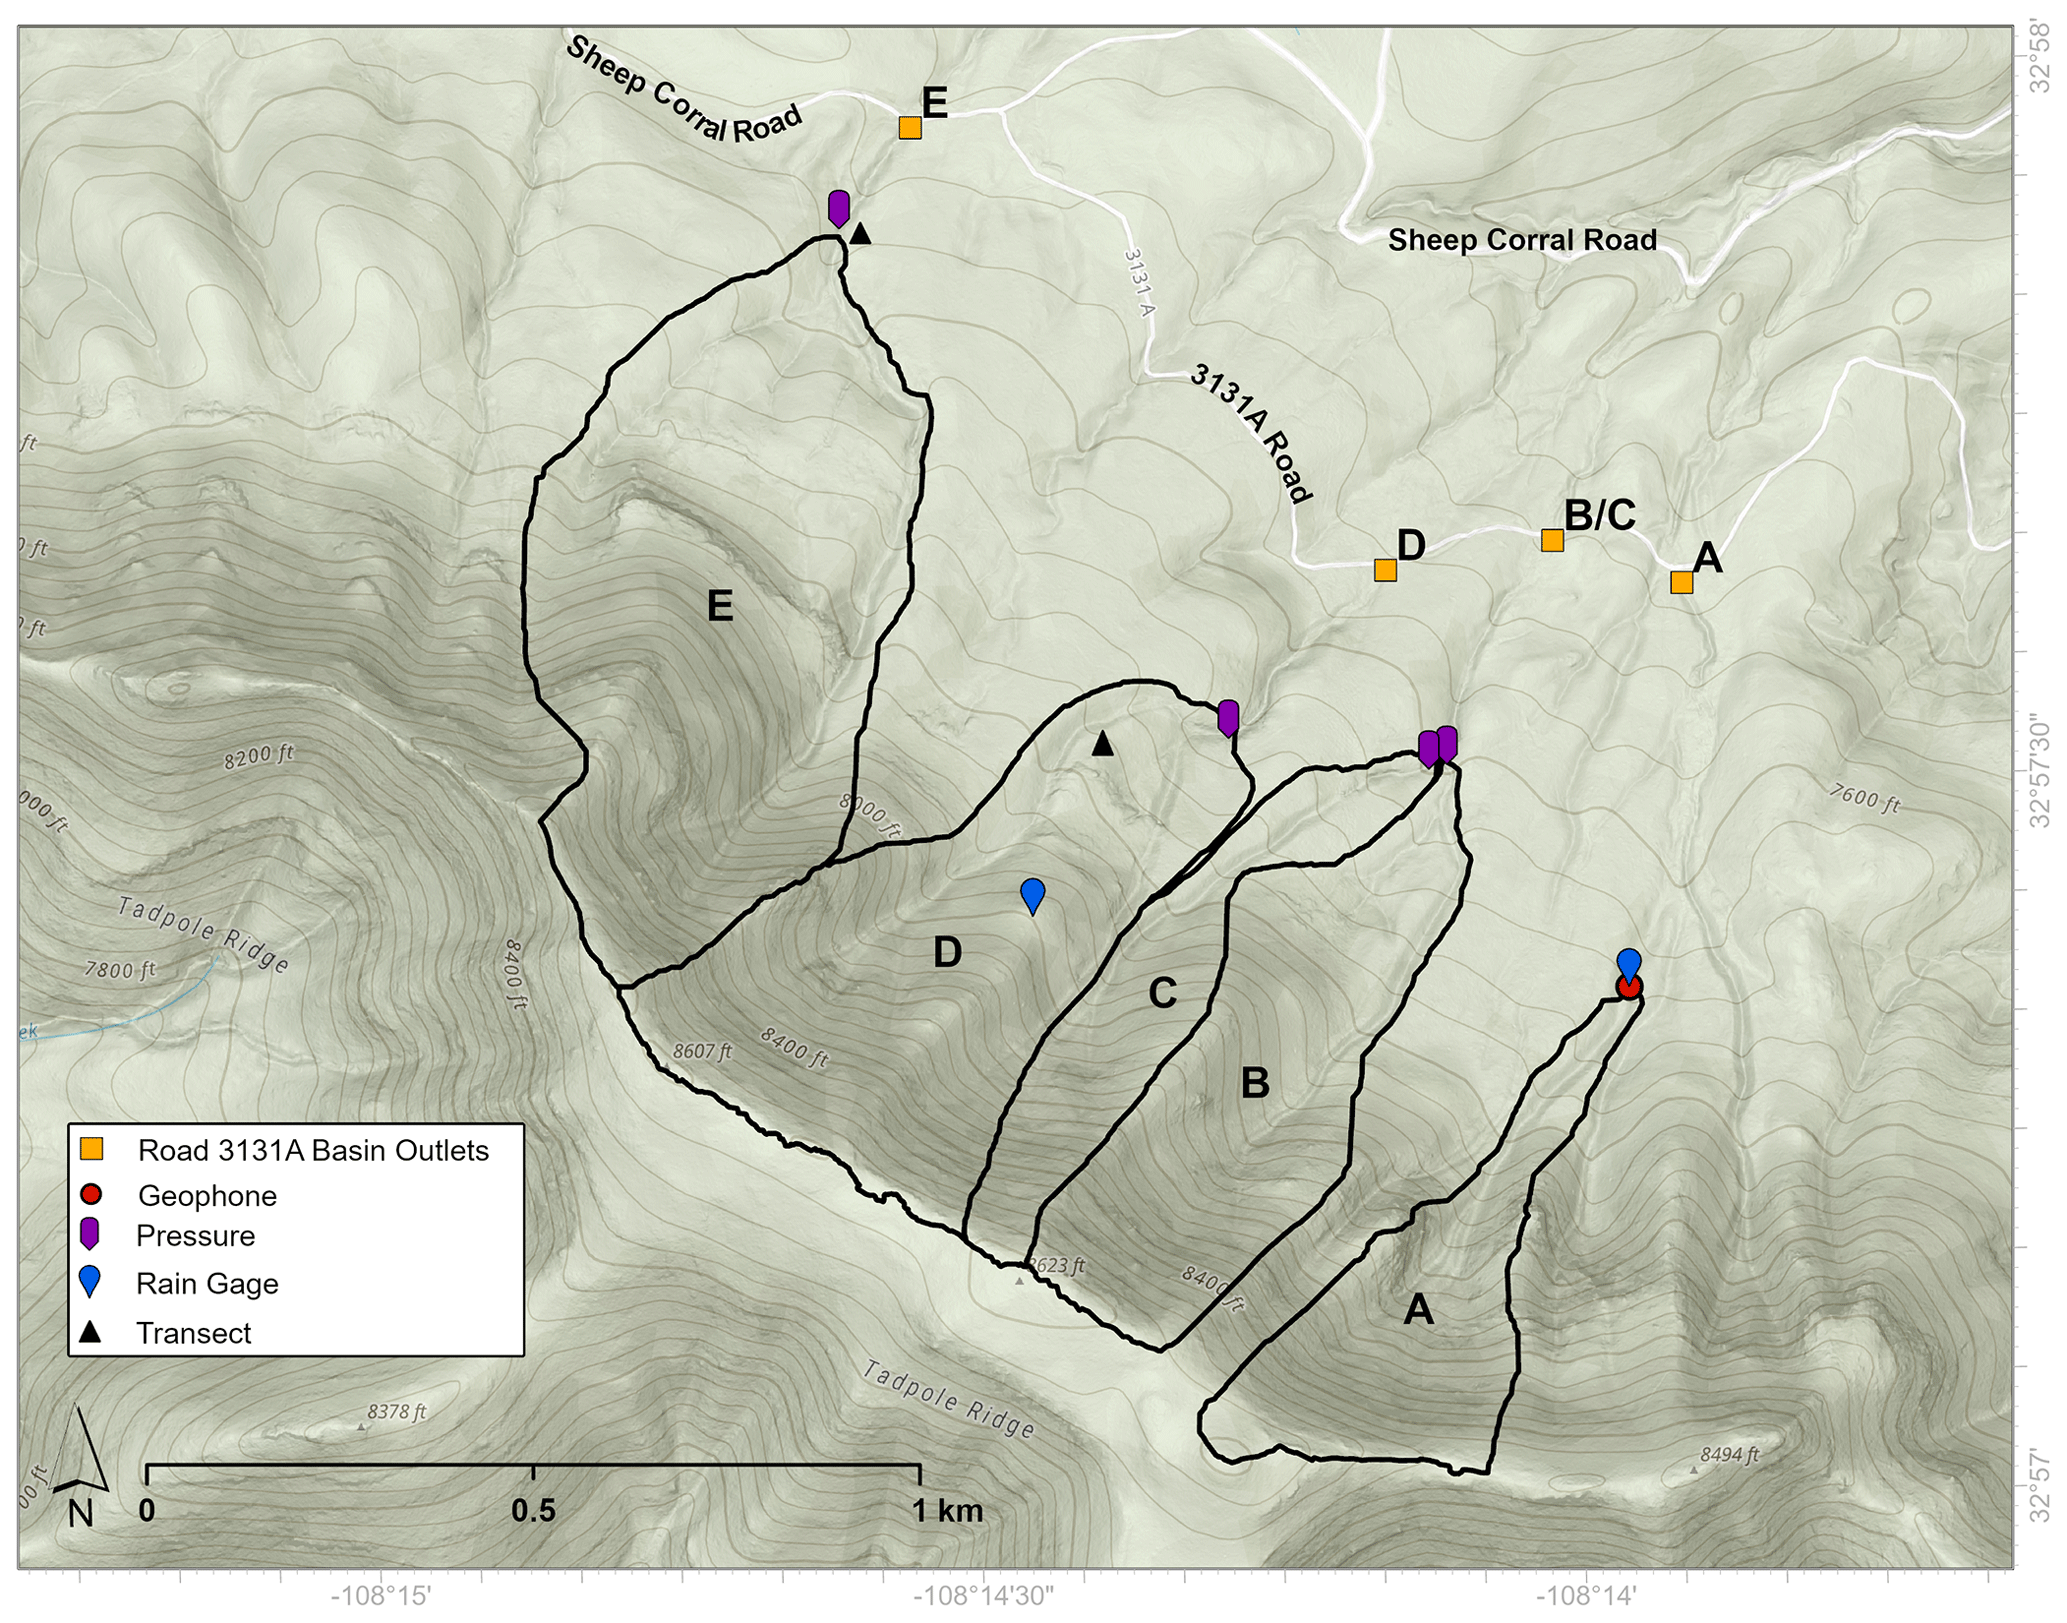
Figure 3The five intensively monitored watersheds, referred to as watersheds A–E, drain to the northeast off Tadpole Ridge towards Forest Road 3131A and Sheep Corral Road. During debris-flow-producing storms, sediment is often deposited where the channels intersect these roads (yellow squares).
The four easternmost of these five watersheds, referred to as watersheds A–D, drain down towards Forest Road 3131A, a dirt road that runs roughly perpendicular to the direction of flow (Fig. 3). Flows exiting watershed E similarly drain towards Sheep Corral Road. Sheep Corral Road also intersects the channels that drain watersheds A–D roughly 500 m downstream of Forest Road 3131A. These roads provided access to the study area and often promoted deposition of debris flow sediment. In Sect. 3.1, we describe methodologies related to field measurements and flow monitoring, including estimating ground cover and infiltration capacity, monitoring rainfall and flow activity, and analyzing rainfall characteristics. In Sect. 3.2, we describe modeling methodologies used to assess debris flow likelihood and temporal variations in runoff generation as a function of time since fire.
3.1 Field measurements and flow monitoring
3.1.1 Ground cover and infiltration measurements
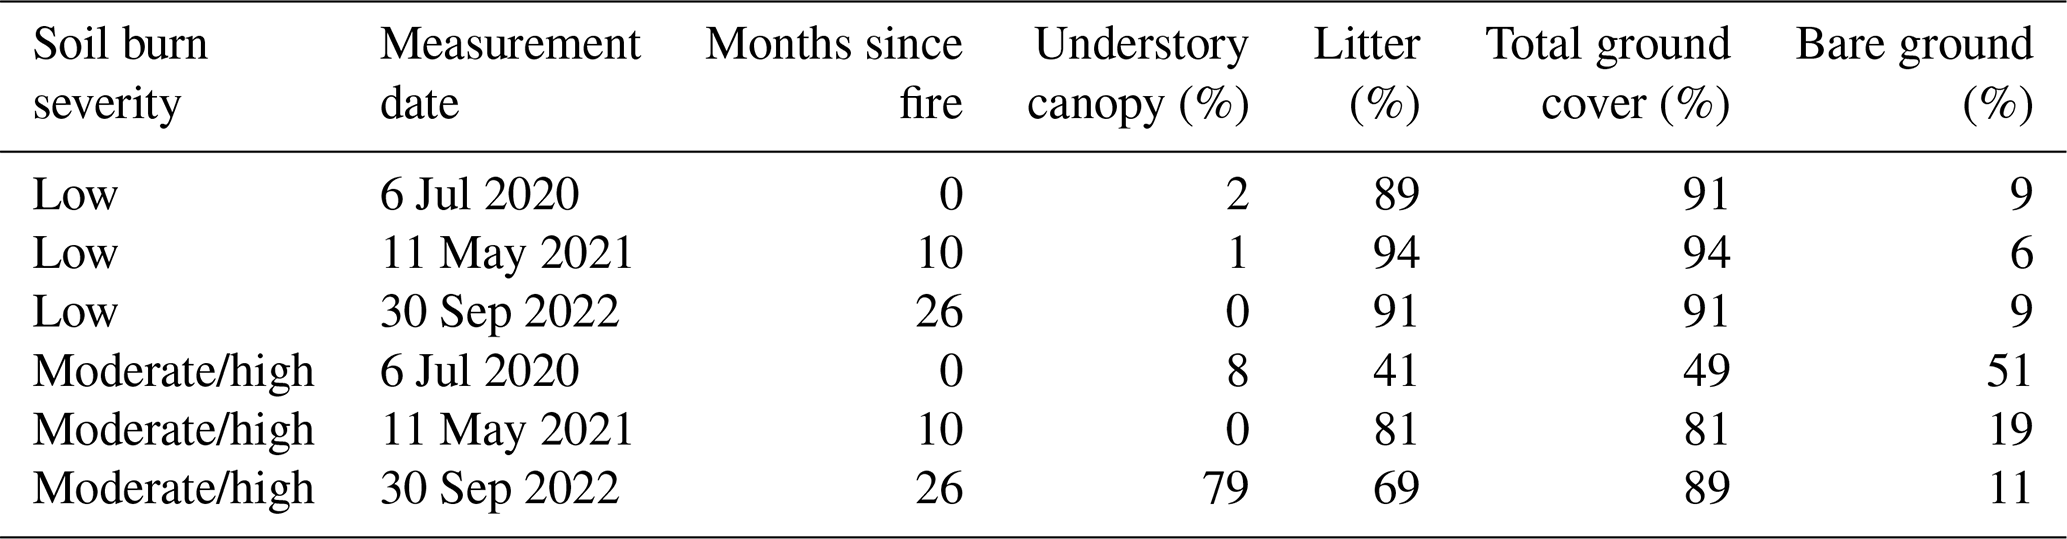
We monitored changes in ground cover and understory canopy cover along two hillslope transects using the line-point intercept method (Crocker and Tiver, 1948) to explore how temporal changes in ground cover affect debris flow activity (objectives 1 and 2). One transect was located in an area burned at moderate/high severity, while the other was located in an area burned at low severity (Fig. 1). Both transects were 20 m in length, and we made measurements at 20 cm intervals to determine the presence of canopy, litter, soil, or rock. Here, canopy refers only to standing vegetation from the ground surface to eye level and therefore does not quantify canopy that remained on mature trees in the low-burn-severity area (Fig. 2). We characterized all loose plant material (i.e., not connected to standing vegetation) on the soil surface as litter, including charred needles and woody debris. Any clasts at or embedded within the soil surface that had a diameter greater than 5 mm were classified as rocks. At each measurement location (i.e., every 20 cm along the transect), we recorded whether there was understory canopy cover, litter, soil, or rock. It is possible for a measurement to indicate the presence of understory canopy, litter, and either soil or rock. In other words, if understory canopy was present, we still assessed the presence or absence of litter, soil, and rock underneath the canopy. If both canopy and litter were present, we continued to determine the presence of either soil or rock. The percentage of total ground cover was determined based on the number of first hits that were classified as either canopy or litter, while bare ground consisted of all measurements where the first hit was soil or rock. We adopted this definition of total ground cover since it reflects the percentage of the ground surface that would be exposed to direct raindrop impact. Exposure of bare ground may affect processes such as raindrop-induced sediment transport and surface soil sealing that are influential in recently burned areas (Larsen et al., 2009). We conducted ground cover surveys on 6 July 2020, 11 May 2021, and 30 September 2022.
Soil hydraulic properties vary spatially, due to variations in soil burn severity and material properties, and temporally as the landscape recovers (Moody et al., 2016; Ebel et al., 2022). Therefore, in support of objective 2, we periodically conducted in situ infiltration measurements over >2 years using minidisk tension infiltrometers in areas burned at moderate/high severity and low severity as well as a nearby unburned area (Fig. 2c). We made measurements shortly following the fire in areas burned at moderate/high severity (July 2020) and low severity (August 2020) and assessed changes over time by also making measurements in both severity classes in May 2021, May 2022, and September 2022. Measurements were performed at arbitrary locations within the study area in 2020 and were then co-located with the vegetation transects in subsequent visits. Measurements made alongside the vegetation transects were spaced at least 1 m apart. The number of measurements for a given group (i.e., in an area burned at a given severity at a particular time) varied from a minimum of 6 to a maximum of 20. All measurements were made at the surface of mineral soil, after brushing aside any ash or litter, with 1 cm of suction.
Measurements resulted in a record of cumulative water volume infiltrated, I, as a function of time, t. We used this time series, following the methodology of Zhang (1997), to estimate field-saturated hydraulic conductivity, Kfs, and sorptivity, S. In particular, Zhang (1997) demonstrated that
where C1=A1S and C2=A2Kfs and A1=1.21 and A2=5.72 are empirical coefficients that depend on soil texture. The values for A1 and A2 used here are consistent with the soil texture at our site, which is classified as a loam. Therefore, Kfs and S can be estimated by fitting a curve to Eq. (1). In addition, we used estimates of Kfs and S to determine the wetting front potential, hf, according to (Ebel and Moody, 2017)
The wetting front potential is a parameter in the Green–Ampt infiltration model, which is commonly used in post-fire hydrologic models (Ebel, 2020; McGuire et al., 2016; Rengers et al., 2016, 2019). In the above equation, θs=0.43 denotes the soil moisture at saturation for a loam soil and we let the residual soil water content, θr=0.078, serve as an approximation for the initial soil moisture (Carsel and Parrish, 1988).
Vandervaere et al. (2000) suggested three different curve-fitting techniques to estimate Kfs and S, all three of which we employ here. The first technique, the cumulative infiltration (CI) method, relies on fitting a quadratic function to
where Y=I and . The cumulative linearization (CL) method is accomplished by dividing Eq. (2) by and fitting a line to the resulting relationship,
where and . Lastly, the differentiated-linearization (DL) method requires fitting a line to
where and . We found, in agreement with Vandervaere et al. (2000), that the DL and CL methods help to identify measurements where infiltration does not meet the assumptions of the Zhang (1997) model. For example, in some cases, we observed nonlinear or piecewise linear trends when plotting Eqs. (3) and (4), in which case fitting a line to these data would result in erroneous estimates for Kfs and S. This could result from a multilayer infiltration system where there is a thin water-repellent layer near the surface and a more wettable layer below. In these cases, we did not use the measurement to estimate Kfs and S. Otherwise, we took the average of the three Kfs values and the three S values resulting from the three curve-fitting techniques to arrive at a single estimate for Kfs and S for each measurement.
In the first summer following the fire, we additionally assessed soil water repellency at the surface of mineral soil and 2 cm below the surface using the water drop penetration time (WDPT) test. We conducted tests at eight different locations, six in areas burned at moderate or high severity and two burned at low severity. Three water drops were placed on the soil surface in each of the eight locations, roughly 10–20 cm apart, after removing any ash or litter. We recorded the time for each drop to be absorbed and then classified water repellency into one of four classes. Water drop penetration times of <5, 5–60, 60–180, and >180 s were associated with no, slight, moderate, and extreme water repellency, respectively (Robichaud and Hungerford, 2000).
3.1.2 Rainfall and flow monitoring
We installed equipment to quantify flow timing, flow type (i.e., debris flow, flood), and rainfall intensity to determine the rainfall characteristics associated with debris flow initiation in five intensively monitored watersheds during the first three monsoon seasons following the fire (objectives 1 and 3) (Figs. 1 and 3). We also made observations to determine the presence/absence of debris flow activity in 12 additional watersheds during the first post-fire monsoon season but did not attempt to constrain flow timing in these instances (Fig. 1). Two tipping bucket rain gages recorded rainfall accumulation over time in increments of 0.2 mm (Fig. 1). We installed non-vented pressure transducers near the outlets of watersheds B–E, which provided information about flow type and timing (Figs. 1 and 3). We installed the pressure transducers by recessing them into a hole drilled into the bedrock channel. Two geophones (single-component, Geospace GS-11) monitored flow in watershed A by recording at a rate of 50 Hz (Fig. 1). Interpretation of geophone and pressure transducer data, described below, was aided by photos from time lapse cameras installed near several watershed outlets (Fig. 1). The cameras captured photos on time intervals ranging from 3–60 min depending on battery life, memory capacity, and expected timing of subsequent visits to service equipment. The equipment was installed in early July 2020 prior to any post-fire rainstorms. Data were not telemetered but were periodically downloaded on site.
The two geophones in watershed A were installed outside of the channel, roughly 15 m from the channel thalweg, and were separated by approximately 18 m (Rengers et al., 2023). Geophone data were filtered between 5 and 20 Hz, and the instrument response was removed, converting the signal to ground velocity. Data are displayed as signal power and short-time Fourier transforms calculated using a 5 s moving window. Seismic data help determine flow type, especially when paired with cameras and frequent field observations, since debris flows produce intense ground vibrations relative to floods (McGuire et al., 2018; Kean et al., 2015). Debris flow activity is also generally characterized by an abrupt increase in signal power, over a wide range of frequencies, that tapers off gradually (Porter et al., 2021). We used these characteristic features of the signal to estimate, to the nearest minute, the time that debris flows passed by the geophones.
The non-vented pressure transducers recorded variations in pressure on 1 min intervals. Pressure can change due to variations in atmospheric pressure, depth of flow in the channel, and changes in sediment thickness on top of the sensor due to deposition or erosion. Data from these sensors are therefore not ideal for obtaining absolute estimates of flow depth, but they provide an effective and low-cost method to determine flow timing and flow type during rainstorms, especially when paired with post-event field observations (Kean et al., 2012). A rapid increase and subsequent decrease in pressure over a short time is typically observed during the passage of a debris flow, whereas the temporal variations in pressure associated with a flood are characterized by a more gradual increase and then decrease in pressure. We therefore used the time series of pressure to identify the time at which debris flows exited the monitored watersheds. Given the relatively small size of the watersheds (< 1 km2) and location of the pressure transducers within hundreds of meters of the ridgeline, we estimate that the time difference between debris flow initiation and the debris flow passing by a pressure transducer or geophone is limited to several minutes. A debris flow could travel a distance of 500 m from an initiation location to a pressure transducer in less than 2 min assuming an average velocity of 5 m s−1. In addition to utilizing the pressure transducer and geophone data to assess the flow type and timing, we also field-verified the occurrence of a debris flows by making post-event observations of deposit morphology within and downstream of the monitored watersheds, as described in more detail below.
3.1.3 Rainfall intensity, recurrence, and temporal variability
To assess rainfall characteristics, we computed rainfall intensities over durations ranging from 5 to 60 min. More specifically, we defined
as the average rainfall intensity over D minutes. We computed ID at intervals of 1 min throughout each rainstorm. Although ID will vary throughout a rainstorm, it has proven useful to summarize rainfall characteristics using the peak value of ID for the development of rainfall intensity–duration thresholds for debris flow initiation. Past studies have demonstrated that I15 is a particularly useful metric for assessing debris flow likelihood during a post-fire rainstorm (Staley et al., 2013), possibly because the debris flows are frequently generated by runoff and runoff is correlated well with rainfall averaged over a 15 min duration in small, steep, recently burned watersheds (Kean et al., 2011; Raymond et al., 2020). In cases where we could constrain the timing of debris flows within rainstorms using the pressure time series and geophone data, we estimated the rainfall intensity responsible for triggering the debris flow (i.e., triggering intensity) by finding the peak value of ID within a 15 min time window prior to the detection of the debris flow at the pressure sensor for values of D of 5, 10, 15, 30, and 60 min (e.g., McGuire and Youberg, 2020). For example, the triggering I5 would be equal to the maximum value of I5 between t∗ and , where t∗ denotes the number of minutes following the start of the rainstorm when the debris flow was detected at the watershed outlet.
The steep, upper slopes of all 17 monitored watersheds, which is where debris flows are most likely to initiate, were all located within approximately 2 km of both rain gages. We used the rain gage closest to each watershed to determine rainfall characteristics associated with events (i.e., a debris flow) at that watershed. During the second and third monsoon seasons, in 2021 and 2022, respectively, the rain gage in watershed D was knocked down, likely by an animal, at an unknown time. Therefore, we only utilized data from the rain gage in watershed A during those two time periods. Rain gages were only maintained from late spring to early fall to capture data during the monsoon season when debris flows were likely to initiate and when precipitation occurred entirely as rainfall.
We computed the recurrence interval of all rainfall intensities that produced debris flows, focusing on average intensity over a 15 min duration given its particular relevance for PFDFs in this region (Kean et al., 2011; Staley et al., 2013; Raymond et al., 2020). Following the methodology from Staley et al. (2020), we determined recurrence intervals for observed rainfall intensities by fitting a curve to the 1-, 2-, 5-, 10-, 25-, 50-, and 100-year recurrence interval intensities as determined by NOAA Atlas 14 (Bonnin et al., 2011). To further analyze rainfall at our study site, we examined the temporal distribution of rainfall within storms using the standardized rainfall profile (SRP) approach described by Huff (1967) and recently applied to the study of PFDFs by Esposito et al. (2023). The SRPs represent the cumulative fraction of storm rainfall as a function of the fraction of storm duration, allowing for a rapid visual assessment of the temporal distribution of rainfall within a storm (Fig. S1 in the Supplement). Convective storms tend to be characterized by SRPs that lie above the 1–1 line, whereas frontal storms often have SRPs that lie below the 1–1 line (Esposito et al., 2023). We further classified rainstorms based on the quartile of storm duration that contains the highest cumulative rainfall total. Storms where more rainfall occurred during the first quartile of the storm duration were classified as Q1 storms, while those with more rainfall during the second, third, or fourth quartile of the storm duration were classified as Q2, Q3, and Q4 storms, respectively (Huff, 1967).
3.1.4 Intensity–duration thresholds
Rainfall intensity–duration (ID) thresholds, which define a curve in intensity–duration space above which debris flow initiation is likely, are a practical tool for post-fire debris flow warning and hazard assessment (Cannon et al., 2008; Staley et al., 2013; Esposito et al., 2023). They are also a convenient way to summarize the rainfall characteristics responsible for triggering debris flows, so they can be compared with findings from other regions. We followed the methodology of Staley et al. (2013) to objectively define rainfall intensity thresholds for durations of 5, 10, 15, 30, and 60 min (objective 3).
For a given duration, D, we use records of rainfall intensity and watershed response to test the performance of intensity thresholds that vary from 1 to 200 mm h−1 on 0.1 mm h−1 intervals. We use the threat score, TS, to assess the performance of each potential intensity threshold. The intensity threshold for a given duration is defined based on which of the tested intensities results in the highest TS. The threat score is defined as
where TP, FN, and FP denote the number of true positives, false negatives, and false positives. A true positive occurs when the rainfall intensity exceeds the threshold and a debris flow is observed. A false negative occurs when the rainfall intensity lies below the threshold but a debris flow is observed. A false positive occurs when rainfall intensity is above the threshold and no debris flow is observed. Potential thresholds are therefore penalized when they incorrectly classify an event (i.e., FN or FP).
3.1.5 Debris flow surveys
During the first post-fire monsoon season, we conducted field surveys at all five of the intensively monitored watersheds on 29 July 2020, 14 and 31 August 2020, and 17 October 2020 to determine which watersheds produced debris flows during the first monsoon season following the fire. Also on 17 October 2020, we visited 12 nearby watersheds and used the presence and absence of debris flow deposits to assess whether there had been debris flows at any point since the fire. In subsequent years, we made pre- and post-monsoon-season visits to conduct field surveys but limited our observations to the five watersheds initially chosen for intensive monitoring. Characteristics associated with debris flow deposits include lateral levees and poorly sorted, matrix-supported deposits that lack imbrication (Fig. 2) (Costa, 1988; Pierson, 2005). We used these characteristic debris flow depositional patterns as an indicator of debris flow activity in a watershed. If no debris flow deposits were found within a watershed, the drainage was classified as having a flood response or no response during all rainstorms that occurred within the monitoring period. In cases where we determined that a debris flow occurred but we could not constrain the timing of debris flow, we assigned the triggering intensity to be equal to the peak rainfall intensity observed in any storm prior to the debris flow survey. Approximating the triggering intensity, which must be equal to or less than the peak rainfall intensity, by the peak rainfall intensity can lead to an overestimation of rainfall intensity–duration thresholds for debris flow initiation (Raymond et al., 2020). In cases where we were able to constrain the timing of debris flows within rainstorms, we examine differences between the triggering and peak rainfall intensities.
We quantified the grain size distribution of six debris flow deposits during the first monsoon season following the fire by collecting samples in half-gallon bags. For comparison, we also collected samples from the upper 5 cm of mineral soil from two burned hillslope locations. These samples were air-dried and sieved, using sieve sizes of 32, 16, 8, 4, and 2 mm, to quantify the particle size distribution of sediment greater than 2 mm. Percentages of sand, silt, and clay were quantified with the hydrometer method. Since these samples did not include boulders or cobbles, we performed pebble counts (Bunte and Abt, 2001) at two deposits to estimate the size distribution of the coarser sediment in the flow. We completed pebble counts within watershed A (lat 32.96085, long −108.23568) and watershed D (lat 32.961053, long −108.236013) by extending a measuring tape in a transect across a debris flow deposit and measuring the B axis of clasts on a 25 cm interval (Fig. S2). If the clast was too small to be measured, it was recorded as fine sediment (< 2 mm). The sample spacing of 25 cm was chosen based on the size of boulders in the deposit to minimize the likelihood of encountering the same clast twice. No clasts were counted twice.
3.2 Modeling
3.2.1 Runoff generation
We used a point-scale infiltration model to quantify how measured temporal changes in soil hydraulic properties, namely Kfs, S, and hf, translated into temporal changes in runoff potential, a key variable for assessing PFDF susceptibility. Watershed responses to rainfall are affected in different ways by changes in Kfs, S, and hf. Analyzing impacts of fire on Kfs, S, and hf in isolation may therefore lead to incomplete conclusions about the potential for runoff, a necessary condition for the initiation of runoff-generated debris flows, since fire-driven changes in Kfs may be entirely or partially offset by changes in hf, or vice versa. Here, we use the Green–Ampt infiltration model to quantify the combined effects of Kfs and hf on runoff generation (Green and Ampt, 1911). The Green–Ampt model represents infiltration-excess overland flow, which is the primary runoff-generation mechanism during storms that produce runoff-generated PFDFs in the southwestern USA (Gorr et al., 2024; Schmidt et al., 2011). The model has been widely applied to simulate post-fire infiltration and runoff generation (Van Eck et al., 2016; Ebel, 2020). Specifically, infiltration capacity, Ic, is computed as
where Ks denotes the saturated hydraulic conductivity, ) denotes the depth of the wetting front, V is the total infiltrated depth, θi = 0.078 is the initial soil moisture content, and h is the depth of overland flow. In the Green–Ampt model, the wetting front potential and saturated hydraulic conductivity, which we estimate using Kfs, control the capillarity and gravity contributions to infiltration, respectively. Given an input rainfall intensity, we used this infiltration model to assess changes in the runoff ratio and peak runoff rate at the point scale (i.e., runoff is not routed over the landscape) over time in soils burned at moderate/high severity and at low severity. The runoff ratio for a rainstorm is defined as the ratio of the total runoff depth to the total rainfall depth. We compared simulated runoff ratios and peak runoff rates from burned soils with those computed for unburned soil conditions. While point-scale modeling does not allow us to assess the concentration of runoff across the landscape, it does allow us to assess the combined effects of changes in Kfs and hf on runoff generation in response to different magnitudes of rainfall intensity.
Since rainfall intensity averaged over 15 min time intervals has proven to be a good predictor for PFDF initiation in the southwestern USA (Staley et al., 2017, 2013; Raymond et al., 2020), we computed runoff ratios in response to design rainstorms with 15 min durations. We considered six different rainstorms characterized by average rainfall intensities that are equal to the 1-, 2-, 5-, 10-, 25-, 50-, and 100-year recurrence interval rainstorms (Bonnin et al., 2011). Since there are distributions of Kfs and hf for a given time after the fire and burn severity class, we used the geometric mean of Kfs as an estimate for Ks (Liu et al., 2023). Similarly, we determined a representative parameter value of hf in simulations based on the geometric mean of the hf distribution derived from the minidisk measurements.
We numerically approximated changes in infiltration and runoff rates over time, t, during a design rainstorm based on the difference between the rainfall rate, R, and the infiltration capacity determined by Eq. (8). More specifically, we separated the rainstorm into a series of time steps of duration, Δt = 1 s. Letting n denote the value of a quantity at a particular time step and assuming a negligible depth of overland flow, infiltration capacity can be computed as
Table 1Estimates of understory canopy cover and ground cover from 101 measurements along 20 m transects. The metric of months since fire is determined from containment in July 2020.
The runoff rate, q, at time step n can be taken as . Then, the total infiltrated depth and depth of the wetting front can be updated according to
and
We set θi=0.078 in all simulations. We summarized the simulated response during each storm by computing the runoff ratio and peak runoff rate.
3.2.2 Debris flow likelihood
We analyzed the morphologic properties and burn severity characteristics of the monitored watersheds to help interpret any observed spatial variations in debris flow susceptibility. Watershed outlets for intensively monitored watersheds were defined based on the locations of flow-monitoring equipment (i.e., geophones, pressure transducers), and watershed outlets for the remaining watersheds were defined based on the farthest downstream point where detailed field observations were made to assess flow type. We focused on quantifying watershed properties related to slope, soil burn severity, and soil erodibility since prior studies have shown these to be particularly relevant for assessing debris flow likelihood at the watershed scale (Cannon et al., 2010; Staley et al., 2017). We consider the mean watershed slope, fraction of area burned moderate or high severity, soil KF factor (KF) from the STATSGO database (Schwarz and Alexander, 1995), fraction of area that is greater than 23° and burned at moderate or high soil burn severity (MH23), and average dNBR. The first two factors related to slope and burn severity have general relevance to debris flow initiation by runoff since steeper, more severely burned watersheds are more likely to experience greater increases in runoff and sediment transport. The last three factors, along with the peak 15 min rainfall accumulation, R15, are inputs for the M1 debris flow likelihood model (Staley et al., 2017) (Table S3 in the Supplement). The M1 model is a logistic regression model, which was trained using a debris flow database from southern California and tested using data throughout the western USA (Staley et al., 2017). The model yields watershed-scale predictions for debris flow likelihood, p, according to
where
In addition, the model equations can be rearranged to solve for the rainfall intensity required over a 15 min time period in order for the likelihood of a debris flow to be 0.5 (Staley et al., 2017). Following Staley et al. (2017), we used the M1 model to compute a 15 min rainfall intensity–duration (ID) threshold, , for each watershed based on rainfall needed to achieve p=0.5. We compared these thresholds with observed values of I15 that triggered debris flows in each watershed in our study area. We further compared spatial variations in with observed variations in debris flow activity. One goal of these comparisons is to help assess the extent to which watershed morphologic factors that control debris flow initiation processes are similar or different regarding our site and the sites in southern California where the M1 model was trained.
4.1 Temporal changes in ground cover, infiltration capacity, and runoff
A substantial amount of bare ground was exposed in areas burned at moderate/high soil burn severity relative to areas burned at low severity in the immediate aftermath of the fire. The vegetation transect surveys on 6 July 2020 indicated 51 % bare ground at the moderate-/high-severity transect compared to 9 % bare ground at the low-severity transect (Table 1). The fraction of bare ground exposed at the moderate-/high-severity transect decreased markedly by the second survey, conducted on 11 May 2021. By this time, roughly 10 months later, a substantial increase in litter cover reduced the percentage of bare ground to 19 %. By September 2022, canopy and litter cover increases further reduced the percentage of bare ground to only 11 % at the moderate-/high-severity transect. There was little change over this same time at the low-severity transect, with the percentage of bare ground varying between 6 % and 9 %.
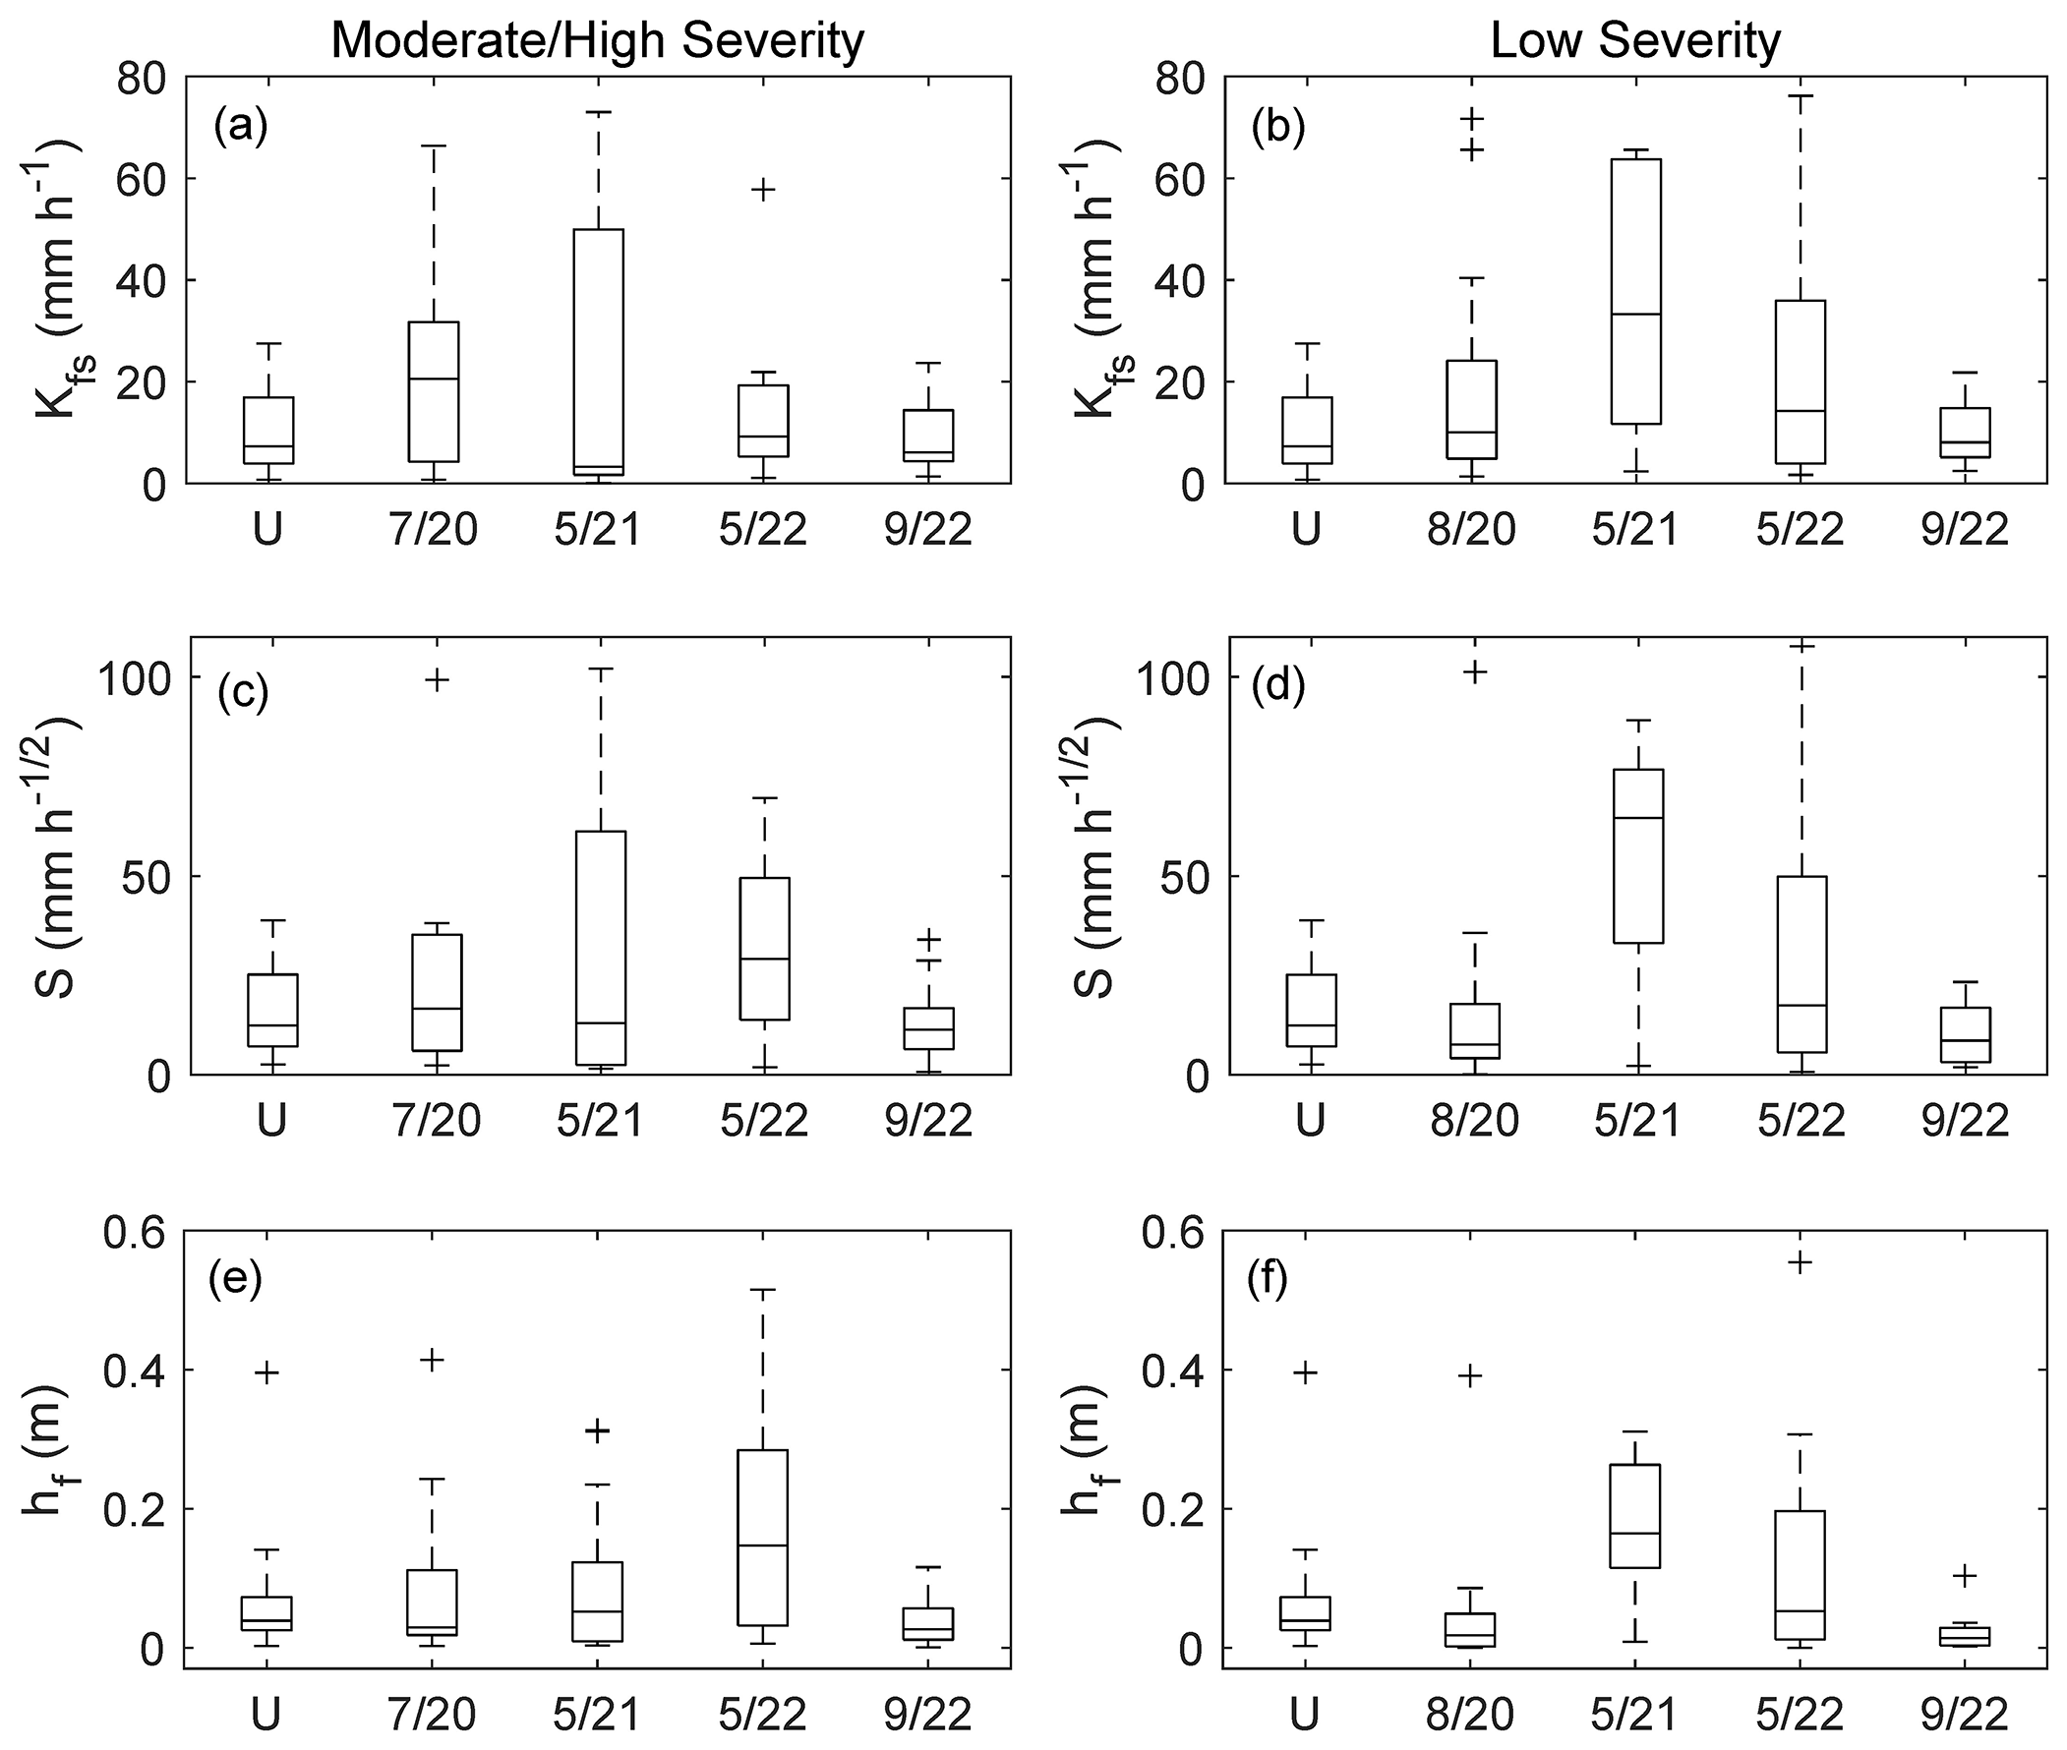
Figure 4Minidisk infiltrometer measurements provide estimates of soil hydraulic properties and their temporal evolution following the fire in July 2020 relative to nearby unburned soils (U). Results indicate non-monotonic trends over time in (a, b) field-saturated hydraulic conductivity, Kfs [mm h−1]; (c, d) sorptivity, S []; and (e, f) wetting front potential, hf [m]. Lines inside each box represent the median, while box edges mark the first and third quartiles.
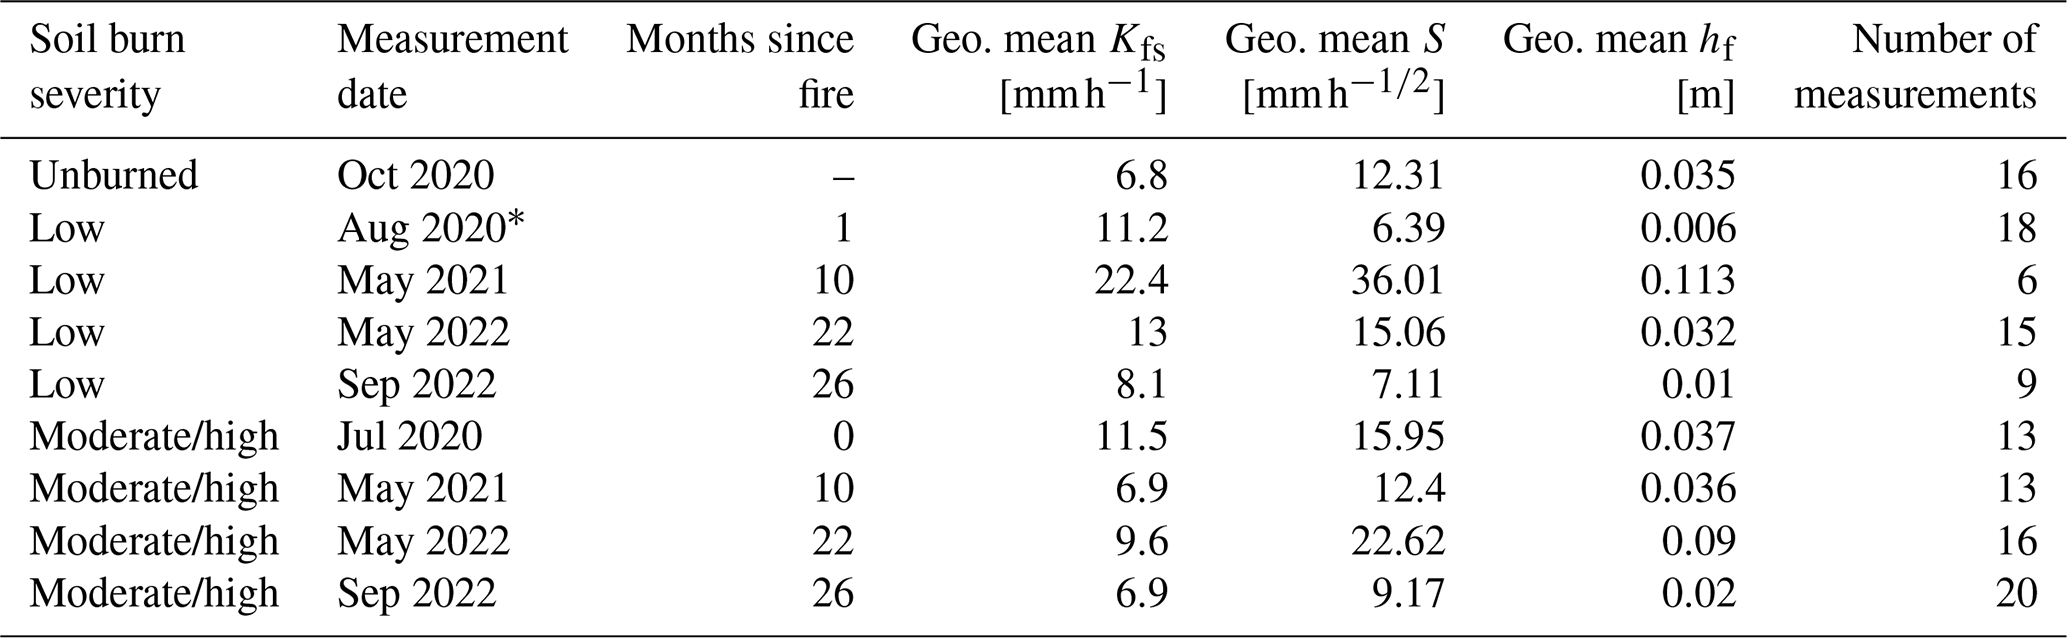
Table 2Summary of soil hydraulic parameters estimated from minidisk tension infiltrometer measurements. We use the geometric mean (geo. mean) as a representative value for the distribution in numerical modeling. ∗ Six measurements are also included from July 2020.
The median field-saturated hydraulic conductivity, Kfs, was slightly greater in areas burned at moderate/high severity in the first few months following the fire relative the unburned area, though a Kruskal–Wallis test indicated no significant differences in the median of the distributions (p=0.27) (Fig. 4). The geometric means of Kfs in moderate-/high-severity, low-severity, and unburned soils were 12, 11, and 7 mm h−1, respectively (Table 2). A Kruskal–Wallis test also indicated no significant differences in the median of the distributions of sorptivity in areas burned at different severities in the first few months following the fire (p=0.24). The geometric mean of S varied from 16 in soils burned at moderate/high severity to 6 and 12 in soils burned at low severity and unburned, respectively (Table 2). Soil water repellency, which was greater at the surface than at 2 cm depth, also did not differ substantially from areas burned at moderate/high severity to areas burned at low severity in the first month following the fire (Fig. S3). At the surface of soils burned at moderate or high severity, approximately 55 % of WDPTs indicated moderate or extreme water repellency. In soil burned at low severity, 33 % of measurements indicated moderate or extreme water repellency. We did not track temporal changes in soil water repellency but estimates of soil hydraulic properties show non-monotonic changes over time in the median and geometric mean of Kfs, S, and hf (Fig. 4, Table 2).
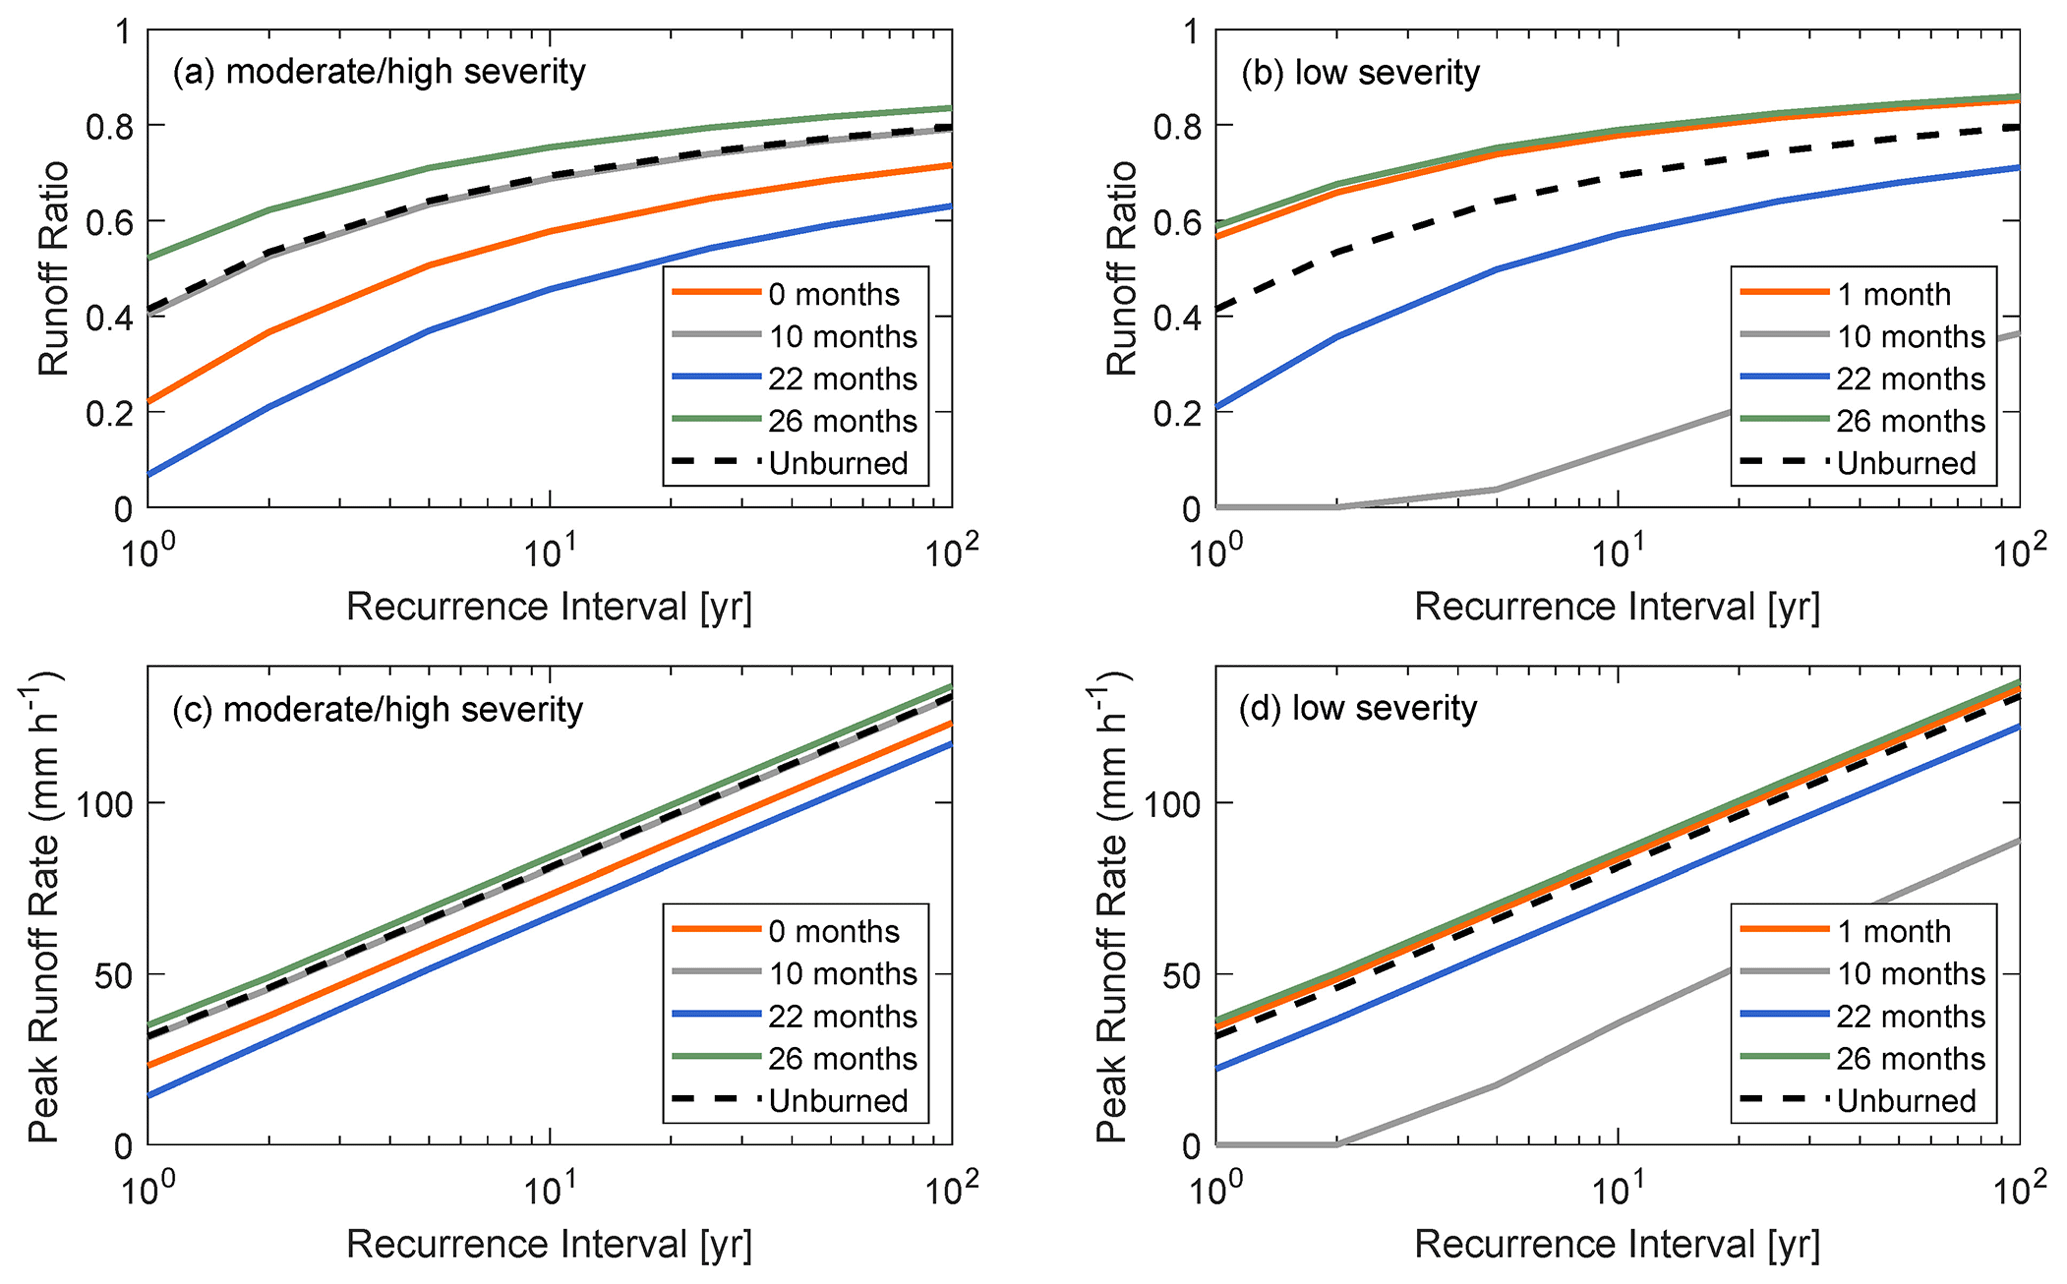
Figure 5Modeled runoff ratios for soils burned at (a) moderate/high severity and (b) low severity as well as modeled peak runoff rates for soils burned at (c) moderate/high severity and (d) low severity. Results for unburned conditions are shown for comparison. Design rainstorms are 15 min in duration with constant rainfall intensities associated with I15 recurrence intervals (RIs) of 1, 2, 5, 10, 25, 50, and 100 years. In both moderate-/high- and low-severity areas, runoff ratios and peak runoff rates oscillate back and forth between being higher or lower relative to unburned soils.
The point-scale rainfall-runoff model constrained by the minidisk measurements indicates that runoff ratios in areas burned at moderate/high severity were lower or similar to those simulated under unburned soil conditions after 0, 10, and 26 months of recovery. Runoff ratios increased slightly relative to unburned soil conditions after 20 months of recovery (Fig. 5). Runoff ratios on soils burned at low severity were greater than unburned conditions after 1 and 26 months of recovery and lower than unburned conditions after 10 and 20 months of recovery. Peak runoff rates over time in areas of moderate/high and low burn severity followed similar patterns in terms of their values relative to those determined for unburned soil (Fig. 5).
Table 3Summary of watershed characteristics and rainfall intensities that produced debris flows. The 15 min rainfall intensity threshold predicted by the M1 likelihood model is denoted by , while I15 denotes the 15 min rainfall intensity associated with debris flow initiation. An asterisk indicates a constraint on debris flow timing within the rainstorm, meaning that I15 denotes the triggering intensity. RI is the recurrence interval of I15.
4.2 Spatial and temporal distribution of debris flow activity
We observed 16 debris flows from 11 different watersheds during the first monsoon season following the fire, with the last debris flows occurring in early September 2020 (Table 3). There were no other debris flows during the remainder of the monitoring period, which extended through September 2022. Four of the five intensively monitored watersheds produced two or more debris flows, with watershed B being the exception. Watershed E was the only intensively monitored watershed to produce three debris flows, two of which initiated during the same rainstorm; 6 of the 12 additional watersheds that we surveyed at the end of the 2020 monsoon season produced debris flows following the fire, but we were unable to determine whether these watersheds produced multiple debris flows. We did not observe any evidence of dry ravel or mass failure (e.g., shallow landslides) on hillslopes. Following the debris-flow-producing rainstorms in July and September, we observed rilling on hillslopes and gully erosion in areas of flow concentration (Fig. 2b). Lateral levees and debris flow deposits downstream of areas of abundant channel and valley incision indicate debris flow initiation was facilitated by runoff and sediment transport processes rather than mobilization from shallow landslides on hillslopes.
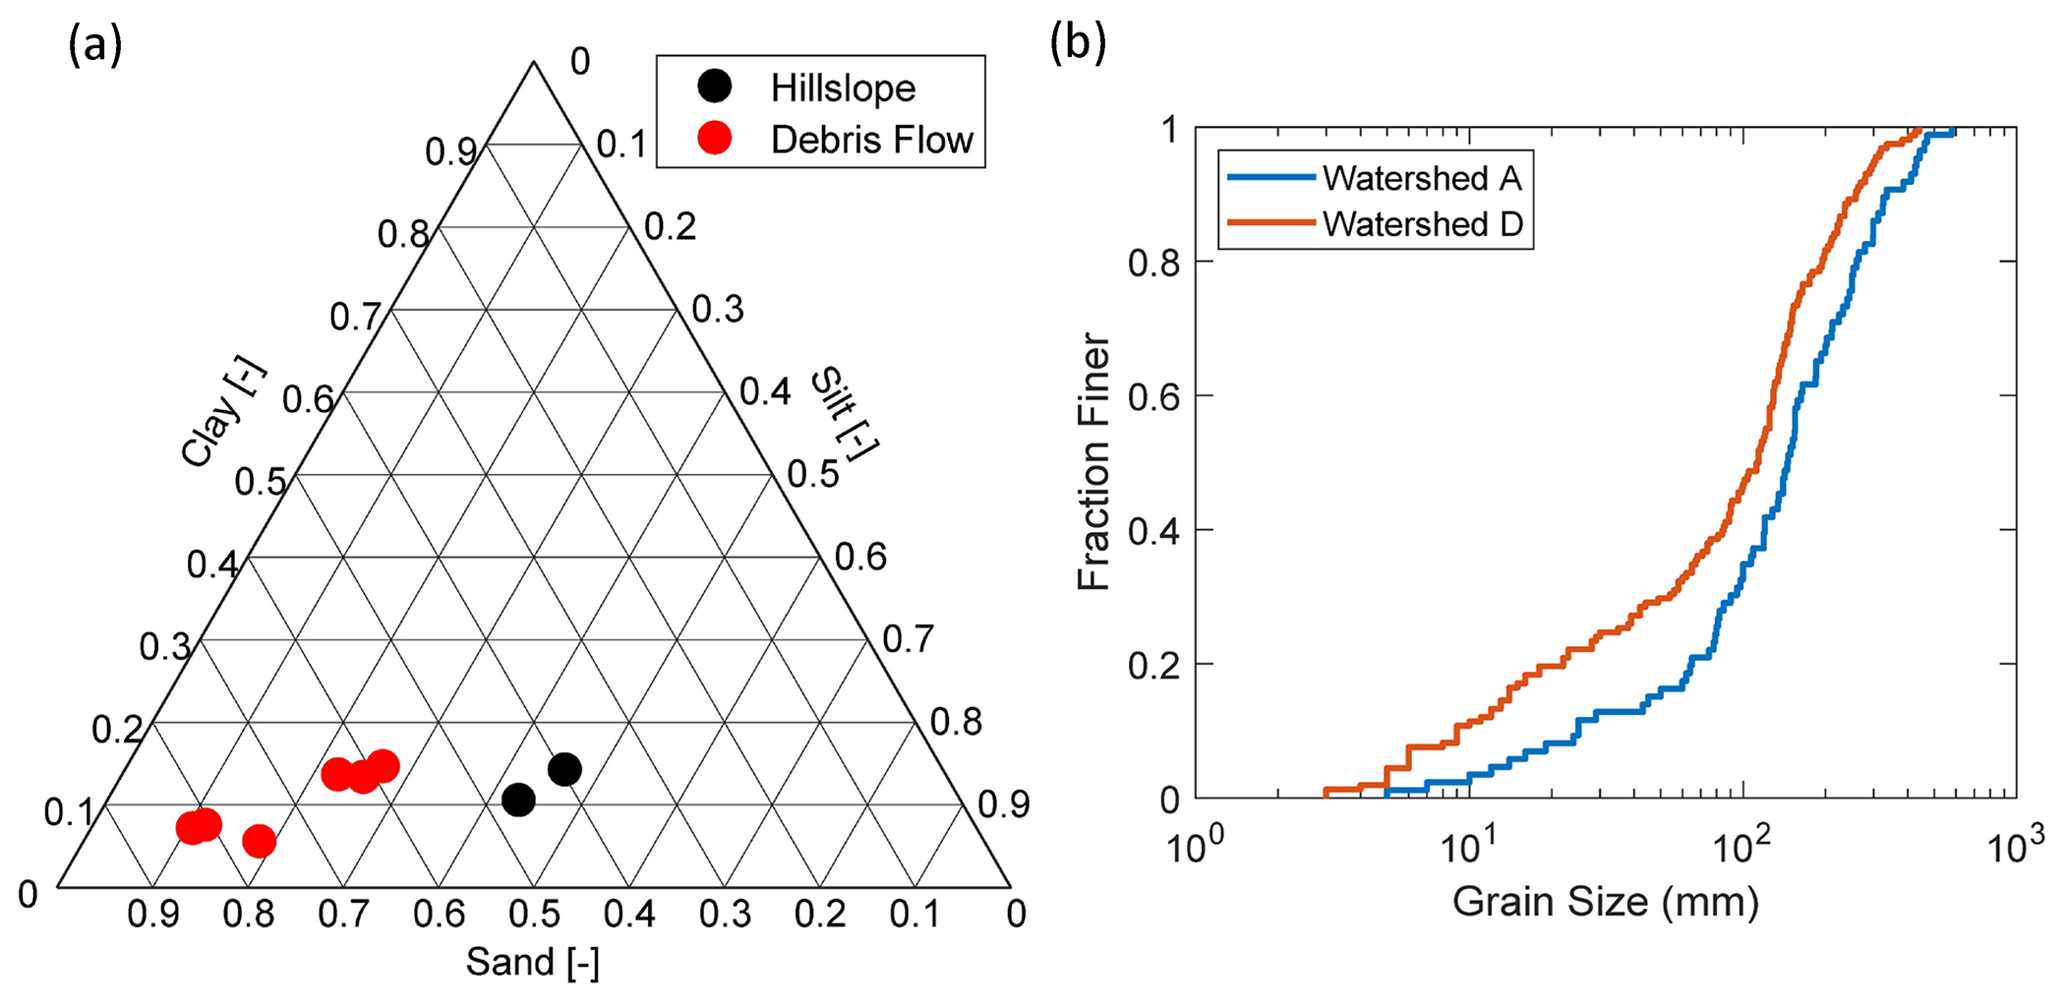
Figure 6(a) Ternary diagram showing differences in the fractions of sand, silt, and clay within the fine (< 2 mm) fraction of samples from debris flow deposits and burned hillslopes. Debris flow deposits have, on average, substantially greater sand content. (b) Grain size distributions of the coarse fraction (> 2 mm) from two debris flow deposits as determined by a pebble count. A total of 86 and 158 clasts were counted for the deposits in watersheds A and D, respectively.
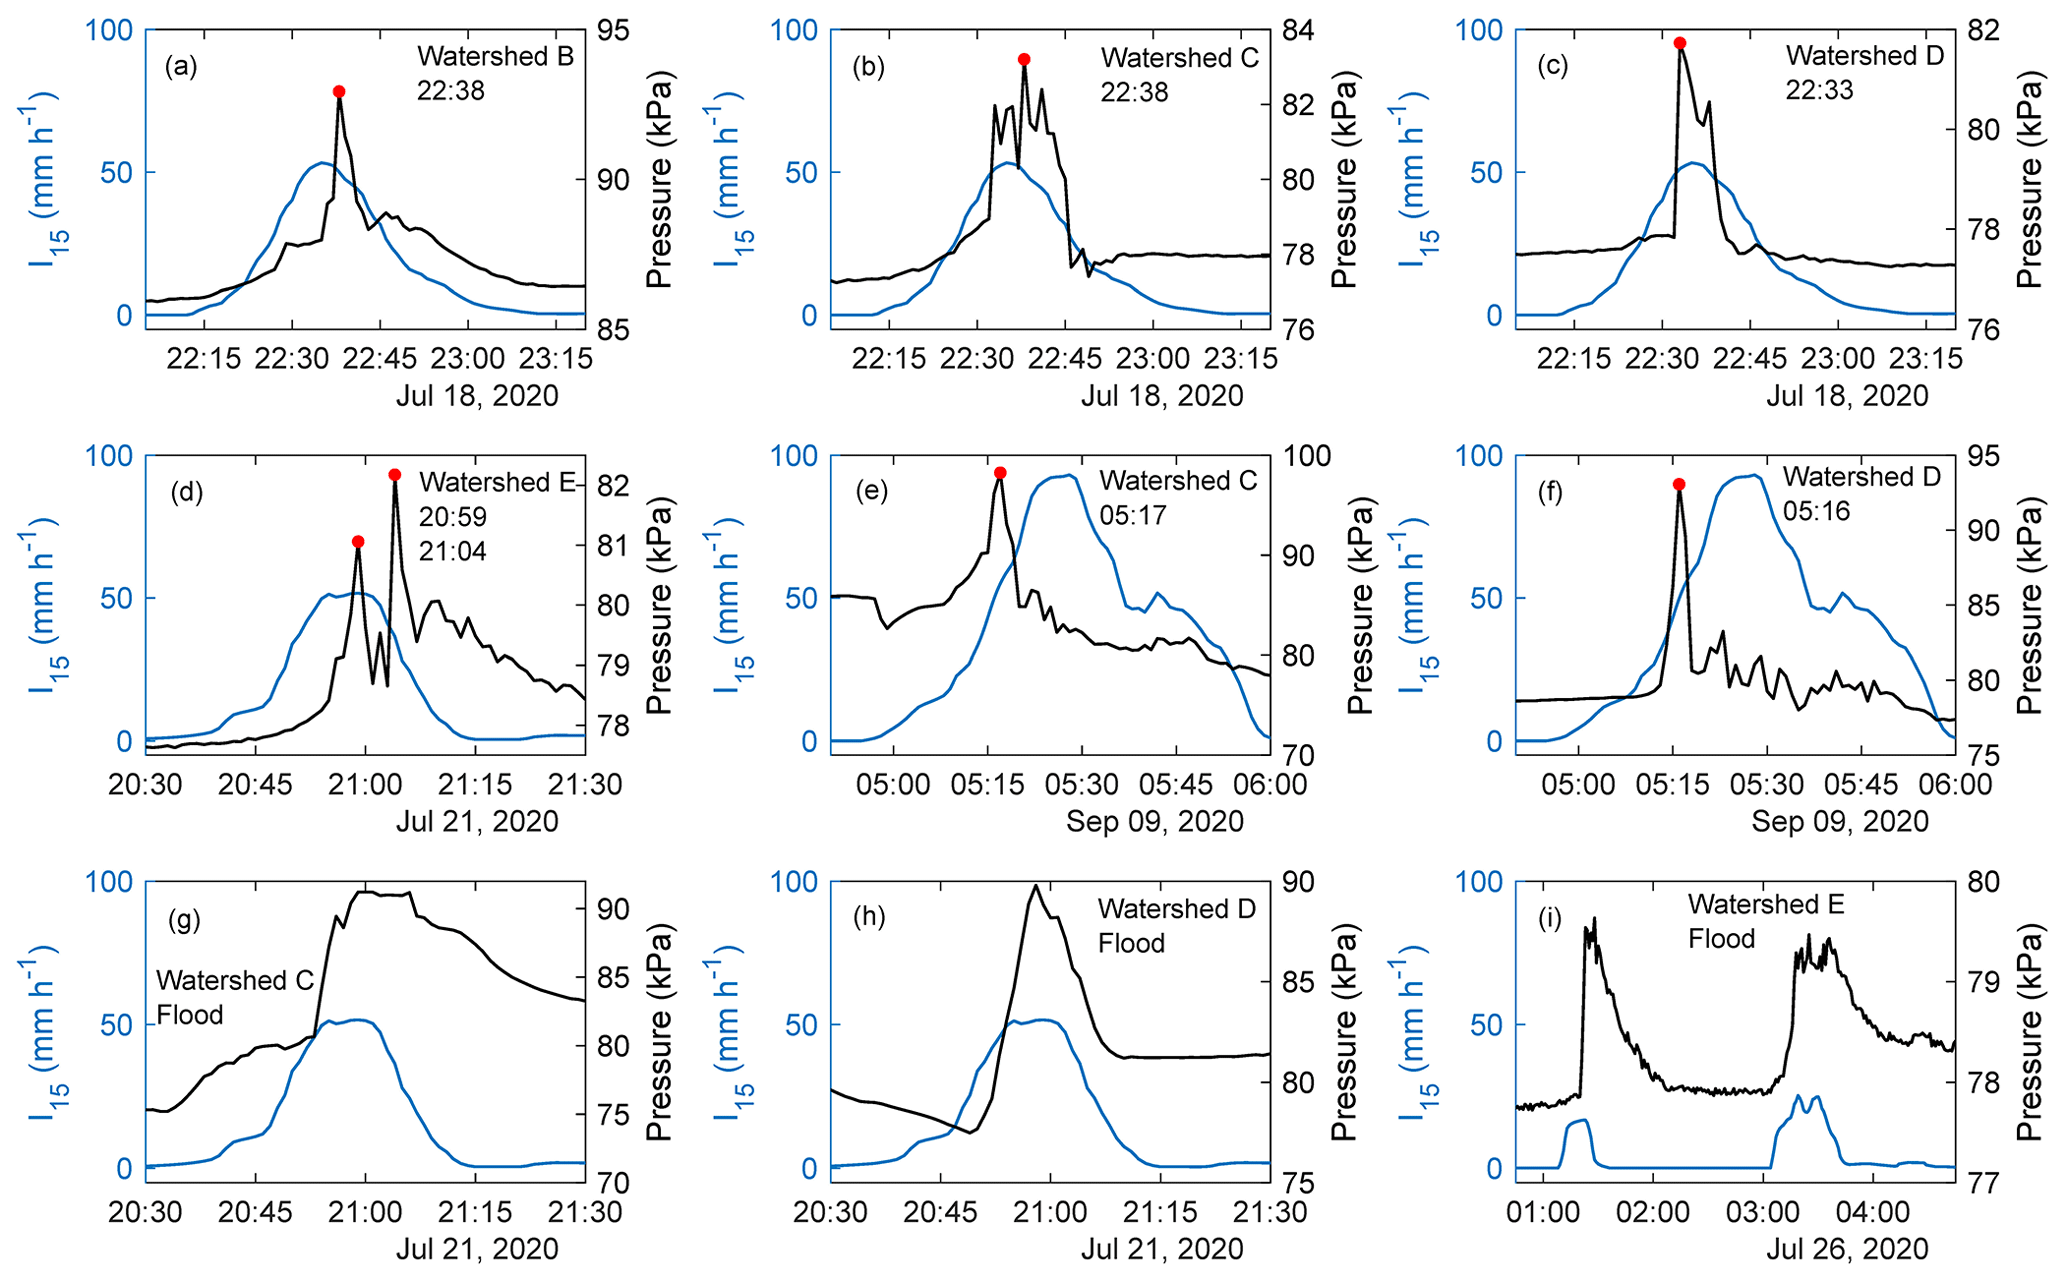
Figure 7We determined timing of debris flows during rainstorms based on rapid changes in pressure over time periods of several minutes. (a–f) The timing of a debris flow is indicated by a red dot, with the time (UTC) included in the upper right corner. (g–i) Water-dominated flood flows are characterized by a more gradual rise and fall of pressure that roughly coincides with temporal variations in the 15 min average rainfall intensity, I15.
Debris-flow-producing storms occurred on 18 July, 21 July, 24 July and 9 September 2020. The debris flows that initiated during the July rainstorms, which were less intense than the rainstorm on 9 September 2020, left terminal deposits on Forest Road 3131A and transitioned to water-dominated flood flows below the road. The debris flows triggered during the September rainstorm were characterized by longer runout distances and left additional deposits between Forest Road 3131A and Sheep Corral Canyon Road (Fig. 3). The fine fraction (< 2 mm) of debris flow sediment contained a higher concentration of sand (58 %–82 %) compared with two hillslope samples from 0–5 cm (43 %) and similar amounts of clay, roughly 5 %–15 % compared with an average of 12 % on the hillslopes (Fig. 6; Table S1). Sieve analyses of sediment samples from debris flow deposits yielded estimates of D50 that ranged from < 2 to 20 mm with a median of approximately 6 mm. The coarse fraction of debris flow deposit sediment, as quantified using pebble counts at watershed A and watershed D, had a D50 of 112 and 147 mm, respectively, and a D90 of 259 and 335 mm, respectively (Fig. 6).
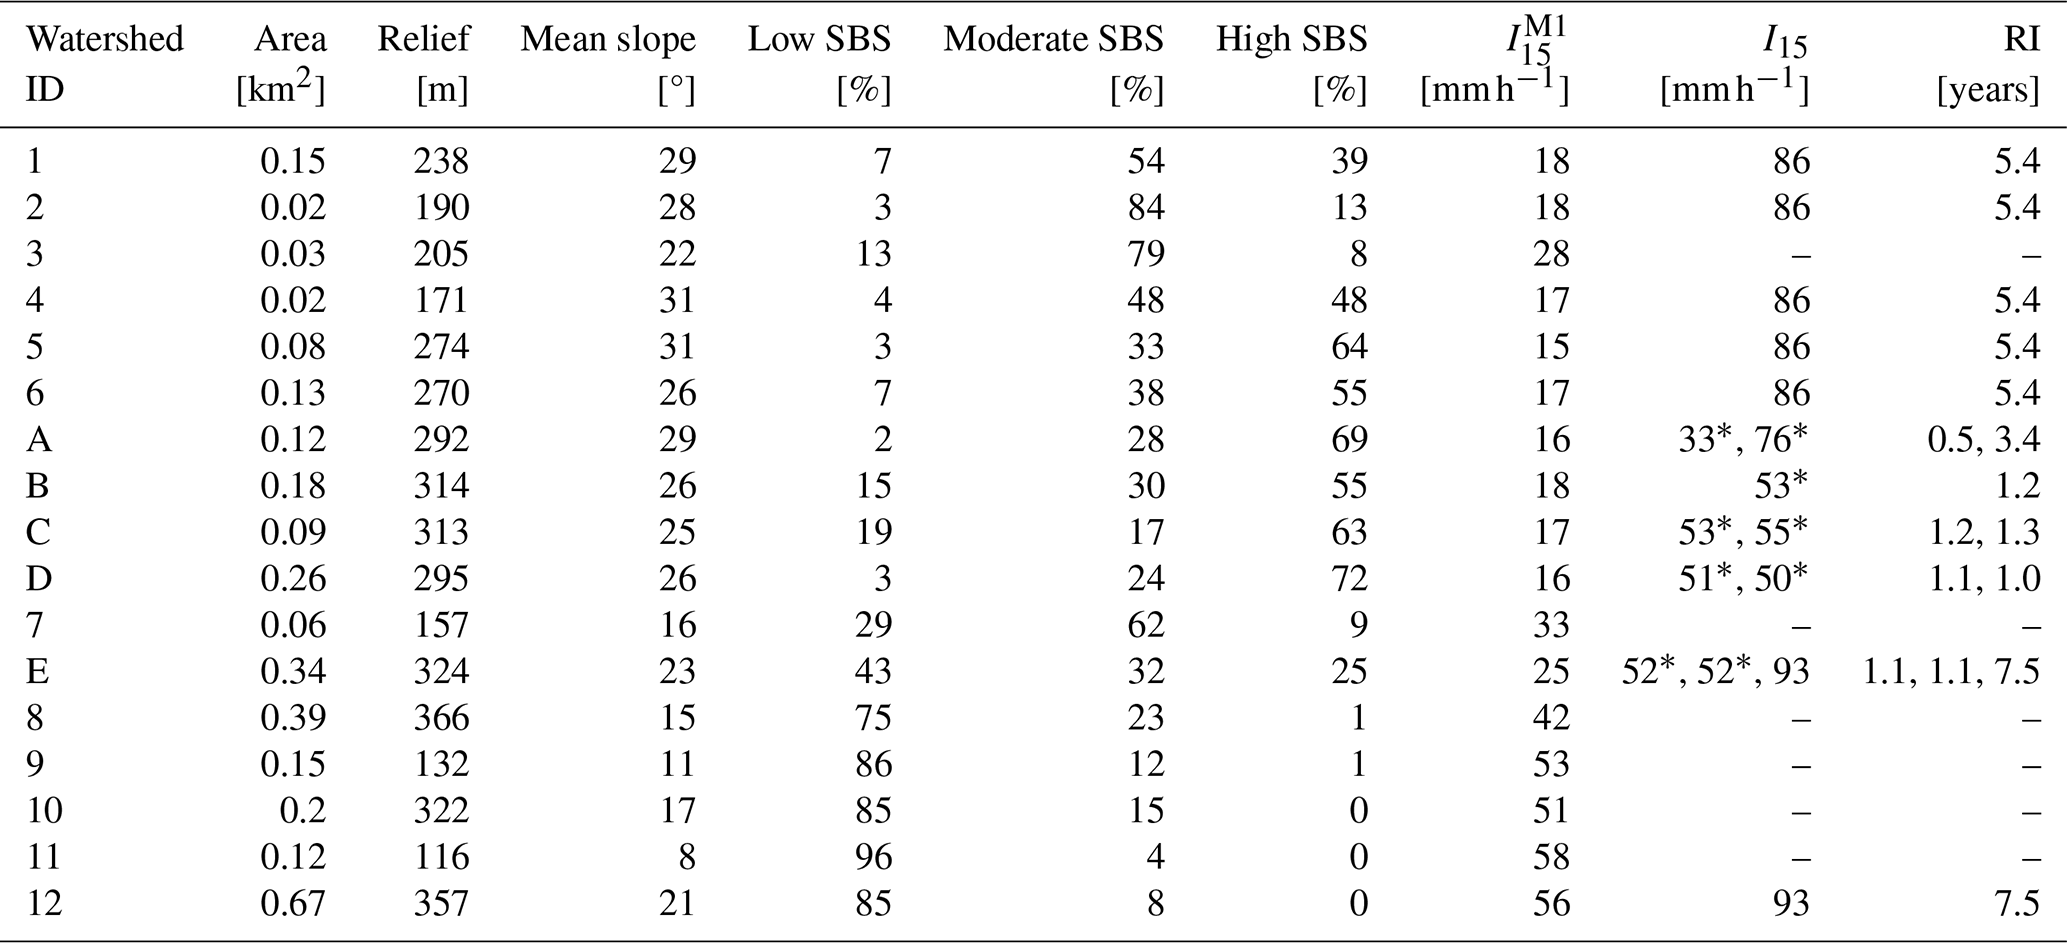
Watersheds that produced debris flows were characterized by mean slopes greater than 20° and a fraction of area burned at moderate or high severity that exceeded 0.57 in all but one instance (Table 3). Watershed 12, only 8 % of which burned at moderate or high severity, produced a debris flow. Watersheds with substantial area burned at moderate or high severity, such as watershed 7 with 71 % area burned at moderate/high severity, did not always produce debris flows if they had a more modest mean slope. The I15 thresholds determined by the M1 model, however, account for spatially variable terrain and burn severity properties among watersheds that affect debris flow potential. The M1-modeled I15 thresholds, , varied from 16 to 58 mm h−1. Since all watersheds shared the same average soil KF factor, 0.2, variations in the modeled thresholds can be attributed to differences in topography, soil burn severity classification, and dNBR; 10 watersheds had 25 mm h−1, and all of these watersheds produced debris flows (Table 3). Watershed 12 also produced a debris flow despite having the second highest M1 threshold of all monitored watersheds, = 56 mm h−1.
4.3 Characteristics of debris-flow-triggering rainstorms
We were able to determine debris flow timing within rainstorms for 9 of the 16 observed debris flows based on time series data from pressure transducers (Fig. 7) and geophones (Fig. 8). Six debris flows occurred in watersheds that were not intensively monitored. Two debris flows initiated in watershed A, where geophones were installed, during rainstorms on 24 July 2020 and 9 September 2020. Seven debris flow events were captured by pressure transducers. The one remaining debris flow occurred on 9 September 2020 in watershed E, but we were unable to get timing information for this flow since the pressure transducer was destroyed by a debris flow on 21 July 2020. The peak 15 min rainfall intensities of rainstorms that produced debris flows, all of which occurred in the first few months following the fire, varied from 34–93 mm h−1 (Table 3). Peak 15 min rainfall intensities were lower during the 2021 and 2022 monsoon season, but the lowest debris-flow-triggering rainfall intensity of I15 = 33 mm h−1 was exceeded during four rainstorms in 2021 and three rainstorms in 2022. The highest I15 recorded after the 2020 monsoon season, I15 = 56 mm h−1, occurred on 15 August 2022.
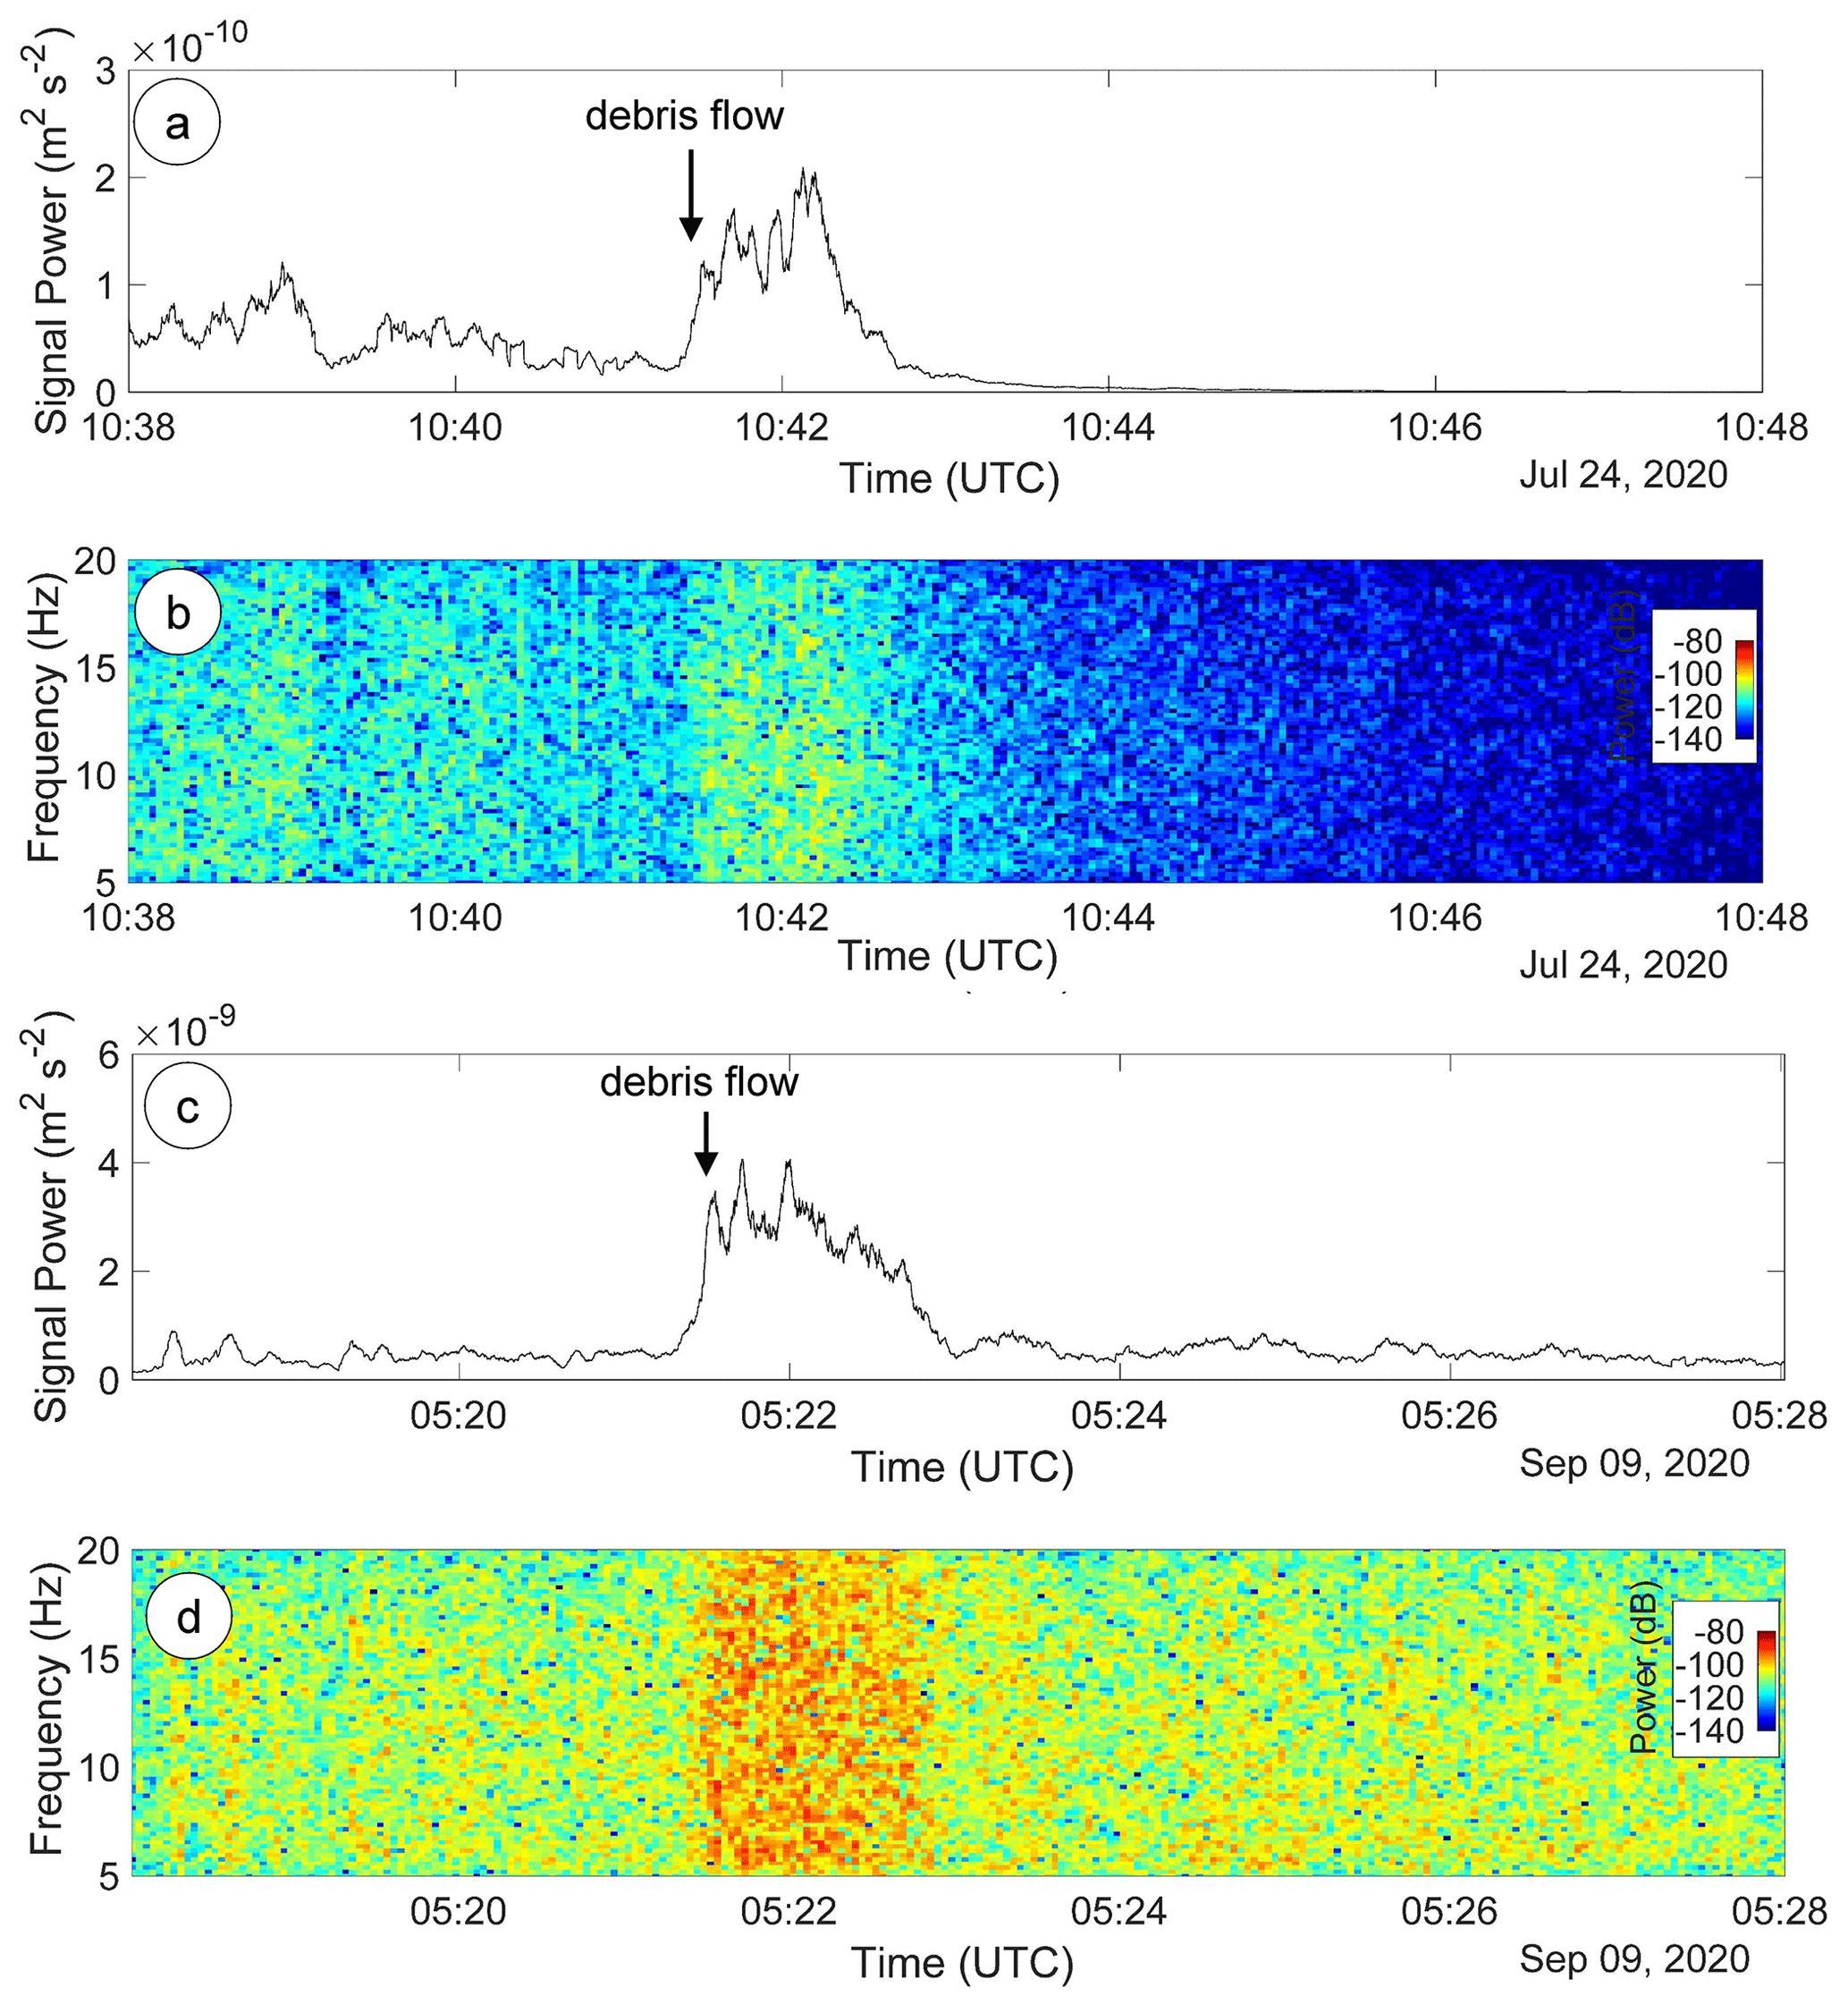
Figure 8We used ground velocity recorded by the upper geophone to estimate debris flow timing within rainstorms at watershed A on (a, b) 24 July 2020 and (c, d) 9 September 2020. Passage of a debris flow is characterized by a rapid increase in signal power (dB), which tapers off more slowly, across a range of frequencies.
In the nine cases where we were able to determine debris flow timing within rainstorms, we computed the triggering I15 and found that it ranged from 33–76 mm h−1 (Table 3). In four of the nine cases, the peak and triggering I15 values were the same (Table S2). In the five remaining cases, the difference between the peak and triggering I15 was 43, 38, 1, 2, and 10 mm h−1 (Table S2). Storm cumulative rainfall totals were also greater than storm rainfall totals prior to debris flows, with the most substantial difference (31 mm) occurring during the storm on 9 September 2020 (Table S2). On average, the debris-flow-triggering time (i.e., the time the debris flow was observed at the outlet) was approximately 3 min before the time of the peak I15 (Fig. 7). The debris-flow-triggering time preceded the peak I15 in six out of nine instances. Debris flows passed the watershed outlet, on average, less than 1 min following the time of peak I10. In contrast, debris-flow-triggering times preceded the time of peak I30 and I60 by roughly 13 and 31 min.
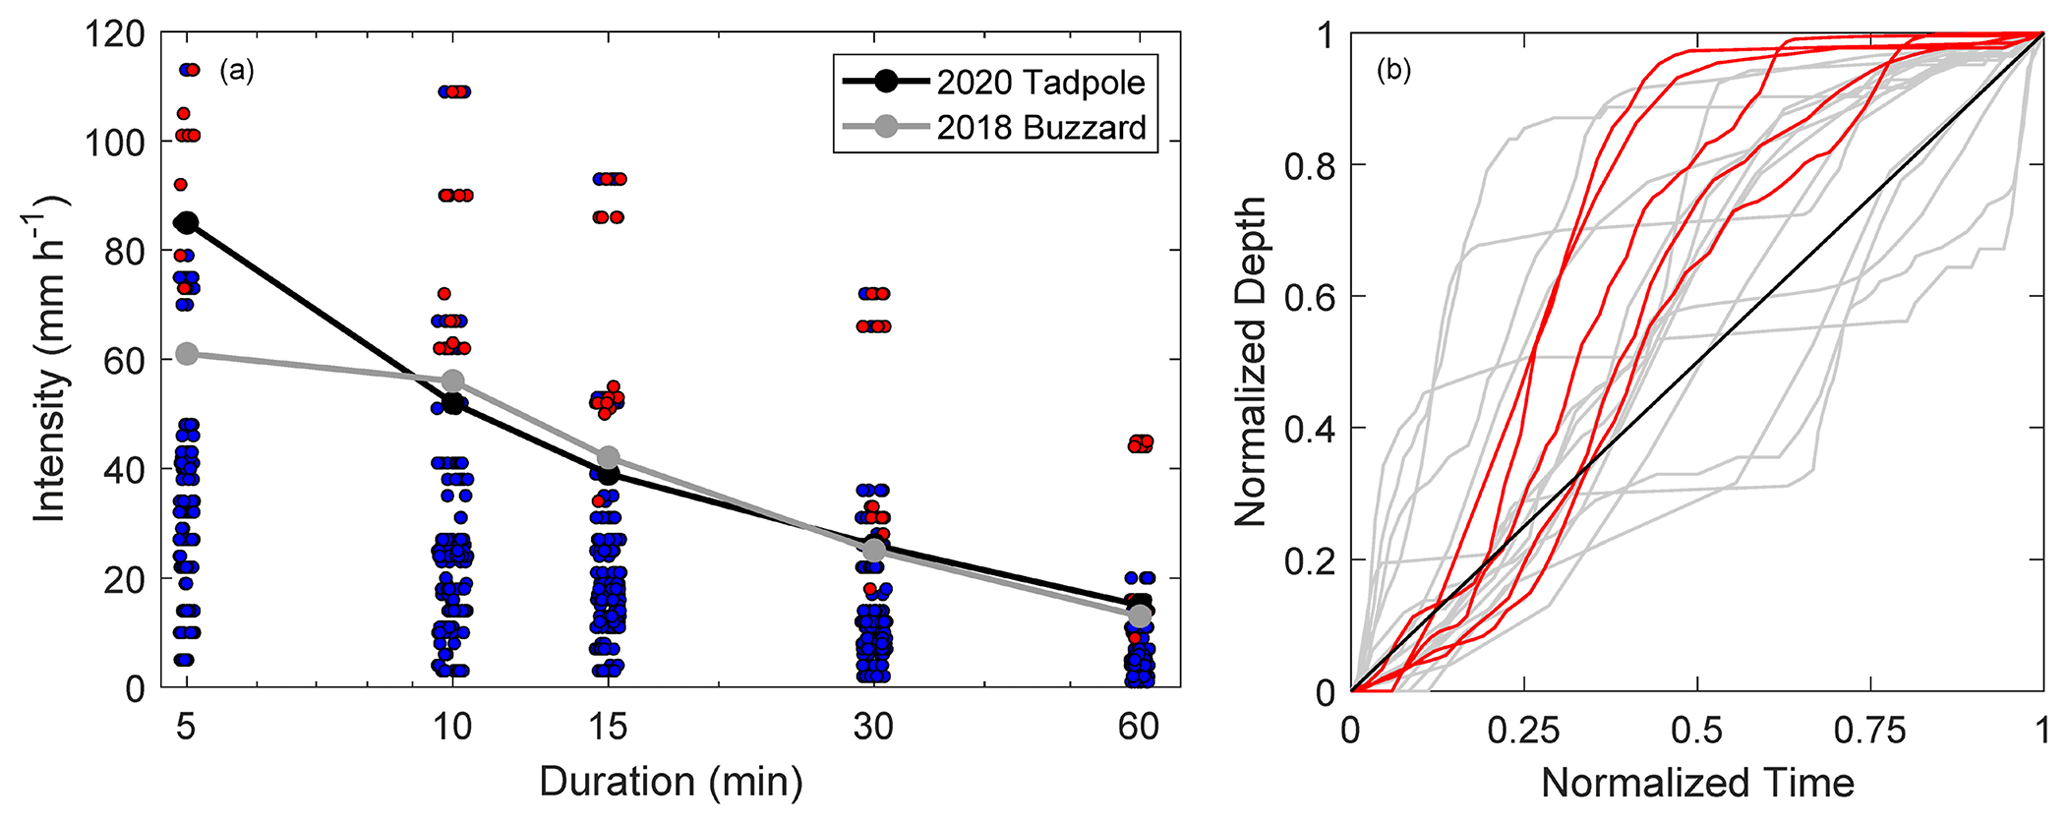
Figure 9(a) Rainstorms that produced debris flows (red circles) can be separated well in intensity–duration (ID) space from those that produced flood responses or no response (blue circles). The rainfall ID threshold derived for the Tadpole Fire is similar to the threshold derived previously by McGuire and Youberg (2020) for the nearby 2018 Buzzard Fire. (b) Standardized rainfall profiles show that the temporal distribution of rainfall within rainstorms that produced debris flows (red curves) is similar, with the majority of rainfall occurring during the second quarter of the storm duration (0.25 ≤ normalized time ≤ 0.5). Rainstorms that did not produce debris flows (grey curves) are characterized by more varied distributions of rainfall. Note that the standardized rainfall profiles are plotted using normalized rainfall depth, so the curves do not provide information of the absolute value of rainfall depth during different portions of the rainstorm.
Debris-flow-producing rainstorms could be separated reasonably well from those that did not produce debris flows by using an ID threshold (Fig. 9). The threshold intensities associated with durations of 5, 10, 15, 30, and 60 min are 85, 52, 39, 26, and 15 mm h−1, respectively. The performance of the thresholds varied with duration. Threat scores of 0.43, 0.41, 0.41, 0.38, and 0.35 were associated with durations of 5, 10, 15, 30, and 60 min, which indicates better performance when using intensities averaged over shorter durations.
The recurrence interval of peak 15 min rainfall intensities during debris-flow-producing storms ranged from 0.5–7.5 years with a mean of 3.4 years. In contrast, the recurrence interval of 15 min rainfall intensities that triggered debris flows (i.e., only including observations where we have flow timing data) ranged from 0.5–3.4 years with a mean of 1.3 years (Table 3). All four rainstorms that produced debris flows were categorized as Q2 storms since more rainfall occurred during the second quartile of the storm duration than during any of the three other quartiles. There was a total of 24 remaining rainfall records with a peak I15 above 10 mm h−1, and 6, 6, 4, and 8 of these were categorized as Q1, Q2, Q3, and Q4, respectively. The four debris-flow-triggering rainstorms all share qualitatively similar SRP patterns but are not extreme in terms of their rainfall distributions relative to other rainstorms that did not produce debris flows (Fig. 9).
5.1 Spatial and temporal patterns in debris flow activity
The first debris flows following the fire initiated on 18 July 2020, roughly 6 weeks after the fire ignited on 6 June 2020 and only 2 d after the fire was contained on 16 July 2020. It is not uncommon in the southwestern USA, particularly in Arizona and New Mexico, for post-fire debris flows to initiate shortly following, or even prior to, fire containment. Debris flows initiated at the Pinal Fire (Raymond et al., 2020) and Frye Fire (McGuire and Youberg, 2019) in southern Arizona in July 2017 prior to when each was contained, in August and September 2017, respectively. The potentially short time between fire containment and the onset of intense monsoon rainfall capable of triggering debris flows highlights the importance of pre-fire planning for post-fire hazards in this region (Tillery et al., 2014). In terms of the temporal persistence of the debris flow hazard, our study site experienced a marked reduction in PFDF susceptibility over a time period of 1 year or less, with no debris flows occurring during the second or third monsoon season after the fire. DeGraff et al. (2015) found that roughly 71 % of post-fire debris flows in the western USA were generated in the first 6 months following fire, though Hoch et al. (2021) and Tillery and Rengers (2020) reported runoff-generated debris flows 1–2 years following fire in ponderosa pine forests of western New Mexico. Observations from around the world similarly indicate that runoff-generated PFDFs tend to occur primarily, though not exclusively, in the first year following fire (Wang et al., 2022; Jin et al., 2022; Esposito et al., 2023; García-Ruiz et al., 2013; Jordan, 2016).
Examining the temporal changes in understory vegetation, ground cover, and soil hydraulic properties in relation to changes in debris flow activity provide insight into the fire-related factors controlling PFDF initiation. All of the observed debris flows occurred within the first 2 months following containment of the fire in July 2020 (Table 3). The highest peak I15 at the rain gage of watershed A occurred during the first monsoon season. However, peak I15 exceeded 33 mm h−1, which was the lowest I15 that led to a debris flow response, in subsequent monsoon seasons, including during four storms in 2021 and three storms during 2022 compared with three storms during 2020 (Fig. S4). Therefore, we do not attribute the observed decline in debris flow activity over time to reductions in rainfall intensity. We documented temporal changes in soil hydraulic properties following the fire that exhibit variations around those measured in nearby unburned soils (Fig. 4), which demonstrates that these soil hydraulic properties were relatively resistant to change following the Tadpole Fire. In contrast, the marked decrease in debris flow activity over time coincided with a consistent decrease in bare ground in areas burned at moderate/high severity (Table 1). Past studies in forested environments, in particular, have demonstrated the importance of litter and duff layers in controlling infiltration, runoff, and erosion (Neris et al., 2013). Loss of litter and duff and the subsequent exposure of bare ground can lead to substantial increases in runoff and erosion (Larsen et al., 2009), even in the absence of burning (Robichaud et al., 2016). Due to the close link between runoff, erosion, and PFDF initiation at our site, we hypothesize that the loss of litter and duff played a key role in increasing debris flow likelihood. We cannot rule out, however, additional controls on debris flow activity from other potential fire-related changes to soil physical properties that were not measured, such as aggregate stability, organic matter, and apparent cohesion associated with fine roots.
Infiltration measurements with minidisk infiltrometers did not demonstrate strong spatial differences in soil hydraulic properties with respect to burn severity. Following the Tadpole Fire, we estimated similar values of Kfs, S, and hf in areas burned at moderate/high severity relative to unburned areas or areas burned at low severity (Fig. 4, Table 2). In an analysis of data from southern California, USA, Ebel and Moody (2020) found that the ratios of Kfs, S, and hf in burned to unburned soils were 0.37, 0.36, and 0.66. Substantial variability exists from site to site (Ebel, 2019), however, with post-fire Kfs sometimes being greater relative to that in nearby unburned soils (Raymond et al., 2020). Collecting additional information related to fire effects on soil physical and chemical properties could help explain variability in how soil infiltration capacity changes in response to burning (Ebel et al., 2022), though this was beyond the scope of our study. Infiltration modeling at our site further demonstrates that, across a range of rainfall intensities, runoff ratios and peak runoff rates would be slightly greater in areas burned at moderate/high severity relative to unburned soils and soils burned at low severity when interception and other potential forms of water storage (i.e., by litter, duff) are neglected (Fig. 5). Despite these trends, we only observed runoff-generated debris flows in watersheds that contained a substantial fraction of area burned at moderate/high severity, with one exception. These results support the hypothesis that factors other than fire-induced changes to infiltration capacity, namely decreases in canopy and ground cover (Table 1), were first-order controls on lowering debris flow initiation thresholds in watersheds burned at moderate or high severity. A number of studies at small scales indicate that ground cover is an important control on post-fire sediment yield (Benavides-Solorio and MacDonald, 2001; Robichaud et al., 2013; Johansen et al., 2001). Increases in bare ground are associated with decreased interception, lower hydraulic roughness, and increases in rilling and raindrop-induced erosion on hillslopes that make it easier to mobilize the volume of sediment required to initiate runoff-generated PFDFs (Meyer and Wells, 1997; Larsen et al., 2009).
Variations in rainfall ID thresholds from one watershed to another, which we expect based on differences in watershed morphology and burn severity characteristics, may be accounted for using the M1 likelihood model to estimate basin specific rainfall ID thresholds (Staley et al., 2017). The M1 likelihood model, which was trained using observations from southern California, underpredicted rainfall thresholds for debris flow initiation at the Tadpole Fire (Table 3). However, the M1 model performed well at identifying the monitored watersheds that were most susceptible to debris flows. The watersheds with the lowest M1 I15 threshold were also the watersheds that produced debris flows, whereas those with higher thresholds did not produce debris flows (Table 3). The lone exception to this trend is watershed 12. Watershed 12 was located farthest from the rain gages (4.1 km), so it is possible that the debris flow observed there was triggered by more intense rainfall than what was received by the rain gages and the other watersheds (Fig. 1). The ability of the M1 model to assess relative susceptibility indicates that the variables in the M1 model, namely MH23, dNBR, and the soil KF factor, remain good predictors of debris flow potential in our study area despite the previously noted site-specific differences (e.g., presence/absence of dry ravel) in debris flow initiation processes between southern California and our study site. A study of runoff-generated post-fire debris flows in Greece also found a significant correlation between debris flow occurrence and a debris flow likelihood predicted by a slightly modified version of the M1 model (Diakakis et al., 2023), which used a Europe-wide soil erodibility index (K factor) (Panagos et al., 2014) in place of the KF factor. The model's ability to identify watersheds susceptible to debris flows across these different settings suggests that it captures elements of watershed morphology that are first-order controls on debris flow initiation.
5.2 Characteristics of debris-flow-triggering rainstorms
The 15 min average rainfall intensities responsible for triggering debris flows ranged from 33–76 mm h−1 (Table 3). Standardized rainfall profiles of debris-flow-producing storms generally plotted above the 1–1 line (Fig. 9), which is a characteristic associated with convective rainstorms (Esposito et al., 2023). This finding is consistent with the timing of debris flows during the summer months shortly following the fire when convective rainstorms associated with the North American monsoon are common in the region. Esposito et al. (2023) similarly found that storms that produced PFDFs in Italy had SRPs consistent with convective rainstorms rather than frontal systems. Debris-flow-triggering rainfall intensities are greater than the I15 = 19 mm h−1 threshold for PFDFs in the San Gabriel Mountains of southern California (Staley et al., 2013) but are consistent with other recent observations from western New Mexico where the triggering I15 varied from 28–79 mm h−1 (McGuire and Youberg, 2020). The recurrence interval of I15 that produced debris flows at the Tadpole Fire, which had a mean of 1.3 years when considering only cases where we have constraints on debris flow timing within rainstorms, highlights the susceptibility of severely burned watersheds to debris flows. Staley et al. (2020) similarly found that the RI of a debris-flow-producing I15 across a range of burned sites in the western USA had a geometric mean of 0.9 years.
A comparison of the rainfall ID thresholds between the Tadpole Fire and the nearby 2018 Buzzard Fire, which also burned through ponderosa pine in the Gila National Forest, indicates similarities that are encouraging for application of a regional PFDF ID threshold for similar areas in New Mexico (Fig. 9). The I15 threshold of 39 mm h−1 is roughly equivalent to the 42 mm h−1 threshold found at the Buzzard Fire (McGuire and Youberg, 2020) and slightly lower than the 56 mm h−1 threshold identified by Raymond et al. (2020) following fire in chaparral-dominated watersheds in southern Arizona. A comparison of the Tadpole Fire I15 threshold (39 mm h−1) with the regional threshold for the San Gabriel Mountains (19 mm h−1) (Staley et al., 2013), however, indicates that more intense rainstorms are generally needed to trigger debris flows via runoff in the immediate aftermath of fire in forested steeplands in New Mexico relative to southern California. These differences could be associated with variations in watershed morphology among the two locations (e.g., slope, channel width) and sediment availability (e.g., relatively minimal dry-ravel activity in New Mexico) or be due to differences in the typical severity or spatial patterns of burn severity. However, it appears that these are not the only factors involved since variations in watershed morphology and burn severity that are first-order controls on debris flow likelihood should be accounted for by the M1 model.
The M1-modeled I15 thresholds substantially underestimated the I15 needed to trigger debris flows in our study area. The average difference between the triggering I15 and the M1-modeled I15 threshold, in watersheds where we could constrain debris flow timing within rainstorms, was 34 mm h−1 (Table 3). We hypothesize that a bias towards underestimating ID thresholds at our site may be related, at least in part, to differences in the climatology of intense rainfall between our study site and the sites in southern California that supplied the training data for the M1 model and/or to differences in the particle size distribution and cohesion of sediment available for transport following fire. We did not observe dry ravel at our site, and the main sediment source for debris flows appeared to be colluvial deposits stored in unincised valley bottoms. This is in strong contrast to the abundant supply of fine, relatively cohesionless sediment delivered from hillslopes to channels via dry ravel following fire in the San Gabriel Mountains (DiBiase and Lamb, 2020).
Rainfall ID thresholds and estimates of the RI of rainfall associated with debris flow initiation provide information for practitioners, decision-makers, and emergency managers tasked with assessing and mitigating the effects of PFDF hazards. There is a general gap, however, in the data that constrain the timing of debris flows within rainstorms in many regions (Staley et al., 2020). In the absence of in situ monitoring equipment, such as stage gages, pressure transducers, geophones, or video cameras, the peak rainfall intensity during a debris-flow-producing storm is taken as an estimate of the triggering intensity. Staley et al. (2013) document significant differences between triggering intensities and peak intensities in southern California, and data from Raymond et al. (2020) indicate that 15 min peak intensities overestimate debris-flow-triggering intensities, on average, by 26 mm h−1 in southern Arizona. Here, differences between the peak and triggering I15 varied from 0–43 mm h−1. If peak rainfall intensity were used in all cases to estimate the triggering I15, the average RI of the debris-flow-triggering I15 would increase from 1.3 to 3.4 years. The observations presented here help improve situational awareness for PFDFs in a region where increases in the number of fires and area burned at high severity (Singleton et al., 2019) are likely to promote conditions conducive to larger and more frequent debris flows.
We monitored debris flow activity in a series of steep watersheds burned by the 2020 Tadpole Fire in western New Mexico, USA, over more than 2 years; 16 debris flows initiated within 11 different watersheds in the first monsoon season following the fire. Rainfall intensities responsible for triggering debris flows were not extreme, having recurrence intervals of approximately 1 year. No debris flows were observed during the second or third monsoon season following the fire, despite rainfall intensities that exceeded those responsible for triggering debris flows in the first several months after the fire. These observations indicate a rapid reduction in debris flow susceptibility with time since fire. Measurements of soil infiltration, understory canopy cover, and ground cover indicate that post-fire changes to soil hydraulic properties did not play a primary role in promoting debris flow initiation following the fire; 15 of the 16 debris flows initiated in watersheds that burned primarily at moderate or high severity. However, in situ measurements indicated similar or slightly greater soil infiltration capacity immediately following the fire in areas burned at moderate to high severity relative to areas that were unburned or burned at low severity. We attribute increased debris flow activity in areas burned at moderate to high severity to decreases in canopy and ground cover, which were substantially lower immediately following the fire in areas burned at moderate to high severity compared with areas burned at low severity. Although we note many differences between our study area and recently burned areas in southern California, a debris flow likelihood model trained on data from southern California was successful at providing a relative measure of debris flow susceptibility across our monitored watersheds. Results provide additional constraints on the rainfall intensities responsible for triggering PFDFs in a region where increases in the number of fires and the area burned at high severity are anticipated to increase risk associated with PFDFs in the future.
Data used for analyses in this study are available in McGuire et al. (2023, https://doi.org/10.4211/hs.136eeec98a4141e6aedb57bdf6fb1fb5) and Rengers et al. (2022, https://doi.org/10.5066/P9I564PP).
The supplement related to this article is available online at: https://doi.org/10.5194/nhess-24-1357-2024-supplement.
LAM, FKR, AMY, ANG, and OJH planned the study and performed initial field equipment installation. LAM, FKR, AMY, ANG, OJH, and RB maintained field equipment and contributed to field data collection efforts. RP led analysis of the geophone data. LAM prepared the manuscript and led other data analysis tasks with contributions from all co-authors.
The contact author has declared that none of the authors has any competing interests.
Any use of trade, firm, or product names is for descriptive purposes only and does not imply endorsement by the U.S. Government.
Publisher's note: Copernicus Publications remains neutral with regard to jurisdictional claims made in the text, published maps, institutional affiliations, or any other geographical representation in this paper. While Copernicus Publications makes every effort to include appropriate place names, the final responsibility lies with the authors.
We thank Beth Ihle, Carolyn Koury, and Mike Natharius for assistance with site access and soil burn severity data.
This research has been supported by the National Integrated Drought Information System (grant no. 1332KP20FNRMT0012), the Arizona Geological Survey, and the U.S. Geological Survey (grant/cooperative agreement no. G23AC00447-00).
This paper was edited by Mario Parise and reviewed by Giuseppe Esposito and Don Lindsay.
Benavides-Solorio, J. and MacDonald, L. H.: Post-fire runoff and erosion from simulated rainfall on small plots, Colorado Front Range, Hydrol. Process., 15, 2931–2952, 2001.
Bonnin, G. M., Martin, D., Lin, B., Parzybok, T., Yekta, M., and Riley, D.: NOAA Atlas 14, Precipitation-Frequency Atlas of the United States, Volume 1 Version 5.0: Semiarid Southwest (Arizona, Southeast California, Nevada, New Mexico, Utah), National Weather Service, Silver Spring, MD, https://hdsc.nws.noaa.gov/pfds/pfds_map_cont.html (last access: 8 April 2024), 2011.
Bunte, K. and Abt, S. R.: Sampling Surface and Subsurface Particle-Size Distributions in Wadable Gravel- and Cobble-Bed Streams for Analyses in Sediment Transport, Hydraulics, and Streambed Monitoring, General Technical Report RMRS-GTR-74, US Department of Agriculture, Forest Service, 450 pp., https://doi.org/10.2737/RMRS-GTR-74, 2001.
Cannon, S. H., Gartner, J. E., Wilson, R. C., Bowers, J. C., and Laber, J. L.: Storm rainfall conditions for floods and debris flows from recently burned areas in southwestern Colorado and southern California, Geomorphology, 96, 250–269, 2008.
Cannon, S. H., Gartner, J. E., Rupert, M. G., Michael, J. A., Rea, A. H., and Parrett, C.: Predicting the probability and volume of postwildfire debris flows in the intermountain western United States, Geol. Soc. Am. Bull., 122, 127–144, 2010.
Carsel, R. F. and Parrish, R. S.: Developing joint probability distributions of soil water retention characteristics, Water Resour. Res., 24, 755–769, 1988.
Conedera, M., Peter, L., Marxer, P., Forster, F., Rickenmann, D., and Re, L.: Consequences of forest fires on the hydrogeological response of mountain catchments: a case study of the Riale Buffaga, Ticino, Switzerland, Earth Surf. Proc. Land., 28, 117–129, https://doi.org/10.1002/esp.425, 2003.
Costa, J. E.: Rheologic, geomorphic, and sedimentologic differentiation of water floods, hyperconcentrated flows, and debris flows, Flood Geomorphology, John Wiley & Sons New York, 113–122, ISBN 0471625582, 1988.
Crocker, R. L. and Tiver, N. S.: Survey methods in grassland ecology, Grass Forage Sci., 3, 1–26, 1948.
Degraff, J. V., Cannon, S. H., and Gartner, J. E.: The Timing of Susceptibility to Post-Fire Debris Flows in the Western United States, Environ. Eng. Geosci., 21, 277–292, 2015.
Diakakis, M., Mavroulis, S., Vassilakis, E., and Chalvatzi, V.: Exploring the Application of a Debris Flow Likelihood Regression Model in Mediterranean Post-Fire Environments, Using Field Observations-Based Validation, Land (Basel), 12, 555, https://doi.org/10.3390/land12030555, 2023.
DiBiase, R. A. and Lamb, M. P.: Dry sediment loading of headwater channels fuels post-wildfire debris flows in bedrock landscapes, Geology, 48, 189–193, https://doi.org/10.1130/G46847.1, 2020.
Ebel, B. A.: Measurement Method Has a Larger Impact Than Spatial Scale For Plot-Scale Field-Saturated Hydraulic Conductivity (Kfs) After Wildfire and Prescribed Fire in Forests, Earth Surf. Proc. Land., 44, 1945–1956, https://doi.org/10.1002/esp.4621, 2019.
Ebel, B. A.: Temporal evolution of measured and simulated infiltration following wildfire in the Colorado Front Range, USA: Shifting thresholds of runoff generation and hydrologic hazards, J. Hydrol, 585, 124765, https://doi.org/10.1016/j.jhydrol.2020.124765, 2020.
Ebel, B. A. and Martin, D. A.: Meta-analysis of field-saturated hydraulic conductivity recovery following wildland fire: Applications for hydrologic model parameterization and resilience assessment, Hydrol. Process., 31, 3682–3696, https://doi.org/10.1002/hyp.11288, 2017.
Ebel, B. A. and Moody, J. A.: Synthesis of soil-hydraulic properties and infiltration timescales in wildfire-affected soils, Hydrol. Process., 31, 324–340, https://doi.org/10.1002/hyp.10998, 2017.
Ebel, B. A. and Moody, J. A.: Parameter estimation for multiple post-wildfire hydrologic models, Hydrol. Process., 34, 4049–4066, https://doi.org/10.1002/hyp.13865, 2020.
Ebel, B. A., Moody, J. A., and Martin, D. A.: Post-fire temporal trends in soil-physical and -hydraulic properties and simulated runoff generation: Insights from different burn severities in the 2013 Black Forest Fire, CO, USA, Sci. Total Environ., 802, 149847, https://doi.org/10.1016/j.scitotenv.2021.149847, 2022.
Esposito, G., Gariano, S. L., Masi, R., Alfano, S., and Giannatiempo, G.: Rainfall conditions leading to runoff-initiated post-fire debris flows in Campania, Southern Italy, Geomorphology, 423, 8830–8839, https://doi.org/10.1016/j.geomorph.2022.108557, 2023.
Florsheim, J. L., Keller, E. A., and Best, D. W.: Fluvial sediment transport in response to moderate storm flows following chaparral wildfire, Ventura County, southern California, Geol. Soc. Am. Bull., 103, 504–511, https://doi.org/10.1130/0016-7606(1991)103<0504:FSTIRT>2.3.CO;2, 1991.
Friedman, E. Q. and Santi, P. M.: Relationship between rainfall intensity and debris–flow initiation in a southern Colorado burned area, in: Association of Environmental and Engineering Geologists Special Publication 28, Colorado School of Mines, https://doi.org/10.25676/11124/173181, 2019.
Gabet, E. J. and Bookter, A.: A morphometric analysis of gullies scoured by post-fire progressively bulked debris flows in southwest Montana, USA, Geomorphology, 96, 298–309, 2008.
García-Ruiz, J. M., Arnáez, J., Gómez-Villar, A., Ortigosa, L., and Lana-Renault, N.: Fire-related debris flows in the Iberian Range, Spain, Geomorphology, 196, 221–230, https://doi.org/10.1016/j.geomorph.2012.03.032, 2013.
Gorr, A. N., McGuire, L. A., Youberg, A. M., Beers, R., and Liu, T.: Inundation and flow properties of a runoff-generated debris flow following successive high-severity wildfires in northern Arizona, USA, Earth Surf. Proc. Land., 49, 622–641, https://doi.org/10.1002/esp.5724, 2024.
Graber, A. P., Thomas, M. A., and Kean, J. W.: How Long Do Runoff-Generated Debris-Flow Hazards Persist After Wildfire?, Geophys. Res. Lett., 50, e2023GL105101, https://doi.org/10.1029/2023GL105101, 2023.
Green, H. W. and Ampt, G. A.: Studies on Soil Phyics, 1. The flow of air and water through soils, J Agr. Sci., 4, 1–24, 1911.
Hoch, O. J., McGuire, L. A., Youberg, A. M., and Rengers, F. K.: Hydrogeomorphic Recovery and Temporal Changes in Rainfall Thresholds for Debris Flows Following Wildfire, J. Geophys. Res.-Earth, 126, e2021JF006374, https://doi.org/10.1029/2021JF006374, 2021.
Holden, Z. A., Swanson, A., Luce, C. H., Jolly, W. M., Maneta, M., Oyler, J. W., Warren, D. A., Parsons, R., and Affleck, D.: Decreasing fire season precipitation increased recent western US forest wildfire activity, P. Natl. Acad. Sci. USA, 115, E8349–E8357, https://doi.org/10.1073/pnas.1802316115, 2018.
Huff, F. A.: Time distribution of rainfall in heavy storms, Water Resour. Res., 3, 1007–1019, https://doi.org/10.1029/WR003i004p01007, 1967.
Jin, T., Hu, X., Liu, B., Xi, C., He, K., Cao, X., Luo, G., Han, M., Ma, G., Yang, Y., and Wang, Y.: Susceptibility Prediction of Post-Fire Debris Flows in Xichang, China, Using a Logistic Regression Model from a Spatiotemporal Perspective, Remote Sens.-Basel, 14, 1306, https://doi.org/10.3390/rs14061306, 2022.
Johansen, M. P., Hakonson, T. E., and Breshears, D. D.: Post-fire runoff and erosion from rainfall simulation: contrasting forests with shrublands and grasslands, Hydrol. Process., 15, 2953–2965, 2001.
Jordan, P.: Post-wildfire debris flows in southern British Columbia, Canada, Int. J. Wildland Fire, 25, 322–336, https://doi.org/10.1071/WF14070, 2016.
Kean, J. W., Staley, D. M., and Cannon, S. H.: In situ measurements of post-fire debris flows in southern California: Comparisons of the timing and magnitude of 24 debris-flow events with rainfall and soil moisture conditions, J. Geophys. Res.-Earth (2003–2012), 116, 1–21, https://doi.org/10.1029/2011JF002005, 2011.
Kean, J. W., Staley, D. M., Leeper, R. J., Schmidt, K. M., and Gartner, J. E.: A low-cost method to measure the timing of postfire flash floods and debris flows relative to rainfall, Water Resour. Res., 48, W05516, https://doi.org/10.1029/2011WR011460, 2012.
Kean, J. W., Coe, J. A., Coviello, V., Smith, J. B., McCoy, S. W., and Arattano, M.: Estimating rates of debris flow entrainment from ground vibrations, Geophys. Res. Lett., 42, 6365–6372, https://doi.org/10.1002/2015GL064811, 2015.
Kean, J. W., McGuire, L. A., Rengers, F. K., Smith, J. B., and Staley, D. M.: Amplification of postwildfire peak flow by debris, Geophys. Res. Lett., 43, 8545–8553, https://doi.org/10.1002/2016GL069661, 2016.
Kean, J. W., Staley, D. M., Lancaster, J. T., Rengers, F. K., Swanson, B. J., Coe, J. A., Hernandez, J. L., Sigman, A. J., Allstadt, K. E., and Lindsay, D. N.: Inundation, flow dynamics, and damage in the 9 January 2018 Montecito debris-flow event, California, USA: Opportunities and challenges for post-wildfire risk assessment, Geosphere, 15, 1140–1163, https://doi.org/10.1130/GES02048.1, 2019.
Kern, A. N., Addison, P., Oommen, T., Salazar, S. E., and Coffman, R. A.: Machine Learning Based Predictive Modeling of Debris Flow Probability Following Wildfire in the Intermountain Western United States, Math. Geosci., 49, 717–735, https://doi.org/10.1007/s11004-017-9681-2, 2017.
Key, C. H. and Benson, N. C.: Landscape assessment (LA), FIREMON: Fire Effects Monitoring and Inventory System. Gen. Tech. Rep. RMRS‐GTR‐164‐CD, Department of Agriculture, Forest Service, Rocky Mountain Research Station: Fort Collins, Colorado, USA, https://www.fs.usda.gov/rm/pubs_series/rmrs/gtr/rmrs_gtr164.pdf (last access: 8 April 2024), 2006.
Kirchmeier-Young, M. C. and Zhang, X.: Human influence has intensified extreme precipitation in North America, P. Natl. Acad. Sci. USA, 117, 13308–13313, https://doi.org/10.1073/pnas.1921628117, 2020.
Lamb, M. P., Scheingross, J. S., Amidon, W. H., Swanson, E., and Limaye, A.: A model for fire-induced sediment yield by dry ravel in steep landscapes, J. Geophys. Res., 116, F03006, https://doi.org/10.1029/2010JF001878, 2011.
Lancaster, J. T., Swanson, B. J., Lukashov, S. G., Oakley, N. S., Lee, J. B., Spangler, E. R., Hernandez, J. L., Olson, B. P. E., DeFrisco, M. J., Lindsay, D. N., Schwatrz, Y. J., McCrea, S. E., Roffers, P. D., and Tran, C. M.: Observations and Analyses of the 9 January 2018 Debris-Flow Disaster, Santa Barbara County, California, Environ. Eng. Geosci., 27, 3–27, 2021.
Langhans, C., Smith, H. G., Chong, D. M. O., Nyman, P., Lane, P. N. J., and Sheridan, G. J.: A model for assessing water quality risk in catchments prone to wildfire, J. Hydrol, 534, 407–426, https://doi.org/10.1016/j.jhydrol.2015.12.048, 2016.
Larsen, I. J., Pederson, J. L., and Schmidt, J. C.: Geologic versus wildfire controls on hillslope processes and debris flow initiation in the Green River canyons of Dinosaur National Monument, Geomorphology, 81, 114–127, https://doi.org/10.1016/j.geomorph.2006.04.002, 2006.
Larsen, I. J., MacDonald, L. H., Brown, E., Rough, D., Welsh, M. J., Pietraszek, J. H., Libohova, Z., de Dios Benavides-Solorio, J., and Schaffrath, K.: Causes of post-fire runoff and erosion: water repellency, cover, or soil sealing?, Soil Sci. Soc. Am. J., 73, 1393–1407, 2009.
Liu, T., McGuire, L. A., Youberg, A. M., Gorr, A. N., and Rengers, F. K.: Guidance for parameterizing post-fire hydrologic models with in situ infiltration measurements, Earth Surf. Proc. Land., 48, 2368–2386, https://doi.org/10.1002/esp.5633, 2023.
McGuire, L. A. and Youberg, A. M.: Impacts of successive wildfire on soil hydraulic properties: Implications for debris flow hazards and system resilience, Earth Surf. Proc. Land., 44, 2236–2250, https://doi.org/10.1002/esp.4632, 2019.
McGuire, L. A. and Youberg, A. M.: What drives spatial variability in rainfall intensity-duration thresholds for post-wildfire debris flows? Insights from the 2018 Buzzard Fire, NM, USA, Landslides, 17, 2385–2399, https://doi.org/10.1007/s10346-020-01470-y, 2020.
McGuire, L. A., Kean, J. W., Staley, D. M., Rengers, F. K., and Wasklewicz, T. A.: Constraining the relative importance of raindrop- and flow-driven sediment transport mechanisms in postwildfire environments and implications for recovery time scales, J. Geophys. Res.-Earth, 121, 2211–2237, https://doi.org/10.1002/2016JF003867, 2016.
McGuire, L. A., Rengers, F. K., Kean, J. W., Staley, D. M., and Mirus, B. B.: Incorporating spatially heterogeneous infiltration capacity into hydrologic models with applications for simulating post-wildfire debris flow initiation, Hydrol. Process., 32, 1173–1187, https://doi.org/10.1002/hyp.11458, 2018.
McGuire, L. A., Youberg, A. M., Rengers, F. K., Abramson, N. S., Ganesh, I., Gorr, A. N., Hoch, O., Johnson, J. C., Lamom, P., Prescott, A. B., Zanetell, J., and Fenerty, B.: Extreme Precipitation Across Adjacent Burned and Unburned Watersheds Reveals Impacts of Low Severity Wildfire on Debris-Flow Processes, J. Geophys. Res.-Earth, 126, 1–21, https://doi.org/10.1029/2020jf005997, 2021.
McGuire, L. A., Rengers, F. K., Youberg, A. M., Gorr, A. N., Hoch, O., and Beers, R.: Hydrologic monitoring and field data collected following the 2020 Tadpole Fire, New Mexico, USA, HydroShare [data set], https://doi.org/10.4211/hs.136eeec98a4141e6aedb57bdf6fb1fb5, 2023.
Meyer, G. A. and Wells, S. G.: Fire-related sedimentation events on alluvial fans, Yellowstone National Park, USA, J. Sediment. Res., 67, 776–791, 1997.
Miller, J. D. and Thode, A. E.: Quantifying burn severity in a heterogeneous landscape with a relative version of the delta Normalized Burn Ratio (dNBR), Remote Sens. Environ., 109, 66–80, https://doi.org/10.1016/j.rse.2006.12.006, 2007.
Moody, J. A., Smith, J. D., and Ragan, B. W.: Critical shear stress for erosion of cohesive soils subjected to temperatures typical of wildfires, J. Geophys. Res.-Earth, 110, F01004, https://doi.org/10.1029/2004JF000141, 2005.
Moody, J. A., Ebel, B. A., Nyman, P., Martin, D. A., Stoof, C., and Mckinley, R.: Relations between soil hydraulic properties and burn severity, Int. J. Wildland Fire, 25, 279–293, https://doi.org/10.1071/WF14062, 2016.
Neris, J., Tejedor, M., Rodríguez, M., Fuentes, J., and Jiménez, C.: Effect of forest floor characteristics on water repellency, infiltration, runoff and soil loss in Andisols of Tenerife (Canary Islands, Spain), Catena, 108, 50–57, https://doi.org/10.1016/j.catena.2012.04.011, 2013.
Nikolopoulos, E. I., Destro, E., Bhuiyan, M. A. E., Borga, M., and Anagnostou, E. N.: Evaluation of predictive models for post-fire debris flow occurrence in the western United States, Nat. Hazards Earth Syst. Sci., 18, 2331–2343, https://doi.org/10.5194/nhess-18-2331-2018, 2018.
Nyman, P., Sheridan, G., Smith, H. G., and Lane, P. N. J.: Evidence of debris flow occurrence after wildfire in upland catchments of south-east Australia, Geomorphology, 125, 383–401, 2011.
Nyman, P., Smith, H. G., Sherwin, C. B., Langhans, C., Lane, P. N. J., and Sheridan, G. J.: Predicting sediment delivery from debris flows after wildfire, Geomorphology, 250, 173–186, https://doi.org/10.1016/j.geomorph.2015.08.023, 2015.
Oakley, N. S., Lancaster, J. T., Kaplan, M. L., and Ralph, F. M.: Synoptic conditions associated with cool season post-fire debris flows in the Transverse Ranges of southern California, Nat. Hazards, 88, 327–354, https://doi.org/10.1007/s11069-017-2867-6, 2017.
Palucis, M. C., Ulizio, T. P., and Lamb, M. P.: Debris Flow Initiation From Ravel-Filled Channel Bed Failure Following Wildfire In A Bedrock Landscape With Limited Sediment Supply, Bull. Geol. Soc. Am., 133, 2079–2096, https://doi.org/10.1130/B35822.1, 2021.
Panagos, P., Meusburger, K., Ballabio, C., Borrelli, P., and Alewell, C.: Soil erodibility in Europe: A high-resolution dataset based on LUCAS, Sci. Total Environ., 479–480, 189–200, https://doi.org/10.1016/j.scitotenv.2014.02.010, 2014.
Parise, M. and Cannon, S. H.: Wildfire impacts on the processes that generate debris flows in burned watersheds, Nat. Hazards, 61, 217–227, https://doi.org/10.1007/s11069-011-9769-9, 2012.
Parsons, A., Robichaud, P. R., Lewis, S. A., Napper, C., and Clark, J. T.: Field guide for mapping post-fire soil burn severity, General Technical Report RMRS-GTR, USDA Forest Service, https://doi.org/10.2737/RMRS-GTR-243, 1–49, 2010.
Peduto, D., Iervolino, L., Esposito, G., Foresta, V., Matano, F., and Masi, R.: Clues of wildfire-induced geotechnical changes in volcanic soils affected by post-fire slope instabilities, B. Eng. Geol. Environ., 81, 454, https://doi.org/10.1007/s10064-022-02947-x, 2022.
Pierson, T. C.: Distinguishing between Debris Flows and Floods from Field Evidence in Small Watersheds, U. S. Geological Survey Fact Sheet No. 2004-3142, U.S. Geological Survey, https://doi.org/10.3133/fs20043142, 2005.
Porter, R., Joyal, T., Beers, R., Loverich, J., LaPlante, A., Spruell, J., Youberg, A., Schenk, E., Robichaud, P. R., and Springer, A. E.: Seismic Monitoring of Post-wildfire Debris Flows Following the 2019 Museum Fire, Arizona, Front. Earth Sci., 9, 649938, https://doi.org/10.3389/feart.2021.649938, 2021.
Raymond, C. A., McGuire, L. A., Youberg, A. M., Staley, D. M., and Kean, J. W.: Thresholds for post-wildfire debris flows: Insights from the Pinal Fire, Arizona, USA, Earth Surf. Proc. Land., 45, 1349–1360, https://doi.org/10.1002/esp.4805, 2020.
Rengers, F. K., McGuire, L. A., Kean, J. W., Staley, D. M., and Hobley, D. E. J.: Model simulations of flood and debris flow timing in steep catchments after wildfire, Water Resour. Res., 52, 6041–6061, https://doi.org/10.1002/2015WR018176, 2016.
Rengers, F. K., McGuire, L. A., Kean, J. W., Staley, D. M., and Youberg, A. M.: Progress in simplifying hydrologic model parameterization for broad applications to post-wildfire flooding and debris-flow hazards, Earth Surf. Proc. Land., 44, 3078–3092, https://doi.org/10.1002/esp.4697, 2019.
Rengers, F. K., McGuire, L. A., Youberg, A. M., Gorr, A. N., Hoch, O., Barnhart, K. R., and Beers, R.: Tadpole fire field measurements following the 8 September 2020 debris flow, Gila National Forest, NM, U. S. Geological Survey data release, U.S. Geological Survey, https://doi.org/10.5066/P9I564PP, 2022.
Rengers, F. K., McGuire, L. A., Barnhart, K. R., Youberg, A. M., Cadol, D., Gorr, A. N., Hoch, O. J., Beers, R., and Kean, J. W.: The influence of large woody debris on post-wildfire debris flow sediment storage, Nat. Hazards Earth Syst. Sci., 23, 2075–2088, https://doi.org/10.5194/nhess-23-2075-2023, 2023.
Robichaud, P. R. and Hungerford, R. D.: Water repellency by laboratory burning of four northern Rocky Mountain forest soils, J. Hydrol, 231, 207–219, 2000.
Robichaud, P. R., Jordan, P., Lewis, S. A., Ashmun, L. E., Covert, S. A., and Brown, R. E.: Evaluating the effectiveness of wood shred and agricultural straw mulches as a treatment to reduce post-wildfire hillslope erosion in southern British Columbia, Canada, Geomorphology, 197, 21–33, 2013.
Robichaud, P. R., Wagenbrenner, J. W., Pierson, F. B., Spaeth, K. E., Ashmun, L. E., and Moffet, C. A.: Infiltration and interrill erosion rates after a wildfire in western Montana, USA, Catena, 142, 77–88, 2016.
Schmidt, K. M., Hanshaw, M. N., Howle, J. F., Kean, J. W., Staley, D. M., Stock, J. D., and Bawden, G. W.: Hydrologic conditions and terrestrial laser scanning of post-fire debris flows in the San Gabriel Mountains, CA, USA, Italian Journal of Engineering Geology and Environment, Special issue: V Conference Debris Flow, 583–593, https://doi.org/10.4408/IJEGE.2011-03.B-064, 2011.
Scholle, P. A.: Geologic Map of New Mexico, Tech. rep., New Mexico Bureau of Geology and Mineral Resources, ISBN 883905168, 2003.
Schwarz, G. E. and Alexander, R. B.: Soils data for the Conterminous United States Derived from the NRCS State Soil Geographic (STATSGO) Data Base, U. S. Geological Survey data release, U.S. Geological Survey, https://doi.org/10.5066/P94JAULO, 1995.
Scott, D. F. and van Wyk, D. B.: The effects of wildfire on soil wettability and hydrological behaviour of an afforested catchment, J. Hydrol, 121, 239–256, 1990.
Singleton, M. P., Thode, A. E., Sánchez Meador, A. J., and Iniguez, J. M.: Increasing trends in high-severity fire in the southwestern USA from 1984 to 2015, Forest Ecol. Manag., 433, 709–719, https://doi.org/10.1016/j.foreco.2018.11.039, 2019.
Smith, D. P., Schnieders, J., Marshall, L., Melchor, K., Wolfe, S., Campbell, D., French, A., Randolph, J., Whitaker, M., Klein, J., Steinmetz, C., and Kwan, R.: Influence of a Post-dam Sediment Pulse and Post-fire Debris Flows on Steelhead Spawning Gravel in the Carmel River, California, Front. Earth Sci., 9, 802825, https://doi.org/10.3389/feart.2021.802825, 2021.
Staley, D. M., Kean, J. W., Cannon, S. H., Schmidt, K. M., and Laber, J. L.: Objective definition of rainfall intensity-duration thresholds for the initiation of post-fire debris flows in southern California, Landslides, 10, 547–562, https://doi.org/10.1007/s10346-012-0341-9, 2013.
Staley, D. M., Negri, J. A., Kean, J. W., Laber, J. L., Tillery, A. C., and Youberg, A. M.: Prediction of spatially explicit rainfall intensity–duration thresholds for post-fire debris-flow generation in the western United States, Geomorphology, 278, 149–162, 2017.
Staley, D. M., Kean, J. W., and Rengers, F. K.: The recurrence interval of post-fire debris-flow generating rainfall in the southwestern United States, Geomorphology, 370, 107392, https://doi.org/10.1016/j.geomorph.2020.107392, 2020.
Stoof, C. R., Vervoort, R. W., Iwema, J., van den Elsen, E., Ferreira, A. J. D., and Ritsema, C. J.: Hydrological response of a small catchment burned by experimental fire, Hydrol. Earth Syst. Sci., 16, 267–285, https://doi.org/10.5194/hess-16-267-2012, 2012.
Stoof, C. R., Ferreira, A. J. D., Mol, W., van den Berg, J., de Kort, A., Drooger, S., Slingerland, E. C., Mansholt, A. U., Ferreira, C. S. S., and Ritsema, C. J.: Soil surface changes increase runoff and erosion risk after a low-moderate severity fire, Geoderma, 239, 58–67, https://doi.org/10.1016/j.geoderma.2014.09.020, 2015.
Thomas, M. A., Rengers, F. K., Kean, J. W., McGuire, L. A., Staley, D. M., Barnhart, K. R., and Ebel, B. A.: Postwildfire Soil-Hydraulic Recovery and the Persistence of Debris Flow Hazards, J. Geophys. Res.-Earth, 126, e2021JF006091, https://doi.org/10.1029/2021JF006091, 2021.
Tillery, A. C. and Matherne, A. M.: Postwildfire debris-flow hazard assessment of the area burned by the 2012 Little Bear fire, south-central New Mexico, U. S. Geological Survey Open-File Report 2013–1108, U.S. Geological Survey, 2012.
Tillery, A. C. and Rengers, F. K.: Controls on debris-flow initiation on burned and unburned hillslopes during an exceptional rainstorm in southern New Mexico, USA, Earth Surf. Proc. Land., 45, 1051–1066, https://doi.org/10.1002/esp.4761, 2020.
Tillery, A. C., Haas, J. R., Miller, L. W., Scott, J. H., and Thompson, M. P: Potential Postwildfire Debris-Flow Hazards–A Prewildfire Evaluation for the Sandia and Manzano Mountains and Surrounding Areas, Central New Mexico, Scientific Investigations Report 2014-5161, U.S. Geological Survey, https://doi.org/10.3133/sir20145161, 2014.
Van Eck, C. M., Nunes, J. P., Vieira, D. C. S., Keesstra, S., and Keizer, J. J.: Physically-Based Modelling of the Post-Fire Runoff Response of a Forest Catchment in Central Portugal: Using Field versus Remote Sensing Based Estimates of Vegetation Recovery, Land Degrad. Dev., 27, 1535–1544, https://doi.org/10.1002/ldr.2507, 2016.
Vandervaere, J.-P., Vauclin, M., and Elrick, D. E.: Transient flow from tension infiltrometers II. Four methods to determine sorptivity and conductivity, Soil Sci. Soc. Am. J., 64, 1272–1284, 2000..
Vieira, D. C. S., Fernández, C., Vega, J. A., and Keizer, J. J.: Does soil burn severity affect the post-fire runoff and interrill erosion response? A review based on meta-analysis of field rainfall simulation data, J. Hydrol, 523, 452–464, https://doi.org/10.1016/j.jhydrol.2015.01.071, 2015.
Wall, S. A., Roering, J. J., and Rengers, F. K.: Runoff-initiated post-fire debris flow Western Cascades, Oregon, Landslides, 17, 1649–1661, https://doi.org/10.1007/s10346-020-01376-9, 2020.
Wang, Y., Hu, X., Wu, L., Ma, G., Yang, Y., and Jing, T.: Evolutionary history of post-fire debris flows in Ren'e Yong valley in Sichuan Province of China, Landslides, 19, 1479–1490, https://doi.org/10.1007/s10346-022-01867-x, 2022.
Wells, W. G.: The effects of fire on the generation of debris flows in southern California, Reviews in Engineering Geology, 7, 105–114, 1987.
Zhang, R.: Determination of soil sorptivity and hydraulic conductivity from the disk infiltrometer, Soil Sci. Soc. Am. J., 61, 1024–1030, 1997.