the Creative Commons Attribution 4.0 License.
the Creative Commons Attribution 4.0 License.
 | 09 Jan 2024
Regional-scale landslide risk assessment in Central Asia
Francesco Caleca
Chiara Scaini
William Frodella
Veronica Tofani
Landslides are widespread phenomena that occur in any terrestrial area with slopes, causing massive property damage and, in the worst-case scenario, loss of human life. This propensity to suffer losses is particularly high for developing countries due to their urban development, population growth and drastic land use changes. Social and economic consequences of landslides can be reduced through detailed planning and management strategies, which can be aided by risk analysis. In this study, we performed a detailed quantitative risk analysis for landslides in the whole of Central Asia (4 000 000 km2). Landslide-induced risk was computed, using a 200 m spatial resolution, in terms of exposed population and expected economic losses to buildings and linear infrastructures (roads and railways). The purpose of our study is to produce the first regional-scale landslide risk assessment for Central Asia in order to inform regional-scale risk mitigation strategies, and it represents an advanced step in the landslide risk analysis for extremely broad areas.
- Article
(10641 KB) - Full-text XML
- BibTeX
- EndNote


Landslides are widespread phenomena that occur in any terrestrial area with slopes and cause huge damage to properties and, in the worst cases, are responsible for the loss of human life (Petley, 2012). Landslide events can be triggered by many different factors. The main causes recognized by the geoscience community are attributable to tectonic, climatic (e.g. intense rainfall) and human (e.g. construction and mining) activities (Petley et al., 2007; Huang et al., 2012; Froude and Petley, 2018; Segoni et al., 2018; Turner, 2018). However, the increasing occurrence of extreme events and their effects related to climate change certainly represent a further factor in the propensity of slopes to instability (Gariano and Guzzetti, 2016; Haque et al., 2019). Every year, significant loss of lives and economic damages are caused by landslides over the whole globe. According to Haque et al. (2019) landslides should be ranked as the fourth biggest killer globally among natural disasters since yearly they cause more than 7800 life losses that are related to landslides triggered by other natural hazards, for instance earthquakes. 4000 direct life losses are related to landslides not triggered by other natural hazards but by, for example, heavy rainfall. Similarly, the urban development in risk-prone locations, land use changes, environmental degradation and weak planning strategies are responsible for the severe economic losses due to landslides.
Therefore, social and economic consequences of landslides can be reduced by means of detailed planning and management strategies, which can be facilitated by risk analysis in order to make rational decisions on the allocation of funds to plan mitigation measures (Dai et al., 2002).
Risk is defined as the measure of the probability and severity of an adverse effect to life, health, property or the environment, while risk analysis is the use of available information to estimate the risk to exposed elements from hazards (Fell et al., 2005). According to the existing literature, risk analysis can be performed in two ways: qualitatively or quantitatively. Qualitative analysis reports risk using word form, that is, descriptive or numerical rating scales (e.g. low, moderate and high), to describe the magnitude of potential consequences and the likelihood that those consequences will occur (Abella and Van Westen, 2007; Wang et al., 2013). Contrarily, quantitative risk analysis is based on numerical values of the probability, vulnerability and consequences, and results in a numerical value of the risk by applying the equation proposed by Varnes and the IAEG Commission on Landslides (1984): , where R is the landslide risk, H is the landslide hazard, V is the vulnerability of the exposed elements, I is the intensity of the landslide and E is the value of the elements at risk. In accordance with Corominas et al. (2014), quantitative risk analysis (QRA) allows risk to be quantified in an objective and reproducible manner comparable from one location to another. The general framework of QRA includes different steps: hazard identification and assessment, location of elements at risk and their relative exposure, vulnerability assessment and risk estimation (Dai et al., 2002; Fell et al., 2008; Corominas et al., 2014).
Landslide hazard assessment aims to identify which areas are most prone to trigger landslides with a certain intensity within a given period of time (Guzzetti et al., 2005; van Westen et al., 2006; Corominas et al., 2014; Lari et al., 2014). Therefore, landslide hazard evaluation is carried out by means of the analysis of three probabilities: probability of landslide size, temporal probability of landslides and spatial probability of landslides also known as landslide susceptibility. The latter probability is the likelihood of a landslide occurring in an area on the basis of the local terrain conditions (Brabb, 1984; Kanungo et al., 2009; Reichenbach et al., 2018), and it is the initial step towards landslide hazard, but it can be also considered as a final product (Corominas et al., 2014). In particular, in the case of lack of available data related to landslide frequency and size, landslide hazard can be approximate to landslide susceptibility (Caleca et al., 2022).
Vulnerability plays an important role in defining the consequences of a landslide event and refers to the degree of loss of a given element at risk. Vulnerability is generally expressed on a scale of 0 (no loss) to 1 (total loss) (Glade, 2003; Uzielli et al., 2008; Li et al., 2010; Corominas et al., 2014; Peduto et al., 2017). Vulnerability assessment is related to, and performed on, the basis of landslide intensity and magnitude. Nevertheless, for risk analysis referred to very vast study areas and for which it is very complicated to retrieve homogeneous data to estimate it, vulnerability can be assumed to be equal to total damage (e.g. total loss) (Glade, 2003).
Exposure analysis is an intermediate stage of risk assessment linking the susceptibility and hazard assessment with the value of elements at risk (Pellicani et al., 2014). According to the literature, exposure is an attribute of considered elements at risk that are potentially affected by a landslide (Lee and Jones, 2004; Corominas et al., 2014). In the case of population, it is generally expressed as the number of people exposed to hazardous phenomena, and further distinction can be made based on demographics or socio-economic indicators (Maes et al., 2017). As for the physically exposed assets (e.g. buildings, transportation and other infrastructures), exposure is quantified by the economic value of the elements (Schuster and Fleming, 1986; Schuster and Turner, 1996). Exposure assessment methods strongly rely on the spatial scale and can be carried out at global or regional scale (Emberson et al., 2020; Pittore et al., 2020) with the necessary assumptions and simplifications (e.g. spatial aggregation). However, exposure assessment can also be developed at the local scale and for single assets (Garcia et al., 2016). Commonly, one of the financial risk metrics is the reconstruction cost, i.e. the amount of money needed to reconstruct the asset following the current regulations (Benson and Clay, 2004). In recent times, an increasing number of datasets (e.g. high-resolution population and land use data, remote sensing products and others) supports the assessment of damage and risks in a timely manner. However, characterizing exposed assets for the purpose of disaster risk assessment is still one of the great challenges of the current disaster risk reduction agenda (Kreibich et al., 2022).
In the past two decades, several studies dealing with QRA have been proposed; however, it is worth noting that the majority of performed analyses have been limited to test sites or basin scale at most (Ko et al., 2003; Catani et al., 2005; Michael-Leiba et al., 2005; Remondo et al., 2005, 2008; Zêzere et al., 2008; Jaiswal et al., 2011; Lu et al., 2014; Uzielli et al., 2015b; Corominas et al., 2019; Huang et al., 2020; Ferlisi et al., 2021; Caleca et al., 2022). Nevertheless, when the case study is represented by very broad areas (e.g. nations), QRA is very difficult to perform due to the difficulty in obtaining homogeneous and complete hazard and exposure datasets. Most studies rely on the definition of indicators that are an oversimplification of the QRA framework but very easy to understand and update (Abella and Van Westen, 2007; Puissant et al., 2014; Guillard-Gonçalves et al., 2015; de Almeida et al., 2016; Trigila et al., 2018; Bezerra et al., 2020; Pereira et al., 2020; Segoni and Caleca, 2021).
The predominant factor contributing to the lack of studies focused on landslide risk at small scale is primarily attributed to challenges associated with accessing data pertaining to each element within the risk equation. However, recent advancements in acquiring global digital data have opened up the potential to bypass the drawbacks of landslide risk analysis and generate preliminary analyses for broad geographic areas that were previously beyond reach.
Based on these developments, the main objective of this research is to undertake an exhaustive landslide risk assessment in quantitative terms, focusing on a geographically broad area encompassing the entirety of Central Asia (about 4 000 000 km2). Despite historical evidence of substantial damage caused by landslides within this region, it is notable that, to date, a comprehensive landslide risk assessment at a regional scale remains conspicuously absent in the literature.
The motivation for this study is based on the expected increase in landslide-related risk in Central Asia due to several factors, including, but not limited to, increased urbanization, population growth and dramatic land use change. These evolving dynamics will drive up the risk of landslide-related losses in the region.
This work is primarily concerned with evaluating and disseminating the first regional-scale landslide risk assessment for Central Asia. This comprehensive assessment will facilitate approaches and decisions for mitigation strategies at the regional scale. The focus of the proposed analysis is to quantify landslide-related risk in terms of two distinct facets: the population exposed to landslides and the expected economic losses associated with damage to buildings and linear infrastructure, particularly roads and railways.
Given the vast extent of the selected region as the subject of our study, we acknowledge that certain approximations should inevitably be integrated within the framework of our analysis. In light of these approximations, there is certainly a degree of overestimation. Indeed, we assume that in the event of a landslide, all elements located in a mapping unit would suffer irreparable damage, and this concept boils down to considering their maximum degree of vulnerability.
The ultimate goal of this research is to identify the areas in Central Asia where the propensity for high losses from landslides is most pronounced. The insights that this analysis can provide are intended to be a valuable resource in facilitating effective mitigation measures and land-planning policies.
The region of Central Asia is constituted by Kazakhstan, Turkmenistan, Uzbekistan, Tajikistan and Kyrgyz Republic (Fig. 1), and it covers an area of about 4 000 000 km2. From a geographical point of view, Central Asia shows a varied geography including mountain chains, grassy steppes and vast deserts (e.g., Kyzyl Kum and Taklamakan). The southern and eastern sectors of the region are mountains areas mainly covered by the Tien Shan chain with summits higher than 7000 m (Charreau et al., 2006; Strom, 2010). The geological history of the Tien Shan range is very complex and characterized by a Palaeozoic subduction process (Burtman, 1975; Windley et al., 1990) and afterward by a new Cenozoic phase, consequent to tectonic activity due to the convergence of India and Eurasia (Molnar and Tapponnier, 1975; Davy and Cobbold, 1988; Havenith et al., 2006; Buslov et al., 2007). Tien Shan consists of E–W mountain ridges marked by several fault systems, the most important of which is the Talass–Fergana fault zone, which divides the western Tien Shan from the central one (Trifonov et al., 1992).
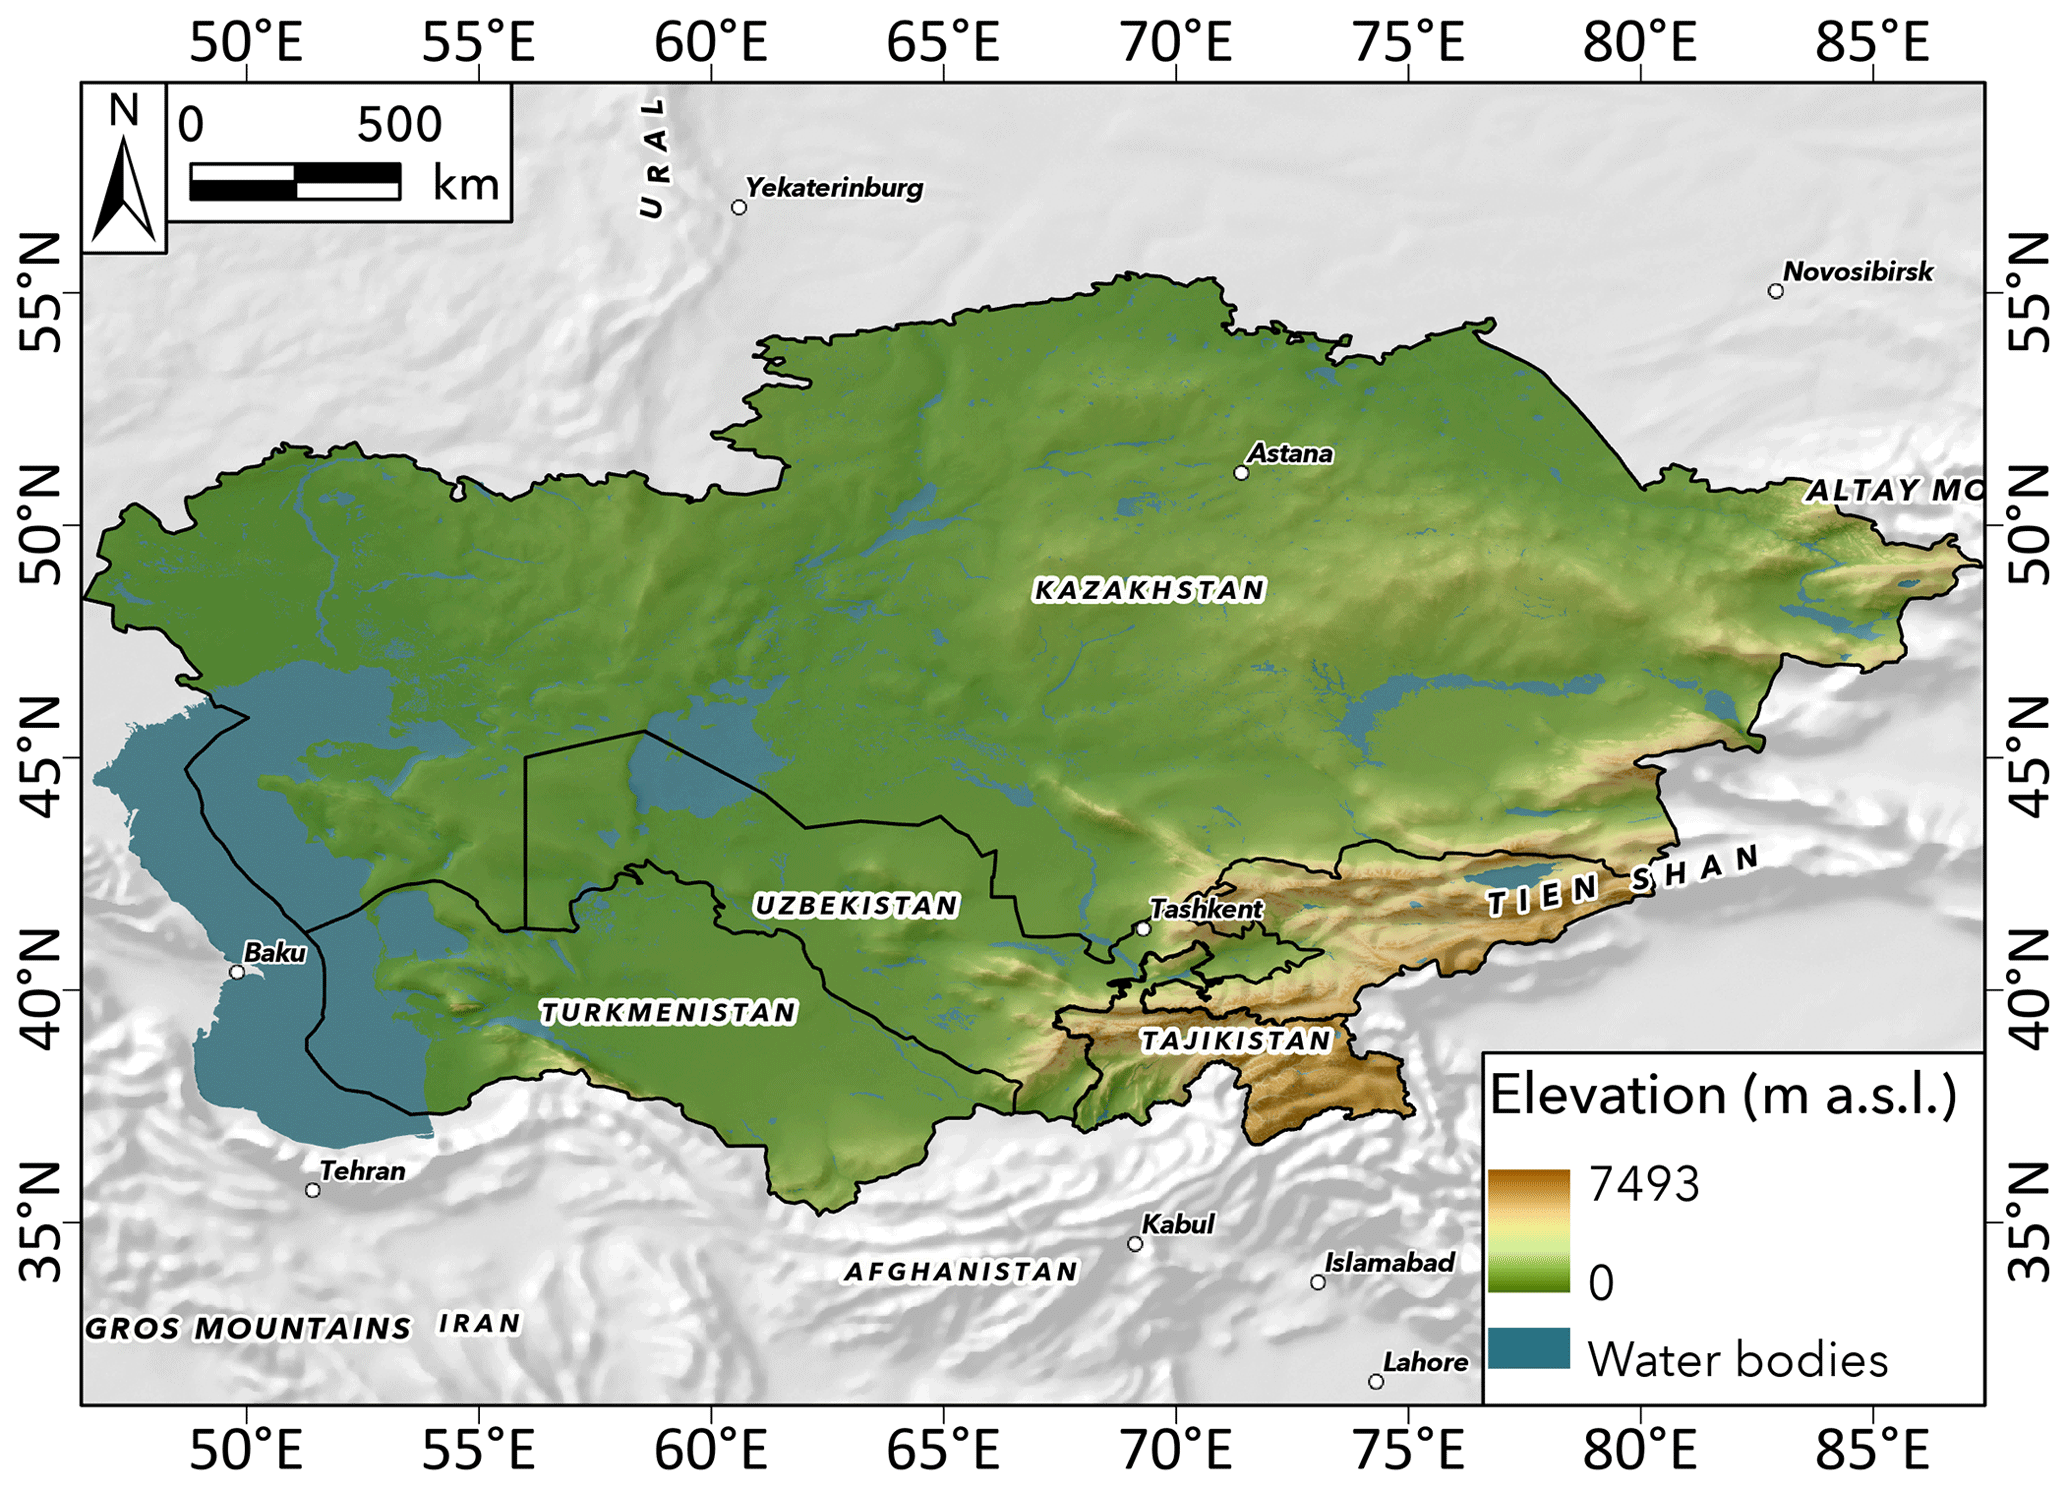
Figure 1Location and elevation of the study area.
The most common landslide events in Central Asia are rockslides/rock avalanches, rotational/translational slides and mud/debris flows, and they are mainly caused by earthquakes, floods, snowmelt and intense rainfall (Kalmetieva et al., 2009; Behling et al., 2014; Golovko et al., 2015; Havenith et al., 2015; Saponaro et al., 2015; Strom and Abdrakhmatov, 2017, 2018). Landslides seismically triggered are very common, and most of the large mapped ones were caused by high-magnitude earthquakes, even prehistoric earthquakes, associated with extreme climate events like intense rainfall or snowmelt (Havenith et al., 2003, 2015; Strom, 2010; Strom and Abdrakhmatov, 2018; Piroton et al., 2020). At the regional scale, Tajikistan and Kyrgyz Republic are the countries most impacted by landslide due to their geological and geomorphological settings. About 50 000 landslides have been mapped in Tajikistan (Thurman, 2011), while Kyrgyz Republic has been affected by 5000 landslides. Emberson et al. (2020) show that the population fraction exposed to landslides in Central Asia exceeds the 10 % and 20 % in Tajikistan and Kyrgyz Republic respectively. However, other sectors that are not located in the above-mentioned countries (e.g. the Almaty region in Kazakhstan or the Tashkent region in Uzbekistan) are also affected by landslide phenomena, mainly due to the increase in the anthropic pressure and activities, which certainly increase the number of elements at risk potentially and therefore the level of exposure in the study area.
In this paper landslide risk was evaluated applying the well-known risk equation proposed by Varnes and IAEG commission on landslide (1984), where risk (R) is defined as the multiplication of three parameters: hazard (H), vulnerability (V) and exposure (E). Nevertheless, since the study area is characterized by a huge areal extension, some approximations within the risk analysis were performed to fix the heterogeneity and the lack of data to assess the different landslide risk parameters. Specifically, simplifications were applied into the landslide hazard and vulnerability assessment. The hazard component was considered as the spatial probability occurrence of landslides (susceptibility) in the study area since it was impossible to retrieve suitable information to evaluate the temporal and landslide size probabilities from the available databases. Furthermore, vulnerability was set equal to 1, the maximum possible degree of loss, due to the lack of data necessary to assess separately the physical vulnerability of each exposed element. Regarding exposure components, we employed a very recent and detailed database developed during the EU-funded Strengthening Financial Resilience and Accelerating Risk Reduction (SFRARR) programme. The research programme, implemented by the World Bank and the Global Facility for Disaster Reduction and Recovery (GFDRR), was applied between 2020 and 2022 to assets exposed to flood, earthquake and landslides in Central Asia. The exposure dataset (Scaini et al., 2023a, b) was produced at a resolution of 100 (population) and 500 m (buildings) to support regional-scale risk assessment. However, for the purpose of landslide risk assessment, the spatial resolution of the buildings' datasets should be increased to encompass the spatial distribution of exposed assets and avoid risk overestimation. (Further details on how the layers were developed in the context of landslide risk assessment are provided in Sects. 3.1 and 3.2.) Landslide risk was computed by estimating the number of exposed population and the expected monetary losses to different types of buildings and transportation systems. The calculation was performed at 200 m spatial resolution discarding flat areas (slope lower than 5∘) where landslides are not expected as a geomorphological process. Risk is then expressed in monetary terms (i.e. United States dollars (USD)) as expected economic losses across the study area.
3.1 Landslide hazard
The hazard component of risk was considered the spatial probability of landslide occurrence. We are aware that this procedure represents a simplification within the QRA framework. Nevertheless, according to Corominas et al. (2014) landslide susceptibility can be considered as a final product, especially in small-scale analyses or in studies where information to estimate both temporal probability of occurrence and size of landslides are insufficient (Caleca et al., 2022). Therefore, the hazard assessment in the present study relies on an already published landslide susceptibility map of Central Asia (Rosi et al., 2023). The map was obtained applying a machine learning algorithm, the Random Forest Treebagger (Breiman, 2001; Brenning, 2005), the application of which in landslide susceptibility studies is well established (Catani et al., 2013; Trigila et al., 2013; Youssef et al., 2016; Lagomarsino et al., 2017; Taalab et al., 2018; Kavzoglu et al., 2019; Merghadi et al., 2020). The landslide susceptibility map was obtained implementing the algorithm over the whole study area, instead of processing each single country; 26 predictors (e.g. lithology, distance from faults, peak ground acceleration maps, maps related to precipitation, etc.) were employed in the model optimization and training. The algorithm was set to work in classification mode identifying the presence or absence of landslides (dependent variable), and then for each pixel the probability to be classified as a landslide was evaluated. The accuracy of model performance was evaluated by means of the area under the receiver operator characteristics curve, the mean value of which was equal to 0.93, showing an extremely excellent result for susceptibility modelling.
The original landslide susceptibility map, based on a 70 m spatial resolution, was upscaled to the selected resolution of this work (200 m) and the values of probability of landslide occurrence were averaged over each 200 m cell of the reference grid used for risk analysis, providing a spatial hazard index ranging from 0 to 1.
It is worth noting that the input susceptibility map is not related to a specific type of landslide since the adopted landslide inventories to train the model did not report the typology of the event; therefore, the performed risk analysis also does not refer to a specific type of landslide phenomenon.
3.2 Exposure
The exposure assessment proposed in this paper was carried out separately for the following elements at risk: buildings, transportation systems and population. Concerning buildings and transportation systems, exposure was evaluated as their reconstruction cost expressed in US dollars, while population exposure was expressed in number of lives.
3.2.1 Population exposure
The population dataset was developed at a 20 m resolution based on the most recent high-resolution global-scale dataset (Facebook, available at https://data.humdata.org/organization/meta; last access: 15 January 2023) complemented with national census data collected for each of the five Central Asian countries in cooperation with local representatives (Scaini et al., 2023a) The resulting exposure layer provides the spatial distribution of population (including gender and age classes) over the whole study area at a 100 m resolution. Population exposure is represented here by the total number of inhabitants in each cell, without gender and age distinction.
3.2.2 Building exposure
In the present study, two different categories of buildings were analysed within the exposure and risk analysis: residential and commercial. Information about residential buildings was provided by a recent work performed on their exposure and spatial distribution over the whole study area (Table 1). The regional-scale buildings exposure dataset was based on the residential buildings exposure model developed by Pittore et al. (2020), which was refined using national-scale data (e.g. national building census and reconstruction costs). The result is a new exposure dataset which comprises both residential and non-residential buildings and their economic value on a constant-resolution grid of 500 m. The resolution of the input regional-scale dataset was increased to 200 m by means of a spatial analysis procedure (Fig. 2). First, for each 500 m cell a mean economic value per building was defined and then the number of buildings was spatially distributed (spatial disaggregation) employing as proxy the 100 m population grid (Table 1). Then, the reconstruction costs in each 100 m cell were obtained by multiplying the mean value and the new spatial distribution of the residential buildings. Finally, the 100 m resolution exposure value was aggregated by summing the values of each 100 m cell to be comparable with the 200 m landslide susceptibility grid (3.1) used for the analysis. Increasing the resolution of exposure data from 500 to 200 m allows a better spatial representation of exposure and prevents risk overestimation when dealing with local phenomena such as landslides.
Table 1An overview of the input data sources used in the proposed analytical approach, categorized by their respective risk parameters, resolutions and references. SRTM DEM stands for the product of the Shuttle Radar Topography Mission. Such product was employed to define the grid analysis on which the approach was built. A landslide susceptibility map available for the whole of Central Asia was acquired to define the hazard component, whereas the exposure component was based on the use of recent databases regarding spatial distribution and economic values of exposed elements. For the technical aspects of these data, see the related references.
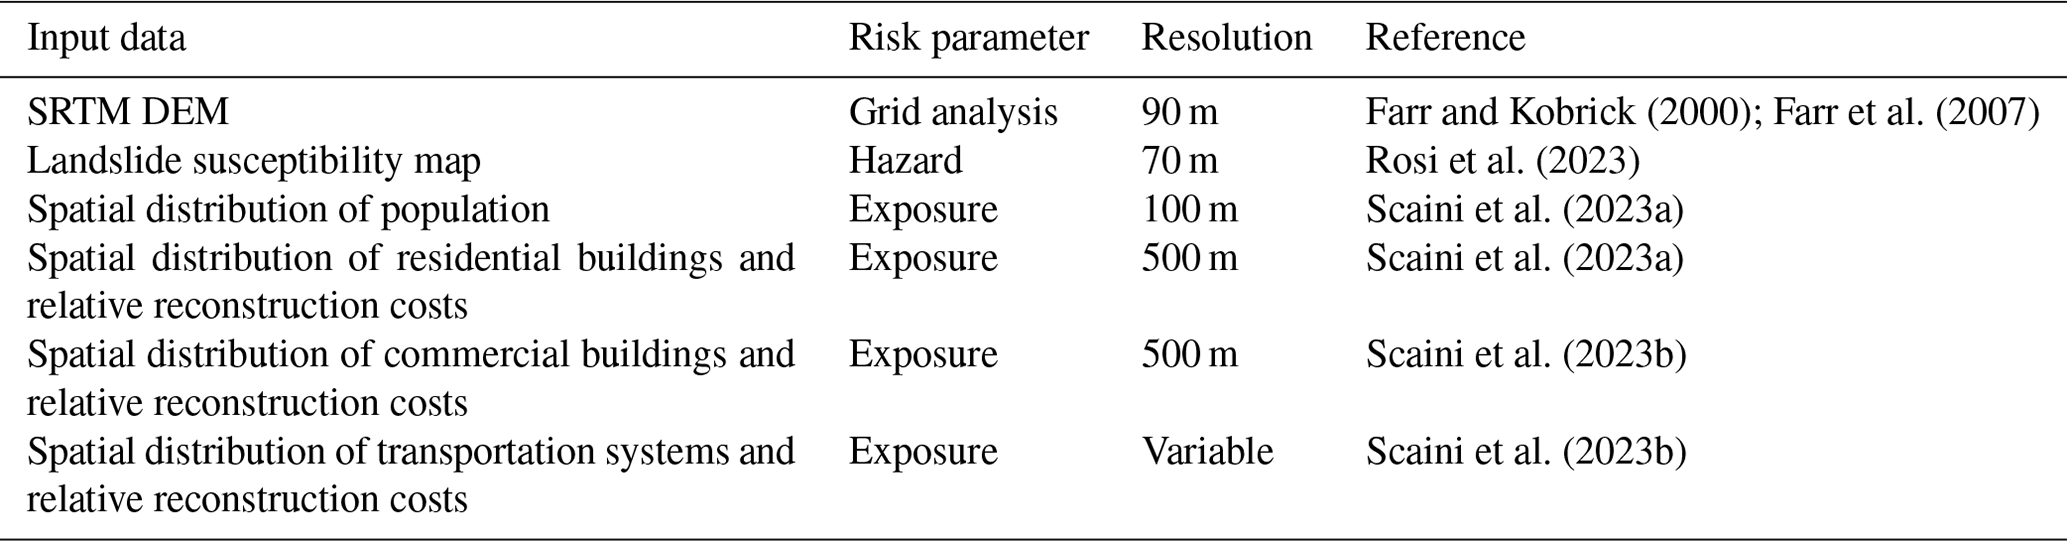
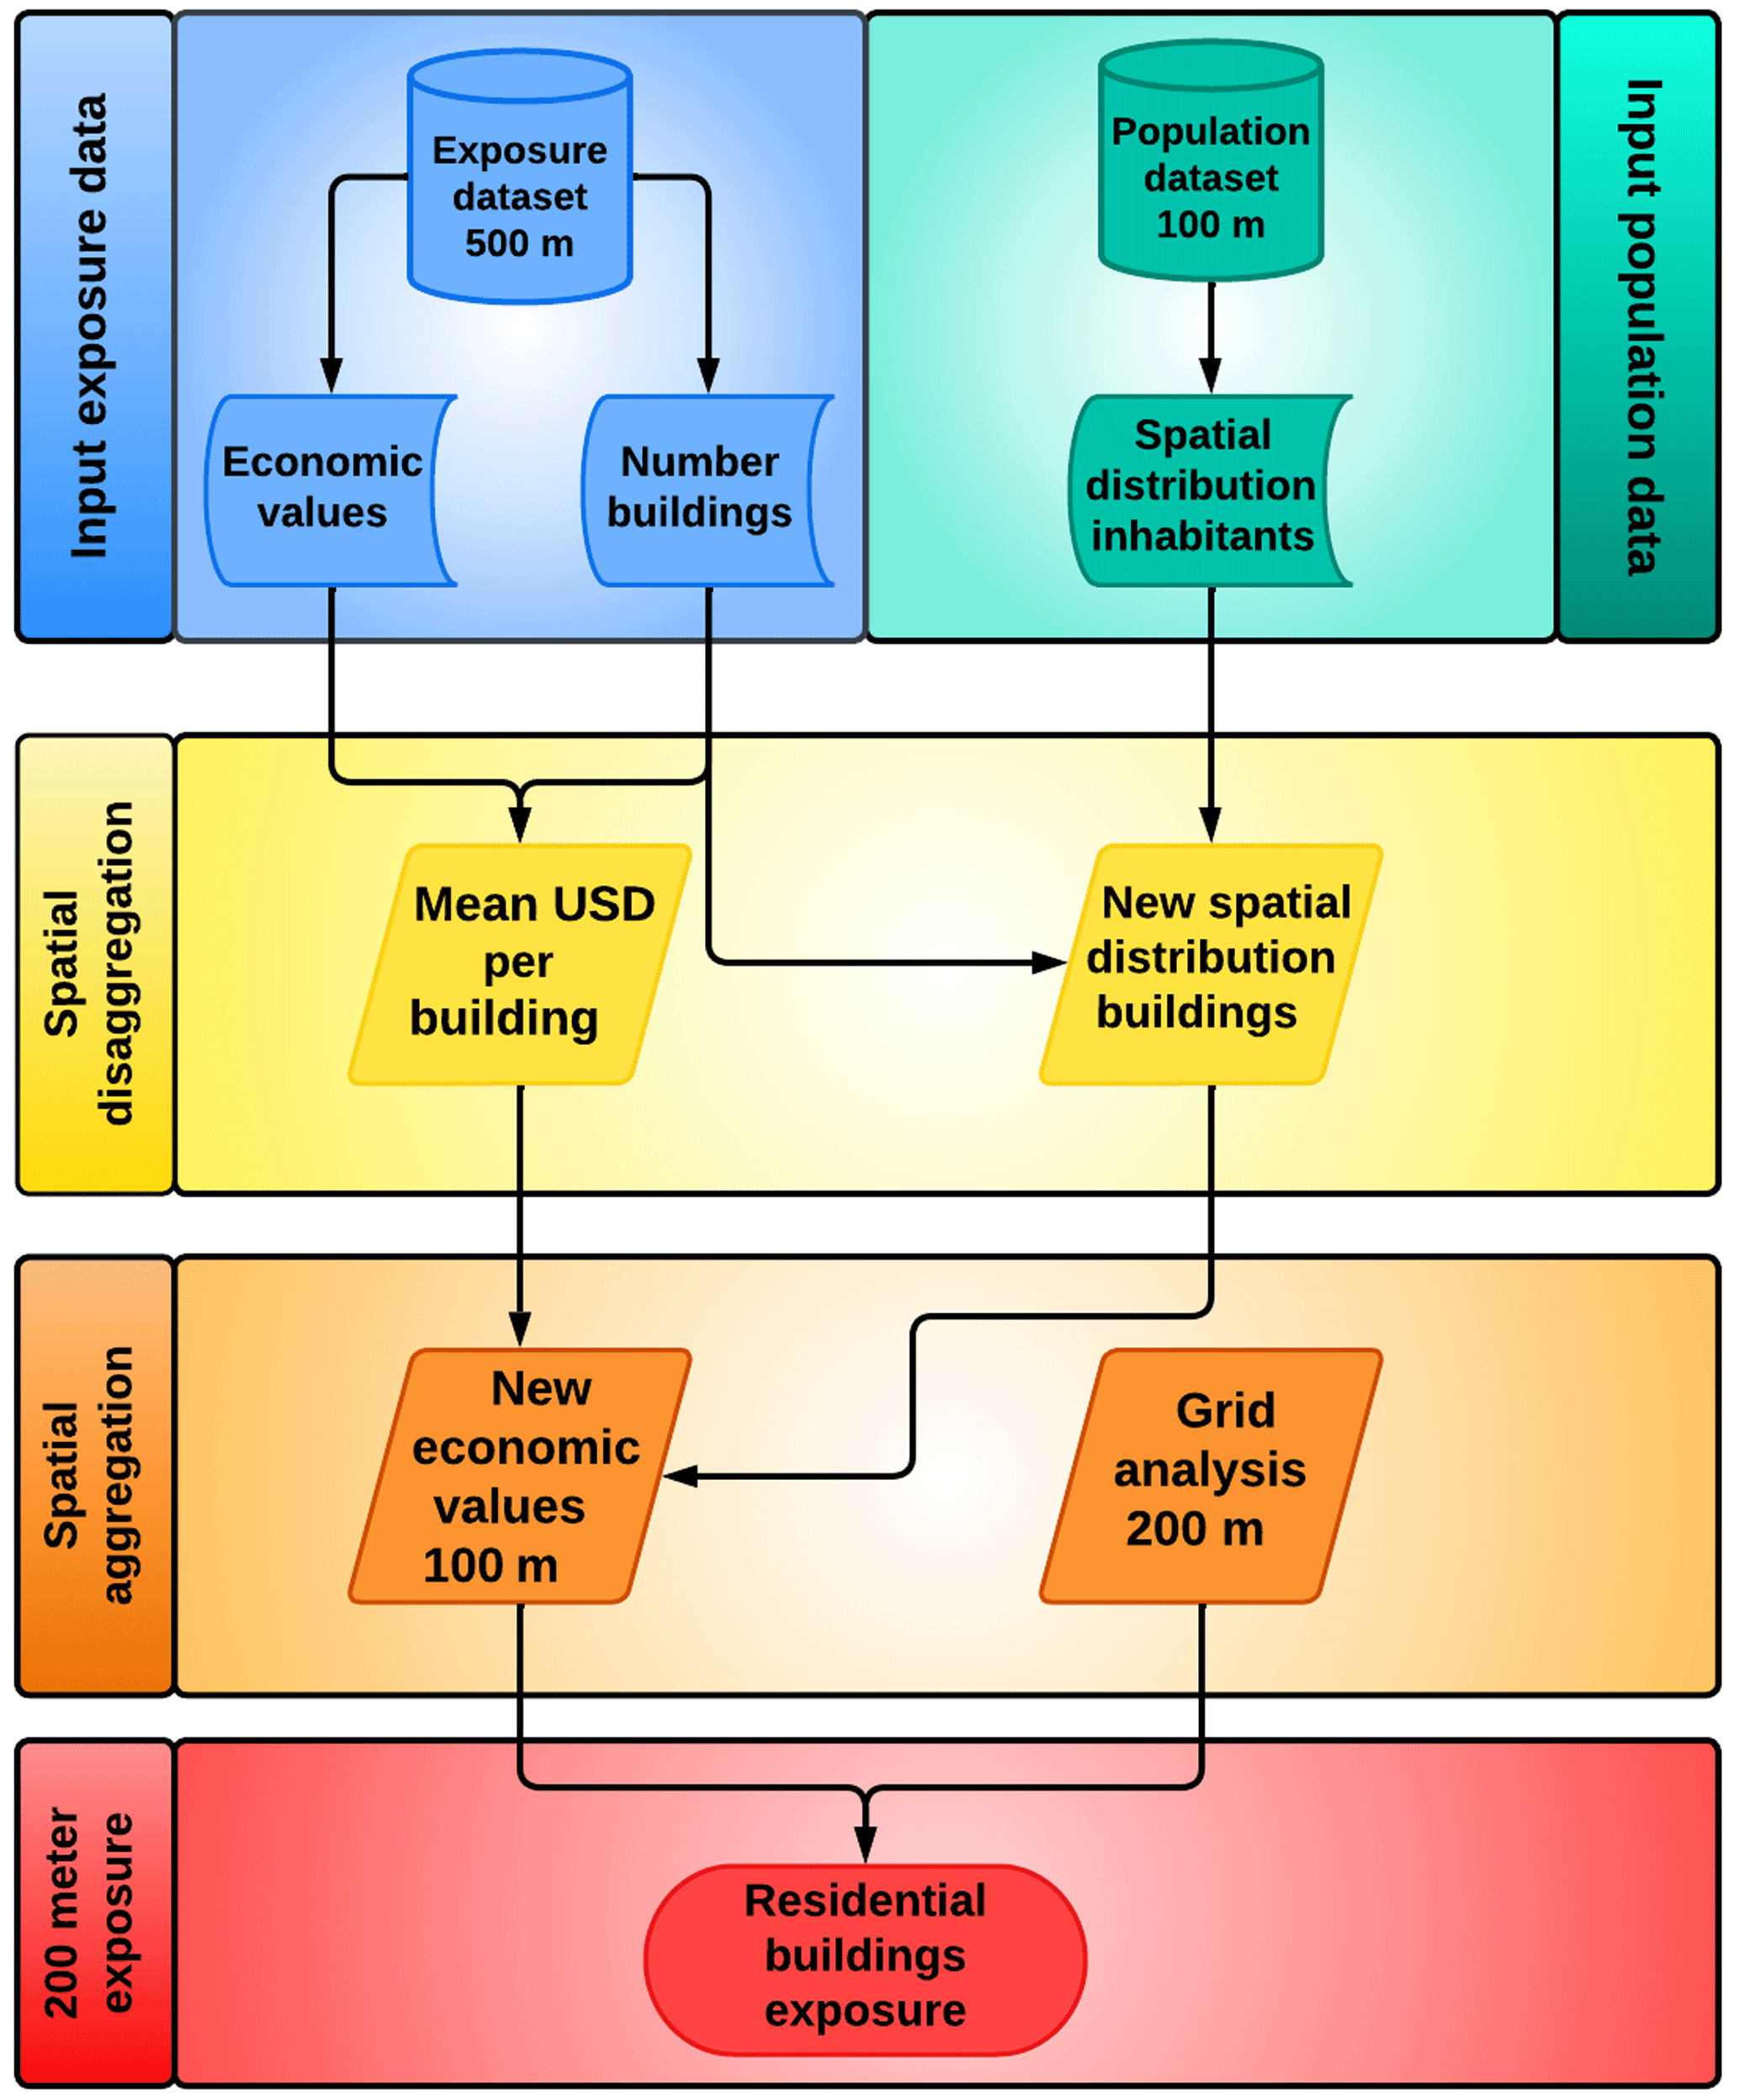
Figure 2Flowchart of the disaggregation procedure which distributes the buildings exposed value on the analysis grid at 200 m resolution.
Exposure of commercial buildings was estimated by means of the commercial building exposure dataset at a 500 m spatial resolution (Table 1). The layer, developed by Scaini et al. (2023b), distinguishes between two commercial buildings categories: wholesale and services (associated with large buildings) and retail (associated with medium/small businesses). In addition, for each typology the number of structures and their relative reconstruction costs were defined. Differently from residential buildings, commercial buildings were not distributed on a 100 m grid using population as a proxy. This is because commercial buildings can be located both in populated and non-populated areas. The economic value of commercial buildings was equally distributed from the original (500 m) to the target (200 m) spatial resolution.
3.2.3 Transportation systems exposure
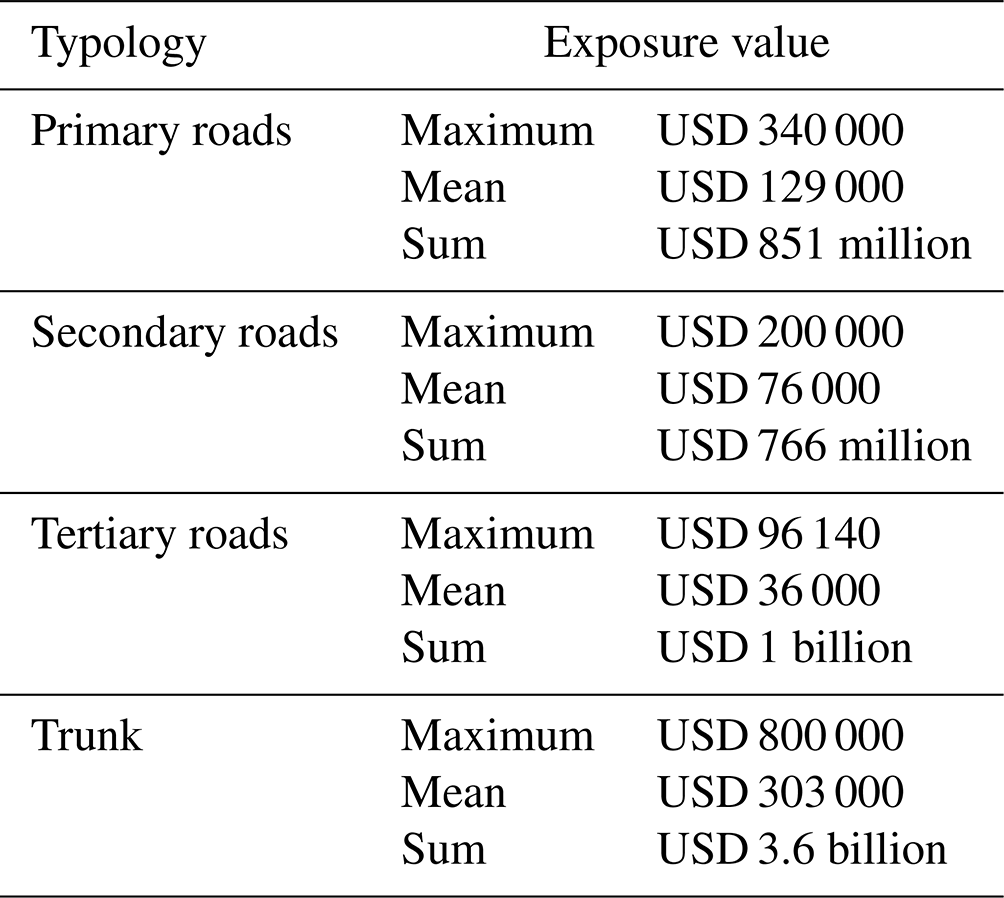
The input transportation exposure dataset was developed on the basis of open street map data and country-based information on the length, type and reconstruction cost of each road or railway type Scaini et al. (2023b). Here, for the purpose of landslide risk assessment, we consider two main classes of transportation systems: roads and railways. Specifically, the exposure layer provided the total length and reconstruction costs of different sub-classes of roads (primary, secondary, tertiary, motorway and trunk) and railways (conventional and high speed). The total reconstruction cost is defined for each linear infrastructure sub-type by multiplying its length and reconstruction cost (USD per metre) within each cell.
3.3 Landslide risk
Landslide risk was computed through a quantitative assessment by assessing the probability of expected losses for the selected elements at risk. The computation is performed on a 200 m grid and only for cells where the landslide susceptibility is not null. Probability is then classified using a continuous scale ranging from the minimum to the maximum value of losses. In particular, losses are intended here as the sum of the value of each asset at stake, assuming a vulnerability of 1 (Coriminas et al., 2014). Equally to exposure assessment, risk analysis was performed separately for the selected exposed elements, producing several specific risk datasets, and these results were then combined into a map of total risk. The total risk map was obtained combining exposure in terms of monetary value. For this reason, the assessment of risk for population was not included in this computation and was analysed separately. In this work four specific risks have been analysed: population risk, buildings risk, roads risk and railways risk.
Population risk is computed as
where Rp is the number of lives potentially at risk, H is hazard and P is the mean number of inhabitants within each cell of the grid analysis.
Buildings risk is computed as
where Rb is the expected loss to buildings, H is hazard and Er and Ec are the exposure of residential and commercial buildings respectively.
Roads risk is computed as
where Rro is the expected loss to roads, H is hazard and Ep, Es, Et, Em and Etr are the exposure of primary roads, secondary roads, tertiary roads, motorways and trunks respectively.
Railways risk is computed as
where Rra is the expected loss to railways, H is hazard and Eco and Eh are the exposure of conventional and high-speed railways respectively.
Total risk is the sum of the specific risks of buildings, roads and railways:
4.1 Landslide hazard
The landslide hazard map of Central Asia is shown in Fig. 3. Since most of the study area is constituted by flat areas, the majority of hazard values lie in an interval that can be classified as low-to-moderate probability occurrence according to a literature overview. In detail, the mean hazard value is 0.37 and about 24 % of the analysed area presents hazard values less than or equal to 0.25, and they are mostly located in the northern and western parts of Central Asia. However, there are sectors of the case study reporting very high values of landslide hazard: 0.65 % of Central Asia showed hazard values greater than or equal to 0.75, which can be classified as a very high probability of landslide occurrence. Of these cells, 74 % reported a maximum value of hazard (i.e., 1) and most of them are located within Tajikistan and Kyrgyz Republic, which are mostly covered by the Tien Shan range and, due to their geological and geomorphological conditions, are very prone to trigger landslide phenomena. Nevertheless, even several cells of Uzbekistan and Kazakhstan, exactly located in the Tashkent and Almaty regions, present hazard values close to or equal to 1.
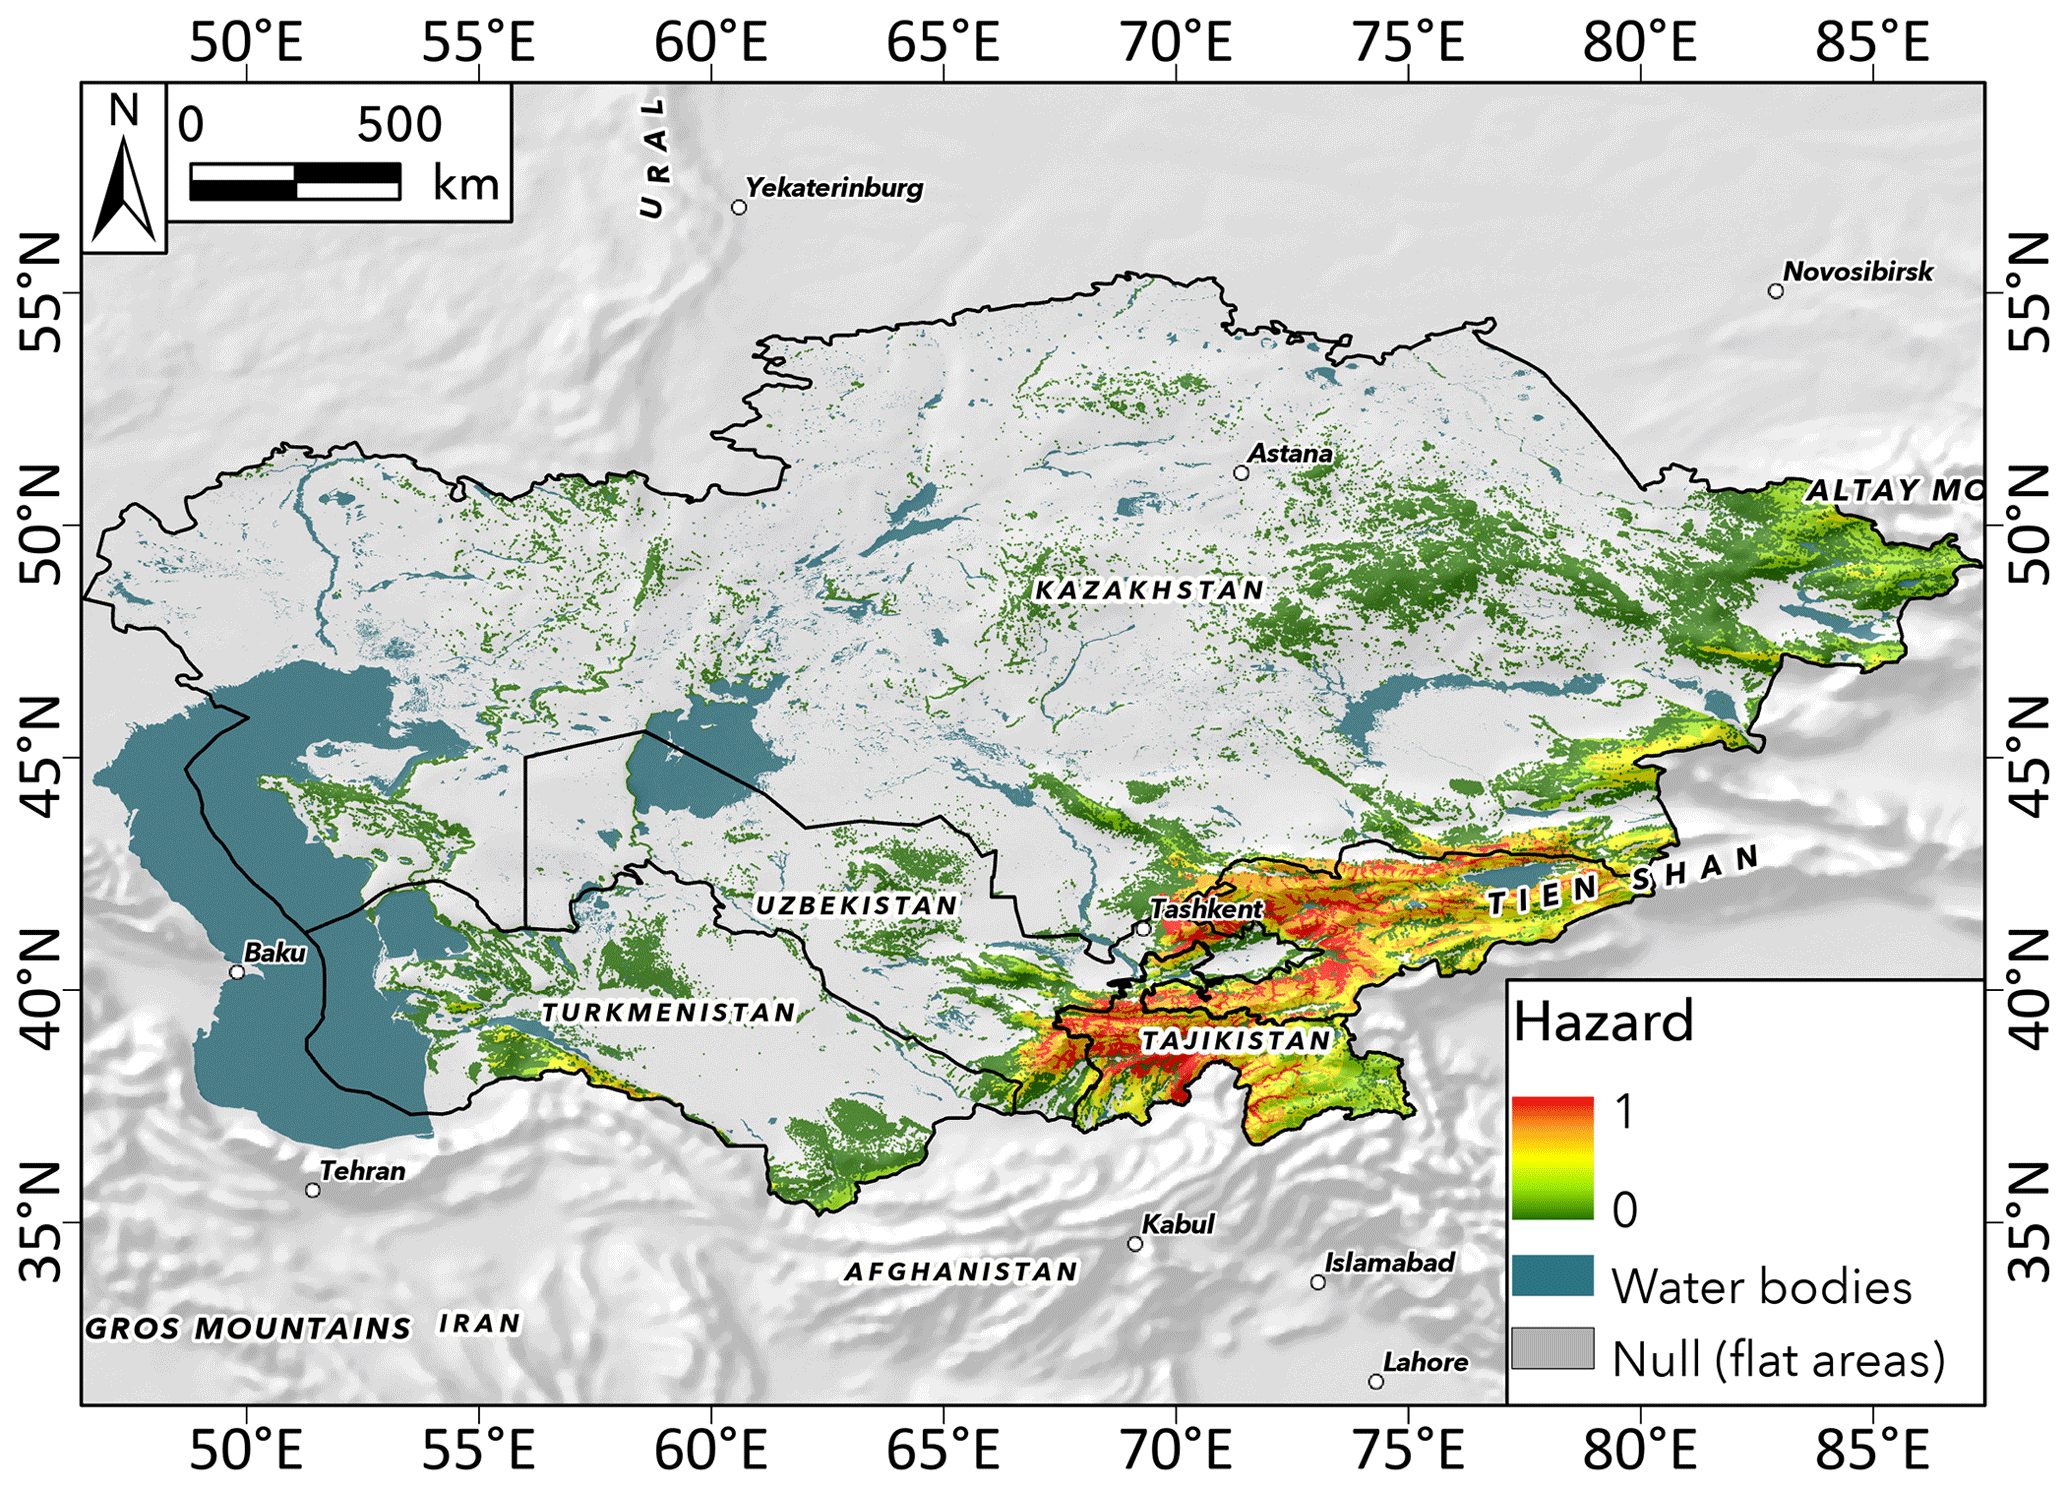
Figure 3Landslide hazard map of Central Asia. Note that flat areas are excluded because they are places not prone to trigger landslides.
4.2 Exposure
The population exposed to landslides is reported in Fig. 4a, which shows the total number of inhabitants per cell. Exposed population ranges from 0 to a maximum of 433.97 inhabitants, which is located in the town of Ghafurov in the Sughd region of Tajikistan. All population exposed to possible landslide events is located within 1.1 % of the cells, with a mean density of 5.7 inhabitants per cell. All the other areas are not inhabited. This is because highly populated areas are not included in the exposure layer since they are sited in floodplains, which are filtered out of the computation because they are not prone to landslides.
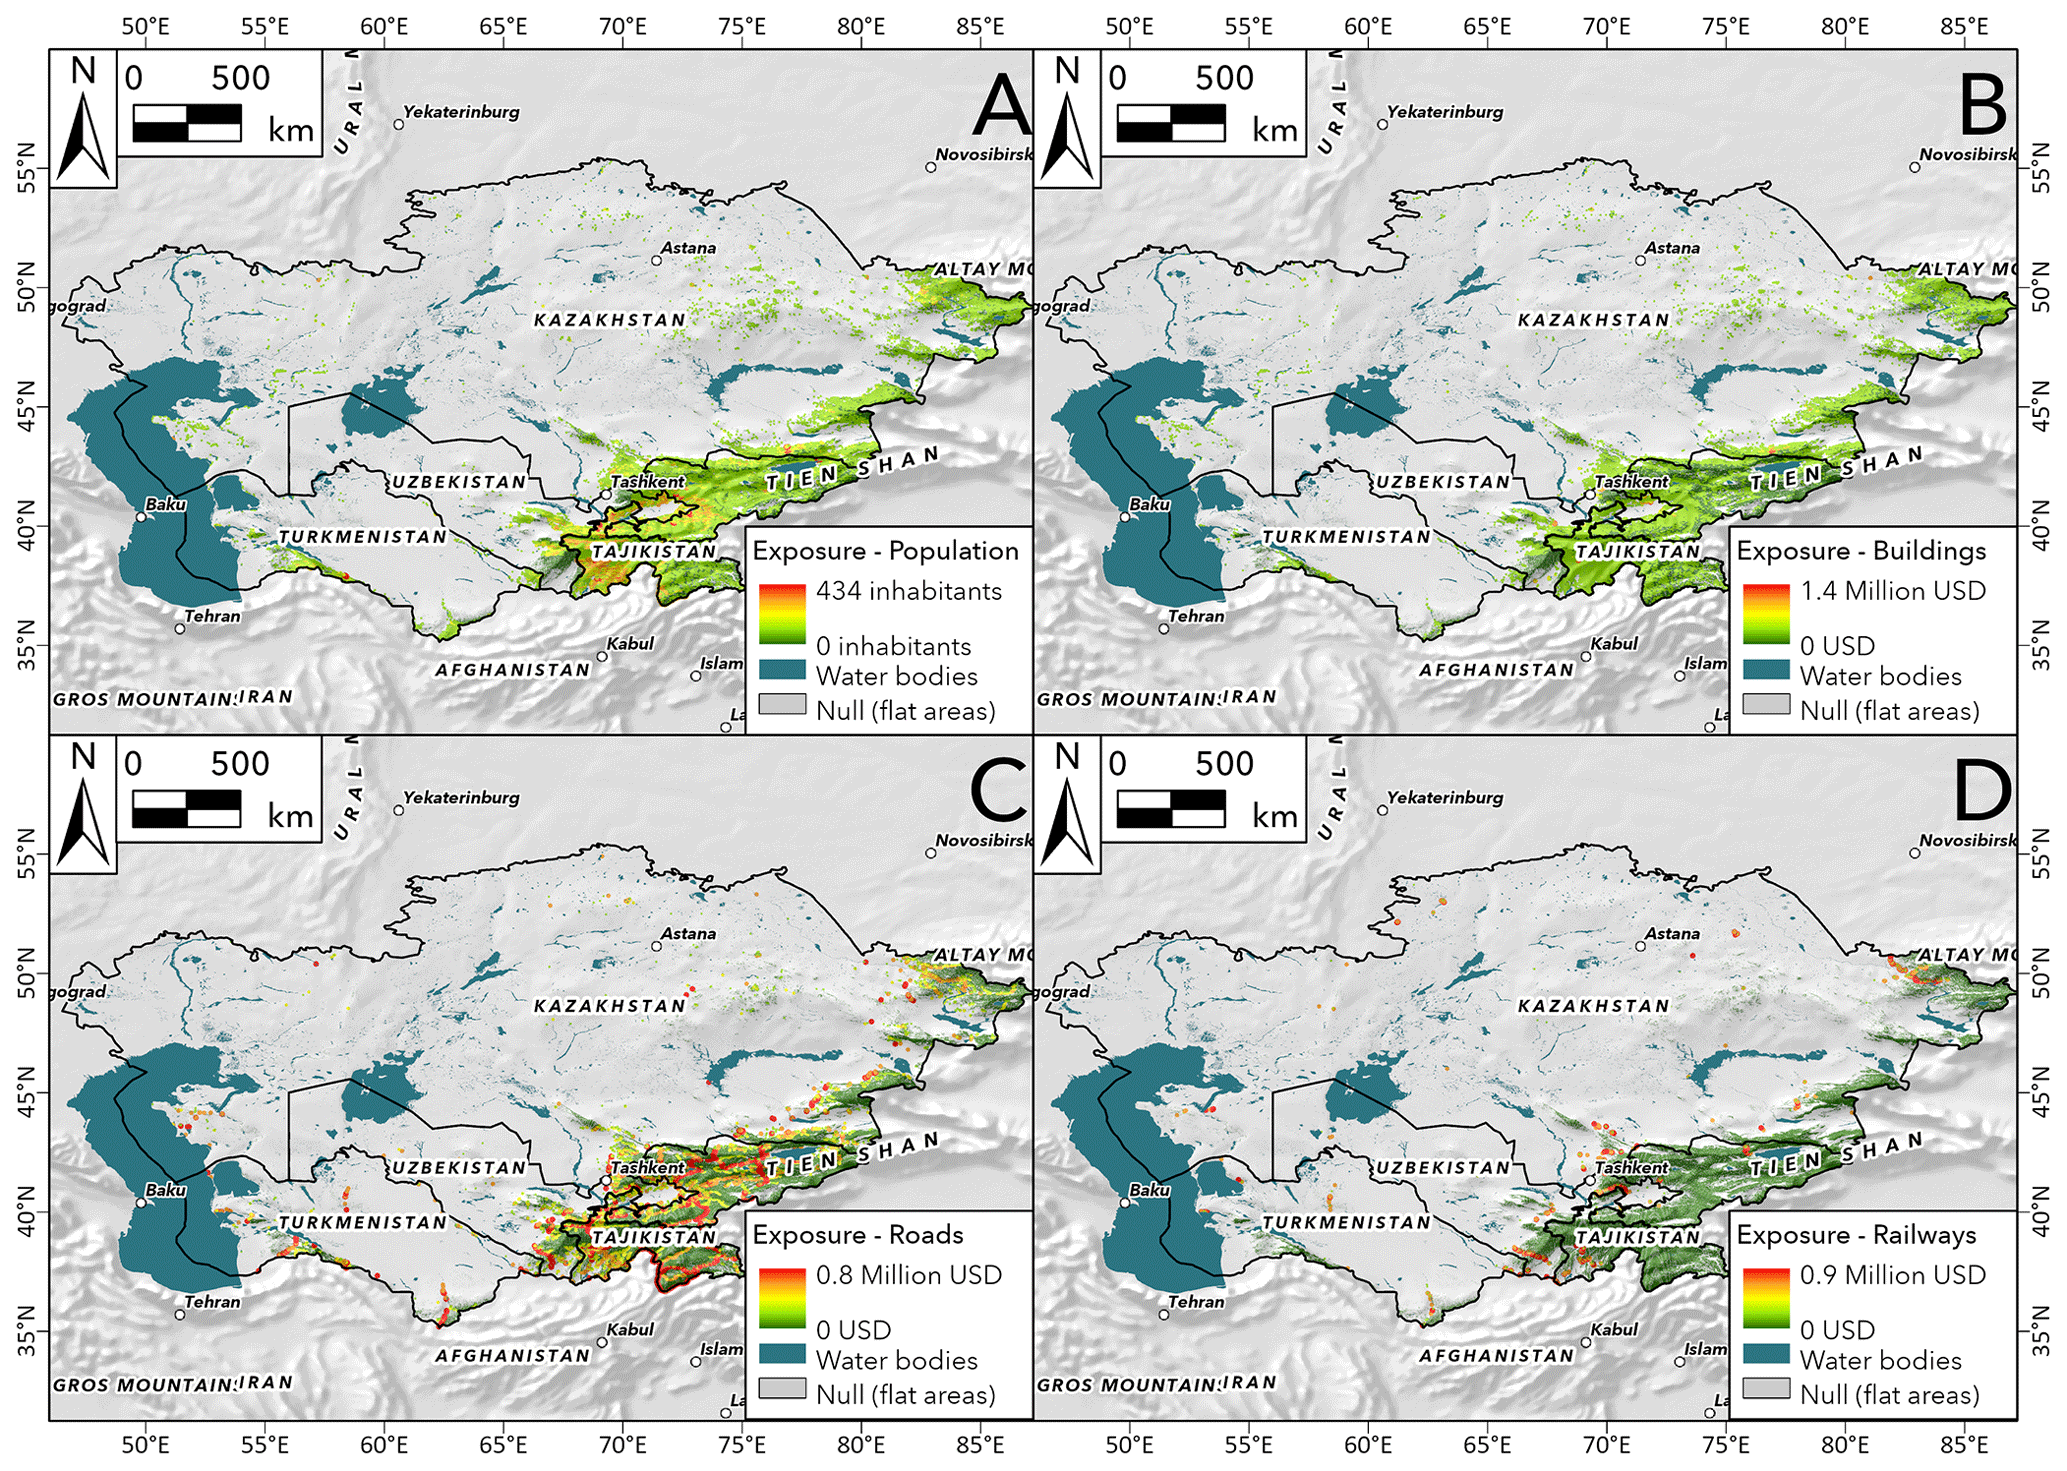
Figure 4Exposure maps of involved elements at risk. Panel (a) shows population exposure, (b) building exposure, (c) road exposure and (d) railway exposure.
Figure 4b shows the spatial distribution of buildings exposure over Central Asia, obtained by combining the total reconstruction cost of residential and commercial buildings. The total buildings exposure ranges from USD 0 to USD 1.39 million per cell (corresponding to approximately USD 35 million per km2), the highest value being located in the city of Almaty (Kazakhstan) at the foot of the Tien Shan chain. Of the analysed area, 0.81 % reports a buildings exposure greater than 0, with the mean value being approximately USD 45 000 per cell and the sum about USD 517 million.
Note that flat areas, where buildings exposure is higher, were excluded from the risk analysis. The total exposed value of commercial buildings in landslides-prone areas is USD 280 million, which is greater than the residential one. Only 0.10 % of landslide-prone cells have a not-null commercial exposure and the mean exposed value is about USD 39 000.
The total exposure of roads in Central Asia (Fig. 4c) was computed summing the exposure of the different road types (primary, secondary, tertiary, motorway and trunk). The total reconstruction cost of roads exposed to landslide phenomena is approximately USD 6.22 billion. The highest value of roads exposure belongs to a cell of the Jayl district (Chuy region) in Kyrgyz Republic crossing by the EM-02 highway: the mean value is USD 110 240 per cell and about 0.40 % of the study area reports a value of exposure greater than 0.
The total reconstruction costs of different road classes exposed to landslides are reported in Table 2. It is worth noting that, according to the spatial analysis, no motorway is directly affected by landslide phenomena and therefore the total motorway exposed length is 0. Road reconstruction costs are proportional to the relevance of the road type (i.e. higher for trunk, motorways and highways, and lower for secondary and tertiary roads), but the total exposure of tertiary roads is nonetheless higher than the one of primary and secondary roads because landslide-prone, mountainous areas are mostly covered by tertiary roads.
Table 2Total reconstruction cost of each considered road class exposed to landslides in Central Asia.
The spatial distribution of railways exposure is reported in Fig. 4d. As with roads exposure, the total railways exposure was obtained by summing that of conventional railways with that of high-speed railways. Railways exposure reaches a maximum value of USD 920 000, located in a cell of the Pop district of the Namangan region of Uzbekistan, and it is related to a segment of the high-speed railway connecting the cities of Tashkent and Andijan. The mean value is USD 344 000 per cell and only 0.03 % of the cells are covered by a railway segment, highlighting that most of these linear infrastructures are located in areas excluded from our grid analysis since they are flat zones. The total exposed value of railways is about USD 1.23 billion. In detail, 98 % of the total railways exposure is due to the high-speed railways: the mean value of exposure of high-speed railways is USD 349 425 per cell and the maximum value is the same as that of the total exposure. Contrarily, conventional railways show a maximum value of USD 518 850 and the mean value is about USD 193 000 per cell. The obtained results show that railways exposure is greater than the exposure of roads and buildings, which is justifiable by their high construction cost.
4.3 Landslide risk
Landslide risk analysis was performed separately for each type of element at risk. Subsequently, the monetary value associated with different asset types was combined into a total risk map.
The specific risk of population is reported in Fig. 5a and ranges from 0 to 227 inhabitants. The maximum number of lives at risk is located in a cell of the city of Dushanbe in Tajikistan with a landslide hazard equal to 0.63 and a population exposure of 358.98 inhabitants, which corresponds to a density of 8974.5 inhabitants per square kilometre. The number of total lives at risk in Central Asia is about 433 000 and the mean is 3 inhabitants per cell. As with the specific risk of buildings, the population risk shows a very low mean number of lives at risk and is surely related to the low percentage of cells (1.04 % of grid analysis) where the number of lives at risk is greater than 0.
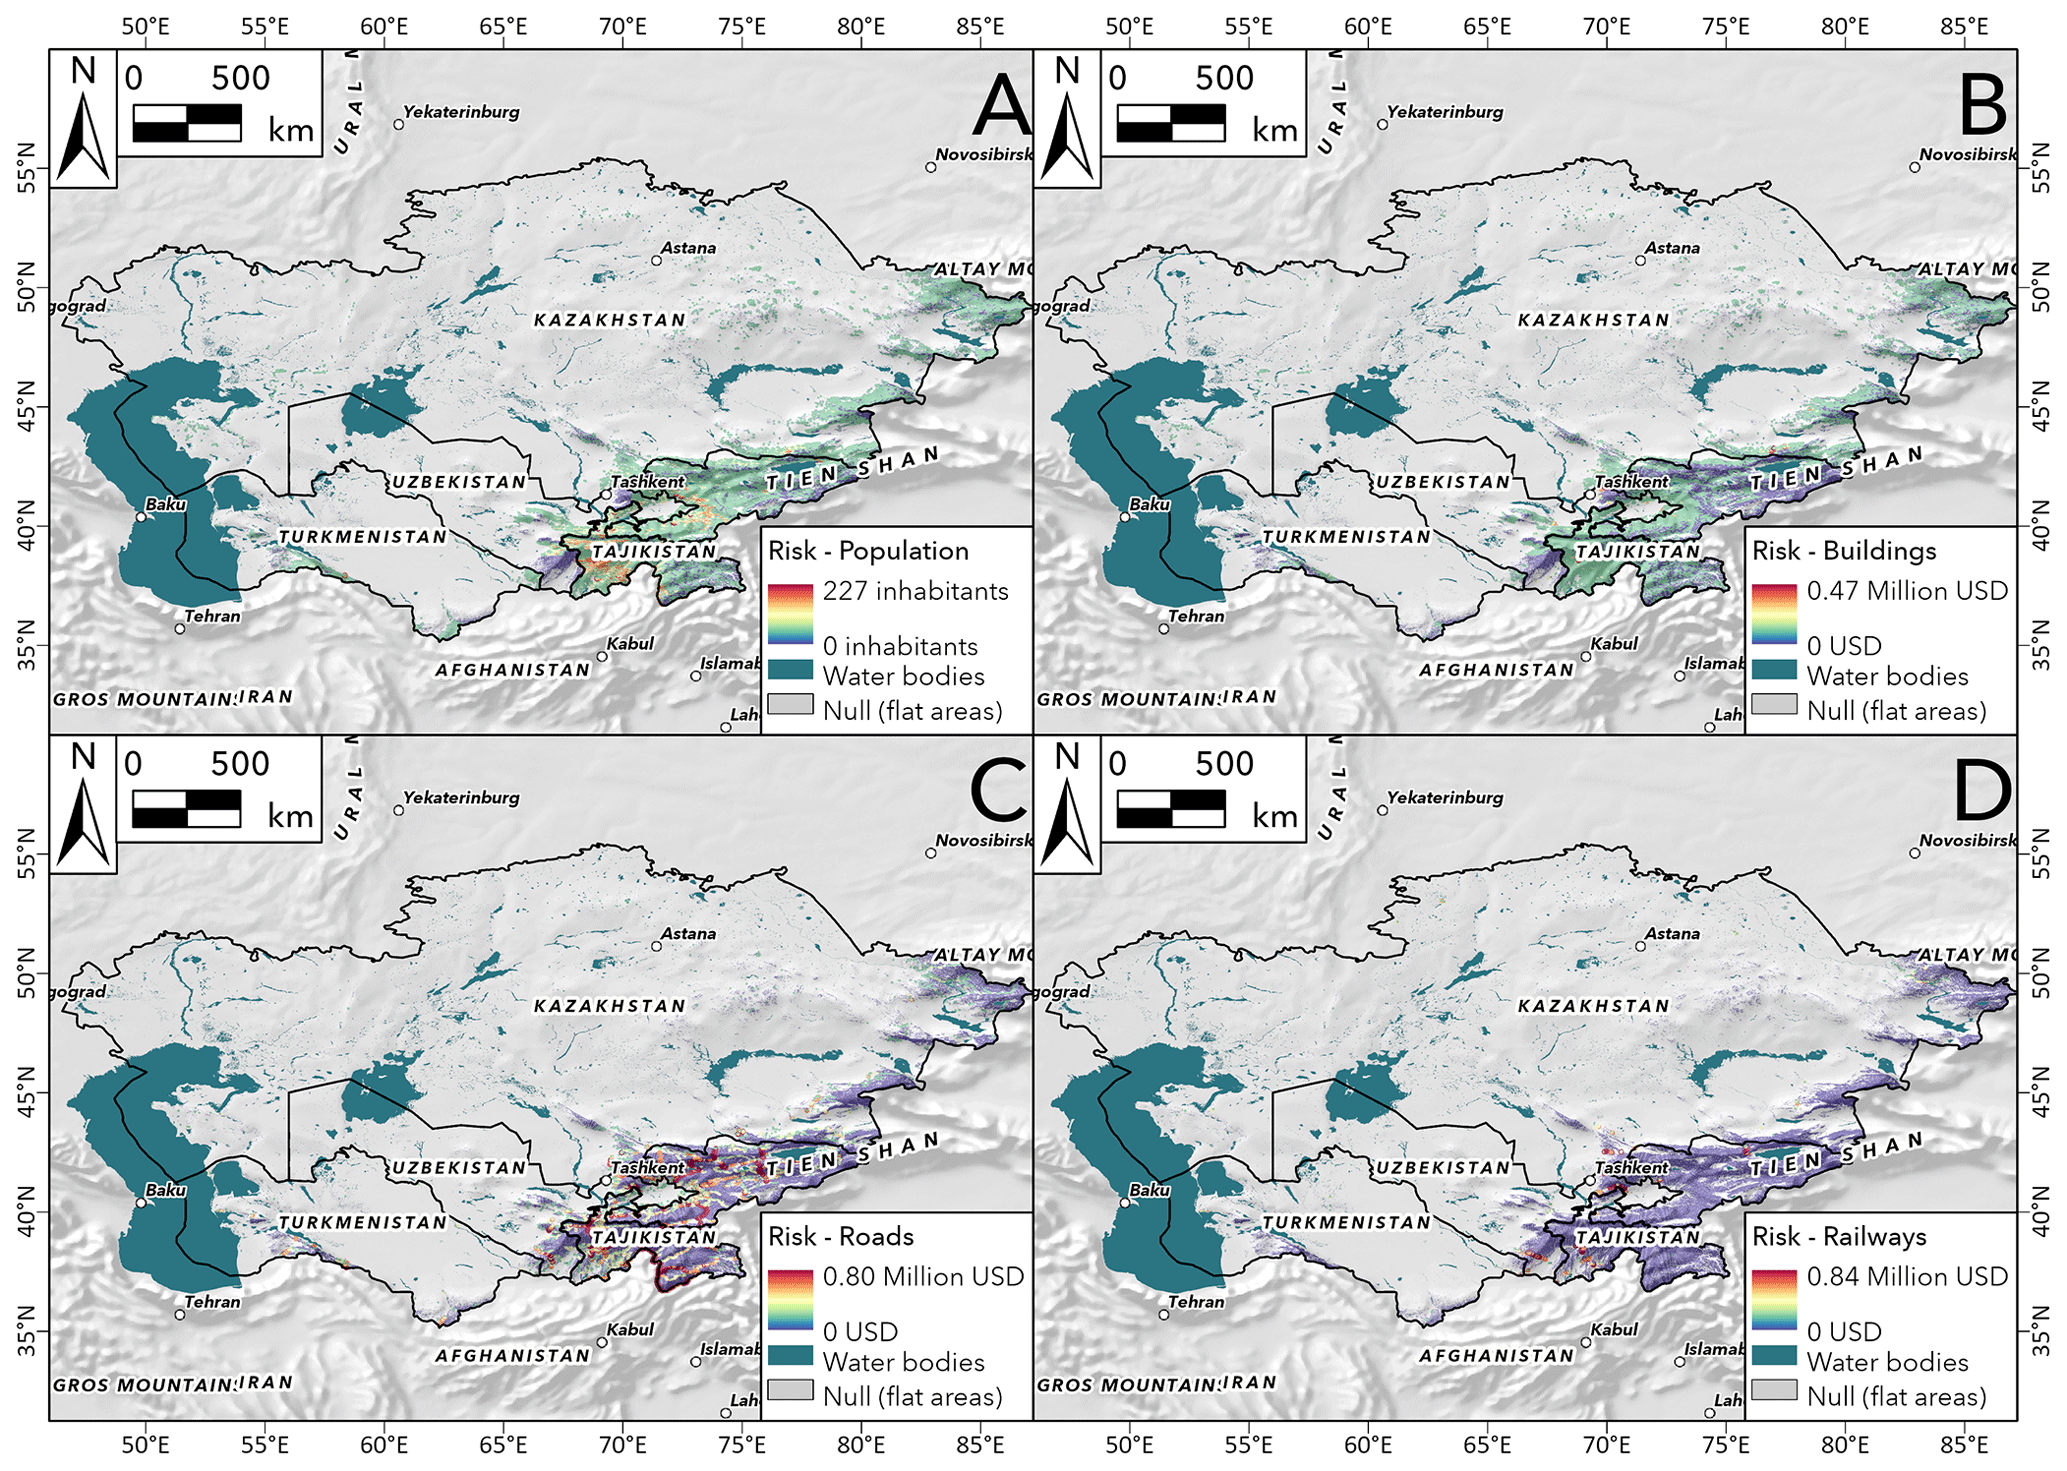
Figure 5Landslide risk maps expressing the potential losses in terms of lives and economic damages for each involved element at risk. Panel (a) shows population risk, (b) buildings risk, (c) roads risk and (d) railways risk.
Figure 5b shows the spatial distribution of landslide risk for buildings, which reaches a maximum value of USD 469 160 in a cell of the city of Almaty in Kazakhstan. This cell reports a landslide hazard value of 0.46 and a buildings exposure of approximately USD 1.02 million. The total risk associated with buildings in Central Asia is about USD 186 million and the mean value is USD 8430 per cell. This value is relatively low when compared with the total exposed value of buildings in Central Asia. This is because the majority of buildings are located in areas where landslide hazard is very close or equal to 0. In fact, only 0.77 % of landslide-prone cells contain buildings, while most buildings in Central Asia are located in flat areas or in areas less prone to trigger landslides. However, specific landslide scenarios can still cause relevant losses at the sub-national scale and should be analysed in detail with specific methods.
Specific landslide risk of roads ranges from USD 0 to a maximum of USD 799 000, which is located in a cell of the Ohangaron district (region of Tashkent) of Uzbekistan. The corresponding map is reported in Fig. 5c. This specific cell has a landslide hazard equal to 1 (very high probability of landslides occurrence); therefore, risk is equal to exposure. In this cell, exposure is high due to the presence of a segment of the A373 highway, connecting Osh (Kyrgyz Republic) and Tashkent (Uzbekistan) cities. The total landslides financial risk associated with roads in Central Asia is USD 3.02 billion and the mean value is about USD 58 000 per cell.
Regarding railways risk, its spatial distribution is shown in Fig. 5d. Financial risk associated with railways ranges from USD 0 to USD 843 493. Similarly to roads risk, the maximum value is located in the Ohangaron district but in a different cell showing the following parameters: landslide hazard equal to 0.92 and railways exposure equal to USD 916 840 represented by the presence of a segment of high-speed railways. The obtained results report a mean value of USD 128 911 per cell and a total risk equal to USD 382 million. In general, all exposed assets are located in few cells in the considered spatial domain. In addition, contrary to risk associated with buildings, risk for railways shows a high mean value considering that the cells covered by a railway segment are only 0.03 % of the grid analysis. Therefore, our outcomes reveal that roads and railways are the element at risk that can be subjected to major losses, with respect to buildings, despite their minor covered area in the grid analysis. This is certainly due to the fact that railways and roads are built in areas more prone to trigger landslides with respect to buildings, which are mostly located in zones with very low landslide hazard or in flat areas.
Finally, the total risk expressed by the sum of the specific risk of buildings, roads and railways is shown in Fig. 6. The maximum risk is about USD 1.03 million. The highest landslide risk value is located in the same cell reporting the highest landslide risk of roads (Tashkent region in Uzbekistan). This cell shows the following parameters: landslide hazard is 1, buildings risk is 0, roads risk is about USD 799 000 and railways risk is USD 231 000. The obtained results highlight that the total expected losses in Central Asia are about USD 3.59 billion, with a mean risk value of USD 23 401 per cell corresponding to USD 0.6 million per km2. Moreover, the percentage of grid analysis with a landslide risk greater than 0 is approximately 1.10 %, areas which are mostly located along the Tien Shan chain or in areas at its foot. Inspecting the first 10 cells with the highest risk values, we discovered that they are mainly located in the Ohangaron district (Uzbekistan) and the mean landslide hazard of these is 0.93. In addition, an already highlighted trend has been shown: the presence of specific exposed assets (railways) plays a relevant role in concurring with the total landslide risk in the region. In detail, these cells reported a mean railways risk of about USD 587 000 per cell, an amount greater than the respective risk values of buildings and roads.
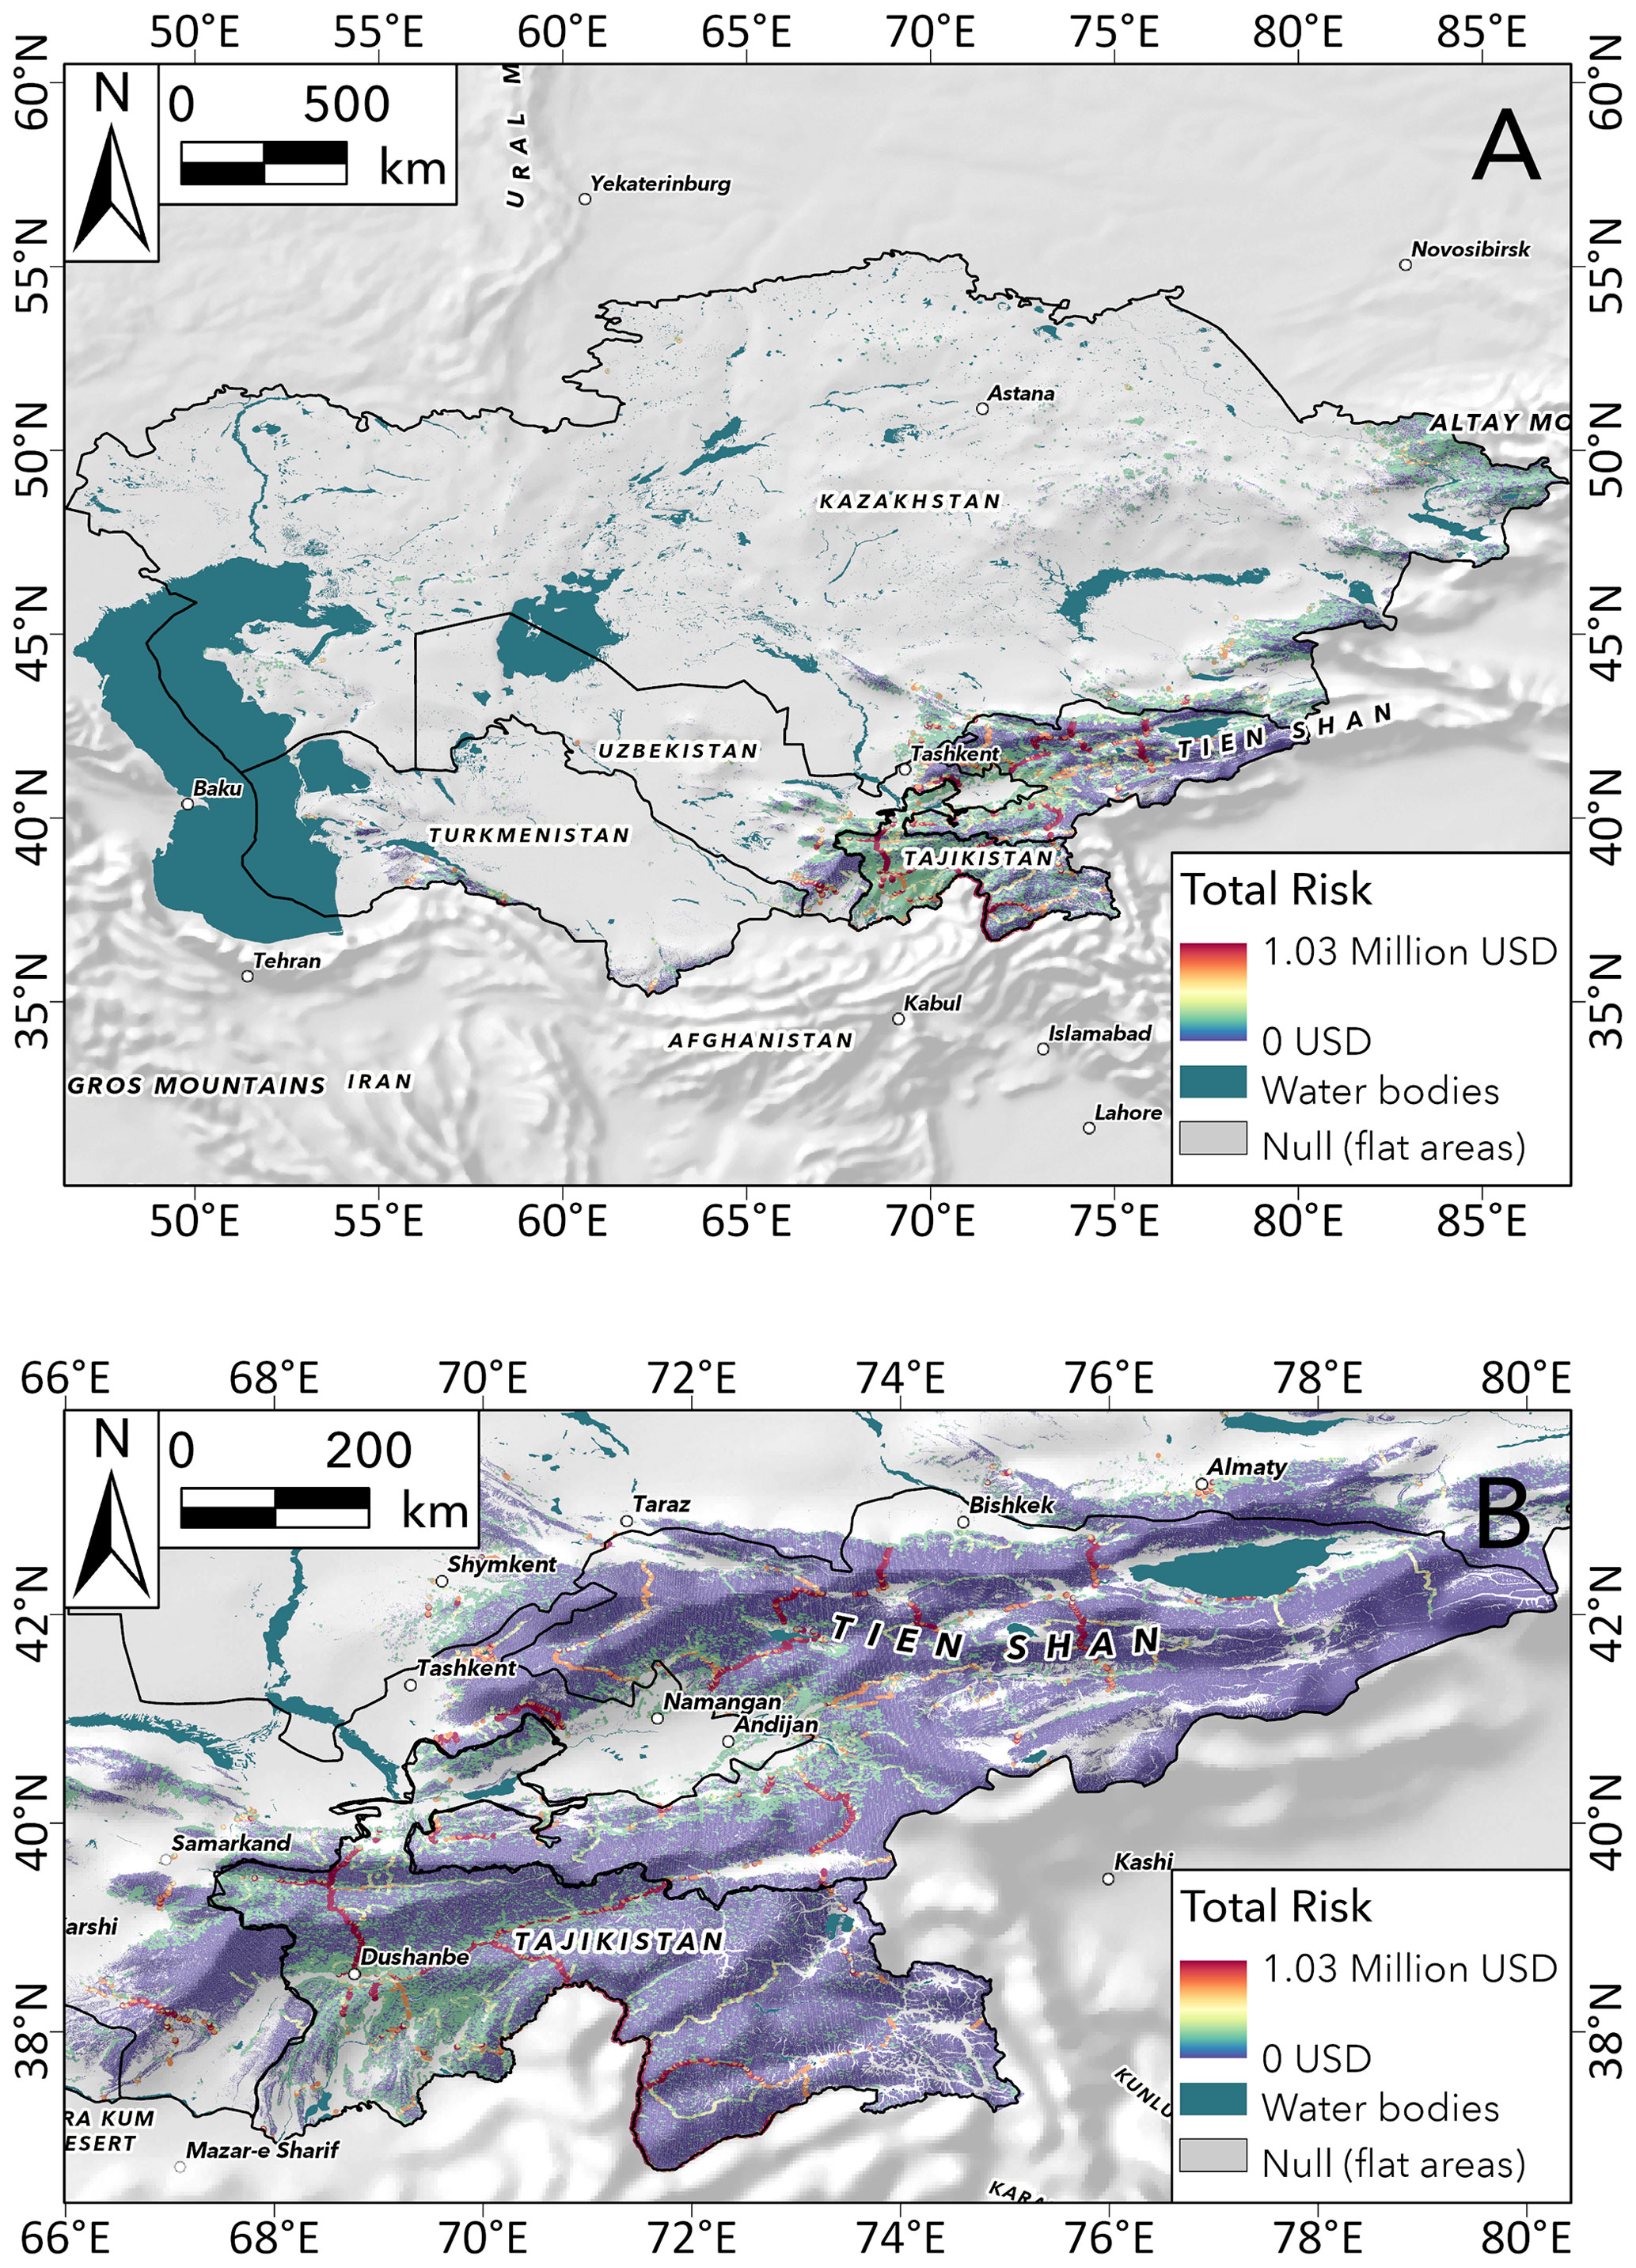
Figure 6Total landslide risk map for Central Asia. Panel (a) shows the distribution of potential economic losses across the whole study area. Panel (b) shows a detailed view of the map in (a) over the area covered by Tajikistan and Kyrgyz Republic.
Figure 7 shows the total landslide risk in Central Asia aggregated within each district. The findings reveal that the district with the highest possible losses is the Ayni district in Tajikistan with a total value of about USD 80 million (Fig. 8) and a maximum value of USD 503 000. The selected district is covered by the Tien Shan chain and its landslide hazard values range from 0.37 to 1, with a mean value of 0.55, revealing that the area is very prone to trigger landslides and to suffer possible damages to structures and loss of lives. Furthermore, the aggregation of landslide risk values at the district level reveals that the majority of these administrative units with high-risk values are mainly located in Tajikistan and Kyrgyz Republic, which are the countries most affected by landslides and damages related to them in Central Asia. Nevertheless, even districts of other countries show high values of risk. For instance, the Ohangaron district located in the Tashkent region of Uzbekistan is among the first 10 districts with the highest total landslide risk (Fig. 8a).
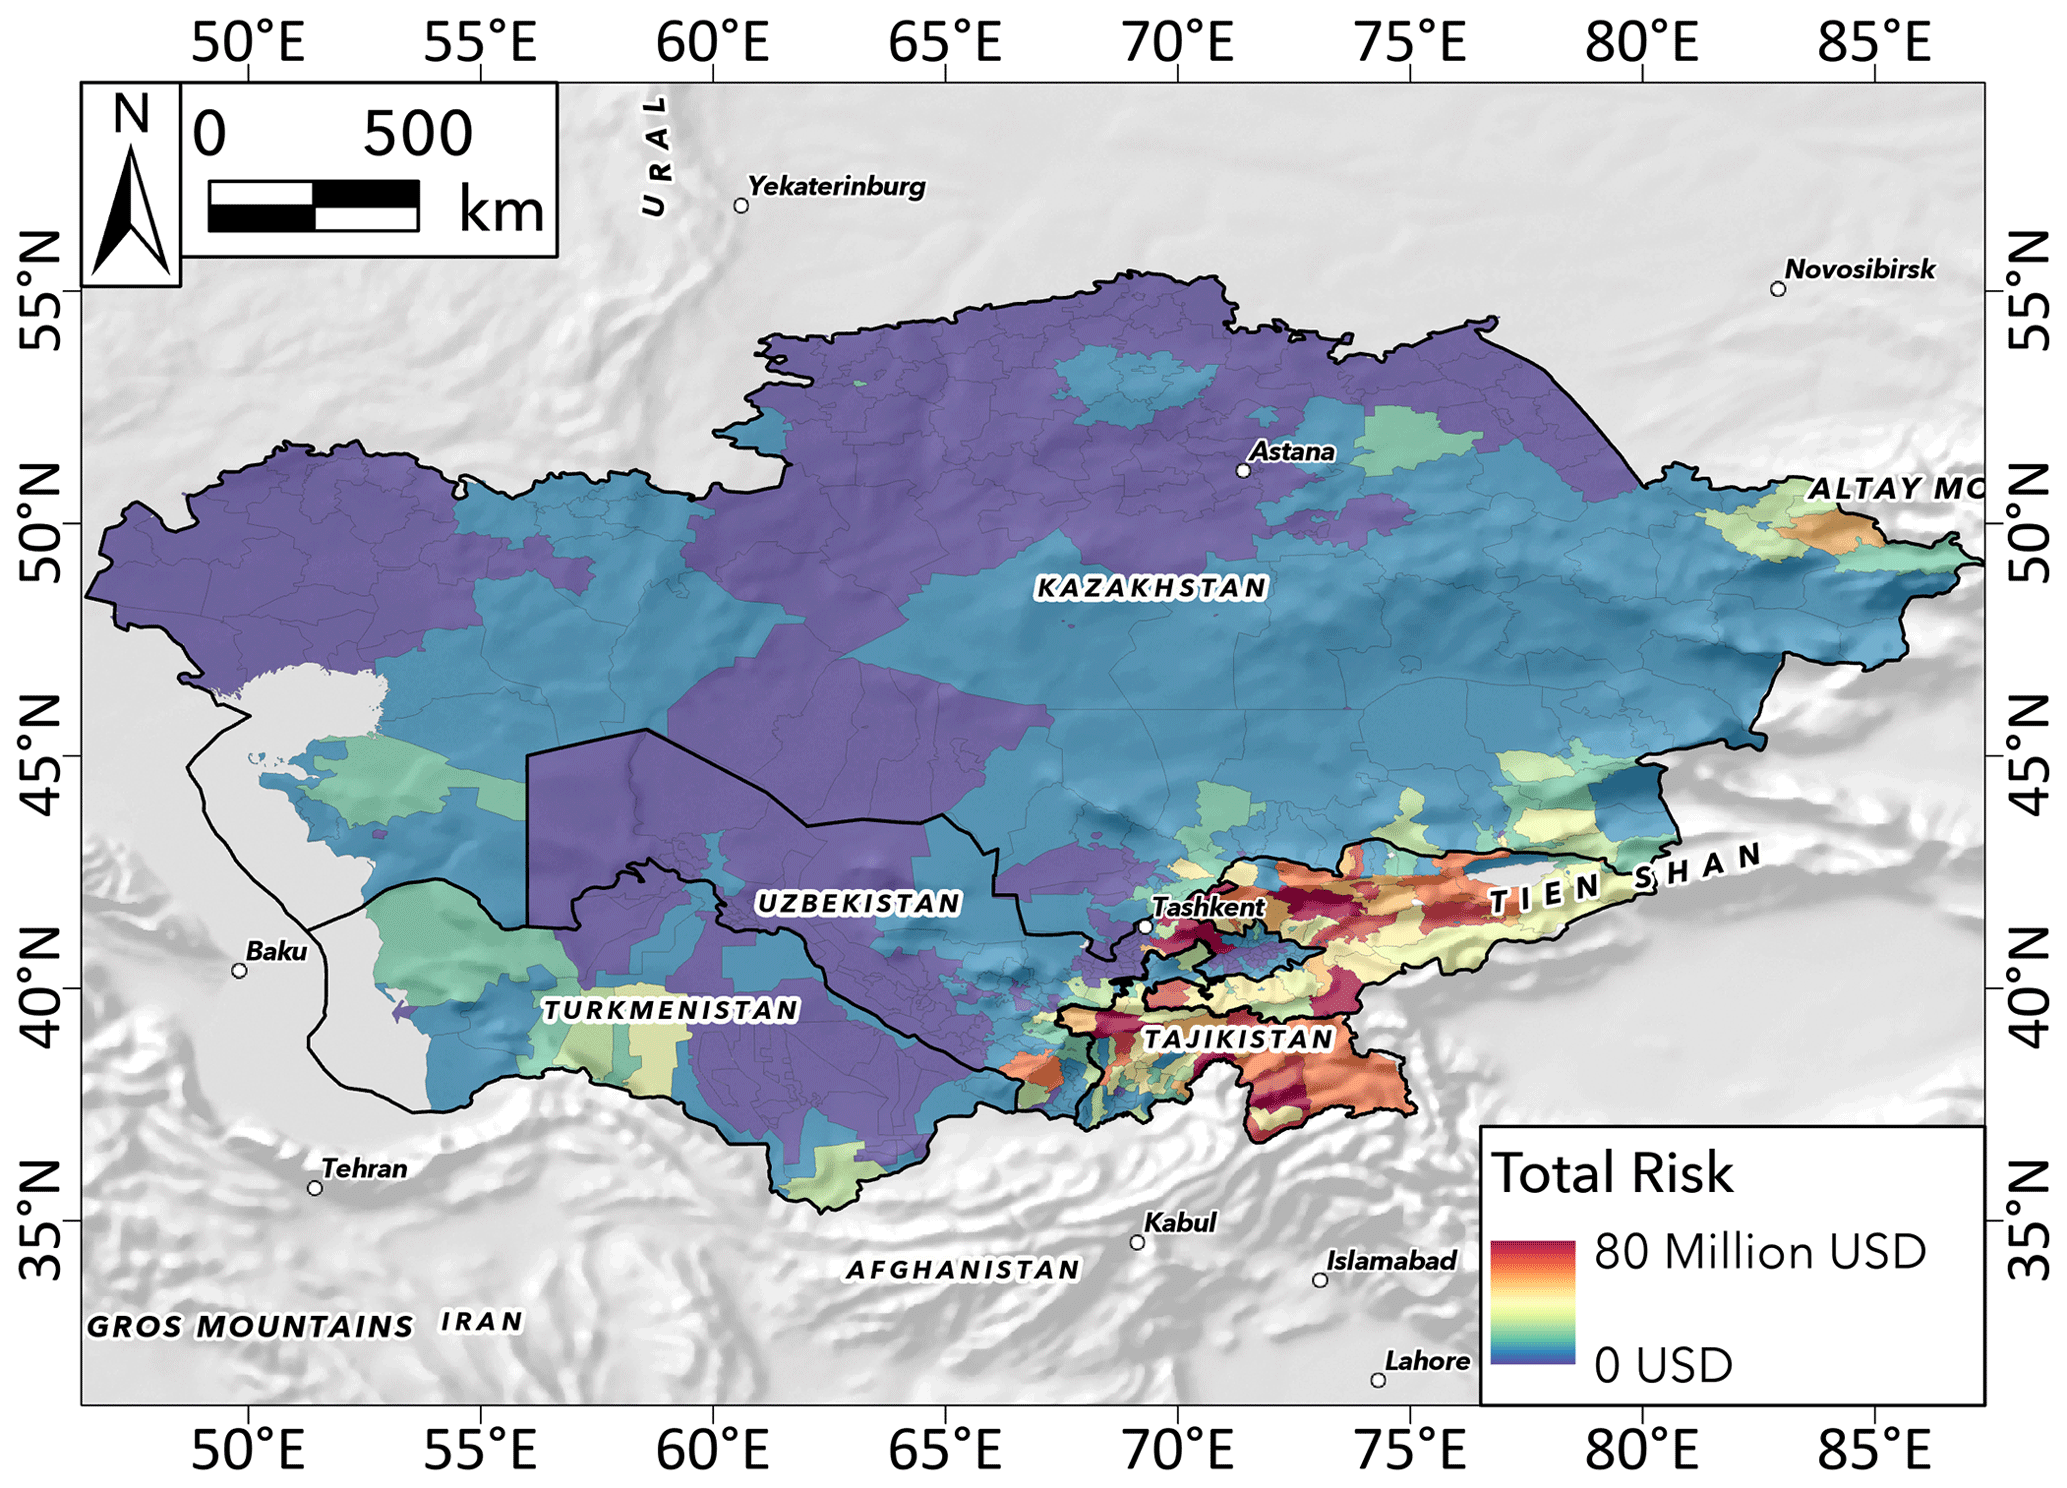
Figure 7Total landslide risk map at the district level in Central Asia.
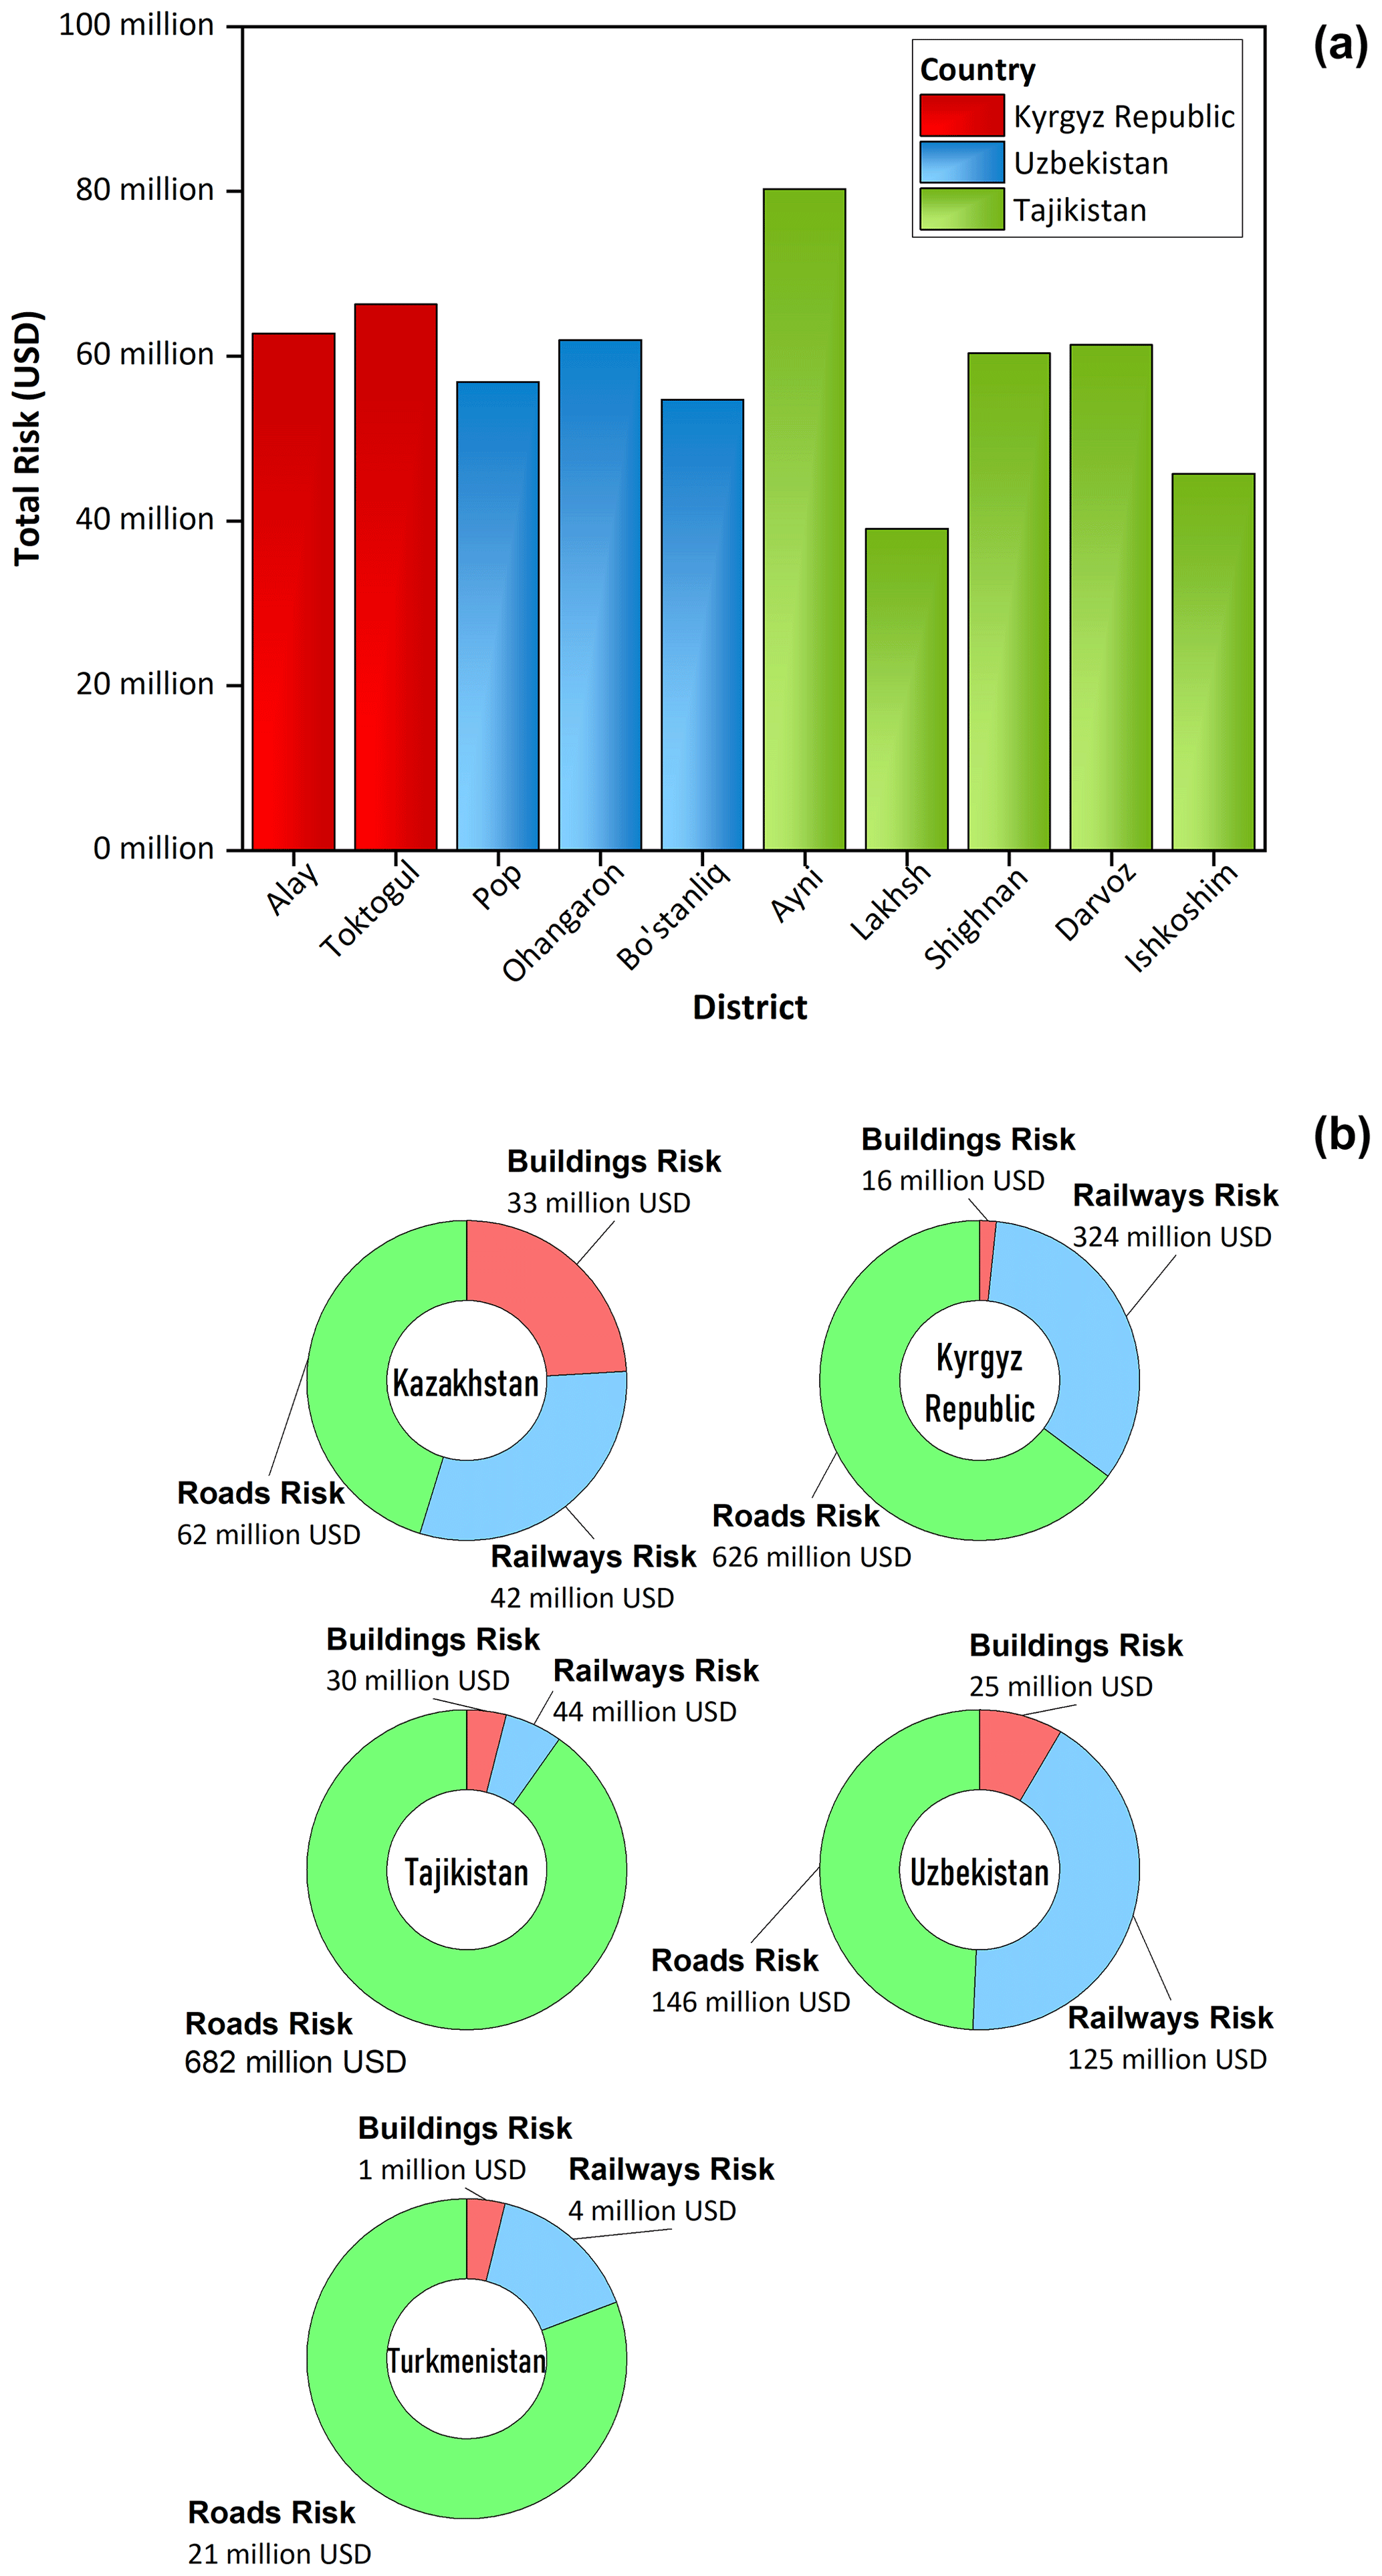
Figure 8Histogram of the 10 districts with the highest landslide risk in Central Asia (a). Landslide risk aggregated at the national level (b).
The obtained outcomes aggregated to the national level further confirm our previous considerations about the landslide risk distribution in Central Asia and show that landslide risk mainly comprises the risk regarding roads, which ranges from a minimum of USD 21 million in Turkmenistan to a maximum of USD 682 million in Tajikistan (Fig. 8b). In detail, the risk component related to roads represents at least 50 % of the total risk (exception for Kazakhstan). This fact is mainly due to the covered area of these infrastructures within the risk grid analysis, which is greater than the area related to the other analysed elements at risk. Kyrgyz Republic shows that the highest expected economic losses, with a value of USD 324 million, are related to railways; nevertheless, Uzbekistan is the country where railways risk contributes more to the total risk with a percentage of 42 %. Finally, in all of Central Asia, Kazakhstan reports the highest value of total buildings risk (USD 33 million) across the country. Moreover, the aggregation at the national level demonstrates that the buildings component is always the one characterized by the least weight within the risk analysis, and this is because buildings are mainly located in areas where landslide hazard is equal or close to 0; or in alluvial plains, which are filtered out of our grid analysis.
4.4 Considerations and future perspectives
In the context of this research, we undertook a quantitative assessment of landslide risk in Central Asia. Our analytical framework involved a spatial resolution of 200 m and a focus on the quantification of potential losses, encompassing both human lives and economical losses associated with the damage to human settlements and linear infrastructures. The findings of this regional-scale landslide risk assessment constitute an innovative step forward, as such comprehensive assessments for vast geographic regions have historically been scarce in the literature. Despite this, we recall once more the inherent limitations mainly stemming from data scarcity, which makes it arduous to evaluate some landslide risk components in the assessment of the temporal and areal probability of landslide occurrence.
Notably, data scarcity in landslide studies can significantly hinder accurate evaluation of the risk posed by these phenomena, potentially putting communities at greater risk (Uzielli et al., 2015a; Dragićević et al., 2015; Jacobs et al., 2018). Furthermore, limited data can impede the development of effective early warning systems (Peres and Cancelliere, 2021; Marin et al., 2021; Lindsay et al., 2022). Indeed, without access to useful data needed to estimate the components of landslide risk equation (e.g. landslide hazard in its completeness or vulnerability of exposed elements), it becomes challenging to produce reliable products (Biçer and Ercanoglu, 2020).
Moreover, the adoption of a 200 m spatial resolution may obscure the socio-economic heterogeneities across Central Asia, thereby rendering our risk estimates as generalized approximations. However, it should be noted that findings resulting from a small-scale analysis can represent a valuable initial resource for any developing country (Stanley and Kirschbaum, 2017; Sim et al., 2022). These analyses provide a preliminary outlook on the spatial distribution of potential losses and offer insight into the degree of prudence required within administrative regions when formulating spatial planning strategies.
In a rising context, where accurate data for in-depth assessments may be limited, small-scale analyses can play a fundamental role by delineating spatial patterns associated with potential losses, which can help policymakers and stakeholders in their efforts to produce a resilient, sustainable development framework. Undoubtedly, the inherent limitations necessitate further investigation and refinement to attain more detailed findings. In this regard, future developments should be focused on in-depth studies at the sub-national level (e.g. a down-scaling phase) with the objective of evaluating in detail all the risk components.
Landslides are a worldwide hazard, especially in the case of developing countries where the increase in urban development, population growth and drastic land use change certainly emphasizes that landslide exposure can lead to significant losses in various contexts. Consequently, a quantitative risk assessment turns out to be an indispensable instrument for mitigating potential repercussions on human lives, settlements and infrastructures.
In this work, we conducted a comprehensive landslide risk analysis in quantitative terms, built upon a 200 m spatial resolution, in Central Asia. Our analytical approach was focused on assessing landslide risk by expressing it in terms of exposed population and expected economic losses to buildings and linear infrastructures (roads and railways). Our findings reveal a clear trend: linear infrastructures, owing to their geographical placement in areas more predisposed to trigger landslides, emerge as the elements exposed to the highest magnitude of losses. Notably, our analysis shows that the cumulative expected losses in Central Asia are approximately USD 3.59 billion, which corresponds to a mean value of USD 0.6 million per km2.
However, we recall that the extension of our study area implies some hypotheses within our workflow: landslide hazard was considered as the spatial probability of landslide occurrence (susceptibility) since the data scarcity on landslide types, frequency and affected areas did not allow us to evaluate it in its completeness. Furthermore, we supposed that in the case of a landslide in a mapping unit, all the placed elements would be affected and suffer the maximum degree of loss, which is equivalent to setting their vulnerability to 1.
Despite these approximations in the analysis, the study can be considered a novelty in landslide risk analyses, particularly in the context of evaluating landslide risk in vast geographic domains. Notably, based on our knowledge of the current state of the literature, our outcomes represent the first regional-scale landslide risk assessment for Central Asia and also represent a valuable resource in facilitating the efforts of policymakers and stakeholders, since these outcomes provide a preliminary view of the spatial distribution of potential losses.
Nevertheless, further refinements could be implemented in the future. A plausible direction for possible future research would include a transition into a down-scaling phase, where more detailed assessments at the sub-national level could be built. These approaches should be focused on assessing landslide hazard and vulnerability of exposed elements in their completeness, providing stakeholders with a more powerful tool for risk management and disaster preparedness.
Data will be provided upon request to the corresponding author.
FC co-conceived the research, wrote the manuscript and ran the analyses. CS contributed to the exposure assessment and the revision of the manuscript. WF contributed to the revision of the research. VT co-conceived the research, supervised the work and revised the manuscript.
The contact author has declared that none of the authors has any competing interests.
Publisher's note: Copernicus Publications remains neutral with regard to jurisdictional claims made in the text, published maps, institutional affiliations, or any other geographical representation in this paper. While Copernicus Publications makes every effort to include appropriate place names, the final responsibility lies with the authors.
This article is part of the special issue “Regionally consistent risk assessment for earthquakes and floods and selective landslide scenario analysis in Central Asia”. It is not associated with a conference.
This work was developed within World Bank-funded project “Strengthening Financial Resilience and Accelerating Risk Reduction in Central Asia” (SFRARR), in collaboration with the European Union, and the Global Facility for Disaster Reduction and Recovery (GFDRR), with the goal of improving financial resilience and risk-informed investment planning in the Central Asian countries (Kazakhstan, Kyrgyz Republic, Tajikistan, Turkmenistan and Uzbekistan).
This research has been supported by the World Bank Group (Consulting Services Contract No. 8006611 – Regionally consistent risk assessment for earthquakes and floods and selective landslide scenario analysis for strengthening financial resilience and accelerating risk reduction in Central Asia).
This paper was edited by Paola Ceresa and reviewed by three anonymous referees.
Abella, E. C. and Van Westen, C. J.: Generation of a landslide risk index map for Cuba using spatial multi-criteria evaluation, Landslides, 4, 311–325, 2007.
Behling, R., Roessner, S., Kaufmann, H., and Kleinschmit, B.: Automated spatiotemporal landslide mapping over large areas using rapideye time series data, Remote Sens.-Basel, 6, 8026–8055, 2014.
Benson, C. and Clay, E. J.: Understanding the economic and financial impacts of natural disasters, World Bank Publications, ISBN 0-8213-5685-2, 2004.
Bezerra, L., Neto, O. de F., Santos Jr., O., and Mickovski, S.: Landslide risk mapping in an urban area of the City of Natal, Brazil, Sustainability, 12, 9601, https://doi.org/10.3390/su12229601, 2020.
Biçer, Ç. T. and Ercanoglu, M.: A semi-quantitative landslide risk assessment of central Kahramanmaraş City in the Eastern Mediterranean region of Turkey, Arab. J. Geosci., 13, 1–26, 2020.
Brabb, E. E.: Innovative approaches to landslide hazard and risk mapping, in: International Landslide Symposium Proceedings, Toronto, Canada, 23–31 August 1984, 17–22, 1984.
Breiman, L.: Random Forests, Mach. Learn., 45, 5–32, https://doi.org/10.1023/A:1010933404324, 2001.
Brenning, A.: Spatial prediction models for landslide hazards: review, comparison and evaluation, Nat. Hazards Earth Syst. Sci., 5, 853–862, https://doi.org/10.5194/nhess-5-853-2005, 2005.
Burtman, V. S.: Structural geology of variscan Tien Shan, USSR, Am. J. Sci., 275, 157–186, 1975.
Buslov, M. M., De Grave, J., Bataleva, E. A. V., and Batalev, V. Y.: Cenozoic tectonic and geodynamic evolution of the Kyrgyz Tien Shan Mountains: A review of geological, thermochronological and geophysical data, J. Asian Earth Sci., 29, 205–214, 2007.
Caleca, F., Tofani, V., Segoni, S., Raspini, F., Rosi, A., Natali, M., Catani, F., and Casagli, N.: A methodological approach of QRA for slow-moving landslides at a regional scale, Landslides, 19, 1539–1561, https://doi.org/10.1007/s10346-022-01875-x, 2022
Catani, F., Casagli, N., Ermini, L., Righini, G., and Menduni, G.: Landslide hazard and risk mapping at catchment scale in the Arno River basin, Landslides, 2, 329–342, https://doi.org/10.1007/s10346-005-0021-0, 2005.
Catani, F., Lagomarsino, D., Segoni, S., and Tofani, V.: Landslide susceptibility estimation by random forests technique: sensitivity and scaling issues, Nat. Hazards Earth Syst. Sci., 13, 2815–2831, https://doi.org/10.5194/nhess-13-2815-2013, 2013.
Charreau, J., Gilder, S., Chen, Y., Dominguez, S., Avouac, J.-P., Sen, S., Jolivet, M., Li, Y., and Wang, W.: Magnetostratigraphy of the Yaha section, Tarim Basin (China): 11 Ma acceleration in erosion and uplift of the Tian Shan mountains, Geology, 34, 181–184, 2006.
Corominas, J., van Westen, C., Frattini, P., Cascini, L., Malet, J.-P., Fotopoulou, S., Catani, F., Van Den Eeckhaut, M., Mavrouli, O., Agliardi, F., Pitilakis, K., Winter, M. G., Pastor, M., Ferlisi, S., Tofani, V., Hervás, J., and Smith, J. T.: Recommendations for the quantitative analysis of landslide risk, B. Eng. Geol. Environ., 73, 209–263, https://doi.org/10.1007/s10064-013-0538-8, 2014.
Corominas, J., Matas, G., and Ruiz-Carulla, R.: Quantitative analysis of risk from fragmental rockfalls, Landslides, 16, 5–21, 2019.
Dai, F. C., Lee, C. F., and Ngai, Y. Y.: Landslide risk assessment and management: an overview, Eng. Geol., 64, 65–87, https://doi.org/10.1016/S0013-7952(01)00093-X, 2002.
Davy, P. and Cobbold, P. R.: Indentation tectonics in nature and experiment. 1. Experiments scaled for gravity, Bull. Geol. Inst. Univ. Upps., 14, 129–141, 1988.
de Almeida, L. Q., Welle, T., and Birkmann, J.: Disaster risk indicators in Brazil: A proposal based on the world risk index, Int. J. Disast. Risk Re., 17, 251–272, https://doi.org/10.1016/j.ijdrr.2016.04.007, 2016.
Dragićević, S., Lai, T., and Balram, S.: GIS-based multicriteria evaluation with multiscale analysis to characterize urban landslide susceptibility in data-scarce environments, Habitat Int., 45, 114–125, 2015.
Emberson, R., Kirschbaum, D., and Stanley, T.: New global characterisation of landslide exposure, Nat. Hazards Earth Syst. Sci., 20, 3413–3424, https://doi.org/10.5194/nhess-20-3413-2020, 2020.
Farr, T. G. and Kobrick, M.: Shuttle Radar Topography Mission produces a wealth of data, Eos T. Am. Geophys. Un., 81, 583–585, 2000.
Farr, T. G., Rosen, P. A., Caro, E., Crippen, R., Duren, R., Hensley, S., Kobrick, M., Paller, M., Rodriguez, E., and Roth, L.: The shuttle radar topography mission, Rev. Geophys., 45, RG2004, https://doi.org/10.1029/2005RG000183, 2007.
Fell, R., Ho, K. K., Lacasse, S., and Leroi, E.: A framework for landslide risk assessment and management, in: Landslide risk management, CRC Press, 13–36, ISBN 04 1538 043 X, 2005.
Fell, R., Corominas, J., Bonnard, C., Cascini, L., Leroi, E., and Savage, W. Z.: Guidelines for landslide susceptibility, hazard and risk zoning for land-use planning, Eng. Geol., 102, 99–111, 2008.
Ferlisi, S., Marchese, A., and Peduto, D.: Quantitative analysis of the risk to road networks exposed to slow-moving landslides: a case study in the Campania region (southern Italy), Landslides, 18, 303–319, 2021.
Froude, M. J. and Petley, D. N.: Global fatal landslide occurrence from 2004 to 2016, Nat. Hazards Earth Syst. Sci., 18, 2161–2181, https://doi.org/10.5194/nhess-18-2161-2018, 2018.
Garcia, R. A. C., Oliveira, S. C., and Zêzere, J. L.: Assessing population exposure for landslide risk analysis using dasymetric cartography, Nat. Hazards Earth Syst. Sci., 16, 2769–2782, https://doi.org/10.5194/nhess-16-2769-2016, 2016.
Gariano, S. L. and Guzzetti, F.: Landslides in a changing climate, Earth-Sci. Rev., 162, 227–252, 2016.
Glade, T.: Vulnerability assessment in landslide risk analysis, Erde, 134, 123–146, 2003.
Golovko, D., Roessner, S., Behling, R., Wetzel, H.-U., and Kleinschmidt, B.: Development of multi-temporal landslide inventory information system for southern Kyrgyzstan using GIS and satellite remote sensing, Photogramm. Fernerkun., 2015, 157–172, 2015.
Guillard-Gonçalves, C., Cutter, S. L., Emrich, C. T., and Zêzere, J. L.: Application of Social Vulnerability Index (SoVI) and delineation of natural risk zones in Greater Lisbon, Portugal, J. Risk Res., 18, 651–674, https://doi.org/10.1080/13669877.2014.910689, 2015.
Guzzetti, F., Reichenbach, P., Cardinali, M., Galli, M., and Ardizzone, F.: Probabilistic landslide hazard assessment at the basin scale, Geomorphology, 72, 272–299, https://doi.org/10.1016/j.geomorph.2005.06.002, 2005.
Haque, U., Da Silva, P. F., Devoli, G., Pilz, J., Zhao, B., Khaloua, A., Wilopo, W., Andersen, P., Lu, P., and Lee, J.: The human cost of global warming: Deadly landslides and their triggers (1995–2014), Sci. Total Environ., 682, 673–684, 2019.
Havenith, H.-B., Strom, A., Jongmans, D., Abdrakhmatov, A., Delvaux, D., and Tréfois, P.: Seismic triggering of landslides, Part A: Field evidence from the Northern Tien Shan, Nat. Hazards Earth Syst. Sci., 3, 135–149, https://doi.org/10.5194/nhess-3-135-2003, 2003.
Havenith, H.-B., Strom, A., Caceres, F., and Pirard, E.: Analysis of landslide susceptibility in the Suusamyr region, Tien Shan: statistical and geotechnical approach, Landslides, 3, 39–50, 2006.
Havenith, H.-B., Strom, A., Torgoev, I., Torgoev, A., Lamair, L., Ischuk, A., and Abdrakhmatov, K.: Tien Shan geohazards database: Earthquakes and landslides, Geomorphology, 249, 16–31, 2015.
Huang, J. S., Griffiths, D. V., and Fenton, G: Quantitative risk assessment of individual landslides. In: Proceedings of the 7th International Symposium on Geotechnical Safety and Risk, 12–13 December 2019, Taipei, Taiwan, 45–54, https://doi.org/10.3850/978-981-11-2725-0-key2-cd, 2020.
Huang, R., Pei, X., Fan, X., Zhang, W., Li, S., and Li, B.: The characteristics and failure mechanism of the largest landslide triggered by the Wenchuan earthquake, May 12, 2008, China, Landslides, 9, 131–142, 2012.
Jacobs, L., Dewitte, O., Poesen, J., Sekajugo, J., Nobile, A., Rossi, M., Thiery, W., and Kervyn, M.: Field-based landslide susceptibility assessment in a data-scarce environment: the populated areas of the Rwenzori Mountains, Nat. Hazards Earth Syst. Sci., 18, 105–124, https://doi.org/10.5194/nhess-18-105-2018, 2018.
Jaiswal, P., van Westen, C. J., and Jetten, V.: Quantitative estimation of landslide risk from rapid debris slides on natural slopes in the Nilgiri hills, India, Nat. Hazards Earth Syst. Sci., 11, 1723–1743, https://doi.org/10.5194/nhess-11-1723-2011, 2011.
Kalmetieva, Z. A., Mikolaichuk, A. V., Moldobekov, B. D., Meleshko, A. V., Jantaev, M. M., Zubovich, A. V., and Havenith, H. B.: Atlas of earthquakes in Kyrgyzstan, in: CAIAG, Bishkek, vol. 76, ISBN 978-9967-25-829-7, 2009.
Kanungo, D., Arora, M., Sarkar, S., and Gupta, R.: Landslide Susceptibility Zonation (LSZ) Mapping – A Review, J. South Asia Disaster Stud., 2, 81–105, 2009.
Kavzoglu, T., Colkesen, I., and Sahin, E. K.: Machine Learning Techniques in Landslide Susceptibility Mapping: A Survey and a Case Study, in: Pradhan, S., Vishal, V., and Singh, T., Landslides: Theory, Practice and Modelling. Advances in Natural and Technological Hazards Research, vol. 50, Springer, Cham, https://doi.org/10.1007/978-3-319-77377-3_13, 2019.
Ko, C. K., Flentje, P., and Chowdhury, R.: Quantitative landslide hazard and risk assessment: a case study, Q. J. Eng. Geol. Hydroge., 36, 261–272, 2003.
Kreibich, H., Van Loon, A. F., Schröter, K., Ward, P. J., Mazzoleni, M., Sairam, N., Abeshu, G. W., Agafonova, S., AghaKouchak, A., and Aksoy, H.: The challenge of unprecedented floods and droughts in risk management, Nature, 608, 80–86, 2022.
Lagomarsino, D., Tofani, V., Segoni, S., Catani, F., and Casagli, N.: A tool for classification and regression using random forest methodology: applications to landslide susceptibility mapping and soil thickness modeling, Environ. Model. Assess., 22, 201–214, 2017.
Lari, S., Frattini, P., and Crosta, G. B.: A probabilistic approach for landslide hazard analysis, Eng. Geol., 182, 3–14, 2014.
Lee, E. M. and Jones, D. K.: Landslide risk assessment, Thomas Telford, London, https://doi.org/10.1680/lra.66236.bm02, 2004.
Li, Z., Nadim, F., Huang, H., Uzielli, M., and Lacasse, S.: Quantitative vulnerability estimation for scenario-based landslide hazards, Landslides, 7, 125–134, https://doi.org/10.1007/s10346-009-0190-3, 2010.
Lindsay, E., Frauenfelder, R., Rüther, D., Nava, L., Rubensdotter, L., Strout, J., and Nordal, S.: Multi-temporal satellite image composites in google earth engine for improved landslide visibility: A case study of a glacial landscape, Remote Sens.-Basel, 14, 2301, https://doi.org/10.3390/rs14102301, 2022.
Lu, P., Catani, F., Tofani, V., and Casagli, N.: Quantitative hazard and risk assessment for slow-moving landslides from Persistent Scatterer Interferometry, Landslides, 11, 685–696, https://doi.org/10.1007/s10346-013-0432-2, 2014.
Maes, J., Kervyn, M., de Hontheim, A., Dewitte, O., Jacobs, L., Mertens, K., Vanmaercke, M., Vranken, L., and Poesen, J.: Landslide risk reduction measures: A review of practices and challenges for the tropics, Prog. Phys. Geog., 41, 191–221, 2017.
Marin, R. J., Velásquez, M. F., García, E. F., Alvioli, M., and Aristizábal, E.: Assessing two methods of defining rainfall intensity and duration thresholds for shallow landslides in data-scarce catchments of the Colombian Andean Mountains, Catena, 206, 105563, https://doi.org/10.1016/j.catena.2021.105563, 2021.
Merghadi, A., Yunus, A. P., Dou, J., Whiteley, J., ThaiPham, B., Bui, D. T., Avtar, R., and Abderrahmane, B.: Machine learning methods for landslide susceptibility studies: A comparative overview of algorithm performance, Earth-Sci. Rev., 207, 103225, https://doi.org/10.1016/j.earscirev.2020.103225, 2020.
Michael-Leiba, M., Baynes, F., Scott, G., and Granger, K.: Quantitative landslide risk assessment of Cairns, Australia, in: Glade, T., Anderson, M., and Crozier, M., Landslide Hazard and Risk, John Wiley & Sons, West Sussex, 621–642, https://doi.org/10.1002/9780470012659.ch21, 2005.
Molnar, P. and Tapponnier, P.: Cenozoic Tectonics of Asia: Effects of a Continental Collision: Features of recent continental tectonics in Asia can be interpreted as results of the India-Eurasia collision, Science, 189, 419–426, 1975.
Peduto, D., Ferlisi, S., Nicodemo, G., Reale, D., Pisciotta, G., and Gullà, G.: Empirical fragility and vulnerability curves for buildings exposed to slow-moving landslides at medium and large scales, Landslides, 14, 1993–2007, 2017.
Pellicani, R., Van Westen, C. J., and Spilotro, G.: Assessing landslide exposure in areas with limited landslide information, Landslides, 11, 463–480, 2014.
Pereira, S., Santos, P. P., Zêzere, J. L., Tavares, A. O., Garcia, R. A. C., and Oliveira, S. C.: A landslide risk index for municipal land use planning in Portugal, Sci. Total Environ., 735, 139463, https://doi.org/10.1016/j.scitotenv.2020.139463, 2020.
Peres, D. J. and Cancelliere, A.: Comparing methods for determining landslide early warning thresholds: potential use of non-triggering rainfall for locations with scarce landslide data availability, Landslides, 18, 3135–3147, 2021.
Petley, D.: Global patterns of loss of life from landslides, Geology, 40, 927–930, 2012.
Petley, D. N., Hearn, G. J., Hart, A., Rosser, N. J., Dunning, S. A., Oven, K., and Mitchell, W. A.: Trends in landslide occurrence in Nepal, Nat. Hazards, 43, 23–44, 2007.
Piroton, V., Schlögel, R., Barbier, C., and Havenith, H.-B.: Monitoring the recent activity of landslides in the Mailuu-Suu Valley (Kyrgyzstan) using radar and optical remote sensing techniques, Geosciences, 10, 164, https://doi.org/10.3390/geosciences10050164, 2020.
Pittore, M., Haas, M., and Silva, V.: Variable resolution probabilistic modeling of residential exposure and vulnerability for risk applications, Earthq. Spectra, 36, 321–344, 2020.
Puissant, A., Van Den Eeckhaut, M., Malet, J.-P., and Maquaire, O.: Landslide consequence analysis: a region-scale indicator-based methodology, Landslides, 11, 843–858, 2014.
Reichenbach, P., Rossi, M., Malamud, B. D., Mihir, M., and Guzzetti, F.: A review of statistically-based landslide susceptibility models, Earth-Sci. Rev., 180, 60–91, 2018.
Remondo, J., Bonachea, J., and Cendrero, A.: A statistical approach to landslide risk modelling at basin scale: from landslide susceptibility to quantitative risk assessment, Landslides, 2, 321–328, https://doi.org/10.1007/s10346-005-0016-x, 2005.
Remondo, J., Bonachea, J., and Cendrero, A.: Quantitative landslide risk assessment and mapping on the basis of recent occurrences, Geomorphology, 94, 496–507, 2008.
Rosi, A., Frodella, W., Nocentini, N., Caleca, F., Havenith, H. B., Strom, A., Saidov, M., Bimurzaev, G. A., and Tofani, V.: Comprehensive landslide susceptibility map of Central Asia, Nat. Hazards Earth Syst. Sci., 23, 2229–2250, https://doi.org/10.5194/nhess-23-2229-2023, 2023.
Saponaro, A., Pilz, M., Wieland, M., Bindi, D., Moldobekov, B., and Parolai, S.: Landslide susceptibility analysis in data-scarce regions: the case of Kyrgyzstan, B. Eng. Geol. Environ., 74, 1117–1136, 2015.
Scaini, C., Tamaro, A., Adilkhan, B., Sarzhanov, S., Ismailov, V., Umaraliev, R., Safarov, M., Belikov, V., Karayev, J., and Fagà, E.: A new regionally consistent exposure database for Central Asia: population and residential buildings, Nat. Hazards Earth Syst. Sci. Discuss. [preprint], https://doi.org/10.5194/nhess-2023-94, in review, 2023a.
Scaini, C., Tamaro, A., Adilkhan, B., Sarzhanov, S., Ergashev, Z., Umaraliev, R., Safarov, M., Belikov, V., Karayev, J., and Fagà, E.: A regional scale approach to assess non-residential buildings, transportation and croplands exposure in Central Asia, Nat. Hazards Earth Syst. Sci. Discuss. [preprint], https://doi.org/10.5194/nhess-2023-95, in review, 2023b.
Schuster, R. L. and Fleming, R. W.: Economic Losses and Fatalities Due to Landslides, Environ. Eng. Geosci., xxiii, 11–28, https://doi.org/10.2113/gseegeosci.xxiii.1.11, 1986.
Schuster, R. L. and Turner, A. K.: Landslides: investigation and mitigation, National Academy Press, Washington, DC, http://onlinepubs.trb.org/Onlinepubs/sr/sr247/sr247.pdf (last access: 3 January 2024), ISBN 0-309-06151-2, 1996.
Segoni, S. and Caleca, F.: Definition of Environmental Indicators for a Fast Estimation of Landslide Risk at National Scale, Land, 10, 621, https://doi.org/10.3390/land10060621, 2021.
Segoni, S., Piciullo, L., and Gariano, S. L.: A review of the recent literature on rainfall thresholds for landslide occurrence, Landslides, 15, 1483–1501, 2018.
Sim, K. B., Lee, M. L., and Wong, S. Y.: A review of landslide acceptable risk and tolerable risk, Geoenvironmental Disasters, 9, 3, https://doi.org/10.1186/s40677-022-00205-6, 2022.
Stanley, T. and Kirschbaum, D. B.: A heuristic approach to global landslide susceptibility mapping, Nat. Hazards, 87, 145–164, 2017.
Strom, A.: Landslide dams in Central Asia region, J. Jpn. Landslide Soc., 47, 309–324, 2010.
Strom, A. and Abdrakhmatov, K.: Large-Scale Rockslide Inventories: From the Kokomeren River Basin to the Entire Central Asia Region (WCoE 2014–2017, IPL-106-2), in: Advancing Culture of Living with Landslides, edited by: Sassa, K., Mikoš, M., and Yin, Y., WLF 2017, Springer, Cham, https://doi.org/10.1007/978-3-319-59469-9_28, 2017.
Strom, A. and Abdrakhmatov, K.: Rockslides and rock avalanches of Central Asia: distribution, morphology, and internal structure, Elsevier, ISBN 978-0-12-803204-6, 2018.
Taalab, K., Cheng, T., and Zhang, Y.: Mapping landslide susceptibility and types using Random Forest, Big Earth Data, 2, 159–178, 2018.
Thurman, M.: Natural disaster risks in Central Asia: a synthesis, Bratisl. Slovak. U. N. Dev. Programme, https://www.preventionweb.net/files/18945_cadisasterrisksmtd51104.pdf (last access: 3 January 2024), 2011.
Trifonov, V. G., Makarov, I. A., and Skobolev, S. F.: The Talas–Fergana active right-lateral fault, Ann. Tectonicae, 6, 224–237, 1992.
Trigila, A., Frattini, P., Casagli, N., Catani, F., Crosta, G., Esposito, C., Iadanza, C., Lagomarsino, D., Mugnozza, G. S., Segoni, S., Spizzichino, D., Tofani, V., and Lari, S.: Landslide Susceptibility Mapping at National Scale: The Italian Case Study, in: Landslide Science and Practice, vol. 1: Landslide Inventory and Susceptibility and Hazard Zoning, edited by: Margottini, C., Canuti, P., and Sassa, K., Springer Berlin Heidelberg, Berlin, Heidelberg, 287–295, https://doi.org/10.1007/978-3-642-31325-7_38, 2013.
Trigila, A., Iadanza, C., Bussettini, M., and Lastoria, B.: Landslides and floods in Italy: hazard and risk indicators, ISPRA Rapp., 287, 172, ISBN 978-88-448-0901-0, 2018.
Turner, A. K.: Social and environmental impacts of landslides, Innov. Infrastruct. Solut., 3, 1–25, 2018.
Uzielli, M., Nadim, F., Lacasse, S., and Kaynia, A. M.: A conceptual framework for quantitative estimation of physical vulnerability to landslides, Eng. Geol., 102, 251–256, https://doi.org/10.1016/j.enggeo.2008.03.011, 2008.
Uzielli, M., Catani, F., Tofani, V., and Casagli, N.: Risk analysis for the Ancona landslide – I: characterization of landslide kinematics, Landslides, 12, 69–82, 2015a.
Uzielli, M., Catani, F., Tofani, V., and Casagli, N.: Risk analysis for the Ancona landslide – II: estimation of risk to buildings, Landslides, 12, 83–100, 2015b.
van Westen, C. J., van Asch, T. W. J., and Soeters, R.: Landslide hazard and risk zonation – Why is it still so difficult?, B. Eng. Geol. Environ., 65, 167–184, https://doi.org/10.1007/s10064-005-0023-0, 2006.
Varnes, D. J. and IAEG Commission on Landslides: Landslide hazard zonation: a review of principles and practice, Unesco, Paris, ISBN 92-3-101895-7, 1984.
Wang, H. B., Wu, S. R., Shi, J. S., and Li, B.: Qualitative hazard and risk assessment of landslides: a practical framework for a case study in China, Nat. Hazards, 69, 1281–1294, 2013.
Windley, B. F., Allen, M. B., Zhang, C., Zhao, Z. Y., and Wang, G. R.: Paleozoic accretion and Cenozoic redeformation of the Chinese Tien Shan range, central Asia, Geology, 18, 128–131, 1990.
Youssef, A. M., Pourghasemi, H. R., Pourtaghi, Z. S., and Al-Katheeri, M. M.: Landslide susceptibility mapping using random forest, boosted regression tree, classification and regression tree, and general linear models and comparison of their performance at Wadi Tayyah Basin, Asir Region, Saudi Arabia, Landslides, 13, 839–856, 2016.
Zêzere, J. L., Garcia, R. A. C., Oliveira, S. C., and Reis, E.: Probabilistic landslide risk analysis considering direct costs in the area north of Lisbon (Portugal), Geomorphology, 94, 467–495, 2008.