the Creative Commons Attribution 4.0 License.
the Creative Commons Attribution 4.0 License.
 | 08 Apr 2024
A dense micro-electromechanical system (MEMS)-based seismic network in populated areas: rapid estimation of exposure maps in Trentino (NE Italy)
Alfio Viganò
Jacopo Boaga
Valeria Cascone
Simone Barani
Daniele Spallarossa
Gabriele Ferretti
Mauro Carli
Giancarlo De Marchi
The micro-electromechanical system (MEMS)-based seismic network of Trentino (NE Italy) consists of 73 low-cost accelerometers installed close to inhabited areas. These sensors have a suitable sensitivity to detect moderate-to-strong earthquakes but are able to record even weaker seismicity. The densely distributed peak ground acceleration values recorded by MEMS and other types of stations are integrated within the existing seismic monitoring procedure in order to automatically obtain a complete set of strong motion parameters a few minutes after the origin time. The exposure of the resident population and critical buildings is estimated by quantifying the different levels of shaking, which is expressed according to the Mercalli–Cancani–Sieberg intensity scale. These types of results, summarized in synthetic portable document format (PDF), can be useful for civil protection purposes to evaluate the state of emergency after a strong earthquake in a timely manner and to choose how and where to activate first aid measures and targeted structural monitoring.
- Article
(9731 KB) - Full-text XML
- BibTeX
- EndNote


During the last few decades seismic monitoring has been greatly improved in order to give precise and increasingly detailed information for emergency and environmental purposes. Besides permanent seismic networks, low-cost micro-electromechanical system (MEMS) instrumentation plays a primary role in capturing the increased amount of instrumental data (D'Alessandro et al., 2019). Nowadays, MEMS accelerometers are widely used on different spatial scales to replace or densify permanent networks, in order to improve seismic detection and evaluate with greater resolution the effects of earthquakes (Cochran et al., 2009; Boaga et al., 2018; Patanè et al., 2022; Vitale et al., 2022). Earthquake early warning systems have also been benefitting greatly from MEMS technology because targeted timely actions can be automatically taken in the case of strong earthquakes (Satriano et al., 2011; Cochran, 2018). For this reason, large earthquake datasets need to be efficiently and rapidly managed (Spallarossa et al., 2021), and related outcomes (e.g. earthquake location and magnitude, strong motion data and maps) need to be shared in real time with different end users, such as scientists, technicians, politicians, civil protection authorities, decision-makers, and citizens.
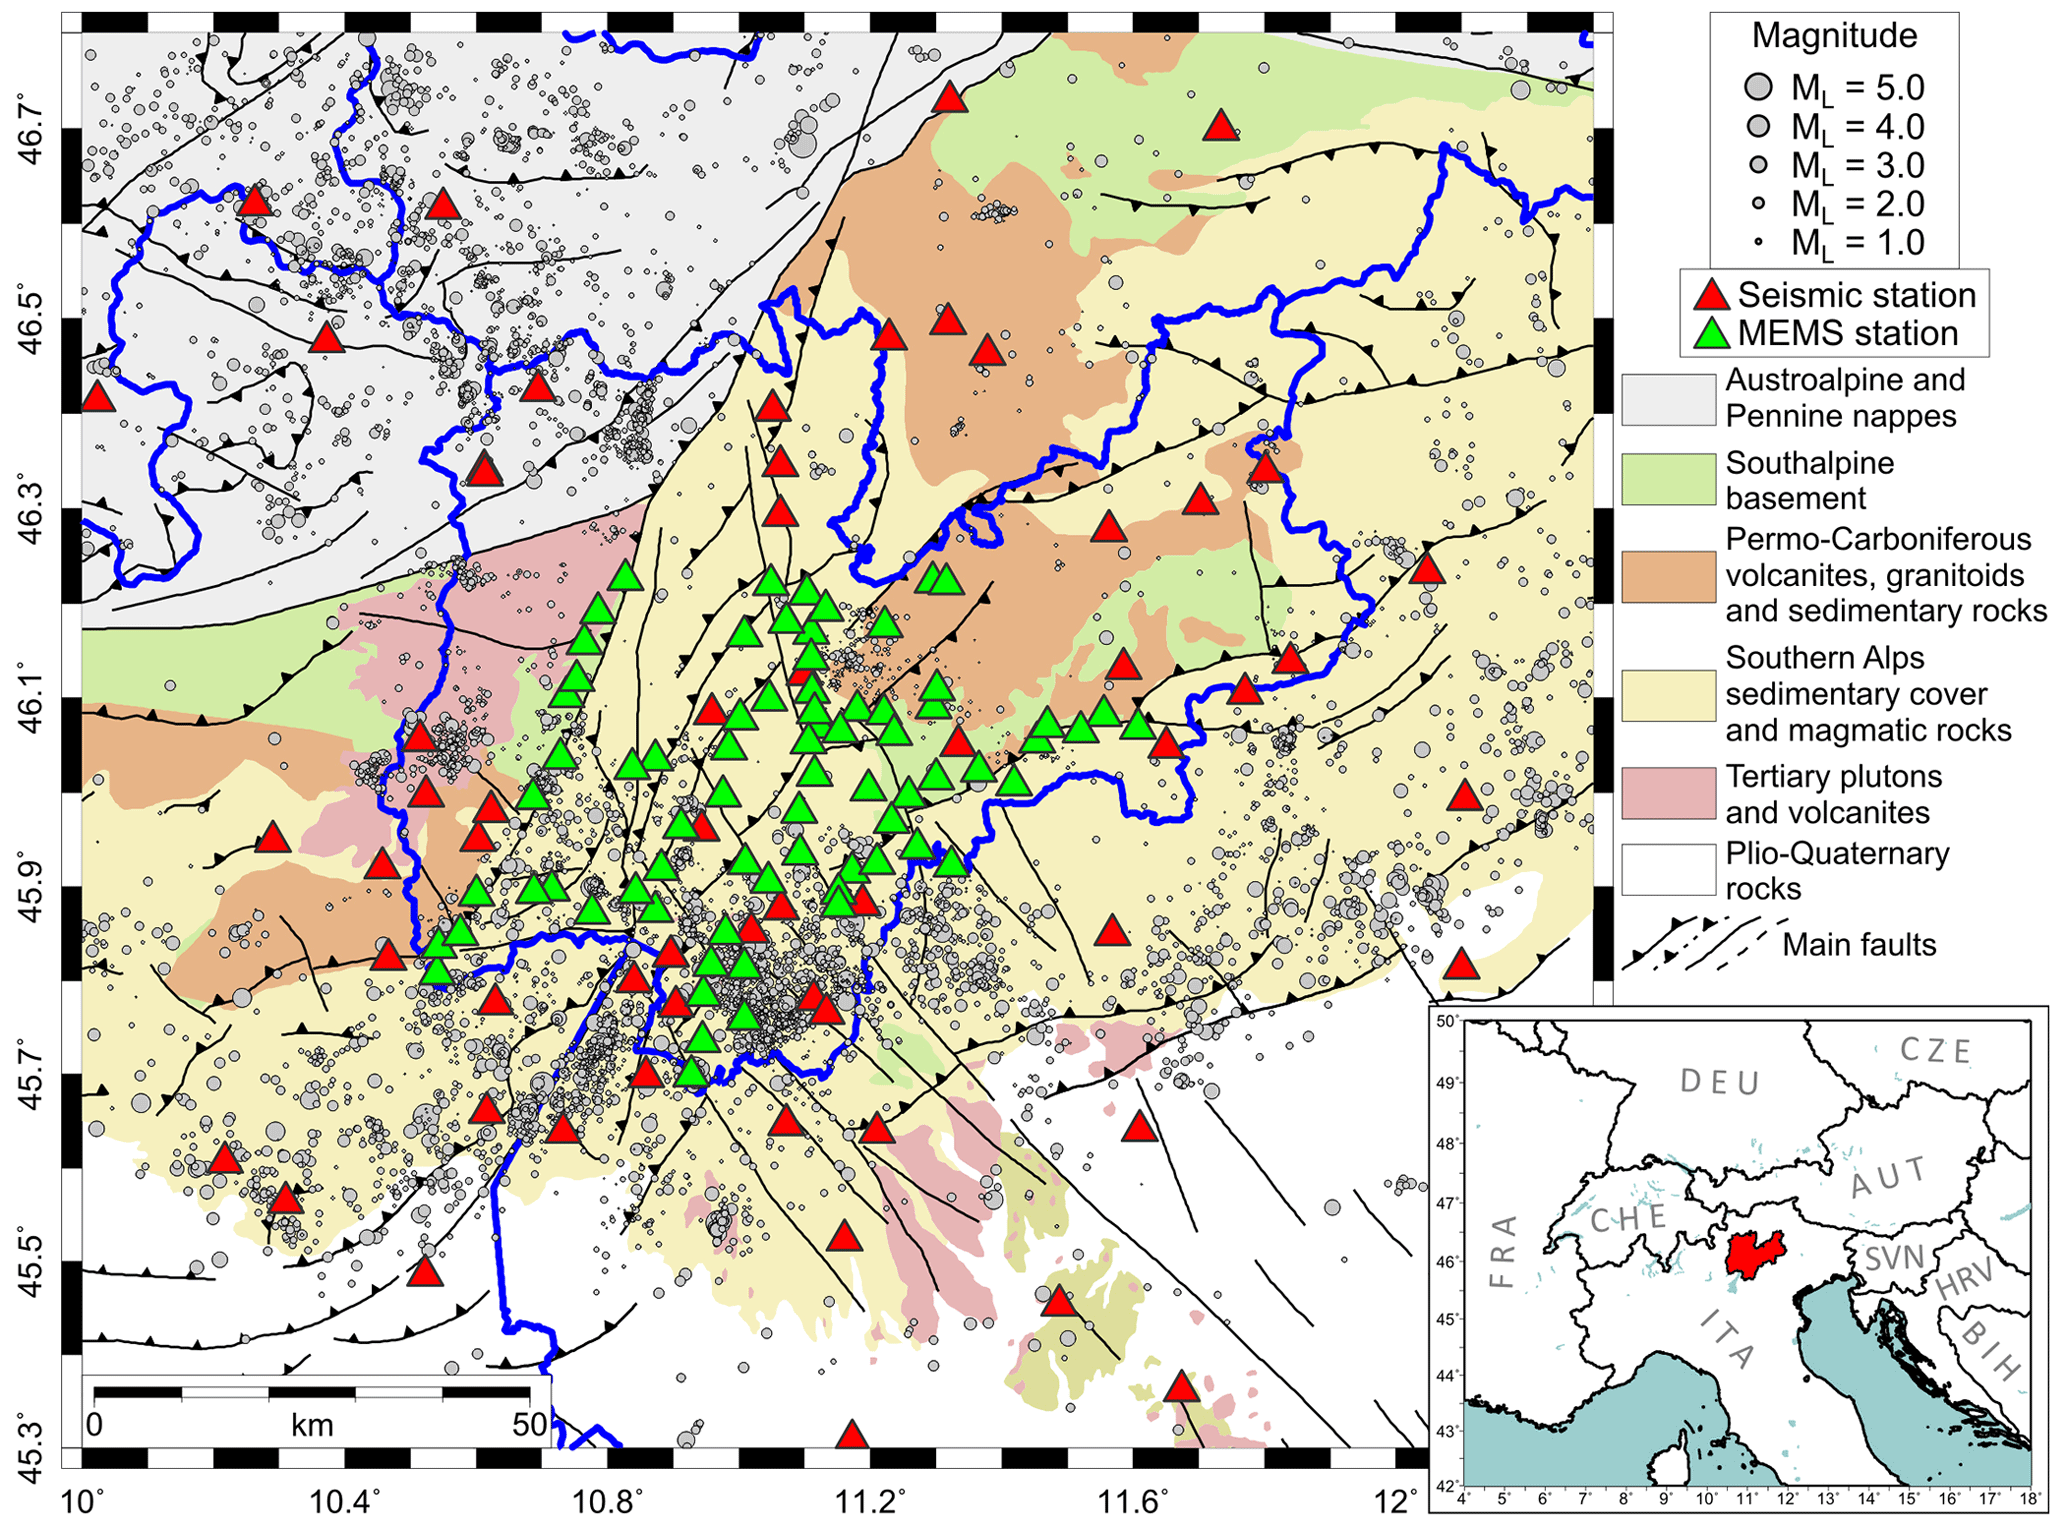
Figure 1Simplified geological map of the Trentino region with an epicentral distribution of earthquakes in the 1981–2021 period and local seismic networks. The green triangles represent the MEMS-based network (73 stations in October 2023).
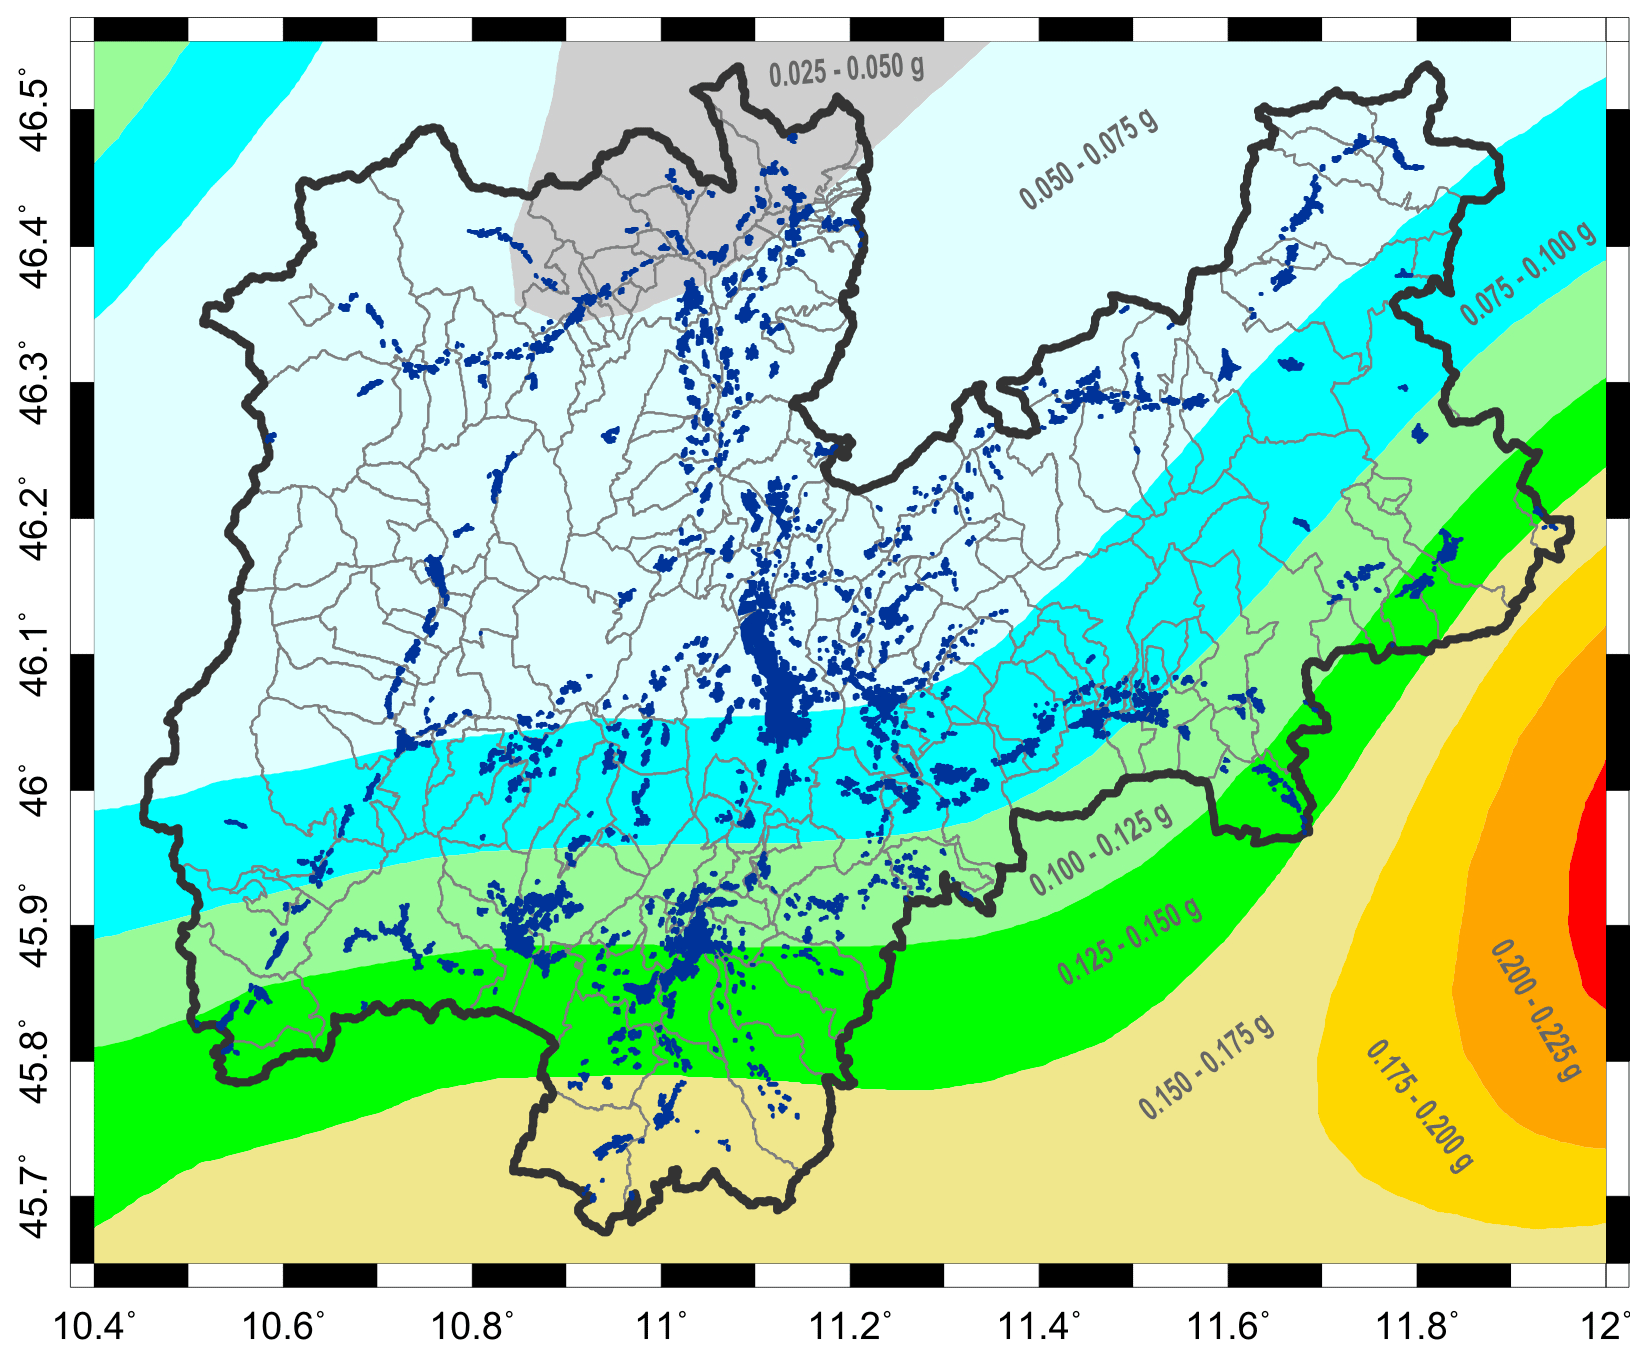
Figure 2Seismic hazard map showing the peak ground acceleration for a return period of 475 years (10 % probability of exceedance in 50 years) (Stucchi et al., 2011). Localities are highlighted in dark blue (ISTAT, 2012).
The Trentino region (NE Italy) is currently monitored by a permanent seismic network, which has been managed by the Autonomous Province of Trento (PAT) since 1981 (Geological Survey–Provincia Autonoma di Trento, 1981; Viganò et al., 2021; Fig. 1). According to the Italian building code (Ministero delle Infrastrutture e dei Trasporti, 2018), this area is characterized by peak ground acceleration (PGA) values lower than 0.18 g (for a return period of 475 years), with the highest seismic hazard in southern Trentino (upper Lake Garda and lower Adige Valley) and eastern Trentino (lower Valsugana, Tesino, and Primiero) where fault systems are mostly active (Viganò et al., 2015) (Fig. 2). The resident population was 540 958 on 1 January 2022 (ISTAT, 2012) and is mostly concentrated in the city of Trento and along the main valleys where principal road networks and infrastructures are located.
Here, we present a local network based on MEMS accelerometers in Trentino, aimed at real-time monitoring and automatic generation of exposure maps. Co-seismic recordings are automatically processed and integrated with those from other stations (e.g. belonging to other permanent networks), allowing for a dense distribution of ground motion measurements.
Maps displaying seismic shaking are widely used during emergencies due to their ability to summarize earthquake effects and their potential impact on local targets (Michelini et al., 2020). In order to lead effective emergency actions, it is essential that these maps, named exposure maps hereafter, are available a few minutes after a seismic event. In fact, they provide a first-level overview of the expected damage over the monitored area.
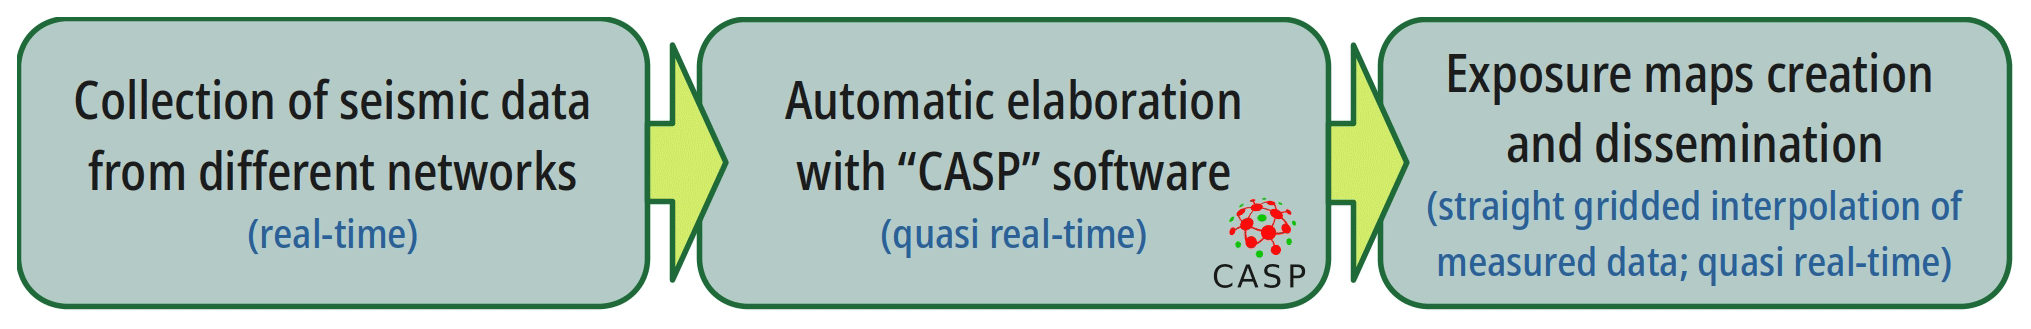
Figure 3Flowchart showing the process behind the generation of the exposure maps for the Trentino region.
The exposure maps of the Trentino civil protection are automatically generated by using all the available seismic data (i.e. ground motion measurements), with the aim of estimating the assets exposed to an earthquake (Fig. 3). In particular, MEMS recordings are integrated with those from other stations and are used to obtain a complete set of strong motion data in order to quantify the resident population and the number of buildings subjected to different levels of shaking. A step-by-step description of the method used to generate the exposure maps is given in the next sections.
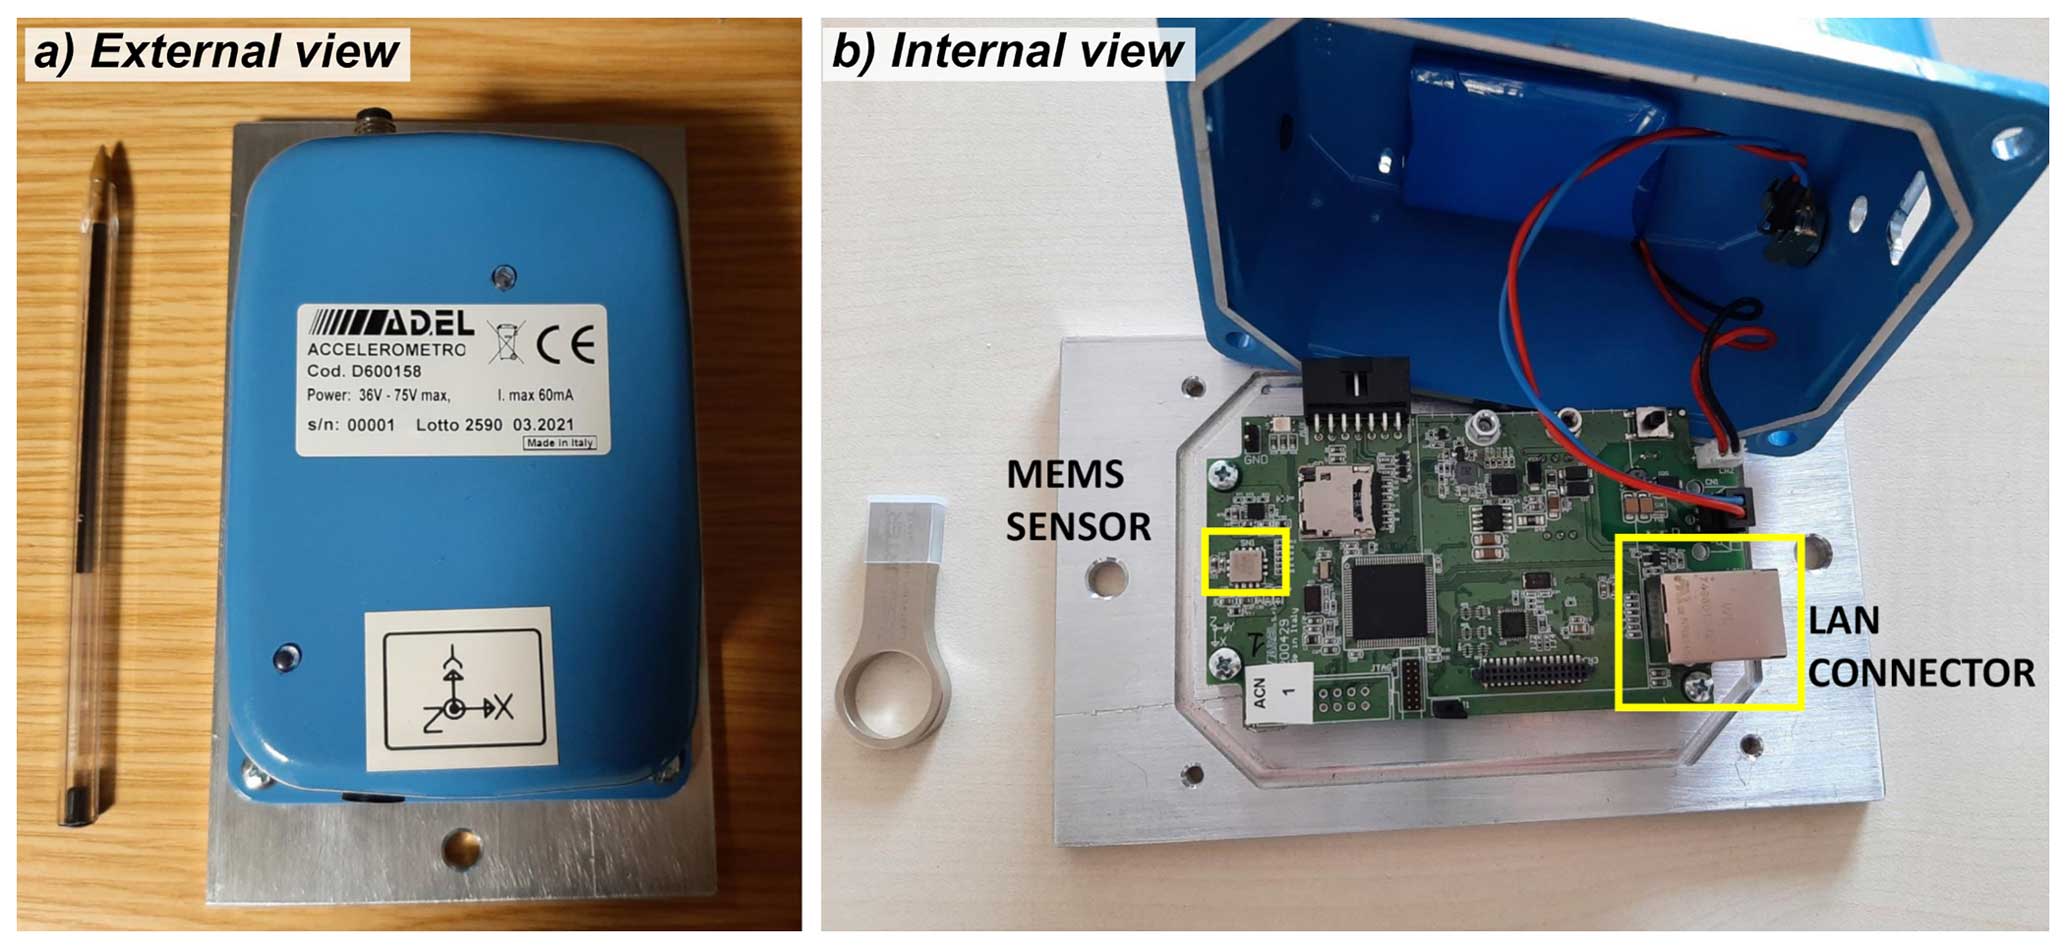
2.1 MEMS accelerometer design and installation
The low-cost MEMS sensor adopted in the presented network is the ADXL355 of Analog Devices. AD.EL s.r.l., an Italian-based telecommunication company, developed the board for housing and operating the MEMS accelerometer, named ASX1000v2 (D600158 AD.EL code; Fig. 4a). The ASX1000v2 is a capacitive triaxial accelerometer, conceived to be a platform for data acquisition and recording for long-term measurements. It is equipped with a high-performance microcontroller unit (MCU; STM32H743 model by STMicroelectronics) and communication channels for remote control and data transmission: a serial channel RS-422 or RS485, a LAN ethernet 10/100 Mbit s−1, a USB 2.0, and a 4G LTE modem (Fig. 4b). This sensor operates in high-sensitivity mode for an acceleration range of ± 2 g (it also supports the ± 4 g full-scale configuration), with a 250 Hz sampling rate. Time synchronization is obtained using the Network Time Protocol (NTP). Data streams from each single station are collected by a dedicated server; here, data are formatted, stored, and made available for the automatic processing by using a standard SeedLink server.
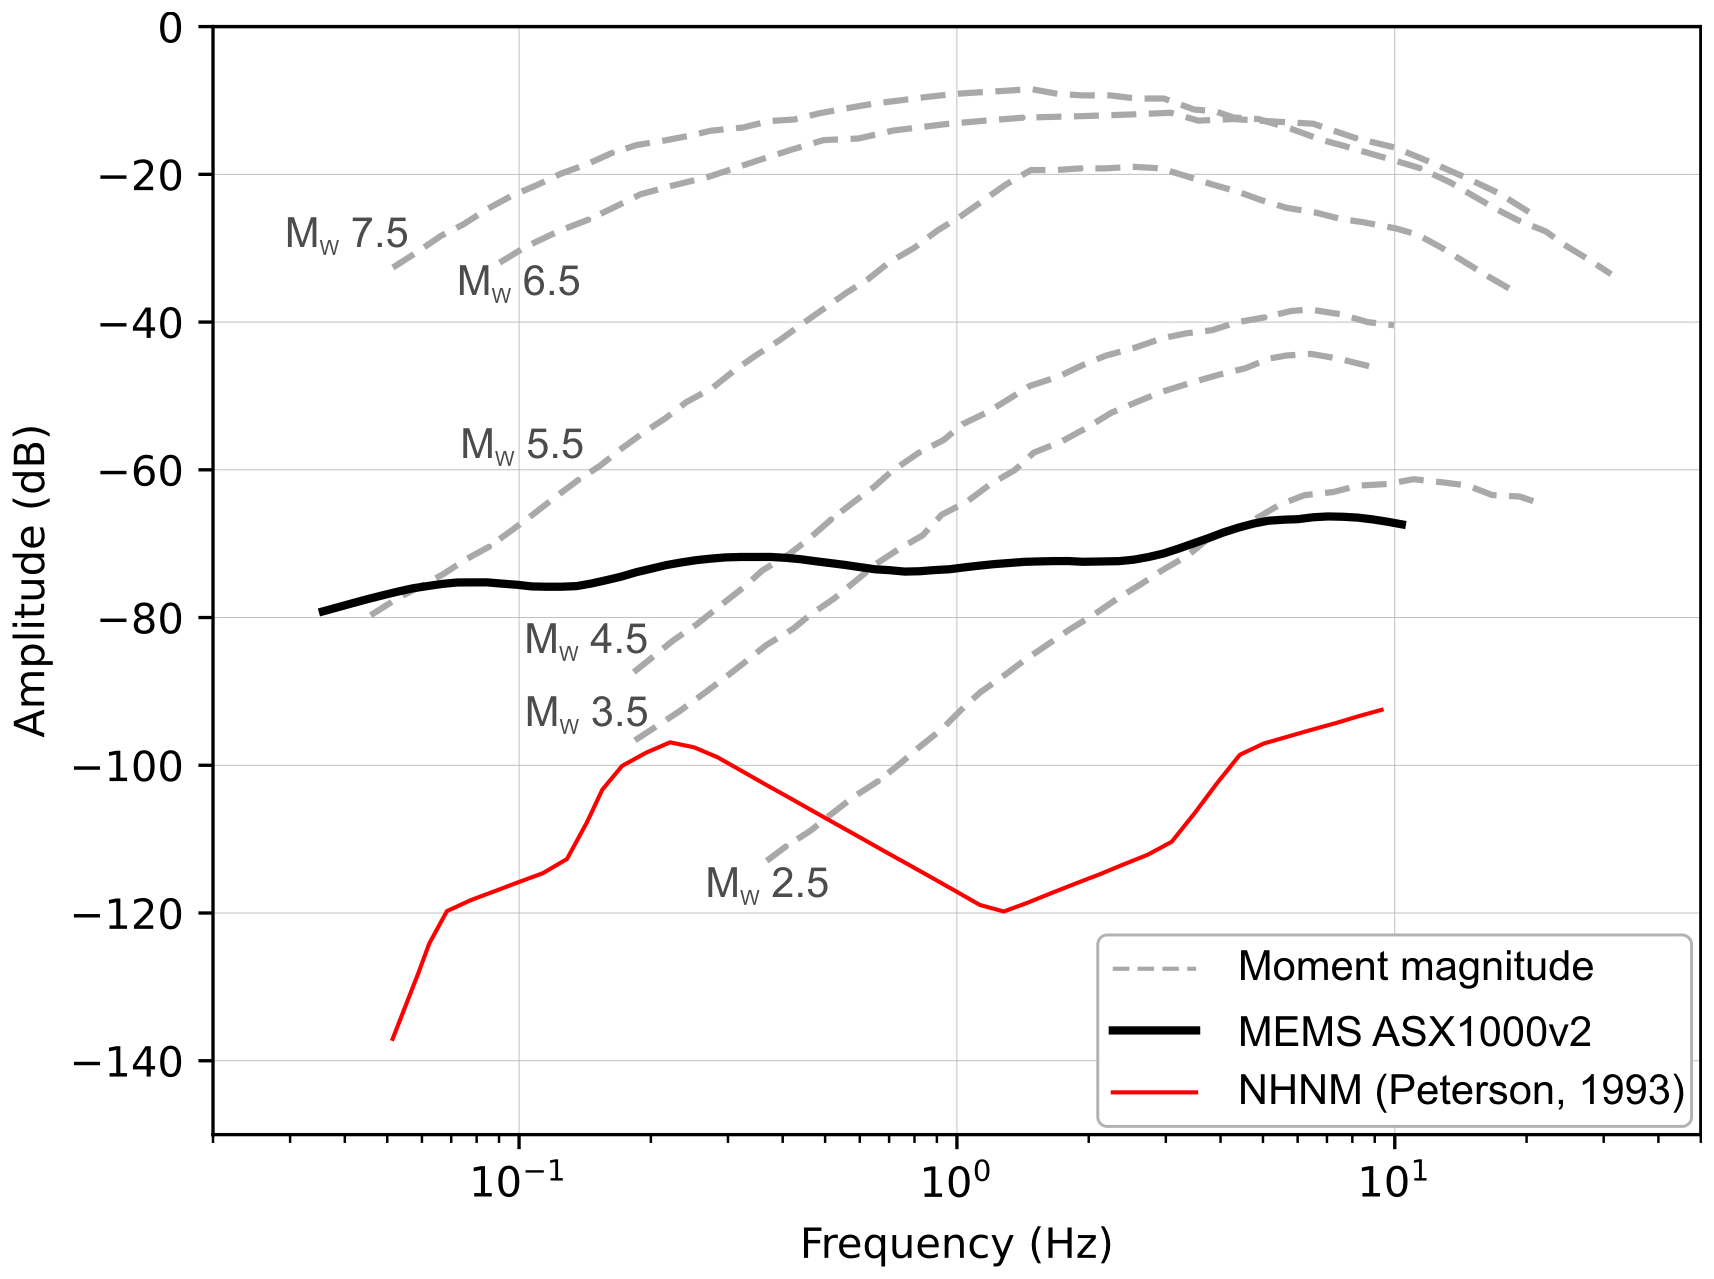
Figure 5Noise floor of the ASX1000v2 MEMS (black line) compared to typical ground motion amplitudes of earthquakes measured at 10 km from the epicentre for different moment magnitudes (dashed lines). The new high-noise model (NHNM – red line) from Peterson (1993) is also shown for reference.
The noise analysis relative to each component reveals a power spectral density with a general downward trend between −80 and −65 dB in the 0.03–10 Hz frequency range (Fig. 5). As shown in Fig. 5, the detectability threshold of seismic events corresponds to a moment magnitude of about 3.5. Therefore, this sensor has a suitable sensitivity to detect moderate-to-strong events, which are of primary interest to public administration for emergency management.
The MEMS sensors are installed inside telecommunication infrastructures. Each sensor is firmly coupled with the ground with screws and plugs, at the base of the local server room; the azimuth is carefully measured during installation. Each sensor is plugged into a wall outlet for power. A complete station costs only a few hundred euros, making the deployment of dense arrays of accelerometers possible.
2.2 Data integration and seismic processing
Seismic data processing is here performed by using the Complete Automatic Seismic Processor (CASP) software (Scafidi et al., 2016, 2018, 2019). By taking advantage of the features of its iterative procedure, this software can effectively manage (during phase picking and location) data provided by different seismic stations with variable signal quality. Contrary to stations of permanent monitoring networks, which are usually installed in remote and quiet areas to ensure seismic signals with low noise levels, signals from seismic stations deployed in urban areas, such as those from our MEMS network, can be significantly affected by high-level noise (producing spikes and impulsive signals) due to anthropogenic activities. This may lead to an uncontrolled proliferation of false (i.e. non-seismic) triggers. Therefore, their use in automatic phase-picking procedures may affect the reliability of the final earthquake location and, in some cases, lead to false events. Hence, noisy stations are often neglected in automatic earthquake monitoring. CASP processes signals by using an iterative procedure within which the phase picking is driven by earthquake location (Spallarossa et al., 2014). On the one hand, this allows for identification of false triggers. On the other hand, arrival times are improved at each iteration, leading to an optimization of the earthquake location.
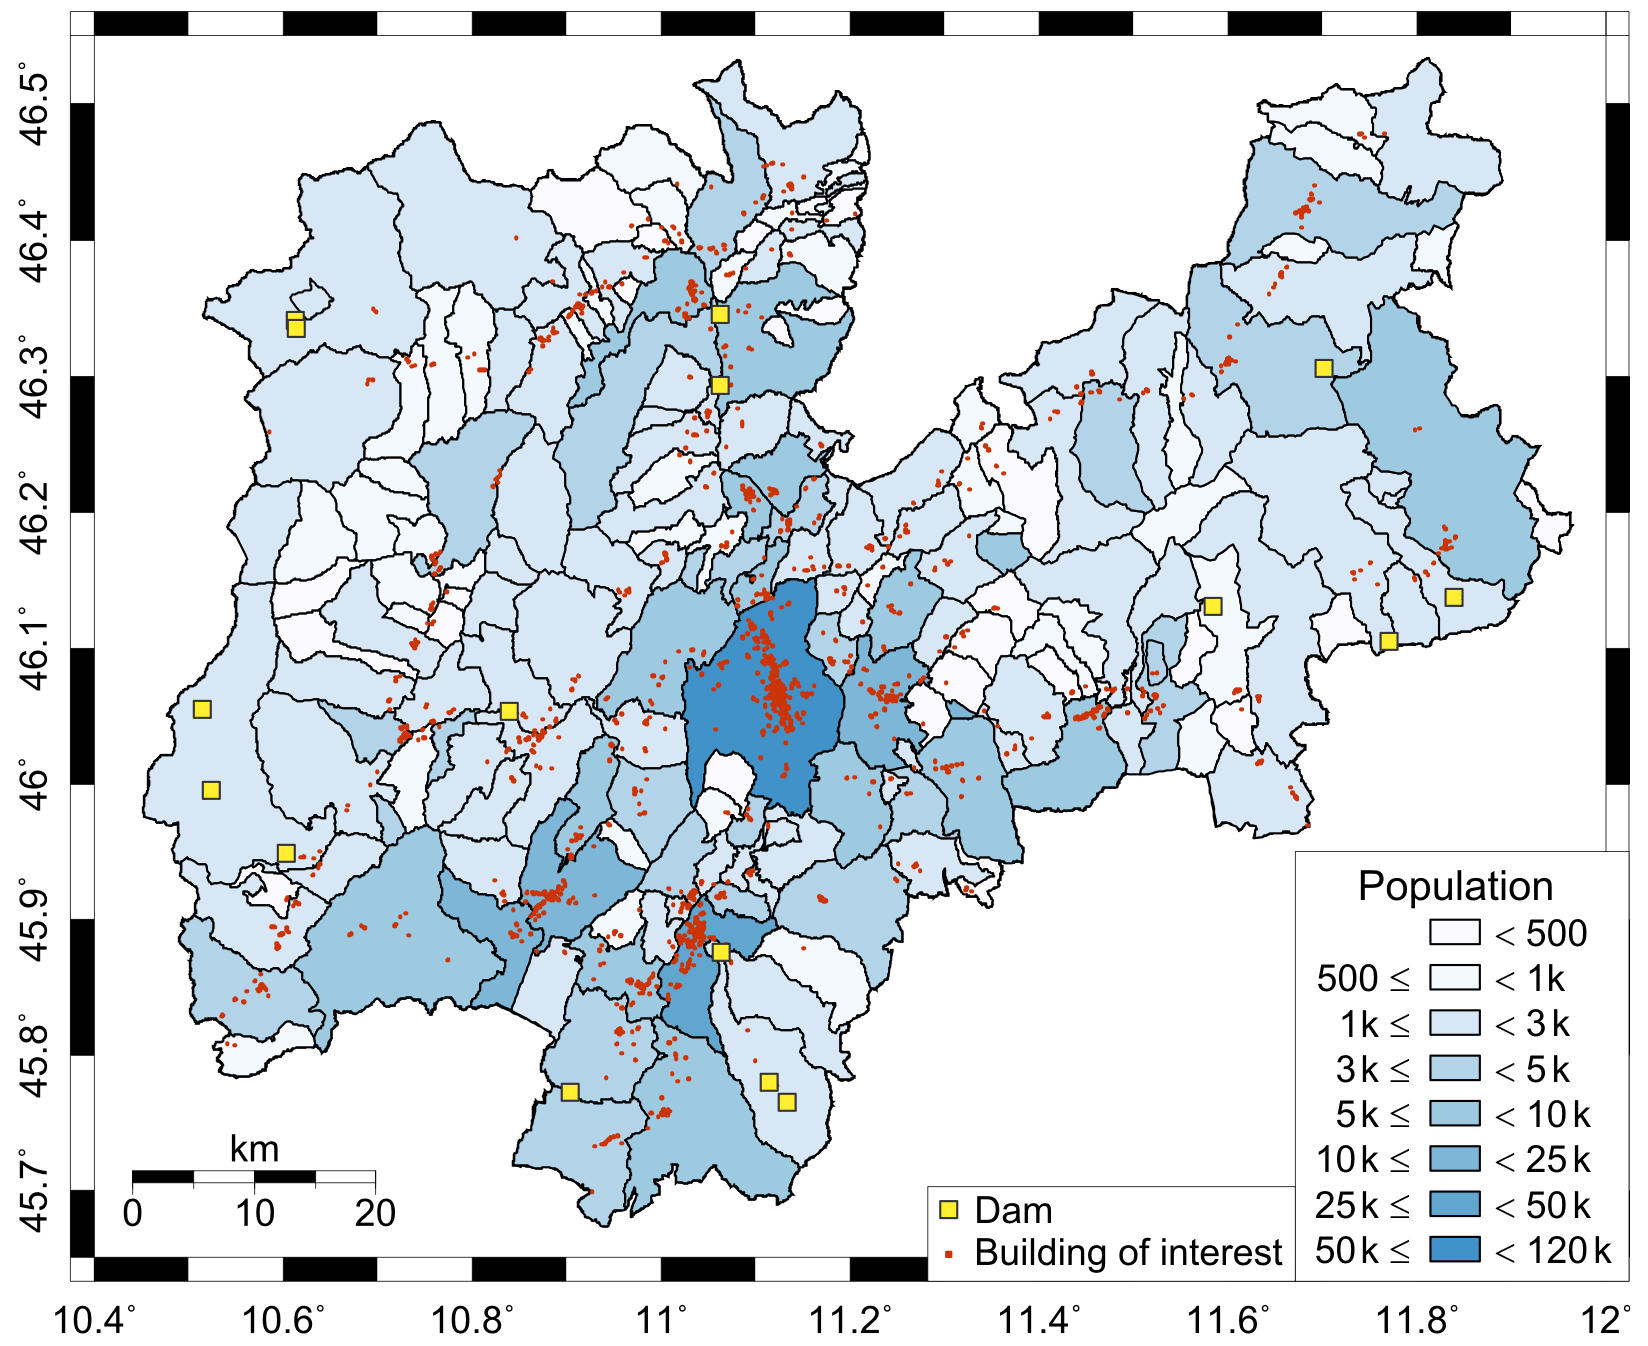
Figure 6Trentino municipalities coloured according to the resident population density (ISTAT, 2012), with buildings of interest (red dots) and main dams (yellow boxes) highlighted.
With reference to the present application, which integrates data from permanent monitoring networks and data from the MEMS stations, CASP is set not to use MEMS data in the first iteration of the location procedure, thus assuming that the data are affected by significant background noise. In this step, the definition of arrival times is not yet driven by location, but it is based on an envelope function on signals (Spallarossa et al., 2014). This precaution may not be necessary for local strong earthquakes, for which the seismic signal clearly dominates the background noise, but it is useful when managing signals from weak earthquakes. From the second iteration onwards, signals from all stations are used, and P- and S-wave arrivals are computed by applying the Akaike information criterion (AIC; Akaike, 1974) on signal windows centred, for each station, around the expected arrival times obtained by the location code. In fact, these picks are determined (at each iteration) by the location algorithm working in conjunction with CASP, namely the NonLinLoc software (Lomax et al., 2000). This allows us to reliably discriminate between seismic-phase arrivals and signal disturbances also in the case of weak-to-moderate earthquakes recorded by different stations, regardless of the type of sensor used.
In addition to the computation of hypocentral parameters, for each station with at least one phase picked, CASP returns the values of a number of ground motion parameters (e.g. PGA, peak ground velocity (PGV), spectral acceleration).
In the case of the Trentino region, a fully automated earthquake monitoring system is already operating based on CASP (Viganò et al., 2021). Thus, the great amount of data provided by the 73 installed MEMS stations (starting date July 2022; Fig. 1) has easily been integrated within the seismic monitoring procedure as the only requirements for CASP are real-time data transmission in standard SeedLink format and station response metadata in seismological standard format (i.e. dataless, StationXML, poles and zeros (PAZ) files). Regarding data transmission between the MEMS stations and the central processing system, the typical average latency is of the order of about 15 s, while the data stream of all the MEMS stations is continuous and complete at about 99.5 %.
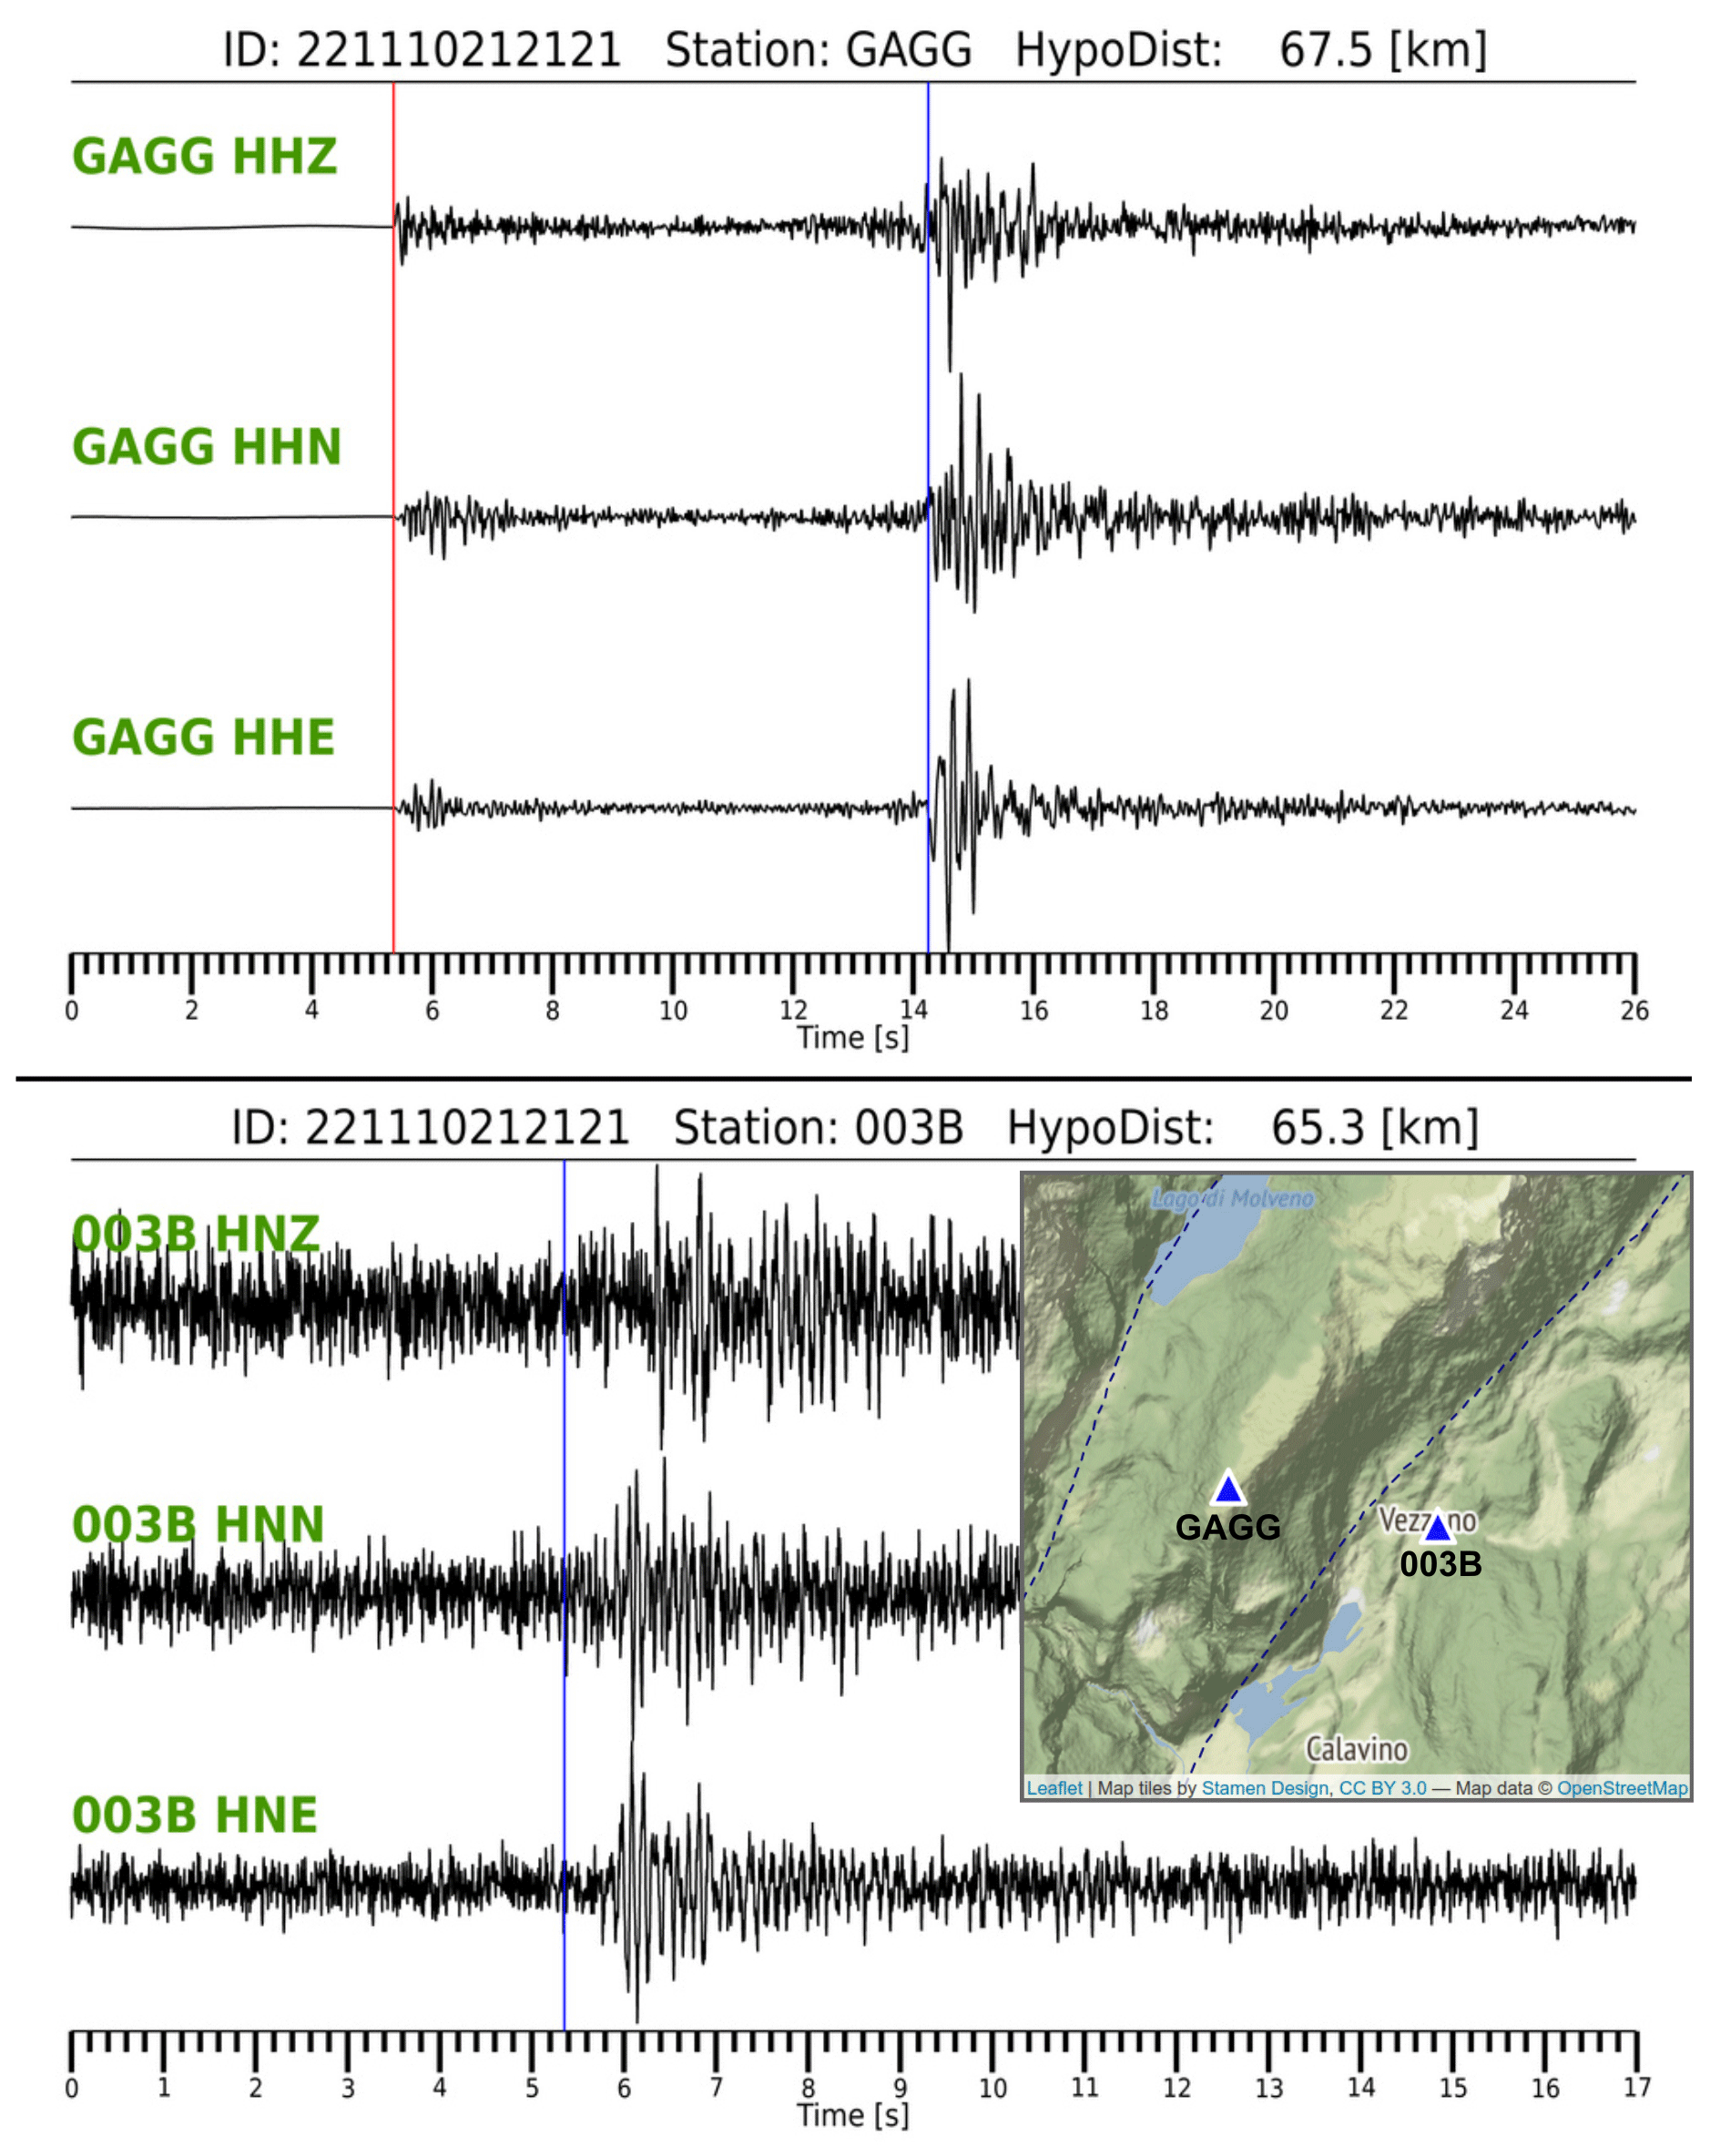
Figure 7Unfiltered three-component seismic traces from standard (GAGG) and MEMS sensors (003B) (see their geographic location in the inset) associated with automatically detected P- and S-phase arrival times (red and blue lines, respectively).
2.3 Exposure maps
Exposure maps are automatically created using the GMT software (Wessel et al., 2013) and the PHP open-source scripting language. At first, shaking data recorded by each station (i.e. peak ground accelerations) are converted to intensity values (Mercalli–Cancani–Sieberg scale, MCS) using empirical relationships for Italy (Faenza and Michelini, 2010, for PGA < 1 cm s−2; Oliveti et al., 2022, for PGA ≥ 1 cm s−2). Intensity, which is considered more informative than peak ground acceleration for civil protection purposes as it is directly based on earthquake damage and perception, is colour-coded according to the ShakeMap palette (Michelini et al., 2020). These densely distributed data are then gridded using adjustable-tension continuous curvature splines (“surface” routine command in GMT, with tension set to 0.5), with no pre-processing (e.g. blockmean) or interpolation. This is possible because of the dense distribution of the MEMS stations, which are mainly located in the vicinity of inhabited areas. At this stage, a maximum intensity value is assigned to each municipality in Trentino, for which the cumulative number of the resident population is known (Fig. 6). Then, the intensity map is compared to the distribution and density of the resident population in Trentino (last national census; ISTAT, 2012), where territorial localities are classified as (i) urban areas, (ii) small inhabited areas, (iii) productive areas, or (iv) widespread houses. For each locality the procedure automatically calculates the maximum intensity and combines it with the population density. The cumulative population for each intensity level is then computed. In a similar way, the system automatically processes (as polygonal features) the distribution of buildings of interest for the Autonomous Province of Trento (Fig. 6), and the cumulative number of buildings for each intensity class is obtained. Finally, peak ground acceleration is measured at 16 instrumented dams located in Trentino (Fig. 6). As with the strong motion parameters from all the other stations, these parameters are also converted to intensity values and are used to create the Trentino exposure maps.
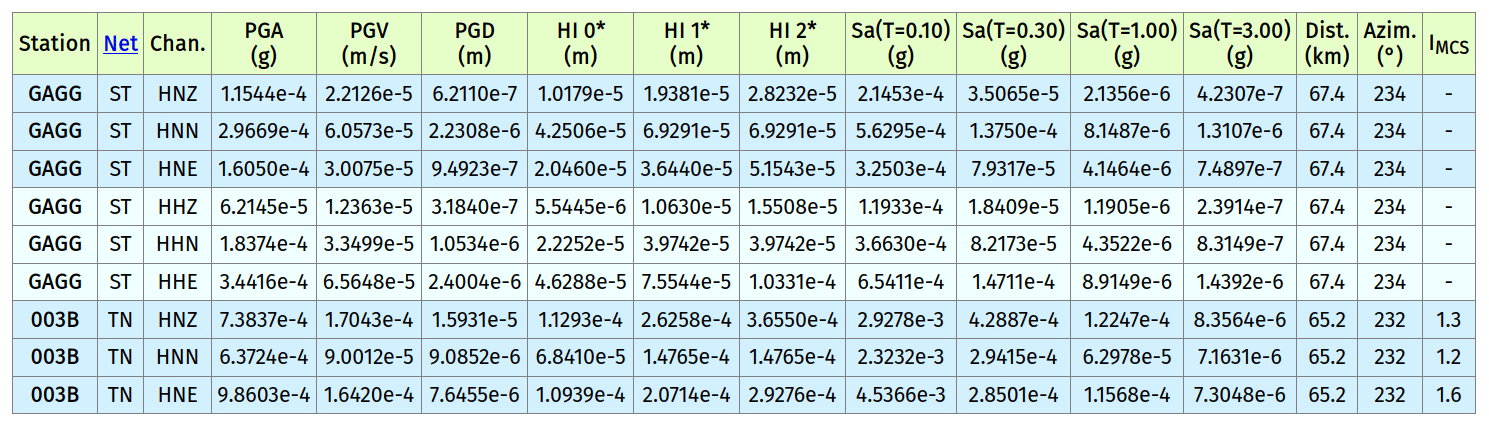
Figure 8Screenshot of the automatically created summary table with strong motion data from standard (GAGG) and MEMS sensors (003B). Network, net; recording channel, chan.; hypocentral distance, dist.; azimuth, azim.; see the text (Sect. 3) for the other parameter abbreviations and meanings.
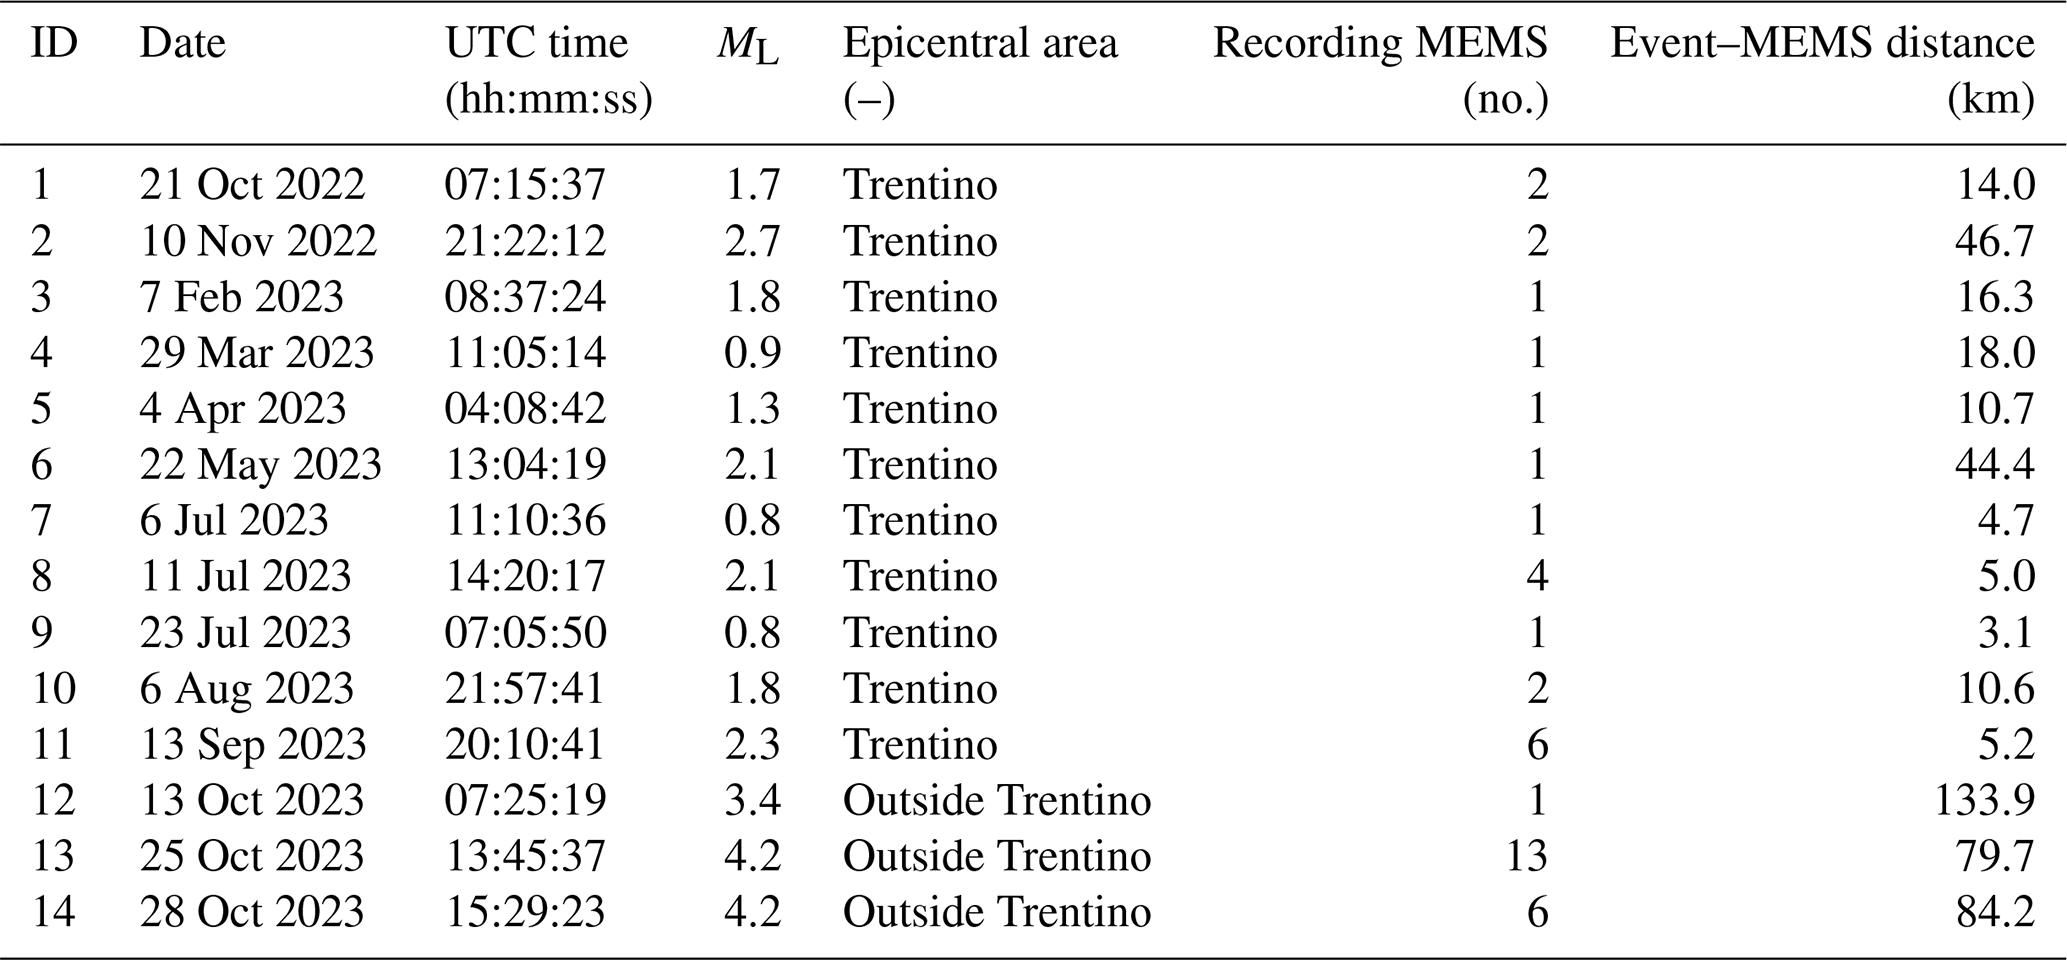
The estimation of exposure maps in Trentino is usually carried out within 10 min of an earthquake. A local magnitude (ML) threshold for their automatic generation is set to ML 4.0. The procedure has been activated since July 2022, using a standard workstation equipped with an Intel Core i5 CPU. Even if no strong earthquakes have occurred until now (October 2023) in the monitored area, MEMS stations have been used for standard locations (i.e. available additional phase arrivals from MEMS stations are used by the location procedure) and to record the ground motions of low-to-medium-energy seismic events. We note that a seismic signal recorded by a MEMS station is commonly clearly detectable for events with ML greater than about 2.5, considering hypocentral distances of a few tens of kilometres (compare also with results by Cascone et al., 2021). In fact, even if the MEMS application presented in this study is principally aimed to perform quasi-real-time exposure maps in the urbanized areas of Trentino, in Appendix A the low-magnitude earthquakes which were recorded by at least one MEMS station during the July 2022–October 2023 period are listed. In some cases, some stations recorded a readable signal, related to seismic events inside or outside the Trentino area. As an example, we can consider the automatically detected P- and S-phase arrival times (red and blue vertical lines in Fig. 7, respectively) for the ML 2.7 earthquake that occurred on 10 November 2022 in the Fassa Valley (NE Trentino). GAGG is a standard seismic station of the permanent PAT network, while station 003B belongs to the MEMS network (see Fig. 1). Both stations are located in the same area (2 km apart from each other) at about 65 km from the earthquake hypocentre. Even if the P-phase onset for station 003B is masked by the background noise, which is clearly higher than the noise affecting the GAGG recordings, the CASP procedure is able to detect the S-phase arrival time. Thus, both GAGG and 003B can be used to calculate the strong motion parameters for that event (Fig. 8). A few minutes (maximum 5) after the origin time, CASP returns the event location, magnitude, and strong motion table (for all the analysed stations), which includes PGA, PGV, peak ground displacement (PGD), spectral acceleration (SA) for different response periods (T), response spectrum intensity (also known as Housner intensity, HI) for different period ranges (0.1–0.5 s, HI 0; 0.1–1.0 s, HI 1; 0.1–1.5 s, HI 2), and instrumental intensity (IMCS; Mercalli–Cancani–Sieberg scale). Compared to station GAGG, station 003B shows stronger shaking values that can be attributed to the effect of different subsoils (Fig. 8). As with all stations belonging to the PAT permanent network, GAGG is deployed on bedrock, while 003B is located in the middle of an alluvial valley near the town of Vezzano. Here, alluvial deposits are reasonably assumed to be responsible for the observed shaking amplification. The higher ground motion values of station 003B are used for a site-specific exposure map, which can take into account local seismic effects near towns and populated areas.
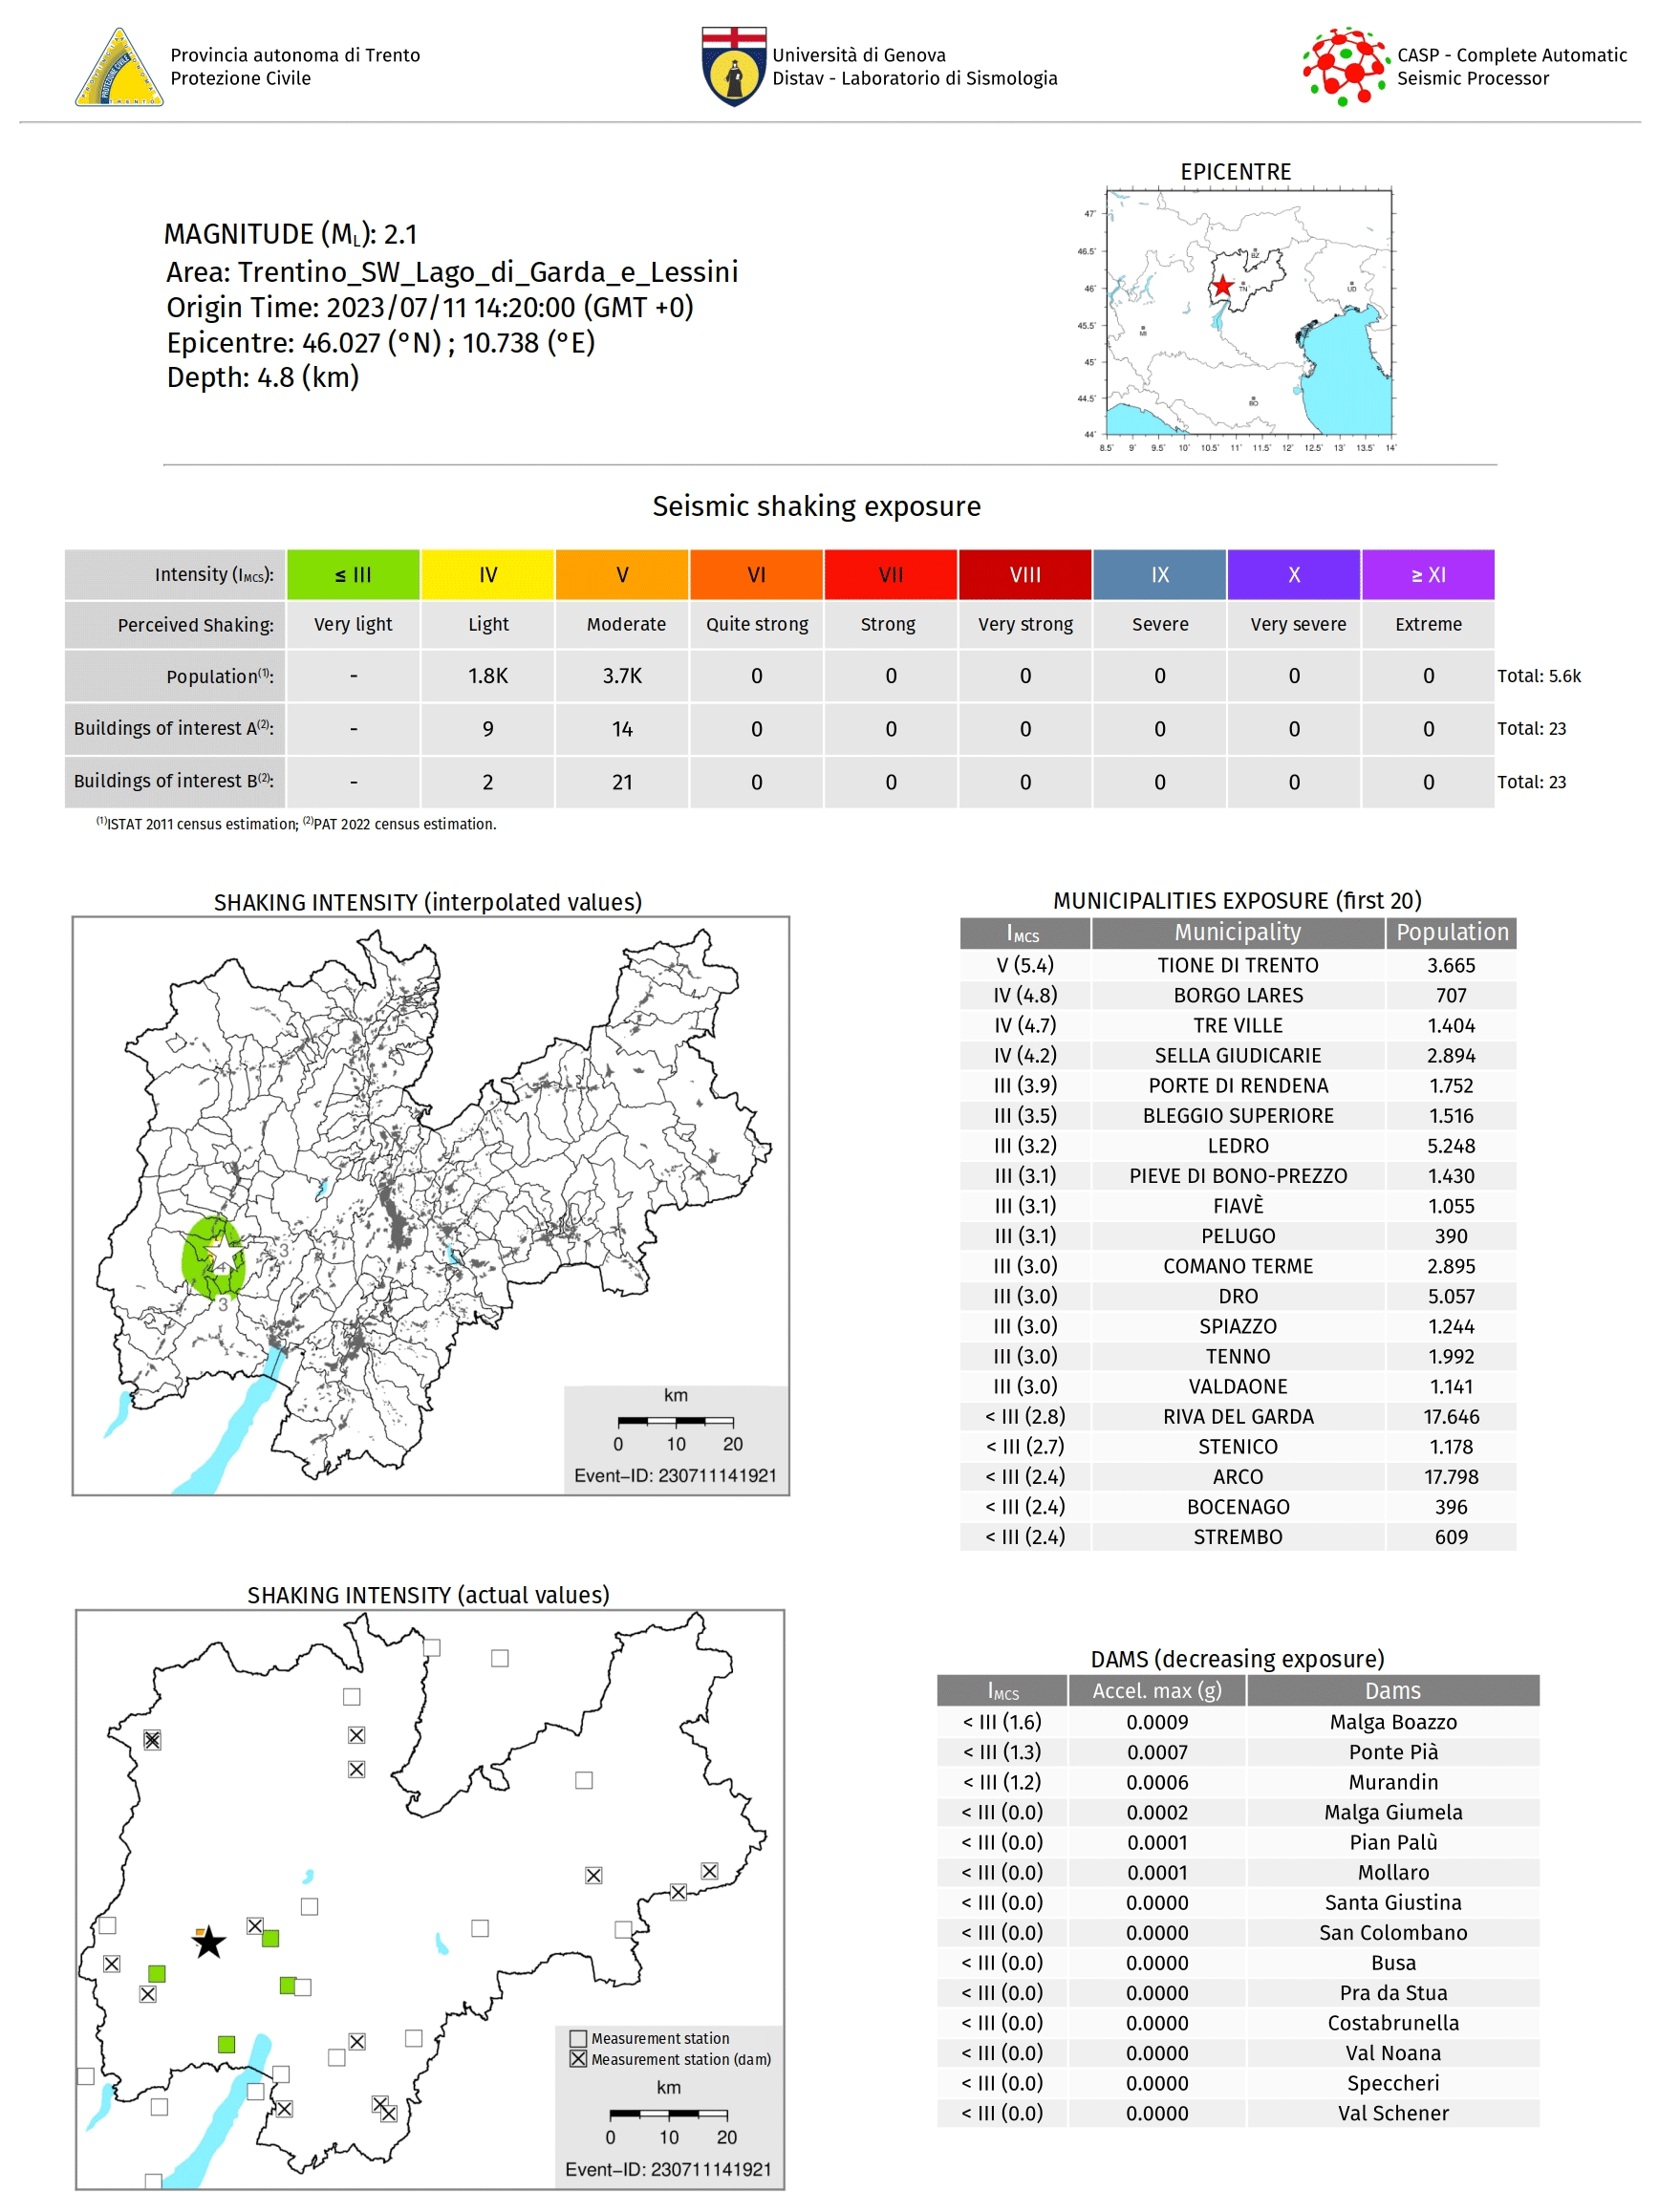
Figure 9Exposure map PDF for a weak earthquake that occurred in western Trentino. See the text (Sect. 3) for a description.
The exposure maps and all the relevant seismic results provided by CASP are reported in an automatically generated document in standard portable document format (PDF), which also contains links to the high-resolution maps stored online. This summary file represents an easy and user-friendly means of communication that can easily be disseminated through emails and messaging platforms (e.g. Telegram), read online, or printed. Figure 9 shows the PDF of the exposure map generated for an ML 2.1 earthquake that occurred on 11 July 2023 in western Trentino. After a synthetic textual and graphical summary of the event location (magnitude, area, origin time, and hypocentral data), tables and maps relative to the seismic shaking and exposure are displayed. The first table contains a quantification of the population and the number of buildings of interest (A and B levels according to the administrative classification) possibly stricken by the earthquake for each intensity level. The maximum recorded intensity is VI MCS at about 5 km from the earthquake hypocentre (which is only 4.8 km deep). Of note, without the information provided by the MEMS network, we would have significantly underestimated the maximum intensity induced by the earthquake, which would not have exceeded III MCS. The PDF also shows two intensity maps that can be helpful for a rapid inspection of the damaged area. The first one shows interpolated values, while the second one displays the values actually observed at each analysed station. Besides the maps, two tables provide further details about the measured shaking levels for both potentially involved populations (first 20 municipalities sorted according to decreasing intensity) and available instrumented dams (listed according to both decreasing intensity and PGA values).
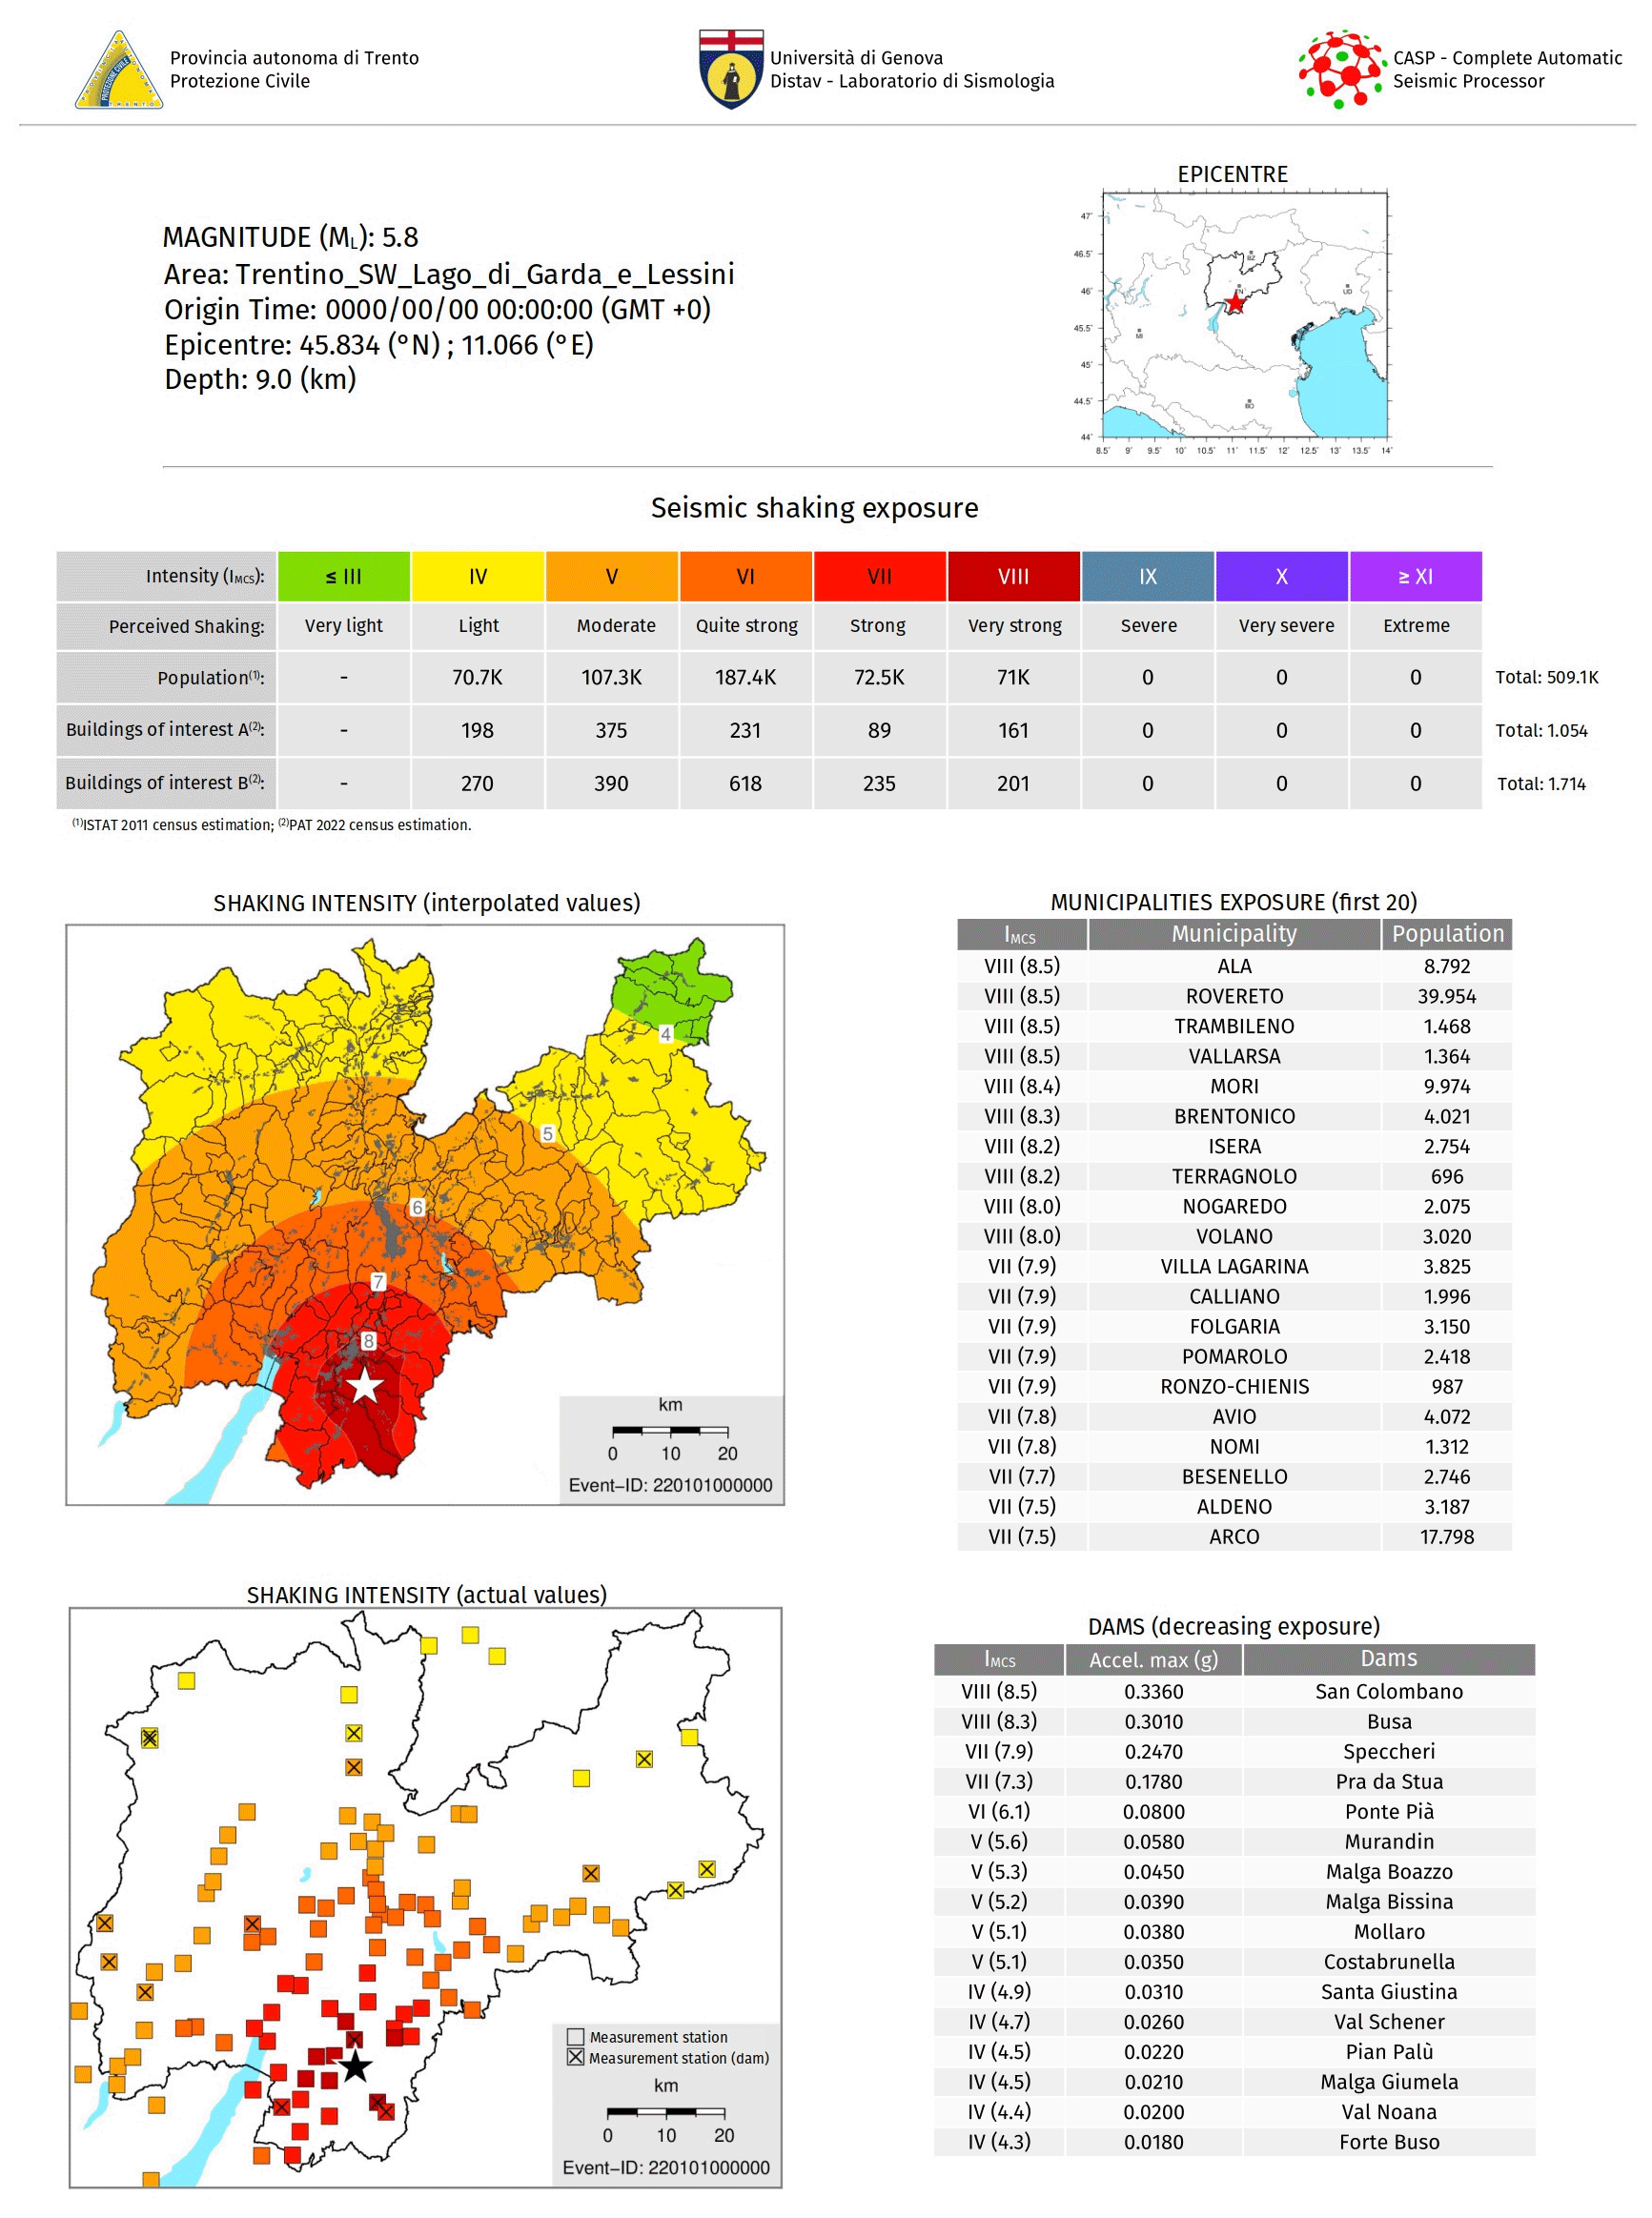
Figure 10Exposure map PDF for a strong earthquake simulated in southern Trentino. See the text (Sect. 3) for a description.
In order to test the procedure considering a realistic emergency scenario for a moderate event, we have simulated an ML 5.8 earthquake in southern Trentino (45.834° N latitude, 11.066° E longitude; 9.0 km depth). This event has been selected to roughly simulate the so-called middle Adige Valley earthquake, which represents a reference for the seismic potential of the Trentino region, as also evidenced by recent studies (e.g. Ivy-Ochs et al., 2017, and references therein). This earthquake is dated to 1046 CE, with estimated epicentral intensity IX MCS and co-seismic shaking responsible for great damage and catastrophic induced events. The performed calculation represents a simplified simulation, obtained by assigning the selected event magnitude and then calculating PGA at each seismic station of the network (MEMS and permanent stations). PGA is computed using the regional attenuation law developed within the framework of the INGV-DPC Project S4 (Michelini et al., 2008). In particular, the regionalized attenuation relation adopted for the eastern Alps is used. The summary PDF relative to this earthquake is shown in Fig. 10. According to this scenario, about 60 000 people and 262 buildings of interest (the statistics are possibly even worse than presented because of the simplified approach used) are involved in the area with maximum intensity (VIII MCS); the four municipalities with maximum intensity have a total population of about 52 000 people. Concerning dams, two of them reach PGA values greater than 0.3 g; this is important in order to define specific structural monitoring when predetermined PGA thresholds are overcome.
We have presented an upgrade of the seismic monitoring procedure of the Trentino region through the integration of data provided by 73 low-cost MEMS accelerometers installed in urban areas. This dense MEMS-based network has a suitable sensitivity to detect moderate-to-strong seismic events; even weaker earthquakes with a local magnitude lower than 3.0 can be recorded and analysed. The additional data in conjunction with the automatic monitoring procedure currently in use allow us to obtain a densely distributed set of strong motion measurements and, consequently, high-definition shaking maps that rely only on actual recorded data. Integrating these dense MEMS data, though noisy, avoids the use of ground motion prediction equations, thus leading to a more reliable picture of the actual ground shaking (hence, of the expected damage). This is of paramount importance for post-earthquake emergency planning in densely populated, urbanized areas characterized by high seismic risk. The use of the CASP code is crucial for properly managing such noisy data with the aim of getting reliable results in quasi-real time.
In addition to shaking data, the procedure presented here provides automatically generated exposure maps that quantify the resident population and the number of critical buildings in Trentino subjected to different levels of shaking during an earthquake. Exposure maps are reported in synthetic PDFs, which are very useful for civil protection in order to rapidly evaluate the local state of emergency after a strong earthquake and to choose how and where to activate first aid measures, both for the population and for structures of interest like dams.
Table A1List of low-magnitude earthquakes recorded by at least one MEMS station, in the July 2022–October 2023 period. The event–MEMS distance is calculated considering the station that is the closest to the hypocentre.
The Complete Automatic Seismic Processor (CASP) is a commercial software (https://lunitek.it/seismic/seismic-software/casp/, Lunitek, 2024).
The seismic data (e.g., earthquake locations) of the Trentino region are publicly available (https://webgis.provincia.tn.it/wgt/?lang=it&topic=14&bgLayer=sfondo_urb&layers=ammcom,stazioni_sismiche,eventi_sismici&layers_visibility=false,true,true&layers_opacity=1,1,0.4&catalogNodes=53, WebGIS PAT, 2024). The property of the dataset about the “buildings of interest” is of the Autonomous Province of Trento (PAT) and the dataset is not publicly available.
DSc, AV, JB, and MC conceptualized the project; JB, VC, MC, and GDM developed the MEMS sensor; DSc, AV, JB, and MC followed the MEMS installation; DSc, AV, MC, and GDM performed data integration; DSc and GF made the earthquake simulation; DSc, AV, JB, GF, and SB wrote the manuscript draft; DSc, AV, JB, GF, SB, and DSp edited the paper; DSc, AV, VC, and GDM revised the paper.
The contact author has declared that none of the authors has any competing interests.
Publisher's note: Copernicus Publications remains neutral with regard to jurisdictional claims made in the text, published maps, institutional affiliations, or any other geographical representation in this paper. While Copernicus Publications makes every effort to include appropriate place names, the final responsibility lies with the authors.
The authors gratefully acknowledge Domenico Patanè, Mirela-Adriana Anghelache, and the anonymous reviewer for their helpful comments and suggestions. This research was supported by the Geological Survey of the Autonomous Province of Trento (http://www.protezionecivile.tn.it, last access: 28 March 2024). Telecom Italia Mobile (TIM) is gratefully acknowledged for supporting AD.EL during the installation of the MEMS stations. The maps were made using Generic Mapping Tools v.4.5 (Wessel et al., 2013).
This paper was edited by Filippos Vallianatos and reviewed by Domenico Patanè, Mirela-Adriana Anghelache, and one anonymous referee.
Akaike, H.: Markovian representation of stochastic processes and its application to the analysis of autoregressive moving average process, Ann. I. Stat. Math., 26, 363–387, 1974.
Boaga, J., Casarin, F., De Marchi, G., Valluzzi, M. R., and Cassiani, G.: 2016 Central Italy earthquakes recorded by low-cost MEMS-distributed arrays, Seismol. Res. Lett., 90, 672–682, https://doi.org/10.1785/0220180198, 2018.
Cascone, V., Boaga, J., and Cassiani, G.: Small locale earthquake detection using low-cost MEMS accelerometers: examples in Northern and Central Italy, The Seismic Record, 1, 20–26, 2021.
Cochran, E. S.: To catch a quake, Nat. Commun., 9, 2508, https://doi.org/10.1038/s41467-018-04790-9, 2018.
Cochran, E. S., Lawrence, J. F., Christensen, C., and Jakka, R. S.: The quake-catcher network: citizen science expanding seismic horizons, Seismol. Res. Lett., 80, 26–30, https://doi.org/10.1785/gssrl.80.1.26, 2009.
D'Alessandro, A., Scudero, S., and Vitale, G.: A review of the capacitive MEMS for seismology, Sensors, 19, 3093, https://doi.org/10.3390/s19143093, 2019.
Faenza, L. and Michelini, A.: Regression analysis of MCS intensity and ground motion parameters in Italy and its application in ShakeMap, Geophys. J. Int., 180, 1138–1152, https://doi.org/10.1111/j.1365-246X.2009.04467.x, 2010.
Geological Survey–Provincia Autonoma di Trento: Trentino Seismic Network, International Federation of Digital Seismograph Networks, Dataset/Seismic Network, https://doi.org/10.7914/SN/ST, 1981.
ISTAT: 15° censimento della popolazione e delle abitazioni 2011, GU serie generale, 209, 18 12 2012, Suppl. ordinario, 294, https://www.istat.it/it/censimenti-permanenti/censimenti-precedenti/popolazione-e-abitazioni/popolazione-2011 (last access: 28 March 2024), 2012.
Ivy-Ochs, S., Martin, S., Campedel, P., Hippe, K., Alfimov, V., Vockenhuber, C., Andreotti, E., Carugati, G., Pasqual, D., Rigo, M., and Viganò, A.: Geomorphology and age of the Marocche di Dro rock avalanches (Trentino, Italy), Quaternary Sci. Rev., 169, 188–205, https://doi.org/10.1016/j.quascirev.2017.05.014, 2017.
Lomax, A., Virieux, J., Volant, P., and Thierry-Berge, C.: Probabilistic earthquake location in 3D and layered models, in: Advances in Seismic Event Location, edited by: Thurber, C. H. and Rabinowitz, N., Kluwer Academic Publishers, Dordrecht, the Netherlands/Boston, Massachusetts/London, United Kingdom, 101–134, https://doi.org/10.1007/978-94-015-9536-0_5, 2000.
Lunitek: CASP, https://lunitek.it/seismic/seismic-software/casp/, last access: 28 March 2024.
Michelini, A., Faenza, L., Lauciani, V., and Malagnini, L.: ShakeMap implementation in Italy, Seismol. Res. Lett., 79, 688–697, 2008.
Michelini, A., Faenza, L., Lanzano, G., Lauciani, V., Jozinović, D., Puglia, R., and Luzi, L.: The new ShakeMap in Italy: progress and advances in the last 10 yr, Seismol. Res. Lett., 91, 317–333, 2020.
Ministero delle Infrastrutture e dei Trasporti: Norme Tecniche per le Costruzioni, Decreto del Ministero delle Infrastrutture, GU serie generale, 42, 20 02 2018, Suppl. ordinario, 8, Gazzetta ufficiale della Repubblica Italiana, https://www.gazzettaufficiale.it/eli/id/2023/03/22/23A01847/SG (last access: 28 March 2024), 2018.
Oliveti, I., Faenza, L., and Michelini, A.: New reversible relationships between ground motion parameters and macroseismic intensity for Italy and their application in ShakeMap, Geophys. J. Int., 231, 1117–1137, 2022.
Patanè, D., Tusa, G., Yang, W., Astuti, A., Colino, A., Costanza, A., D'Anna, G., Di Prima, S., Fertitta, G., Mangiagli, S., Martino, C., and Torrisi, O.: The urban seismic observatory of Catania (Italy): a real-time seismic monitoring at urban scale, Remote Sens.-Basel, 14, 2583, https://doi.org/10.3390/rs14112583, 2022.
Peterson, J.: Observations and modelling of seismic background noise, US Geol. Surv. Open-File Rept., 93–322, https://doi.org/10.3133/ofr93322, 1993.
Satriano, C., Wu, Y.-M., Zollo, A., and Kanamori, H.: Earthquake early warning: concepts, methods and physical grounds, Soil Dyn. Earthq. Eng., 31, 106–118, https://doi.org/10.1016/j.soildyn.2010.07.007, 2011.
Scafidi, D., Spallarossa, D., Turino, C., Ferretti, G., and Viganò, A.: Automatic P- and S-wave local earthquake tomography: testing performance of the automatic phase-picker engine “RSNI-Picker”, B. Seismol. Soc. Am., 106, 526–536, 2016.
Scafidi, D., Viganò, A., Ferretti, G., and Spallarossa, D.: Robust picking and accurate locations with RSNI-Picker2: real-time automatic monitoring of earthquakes and nontectonic events, Seismol. Res. Lett., 89, 1478–1487, 2018.
Scafidi, D., Spallarossa, D., Ferretti, G., Barani, S., Castello, B., and Margheriti, L.: A complete automatic procedure to compile reliable seismic catalogs and travel-time and strong-motion parameters datasets, Seismol. Res. Lett., 90, 1308–1317, 2019.
Spallarossa, D., Ferretti, G., Scafidi, D., Turino, C., and Pasta, M.: Performance of the RSNI-Picker, Seismol. Res. Lett., 85, 1243–1254, https://doi.org/10.1785/0220130136, 2014.
Spallarossa, D., Cattaneo, M., Scafidi, D., Michele, M., Chiaraluce, L., Segou, M., and Main, I. G.: An automatically generated high-resolution earthquake catalogue for the 2016–2017 Central Italy seismic sequence, including P and S phase arrival times, Geophys. J. Int., 225, 555–571, https://doi.org/10.1093/gji/ggaa604, 2021.
Stucchi, M., Meletti, C., Montaldo, V., Crowley, H., Calvi G. M., and Boschi, E.: Seismic Hazard Assessment (2003–2009) for the Italian Building Code, B. Seismol. Soc. Am., 101, 1885–1911, https://doi.org/10.1785/0120100130, 2011.
Viganò, A., Scafidi, D., Ranalli, G., Martin, S., Della Vedova, B., and Spallarossa, D.: Earthquake relocations, crustal rheology, and active deformation in the central-eastern Alps (N Italy), Tectonophysics, 661, 81–98, https://doi.org/10.1016/j.tecto.2015.08.017, 2015.
Viganò, A., Scafidi, D., and Ferretti, G.: A new approach for a fully automated earthquake monitoring: the local seismic network of the Trentino region (NE Italy), J. Seismol., 25, 419–432, https://doi.org/10.1007/s10950-021-09993-0, 2021.
Vitale, G., D'Alessandro, A., Di Benedetto, A., Figlioli, A., Costanzo, A., Speciale, S., Piattoni, Q., and Cipriani, L.: Urban seismic network based on MEMS sensors: the experience of the seismic observatory in Camerino (Marche, Italy), Sensors, 22, 4335, https://doi.org/10.3390/s22124335, 2022.
WebGIS PAT: https://webgis.provincia.tn.it/wgt/?lang=it&topic=14&bgLayer=sfondo_urb&layers=ammcom,stazioni_sismiche,eventi_sismici&layers_visibility=false,true,true&layers_opacity=1,1,0.4&catalogNodes=53, last access: 28 March 2024.
Wessel, P., Smith, W. H. F. , Scharroo, R., Luis, J. , and Wobbe, F.: Generic Mapping Tools: Improved Version Released, Eos Trans. AGU, 94, 409–410, https://doi.org/10.1002/2013EO450001, 2013.