the Creative Commons Attribution 4.0 License.
the Creative Commons Attribution 4.0 License.
 | 03 Apr 2024
A regional early warning for slushflow hazard
Heidi A. Grønsten
Siv Å. Seljesæter
Slushflows are rapid mass movements of water-saturated snow. They release in gently sloping locations (<30°) and are hence not restricted to steep slopes. Slushflows are observed worldwide in areas with seasonal snow cover and pose a significant natural hazard in Norway. Hazard prediction and early warning are therefore crucial to prevent casualties and damage to infrastructure.
A regional early warning for slushflow hazard was established in Norway in 2013–2014 as the first of its kind in the world. It has been operational since then. Four main variables are central in the methodology used: ground conditions, snow properties, air temperature, and water supply to snow. Gridded forecasting model simulations in the decision-making tool Varsom Xgeo, real-time data from automatic stations, and field observations from the field are assessed. Based on data from historical slushflows, a water supply–snow depth by snow type ratio has been developed as an assessment tool. This approach can be implemented in other areas with slushflow hazard where the necessary input data are available.
- Article
(5678 KB) - Full-text XML
- BibTeX
- EndNote


Slushflows annually pose a major natural hazard in Norway and elsewhere, threatening people and infrastructure. Historically the damages and economical cost in Norway have been equally caused by slushflows and snow avalanches (Hestnes, 1998). More than 1550 fatalities in the country have been caused by snow-related hazards, including slushflows, during the past ∼150 years (Hisdal et al., 2017). Here we present the operational regional slushflow early warning assessment method (SEW) currently used in Norway. Its main purpose is to initiate and facilitate measures aimed at preventing damage to health and infrastructure.
Slushflows are rapid mass movements of water-saturated snow (Fig. 1; Washburn and Goldthwait, 1958; Nobles, 1966; Hestnes, 1985). Although not well known and often associated only with the Arctic, slushflows are observed and pose a hazard in snow-covered areas globally (Onesti and Hestnes, 1989). As an example, 88 fatalities were caused by a single slushflow event in Japan in 1945 (Kobayashi et al., 1994). We use the definition of slushflow agreed on internationally in 1992 (Hestnes, 1998) which covers a range of slushy appearances such as slush avalanches, torrents, and so on (Gude and Scherer, 1998).
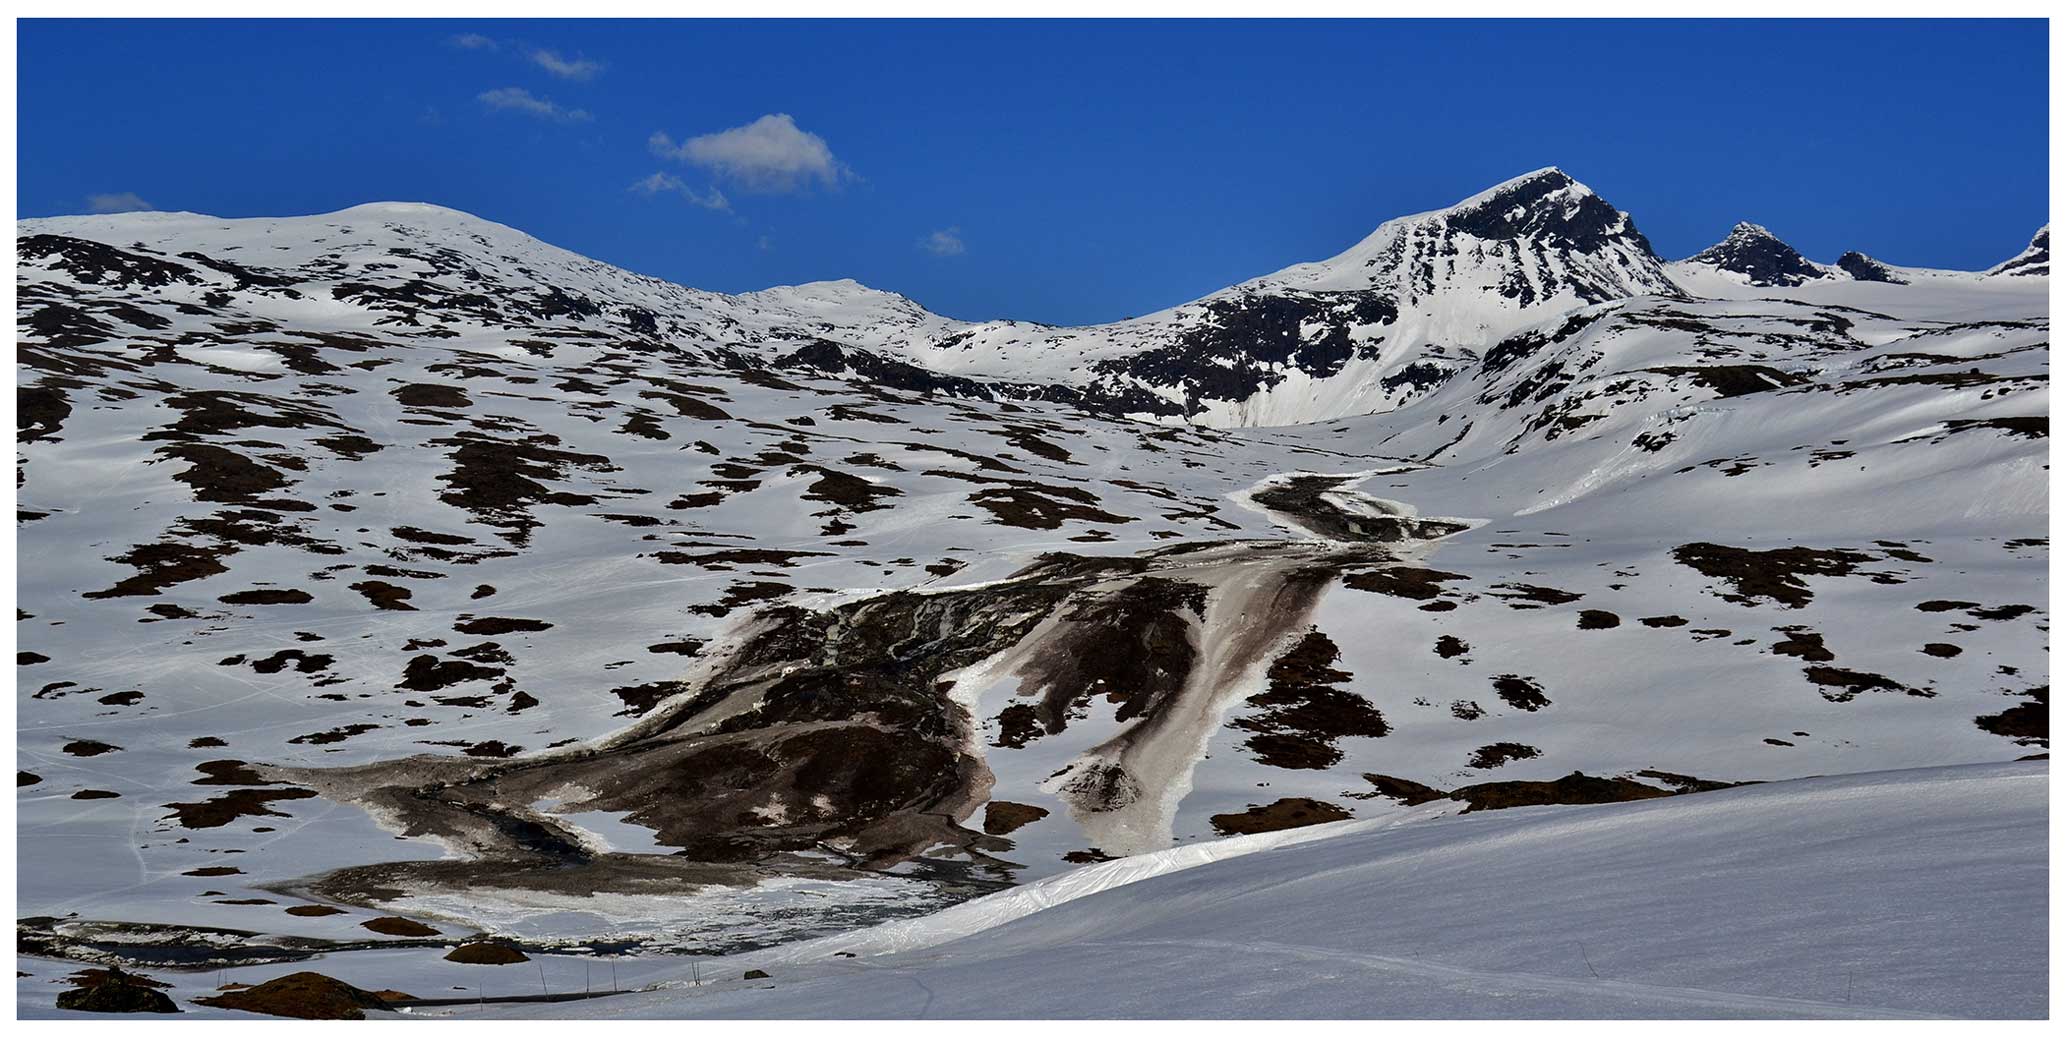
Figure 1Example of a slushflow path and runout, close to Krossbu, Jotunheimen, southern Norway, 19 May 2013. It released at the outlet of a lake and eroded the ground. It is not uncommon that slushflows initiate in sunny weather due to snowmelt only. (Photo credit: Kjell Nyøygard.)
Slushflows are generally released in low to moderately sloping terrain (<30°), unlike snow avalanches, landslides, and debris flows. The flowing mixture of snow and water initiates in depressions, gentle slopes, and in the transition zone between steep- and low-grade terrain, but it is also released during ice breakup of streams and rivers.
The initiation mechanism and flow dynamics may partly resemble those of debris flows (Statens vegvesen, 2014). The flow paths are characterized by long distances up to several kilometres (e.g. Hestnes, 1998; Pérez-Guillén et al., 2019). The fluidity of slushflows also enables flow around obstacles, and thus they may not follow straight runouts as commonly seen in snow avalanches and landslides. The mass movements often continue farther downward steep slopes and may transform into debris flows. Due to their high water content, slushflows have large erosional power (Rapp, 1960; Onesti and Hestnes, 1989). They often erode the ground along their path and accumulate mass by incorporating snow, rocks, debris, and other materials. High density makes the damage potential substantial, both for infrastructure and geomorphology. Stones deposited 20 m above riverbeds and debris coverage of vegetated areas have been observed in Greenland (Washburn and Goldthwait, 1958).
Slushflows are reported to have occurred in a variety of weather situations, spanning from cyclonic activity with heavy rainfall and rapid snowmelt to situations with snowmelt only, due to solar radiation (Hestnes and Sandersen, 1987; Scherer et al., 1998; Decaulne and Sæmundsson, 2006; Jaedicke et al., 2013). The latter situation, a sunny weather type that many people do not associate with danger, can thus pose a hazard. During the winters of 2010 and 2011, there were eight fatalities purely due to slushflows in Norway. One of the situations occurred during sunny weather conditions, possibly viewed as harmless by the public, but resulted in four deaths (Hestnes et al., 2012).
Physical mitigation measures are expensive, if feasible at all. In some areas they are difficult to implement due to the nature of the slushflows (Hestnes and Sandersen, 2000; Tómasson and Hestnes, 2000). Therefore, an early warning system (EWS) which includes slushflow hazard is an asset both to protect lives, buildings, roads, and railways and as an incentive to take precautions and safety measures. Early warning of slushflows is a necessity for infrastructure but is also beneficial to, for example, hikers and skiers (Gude and Scherer, 1998).
EWSs comprise four different elements: knowledge, monitoring and warning service, dissemination and communication, and response capability (UN/ISDR, 2006). For several natural hazards, such as floods and snow avalanches, regional early warning and forecasting has been developed through many decades (e.g. Föhn, 1998; Krøgli et al., 2018). Krøgli et al. (2018) present the development of the Norwegian Landslide Forecasting and Warning Service (NLFWS) in more detail. Local slushflow forecasting has to some extent been carried out for four decades (Hestnes, 1998). Due to the range of initiation factors and processes, assessment of slushflow hazard is much more complicated than that of avalanche hazard (Onesti, 1985; Onesti and Hestnes, 1989; Hestnes, 1998).
In this paper we focus on the method developed for operational regional slushflow early warning assessment established and used within the NLFWS. We present the foundation and development of the hydro-meteorological method of the regional SEW. Furthermore, we examine the implications that the nature of slushflows has on data collection and outline the possibilities for application of the method to other areas.
2.1 Previous work
As previously mentioned, the release mechanism of slushflows differs from that of snow avalanches. As liquid water content (LWC) increases in the snowpack, the pore pressure increases and snow crystal bonds weaken. The gravity component may be small in low-sloping terrain (Hestnes, 1998). The dynamics of slushflows resemble those of debris flows in that the high water content enables great mobility. This means that the masses have little firmness and therefore behave like a viscous liquid (Washburn, 1980, and references therein).
In 1983 the Norwegian Geotechnical Institute (NGI) started developing objective forecasting criteria for slushflow hazard on a local scale. Hestnes (1985) defined three types of slushflow release based on terrain types: drainage channels, water-saturated embanked snow through narrow outlets, and bogs.
Critical stability of the snowpack, as well as slushflow release during snowmelt and rain, depends on a complex interaction between several factors: impermeable ground conditions, rate and duration of water input, and snow structure – specifically the permeability of the snowpack layers, the number and strength of the bonds between snow particles, as well as the slope angle determining the pressure head (Hestnes et al., 1994; Hestnes, 1998; Hestnes and Bakkehøi, 2004).
Liquid water can be present in the snowpack in two regimes, with low or high saturation respectively: (a) the pendular regime, when air is continuous throughout the pore space between individual grains. This typically occurs up to 7 % volumetric LWC. (b) The funicular regime when liquid water is connected throughout the pore space, and air space is reduced (Colbeck, 1973). The snow structure controls the transitional range between the pendular and funicular regimes. For old, coarse grained snow it is typically between 7 % and 12 % LWC, while new snow is saturated at 13 %–18 % LWC (Denoth, 1982). Furthermore, the degree of wetness can be separated into very wet snow (estimated at 8 %–15 % LWC) and soaked snow at >15 % LWC (Fierz et al., 2009).
Impermeable or water-saturated ground conditions are necessary to saturate a snowpack, as it impedes water from leaving the snowpack through ground infiltration. This requirement is met when the snowpack covers a thick ice layer, bare rock, or frozen ground (Hestnes, 1985), but this may also occur on saturated unfrozen ground (Gude and Scherer, 1995; Hestnes, 1998).
Hestnes and Bakkehøi (1996) studied slushflow conditions systematically. They found that cohesionless new snow and porous, coarse grained snow types are most prone to start flowing when the snow is completely saturated. Stratified snowpacks with layers of crust and ice are more stable. Dense, icy snow layers were found to withstand more than 3 d of submersion. Depth hoar at the base of the snowpack covered by coarse grained snow facilitates large slushflows (Hestnes, 1998).
Water supply to the snowpack is controlled by precipitation and snowmelt. Snowmelt is determined by the energy balance at the snow surface, where the important components are the turbulent energy exchange from sensible and latent heat, as well as the radiation balance. Humid, strong winds, high air temperatures, and a high amount of incoming solar radiation, such as under midnight sun conditions, will facilitate intense snowmelt (Hestnes, 1998). According to Hestnes et al. (1987), if the relative air humidity is less than 28 % no melting will take place, but some snow will evaporate.
Reliable estimates of snowmelt are essential in the forecasting of slushflow hazard. Solar radiation as a component to snowmelt is found to be an important factor for the release of slushflows and wet snow avalanches in certain situations (Jaedicke et al., 2013; Mitterer and Schweizer, 2013). Scherer et al. (1998) state that the meltwater flow through the snowpack influences the release of slushflows.
Hestnes et al. (1994) analysed 80 slushflow events. During periods of cyclonic warm fronts snowmelt contributed with 5 %–45 % of the total water input. Based on five major situations between 2008 and 2013, Jaedicke et al. (2013) found that the rain-induced slushflows typically occurred during the first half of the winter season when solar radiation was low. The springtime examples of widespread slushflow activity were found to be caused by intensive snowmelt only. Scherer et al. (1998) found that for snowmelt-induced slushflows, the timing of energy input is crucial.
Even though slushflows can occur anywhere globally with seasonal snow cover given the right combinations of factors (Onesti and Hestnes, 1989), no standardized national or international method for regional forecasting of slushflow hazard has been developed. The need for such a service, improving the safety of rail and road traffic, but also for backcountry activities, was pointed out already in the 1990s (Barsch et al., 1993; Gude and Scherer, 1998). The lack of further development may have several reasons: some people assumed that slushflows only occurred in restricted parts of the world, slushflows are often misclassified, and sufficient regional data input has not been available, even though the phenomenon has been known for more than 300 years (Onesti and Hestnes, 1989).
2.2 Establishment of regional early warning of slushflow hazard
In 2009, the Norwegian Water Resources and Energy Directorate (NVE) was assigned the responsibility of establishing national EWSs for natural hazards (including the previous organizational unit in the NVE, the division for floods, expanding to snow avalanches, landslides, and rock falls). This was part of a political effort to reduce the risk posed by water-related natural hazards. The Norwegian Landslide Forecasting and Warning Service (NLFWS) was officially launched in autumn 2013 (Krøgli et al., 2018). From 2014, this service also officially included forecasting slushflow hazard. The organizational decision to include slushflows along with landslide forecasting was mainly based on three reasons: (a) slushflows are water related and the ground conditions are also part of the hazard assessments, (b) slushflows can also occur during periods when the snow avalanche warning service is not operative (June–November), and (c) slushflows release in gentle slopes and may therefore also occur in areas other than those normally covered by the Norwegian Avalanche Warning Service (NAWS) (Engeset, 2013).
It is important to distinguish between local and regional forecasts. Locally, factors that are specific to the place, such as cirque formation, are decisive, as they may induce local melt conditions. Regional forecasts must recognize weather conditions that are valid for a larger area, as well as differentiate between different danger levels. As for regional landslides and snow avalanches, regional slushflow forecasts are not intended to be site specific, i.e. they do not indicate the location of possible slushflows. The regional SEW does not cover single slushflow events caused by external triggers such as snow avalanches damming a river or human activity that blocks drainage. The danger level is communicated through a bulletin that is updated at least once a day at https://www.varsom.no/ (last access: 13 February 2024) (Krøgli et al., 2018).
It must be noted that during method development, it was an overall requirement that the resulting method for assessing regional slushflow hazard use the same approaches as, and fit into, the existing framework already developed for the NVE's other natural hazard EWSs, in particular that of landslide. This overall objective put some constraints on the methodological approach, the definition of the danger levels, and hence the evaluation of the issued warning bulletins. The slushflow hazard is subjected to the same scale and definitions as flood and shallow landslides, built on the same concept as meteoalarm (http://www.meteoalarm.eu/, last access: 13 February 2024) (Krøgli et al., 2018), and is thus not the same as the snow avalanche hazard scale used in Norway and Europe in general.
Unlike with warnings issued by the NAWS, the regions for landslide and slushflow hazard are not predefined, only constrained by municipality borders. The minimum size of a warning area is set to approximately 7500 km2. This approach enables identification of exposed areas, e.g. along the coast.
The NLFWS assessments are based on analysis of automatic meteorological and hydrological monitoring stations, a database of historical landslides, hydro-meteorological models, and simulations (Krøgli et al., 2018). The NAWS also benefits from in situ snow observations in slopes (Engeset, 2013). These observations are mainly carried out in steep terrain.
The NLFWS bulletins are divided into four colour-coded danger levels (Krøgli et al., 2018): green (1), yellow (2), orange (3), and red (4). Green indicates generally safe conditions and is the level that occurs most frequently. Yellow is the lowest of the levels for which an early-warning bulletin is issued. Orange level indicates high landslide hazard and red level indicates extreme hazard. Note that the nature of slushflows makes it possible for them to occur both in flat and steep terrain. The current regional early warning is thus not a means of pinpointing safe terrain types in detail, at least not to the same degree as snow avalanche early warning. Still, the different danger levels, to some extent, give a clue to where the hazard mainly could be expected.
At yellow (2) level the expected appearance of slushflows is mainly restricted to terrain formations particularly prone to slushflows, such as narrow outlets (cirques and funnel shapes) that enhance accumulation of water. Yellow danger level may be valuable to the municipalities, where local knowledge about the most susceptible geomorphic features in the area can be applied. For areas with vulnerable infrastructure and buildings, this is a signal to initiate mitigating measures. At orange (3) level the expected slushflow hazard is high and many slushflows are expected. Red level (4) is an extreme situation and emergency response authorities should implement emergency plans and mitigation measures for carrying out possible evacuations and other contingency responses.
Our methodological approach to regional SEW is based on the combination of factors that have previously been found to be decisive in the triggering process. However, in the regional approach, the geomorphic terrain features will be of less importance in the assessment, as the size of the area ensures their presence. Nevertheless, they are to some extent reflected in the yellow danger level. The variables for regional assessment of slushflow hazard can then be narrowed down to ground conditions, snow properties, and water supply. The daily operational routines and bulletin distribution is described in detail by Krøgli et al. (2018). Here we concentrate on the assessment method for regional SEW, developed since 2013.
3.1 Setting, hydro-meteorological data, tools, and assessment process
The Norwegian mainland (Scandinavian peninsula) covers an area of 324 000 km2, spans latitudes from 58 to 71° N, and comprises widely different climate types. The country currently has a real-time network of ca. 600 hydrological and ca. 500 meteorological (precipitation and temperature) stations. In addition, there are ca. 530 locations with snow depth measurements and ca. 20 snow pillows.
For forecasting purposes, the relatively poor coverage of stations is supplemented by hydrological models that provide forecasted hydro-meteorological variables. The country is divided into 1×1 km2 grid cells which are displayed in the open access analysis and decision-making webtool Varsom Xgeo (https://www.xgeo.no/aboutXgeo.html, last access: 13 February 2024, hereafter referred to as Xgeo). The development of observational and simulated weather grid data, covering the whole country at 1×1 km2 resolution, enables regional approaches to early warning. Development and limitations of the maps in Xgeo are explained at NVE (2024b). The different variables are shown as various maps that are manually evaluated by the forecasters.
The daily slushflow assessment is standardized and based on the following: (a) information about hydro-meteorological conditions derived from real-time measurements, model simulations, and forecasts assembled as nationwide gridded thematic maps and data time series; and (b) quantitative gridded forecasts of precipitation, temperature, wind, and air humidity, supplied by the Norwegian Meteorological Institute (MET).
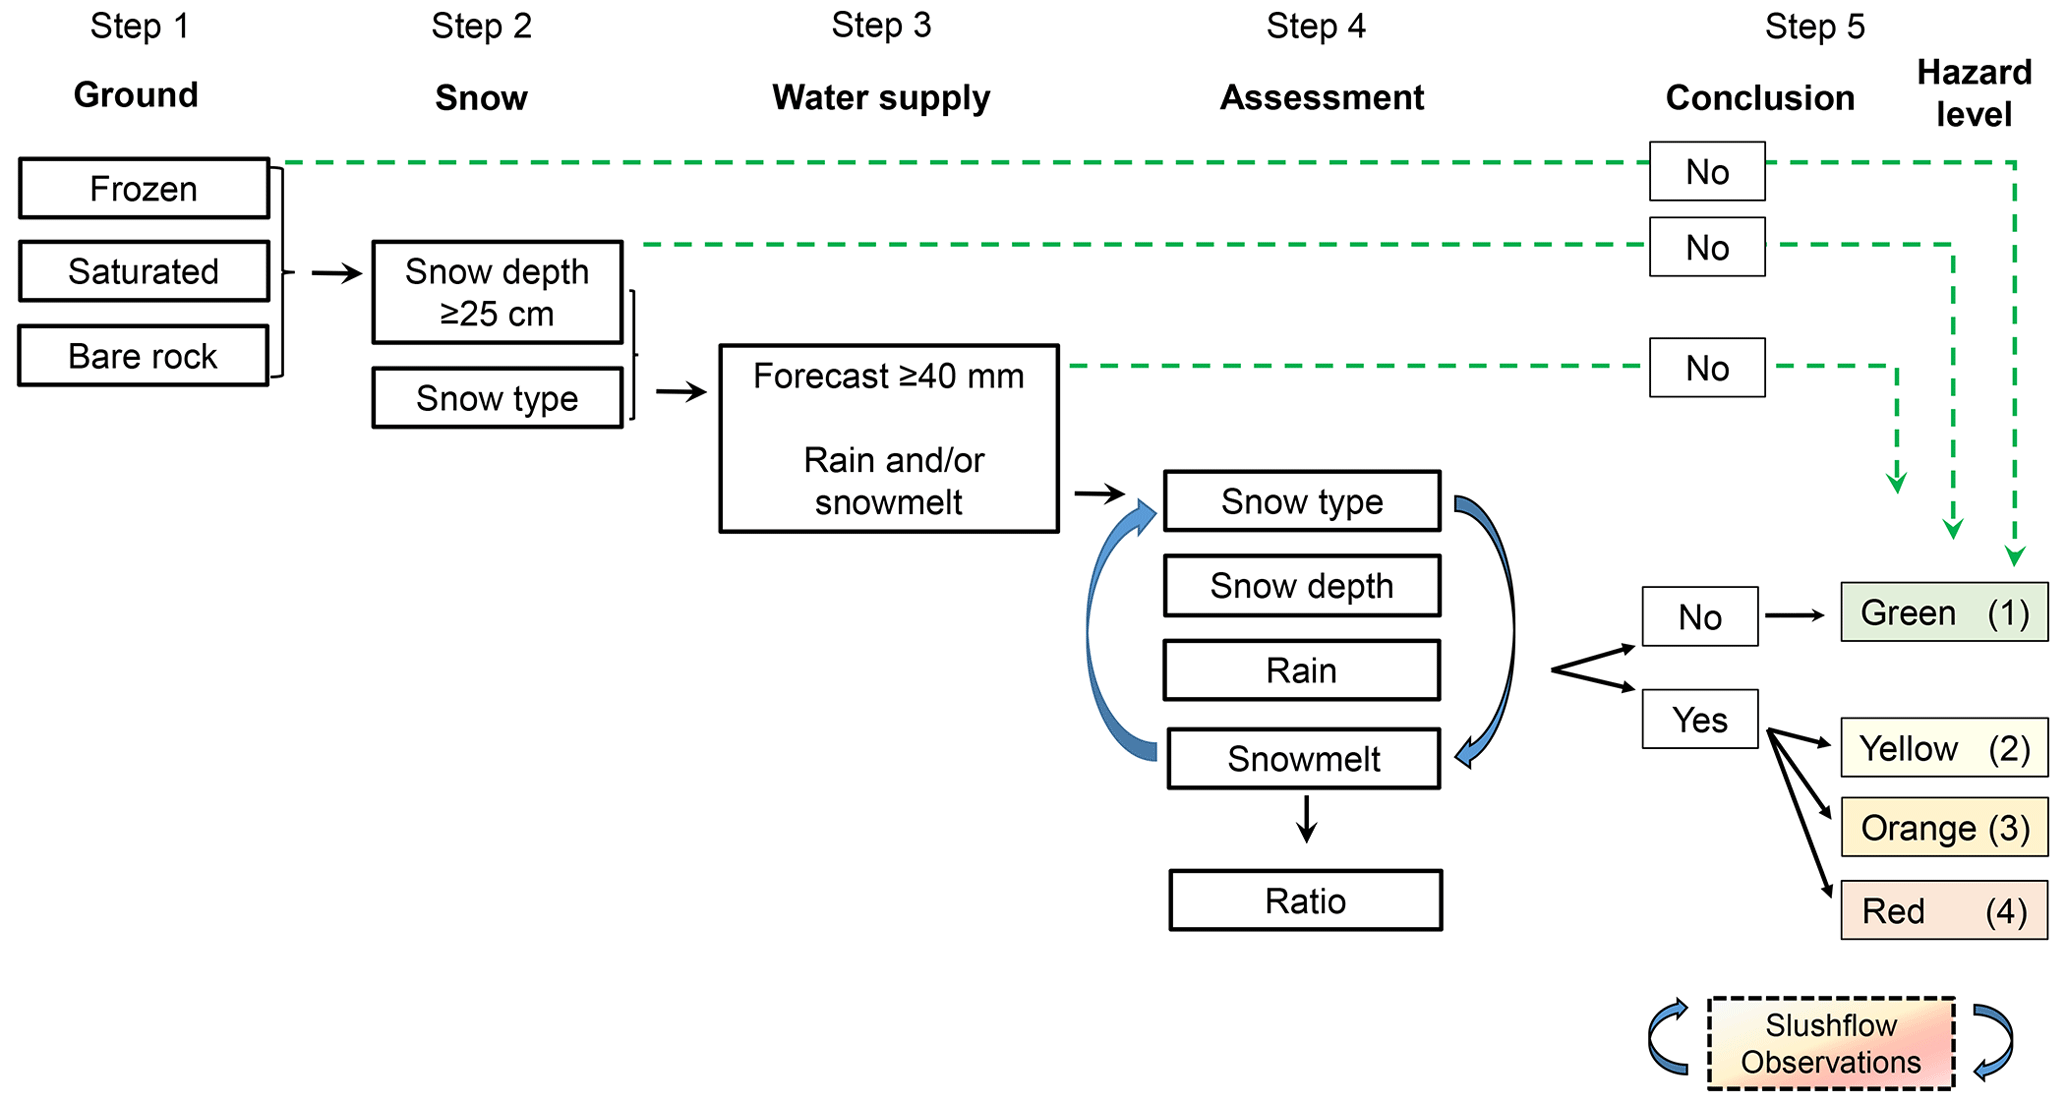
Figure 2The steps in the forecasters' slushflow hazard assessment process. Simulations of the different variables run automatically and are presented on the Xgeo.no website, while the forecasters manually check the snow type, verify the variables, and assess the regional interactions of the variables.
Table 1Overview of information and variables used in the assessment.
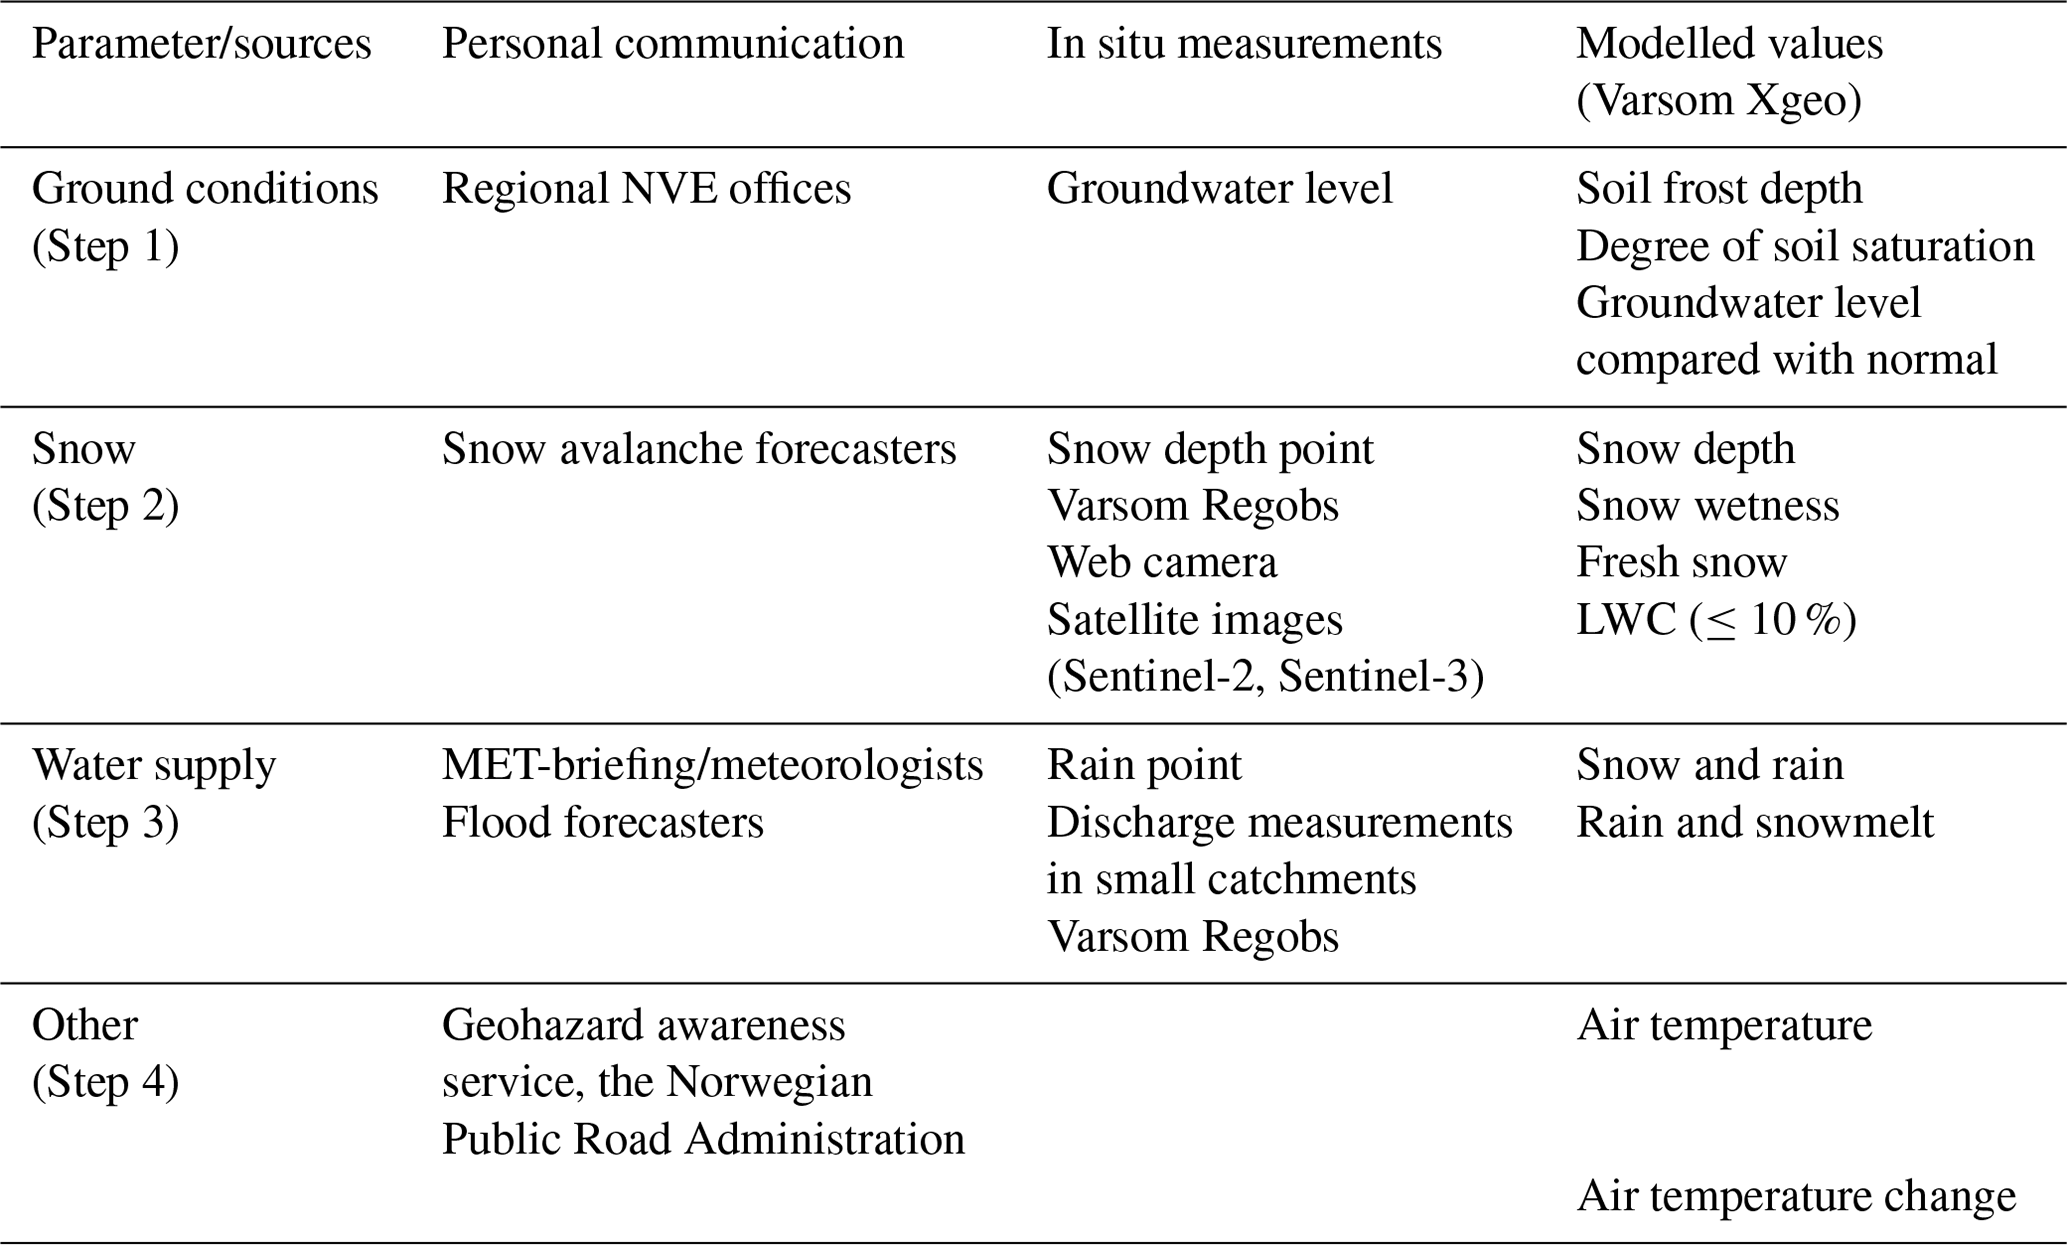
The forecasted hydro-meteorological variables are obtained by a distributed version of the hydrological HBV model (Beldring et al., 2003) and the seNorge snow model (Saloranta, 2016). The model runs four times daily and the results are presented in Xgeo under specific menus such as water supply (rain and snowmelt), soil water saturation, groundwater level, and soil frost (Krøgli et al., 2018, and references therein). Simulated variables are compared with real-time station data to evaluate the model's performance. The assessment process is shown schematically in Fig. 2, and information as well as variables used, in Table 1. The different steps are described further in the following subsections.
3.2 Impeded infiltration of the ground
Impeded infiltration of the ground is a prerequisite for water saturation of the snowpack. Modelled ground properties, such as soil frost, soil saturation, and groundwater level, are all included in the assessment. For modelling purposes, the soil in Norway on a regional scale is defined as till, although there are variations. Thus, the same model parameters for soil conditions are used nationwide (see Krøgli et al., 2018, for more details).
Soil frost depth is simulated using the Motovilov et al. (1999) approach within the spatially distributed version of the hydrological HBV model (Beldring et al., 2003). The soil frost depth calculation is based on the physics of heat conduction in the soil matrix and in the snow cover above the ground. It is used with air temperature data and precipitation data as input. The simulation only gives a rough estimate, as in nature the soil frost depth varies locally due to many factors, including snow depth, water content, as well as soil properties and structure. Vegetation also influences this process. Experience shows that the simulation performance is more reliable in autumn, when the soil frost depth is increasing, than late in spring. On the other hand, spring conditions often encompass a high degree of water saturation. Observational data for comparison is a valuable asset.
The degree of water saturation in the ground is simulated with a distributed version of the HBV model. A high degree of water saturation indicates that the soil pores are filled with water and the infiltration to the ground will therefore be impeded and the criterion met.
An approximate groundwater level is also simulated with the spatially distributed version of the HBV model in Xgeo and shows the groundwater level in relation to the average groundwater level on the same date for the reference period 1981–2000. A network of ∼65 groundwater stations around the country is also used for comparison with the model simulations (Li et al., 2015). High groundwater level is not sufficient to determine impeded infiltration of the ground in an area. It is, however, an indication that the ground conditions are approaching a level where the infiltration capacity is low. The simulations only give estimates. For example, they do not account for areas with talus with space for water infiltration into the ground even when frozen.
Bare rock and bogs also represent areas with impeded infiltration, at least on a local scale (Hestnes, 1998). Currently, few areas in Norway (Nordland and Agder counties) are considered to have large enough areas of bare rocks for this criterion to be met regionally and included in the assessment.
In rare situations, a thick ice layer in the snowpack can also work as an impermeable layer and facilitate slushflows, provided it is covered with enough snow. Several ice layers will instead strengthen the snowpack against slushflows (Hestnes, 1998).
Model simulations of soil frost, groundwater level, and water saturation are evaluated by the forecasters and compared with observations, e.g. from the regional NVE offices (Table 1), if available. An important part of the assessment is to resolve whether the possible conditions are regionally or only locally present.
3.3 Snow properties
The properties of snow change through time and are subject to large variations. This also influences the distribution and rate of water routing through the snowpack. Nevertheless, for a regional approach it is necessary to make simplifications and generalizations. Data on the regional snow types and structure are supplied by the NAWS. These data only cover the most rugged part of Norway and focus on conditions in slopes. Real-time observations containing information on the latest development of the snowpack during the ongoing situation are retrieved through the crowdsourcing tool Varsom Regobs (https://www.regobs.no, last access: 13 February 2024) (Ekker et al., 2013) (hereafter referred to as Regobs).
Since 2013, a minimum of one weekly observation of the snowpack has been carried out in many regions in Norway (Engeset et al., 2013). Regional snowpack updates are also provided directly from the NAWS, daily when necessary. For regions with less observational data, data from the other regions and comparisons with Xgeo simulation data are used to extrapolate the snow conditions.
Several snow cover models, such as CROCUS (Brun et al., 1989), later integrated within the framework of SURFEX (Vionnet et al., 2012), have been developed. They aim to provide information on snow depth and stratigraphy where spatial and temporal observations are sparse. In recent years, the physics-based SNOWPACK snow cover model has been applied to simulate LWC for the forecast of wet snow avalanches (Bellaire et al., 2017). However, wet snow avalanches are triggered in a pendular regime (3 %–7 % LWC) and thus at a lower LWC than the funicular regime of slushflows. Snow models still have too poor performance for preferential flow and ponding to be used operationally in regional slushflow forecasting. Meanwhile, observational data on snow moisture and wet snow avalanching reported in Regobs, as well as the simulated snow wetness index, give an indication of the LWC in the region.
Based on the abovementioned observations, for slushflow assessment the snow stratigraphy and texture are divided into four snow types, all with emphasis on the lowermost 0–1 m of the snowpack. Snow types prone to slushflows listed from high to low susceptibility are facets/depth hoar (FC/DH) at or near the ground, new snow (PP, precipitation particle) deposited on an impermeable layer, melt forms (MF), and all other snow types (OTH). The division is based on previous studies (Hestnes, 1998) and empirically from regional information during the 10 years of our service. This is a rough differentiation based on the data available. Here we use “new snow” meaning relatively recently deposited snow with limited influence from wind drift. Snow with various properties that are less slushflow-prone are grouped under “all other”.
Snow depth and snow wetness values are provided from Xgeo and are validated from observations via Regobs. The grid values represent a larger area (1×1 km2) and thus do not reflect the local snow depth. They do, however, provide an adequate input to the ratio of water supply to snow depth developed to reflect the regional danger level (Sect. 3.5). The effect of snow wetness is added to the forecasted water supply before the water supply–snow depth ratio is assessed.
The Xgeo-variable snow wetness is an indicator of the ripening status of the snowpack towards isothermal conditions when runoff from snowmelt is initiated. The snow wetness assessment is based on both observations (Regobs) and simulations of the wetness (up to 10 % LWC) throughout the snowpack.
3.4 Water supply
Slushflows normally occur during situations with air temperatures above freezing. They are often associated with steep air temperature increases above 0 °C (e.g. Decaulne and Sæmundsson, 2006). Diurnal air temperature variations are important for assessing the water supply to the snowpack (e.g. Techel and Pielmeier, 2011). Fluctuation around 0 °C mutes the rate of water supply to the snowpack. Situations where the temperature is more stable during day and night, e.g. due to midnight sun like in northern Norway, are more favourable for the water supply rate. Xgeo provides an overview of changes in diurnal variation in air temperature for several days, both as observed values and forecast.
The length and intensity of positive degree days prior to slushflow initiation influence both snow metamorphosis and thus snow type, as well as meltwater production. Even though intense rain and/or snowmelt situations often have been highlighted, sufficient water may accumulate in the snowpack when there is constant water supply through several days, even though the rates are relatively low. Special attention is therefore paid to such weather forecasts. During assessment the forecasters evaluate whether the simulated rain and snowmelt variable is over- or underestimating values and to what extent the regional distribution is reliable. This is strongly based on the meteorologist's briefing. As an example, the elevation of 0 °C is often a decisive factor, but it may also be encumbered with large uncertainties.
3.4.1 Rain on snow
In the following sections, mentions of rain are consistently in the sense of rain on snow (ROS). In the calculation of water supply, rain is less subjected to errors than snowmelt. However, there are uncertainties in observations and forecasts. The precipitation type simulation in Xgeo is based on a temperature limit, and the actual type of precipitation may differ from this. The daily meteorology briefing provided by the Norwegian Meteorological Institute enables adjustments in the forecaster's interpretation of the model simulations. Real-time measurements and observations from, for example, webcams are also an asset in this respect.
3.4.2 Snowmelt
Snowmelt is simulated both through the distributed HBV model (rain and snowmelt) and by the snow melting energy balance (EB) model. Both model results are presented in Xgeo. The simulated combined rain and snowmelt do not account for snowmelt due to solar radiation and turbulent heat fluxes. The water input is therefore underestimated in this model simulation. Jaedicke et al. (2013) found that the observed slushflow in their study region occurred on the day with the highest daily solar radiation balance. In the EB model solar radiation and turbulent heat fluxes are incorporated. The EB model is only simulated 48 h ahead and, for technical reasons, not combined with predicted rain values. The EB simulations are satisfactory at 3 h time steps. At daily resolution, however, they tend to overestimate the snowmelt rates when compared with rates at snow pillow stations (Skaugen and Saloranta, 2015). Thus, both simulations are currently used in the assessment.
Many slushflows commonly occur during the ice breakup process of streams and rivers in spring. A sharp increase in water discharge could therefore be a good indicator of increasing slushflow hazard (Hestnes, 1998). Water discharge data from monitoring stations could be useful for an early indication. In Norway, however, there are very few stations in small catchments (<50 km2), hampering the use in a regional approach. The assessment therefore relies on observations of rapidly increasing water discharge reported in Regobs and a close cooperation with the flood forecasting service.
3.5 Water supply–snow depth by snow type ratio (WSR)
Hestnes and Bakkehøi (2004) investigated the connection between exposed snow types and slushflows. Studies investigating the connection between snow type, snow depth, and the associated water supply for slushflow release are very scarce (Skuset, 2018).
Our methodological approach was established with the assets and parameters available (Sect. 2.2) and was initially based on a 1:1 ratio for water supply and snow depth during 24 h in the most slushflow-prone snow types. This has further been developed into ratio tables (Table 2) for the four snow types used: facets and depth hoar (FC/DH), new snow on saturated or impermeable ground (PP), melt forms (MF), and other snow types (OTH). We used data from quality-controlled slushflow events as a basis to derive the water supply–snow depth by snow type ratio (WSR) tables. The tables are based on values from precipitation as rain, snowmelt from the EB model, and snow depth retrieved from https://www.xgeo.no/aboutXgeo.html (last access: April 2023) corresponding with the initiation areas of the slushflow events. Retrieving the snow type was challenging, as the availability of observations varies. For some of the events previous meteorological data from the same snow season were used to estimate the snow type, and only the most reliable estimates were used.
Table 2Danger level (2–4) based on water supply–snow depth by snow type ratio (WSR).
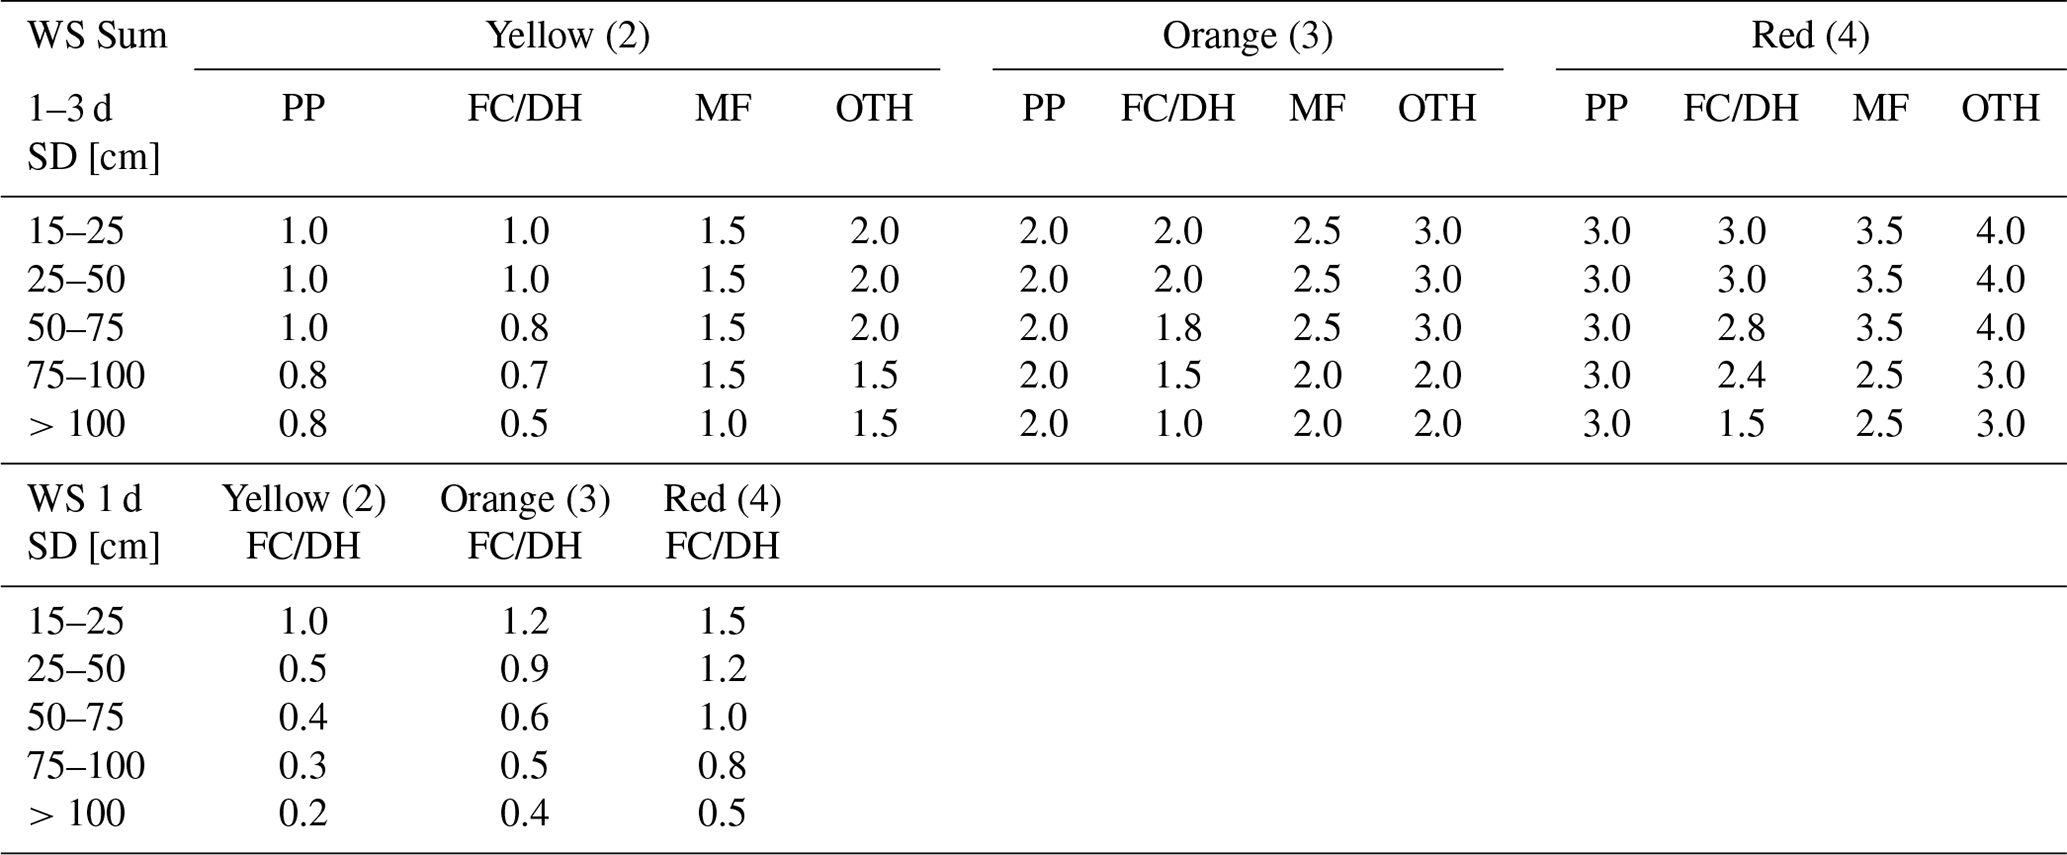
WS: water supply to snow; SD: snow depth; PP: precipitation particles/new snow; FC/DH: faceted crystals near the ground or depth hoar; MF: melt forms; OTH: all other snow types.
The events were first sorted by the four snow types, then by five snow depth classes in the estimated initiation area, based on the modelled grid value from Xgeo. Not all snow depth classes were represented in the dataset. Thus, the remaining depth classes were inter- and extrapolated following a logical approach where larger snow depth to some extent needs more water supply than smaller snow depth. For FC/DH this deviates the most, based on observations. We followed the principle that the FC/DH layer near the ground is decisive. Thus, higher snow depth mainly contributes to delaying the water percolation towards the base of the snowpack, rather than the need for soaking the entire snowpack before a slush flow is released. For an MF snowpack, complete soaking is considered necessary before a slushflow is released.
The values in Table 2 reflect our experience that there are differences between snow types with weak versus strong crystal bonding, especially on a regional scale assessment, an assumption that is also supported by previous studies (e.g. Hestnes, 1998). Furthermore, when the water supply is sufficiently large and intense, the snow types are less important, although the more-slushflow-prone snow types are still expected to generate a larger number of slushflows than the less-slushflow-prone ones.
It is important to note, however, that Table 2 shows an estimate, and some caution must therefore be taken. As an example, consider a modelled snowpack consisting of 25 cm of new snow, which in 1 d receives half the water supply required to start a slushflow. The following day it receives no additional water. On the third day it receives the rest of the water needed for a slushflow to release. By that time, the snow may have transformed into melt forms, and the calculations need to be reassessed due to the change in snow type. Likewise, some vigilance must be exercised at snow depths just below the lowest end of the scale, when FC/DH are present. Water discharge measurements in small catchments would be a special benefit in these situations. Still, the overall regional values also seem to catch this type of slushflow release, as they result from rapid increase in snowmelt and water discharge. The ratio is based on snow depth and is thus not an unambiguous quantity. On the one hand, there may be large variations in the snow water equivalent (SWE) for a given snow depth. On the other hand, using the SWE instead of snow depth leaves the question about snow type unanswered. (Note that the values in Table 2 are subject to continuous improvements as new quality-controlled slushflow data become available.)
3.6 Slushflow observations, detection, and database
Observations of slushflow-related events are important for several reasons. First, there is the direct importance for the slushflow hazard assessment. Various signs, such as water ponding atop snow, intense snowmelt, and minor slushflows in streams, may indicate an increasing slushflow hazard (Hestnes, 1998). At times, such observations of increased LWC in the snowpack can be retrieved from Regobs in real time. They are also used for validation of, for example, snow wetness simulations. Second, observations are used both in the weekly post-evaluation of the assessment as well as in longer-term evaluations. For the long-term evaluations, data from the release area become important for differentiating between proper debris flows and debris flows initially released as slushflows. Information on release area is also important in the development of WSR and a future index. Underreporting of slushflows is a weakness, however. Third, quality-controlled events are important in the development of statistical decision-making tools. Finally, the development of, for example, RAMMS applications for slushflows also suffers from lack of data. There is currently ongoing work at other institutions and departments to meet the needs for better modelling of this natural hazard.
3.6.1 Slushflow observations
After several years of operation of the NLFWS, the verification of landslide and slushflow occurrence is still a difficult and tedious task (Devoli et al., 2021). There are several challenges in the data collection of slushflow events, the main being misclassification and underreporting.
Insufficient observer knowledge causing misinterpretation of slushflows as snow avalanches or debris flows is still a considerable challenge. Several different terms have been used for slushflows (e.g. slushers, slush avalanche, and rain-on-snow event) which has distorted the classification and establishment of a reliable national slushflow database (e.g. Onesti and Hestnes, 1989; Hestnes, 1998). On the one hand, the large erosional capacity of slushflows, and possible transformation into debris flows, complicates the interpretation of the deposits (Hestnes and Kristensen, 2010). On the other hand, slushflows that do not erode the ground or incorporate material other than snow are also difficult to verify later. The verification time window after an event is usually limited to the existence of snow and slush, and evidence of slushflows may melt away rapidly.
Historical and media documentation are mostly related to the damage of property and infrastructure, and not the frequency of slushflows (Hestnes, 1998). A slushflow situation that occurred close to Fauske, northern Norway, on 25 February 2021 exemplifies this problem. Initially only one, and later two, slushflows that hit the road were reported. Photos taken from a helicopter at the date of occurrence revealed there were at least 13 additional slushflows, i.e. a total of 15 all within an area of only 2 km2 (Fig. 3).
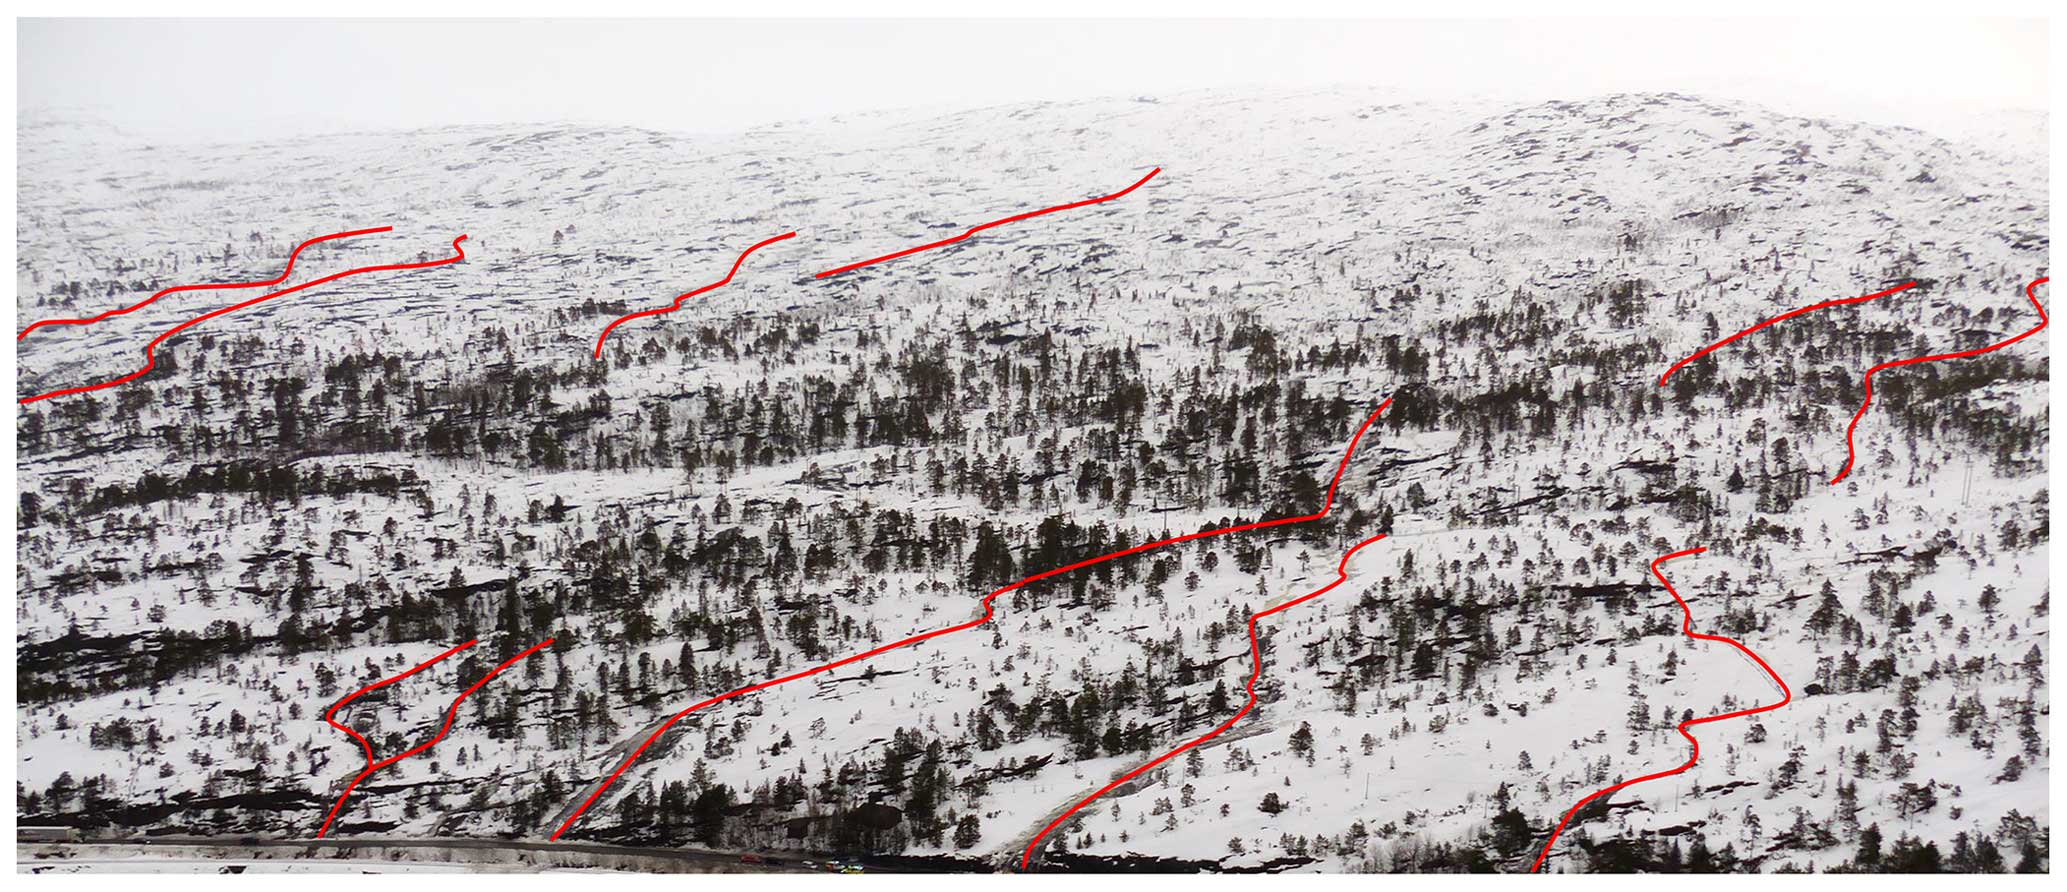
Figure 3Some of the slushflow paths (red lines) identified in the review of images from 25 February 2021, Fauske, northern Norway. (Photo credit: no. 330 squadron of the Royal Norwegian Air Force.)
3.6.2 Remote sensing
Satellite images are a potential source of data on slushflows. Slushflows are, however, triggered under weather conditions where the snow cover is rapidly changing, putting constraints on which temporal and spatial resolution are useful. Using data from Sentinel-1A, Radarsat-2, and Envisat ASAR, Malnes et al. (2016) attempted to detect slushflows that had already been reported. Out of 13 investigated events, 7 were found, but the confidence level was low. For only 1 of the 13 slushflows, the interpretation was reasonably certain. Investigating an extraordinary slushflow situation in Greenland, several slushflows were detected using Sentinel-2 imagery. However, these were larger slushflows causing substantial erosion, making it possible to detect the events 2 weeks later (Abermann et al., 2019).
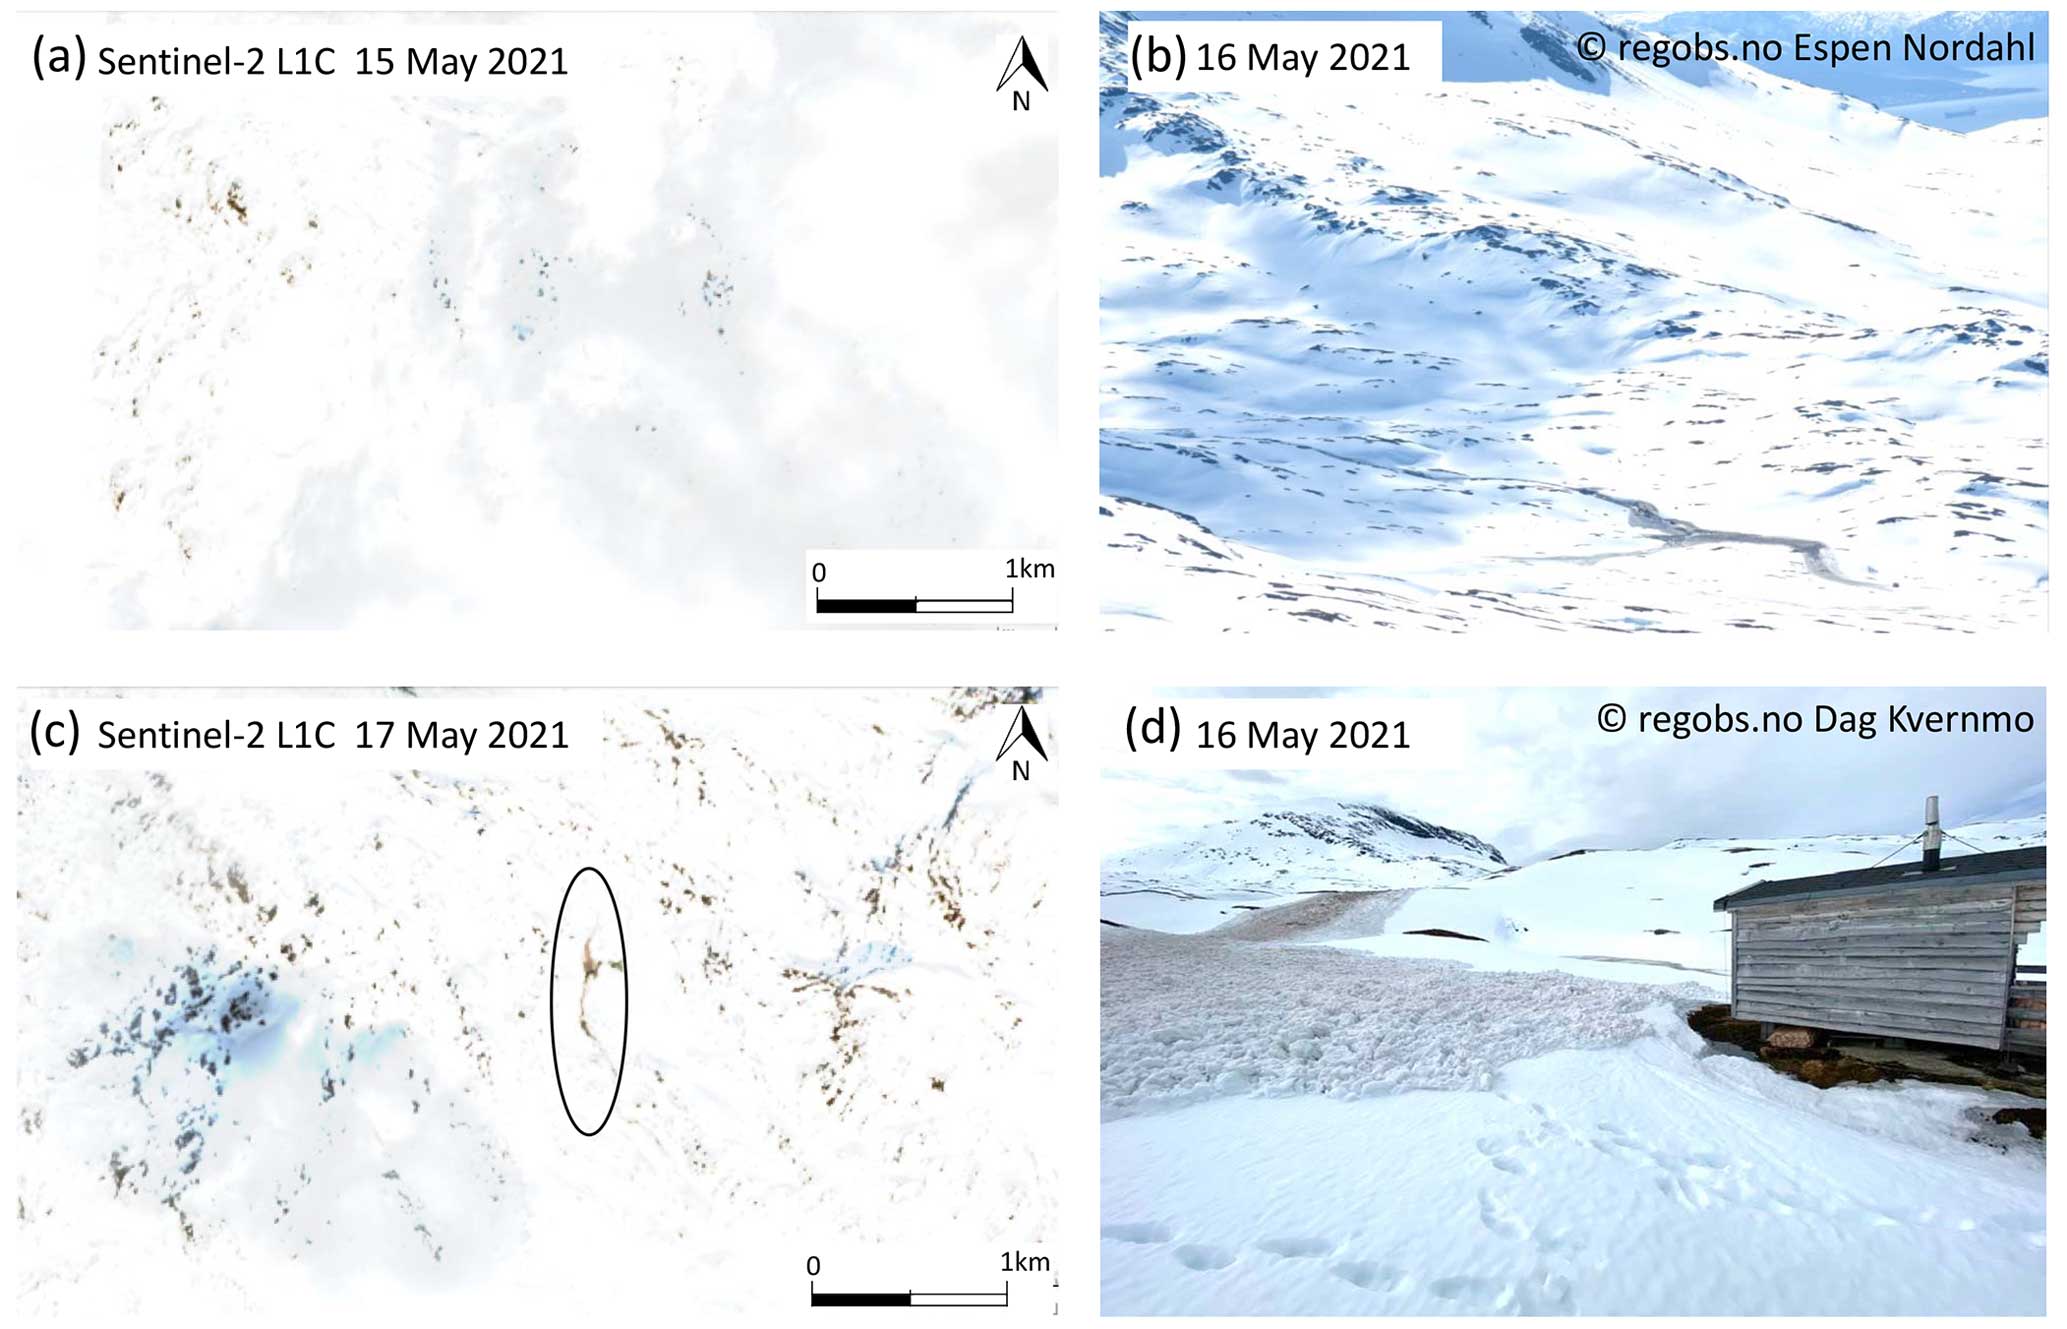
Figure 4Snowmelt situations generally cause substantial changes in the snow cover, and slushflows are often challenging to extract from multi-temporal satellite images. The slushflow at Leigassletta, Nordland, Norway, on 16 May 2021 is an exception with its long runout and distinct shape. It also occurred at a time of a favourable temporal resolution (of the satellite images). Panel (a) is a modified Copernicus Sentinel-2 L1C satellite image from 15 May 2021 prior to the slushflow. Panel (b) shows parts of the slushflow released on 16 May 2021, seen from a distance. (Photo credit: Espen Nordahl, Regobs.no.) Panel (c) is a modified Copernicus Sentinel-2 L1C satellite image from 17 May 2021, with parts of the slushflow inside the black oval. Panel (d) is a close-up photo of the slushflow on 16 May 2021. (Photo credit: Dag Kvernmo, Regobs.no.)
The temporal resolution is still often too low for optical detection. To some extent, the spatial distribution of the slushflow is also a challenge. For instance, the spatial resolution must be sufficient to detect rather confined tracks of slushflow in brooks. Furthermore, the nature of slushflows may also hamper the use of methods involving surface roughness and backscatter signature detection. Wet snow avalanches leave debris in the runout zone enabling detection of high backscatter due to the relatively high surface roughness of the debris (Eckerstorfer et al., 2019). This approach is currently also of limited use for many slushflows. In slushflows flowing over frozen terrain or rocks, the snow masses involved may melt rather than leave debris. When there is no erosion of the ground, there are usually no long-lasting deposits. Finally, the nature of slushflows enables flow across almost all types of terrain. This prevents the possibility of masking out certain terrain types to reduce the amount of data and speed up the processing during automated tracking, as is possible for automated tracking of wet snow avalanches. Increasing application of unmanned aerial vehicles may alleviate these limitations in the future.
A slushflow on 16 May 2021 at Leigassletta, Nordland, Norway, provides an example of close to optimal conditions for detecting such events. There were dependable, in situ observations of the slushflow covering more than 2 km distance in length and sufficient temporal resolution. Low cloud coverage enabled use of optical satellite sensors such as Copernicus Sentinel-2 L1C provided free by the European Commission's Copernicus environmental monitoring programme. Still, the slushflow was spotted neither very easily nor along its entire extent (Fig. 4).
3.6.3 National database
A national database of rapid mass movements has been established in Norway (Jaedicke et al., 2009; Hermanns et al., 2012). It is available at https://www.skredregistrering.no (last access: 13 February 2024) and maintained and further developed by the NVE since 2011. It consists of raw observations registered directly in the database and observations transferred from Regobs. Some of the data have also been supplemented later. A considerable part of the data is quality-controlled (Fig. 5). Several national sources contribute to the database (see Krøgli et al., 2018 for further details). The slushflow entries before 2010 were mainly registered by NGI but also supplied with more information later. In the past 3 years, also the Norwegian Public Roads Administration has started a more systematic collection of slushflow data.
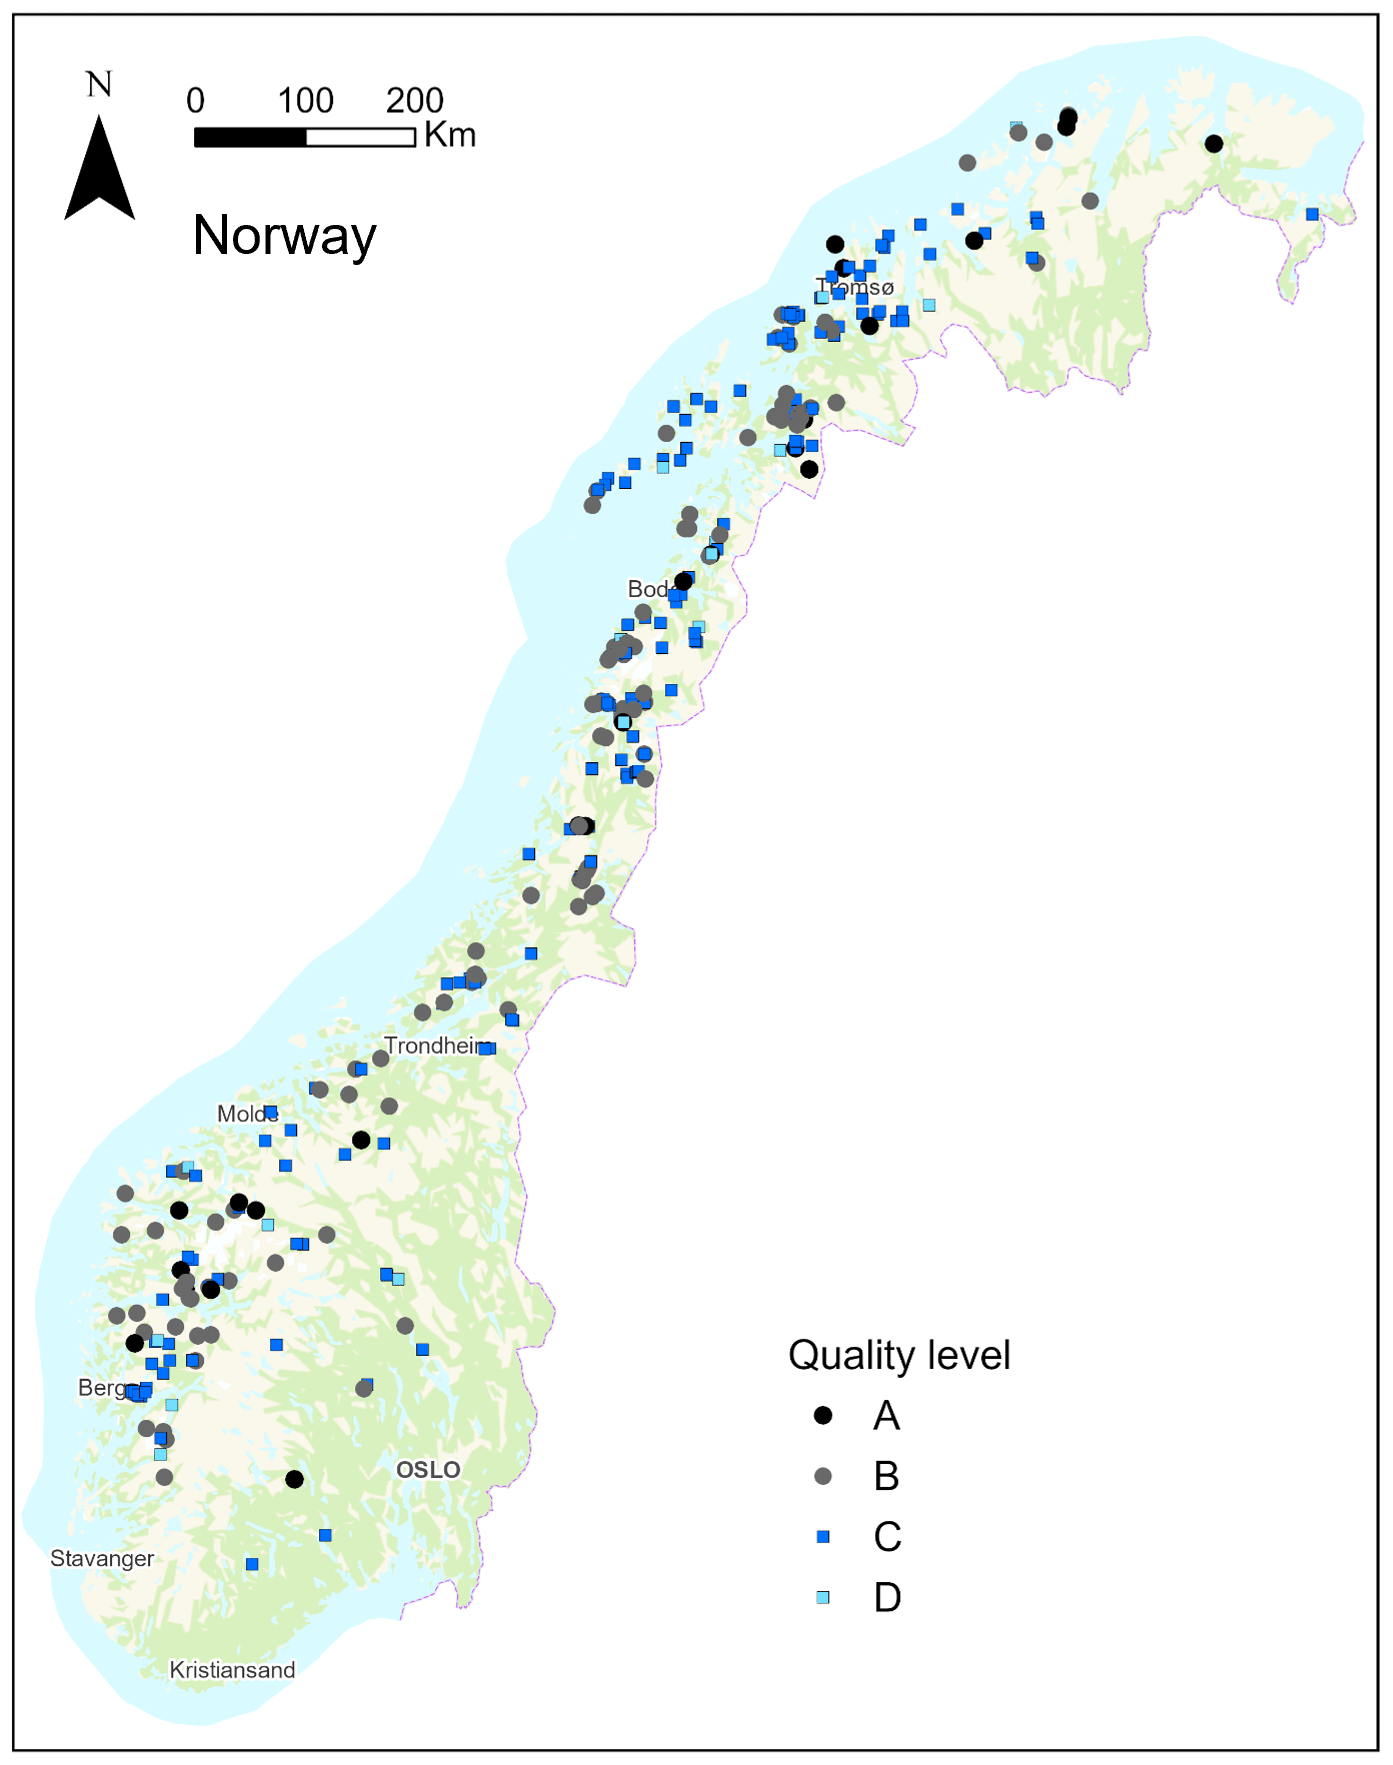
Figure 5Reported and quality-controlled slushflows in Norway in the period autumn 2013 to spring 2023. There are 152 events of quality A and B, and 394 slushflows in total. (Map source: the Norwegian Mapping Authority, Geovekst–Geodata AS.)
The current database contains over 1000 reported slushflows from the year 1600 to the present (Lunde et al., 2023). Around half of these slushflows have undergone quality control and are categorized as A, B, C, or D. Events classified as A have a known date, time, and position. Events falling under category B have a date and time accuracy within ±1 d and a location accuracy within 50 m. Unverified reported slushflows are initially categorized as D but may be upgraded to at least C if confirmation of the event being a slushflow is obtained.
3.7 Operationalization
The operational slushflow hazard assessment procedure follows a checklist according to the workflow in Fig. 2. An imperative consideration for the forecasters is to determine how well the modelled variables reflect the situation. Real-time data from stations, web cameras, and reports from Regobs, e.g. about abundant water in the snowpack, are very useful in this respect. Another important consideration is their regional representativeness. This is a particularly important part of the assessment, as in many situations there are indications of local hazard only. Thus, it is the forecaster's task to analyse to what extent the simulations are correct and the probability that the situation will not extend into a larger area. Another task, when the interaction between the various factors is of regional relevance, is to delineate the exposed area correctly. This is to a large degree based on the forecaster's experience with the model performance. The differences between forecast weather and real weather also play a role, e.g. the exact altitude of the 0 °C isotherm.
During the daily morning briefing, the simulated hydro-meteorological variables are scrutinized against the meteorologist's evaluation of the situation. Afterwards, a discussion is held with the snow avalanche forecasters to determine the predominant snow type in the area in question. The Norwegian Public Road Administration also participates in the briefing and provides updates from the road network. There is also a synergistic effect from working closely with the flood forecasters.
An analysis of the interaction between the different variables (step 4 in Fig. 2) follows, and Table 2 comes into effect. Snow type is considered an important factor on a regional scale. At the same time, with sufficient water supply, slushflows can occur in all types of snow. It is therefore natural to attach the most importance of the assessment to the type of snow on yellow and orange danger levels. The challenge is to determine how much water is needed in the various combinations (snow type, snow depth, initial snow condition, and intensity of water supply) that can occur. The WSR values (Sect. 3.5; Table 2) reflect the principle that at equal snow depth, the least water supply will be needed if the snow is already wet and there is a vulnerable snow type.
Representative water supply and snow depths for the area in question are selected and the resulting WSR is extracted. Finally, the appropriate danger level is determined. During an ongoing situation, reports on slushflow observations from Regobs are also important input to evaluate whether the danger level in the issued bulletin is correct.
3.8 Assessment
Since autumn 2013, regional slushflow early warnings have been issued in Norway, and the practice was officially established in January 2014. Many of these warnings have been in a combined bulletin with debris flows, in weather situations where shallow landslides and debris flows also are relevant hazards. In situations with solid ground frost, or with saturated ground but insufficient water supply for landslide release, a slushflow bulletin has been issued alone.
As examples of the variations in snow depth and water supply causing slushflows, we present four different slushflow situations in more detail (Fig. 6). These situations happened during different dominating snow types, i.e. FC/DH, PP, MF, and OTH respectively. All values are modelled values retrieved from Xgeo (accessed in April 2023).
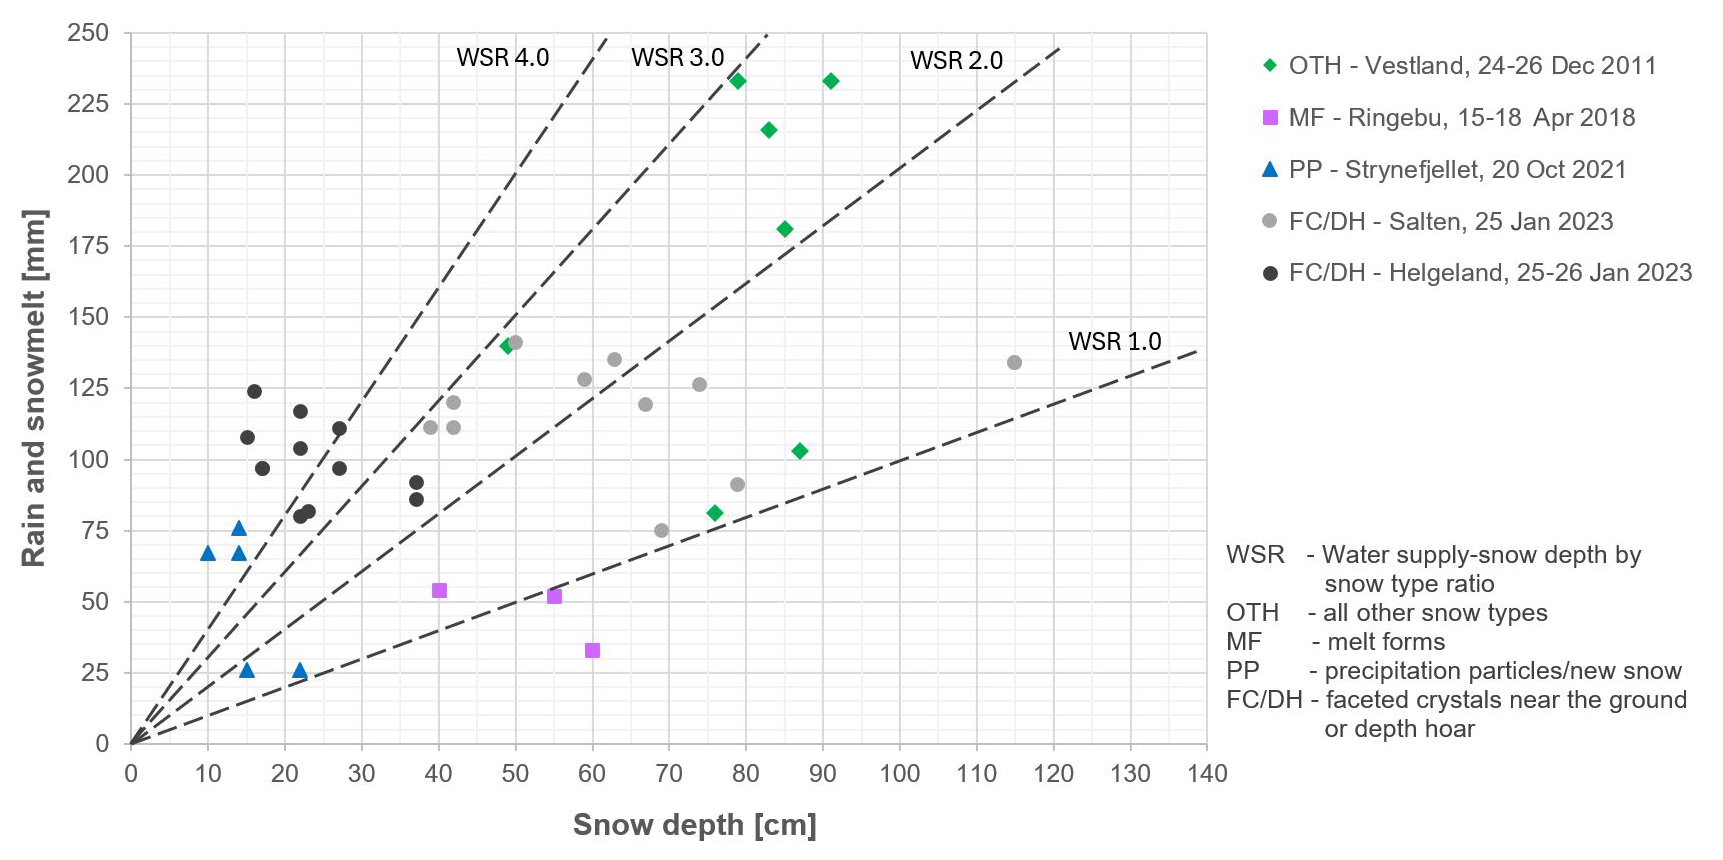
Figure 6An example distribution of slushflows according to snow type, as well as modelled snow depth and water supply (i.e. rain and snowmelt) 1–3 d before the events.
In January 2023, there was intense rain and snowmelt on a snowpack with facets near the ground and depth hoar (FC/DH) in parts of Nordland County. In Salten the 3 d water supply varied between 75 and 141 mm with an average of 119 mm. The snow depth varied between 39 and 115 cm with an average of 68 cm. The maximum water supply of 141 mm corresponded with a snow depth of 50 cm, giving a WSR of almost 3 (red level in Table 2). At higher danger levels most of the lower-level ratios are expected to be represented within the area of hazard as well. For Helgeland the 3 d water supply varied within the range of the values found in Salten for the reported slushflows (80–124 mm). Since the snow depth here was considerably lower (15–37 cm), the WSR was even higher, with more than 4 on average. The values were typically extracted from the most distinct slushflows in the region. In addition, there have been several smaller slushflows possibly with lower ratios.
At Strynefjellet, the slushflows occurred a few days after the area had received snow (PP) on frozen ground. Most of them were reported along the highway Rv15, which runs in a valley in this mountainous area. On 19 October 2021, snowmelt started and was accompanied by rain in the lower areas before the slushflows were released on 20 October 2021. The modelled snow depths for the reported slushflow sites vary from 10 to 22 cm and water supply from 26 to 76 mm. This corresponds to an average WSR of almost 4, with 1.1 as the lowest.
The example from Ringebu shows a situation in spring with melt forms (MF). These situations, with warm and sunny weather, are often challenging to assess because meltwater may accumulate for several days before the slushflow release. Hence, the value that must be taken into consideration is the cumulative water supply (snowmelt) through several days. As the actual in situ snow depth varies, slushflows may release several days in a row depending on when sufficient water supply is reached at different locations. For these three reported slushflows the modelled snowmelt and thus water supply was in the range of 33–54 mm on snow depths of 40–60 cm. There are indications that the modelled snowmelt values in Xgeo do not fully account for the effect of solar radiation, and hence the values can be underestimated in this case.
The windstorm called Dagmar swept over Norway on 24 December 2011 and eventually dissipated on 27 December. Strong winds along with warm temperatures combined with rain and snowmelt led to slushflows in the western part of Norway (Vestland County). The reported slushflows represent snow types other (OTH) than the three situations previously described. Since this happened 2 years prior to the NLFWS and the NAWS, no slushflow or avalanche warnings were issued at the time and there was no organized registration of observed slushflows. The snow type is derived from weather data. Seven slushflows are plotted in Fig. 6, but we consider that the number of slushflows was underreported also for this event. The modelled snowmelt and thus 3 d water supply for the seven events was in the range of 81–233 mm on snow depths of 50–90 cm.
Jaedicke et al. (2013) used 4×4 km2 grid resolution data applied to five major weather situations to study critical meteorological elements for slushflow release. They suggest a minimum of 80 mm water supply per day for snow depths of at least 50 cm in mixed situations with rain and snowmelt, while intense rain situations were set to 50 mm d−1. Their recommendation fits well with our results. They also estimated that as water input intensity increases, the importance of snow properties decreases.
Devoli et al. (2021) investigated the performance of the NLFWS. They found that the NLFWS generally has had a high performance (score) of more than 90 % correct warnings issued, within the limitations discussed. Due to the organizational decision of evaluating slushflows and landslides jointly (Sect. 2.2), only combined statistics are available. However, not all years presented in the score (Devoli et al., 2021) include quality-controlled slushflow database entries (Lunde et al., 2023). Evaluating issued warnings is challenging due to difficulties in event collection and quality control. This is especially true for slushflows (Sect. 3.6). Misclassification and underreporting complicate danger level assessment. Retrieving information from sources other than media and Regobs can improve the assessment but is resource demanding to collect.
We believe that the SEW method is universally applicable to areas that are subject to snowfall, either frequently or infrequently. An advantage of our method is its applicability to other areas with seasonal snow if sufficient hydro-meteorological data are available. It focuses on the interaction between the parameters and therefore enables a more direct adaptation of the method to other areas, also where the large-scale weather systems differ from those that occur in Norway. Conversely, the combined snow type, snow depth, as well as rain and snowmelt data corresponding with observed slushflows in other countries could be used as input to improve the SEW in Norway.
Soil properties at a specific site can be considered relatively permanent in time (more than decades), resulting in specific indexes for different areas, e.g. those used by the NLFWS (Krøgli et al., 2018). The characteristics of snow, however, vary greatly with time, but under otherwise similar hydro-meteorological conditions its properties become comparable across different locations. The SEW is based on the properties of snow, categorized as four different snow types, and the necessary corresponding hydro-meteorological conditions. Although Table 2 is based on modelled values, it gives an indication of the suitable WSR and danger levels, and it could be used for assessments elsewhere. Obviously, some kind of assessment must be done regarding ground properties and snow type in the area. Establishment of a similar SEW service elsewhere could therefore find its place both within meteorological forecasting services, snow avalanche forecasting, or other types of water-related slides and avalanche hazard services.
The main part of our assessment was successfully used by the NVE to forecast slushflow hazard and to time contingency operations, such as trenching the snow cover in exposed terrain, in Longyearbyen and surroundings in the High Arctic archipelago of Svalbard. The forecast was done as an emergency measure for a few seasons starting in 2016.
In December 2022, several communities on the Faroe Islands were hit by slushflows, fortunately without fatalities. The islands are characterized by a thin layer of soil covering the underlying rock, facilitating rapid saturation of the ground when soil frost is absent (Christiansen et al., 2007). The ground could therefore generally be considered as meeting the requirement of an impermeable or saturated ground. Simulated meteorological data from https://www.meteoblue.com/de/wetter/woche/ (last access: 12 June 2023) for Klaksvik 15–19 December 2022 and snowmelt energy balance graphs (Skaugen and Saloranta, 2015) give a rough minimum estimate of the water supply (30 mm rain and 15 mm snowmelt; 45 mm in total) to an estimated mean new-snow depth of ca. 30 cm. Even with this very conservative estimate, the resulting minimum ratio of 1.5 is well within the warning range and satisfactorily reflects the situation. The area of Klaksvik experiences significant local weather variations (Lis Mortensen, personal communication, 6 December 2023) and the values could therefore be regarded as very conservative estimates.
Our approach could also be utilized in areas with rare snowfall, as the snow will most likely be within the new-snow category. On 26 July 2019 a snow/hailstorm hit Col de l'Iseran, France, during the Tour de France bicycle race. The impermeable asphalt was covered by snow and hail that was rapidly saturated by a subsequent intense rain shower. Similar to new snow, hail has poor cohesion between grains. Several slushflows initiated and some also transformed into debris flows as they flowed downhill on unfrozen, debris-covered hillsides. Although this was a rather unpredictable and local event, it shows the importance of the right combinations of factors.
We observe that the initial areas where slushflows occur are often the marginal zones of snow-covered areas as the WSR increases in these areas first. From this we hypothesize that our method has potential for a more tailored use at lower WSR entry values of smaller areas according to the specific need of other communities and areas.
5.1 Conclusion
The regional slushflow early warning (SEW) in Norway, officially operational since January 2014, is probably the first of its kind in the world. SEW is based on previous studies and adapted to, and further developed within, the Norwegian Varsom Xgeo grid-based early warning assessment tool. It has been developed within the existing framework for the forecasting of other natural hazards at the NVE.
A relationship between snow types, snow depths, and water supply to the snowpack, the so called water-supply-snow depth by snow type ratio (WSR), for various levels of regional slushflow hazard, has been established. The WSR for a snow depth of up to 50 cm ranges from 1.0, for the most susceptible snow types at the yellow danger level, to 4.0 for the least susceptible snow types at the red danger level.
An advantage of using the WSR is that improvements can easily and continuously be incorporated in the WSR table as more data become available from new slushflow events. The procedure remains unchanged, which is a great asset to the forecasters who work in rotational duty. Sampling of data on snow type and snow depth on site, when available, and their regional representation by the Xgeo grid values, will also eventually yield ratios that will be directly applicable both locally and regionally. We believe that this novel method for slushflow hazard assessment could be of benefit to other countries as well.
A considerable challenge is that registrations of possible slushflow events are missing in large areas, as demonstrated in the example from the Fauske area. Even though slushflows hitting roads and infrastructure are considered most important, all observations are valuable for statistical input to the development of a slushflow hazard index for a more automated assessment. With the unprecedented availability of satellite images with high temporal and spatial resolution, as well as continuous development of remote sensing techniques, there is great potential for future improvements and automated detection of slushflows. This would also be a benefit to the improvement of numerical modelling of slushflow runout.
5.2 Future perspectives
For the development of early warning of landslides in Norway, there were enough quality-controlled events (>200) with corresponding modelled variables (water supply and soil saturation degree) in Xgeo to establish thresholds using classification trees (Krøgli et al., 2018). Classification trees have also been used to create a tool for operational snow avalanche forecasting (Hendrikx et al., 2014). Øyehaug (2016) attempted to find slushflow hazard thresholds using classification trees, but the dataset at that time was too poor to ensure sufficient reliability for this approach. The increased work during the past years with expanding the number of quality-controlled slushflows and related data has therefore been essential. During the 10 seasons (starting 2013–2014) of SEW, there have been 359 reported slushflows in the country of which 152 (42 %) have been of good to fairly good registration quality (A and B categories) (https://www.skredregistrering.no/, last access: 12 June 2023). The awareness and knowledge about slushflows are increasing, and the crowdsourcing tools are improving and seeing more use. We therefore expect that the dataset will gradually grow and the data quality will continue to improve, thus generally enabling more precise results using statistical methods.
Knowledge about the release area of reported slushflows is important to access the correct corresponding value for hydro-meteorological data and to derive better information on the snow type on site prior to slushflow initiation. This is imperative to future strengthening of the SEW. Improved data will increase the accuracy of the WSR values. Furthermore, they will provide a more robust dataset suited for statistical analysis, e.g. multivariate analysis to develop slushflow hazard indexes according to snow type, snow depth, and danger levels. It is important that a slushflow hazard index continue to incorporate situations with cumulative water supply over time. Several situations have been observed to occur after a period with water supply with relatively low daily levels (Decaulne and Sæmundsson, 2006; Hestnes, 1998; Scherer et al., 1998).
Slushflows are the result of a series of coinciding events. For more reliable estimates of the impact of climate change on slushflows, it is not sufficient to only study how the individual factors will change, but also necessary to assess their combined interaction once more precise climate projections of hydro-meteorological data become available.
Observations and simulations used for Table 2 can be visualized at https://www.xgeo.no/index.html?p=flomogjordskred (NVE, 2024a) and https://regobs.no/ (NVE, 2024c) and downloaded from https://www.skredregistrering.no/ (NVE, 2024e). Photos used for Fig. 4 are available at https://browser.dataspace.copernicus.eu (Copernicus, 2023) and https://regobs.no/ (NVE, 2024c). Slushflow data used for Fig. 5 can be downloaded from https://www.skredregistrering.no/ (NVE, 2024e). Data used for Fig. 6 can be viewed at https://www.xgeo.no/index.html?p=flomogjordskred (NVE, 2024a) and https://www.skredregistrering.no/ (NVE, 2024e).
MS designed the method and wrote the manuscript. HAG and SÅS contributed to the development and testing of the WSR table. All authors reviewed the manuscript.
The contact author has declared that none of the authors has any competing interests.
Publisher's note: Copernicus Publications remains neutral with regard to jurisdictional claims made in the text, published maps, institutional affiliations, or any other geographical representation in this paper. While Copernicus Publications makes every effort to include appropriate place names, the final responsibility lies with the authors.
We are grateful to Erik Hestnes and Christian Jaedicke for fruitful discussions during the first years of method establishment. We also thank Ivar Berthling for helpful comments on an earlier version of the paper, Stein Beldring for clarifications regarding the Xgeo model foundation, and no. 330 squadron of the Royal Norwegian Air Force for providing photos and permission for use. Several students contributed to quality control of the slushflows. The landslide early warning team at the NVE provided valuable input during the years of operation. Thor Parmentier provided proofreading assistance. We thank the reviewers for their valuable comments.
This paper was edited by Yves Bühler and reviewed by Harpa Grimsdottir and Dieter Issler.
Abermann, J., Eckerstorfer, M., Malnes, E., and Hansen, B. U.: A large wet snow avalanche cycle in West Greenland quantified using remote sensing and in situ observations, Nat. Hazards, 97, 517–534, https://doi.org/10.1007/s11069-019-03655-8, 2019.
Barsch, D., Gude, M., Mausbacher, R., Schukraft, G., Schulte, A. and Strauch, D.: Slush stream phenomena – process and geomorphic impact, Supplementband 92, Z. Geomorphol., 39–53, http://geoprodig.cnrs.fr/items/show/80945 (last access: 14 February 2024), 1993.
Beldring, S., Engeland, K., Roald, L. A., Sælthun, N. R., and Voksø, A.: Estimation of parameters in a distributed precipitation-runoff model for Norway, Hydrol. Earth Syst. Sci., 7, 304–316, https://doi.org/10.5194/hess-7-304-2003, 2003.
Bellaire, S., van Herwijnen, A., Mitterer, C., and Schweizer, J.: On forecasting wet-snow avalanche activity using simulated snow cover data, Cold Reg. Sci. Technol., 144, 28–38, https://doi.org/10.1016/j.coldregions.2017.09.013, 2017.
Brun, E., Martin, E., Simon, V., Gendre, C., and Coleou, C.: An energy and mass model of snow cover suitable for operational avalanche forecasting, J. Glaciol., 35, 333–342, https://doi.org/10.3189/S0022143000009254, 1989.
Christiansen, H. H., Blikra, L. H., and Mortensen, L. E.: Holocene slope processes and landforms in the northern Faroe Islands, Earth Environ. Sci. T. Roy. Soc. Edinb., 98, 1–13, https://doi.org/10.3390/geosciences13020030, 2007.
Colbeck, S. C.: Theory of Metamorphism of Wet Snow, CRREL, Special Report, 1–11, https://erdc-library.erdc.dren.mil/jspui/bitstream/11681/5894/1/CRREL-Research-Report-313.pdf (last access: 13 February 2024), 1973.
Copernicus: Sentinel-2 L1C satellite images, https://browser.dataspace.copernicus.eu (last access: 12 June 2023), 2023.
Decaulne, A. and Sæmundsson, T.: Meteorological conditions during slushflow release and their geomorphological impact in Northwestern Iceland: A case study from the Bíldudalur Valley, Geogr. Ann. A, 88, 187–197, https://doi.org/10.1111/j.1468-0459.2006.00294.x, 2006.
Denoth, A.: The pendular-funicular liquid transition and snow metamorphism, J. Glaciol., 28, 357–364, https://doi.org/10.3189/S0022143000011692, 1982.
Devoli, G., Colleuille, H., Sund, M., Wasrud, J.: Seven Years of Landslide Forecasting in Norway – Strengths and Limitations, in: Springer Nature Switzerland AG 2021, Understanding and Reducing Landslide Disaster Risk, ICL Contribution to Landslide Disaster Risk Reduction, edited by: Casagli, N., Tofani, V., Sassa, K., Bobrowsky, P. T., and Takara, K., Springer, 267–274, https://doi.org/10.1007/978-3-030-60311-3_30, 2021.
Eckerstorfer, M., Vickers, H., Malnes, E., and Grahn, J.: Near-real time automatic snow avalanche activity monitoring system using Sentinel-1 SAR data in Norway, Remote Sens.-Basel, 11, 2863, https://doi.org/10.3390/rs11232863, 2019.
Ekker, R., Kvaerne, K., Os, A., Humstad, T., Wartiainen, A., Eide, V., and Hansen, R. K.: RegObs – Public Database for Submitting and Sharing Observations, in: Proceedings of the International Snow Science Workshop, 7–11 October 2013, Grenoble, France, 5 pp., http://arc.lib.montana.edu/snow-science/objects/ISSW13_paper_P5-42.pdf (last access: 13 February 2024), 2013.
Engeset, R. V.: The Norwegian Avalanche Warning Service, in: Proceedings of the International Snow Science Workshop, 7–11 October 2013, Grenoble, France, 10 pp., https://arc.lib.montana.edu/snow-science/objects/ISSW13_paper_P1-19.pdf (last access: 13 February 2024), 2013.
Fierz, C., Armstrong, R. L., Durand, Y., Etchevers, P., Green, E., McClung, D. M., Nishimura, K., Satyawali, P. K., and Sokratov, S. A.: The international classification for seasonal snow on the ground, IHP-VII, Technical Documents in Hydrology N83, IACS Contribution N1, UNESCO-IHP, Paris, France, https://unesdoc.unesco.org/ark:/48223/pf0000186462 (last access: 13 February 2024), 2009.
Föhn, P. M. B.: An overview of avalanche forecasting models and methods, in: 25 years of snow avalanche research, Voss, Norway, 12–16 May 1998, edited by: Hestnes, E., Norwegian Geotechnical Institute, Oslo, Norway, 19–27, https://hdl.handle.net/11250/3082354 (last access: 13 February 2024), 1998.
Gude, M. and Scherer, D.: Snowmelt and slush torrents – preliminary report from a field campaign in Kärkevagge, Swedish Lappland, Geogr. Ann. A, 77, 199-206, https://doi.org/10.2307/521329, 1995.
Gude, M. and Scherer, D.: Snowmelt and slushflows: hydrological and hazard implications, Ann. Glaciol., 26, 381–384, https://doi.org/10.3189/1998AoG26-1-381-384, 1998.
Hendrikx, J., Murphy, M., and Onslow, T.: Classification trees as a tool for operational avalanche forecasting on the Seward Highway, Alaska, Cold Reg. Sci. Technol., 97, 113–120, https://doi.org/10.1016/j.coldregions.2013.08.009, 2014.
Hermanns, R. L., Hansen, L., Sletten, K., Böhme, M., Bunkholt, H. S. S., Dehls, J. F., Eilertsen, R. S., Fischer, L., L'Heureux, J.-S., Hægaas, F., Nordahl, B., Oppikofer, T., Rubensdotter, L., Solberg, I.-L., Stalsberg, K., and Yugsi Molina, F. X.: Systematic geological mapping for landslide understanding in the Norwegian context, in: Landslides and Engineered Slopes: Protecting Society through Improved Understanding, edited by: Eberhardt, E., Froese, C., Turner, K., and Leroueil, S., Taylor & Francis Group, London, 265–271, ISBN 978-0-415-62123-6, 2012.
Hestnes, E.: A contribution to the prediction of slush avalanches, Ann. Glaciol., 6, 1–4, https://doi.org/10.3189/S0260305500007941, 1985.
Hestnes, E.: Slushflow hazard – where, why and when? 25 years of experience with slushflow consulting and research, Ann. Glaciol., 26, 370–376, https://doi.org/10.3189/1998AoG26-1-370-376, 1998.
Hestnes, E. and Bakkehøi, S.: Observations on water level fluctuations in snow due to rain and snowmelt, in: International conference on avalanches and related subjects, Proceedings, Kirovsk, Murmansk, Production Association “Apatit”, 2–6 September 1996, Kirovsk, Russia, 115–120, https://hdl.handle.net/11250/3099104 (last access: 13 February 2024), 1996.
Hestnes, E. and Bakkehøi, S., Slushflow hazard prediction and warning, Ann. Glaciol., 38, 45–51, https://doi.org/10.3189/172756404781814889, 2004.
Hestnes, E. and Kristensen, K.: The diversity of large slushflows illustrated by selected cases, in: Proceedings of the International Snow Science Workshop, 17–22 October 2010, Squaw Valley, CA, https://arc.lib.montana.edu/snow-science/item/397 (last access: 13 February 2024), 2010.
Hestnes, E. and Sandersen, F.: Avalanche formation, movement and effects, IAHS Publ. N162, https://hdl.handle.net/11250/3083732 (last access: 13 February 2024), 1987.
Hestnes, E. and Sandersen, F.: The main principles of slushflow hazard mitigation, in: International Symposium Interpraevent 2000, Villach, Austria, Tagungspublikation, Band 2, 267–280, https://www.interpraevent.at/palm-cms/upload_files/Publikationen/Tagungsbeitraege/2000_2_267.pdf (last access: 13 February 2024), 2000.
Hestnes, E., Bakkehøi, S., Sandersen, F., and Andresen, L.: Meteorological significance to slushflow release, NGI 582000-5, 18 pp., 1987.
Hestnes, E., Bakkehøi, S., Sandersen, F., and Andresen, L.: Weather and snowpack conditions essential to slushflow release and downslope propagation, in: Proceedings of the International Snow Science Workshop, Snowbird, 30 October–3 November 1994, UT, 40–57, https://hdl.handle.net/11250/3083732 (last access: 13 February 2024), 1994.
Hestnes, E., Bakkehøi, S., and Kristensen, K.: Slushflow formation, flow regimes and consequences (short Version), in: Proceedings of the international Snow Science Workshop, 16–21 September 2012, Anchorage, Alaska, 414–419, https://arc.lib.montana.edu/snow-science/objects/issw-2012-414-419.pdf (last access: 13 February 2024), 2012.
Hisdal, H. (Ed.), Bjordal, H., Colleuille, H., Engeset, R. V., Helgås, G., Odberg, M. M., Sivle, A., and Steinvik, K.: Evaluering av snø- og jordskredvarslingen, NVE report 38-2017, https://publikasjoner.nve.no/rapport/2017/rapport2017_38.pdf (last access: 24 April 2023), 2017.
Jaedicke, C., Lied, K., and Kronholm, K.: Integrated database for rapid mass movements in Norway, Nat. Hazards Earth Syst. Sci., 9, 469–479, https://doi.org/10.5194/nhess-9-469-2009, 2009.
Jaedicke, C., Høydal, Ø. A., and Midtbø, K. H.: Identification of slushflow situations from regional weather models, in: Proceedings of the International Snow Science Workshop, 7–11 October 2013, Grenoble, France, 177–182, https://hdl.handle.net/11250/3083329 (last access: 13 February 2024), 2013.
Kobayashi, S., Izumi, K., and Kamiishi, I.: Slushflow disasters in Japan and its characteristics, in: Proceedings of the International Snow Science Workshop, 30 October–3 November 1994, UT, 657–665, https://arc.lib.montana.edu/snow-science/objects/issw-1994-657-665.pdf (last access: 13 February 2024), 1994.
Krøgli, I. K., Devoli, G., Colleuille, H., Boje, S., Sund, M., and Engen, I. K.: The Norwegian forecasting and warning service for rainfall- and snowmelt-induced landslide, Nat. Hazards Earth Syst. Sci., 18, 1427–1450, https://doi.org/10.5194/nhess-18-1427-2018, 2018.
Li, H., Xu, C.-Y., and Beldring, S.: How much can we gain with increasing model complexity with the same model concepts?, J. Hydrol., 527, 858–871, https://doi.org/10.1016/j.jhydrol.2015.05.044, 2015.
Lunde, E. N., Morken, E., Devoli, G., and Sund, M.: Registrerte og kontrollerte sørpeskred i Norge, Statistisk oversikt og metodegrunnlag, NVE report 8/2023, https://publikasjoner.nve.no/rapport/2023/rapport2023_31.pdf (last access: 13 February 2024), 2023.
Malnes, E., Eckerstorfer, M., and Sund, M.: Deteksjon av sørpeskred med radarsatellitt. Utredning av muligheter basert på SAR data fra reelle sørpeskred, NORUT rapport 02/2016, https://norceresearch.brage.unit.no/norceresearch-xmlui/bitstream/handle/11250/2735159/Norut_Tromso_rapport_11-2015.pdf (last access: 3 June 2023), 2016.
Mitterer, C. and Schweizer, J.: Analysis of the snow-atmosphere energy balance during wet-snow instabilities and implications for avalanche prediction, The Cryosphere, 7, 205–216, https://doi.org/10.5194/tc-7-205-2013, 2013.
Motovilov, Y. G., Gottschalk, L., Engeland, K., and Rodhe, A.: Validation of a distributed hydrological model against spatial observations, Agr. Forest Meteorol., 98–99, 257–277, https://doi.org/10.1016/S0168-1923(99)00102-1, 1999.
Nobles, L. H.: Slush avalanches in Northern Greenland and the classification of rapid mass movements, Ass. Int. Hydrol. Sci. Publ., 69, 267–272, 1966.
NVE: Decision-making webtool Varsom Xgeo, https://www.xgeo.no/index.html?p=flomogjordskred (last access: 13 February 2024), 2024a.
NVE: Development and limitations of the maps in Xgeo, https://senorge.no/Models?lang=no (last access: 13 May 2023), 2024b.
NVE: Slushflow observations, Varsom Regobs, https://regobs.no/ (last access: 13 February 2024), 2024c.
NVE: Norwegian avalanche, flood and landslide (including slushflows) hazard warnings, http://www.varsom.no/ (last access: 13 February 2024), 2024d.
NVE: Slushflow data, https://www.skredregistrering.no/ (last access: 13 February 2024), 2024e.
Onesti, L. and Hestnes, E.: Slush-flow questionnaire, Ann. Glaciol., 13, 226–230, https://doi.org/10.3189/S0260305500007941, 1989.
Onesti, L. J.: Meteorological conditions that initiate slushflow in the Central Brooks Range, Alaska, Ann. Glaciol., 6, 23–25, https://doi.org/10.3189/1985AoG6-1-23-25, 1985.
Øyehaug, G.: Hydrometeorologiske tersklar for sørpeskredfare, MSc thesis Geohazards, Institute for Geosciences, Uni. of Oslo, Oslo, Norway, 1–117, https://www.duo.uio.no/bitstream/handle/10852/54594/-yehaug_Gaute_B_master_des_2016_lev.pdf (last access: 3 June 2023), 2016.
Pérez-Guillén, C., Tsunematsu, K., Nishimura, K., and Issler, D.: Seismic location and tracking of snow avalanches and slush flows on Mt. Fuji, Japan, Earth Surf. Dynam., 7, 989–1007, https://doi.org/10.5194/esurf-7-989-2019, 2019.
Rapp, A.: Recent developments of mountain slopes in Kärkevagge and surroundings, northern Scandinavia, Geogr. Ann., 42, 71–200, https://doi.org/10.1080/20014422.1960.11880942, 1960.
Saloranta, T. M.: Operational snow mapping with simplified data assimilation using the seNorge snow model, J. Hydrol., 538, 314–325, https://doi.org/10.1016/j.jhydrol.2016.03.061, 2016.
Scherer, D., Gude, M., Gempeler, M., and Parlow, E.: Atmospheric and hydrological boundary conditions for slushflow initiation due to snowmelt, Ann. Glaciol., 26, 377–380, https://doi.org/10.3189/1998AoG26-1-377-380, 1998.
Skaugen, T. and Saloranta, T.: Simplified energy-balance snowmelting model, NVE report 31-2015, 1–27, https://publikasjoner.nve.no/rapport/2015/rapport2015_31.pdf (last access: 13 February 2024), 2015.
Skuset, S.: Utløysing av sørpeskred i ulike snøtypar, MSc thesis, Institute for Geosciences and Petroleum, Norwegian University of Science and Technology, 1–117, https://ntnuopen.ntnu.no/ntnu-xmlui/handle/11250/2564441 (last access: 3 June 2023), 2018.
Statens vegvesen: Flom- og sørpeskred (Debris flows and slushflows), N-V139, Statens vegvesen, Oslo, Norway, https://vegvesen.brage.unit.no/vegvesen-xmlui/handle/11250/3073176 (last access: 3 June 2023), 2014.
Techel, F. and Pielmeier, C.: Point observations of liquid water content in wet snow – investigating methodical, spatial and temporal aspects, The Cryosphere, 5, 405–418, https://doi.org/10.5194/tc-5-405-2011, 2011.
Tómasson, G. G. and Hestnes, E.: Slushflow hazard and mitigation in Vesturbyggd, Northwest Iceland, Nord. Hydrol., 31, 399–410, https://doi.org/10.2166/nh.2000.0024, 2000.
UN/ISDR: Developing Early Warning Systems: a checklist, EWC III 3rd international Conference on Early Warning, From Concept to Action, UN/ISDR, https://www.unisdr.org/2006/ppew/info-resources/ewc3/checklist/English.pdf (last access: 5 July 2023), 2006.
Vionnet, V., Brun, E., Morin, S., Boone, A., Faroux, S., Le Moigne, P., Martin, E., and Willemet, J. M.: The detailed snowpack scheme Crocus and its implementation in SURFEX v7.2, Geosci.Model Dev., 5, 773–791, https://doi.org/10.5194/gmd-5-773-2012, 2012.
Washburn, A. L.: Geocryology – A survey of periglacial processes and environments, Quaternary Research Center, University of Washington, Halsted Press, John Wiley & Sons Inc., New York, ISBN 0-470-26582-5, 1980.
Washburn, A. L. and Goldthwait, R. P.: Slushflows, Bull. Geol. Soc. Am., 69, 1657–1658, 1958.