the Creative Commons Attribution 4.0 License.
the Creative Commons Attribution 4.0 License.
 | 03 Apr 2024
Surface rupture kinematics of the 2020 Mw 6.6 Masbate (Philippines) earthquake determined from optical and radar data
Khelly Shan Sta. Rita
Sotiris Valkaniotis
Alfredo Mahar Francisco Lagmay
Optical correlation, interferometry, and field investigation of laterally offset features were undertaken to analyze the kinematics of the 2020 Mw 6.6 Masbate earthquake. Ground displacement fields show a peak left-lateral offset of 0.6 m corresponding to Mw 6.6 geodetic moment magnitude, with an average 0.4 m left-lateral slip. The slip distributions also indicate a single asperity located ∼200 m SE of the centroid. Post-seismic deformation estimates from interferometry highlight an at least 0.14 m left-lateral offset consistent with a Mw 6.2 post-seismic moment magnitude. The total and post-seismic slip distributions coincide with each other, with both peaks adjacent to the centroid. Slip measurements and the ∼28.2–41 km rupture length estimates from field and remote sensing datasets characterize the Masbate segment as capable of producing long ruptures with significant offsets despite the presence of interseismic creep. Post-seismic interferograms resolved the rupture far better than optical correlation, which was degraded due to high-amplitude noise from sensor and environmental sources. Nevertheless, this review of the 2020 Mw 6.6 Masbate earthquake provides a comprehensive slip measurement of the surface rupture and demonstrates the presence of two transtensional basins in the Masbate province, revealing new insights into the seismic hazard and seismotectonic setting of the central Philippines.
- Article
(12855 KB) - Full-text XML
-
Supplement
(40723 KB) - BibTeX
- EndNote


Philippine earthquake geodesy traditionally relies on interferometry, a global navigation satellite system (GNSS), waveform modeling, and field investigation (Velasco et al., 1996; Yen et al., 2018). The techniques have been used to investigate the rupture kinematics of significant earthquakes in the Philippines. Earthquake kinematics describes the three-dimensional motion of the ground surface during an earthquake event and is characterized by the spatial distribution of ground displacements along the fault rupture. It is crucial in seismic hazard assessments since it can be used in estimating the possible ground shaking intensity and fault rupture potential of a particular location (Morell et al., 2020).
A Mw 6.6 earthquake jolted the island of Masbate on 18 August 2020 and was followed by a M 5.7 aftershock in about 10 min (Aurelio et al., 2021). In the span of 32 h after the mainshock, 244 aftershocks were recorded ranging from M 1.6 to M 5.1 (PHIVOLCS, 2020). The focal mechanism solution of the mainshock illustrates a strike-slip movement with hypocenter at 7 km S29° E of Cataingan and a depth of 21 km (PHIVOLCS, 2020). The earthquake resulted in devastating losses in terms of human lives and properties (NDRRMC, 2020). The heavy impacts of the earthquake warrant a thorough evaluation of the event to support the assessment of seismic hazards to mitigate losses and damages for the next earthquakes on the island of Masbate.
Preliminary assessments using Sentinel-1 interferograms showed butterfly-shaped fringes and phase shifts between 3 and 30 cm along the descending track line of sight (LOS) (PHIVOLCS, 2020) and >15 cm LOS ground deformation along the ascending track (Tiongson and Ramirez, 2022). The ascending interferograms used a 12 d (15–27 August 2020) temporal baseline, resulting in low phase coherence of the InSAR pairs. Spectral analysis of seismic waveforms (Simborio et al., 2022) outlined a 3.0 km s−1 rupture velocity beginning on a shallow region of the southern fault plane with peak ground displacements ≥ 1.0 m.
We introduce the application of optical image correlation (OIC) in the Philippines to highlight its importance when used alongside interferometry. The simultaneous application of OIC and InSAR provides complementary information on the decorrelated portions of the coseismic interferogram to improve the understanding of the 2020 Mw 6.6 Masbate earthquake since the event is still relatively unstudied compared with the 2003 Ms 6.2 event that occurred on the same fault segment (Besana and Ando, 2005; Lai et al., 2019; Tsutsumi and Perez, 2011, 2013).
This study presents first-order ground displacements and post-seismic slip from the Masbate segment of the Philippine Fault (PF). The resulting slip distributions and surface rupture parameters refine our understanding of the Masbate segment, shed light on the relationship of rupture initiation with mesoscale structures, topography, and bedrock lithology, as well as provide insights into the underlying faulting mechanisms. The accompanying morphological interpretations of surface ruptures highlight the known stress regime in Masbate, expanding upon our understanding of the structural characteristics of the central Philippines. These findings contribute to the enhancement of earthquake models for use in seismic hazard assessments in the region.
The Philippines is a region of active tectonics and volcanism arising from the interaction of the Sunda block of the Eurasian plate with the Philippine Sea Plate (Fig. 1a) (Aurelio, 2000a; Bird, 2003). Oppositely dipping subduction margins flank the archipelago: the east-dipping Manila, Sulu, Negros, and Cotabato trenches in the west; and the west-dipping Philippine Trench and East Luzon Trough in the east (Aurelio, 2000a; Barrier et al., 1991). The eastern margin accommodates the northwesterly advance of the Philippine Sea Plate at a rate of 3–9 cm yr−1 relative to the Eurasian plate (Seno, 1977), while the western end consumes the subducting Sunda block moving at a rate of 1 cm yr−1 eastward relative to the Eurasian plate (Chamot-Rooke and Le Pichon, 1999). The interaction and oblique convergence of the tectonic plates that bind the country resulted in the formation of the approximately 1200 km-long left-lateral Philippine Fault in the Middle Miocene (Allen, 1962; Fitch, 1972; Tsutsumi and Perez, 2013; Pinet and Stephan, 1990) as the Philippine Sea Plate's motion shifted counterclockwise from northward to a northwestward direction (Aurelio, 2000a). An Association of Southeast Asian Nations (ASEAN)-wide GPS network assessment (Aurelio et al., 1997; Aurelio, 1998, 2000b; Rangin et al., 1999) measured a 2–3 cm yr−1 current slip rate throughout the fault zone. An approximately 580 m curved section of the PF traverses the central Philippines from the southeastern portion of Quezon Province to Leyte Island (Fig. 1b). Coined the Philippine Fault Bend, the deformation zone in the midsection of the PF is characterized by a N50° W fault strike and forms a releasing bend structure relative to the approximately N20° W general strike north and south of the central section (Lagmay et al., 2005).
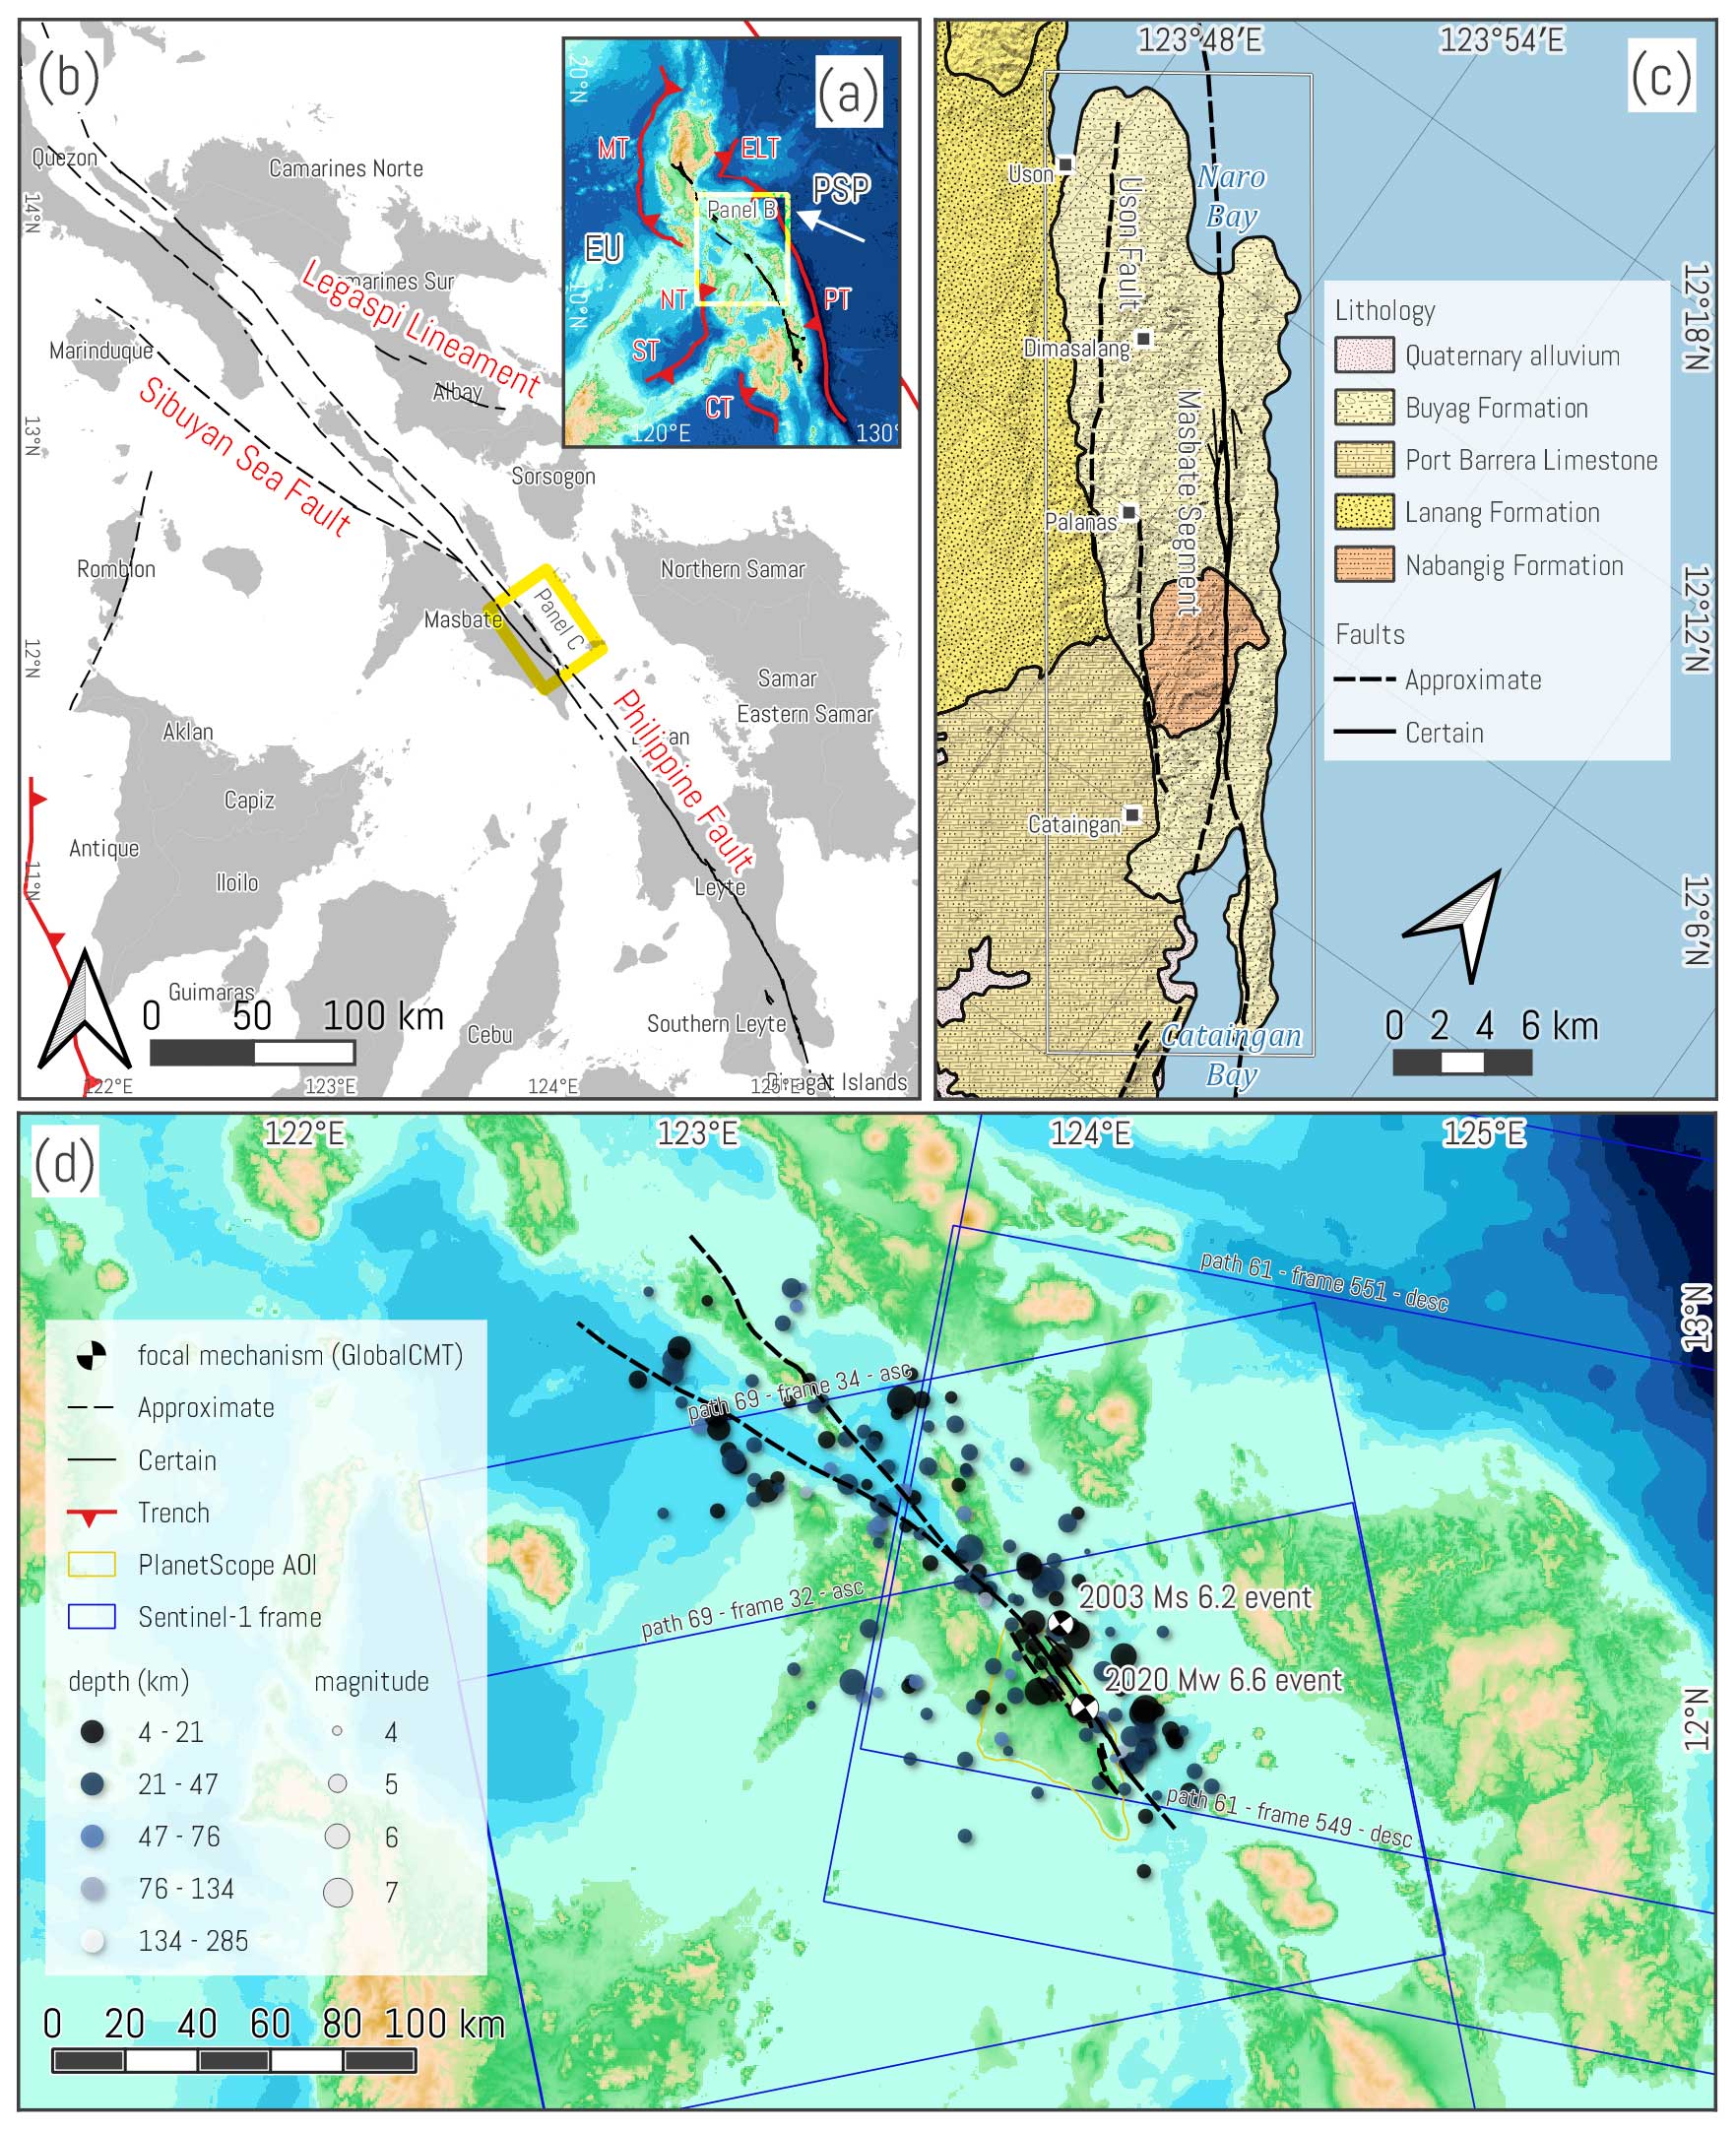
Figure 1Panel (a) shows the regional geologic setting of the Philippine archipelago with the adjacent Philippine Sea Plate (PSP) and Eurasian plate (EU). The large-scale tectonic features are also depicted, including the east-dipping subduction zones – the Manila Trench (MT), Negros Trench (NT), Cotabato Trench (CT), and Sulu Trench (ST) – on the western side; west-dipping trenches – East Luzon Trough (ELT) and Philippine Trench (PT) – on the eastern side; and the resultant Philippine Fault running across the archipelago. The white arrow indicates the movement direction of the Philippine Sea Plate. Panel (b) shows the major structural features directly affecting Masbate including the central Philippine Fault Zone (Guinayangan, Masbate, and Leyte segments), their approximate offshore projections, the Legaspi Lineament, and the Sibuyan Sea Fault. Panel (c) shows the southeastern Masbate area with the involved lithologic units and traces of the Philippine Fault and Uson Fault. The black–white boundary box highlights the primary region of interest. (Lithology adapted from Manalo et al., 2015; trace of active structural features adapted from PHIVOLCS.) Panel (d) shows the historical seismicity of Masbate Island from 1917 to 2022 with the moderate earthquakes (M 4–6.6) with focal mechanism solutions of the February 2003 and August 2020 events. (Background topography and bathymetry from GEBCO; earthquake data acquired from USGS-NEIC; focal mechanism solutions sourced from GlobalCMT.)
2.1 Geology of Masbate
The PF and Sibuyan Sea Fault (SSF) are the prominent structural features of Masbate Island (PHIVOLCS, 2020; Tsutsumi and Perez, 2013) (Fig. 1b). The Masbate segment of the PF extends from Burias and Ticao islands in the north, and strikes N40° W as it crosses the southeastern tip of the mainland (Aurelio et al., 1991). In terms of morphology, it spans approximately 30 km along a linear trough parallel to the coastline (PHIVOLCS, 2020; Tsutsumi and Perez, 2013). Complexities in the fault geometry include a fault complexity between 12°08′ N and 12°06′ N latitude, and a bifurcation around 12°03′ N. The northeastern leg of the bifurcated structure is curved at 12° N and connects to the Leyte segment, whereas the southwestern leg strikes at N20° W and appears to terminate at Cataingan Bay (PHIVOLCS, 2018). Offshore seismic profiling in the bay (Llamas and Marfito, 2022) shows left-stepping faults and negative flower structures that denote transtensional deformation in the region.
The SSF is another left-lateral strike-slip fault with a normal component (Aurelio et al., 1991; Bischke et al., 1988). It runs parallel to the PF in mainland Masbate and then deflects westward into the Sibuyan Sea (Fig. 1b). The extensional component associated with the SSF is represented by tilted blocks formed from normal faulting and bathymetric depressions in the Sibuyan Sea (Bischke et al., 1990). The SSF influences the local stress regime expressed by alternating extensive and compressive structures, due to its interaction with the PF (Aurelio et al., 1997). The SSF was also described as separate from the PF and is a manifestation of the transtensional deformation with the 3σ oriented perpendicular to the PF (Aurelio, 1992; Aurelio et al., 1991). GPS measurements further substantiate this regime on the local scale (Bacolcol, 2003; Duquesnoy et al., 1994).
Ophiolites comprise the basement complex of Masbate Island and are unconformably overlain by a series of sedimentary and igneous units (Fig. 1c). The Cretaceous Panguiranan Chert represents the pelagic cover of the ophiolite sequence (Aurelio and Peña, 2010). The Late Oligocene Nabangig Formation is the oldest lithologic unit underlying the area of interest and is composed of a clastic sequence with recrystallized limestone. The Middle Miocene Lanang Formation lies unconformably over the Nabangig Formation and consists of highly deformed sedimentary rocks ranging from conglomerates to mudstones (Manalo et al., 2015). The majority of the study area is underlain by the Miocene–Pliocene Buyag Formation. It overlies the Lanang Formation and is composed of conglomerates with fine-grained igneous clasts and interbedded shale and siliceous sediments. The largely coralline Pleistocene Port Barrera Limestone is the youngest stratigraphic unit in the province (Porth et al., 1989).
2.2 Seismotectonics of the Masbate segment
Bacolcol (2003) and Lai et al. (2019) described the Masbate segment as the transition zone between the northern and southern segments of the central PF. Historical earthquake information revealed recurrence intervals from as short as 5 years (Besana and Ando, 2005) for moderate magnitude (M 5.5–6.2) earthquakes to as much as 238 years using slip deficit rates between the 2003 event and interseismic velocities (Lai et al., 2019). A marked absence of strong events beyond M>7.0 in the past four centuries is also apparent (Bautista and Oike, 2000; SEASEE, 1985). A map (Fig. 1d) of moderate seismicity between 1917 and 2022 culled from the United States Geological Survey – National Earthquake Information Center (USGS-NEIC) (USGS, 2017) highlights the earthquake epicenters related to the Masbate segment and the SSF during this period. Observations and discussions on the 2003 event led Besana and Ando (2005) to characterize the seismic activity of the segment as capable of generating moderate to large events that produce ruptures larger than expected and can be succeeded by post-seismic deformation or creep.
The 2003 Ms 6.2 event is the previous notable earthquake in the province that produced an approximately 20 km-long rupture with the epicenter in the northern portion of the Masbate segment. It was accompanied by either post-seismic deformation or a slow creep component (Besana and Ando, 2005; Lai et al., 2019; Tsutsumi and Perez, 2011, 2013). Kinematic offsets were measured at a maximum of 47–50 cm, which is beyond the expected peak offsets for a M 6.2 earthquake, based on empirical magnitude scaling equations (Wells and Coppersmith, 1994). Lai et al. (2019) attributed the post-seismic deformation to the significant excess moment released by the earthquake. Aftershock analysis of earthquakes within 2 months of the 2003 temblor showed a cluster of M 5.0–6.0 epicenters at the southern portion of the fault. The aftershocks were accompanied by the development of hairline fractures near Cataingan that expanded to as much as 8 mm (Besana and Ando, 2005). In addition, Bacolcol et al. (2005) recorded 10 cm GPS deviations within 6 months after the mainshock, supporting observations of post-seismic deformation. Coulomb stress transfer (CST) analysis showed that the 2003 event raised the stress in the southern part of Masbate by approximately 0.3–1 bar (Legaspi et al., 2018), which is presumed to have reduced the time elapsed before the 2020 earthquake.
The apparent absence of strong earthquakes (M>7.0) in the Masbate segment can be explained by the presence of creep (Scholz, 1998). Aseismic slip during interseismic periods was measured at 2.3±1.1 cm yr−1 through GPS (Bacolcol et al., 2005) and 0.7–1.7 cm yr−1 through alignment arrays (Tsutsumi et al., 2016). A moderate background seismicity can be observed along the Masbate segment (Fig. 1d) and is further described in PHIVOLCS reports (PHIVOLCS, 1999).
The surface displacement components of the Masbate earthquake were measured using optical and radar satellite data. Pixel offset tracking on PlanetLabs image pairs with 3.125 m resolution was accomplished using the mm2dpossism binary of the MicMac program (Rosu et al., 2015) for the horizontal ground displacements. Interferometric Synthetic Aperture Radar (InSAR) was done using the European Space Agency's (ESA) Sentinel-1A/B radar data with a 6 d temporal baseline (14–21 August 2020) for the coseismic slip and a 31 d (20 August to 20 September 2020) time series after the mainshock for the post-seismic deformation following the rapid aftershock decay duration.
3.1 Spatiotemporal seismicity analysis
Earthquake data from 2019 to 2021 with magnitudes M≥1.0 were gathered from the PHIVOLCS online earthquake archive (Sect. S3 in the Supplement). Foreshock and aftershock patterns were analyzed by plotting the distribution of both magnitude and frequency in time and space. All seismicity information was primarily used to define the earthquake periods (Farrell et al., 2009; Mogi, 1963) related to the 2020 Masbate event. Focal mechanism solutions acquired from PHIVOLCS, USGS, and GlobalCMT were used for the analysis of the nodal planes present in the double couple as a seismological basis of the sense of movement of the fault plane responsible for the mainshock.
3.2 Optical image correlation
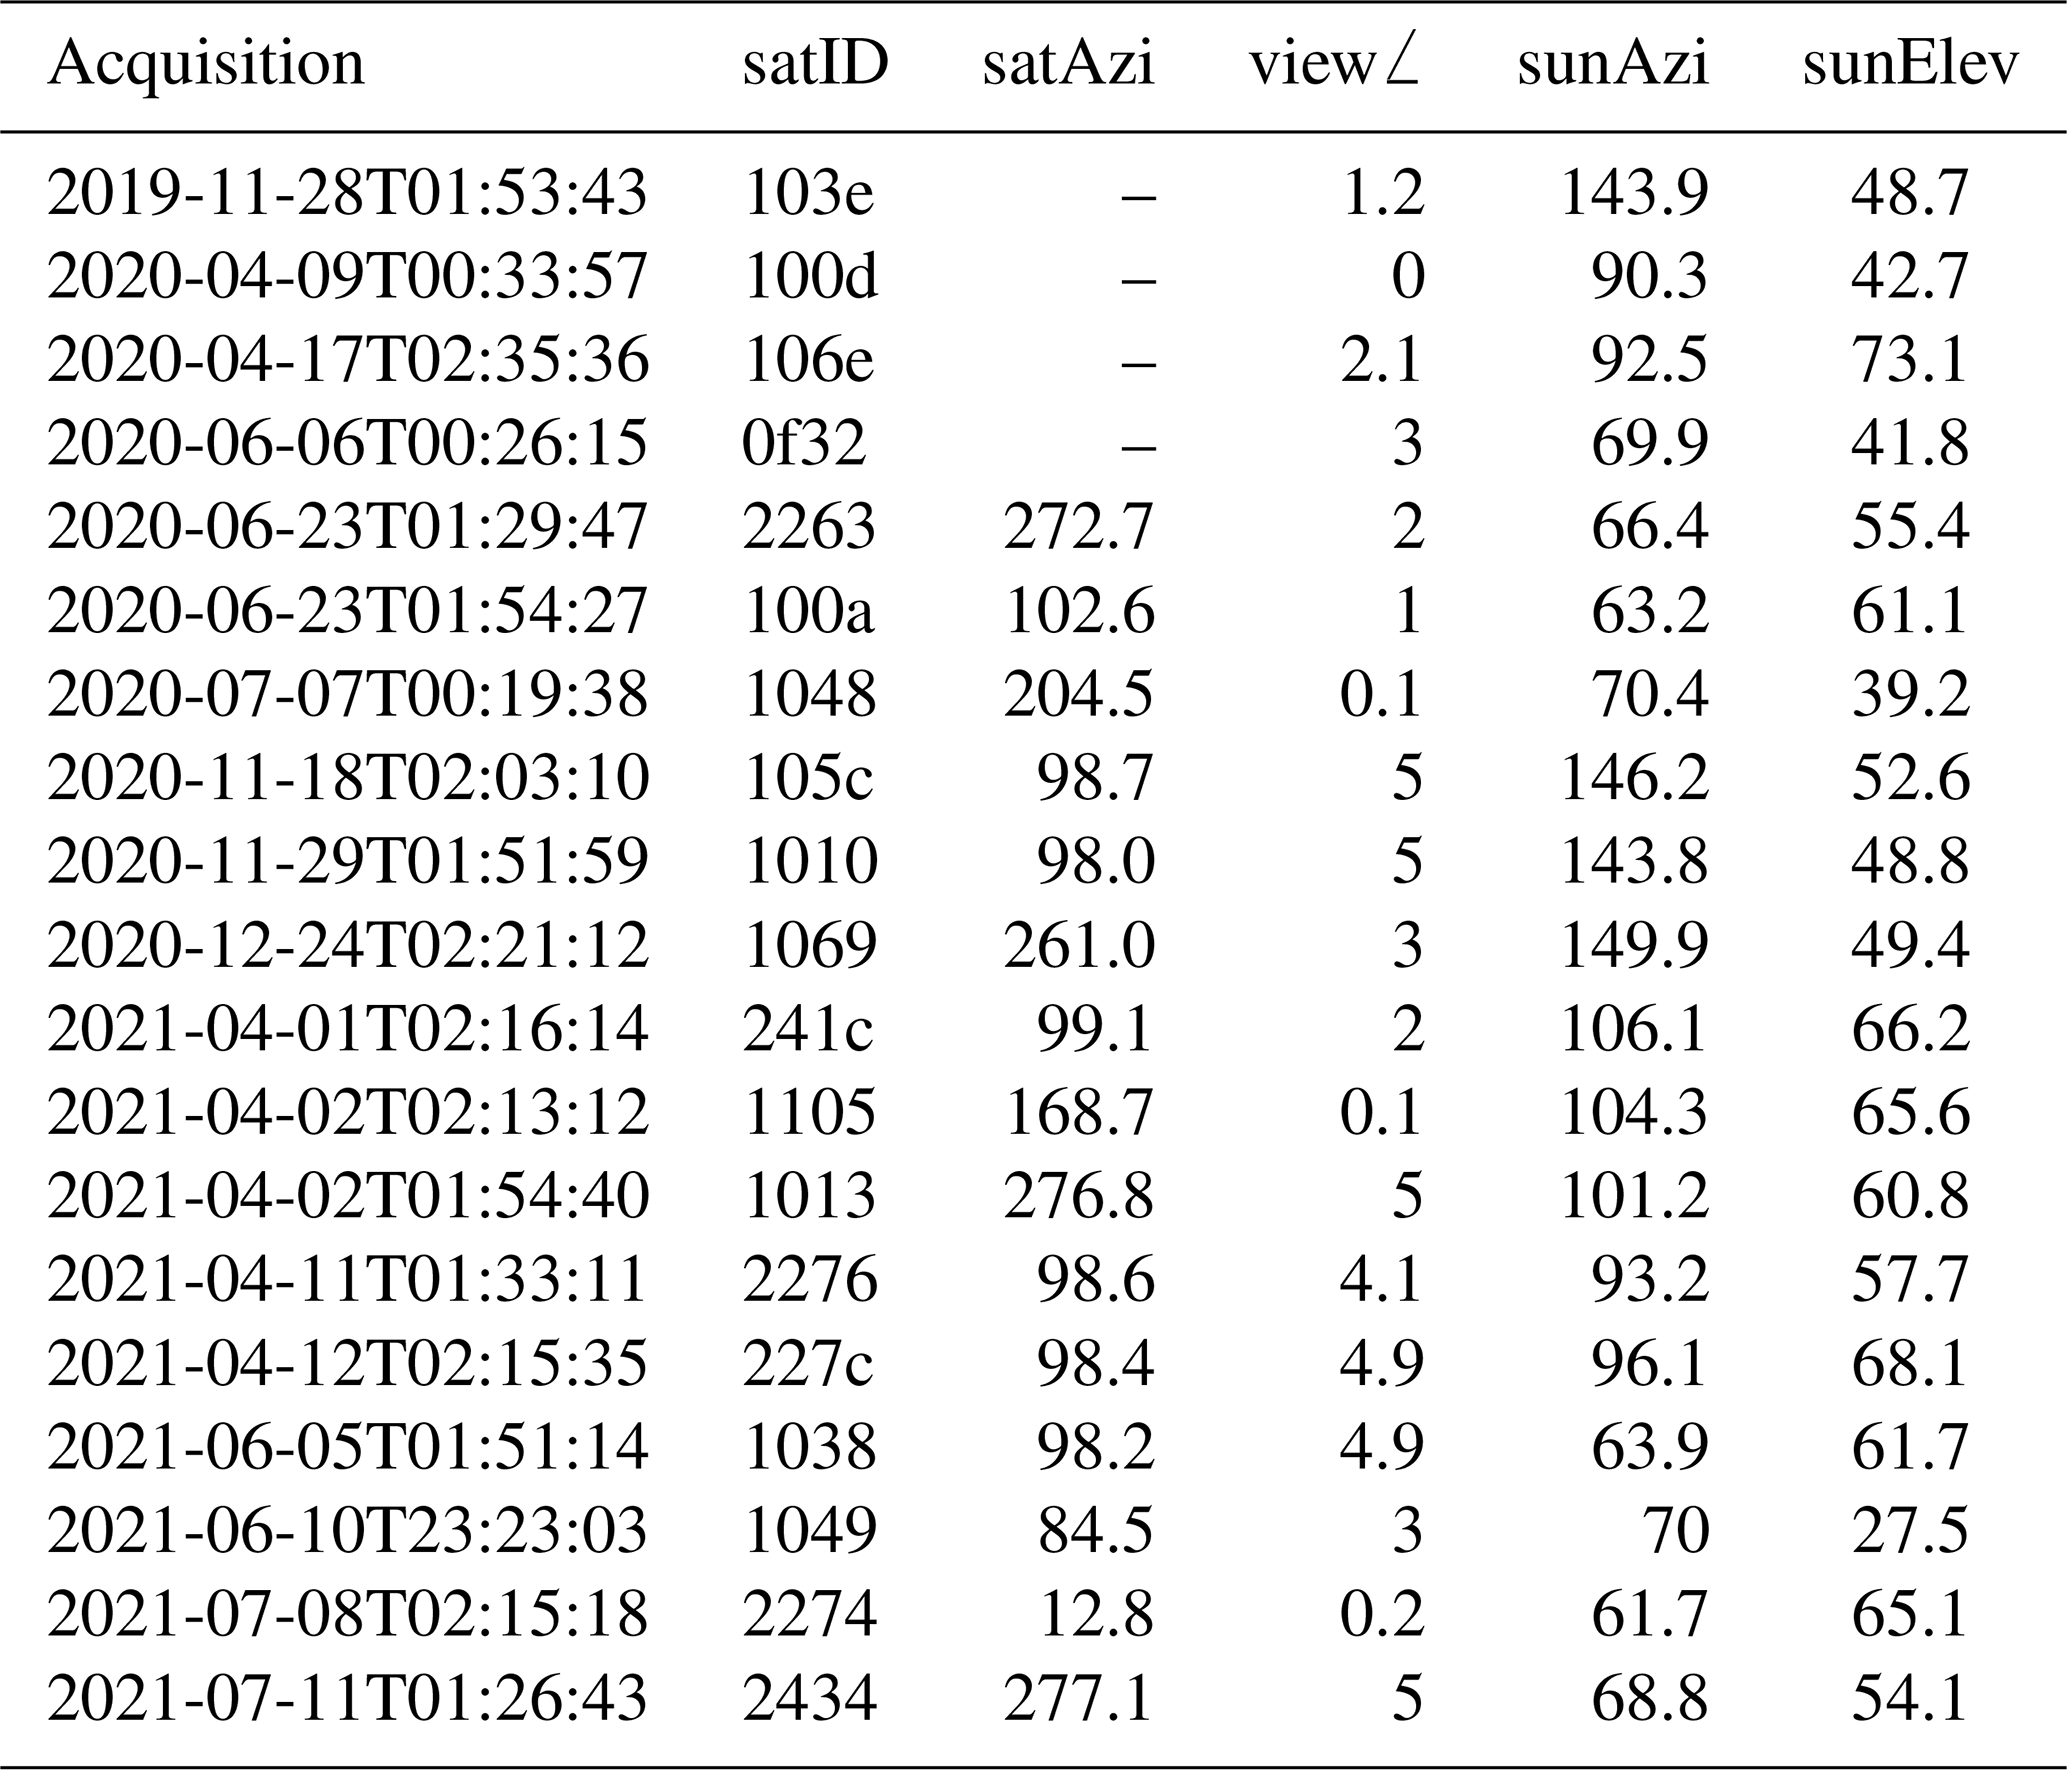
PlanetScope satellite imagery (Planet Team, 2017) was the primary dataset due to the daily data acquisition and high spatial resolution of the available products. Images with the least cloud cover covering the region of interest (Fig. 1c) with a maximum 15 % obstruction threshold were selected. Ortho Tile products with a 3.125 m ground resolution, processed at level 3A and corrected for surface reflectance (SR), were utilized. When Ortho Tile products were unavailable, we used Ortho Scene products downsampled to 3.125 m ground resolution and corrected for top-of-atmosphere (TOA) reflectance.
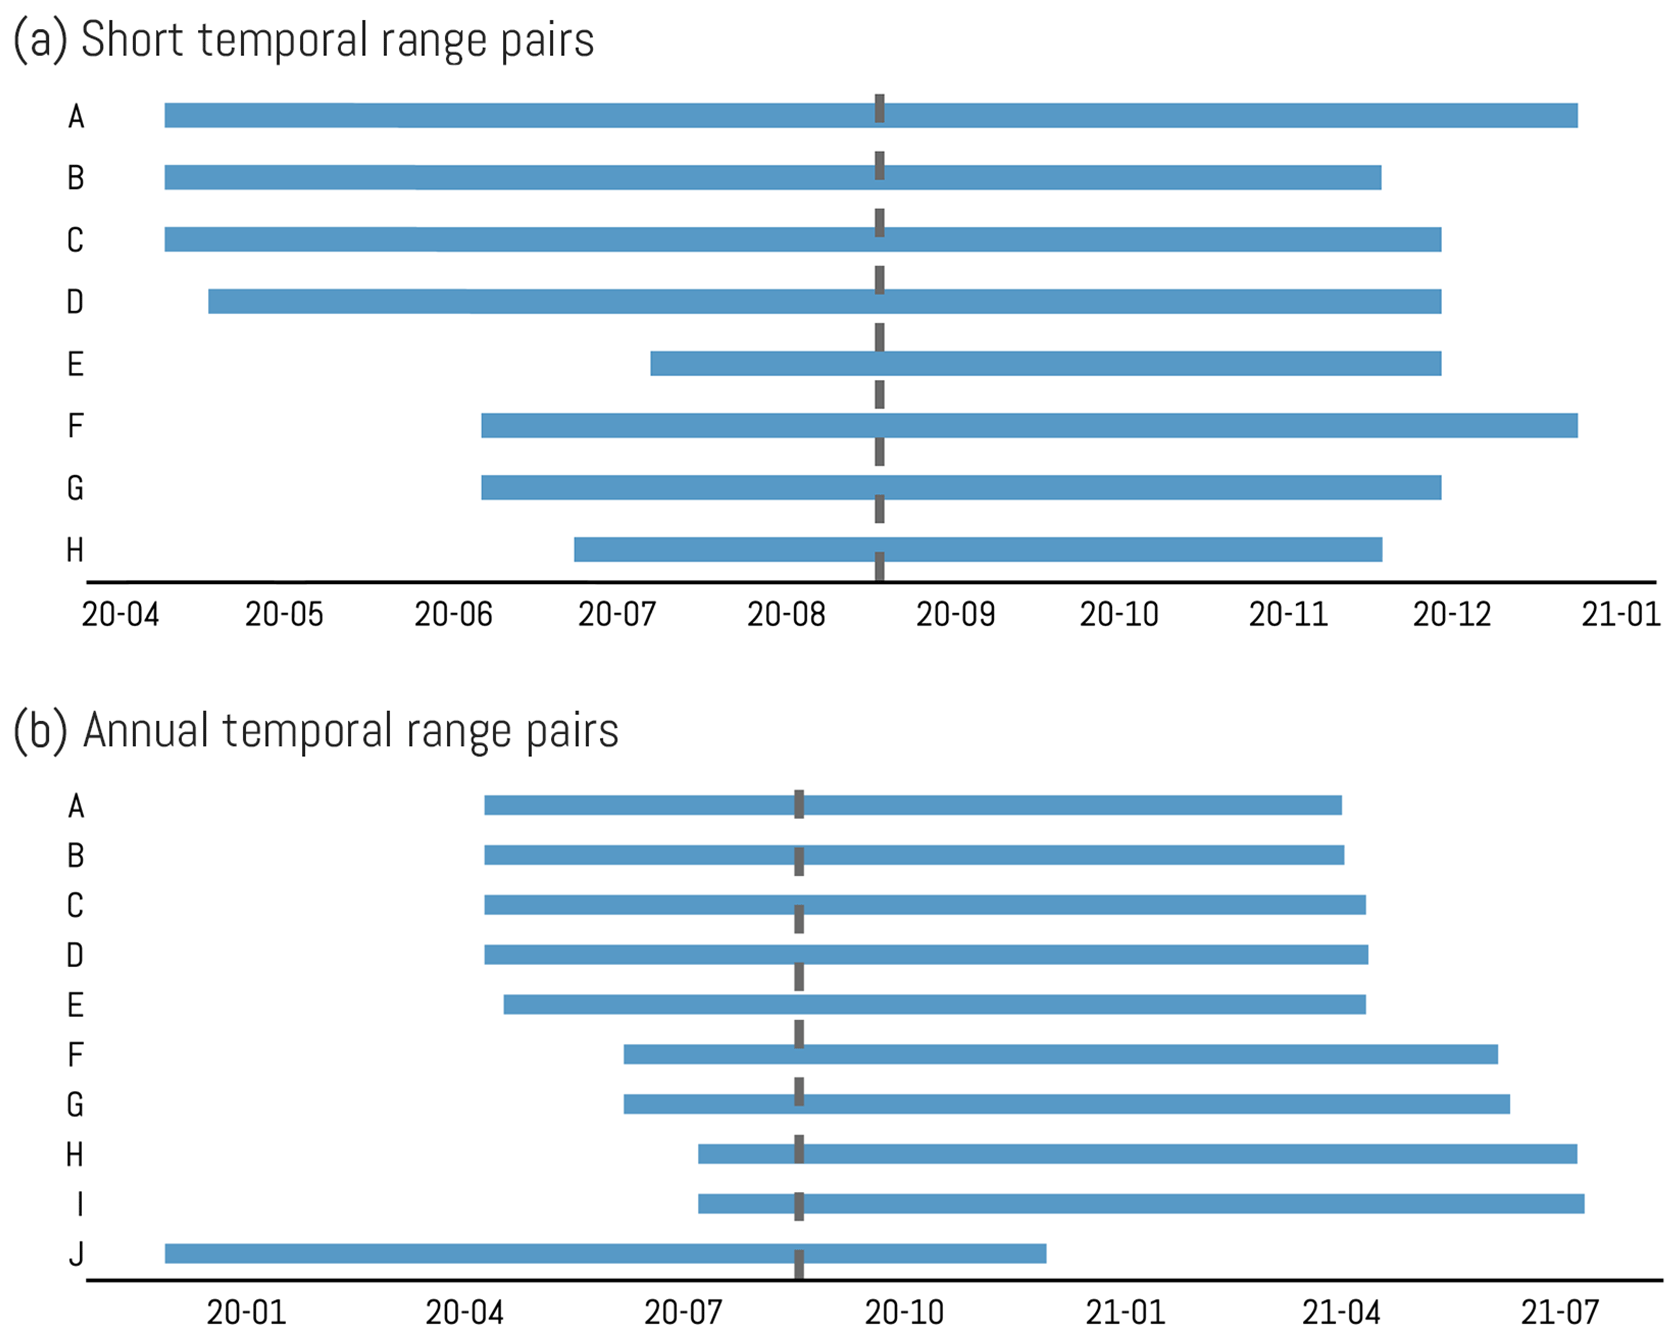
Figure 2Two classes of PlanetScope satellite imagery pairs evaluated through optical correlation. Panel (a) shows short-term pairs taken within the same year as the Masbate earthquake ranging from 5 to 9 months apart and as close to the event as possible. Panel (b) shows approximately annual span pairs acquired at about 365 d apart where environmental interference is expected to be at a minimum (A. Elliott et al., 2020).
We realize the necessity for the shortest temporal baseline to properly delimit the slip components. However, no workable Planet datasets in terms of cloud cover, ROI coverage, or compatibility of acquisition parameters were available that more closely bracketed the earthquake. To observe the influence of time on the quality of the output offset rasters, two sets of temporal ranges were tested for the Masbate event (Fig. 2). Five short-term pairs were selected from visually feasible images sampled months apart in 2020, whereas 10 annual pairs were roughly 1 year apart (Table 1). This was done to minimize the effect of environmental variables following the approach of A. Elliott et al. (2020).
Table 1Satellite geometry and acquisition parameters of the PlanetScope data used in the study. Values of the satellite azimuth (satAzi) are unavailable for the older images in the table. Available tiles for 23 June 2020 are merged to create a single mosaic to maximize the extent. The two datasets for 2 April 2020 are analyzed separately. Time zone is UTC.
The image pairs were coregistered to a Sentinel-2 basemap using the global coregistration function of the Automated and Robust Open-Source Image Co-Registration Software (AROSICS) (Scheffler et al., 2017) to increase the registration accuracy while preserving the deformation signal. The pairs were clipped to their overlapping extents with a Universal Transverse Mercator (UTM) projection and either an 8- or a 16-bit integer pixel data type as required by MicMac. Manual cloud masking was accomplished using the saisiemasqQT binary of MicMac for precision masking.
Correlations in the spatial domain were performed with MicMac on the prepared image pairs using the following parameters:
-
7×7 window size (SzW = 3) for a 21.875 m search grid on each side to compensate for feature-related noise and expected displacement,
-
0.5 regularization factor (Reg = 0.5) to provide distance-based correlation weights on the neighboring pixels within the window for noise reduction, and,
-
pixel subsampling parameter of 2 (SsResolOpt = 2) as recommended by Canizares et al. (2020) for earthquake events to resolve displacement fields close to the ground resolution of the source imagery.
The resulting output files were georeferenced using gdal_translate with the -a_ullr flag (GDAL/OGR contributors, 2021) to ensure a 1:1 alignment with the input image pairs without warping the rasters. To retain most deformation signals, the correlation threshold was set to 50 %. A non-local median (NLM) filter with a low H-noise value was applied to prevent flattening real ground deformation signals while improving the signal-to-noise ratio (SNR). The outputs were then translated into the spatial domain by multiplying the rasters with the ground resolution of the input files. The rasters chosen to extract profiles and calculate fault-parallel offsets were selected based on noise levels, atmospheric obstruction, pre-processing accuracy, ROI coverage, and quality of slip visualization (Sect. S1.1 in the Supplement).
The post-processed data generated coherent pixel offset maps along the N–S () and E–W () horizontal axes with a 3.125 m pixel resolution. Slip measurements with respect to the general fault strike azimuth (θ=325°) of the Masbate segment were acquired by transposing the N–S and E–W slip into fault-oriented components using the following equations (A. Elliott et al., 2020):
Measurements were acquired by taking profiles of the pixel offset data across the fault to determine the net fault-parallel offset (Sect. S1.2). The fault-parallel (D∥) direction refers to movements parallel to the fault trace represented by laterally offset features on the field. This component was the sole subject of profiling due to the stronger horizontal offset signal in the field. The tension–compression (D⟂) aspect detectable from the fault-normal component was not analyzed due to the minimal deformation along the vertical axis, further complicated by high noise amplitudes.
Wide swath profiles (321×161 px, roughly km) along the fault trace were acquired with StackProf (Pourchet and Delorme, 2021) developed for the MicMac project. The slip values from profiles aided in the measurement of the near-fault slip distribution for comparison with offsets measured in the field. The displacements were calculated from the intercepts of the regression of weighted median offsets across the fault trace. We used the coherence values to remove zero correlation pixels to highlight the genuine earthquake slip in the arctangent model. We selected the regression limits by hand to exclude areas of decorrelation, apparent noise signals, and obvious spurious pixel offset data that remained after filtering. As a result, most regression lines were limited to 300–600 m across the fault trace. Validated slip data were plotted along the fault strike to show the spatial trends.
Absolute standard deviations (1σ) from the weighted median values across the transect indicate the measurement uncertainties in individual box profiles. The individual slip uncertainties are the sum of the standard errors of intercepts of the regression of the eastern and western blocks (Pourchet and Delorme, 2021). The displacement curve was calculated using a robust weighted moving mean approach with minimal smoothing (q=0.15) to prevent the removal of small deviations along the strike.
3.3 Small baseline subset interferometry
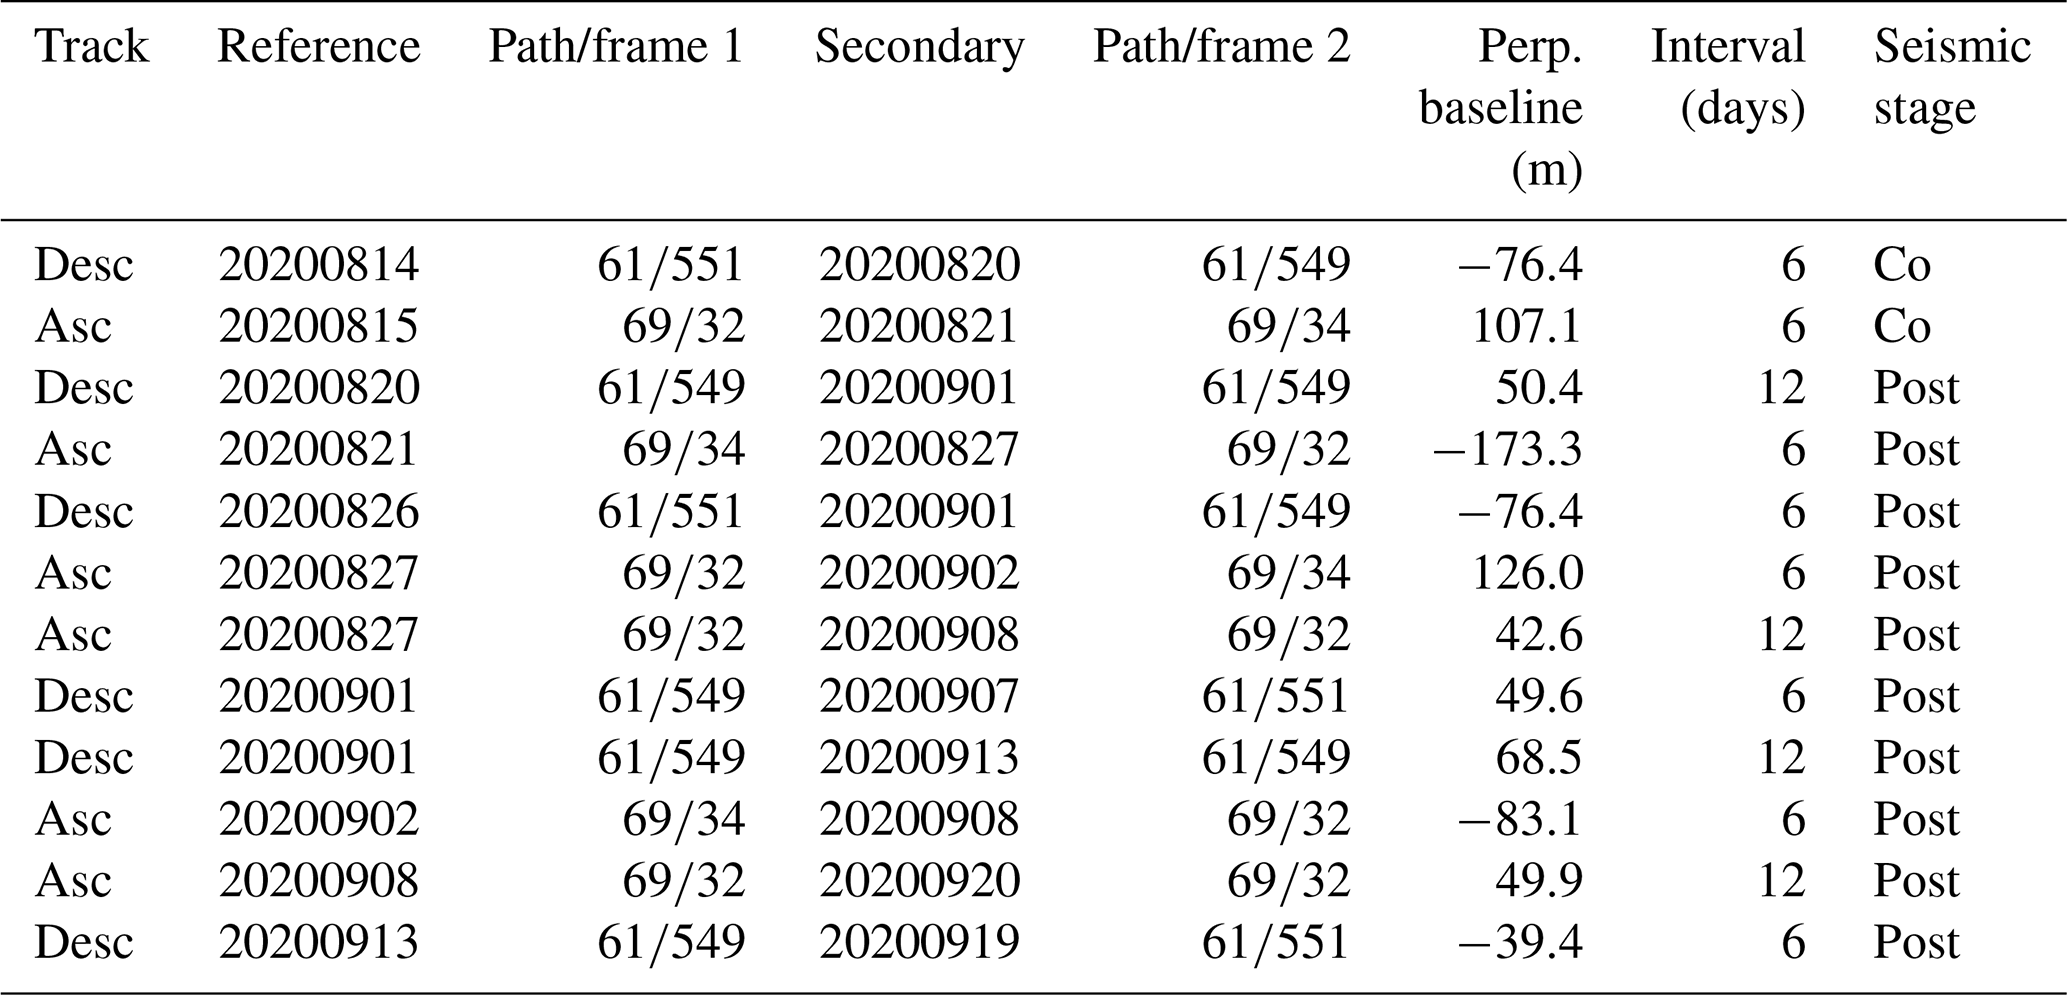
Coseismic and post-seismic interferograms were processed with NASA's Alaska Satellite Facility Distributed Active Archive Center (ASF DAAC) Hybrid Pluggable Processing Pipeline (HyP3) (Kennedy et al., 2021). Sentinel-1A/B single look complex (SLC) C-band radar data acquired through the interferometric wide (IW) swath mode were used. Data with 6–12 d intervals from paths 61 (descending track) and 69 (ascending track) (Fig. 1d) imaged from 14 to 21 August 2020 for the coseismic slip and 20 August to 20 September 2020 for the afterslip were multilooked by 20 in the azimuth direction and 4 in the range resulting in a pixel size of 80×80 m to minimize the effect of land cover (Table 2).
Table 2Summary of reference and secondary scenes processed within Alaska Satellite Facility's Hyp3 processor to create interferograms.
Small baseline time series analysis (SBAS) was employed using MintPy (Yunjun et al., 2019) to quantify the post-seismic deformation in the aftershock observation period. Atmospheric corrections were not applied, since the study area is highly localized relative to the global dataset implemented in available databases. Furthermore, the unwrapping reference point was set to a common high coherence pixel for both tracks. The ascending (VA) and descending (VD) LOS velocities were projected into the azimuthal fault strike (θ=325°) (Dianala et al., 2020; Lindsey et al., 2014; Tymofyeyeva and Fialko, 2018) to estimate the fault-parallel () and vertical (VZ) post-seismic velocities. The approach assumes a zero third component acceptable for areas of relatively simple faulting. Equation (3) was used to derive the fault-oriented afterslip LOS velocities within the asc_desc2horz_vert script in MintPy. The pixel unit vector directed to the satellite was decomposed into e, n, and u representing the east, north, and upward directions of both tracks, respectively:
The total afterslip was obtained by multiplying the fault-parallel component with the temporal range of the time series, and the data were smoothed using an NLM filter to arrest pixel outliers. Swath profiles (Krambach, 2015) were taken at 0.5 km intervals with a 3.5 km swath width across the fault strike (Sect. S4.1). We determined the across-fault 1σ uncertainties from the absolute deviation from the weighted median in each swath. Slip uncertainty estimates come from the sum of the standard error of regression intercepts of the eastern and western blocks, following the StackProf approach (Pourchet and Delorme, 2021). Similar to optical correlation, the regression lines for the eastern and western blocks were manually delimited in order to exclude the remaining phase unwrapping artifacts and other noise signals.
The spatial distribution of the afterslip along the strike was evaluated using a smoothed moving mean displacement curve (q=0.15). The vertical post-seismic displacement was not investigated due to the primarily horizontal ground movement. The coseismic interferogram was limited to qualitative comparisons with optical correlation. No quantifiable comparisons can be made since slip is unresolved in the near-fault region as a result of decorrelation due to high magnitudes of coseismic slip.
3.4 Ground truthing
Field investigation was conducted from 18 to 21 May 2022 to identify and measure the horizontal offsets across the ground rupture. Locations of known ground rupture (Ronald dela Cruz, personal communication, 2022) were complemented by points of interest identified from the image correlation outputs and InSAR. Due to the 2-year interval between the earthquake and fieldwork, geomorphic or human modifications of offset features may have occurred. Additionally, many offsets and evidence of surface rupture may have been erased given the small magnitude of surface slip. The significance of these changes can be assessed by correlating field data with other measurement techniques to determine the slip.
We selected points of interest for field checking based on the pixel offset rasters, prioritizing locations with significant contrast along the approximate and certain fault traces. Field offsets were measured with a steel tape and structural orientations were determined with a base plate compass. Measurements of on-fault offsets were limited to individual rupture strands. Due to the scarcity of remnant ruptures, most sites had a single measurement. Uncertainty was estimated by comparing values at these locations to earlier measurements acquired a week after the earthquake (PHIVOLCS, 2020; Miraballes et al., 2020). In areas with complex, closely spaced ruptures, multiple measurements were acquired and statistically assessed to estimate the uncertainty.
Observation points with measurable feature offset and ruptures were plotted along the strike to show the attitude and slip distribution along the fault (Sect. S2). The measured horizontal offsets were used to validate the results of the remote sensing analysis. Finally, the maximum and average displacements, as well as the surface rupture length were derived from the conjoined remote sensing outputs and field data to estimate the seismic moment.
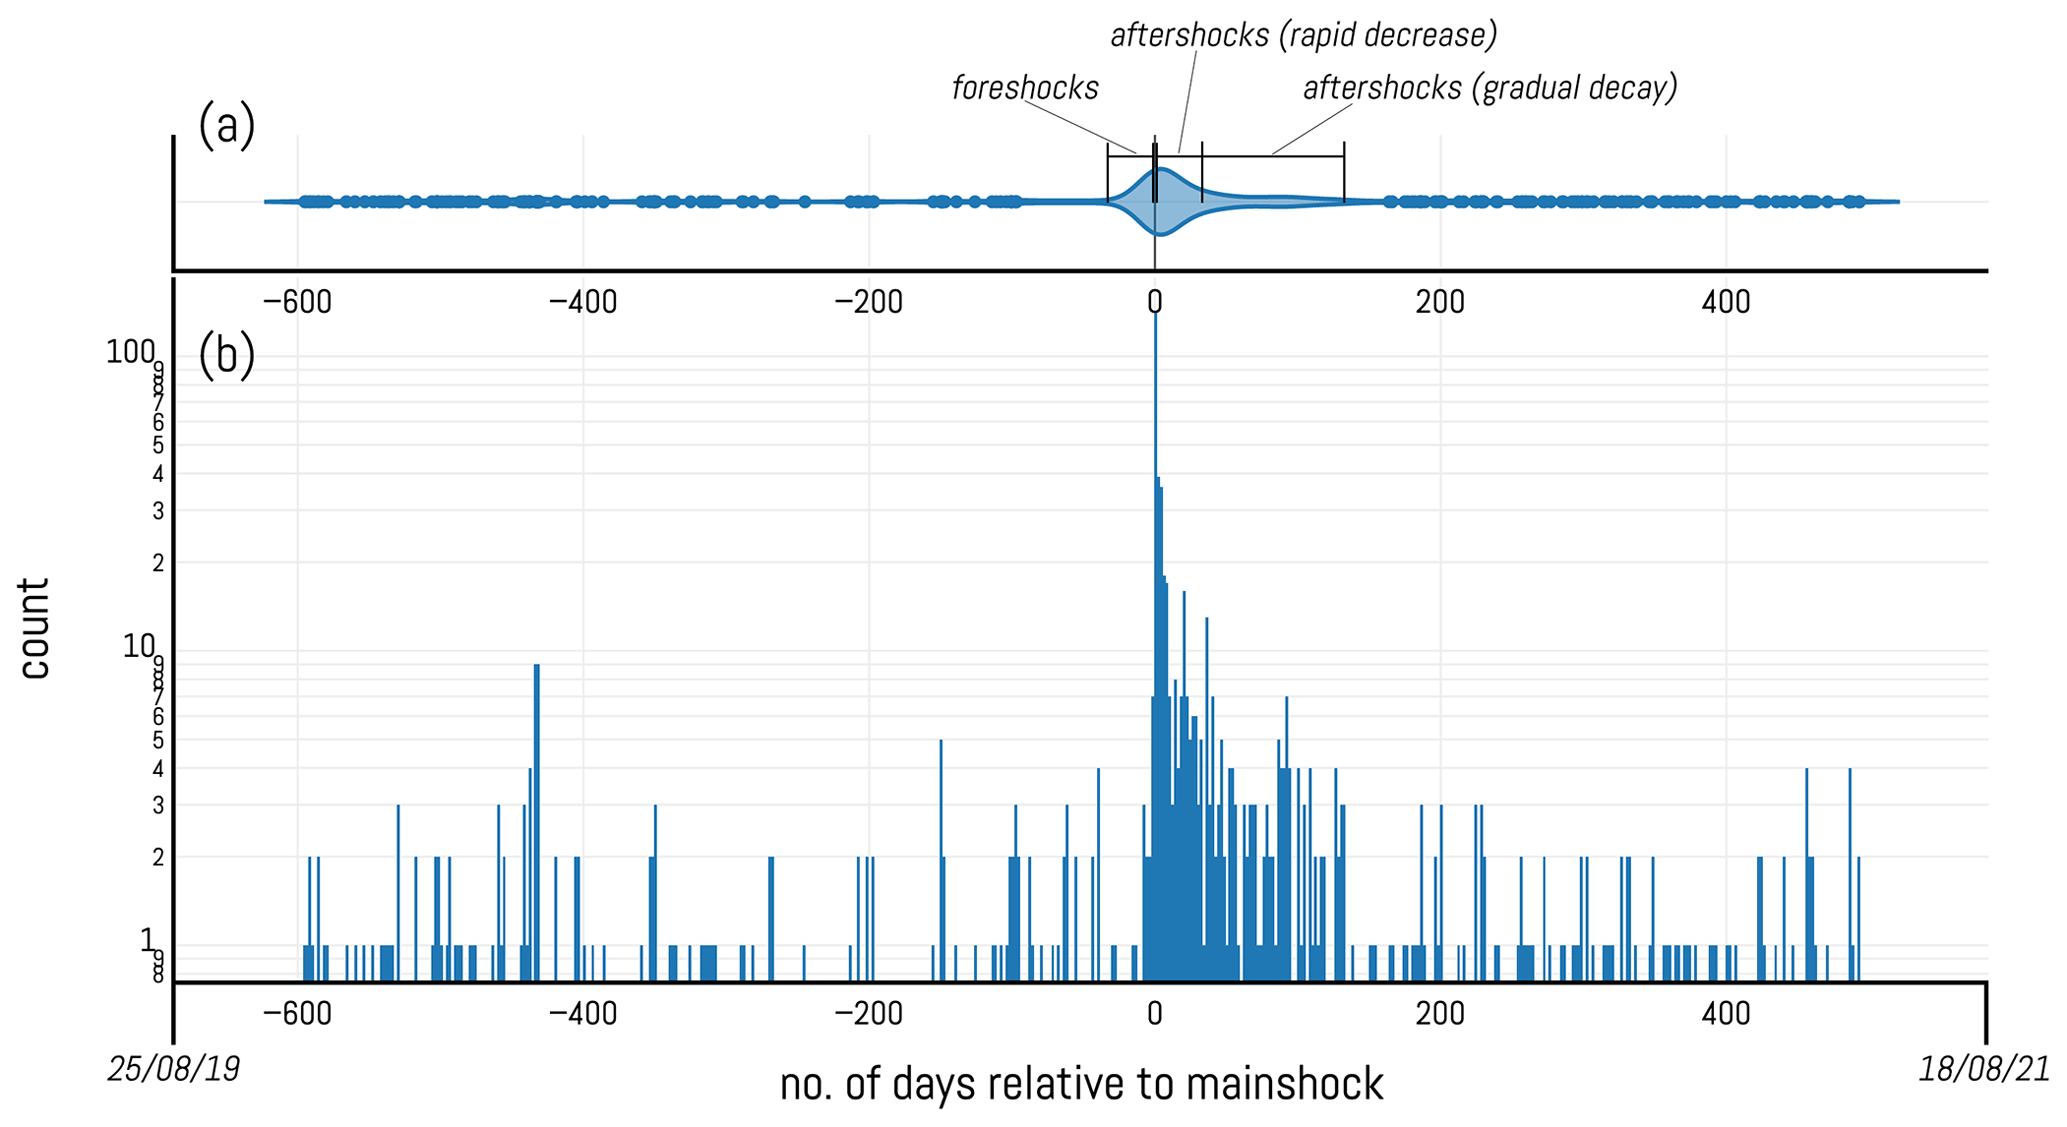
Figure 3Panel (a) is an earthquake probability density subplot showing the normalized population of earthquakes per day, highlighting the contrast between the periods of the earthquake sequence. Panel (b) is a plot showing the number of earthquakes with magnitudes M≥1 related to the Masbate segment and their temporal distribution relative to the 18 August 2020 mainshock.
4.1 Seismicity
4.1.1 Earthquake frequency and temporal relationships
The frequency–time distribution of earthquakes between 25 August 2019 and 18 August 2021 shows the immediate seismicity related to the 18 August 2020 Mw 6.6 event (Fig. 3). The foreshocks, mainshock, and aftershocks are identifiable in the probability density subplot (Fig. 3a) as a distinct bell-shaped curve relative to the generally quiescent background activity. The island of Masbate typically experiences less than 10 earthquakes per day, corresponding to a moderate background seismicity. An increase in earthquake frequency defines the foreshock sequence (Farrell et al., 2009) at around 32 d before the mainshock, as shown by the distinct trend increase in the probability density subplot. The peaks of the frequency plots (Fig. 3a and b) correspond to 141 earthquakes which were mostly aftershocks on 18 August 2020. A negative slope in the probability density subplot depicts the aftershock sequence. The decaying earthquake frequency is initially symmetrical to the foreshock trend with an inflection point around 30 d after the mainshock, which transitioned to a more gradual decrease. The aftershocks persisted for 166 d or up to 31 January 2021. The succeeding return to background levels saw a similar seismic activity to the previous background activity from 2019 to early 2020.
4.1.2 Spatiotemporal earthquake distribution
In general, the background seismicity (M≤4) is well distributed throughout the overall length of the Masbate segment of the PF traversing the islands of Ticao and Burias, as well as the provincial mainland (Fig. 4a). However, an absence of seismic activity is noticeable in the northern portion of the fault in mainland Masbate during this period. On the contrary, an earthquake cluster occurred near the location of the mainshock. Foreshock activity is concentrated in southeastern Masbate adjacent to the mainshock and is composed of mostly weak (M 2–3) and shallow hypocenters peaking at M 4.9 (Fig. 4b).
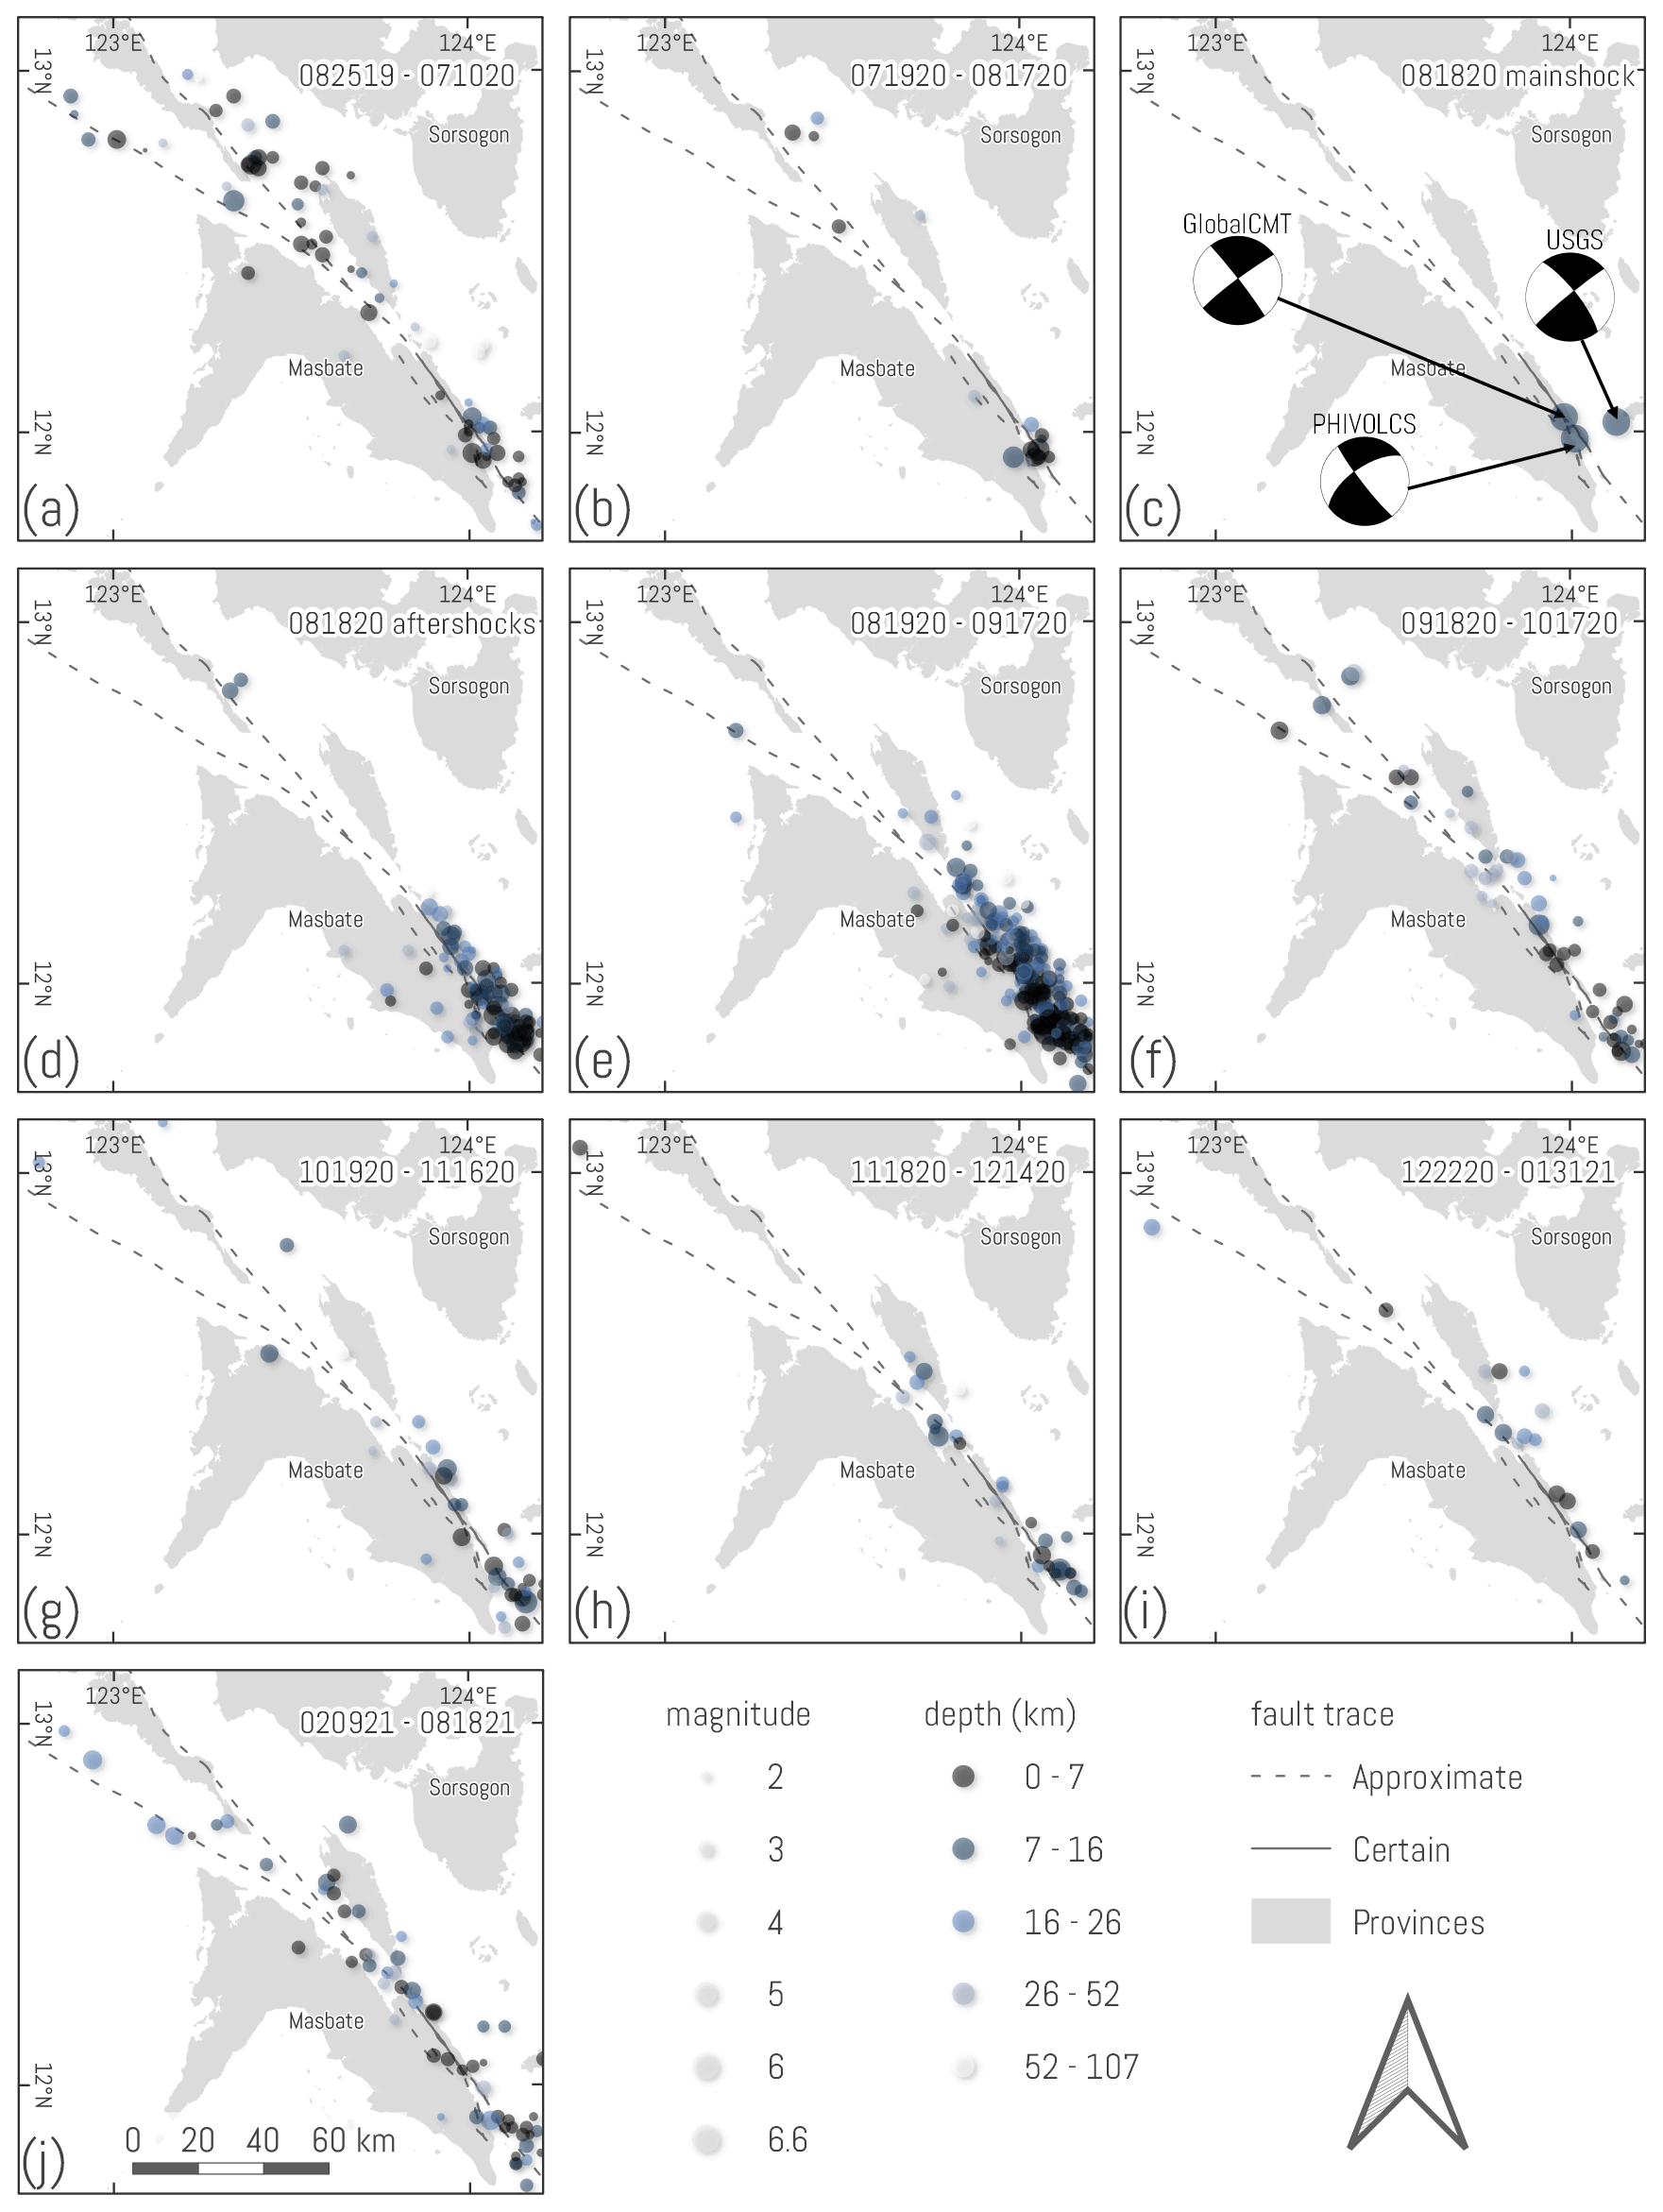
Figure 4Spatiotemporal earthquake distribution for the Masbate segment: (a) background seismicity between 25 August 2019 and 10 July 2020; (b) foreshocks from 19 July to 17 August 2020; (c) moment tensors of the mainshock from GlobalCMT, PHIVOLCS, and USGS; (d) same-day aftershocks; (e) first-month aftershocks from 19 August to 17 September 2020; (f) second-month aftershocks from 18 September to 17 October 2020; (g) third-month aftershocks from 19 October to 16 November 2020; (h) fourth-month aftershocks from 18 November to 14 December 2020; (i) last aftershocks from 22 December 2020 to 31 January 2021; and (j) return to background seismicity covering 9 February to 18 August 2021.
Three moment tensor solutions from GlobalCMT, PHIVOLCS, and USGS highlight the mainshock's dominant left-lateral strike-slip movement (Fig. 4c). The solutions of PHIVOLCS and USGS show a noticeable, albeit minimal, dip-slip component toward the NNE. The epicentral location of the mainshock from GlobalCMT and PHIVOLCS coincided with the fault trace, while USGS' focal mechanism solution deviated to the northeast of the fault.
Aftershocks that transpired on the same day as the mainshock (Fig. 4d) are shallow (1–30 km) and densely grouped in the southeastern offshore extension of the segment and deepen (10–50 km) as they taper toward the onshore portion. The aftershocks have weak magnitudes ranging from M 2.0 to M 4.4. Succeeding first-month aftershocks are weak to moderate, with a wide range of magnitudes between M 1.7 and M 5.1, mostly occurring at depths above 30 km. A monthly progressive dispersal of hypocenters in space is also observed, with the first month showing a dense cluster in the southeastern section that tapers to the northwest (Fig. 4e). The pattern and geographic extent of the first-month aftershocks appear to be an expansion of the same-day aftershocks. The succession of the aftershock patterns in the following months continued to scatter along the Masbate segment and the SSF while retaining a perceptible concentration in the offshore southeastern extension of the causative fault segment (Fig. 4f–i). The last 2 months of aftershock activity (Fig. 4h and i) feature the least number of hypocenters throughout the aftershock sequence.
Background levels returned on 2 February 2021 defined by the well-distributed hypocenters on the fault segments with moderate magnitudes (Fig. 4j) similar to the pre-event seismicity in 2019 (Fig. 4a). The frequency and distribution of earthquakes in time and space enabled the distinction of various stages of the earthquake sequence relative to the 2020 Masbate event.
4.2 Optical image correlation
4.2.1 Long and short temporal baseline
The acquired pixel offset maps (Fig. 5) illustrate the fault rupture and the known left-lateral movement of the Masbate segment, despite the presence of noise that obscures portions of the rupture. Only one of the eight image pairs from the short time span spaced months apart (Fig. 2a) produced outputs with perceptible rupture due to the low SNR. Annual time-span pairs resolved the rupture more clearly compared with the short time-span image pairs. The north–south slip components show better representations of the rupture, whereas the east–west components tend to be noisier. Nevertheless, the valid image pairs (Sect. S1.1) with resolvable slip and subjected to stack profiling exhibit reliable estimates of the slip in the near-field region.
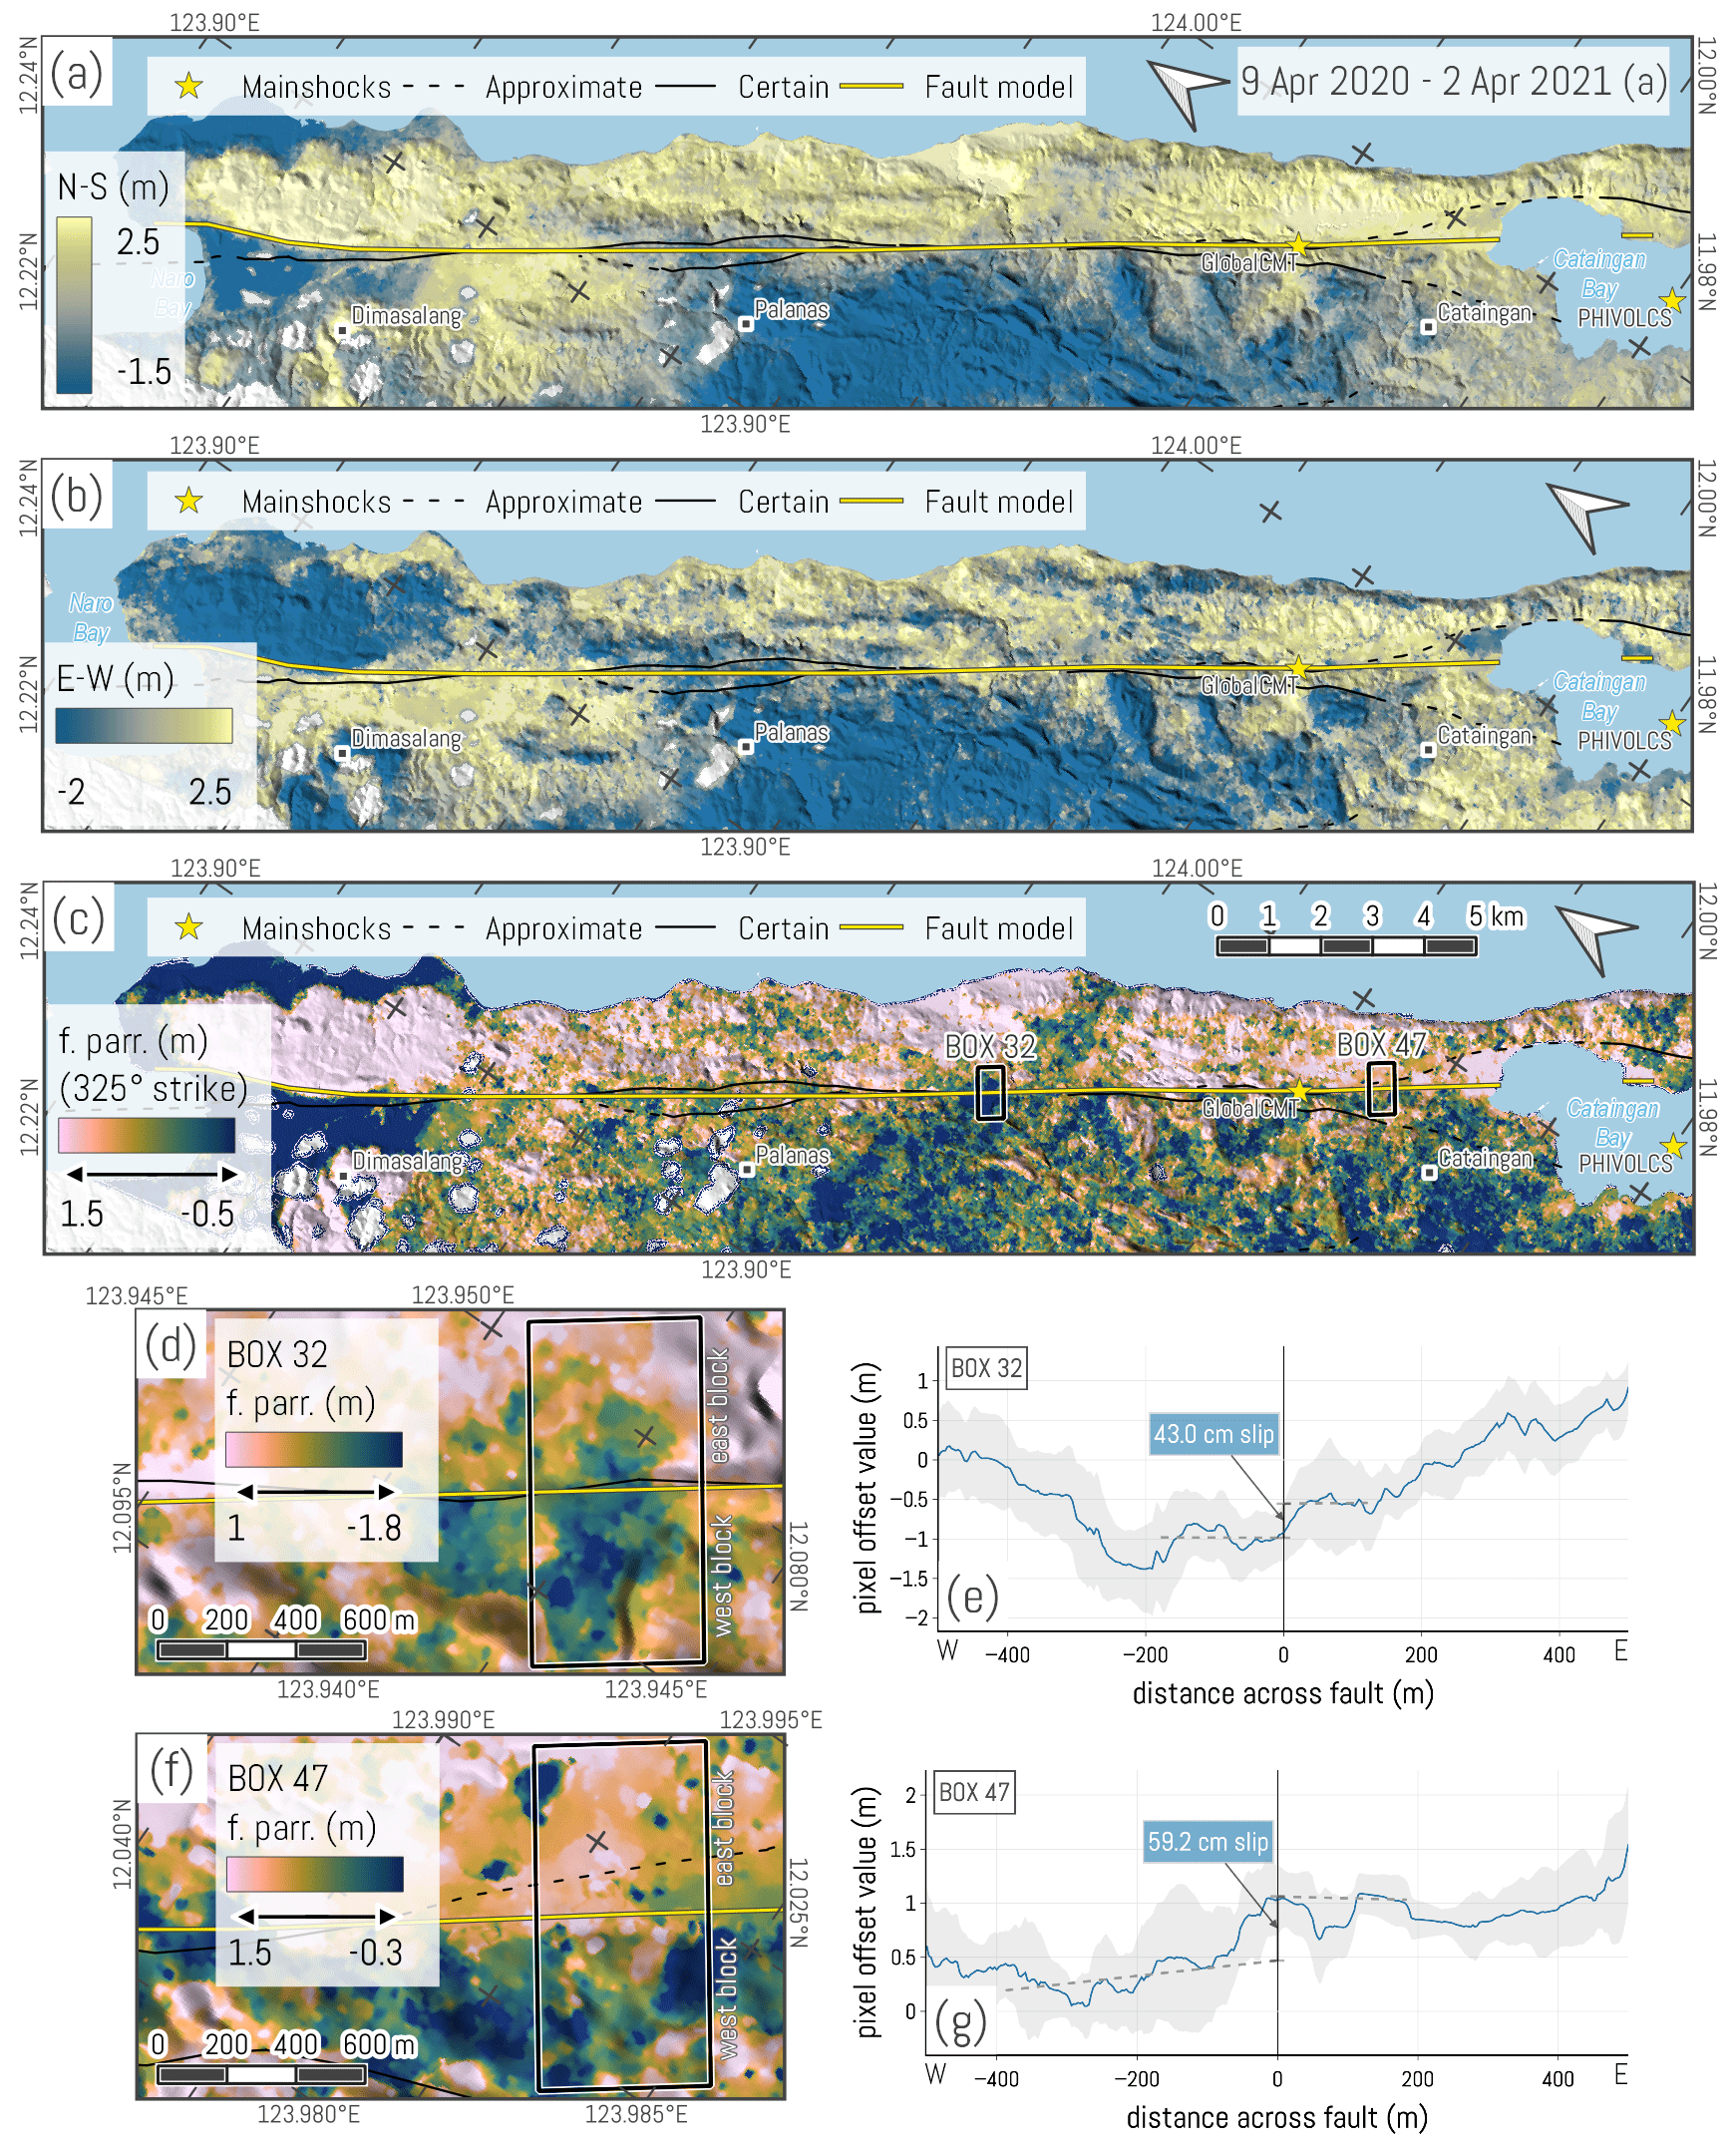
Figure 5Optical correlation results showing the representative data from the 9 April 2020 and 2 April 2021 image pair. Blue lines in (e) and (g) are the absolute median fault-parallel values across the profile box. Gray shaded region in (e) and (g) feature the 1σ absolute standard deviation of the fault-parallel values across the fault in each box. Panel (a) shows the N–S component. Blue refers to southward movement and yellow refers to northward motion. Panel (b) shows the E–W component. Blue refers to westward movement and yellow refers to eastward motion. Panel (c) shows the fault-parallel component. Pink refers to movements toward the NW and blue denotes motion toward the SE. Panel (d) is a closer view of box 32 showing the fault-parallel offset. Panel (e) shows a swath profile of box 32 highlighting the 43 cm slip. Lower regression intercept of the western block relative to the eastern block indicates left-lateral movement. Panel (f) is a closer view of box 47 displaying the fault-parallel offset in Cataingan. Panel (g) shows a swath profile of box 47 exhibiting the peak 59.2 cm left-lateral offset in this particular image pair.
4.2.2 Horizontal ground displacements
A generalized fault trace (yellow line in Fig. 5) was delineated from the valid pixel offset rasters and the known fault trace, which served as the baseline for slip profiling. The fault trace is mostly straight, except for an apparent northeasterly strike rotation toward the north, where it follows the piedmont of a topographic high in Dimasalang. No measurements were acquired in the area due to anomalously high values, which are probably terrain residuals. Topographic artifacts and decreasing slip away from the epicenter posed difficulties in delineating the northern rupture section near Naro Bay. In the southwestern section,the offset rasters show a new splay striking NW–SE that bisects the previously recognized bifurcation in Cataingan. The rupture traverses the deltaic area and possibly continues southward across Cataingan Bay, then resurfaces on the opposite side of the bay. Smaller fractures and minute rupture components are not visible due to ubiquitous noise.
Left-lateral offsets were quantified along the ∼25 km onshore length of the fault from Dimasalang to Cataingan, given the inland spatial extents and continuity where optical correlation was feasible. Edge artifacts and the obscured western block in the south of the bay hindered the acquisition of slip profiles.
A total of 51 wide swath profile boxes were generated throughout the fault rupture, with the first box in Dimasalang and the last in Cataingan to determine the along-strike-slip distribution (Fig. 6). The optical correlation results generated a total of 126 left-lateral measurements over six image pairs (Sect. S1.2). Using a 325° general strike azimuth of the Masbate segment, the east–west and north–south displacement components (Fig. 5a and b) were transposed into the fault-parallel direction (Fig. 5c).
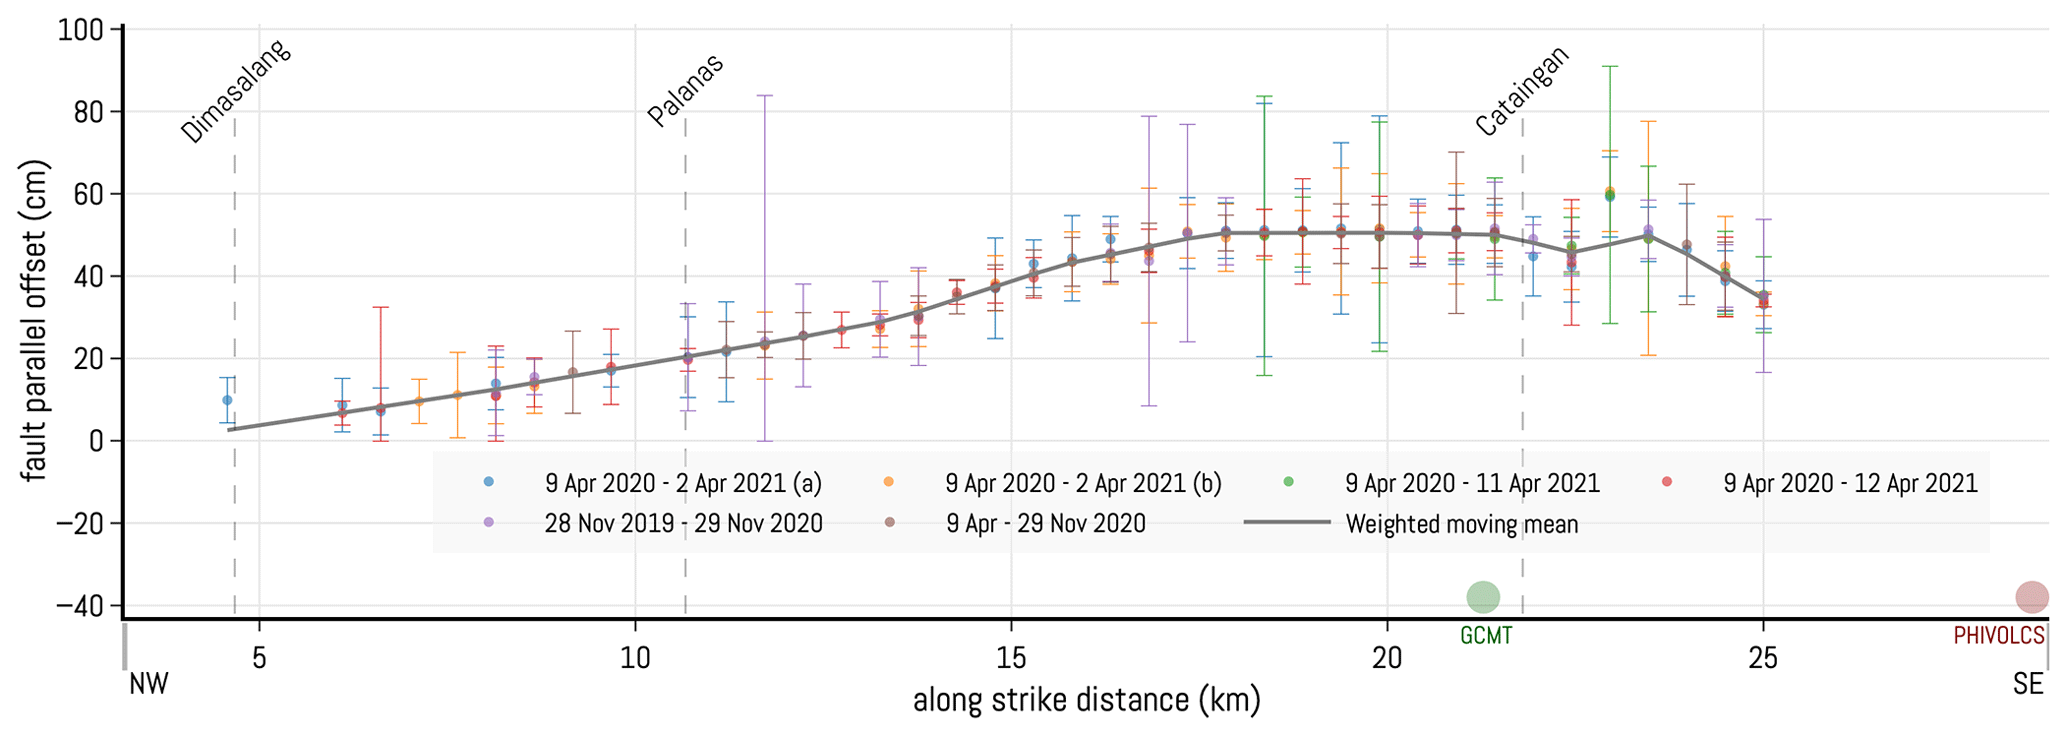
Figure 6Along-strike distribution of the fault-parallel offsets from 126 profile boxes across six image pairs. Error bars refer to the 1σ sum of standard errors of the intercepts of regressions of the eastern and western blocks providing slip uncertainty estimates.
The 9 April 2020 to 2 April 2021 pair was selected as the representative dataset due to its wide spatial extent and reliable representation of the fault rupture. The north–south component (Fig. 5a) shows a continuous linear rupture trace from Dimasalang to the deltaic area in Cataingan, although the Dimasalang area and its border with Palanas exhibited unusually high values due to topographic artifacts. The east–west component (Fig. 5b) is less coherent, likely due to smaller ground movements in this direction or overprinted data from the noise. The outputs show noise from both artificial and environmental sources, represented by topographic artifacts in the southwestern block, an apparent seamline, and reduced coherence due to differences in land cover between the images. Nevertheless, the fault-parallel component (Fig. 5c) shows good estimates of the left-lateral slip, further supported by the near-field offset models.
Box 32 (Fig. 5d), located ∼6 km north of the GlobalCMT surface projection, shows a 43 cm slip in the near field (Fig. 5e). Pixel offset values increase in the far field for the western block, which may either represent noise or distributed deformation. Box 47, situated ∼1.5 km south of the GlobalCMT epicenter, exhibits a 59.2 cm left-lateral offset. The box represents the peak offset in this image pair and displays a clear contrast between the eastern and western blocks.
The plot of the slip distribution along strike (Fig. 6) displays the 126 left-lateral offsets compiled from the valid offset rasters to characterize the displacement field. The slip minima ranges from 6 to 9 cm, located 4.5 km from the northern shoreline in Dimasalang. The displacement increased to ∼50 cm around the vicinity of the GlobalCMT projection of the centroid. Slip values remained constant within a ∼5 km span in Cataingan and increased to a peak ∼60 cm at around ∼1 km southeast of the centroid. South of the peak value, the displacement declines toward the shoreline. The skewed semi-elliptical weighted moving mean curve (solid gray line in Fig. 6) shows the average left-lateral offset of 37.7±10 cm, while the individual measurements indicate a peak 60.6±9.8 cm offset adjacent to the surface projection of the centroid in Cataingan.
4.3 Interferometry
4.3.1 Coseismic interferograms
The Sentinel-1 coseismic wrapped interferograms in the ascending and descending tracks (Fig. 7a and c) show the butterfly-shaped fringe patterns and oppositely verging LOS displacements, both of which are typical of strike-slip events. The fringe lobe patterns illustrate a range increase from the ascending track and a range decrease from the descending track for the western side of the fault. Since the orbit of the ascending track is subparallel to the regional fault strike, the left-lateral movement is indicated with a possible subsidence component. This is consistent with the moment tensor solutions (Fig. 4c) and agrees with the sense of movement shown by the optical correlation outputs and field observations.
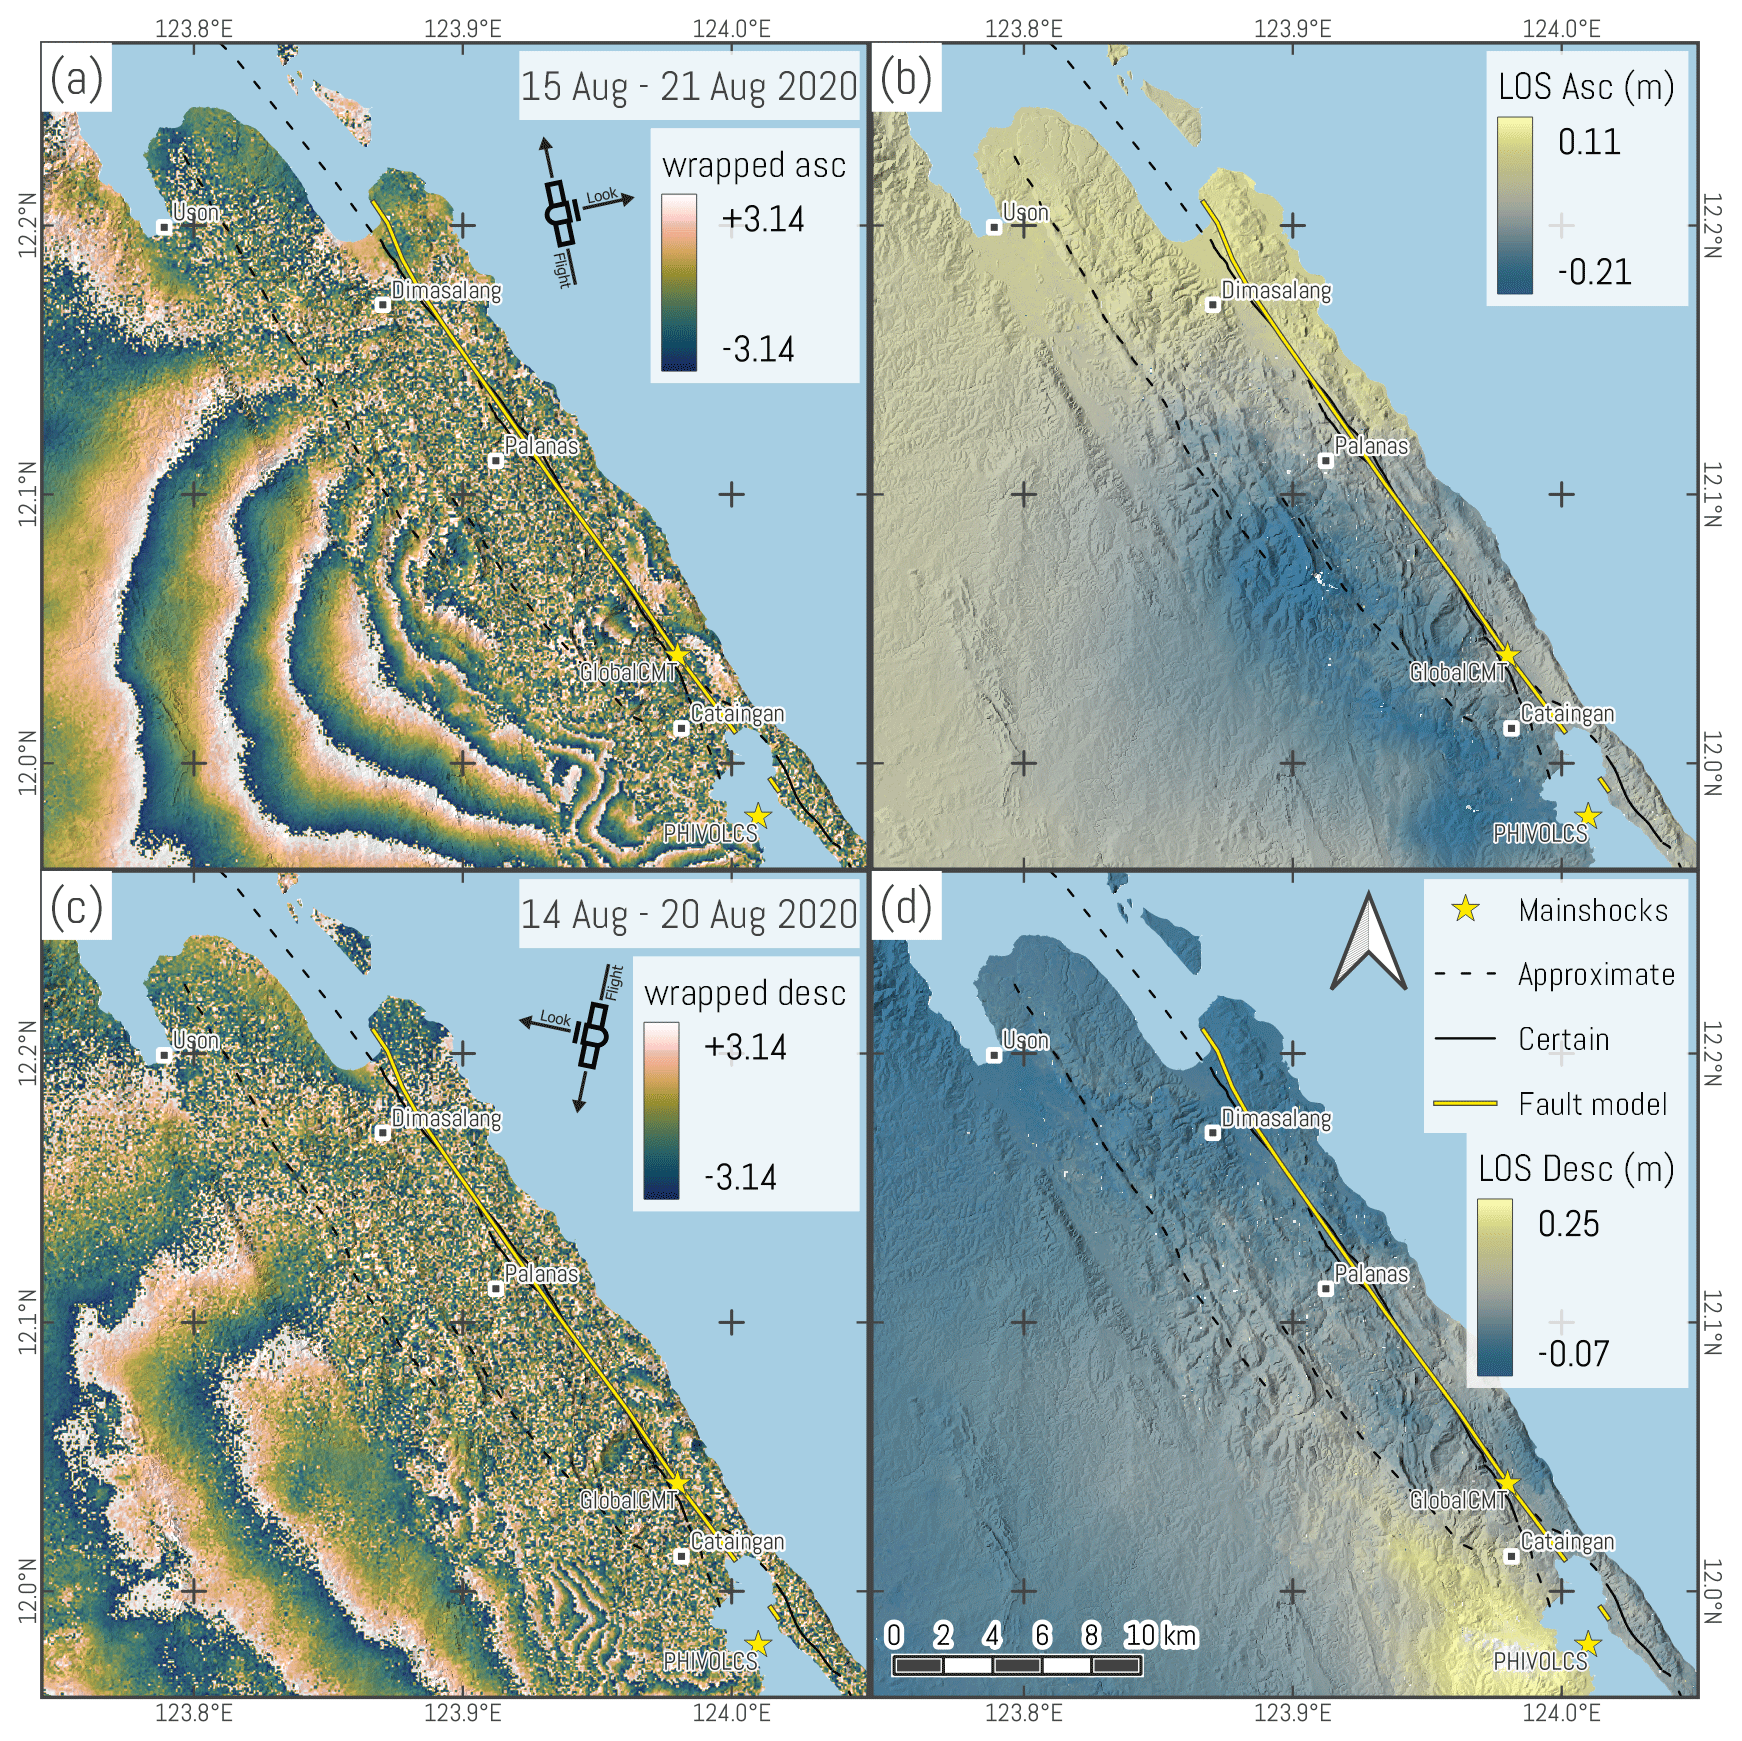
Figure 7Sentinel-1 coseismic interferograms in ascending and descending tracks: (a) wrapped ascending interferogram, (b) unwrapped LOS displacement in the ascending track, (c) wrapped descending track interferogram, and (d) unwrapped LOS displacement in the descending track.
Low phase coherence persists in the near-fault region. Widespread decorrelation leads to mostly unusable information upon phase unwrapping due to the likelihood of creating unwrapping errors. Noise is similarly dominant and overprints most of the deformation signals in an approximately 18 km-wide region across the fault trace, hence, the lack of near-fault information in preliminary published interferograms (PHIVOLCS, 2020; Tiongson and Ramirez, 2022). In addition, the rupture is unresolved upon phase unwrapping (Fig. 7b and d) due to decorrelation. This loss of resolvable information in the near field ultimately hinders slip measurements in the coseismic interferograms.
4.3.2 Post-seismic deformation estimates
Post-seismic interferograms capture an improved overall manifestation of the fault rupture compared with the coseismic ones (Fig. 8). This is a consequence of the expected smaller afterslip values relative to the coseismic slip, which decreases the number of fringes and increases the coherence. The temporal coverage of the interferogram stack allows us to quantify afterslip to complement the estimated coseismic slip from optical correlation. However, the first post-earthquake Sentinel-1 revisit occurred 2 d after the mainshock, resulting in all measurements to be lower-bound estimates of the afterslip.
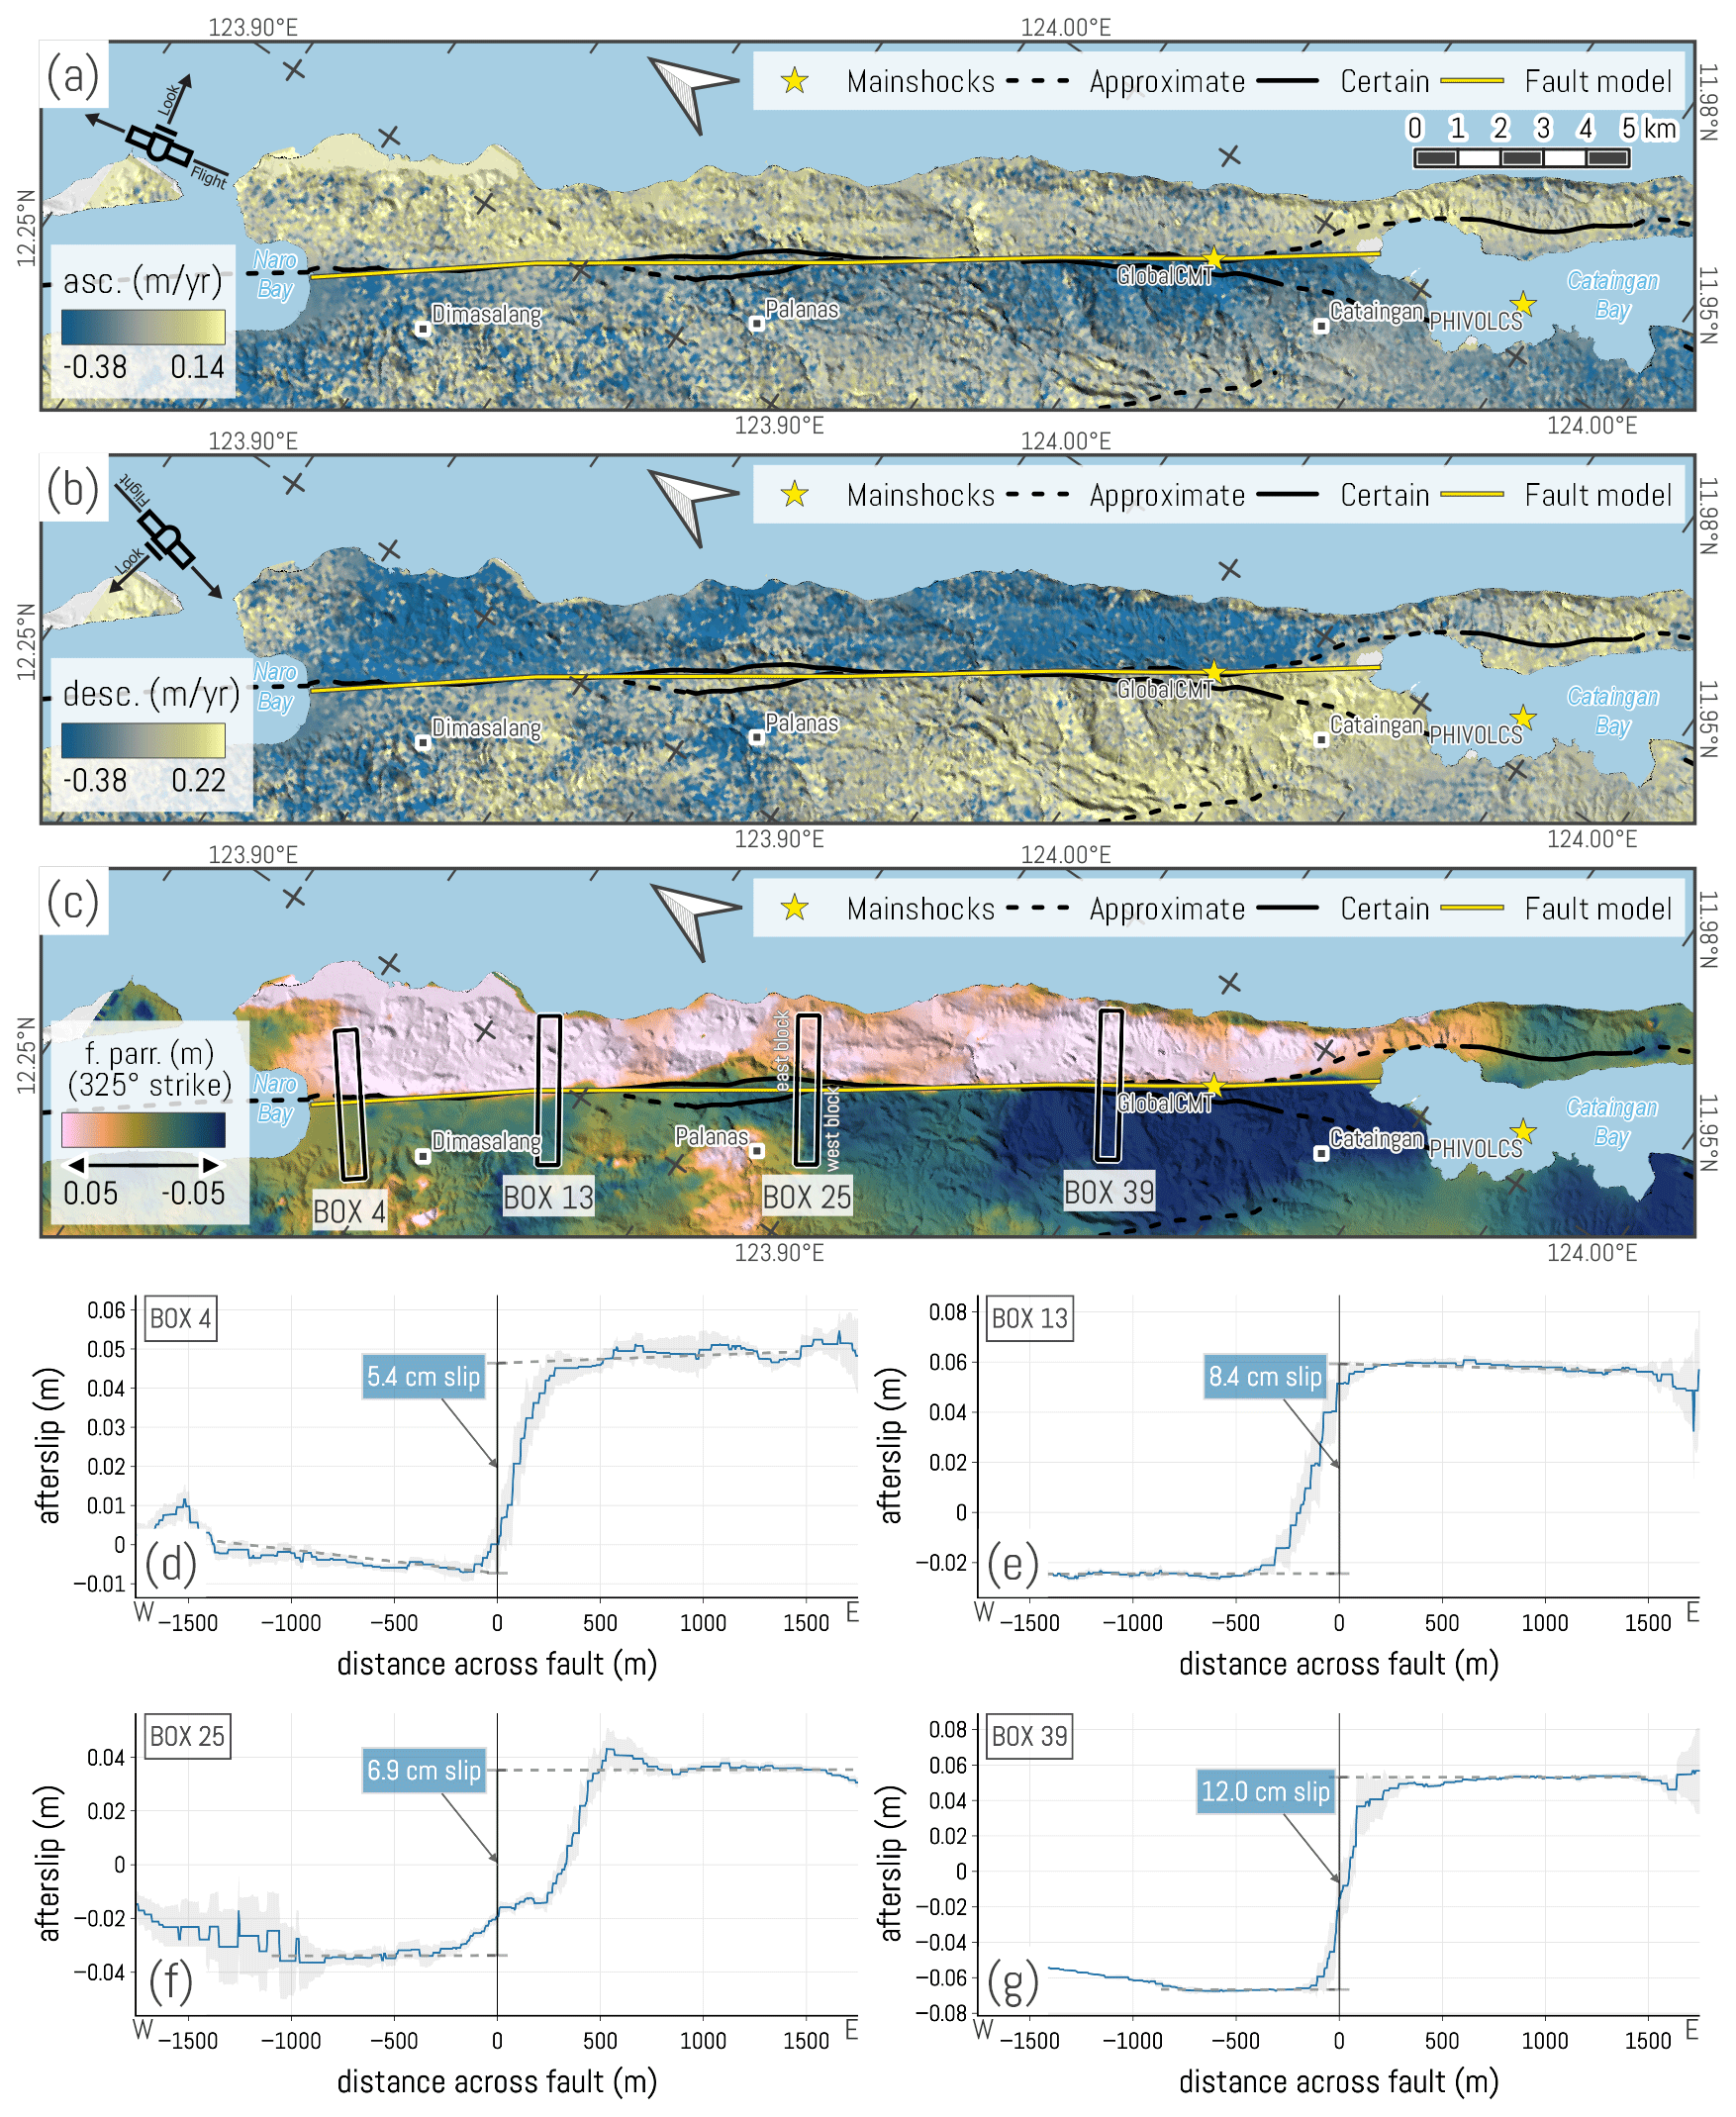
Figure 8Post-seismic deformation between 20 August and 20 September 2020. Panel (a) is the ascending track time series showing range increase (yellow) and decrease (blue) for the eastern and western blocks, respectively. Panel (b) is the descending track time series showing range decrease (blue) and increase (yellow) for the eastern and western blocks, respectively. Panel (c) shows the projected fault-parallel post-seismic deformation field. Panel (d) shows the fault-parallel afterslip for box 4 in Dimasalang indicating the 5.4 cm left-lateral afterslip. Lower regression intercept of the western block relative to the eastern block indicates left-lateral movement. Median afterslip value is shown by the blue line. Gray background exhibits the 1σ uncertainty across the box. Panel (e) shows the swath profile of box 13 indicating an 8.4 cm left-lateral afterslip around the Dimasalang–Palanas boundary. Panel (f) is the swath profile of box 25 showing a 6.9 cm afterslip in Palanas. Panel (g) is the swath profile of box 39 in Cataingan showing a 12.0 cm left-lateral afterslip.
Unwrapping errors are less frequent on the ascending and descending track interferograms and are further minimized upon time-series stacking. The remaining phase unwrapping errors upon stacking and filtering were manually excluded in profiling. These unwrapping errors occur as significant high amplitude phase shifts and polarity reversals, noticeable in the Dimasalang and Palanas areas.
The fault-parallel afterslip deformation field (Fig. 8c) shows a strongly linear and simple fault trace that accommodated the post-seismic deformation. Deviations from the regional fault strike are observed around 5–13 km from Naro Bay in the north, represented by multiple short NNE–SSW oriented (∼290–300° azimuth) bends which are adjacent to and coincide with the narrow stepover in the Palanas–Dimasalang area. However, the noticeable unwrapping errors and low ground resolution (80 m) precludes the validity and recognition of these rupture complexities.
The afterslip is resolved from Naro Bay in the north toward Cataingan Bay in the south along the ∼25 km simplified fault trace (Sect. S4.1). A total of 49 swath profile boxes were generated along this trace. Individual measurements reveal centimetric fault-parallel afterslip with minimal across-fault variability and minor 1σ uncertainties, except where the boxes overlap with the phase unwrapping error patches. The deformation was detected up to the far-field extents of the profiles from most swath boxes.
Boxes 4, 13, 25, and 39 (Fig. 8d–g) illustrate select wide swath profiles roughly equidistant from each other. Box 4, situated in Dimasalang, shows a 5.4 cm left-lateral fault-parallel afterslip and reasonably low variability across the fault. Unwrapping errors in the far field at 1.5 km from the fault on both sides caused irregularities in the profile. Box 13, located around the boundary of Palanas and Dimasalang, depicts an 8.4 cm fault-parallel slip. Both sides of the fault exhibit exceedingly even slip across the fault, except for a noticeable dip in the eastern edge. The dip is likely due to data loss since the box overlapped with the water body to the east. The profile also appears to be offset by about ∼100 m to the west, which corresponds to one of the abovementioned bends that may be an unwrapping artifact. Still, the measured slip from the arctangent model remains valid. Box 25 shows a 6.9 cm afterslip in Palanas, located at the southern edge of the fault complexity. Multiple across-fault deviations are visible around 200 and 500 m east of the fault, as well as in the western far field. The eastern anomalies could either be unwrapping or topography related, while the western patch comes from unwrapping issues. Box 39 in Cataingan displays a 12.0 cm left-lateral afterslip with good symmetry and even across-fault distribution.
The along-strike afterslip distribution graph (Fig. 9) depicts the computed fault-parallel offsets from north to south on the mainland. The smallest value is measured in Dimasalang, adjacent to Naro Bay, amounting to 4.3 cm of left-lateral afterslip. The ground offsets exhibit a generally increasing trend to around ∼5 km from the north. Fluctuating values are observed between 6.1 to 13.8 km from the north in Dimasalang and Palanas. The measured displacements oscillate between 5.0 and 9.6 cm in this span. The increasing trend continued to a 14.3±0.9 cm peak value in Cataingan, located 24 km from Naro Bay and ∼3 km southwest of the GlobalCMT surface projection. The displacements decrease from the largest value to 11.5 cm on the shoreline of Cataingan Bay. The weighted moving mean curve (solid blue line in Fig. 9) indicates a mean left-lateral afterslip of at least 8.8±0.7 cm.
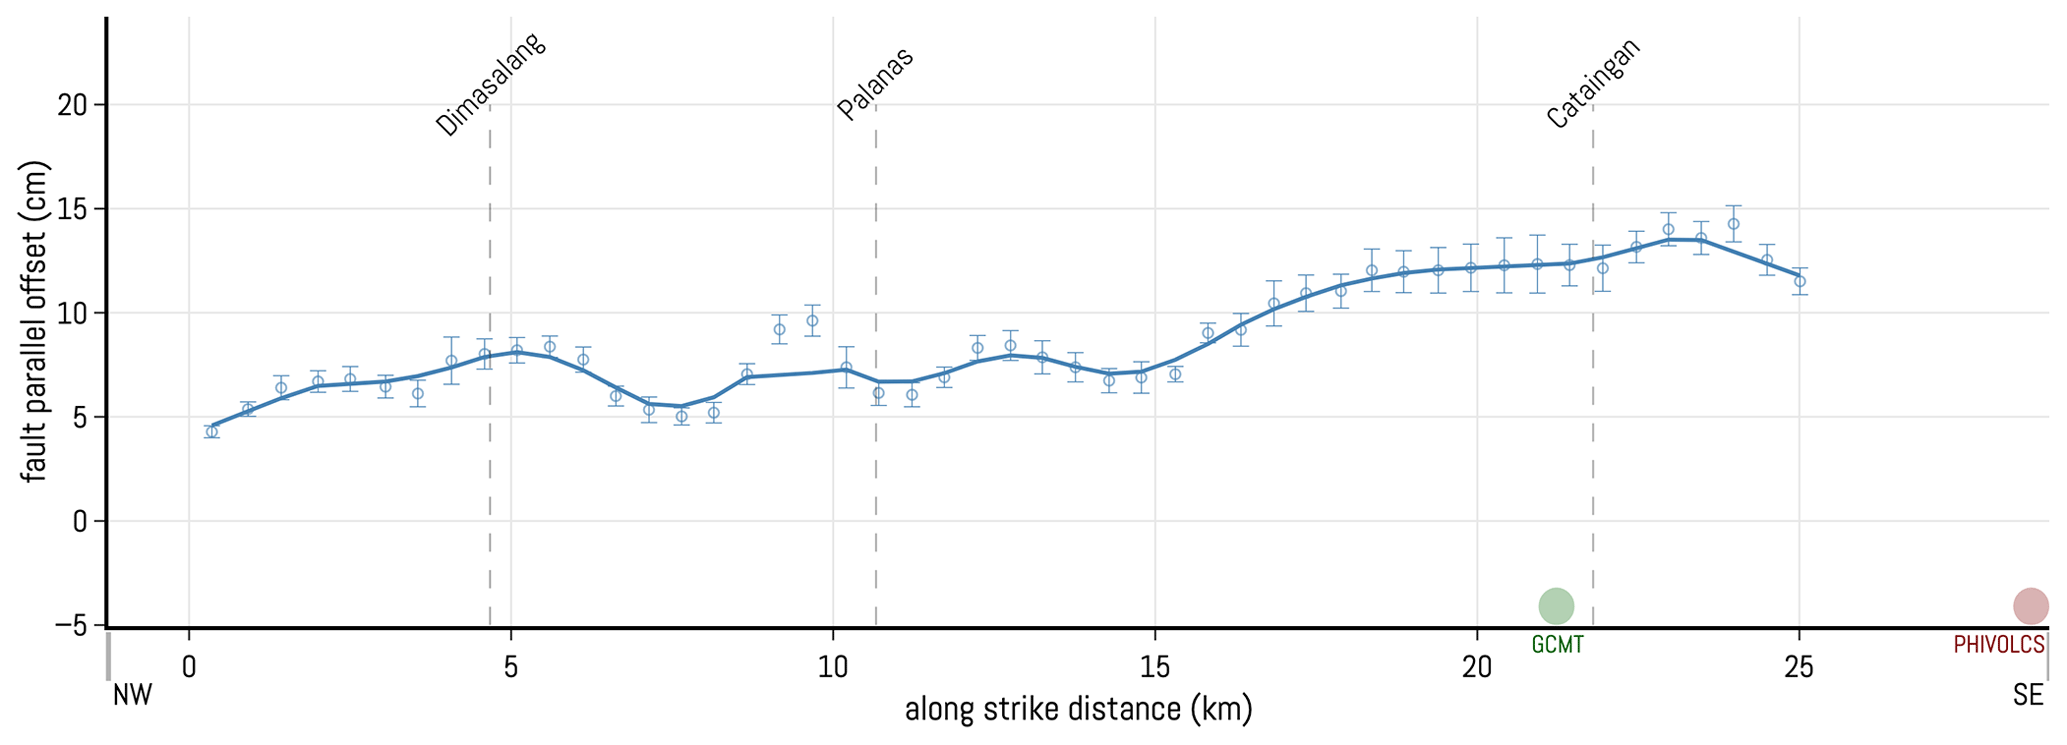
Figure 9Along-strike distribution of the fault-parallel afterslip formed by the 49 profile boxes. Error bars refer to the 1σ standard errors of the intercepts of regressions of the eastern and western blocks. Solid blue line shows the weighted moving mean afterslip curve.
4.4 Ground truthing
4.4.1 Observed surface ruptures
Remnant effects after about 2 years post-earthquake were observed on laterally offset cultural and geomorphic features from Dimasalang to Cataingan following the known fault trace (Sect. S2). Assisted by the remote sensing data, the observed ground manifestation of the earthquake from 57 stations (Fig. 10a and b) include fractures, reported earthquake-induced landslides (EIL), indications of liquefaction features and lateral spreading, secondary gravitational features, and ruptures with quantifiable displacements. Earthquake effects recorded during the field activity include reported ground shaking from interviews with locals.
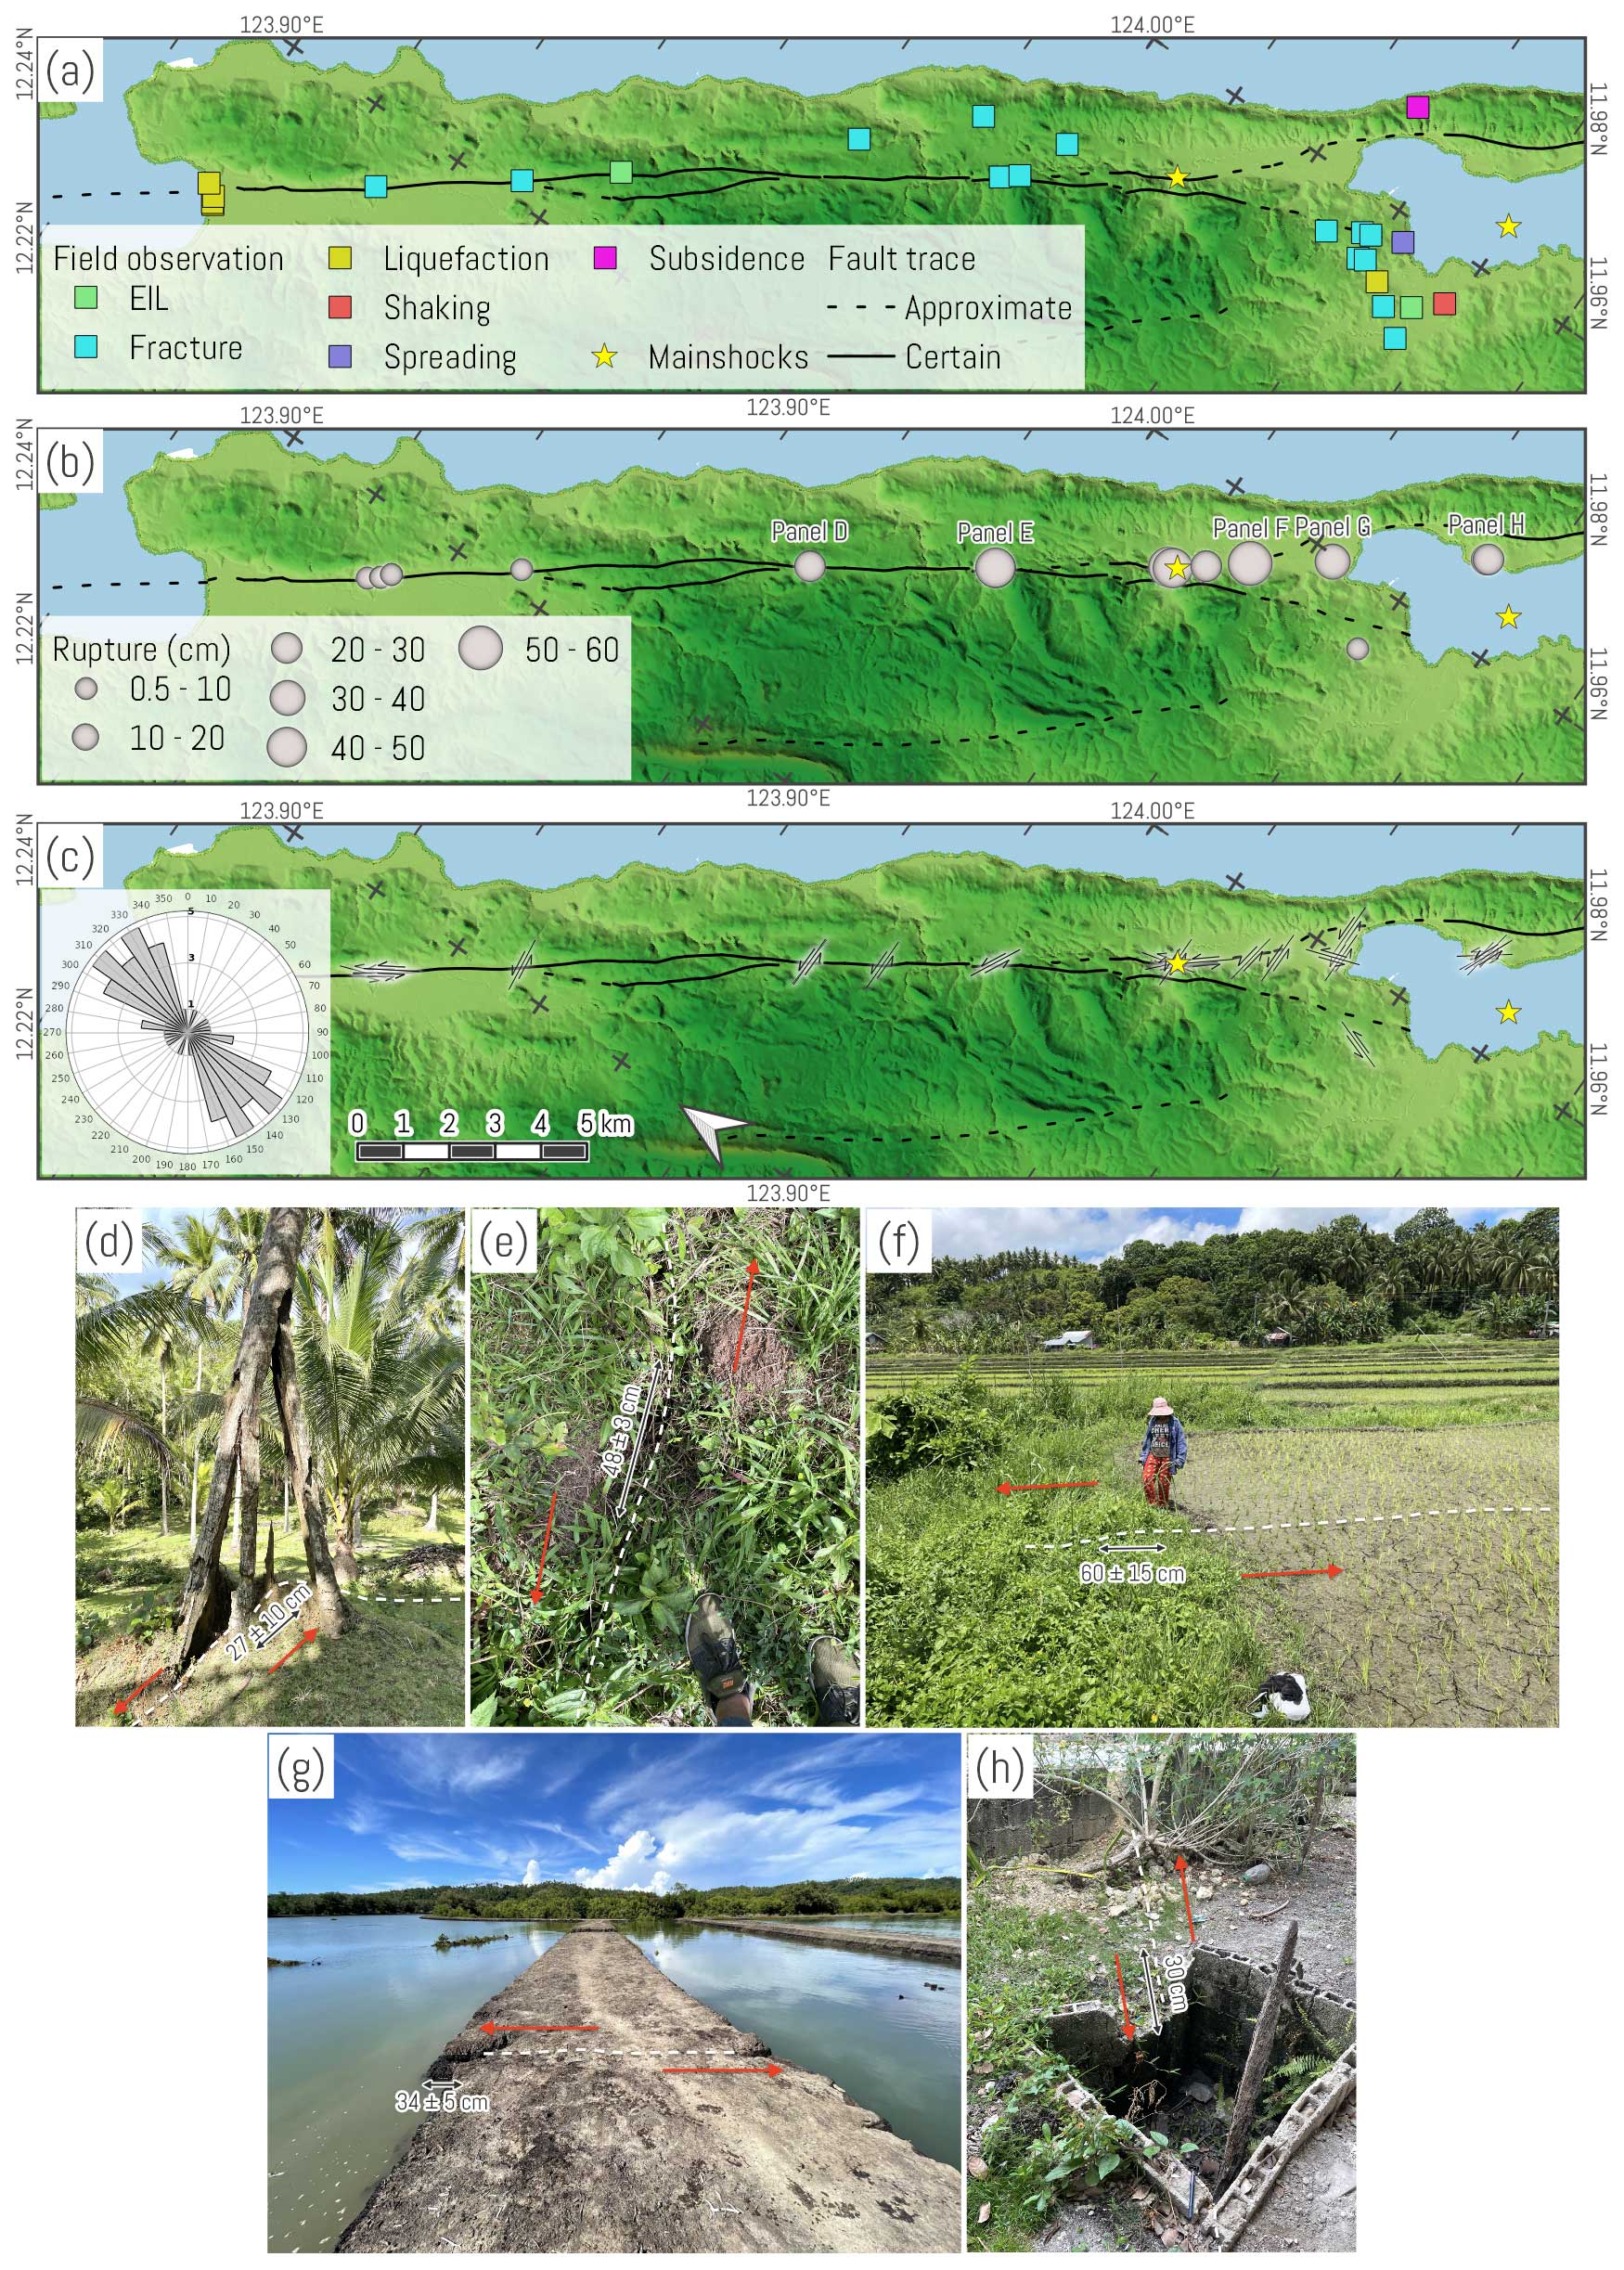
Figure 10Compiled ground-truthing data: (a) earthquake hazards aside from ruptures, (b) ruptures symbolized by size showing the amount of slip, (c) rupture orientations, (d) ruptured tree showing cumulative 87 cm slip from 2003 and 2020 events with estimated 27±10 cm offset from the 2020 earthquake, (e) soil mound cut by the fault highlighting a 48±3 cm left-lateral offset, (f) rice field embankment traversed by fault showing 60±15 cm displacement, (g) ruptured fishpond dike recording a 34±5 cm offset, and (h) abandoned septic tank showing a 30 cm displacement south of Cataingan Bay.
The observed rupture zone of the 2020 Masbate earthquake persisted from Dimasalang to Cataingan and crossed Cataingan Bay. Measured surface ruptures strike at a low angle with respect to the regional fault trace (Fig. 10c) with a mean strike azimuth of 313°. Our northernmost resolvable ground offset was observed on a road in Dimasalang, around ∼3 km from Naro Bay. An apparent 0.5 cm offset fracture oriented parallel to the fault trace was recorded in this point, possibly representing the minimum northward constraint of the field rupture. A 2–5 cm displacement oriented 325° NW occurring on a residential structure on top of the fault was observed on the border between Dimasalang and Palanas. The rupture displacement increased further south ∼7 km from the northern shoreline, where a 7 cm left-lateral offset was seen coupled with spreading of the road pavement. The fault bisected a coconut tree at the southern limit of the fault complexity in Palanas (Fig. 10d) (Aurelio, 2022), resulting in a cumulative 87 cm opening from the 2003 and 2020 events. The newer slip is estimated at 27±10 cm on a 275° W-oriented rupture. Right-stepping en echelon fractures occurred adjacent to the coconut tree, most of which were eroded at the time of visit.
The rupture is continuous southward, up to 4 km from the GlobalCMT centroid projection. The fault rupture traversed an abandoned house and deflected its wall by roughly ∼50 cm. A soil mound at the base of the wall (Fig. 10e) shows a 297° W-oriented rupture with a 48±3 cm left-lateral offset. Residents reported a ∼200 m-long rupture in the area, which was already mostly eroded. Nevertheless, the remnant right-stepping en echelon fractures formed a linear rupture zone connected to the displaced wall. A 30 cm offset oriented 279° E on a road in Cataingan likely represents the northern indication of the rupture bisecting the bifurcation in Cataingan. The rupture continued to an agricultural area (Fig. 10f), where the embankments are displaced by 60±15 cm, representing the peak field offset measurements. Long, continuous ruptures were observed on the rice fields immediately after the event but were erased by the time of the field investigation. Another southerly continuation was identified, where a 341° NW-oriented rupture displaced fishpond levees (Fig. 10g) by about 34±5 cm. Locals stated that the visible rupture appeared lengthy and continuous in the deltaic areas immediately after the earthquake. The rupture was evident again south of Cataingan Bay, manifested on a collinear set of points through several residential structures. A septic tank diagonally cut by a 279° NW-oriented rupture shows a 30 cm left-lateral displacement (Fig. 10h). Offset measurements adjacent to the septic tank vary from 5 to 30 cm.
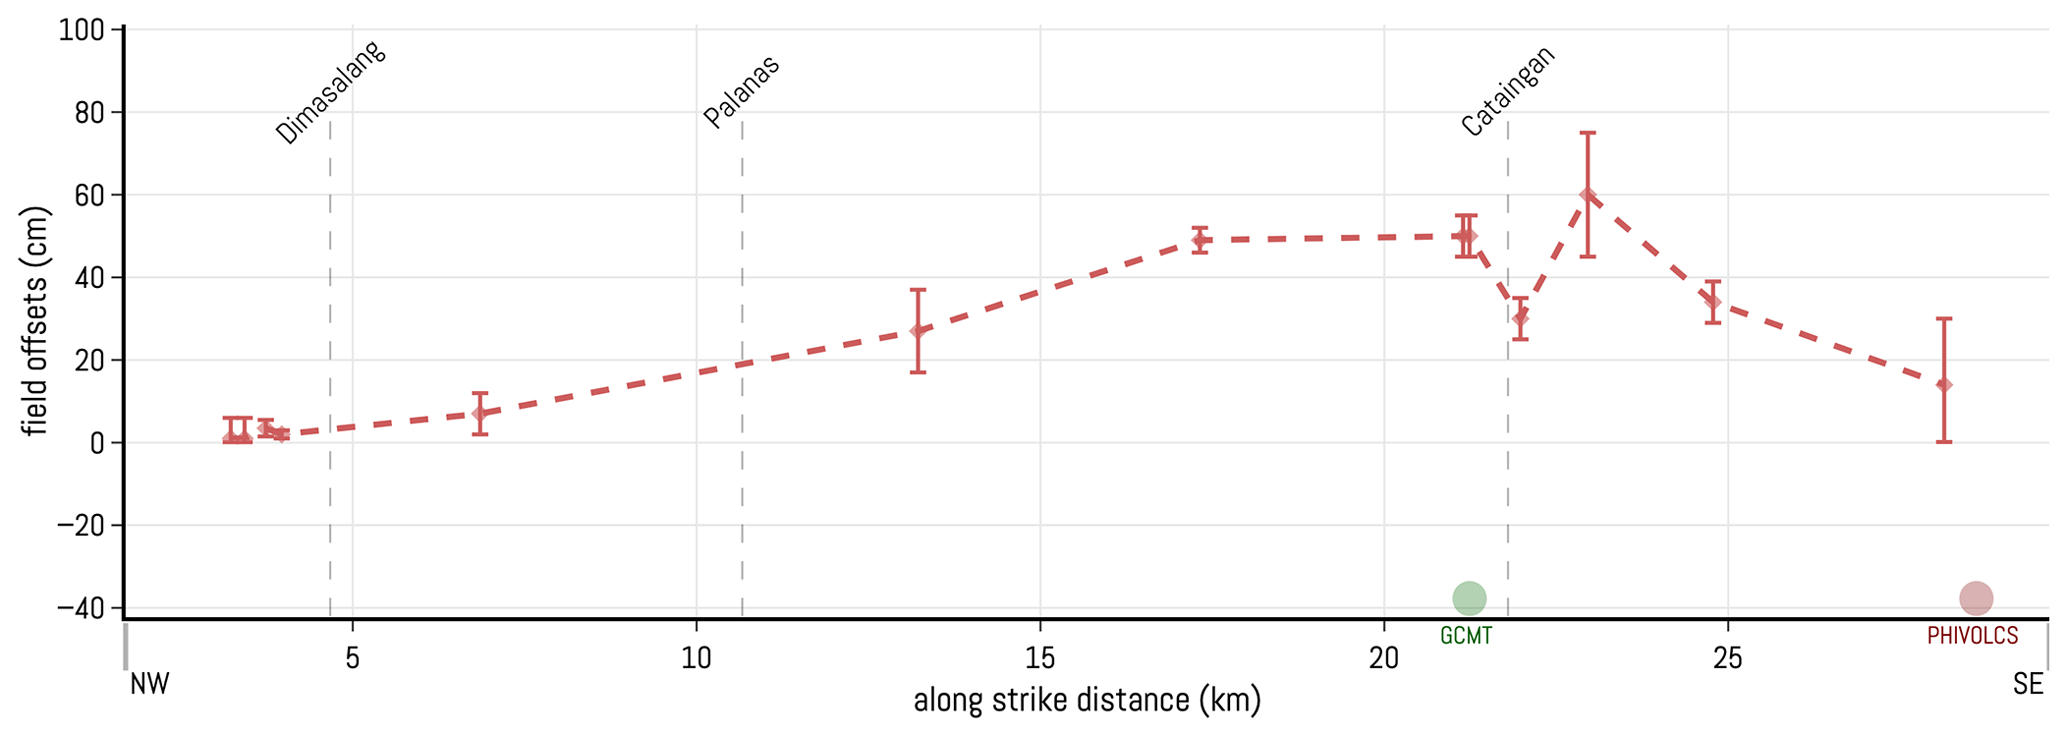
4.4.2 Left-lateral offset distribution
The plot of offset features along the fault strike (Fig. 11) and shows the minimum 0.5 cm left-lateral displacement ∼3 km from Naro Bay in Dimasalang. This point corresponds to the northernmost resolvable ground offset. The measurements continually increased to 50 cm beginning at 17 km from Naro Bay, around the boundary of Palanas and Cataingan. The offset measurements remained constant for a ∼4 km span followed by an abrupt dip to 30 cm, which increased again to the peak 60 cm offset. The local 30 cm minimum was measured on a ruptured road. This single discordant measurement could be due to off-fault displacement, physical reduction due to post-earthquake repairs, or an inaccurate measurement from a cultural feature. The displacement tapered to 30 cm near the shoreline of Cataingan Bay. Spatially coincident offsets ranging from 5 to 30 cm resulted in a wide range of uncertainties at the southeastern limitation of the plot. The weighted moving mean curve of the slip distribution (broken red line in Fig. 11) for the 2020 Masbate event indicates a 25.3 cm mean left-lateral displacement, while the individual observations denote the maximum of 60 cm displacement near the GlobalCMT centroid projection.
5.1 Comparison of optical correlation and InSAR
5.1.1 Displacement threshold
Independently applying optical correlation and interferometry to analyze the 2020 Masbate event provided a basis to assess the technical capabilities and shortcomings of the methods in a tropical setting. Peak displacements of the Masbate earthquake amount to ∼60 cm, denoting a high interferometric phase gradient for Sentinel-1. SAR interferograms lose coherence when offsets exceed half the interferometric fringe per pixel (Michel et al., 1999), highlighting the effectiveness of the method for small deformations on millimeter and centimeter scales (Tronin, 2006). The LOS measurements of PHIVOLCS (2020) and Tiongson and Ramirez (2022) from coseismic interferograms are likely underestimated due to data loss because of the high phase gradients and near-field decorrelation on the coseismic interferograms (Fig. 7).
The ability of InSAR to detect centimetric displacements was evident when comparing the post-seismic and coseismic interferograms. The rupture trace is conspicuous and the offset is observable in both the near field and far field of the post-seismic interferograms. Left-lateral afterslip measurements are at least 4–14 cm with an average 1σ uncertainty of 1.5 cm. Millimeter-scale offsets were not detected given the coarse 80 m pixel resolution and noise of the resultant interferograms.
Optical correlation is useful to assess the near-field region (Avouac et al., 2006) and larger displacements equivalent to at least one-tenth of the pixel resolution (J. Elliott et al., 2020; Leprince et al., 2007). Results show that near-field displacements are resolved (Figs. 5 and 6) despite noticeable high noise levels. OIC, using PlanetScope data with 3.125 m pixel resolution, was able to detect left-lateral offsets between 7 and 60 cm in the near field but with a larger 19.9 cm 1σ average uncertainty than InSAR due to noise. Thus, careful interpretation of swath profiles is crucial to identify valid measurements because noise easily overprints tectonic signals. Noise signals are amplified by misaligned acquisition geometry, unequal solar illumination angle, and insufficient geometric corrections (J. Elliott et al., 2020; Stumpf et al., 2017). The representative 9 April 2020 to 2 April 2021 (satellite ID 1105) images had decent illumination and acquisition geometry agreement (Table 1), and support the validity of the measurements.
5.1.2 Temporal baseline
The pair classes of PlanetScope orthoimages used in the study showed that images roughly 1 year apart resolved the rupture far better than those imaged months apart primarily due to the contrasting vegetative cover. Satellite images from the same seasons are critical for optical correlation because feature similarity helps the algorithm match features more accurately (A. Elliott et al., 2020). Feature matching in agricultural and developing areas can be difficult in the subpixel domain given the difference in crop patterns and rapid anthropogenic development, leading to differing pixel intensity values in the pre-event and post-event images (Barnhart et al., 2011).
Images that are 1 d apart generate deformation fields with minimal seasonal and anthropogenic artifacts. However, this may have exceptions such that correlations for the 2016 Fukushima earthquake using 1 d interval drone images resulted in noisy deformation fields with low correlation (Sotiris Valkaniotis, personal communication, 2021). Single-day intervals were not tested in Masbate due to the lack of usable orthoimagery in terms of study area coverage, compatible acquisition parameters, and cloud cover.
DInSAR relies on coherence to resolve the deformation along the LOS direction, which is controlled by the similarity of point scatterers between the acquisitions. Good coherence in urban areas and dry deserts that remain constant throughout several years produce quality interferograms (Wang and Fialko, 2014; Wei and Sandwell, 2010), which indicate the capability of interferometry to function for longer periods. However, in other types of surface cover, such as vegetation and snow, coherence has an inverse relationship with temporal 6 d revisit of Sentinel-1 conveniently dictating the pre-event and post-event radar data pairing in areas affected by sub-optimal land cover. The baseline can be increased for L-band satellites, such as ALOS-2, for they can detect the bare ground irrespective of surface cover. Interferograms with severe unwrapping errors are manually excluded in the time-series analysis (Yunjun et al., 2019), effectively limiting the temporal baseline range to 6–12 d.
5.2 Accuracy of optical correlation
The slip distribution from optical correlation agrees with the offset feature measurements from the field survey (Fig. 12a). The weighted moving mean of the pixel offset measurements unifies the six valid pairs to compensate for data gaps that particular pairs are unable to resolve. The variance between the pixel offsets and field measures is typically ∼2 cm with a maximum ∼17 cm. The larger difference is interpreted to be a local variation or measurement error since the specific point was taken on a repaired road section, which the remote sensing approach may have missed as it generally detects the overall deformation and is less sensitive to local slip.
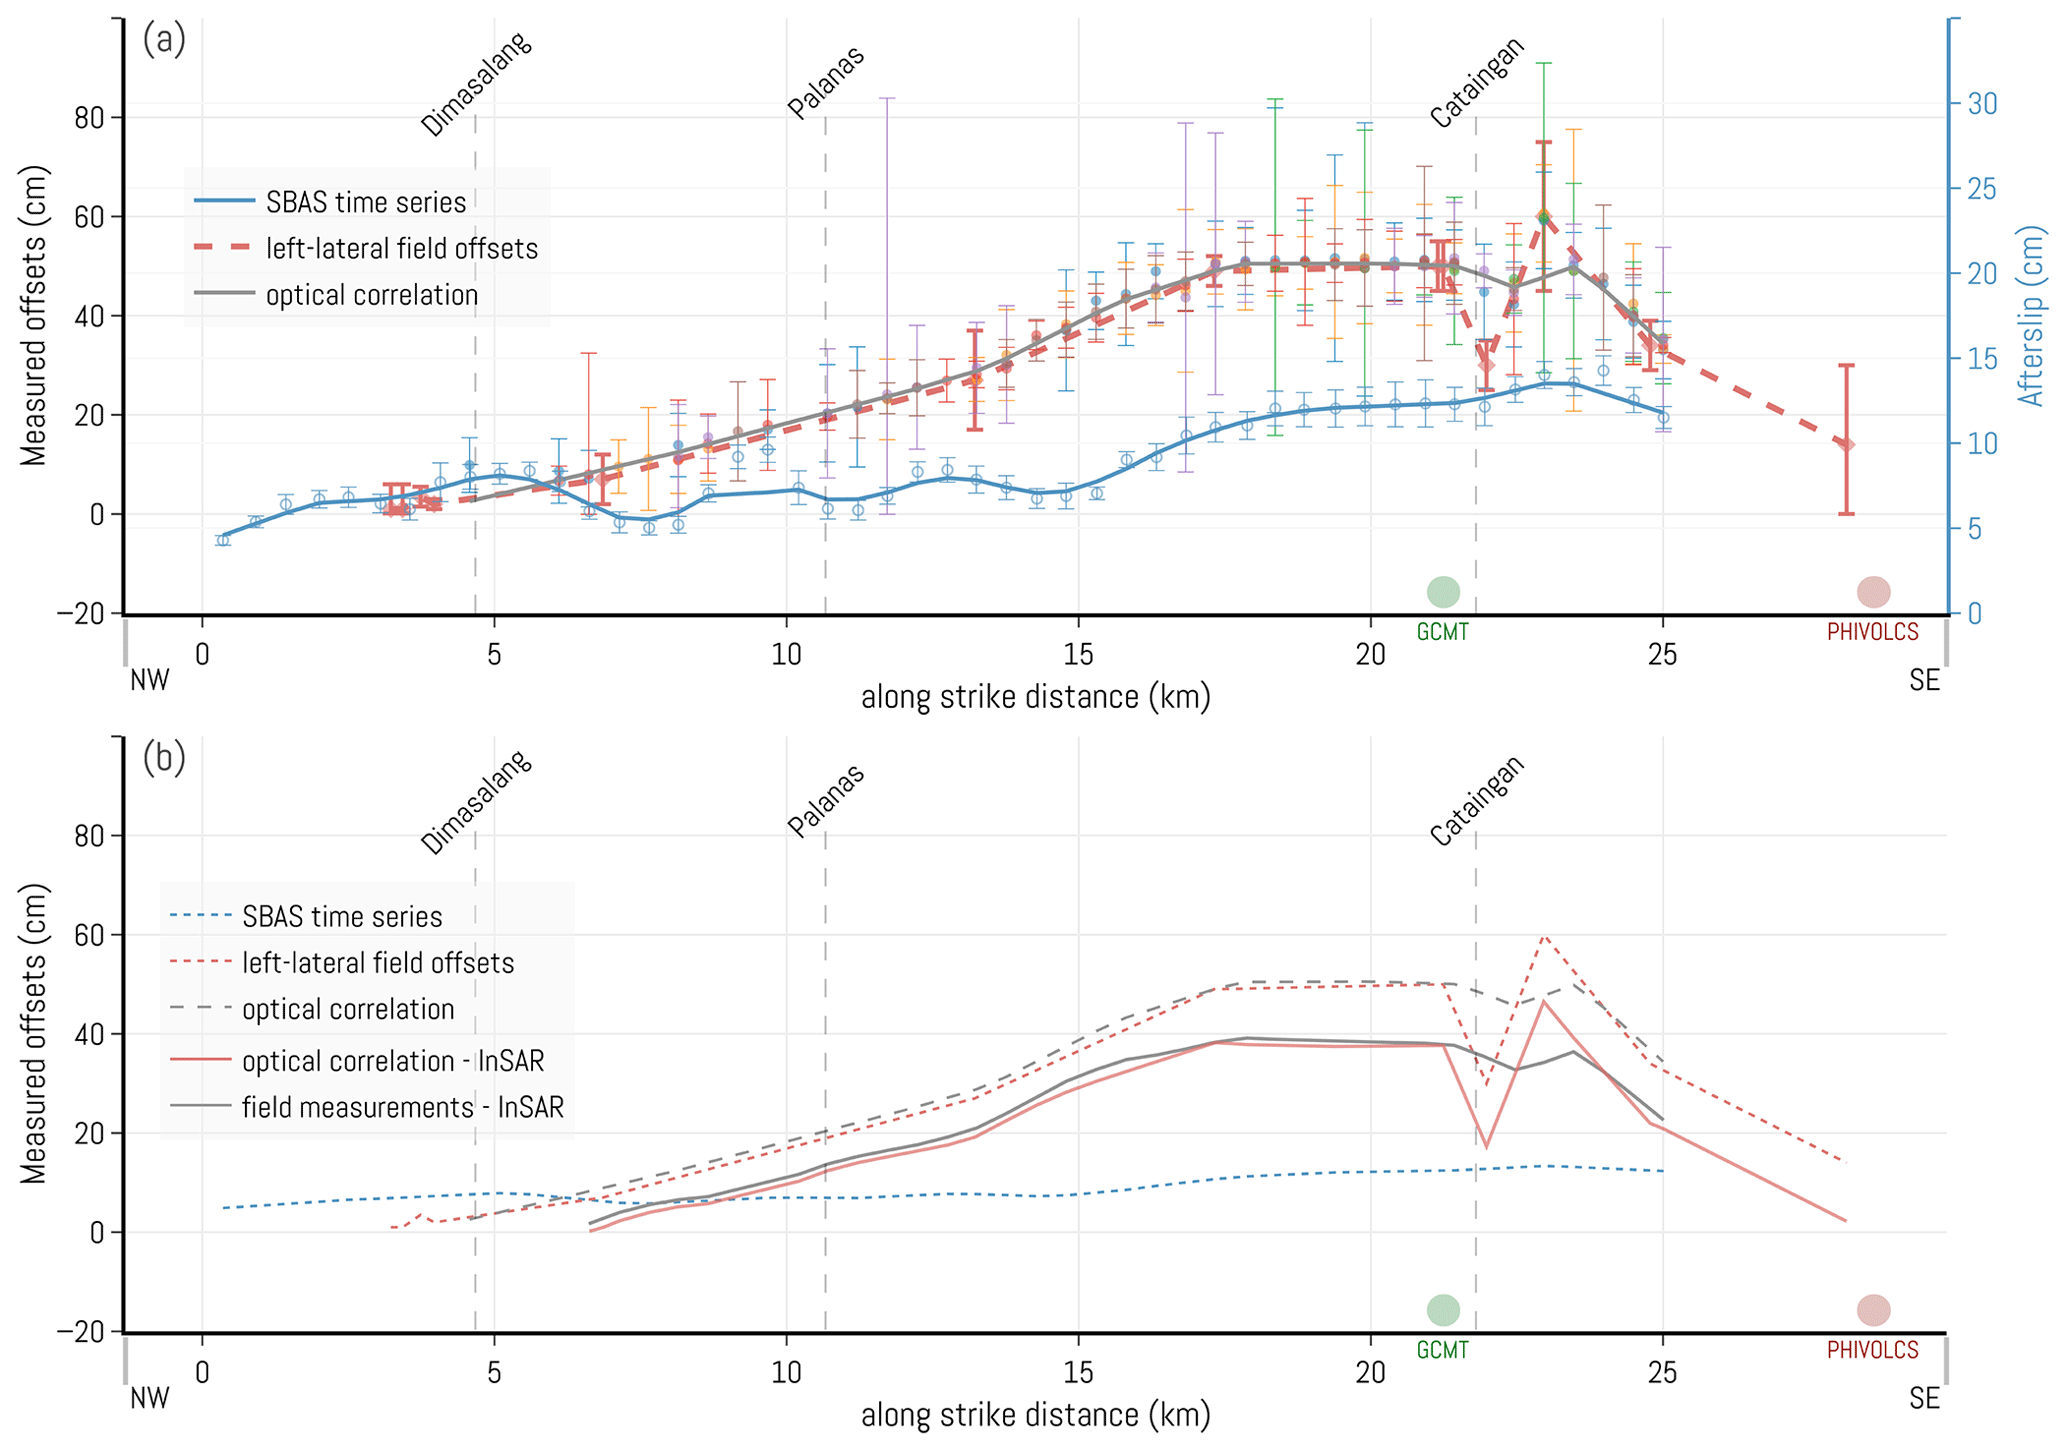
Figure 12Combined slip distribution plots: (a) solid gray line shows the weighted moving mean of the six valid optical correlation pairs, dashed red line represents the weighted moving mean of the field measurements, and blue line as well as markers represent the afterslip from InSAR placed in a secondary axis; (b) residual curves of the weighted moving mean pixel offsets and field measurements with InSAR to estimate the coseismic slip.
Previous studies show varying degrees of misfit between field offsets and remote sensing data (Cheloni et al., 2014; Gold et al., 2021). These misfits were attributed to diffuse displacement, secondary faulting, and shallow fault complexities. Our measurements, however, show consistency and minimal short wavelength variability. This may be a consequence of the 2-year interval between the earthquake event and the field survey as most surface traces have been modified by active surface processes. Furthermore, ruptures on unconsolidated overburden are easily erased due to active weathering and erosion, leaving only the most prominent traces to remain. Similarly, abundant vegetation, challenging surface conditions, and relatively small tectonic displacements compromise the clarity of the resolved rupture and efficacy of optical correlation. Nevertheless, OIC outputs indicate that the remote sensing results accurately capture ground displacements and provide greater along-strike coverage.
The extent of detectable rupture is another fundamental difference between optical correlation outputs and field measurements. The northern rupture terminations are situated 4.6 and 3.2 km from Naro Bay for optical correlation and field survey, respectively. To the south, OIC measurements cease at the shore of Cataingan Bay since no slip measurements are attainable on the opposite side of the water body, where the field survey revealed more ruptures as the fault resurfaced therein. Neither method can resolve slip on submerged fault segments, requiring the use of complementary marine survey techniques and datasets that cover the ocean floor.
5.3 Surface rupture kinematics
5.3.1 Constraining the coseismic slip
The temporal range of the pixel offset rasters and field investigation date implies the presence of both coseismic and post-seismic slip components in the optical correlation measurements and field measurements. To estimate the peak coseismic offsets, we subtracted the largest afterslip value from the peak pixel offsets and field measures. The average values were derived from the mean of residuals of the moving mean curves of the two total slip measures with InSAR (Fig. 12b). From this, the estimated peak coseismic slip amounts to 46.3±10.7 cm from the optical correlation and 45.7±15.9 cm from the field measure residuals. The average values are 27.7 and 24.3 cm from pixel offsets and field measures, respectively.
5.3.2 Coseismic offsets
The amount of coseismic slip is a key factor in the assessment of seismic moment, rupture mechanism, and degree of seismic hazard. The results of this study show a unimodal curve with a characteristic long wavelength and isolated short wavelength variability for the regional slip distribution (Fig. 12). The pattern suggests a low generalized resolution due to temporally influenced smoothing and noise. In addition, the long wavelength trend can also indicate fault maturity (Allam et al., 2019), which is a credible interpretation for the Masbate segment of the PF given its Middle Miocene initiation and rate of activity (Fitch, 1972; Tsutsumi and Perez, 2013; Pinet and Stephan, 1990). Moreover, the known fault trace in Masbate is morphologically linear, supporting the general maturity estimate (Manighetti et al., 2021).
Slip distributions can give clues into the fault complexity and mechanical properties of the fault plane (Allam et al., 2019; Bruhat et al., 2020; Perrin et al., 2016). This suggests that the observed unimodal slip distribution with a singular peak implies a relatively simple fault zone at depth, subject to validation through geodetic inversion. Such peaks usually define the location of the ruptured asperity (Kaneda et al., 2008) where the highest stress drop occurs due to peak moment release from the accumulated potential energy (Freymueller et al., 1994).
Our seismotectonic interpretations (Sect. 5.4) imply a variable slip distribution on the submerged sections of the Masbate segment of the PF since it represents the primary depression of the identified transtensional basin. This inferred slip trend may portray a complex shallow fault structure in this section as the slip is distributed on multiple fault segments (Avouac et al., 2006; Allam et al., 2019; Wang et al., 2022). Moreover, recent marine geophysical surveys in the vicinity of Cataingan Bay (Llamas and Marfito, 2022) revealed the geometric complexity of the fault, which supports our interpretation.
Offset values gradually decay to zero toward the northwest. The smooth slip trend, devoid of short wavelength variation, suggests a systematic rupture (Treiman, 2002) on a relatively simple sub-vertical fault plane (Allam et al., 2019; Chen et al., 2021). Tapering and deepening aftershock patterns along with the focal mechanism solutions could support this observation.
5.3.3 Post-seismic offsets
Our interferometry results denote a 14 cm largest afterslip, which accounts for at least 30 % of the estimated peak coseismic displacement over the rapid aftershock decay interval. This lower-limit estimate is a consequence of the 6 d revisit cycle of Sentinel-1, resulting in incomplete data since the first radar image in the time-series stack was from 20 August 2020, and does not include the earliest post-seismic deformation immediately after the 18 August 2020 mainshock.
The distribution of afterslip (Fig. 12) along the fault demonstrates a general slip increase southwards, which can be divided into two distinct sections. The northern ∼15 km section is characterized by short wavelength variations and average left-lateral offsets of 5–6 cm, whereas the southern section includes the peak afterslip without distinctive variability. The northern trend may indicate the occurrence of diffuse afterslip on a wide zone, which may or may not have breached the surface. Chen et al. (2021) suggested an increased relative friction such that the released post-seismic moment is typically less compared with the mainshock, resulting in heterogeneous loading. However, we cannot exclude the possibility that variability may stem from surface complexities or data processing artifacts, as indicated by the observed unwrapping errors and the lack of data from the earliest post-seismic period.
Post-seismic deformation usually occurs outside the regions of peak coseismic slip as the shear stress is transferred by the mainshock and causes stress loading at the locations of incomplete rupture and unruptured sections (Johanson, 2006; Bürgmann et al., 2021). Our results reflect the coincidence of the post-seismic and coseismic slip distributions on the surface, whose maxima are aligned and equidistant from the centroid, accompanied by a gradual slip recession northwards (Fig. 12). This is similar to the 1999 Izmit (Reilinger et al., 2000), 1996 Biak (Das and Henry, 2003), 2011 Maduo (Wang et al., 2019), and 2014 South Napa (DeLong et al., 2016) earthquakes, which also exhibit spatially overlapping coseismic and post-seismic slip distributions. We interpret this overlap of the slip distributions to indicate a vertical stress migration along the fault surface to either deeper or shallower sections of the fault.
Aseismic afterslip, viscoelastic relaxation, and poroelastic rebound are the common mechanisms of post-seismic deformation (He et al., 2021; Tomita et al., 2020). The existence of resolvable afterslip is a clear indication of post-seismic activity as the stress is released by the mainshock. Our observed coincidence of the coseismic and post-seismic slip distributions probably indicates a localized stress transfer to the adjacent velocity strengthening vicinity of the primary asperity in accordance with the rate-and-state friction model (Marone et al., 1991). This would suggest that the post-seismic deformation is likely stress driven (He et al., 2021) and operated as aseismic afterslip (Johanson, 2006) to accommodate the excess coseismic stress. This also agrees with the hypothesized vertical migration of stress along the fault plane.
We recognize that the data are limited to surface measurements and more information is required to accurately describe the occurrence of the afterslip along the fault plane. Determining the mechanics of the superposed slip character of the 2020 Masbate earthquake event is of interest and warrants investigation into potential factors such as non-steady-state friction (Helmstetter and Shaw, 2009), residual stress heterogeneity (Wang et al., 2019), stress reorganization, or shallow material redistribution (He et al., 2021). Additionally, the contribution of known interseismic creep associated with the Masbate segment to the slip distributions merits further investigation.
5.3.4 Surface rupture length
Surface rupture length estimates from remote sensing data were assumed to be symmetrical about the peak displacement zone (Table 3). The ground displacement distributions from optical correlation and field survey (Fig. 12) imply that the northern rupture terminus is located approximately 3.2 km from the northern shoreline, with peak slip values occurring between 17.3 and 23.5 km, resulting in rupture length estimates ranging from 28.2 to 41 km. The absence of offset measurements in the submerged portions of the fault necessitated the use of interpolation. Given the asymmetrical nature of strike-slip distributions, which can take on either elliptical or triangular forms (Perrin et al., 2016), caution is critical when interpreting the interpolated values. The rupture lengths are also measured from the total length of the field survey and its extension toward the stepover in Cataingan Bay (Llamas and Marfito, 2022) resulting in 25 and 35.6 km rupture lengths, respectively.
Table 3Measured rupture parameters with corresponding moment magnitude (Wells and Coppersmith, 1994) and seismic moment (Hanks and Kanamori, 1979).
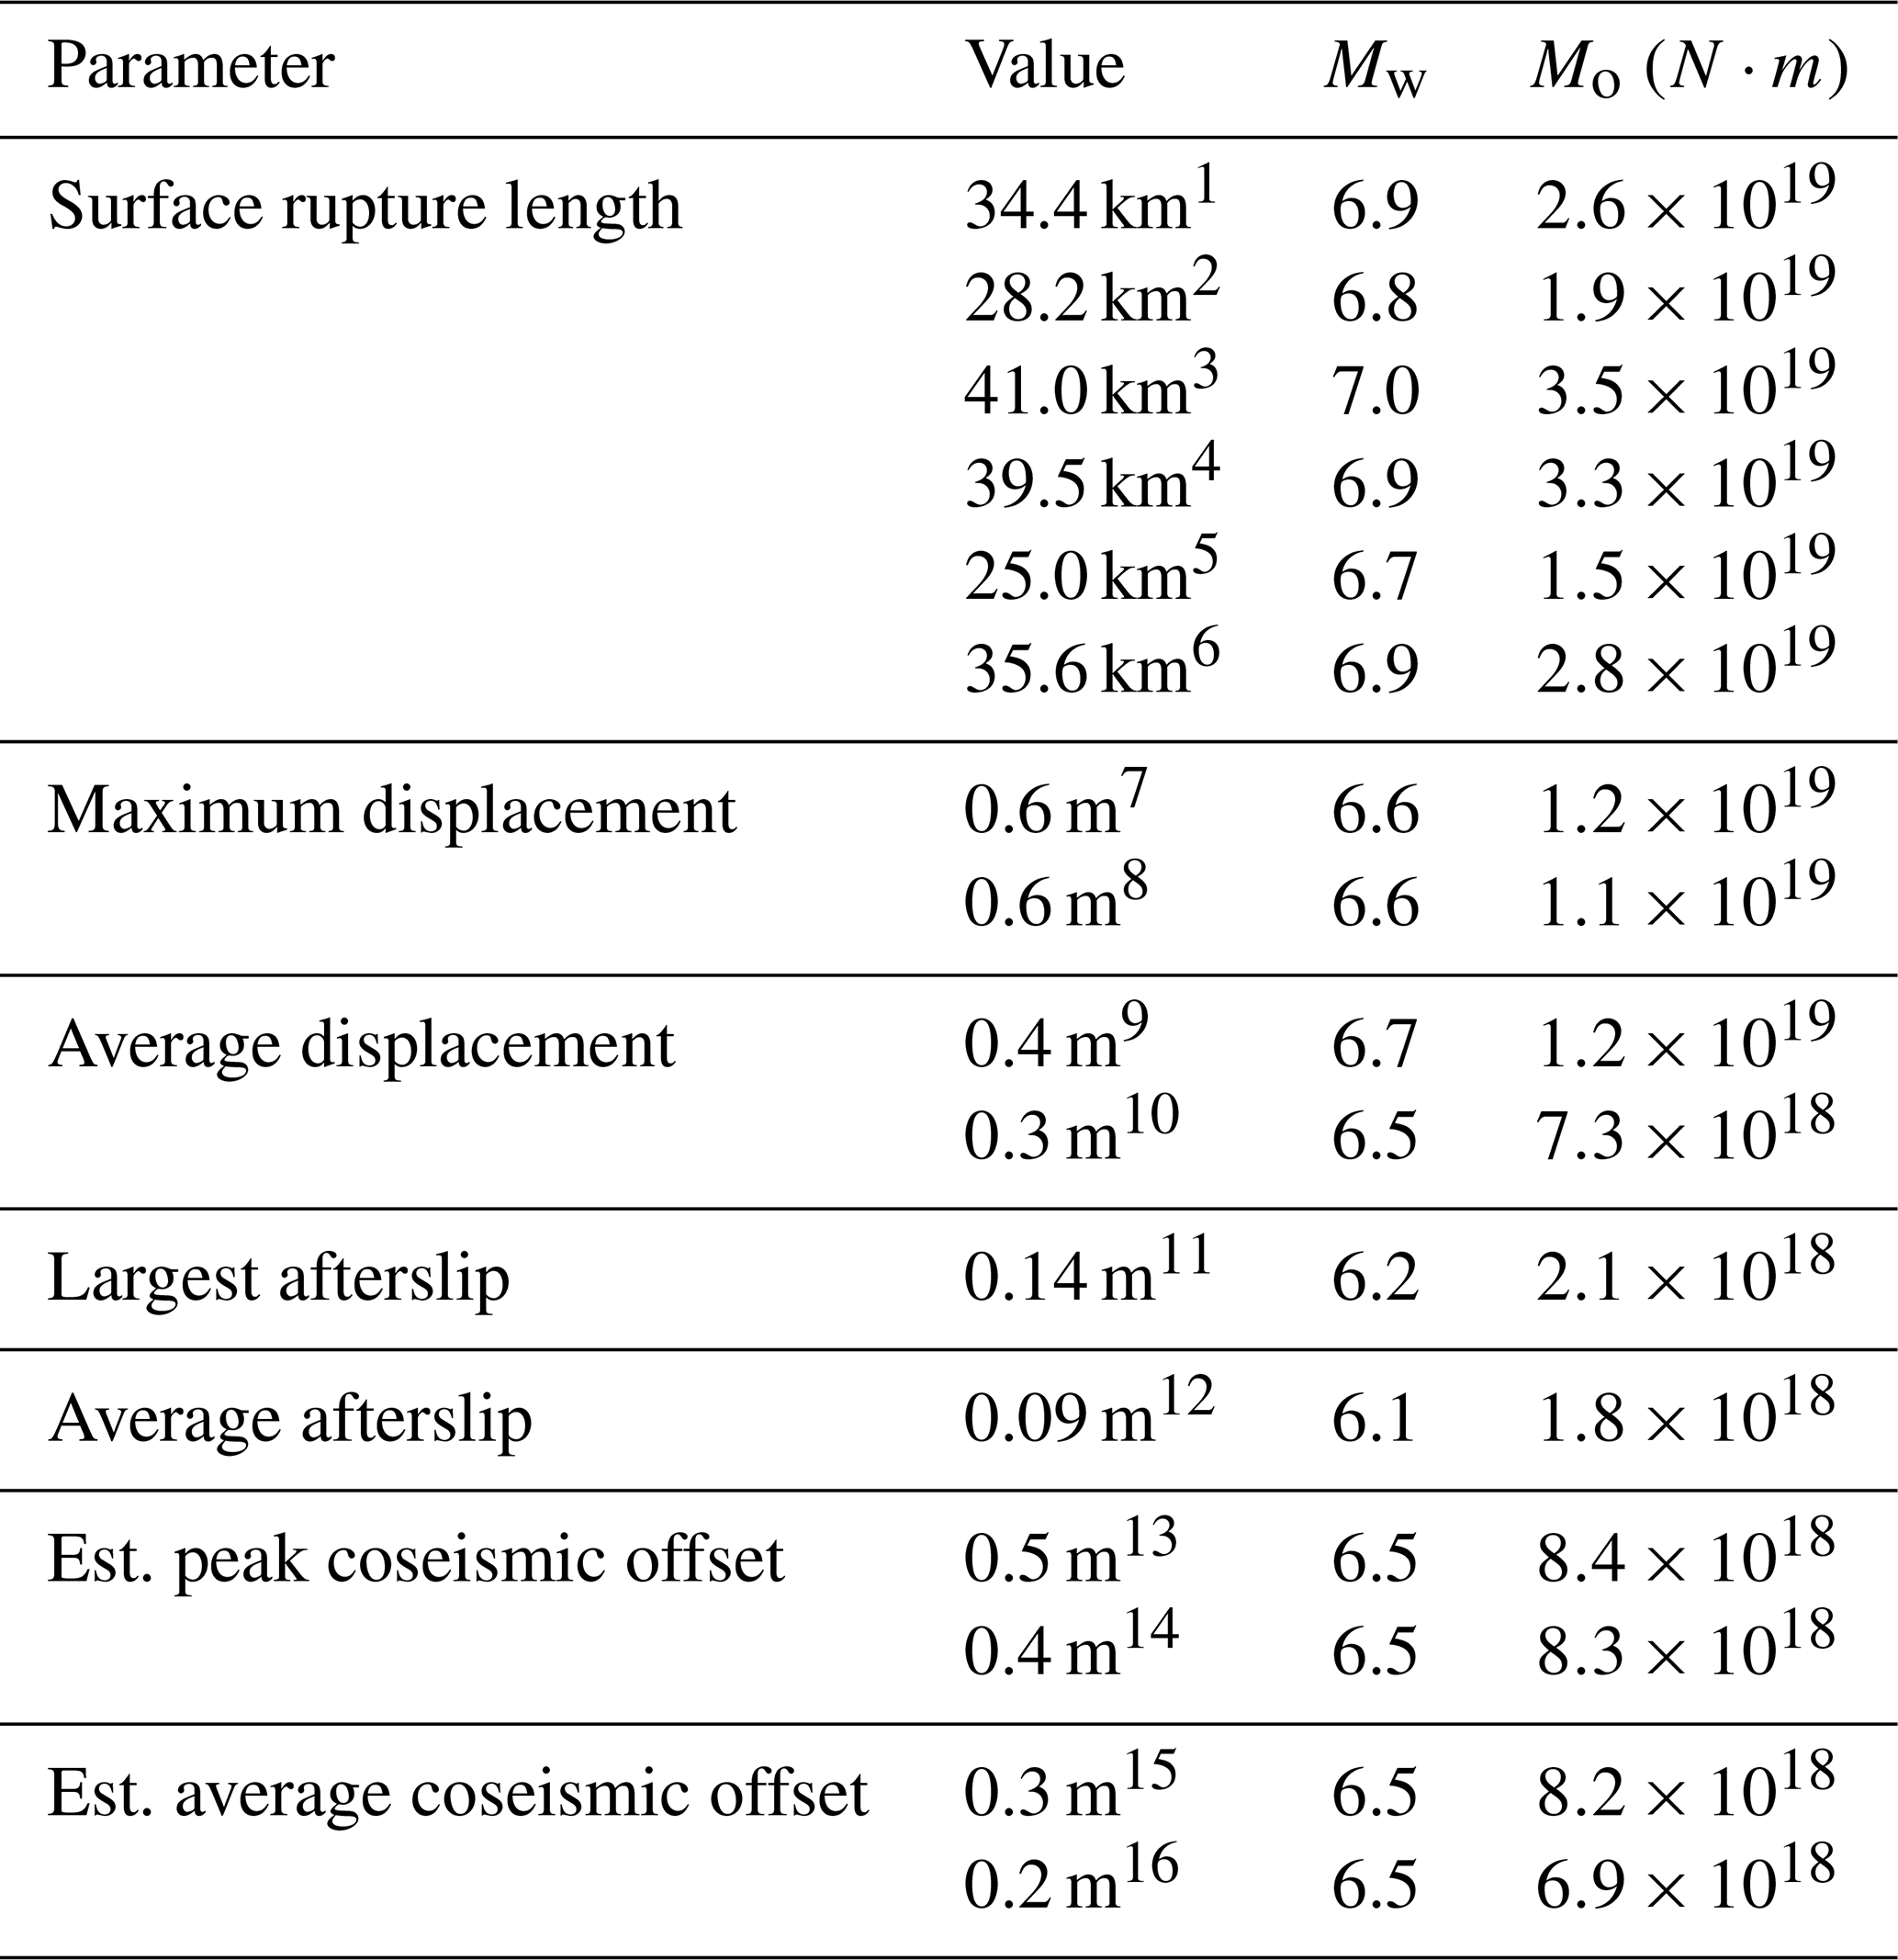
1 Symmetrical about the midpoint of the zone of peak displacement. 2 Symmetrical about the lower limit of the zone of peak displacement. 3 Symmetrical about the upper limit of the zone of peak displacement. 4 Symmetrical about the peak displacement. 5 Cumulative rupture length from the field survey. 6 Cumulative rupture length from the field survey extended to the onshore stepover identified by Llamas and Marfito (2022). 7 From optical correlation. 8 From field survey. 9 From the weighted moving mean curve of optical correlation outputs. 10 From the weighted moving mean curve of field measurements. 11 Highest individual measurement from InSAR. 12 From the weighted moving mean curve of InSAR. 13 Peak optical correlation value minus peak InSAR value. 14 Peak field measurement minus peak InSAR value. 15 Average of the residuals between the weighted moving mean curves of optical correlation and InSAR. 16 Average of the residuals between the weighted moving mean curves of field measurements and InSAR.
5.3.5 Seismic moment estimates
Moment magnitude (Mw) and seismic moment (Mo) estimates for the 2020 Masbate event were calculated from the surface rupture parameters (Table 3). Mw calculations used the corresponding empirical equations from regression of rupture parameters and moment magnitudes (Wells and Coppersmith, 1994). The Mo was derived as a function of Mw from scaling relationships (Hanks and Kanamori, 1979). This approach was preferred over directly calculating the Mo from the rupture area and material rigidity due to the lack of reliable estimates of rupture width and subsurface fault rupture parameters.
The Mw estimates from the maximum and average displacements range between Mw 6.5 and Mw 6.7. The estimated maximum and average coseismic offsets all equate to Mw 6.5. The values closely fit the instrumental 6.6 moment magnitude. All rupture length estimates returned high Mw values between Mw 6.7 and Mw 7.0 which agrees with the 2003 earthquake observations, wherein the fault rupture is longer than expected relative to the magnitude. However, a downward counterfactual approach (Woo and Mignan, 2018; Woo, 2019), given the fault uncertainties at depth, suggests the probability of the larger Mw estimates. Nevertheless, the estimated coseismic displacements reasonably fit with the instrumental seismic moment of the mainshock. The calculated Mw 6.5 value from the estimated coseismic slip parameter is consistent with a seismic moment of 8.4×10¹⁸ N⋅m.
The lower limit of the post-seismic moment was assessed using the largest and average afterslip values (Table 3). The largest afterslip, which measured 0.14 m, corresponds to Mw 6.2, while the average afterslip of 0.09 m is consistent with Mw 6.1. By comparing the largest afterslip value () with the peak coseismic moment, we estimate that the afterslip resulted in the release of energy equal to at least 25 % of the mainshock.
5.4 Seismotectonic implications
5.4.1 Surface rupture morphology
The fault geomorphology (Fig. 10c) and geodetic observations (Figs. 5 and 8) highlight the linearity of the Masbate segment. However, the fault complexity (Tsutsumi and Perez, 2013) around 12°07'N was not clearly defined due to unwrapping errors in interferometry and high-amplitude noise in optical correlations.
The ruptures in Palanas form a right-stepping Riedel shear zone, with the ruptures occurring at a low angle with respect to the regional fault strike. Furthermore, a possible new splay was observed to the south, which potentially represents the primary fault plane, cutting across the bifurcating trace and traversing Cataingan Bay. Antithetic shears were observed at the bifurcation point and along the cross-cutting splay.
Topography and bedrock geology may also control the rupture (Kaneda et al., 2008) such that the southwestern rupture termination is observed on an alluvial plain, succeeded by rugged topography northwards. The fault complexity in Palanas and the bifurcation point in Cataingan coincide with the stratigraphic contacts of the Late Oligocene Nabangig and Miocene–Pliocene Buyag formations. The previously identified fault complexities in this area may reflect the rheological contrast between the clastic limestones of the Nabangig Formation and the conglomeratic Buyag Formation.
5.4.2 Developing transtensional basins
The morphology of mainland Masbate following the 2020 event (Fig. 13) was the basis for assigning a late relative development stage in a modeled transtensional basin development sequence (Wu et al., 2009). The basin boundary is characterized by floodplains surrounded by topographic highs. Apparent asymmetrical depocenters were recognized, with the shallower depocenter occurring on the floodplain and the nearshore section of Cataingan Bay, while the second one extends further southwest.
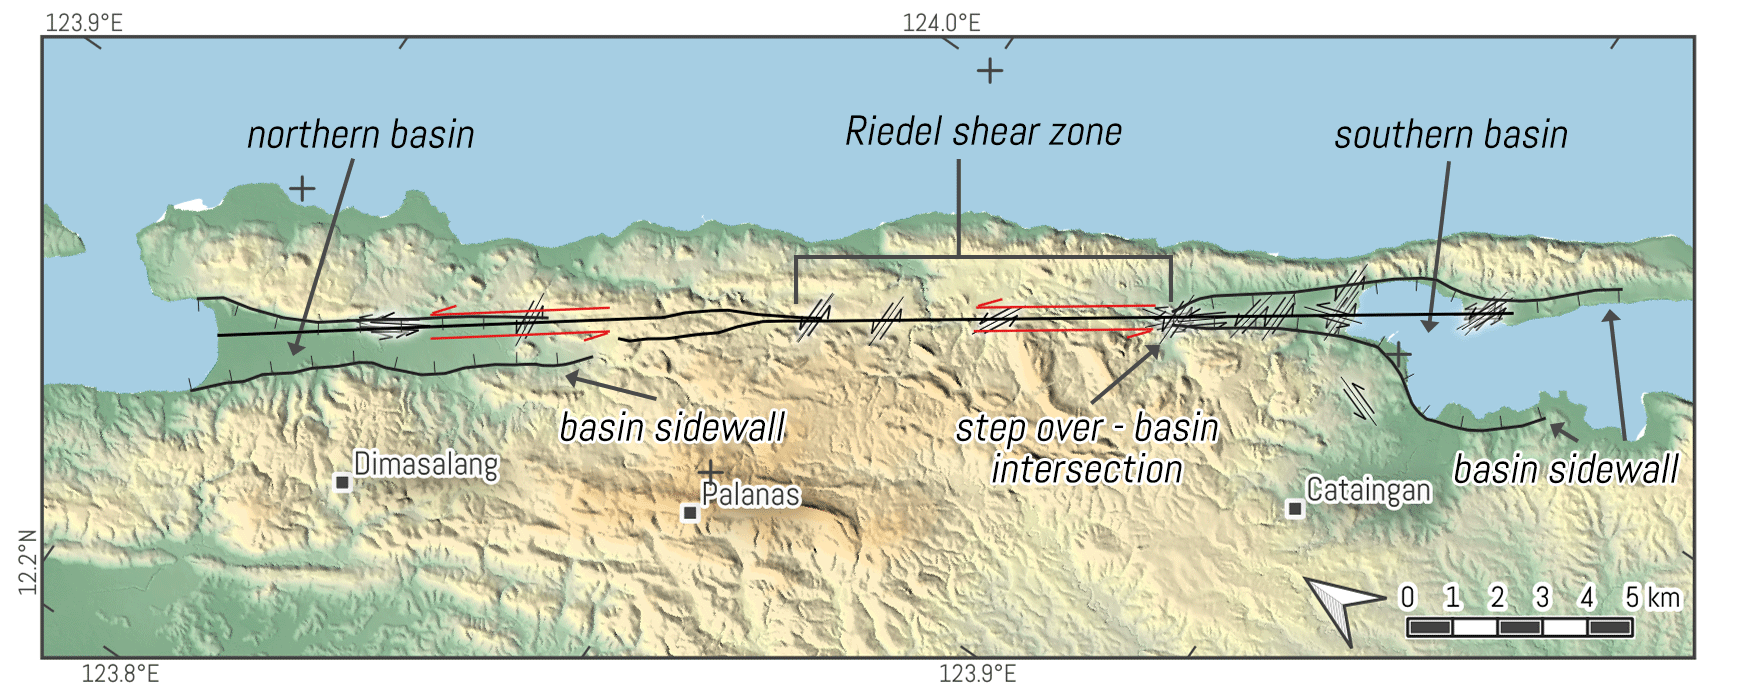
Figure 13Morphology of the transtensional basins linked by a right-stepping shear zone. Solid line indicates the regional fault and lines with hachures indicate the basin sidewall boundary.
A separate transtensional basin is discernible in Dimasalang given the topography, rupture occurrence, and extensional structures in north Masbate (Bischke et al., 1990). The northern and southern basins appear to be linked by the Riedel shear zone in Palanas. Fault complexities in the principal deformation zone of a pull-apart basin (Wu et al., 2009) impede rupture propagation (Biasi and Wesnousky, 2017) in line with the implications of the observed decreasing coseismic and post-seismic slip toward the north. However, the scarcity of observed ruptures inhibits further analysis of the northern transtensional basin.
Fitting the development stage of the southern basin is constrained by the absence of information regarding local strain partitioning. Nonetheless, the expressed fault maturity and identified negative flower structures (Bischke et al., 1990; Llamas and Marfito, 2022) in the northern and southern bays highlight the presence of oblique extensional stress bounding the Masbate mainland. The orientation of the regional fault implies a WNW–ESE-oriented 1σ. However, real-world conditions are more complex compared with the simplified parameters in analog models.
The necessity of coupling optical correlation and interferometry is demonstrated by investigating the surface rupture of the 2020 Mw 6.6 Masbate earthquake along the Masbate segment of the Philippine Fault. Seismicity data showed that foreshocks began 32 d prior to the mainshock on 18 August 2020. The first 30 d of subsequent aftershocks are characterized by a rapid decrease in earthquake frequency, followed by a transition to a gradual decay until 31 January 2021.
Optical correlation and InSAR are directly compared through the corresponding generated offset maps. Measuring the ground offset from the near-field region of the interferogram is hindered by decorrelation, whereas the far field suffers because of the submerged northeastern block. The optical correlation method revealed an average 37.7±10 cm displacement and 60.6±9.8 cm peak left-lateral offset in the near field of the onshore fault segments. Estimates of the peak left-lateral coseismic slip from the total slip and afterslip are consistent with a geodetic moment magnitude of Mw 6.5 ().
The capacity of InSAR to detect smaller displacement amplitudes is highlighted by the post-seismic interferograms. The SBAS time-series stack outlined at least 14.3±0.9 cm largest afterslip and 8.8±0.7 cm average left-lateral afterslip. The measurements correspond to a Mw 6.2 () energy release equivalent to at least 25 % of the coseismic moment estimate. The resolved rupture from interferometry is clearer relative to optical correlation. Multimodal rupture length estimates translate to overestimated moment magnitude values. Hence, the Masbate segment is characterized as capable of producing significant slip and ruptures that are longer than expected, despite the short interval and continuous aseismic stress release during interseismic periods.
Our optical correlation data agree with the laterally offset features from field investigation, highlighting the capacity of the method to accurately capture ground displacements despite the difficult tropical terrain. We view this as a consequence of the time interval between the 2020 Masbate earthquake and the 2022 field investigation. Weathering and erosion of fine ruptures had transpired, possibly influencing the field offset distribution.
The coseismic slip distribution shows the presence of a single asperity adjacent to the GlobalCMT centroid. In conjunction, the surface distribution of the afterslip coincides with the coseismic slip distribution. Based on the stress transfer theorem and the rate-and-state friction model, we infer that the involved post-seismic deformation is fundamentally stress driven and migrated vertically in either the downdip or updip direction along the sub-vertical fault plane.
The surface rupture of the 2020 Masbate event cut across the extant bifurcating trace of the Philippine Fault on the island, possibly reflecting the primary fault plane. Comparing the rupture morphology with analog models reveals the presence of two transtensional basins in Cataingan and Dimasalang, located in the south and north, respectively. The low-angle orientation of ruptures in the midsection corresponds to a Riedel shear zone, which is interpreted to link the identified transtensional basins. Recognition of this structure adds valuable insights into zones vulnerable to future deformation, informing targeted land-use planning and mitigation strategies.
The findings and the methods we used for this study in Masbate lead us and future scientists to further analyze the geometry, kinematics, mechanics, and dynamics of fault movement in the area for improved seismic hazard mitigation. Specifically, the comprehensive slip data and observed unusually long rupture lengths along the fault measured through the optical correlation method agree with previous characterizations by Besana and Ando (2005), indicating significant movement despite the presence of creep. This challenges current seismic hazard models of Masbate and underscores the need to reevaluate potential earthquake magnitudes and ground shaking intensities in the region.
Our use of optical correlation alongside interferometry provides high-resolution surface displacement measurements that can aid in the assessment of earthquake hazards to assist the development of mitigation strategies. We recommend the widespread adoption of these methods in studying other active faults in the Philippines. Future studies could incorporate other datasets, such as UAVs, and explore the method for other surface processes. By reevaluating existing hazard models, refinement of the geologic characterization, and scrutinizing slip estimates, we can gain a deeper understanding of the region's seismotectonic configuration and enhance earthquake preparedness in the region.
MicMac is available from https://github.com/micmacIGN/micmac (micmac IGN, 2024a). StackProf is available from https://github.com/micmacIGN/stackprof (micmac IGN, 2024b). MintPy is available from https://github.com/insarlab/MintPy (insarlab, 2024).
Sentinel-2 datasets are accessed from ESA/EC Copernicus Sentinels Scientific Data Hub and various repositories. The dataset in this study is retrievable from https://www.esa.int/Applications/Observing_the_Earth/Copernicus/Sentinel-2 (ESA, 2022a). Sentinel-1A/B radar data and cloud interferogram processing are available at https://sentinel.esa.int/web/sentinel/missions/sentinel-1 (ESA, 2022b). PlanetLabs data are not openly accessible, but academic/scientific access can be requested. Outputs were rendered with Scientific Colour Maps available from https://doi.org/10.5281/zenodo.5501399 (Crameri, 2021).
The supplement related to this article is available online at: https://doi.org/10.5194/nhess-24-1135-2024-supplement.
KSCSR: conceptualization, data curation, formal analysis, investigation, methodology, project administration, resources, software, validation, visualization, and writing – original draft, review, and editing. SNV: formal analysis, resources, software, supervision, methodology, and writing – review and editing. AMFAL: conceptualization, funding acquisition, resources, supervision, and writing – review and editing.
The contact author has declared that none of the authors has any competing interests.
Publisher's note: Copernicus Publications remains neutral with regard to jurisdictional claims made in the text, published maps, institutional affiliations, or any other geographical representation in this paper. While Copernicus Publications makes every effort to include appropriate place names, the final responsibility lies with the authors.
We extend our wholehearted appreciation to Arturo Daag, Allan Gil Fernando, Mario Aurelio, and John Dale Dianala for their suggestions and comments. We appreciate the UPRI staff for their administrative and technical assistance and support. We thank the National Mapping and Resource Information Authority for providing the elevation data. We also thank the Philippine Institute of Volcanology and Seismology and the Disaster Risk Management Office of Dimasalang, Masbate, for their contributions to the field investigation. We are also grateful for the comments of Austin Elliot, Gordon Woo, Brianna Corsa, and the anonymous reviewers for their input and contributions toward improving this work.
This paper was edited by Veronica Pazzi and reviewed by Austin Elliott, Brianna Corsa, and three anonymous referees.
Allam, A. A., Kroll, K. A., Milliner, C. W. D., and Richards‐Dinger, K. B.: Effects of fault roughness on coseismic slip and earthquake locations, J. Geophys. Res.-Solid, 124, 11336–11349, https://doi.org/10.1029/2018JB016216, 2019. a, b, c, d
Allen, C. R.: Circum-Pacific faulting in the Philippines-Taiwan Region, J. Geophys. Res., 67, 4795–4812, https://doi.org/10.1029/JZ067i012p04795, 1962. a
Aurelio, M.: Tectonique du segment central de la faille philippine : etude structurale, cinematique et evolution geodynamique, PhD thesis, http://www.theses.fr/1992PA066699 (last access: April 2023), 1992. a
Aurelio, M.: Displacement rates and block rotation in and around the Philippines-results from GEODYSSEA data Part II, Program and Abstracts: GEOSEA 98-Ninth Regional Congress on Geology Mineral and Energy Resources of Southeast Asia, 238, https://cir.nii.ac.jp/crid/1570572700614632960 (last access: April 2023), 1998. a
Aurelio, M.: Tectonics of the Philippines revisited, J. Geol. Soc. Philippines, 55, 119–183, 2000a. a, b, c
Aurelio, M.: Shear partitioning in the Philippines: Constraints from Philippine Fault and global positioning system data, Island Arc., 9, 584–597, https://doi.org/10.1111/j.1440-1738.2000.00304.x, 2000b. a
Aurelio, M.: Masbate's three-legged coconut tree spurs scientific interest, https://coverstory.ph/masbates-three-legged-coconut-tree-spurs-scientific-interest/ (last access: December 2022), 2022. a
Aurelio, M. and Peña, R.: Geology of the Philippines, in: 2nd Edn., Mines and Geosciences Bureau, 2010. a
Aurelio, M., Barrier, E., Rangin, C., and Müller, C.: The Philippine Fault in the Late Cenozoic tectonic evolution of the Bondoc-Masbate-N. Leyte area, Central Philippines, J. Southeast Asian Earth Sci., 6, 221–238, https://doi.org/10.1016/0743-9547(91)90069-a, 1991. a, b, c
Aurelio, M., Barrier, E., Gaulon, R., and Rangin, C.: Deformation and stress states along the central segment of the Philippine Fault: implications to wrench fault tectonics, J. Asian Earth Sci., 15, 107–119, https://doi.org/10.1016/s0743-9547(97)00001-9, 1997. a, b
Aurelio, M., Lagmay, M., Escudero, J. A., and Catugas, S.: Latest Philippine earthquake reveals tectonic complexity, Temblor, https://doi.org/10.32858/temblor.191, 2021. a
Avouac, J.-P., Ayoub, F., Leprince, S., Konca, O., and Helmberger, D. V.: The 2005, Mw 7.6 Kashmir earthquake: Sub-pixel correlation of ASTER images and seismic waveforms analysis, Earth Planet. Sc. Lett., 249, 514–528, https://doi.org/10.1016/j.epsl.2006.06.025, 2006. a, b
Bacolcol, T. C.: Etude géodésique de la faille Philippine dans les Visayas, PhD thesis, Université Pierre et Marie Curie, http://www.theses.fr/2003PA066404 (last access: June 2021), 2003. a, b
Bacolcol, T. C., Aguilar, A., Jorgio, R., and de la Cruz, R.: Interseismic Deformation and Horizontal Displacements Associated with the February 15, 2003 Masbate Earthquake, Tech. rep., Philippine Institute of Volcanology and Seismology, Philippines, https://www.phivolcs.dost.gov.ph/index.php/publications/open-file (last access: April 2022), 2005. a, b
Barnhart, W. D., Willis, M. J., Lohman, R. B., and Melkonian, A. K.: Insar and optical constraints on fault slip during the 2010–2011 new zealand earthquake sequence, Seismol. Res. Lett., 82, 815–823, https://doi.org/10.1785/gssrl.82.6.815, 2011. a
Barrier, E., Huchon, P., and Aurelio, M.: Philippine fault: A key for Philippine kinematics, Geology, 19, 32, https://doi.org/10.1130/0091-7613(1991)019<0032:pfakfp>2.3.co;2, 1991. a
Bautista, M. L. P. and Oike, K.: Estimation of the magnitudes and epicenters of Philippine historical earthquakes, Tectonophysics, 317, 137–169, https://doi.org/10.1016/s0040-1951(99)00272-3, 2000. a
Besana, G. M. and Ando, M.: The central Philippine Fault Zone: Location of great earthquakes, slow events, and creep activity, Earth Planets Space, 57, 987–994, https://doi.org/10.1186/BF03351877, 2005. a, b, c, d, e, f
Biasi, G. and Wesnousky, S.: Bends and Ends of Surface Ruptures, Bull. Seismol. Soc. Am., 107, 2543–2560, https://doi.org/10.1785/0120160292, 2017. a
Bird, P.: An updated digital model of plate boundaries, Geochem. Geophy. Geosy., 4, 3, https://doi.org/10.1029/2001GC000252, 2003. a
Bischke, R., Suppe, J., and Del Pilar, R.: Implications of a newly discovered branch of the Philippine fault system, in: International Symposium on the Geodynamic Evolution of Eastern Eurasian Margin, Paris, p. 29, 1988. a
Bischke, R., Suppe, J., and del Pilar, R.: A new branch of the Philippine fault system as observed from aeromagnetic and seismic data, Tectonophysics, 183, 243–264, https://doi.org/10.1016/0040-1951(90)90419-9, 1990. a, b, c
Bruhat, L., Klinger, Y., Vallage, A., and Dunham, E. M.: Influence of fault roughness on surface displacement: from numerical simulations to coseismic slip distributions, Geophys. J. Int., 220, 1857–1877, https://doi.org/10.1093/gji/ggz545, 2020. a
Bürgmann, R., Fielding, E., Liu, Z., and Wang, K.: Postseismic deformation due to the 2019 Ridgecrest earthquakes and its impact on the CGM, Tech. rep., https://files.scec.org/s3fs-public/reports/2020/20016_report.pdf?CUhbHuJtXfV9IPyOGtLr.ZvyIuNq91Fg (last access: January 2023), 2021. a
Canizares, C., Motagh, M., and Haghshenas Haghighi, M.: Resolving 3D coseismic deformation of the 2019 Mw 7.1 Ridgecrest earthquake using radar and optical data, EGU General Assembly 2020, Online, 4–8 May 2020, EGU2020-13659, https://doi.org/10.5194/egusphere-egu2020-13659, 2020. a
Chamot-Rooke, N. and Le Pichon, X.: GPS determined eastward Sundaland motion with respect to Eurasia confirmed by earthquakes slip vectors at Sunda and Philippine trenches, Earth Planet. Sc. Lett., 173, 439–455, https://doi.org/10.1016/S0012-821X(99)00239-3, 1999. a
Cheloni, D., Giuliani, R., D'Anastasio, E., Atzori, S., Walters, R., Bonci, L., D'Agostino, N., Mattone, M., Calcaterra, S., Gambino, P., Deninno, F., Maseroli, R., and Stefanelli, G.: Coseismic and post-seismic slip of the 2009 L'Aquila (Central italy) MW 6.3 earthquake and implications for seismic potential along the Campotosto fault from joint inversion of high-precision levelling, InSAR and GPS data, Tectonophysics, 622, 168–185, https://doi.org/10.1016/j.tecto.2014.03.009, 2014. a
Chen, H., Qu, C., Zhao, D., Ma, C., and Shan, X.: Rupture kinematics and coseismic slip model of the 2021 mw 7. 3 maduo(China) earthquake: implications for the seismic hazard of the kunlun fault, Remote Sens., 13, 3327, https://doi.org/10.3390/rs13163327, 2021. a, b
Crameri, F.: Scientific colour maps, Zenodo [data set], https://doi.org/10.5281/zenodo.5501399, 2021. a
Das, S. and Henry, C.: Spatial relation between main earthquake slip and its aftershock distribution: Aftershock Distributions, Rev. Geophys., 41, 1013, https://doi.org/10.1029/2002RG000119, 2003. a
DeLong, S. B., Donnellan, A., Ponti, D. J., Rubin, R. S., Lienkaemper, J. J., Prentice, C. S., Dawson, T. E., Seitz, G., Schwartz, D. P., Hudnut, K. W., Rosa, C., Pickering, A., and Parker, J. W.: Tearing the terroir: Details and implications of surface rupture and deformation from the 24 August 2014 M 6.0 South Napa earthquake, California, Earth Space Sci., 3, 416–430, https://doi.org/10.1002/2016EA000176, 2016. a
Dianala, J. D. B., Jolivet, R., Thomas, M. Y., Fukushima, Y., Parsons, B., and Walker, R.: The Relationship Between Seismic and Aseismic Slip on the Philippine Fault on Leyte Island: Bayesian Modeling of Fault Slip and Geothermal Subsidence, J. Geophys. Res.-Solid, 125, e2020JB020052, https://doi.org/10.1029/2020JB020052, 2020. a
Duquesnoy, T., Barrier, E., Kasser, M., Aurelio, M., Gaulon, R., Punongbayan, R. S., and Rangin, C.: Detection of creep along the Philippine Fault: First results of geodetic measurements on Leyte Island, central Philippine, Geophys. Res. Lett., 21, 975–978, https://doi.org/10.1029/94GL00640, 1994. a
Elliott, A., Elliott, J., Hollingsworth, J., Kulikova, G., Parsons, B., and Walker, R.: Satellite imaging of the 2015 M 7.2 earthquake in the Central Pamir, Tajikistan, elucidates a sequence of shallow strike-slip ruptures of the Sarez-Karakul fault, Geophys. J. Int., 221, 1696–1718, https://doi.org/10.1093/gji/ggaa090, 2020. a, b, c, d
Elliott, J., De Michele, M., and Gupta, H. K.: Earth observation for crustal tectonics and earthquake hazards, Surv. Geophys., 41, 1355–1389, https://doi.org/10.1007/s10712-020-09608-2, 2020. a, b
ESA – European Space Agency: Sentinel-2 [Earth observation satellite mission], https://www.esa.int/Applications/Observing_the_Earth/Copernicus/Sentinel-2 (last access: March 2022), 2022a. a
ESA – European Space Agency: Sentinel-1A/B [Radar satellite mission], https://sentinel.esa.int/web/sentinel/missions/sentinel-1 (last access: April 2022), 2022b. a
Farrell, J., Husen, S., and Smith, R. B.: Earthquake swarm and b-value characterization of the Yellowstone volcano-tectonic system, J. Volcanol. Geoth. Res., 188, 260–276, https://doi.org/10.1016/j.jvolgeores.2009.08.008, 2009. a, b
Fitch, T. J.: Plate convergence, transcurrent faults, and internal deformation adjacent to Southeast Asia and the western Pacific, J. Geophys. Res., 77, 4432–4460, https://doi.org/10.1029/jb077i023p04432, 1972. a, b
Freymueller, J., King, N. E., and Segall, P.: The co-seismic slip distribution of the Landers earthquake, Bull. Seismol. Soc. Am., 84, 646–659, https://doi.org/10.1785/BSSA0840030646, 1994. a
GDAL/OGR contributors: GDAL/OGR Geospatial Data Abstraction software Library, https://gdal.org (last access: May 2022), 2021. a
Gold, R. D., DuRoss, C. B., and Barnhart, W. D.: Coseismic surface displacement in the 2019 ridgecrest earthquakes: comparison of field measurements and optical image correlation results, Geochem. Geophy. Geosy., 22, e2020GC009326, https://doi.org/10.1029/2020GC009326, 2021. a
Hanks, T. C. and Kanamori, H.: A moment magnitude scale, J. Geophys. Res.-Solid, 84, 2348–2350, https://doi.org/10.1029/JB084iB05p02348, 1979. a, b
He, L., Feng, G., Wu, X., Lu, H., Xu, W., Wang, Y., Liu, J., Hu, J., and Li, Z.: Coseismic and early postseismic slip models of the 2021 Mw 7.4 maduo earthquake(Western china) estimated by space‐based geodetic data, Geophys. Res. Lett., 48, e2021GL095860, https://doi.org/10.1029/2021GL095860, 2021. a, b, c
Helmstetter, A. and Shaw, B. E.: Afterslip and aftershocks in the rate-and-state friction law, J. Geophys. Res.-Solid, 114, 2007JB005077, https://doi.org/10.1029/2007JB005077, 2009. a
insarlab: MintPy, GitHub [code], https://github.com/insarlab/MintPy (last access: 30 March 2024), 2024. a
Johanson, I. A.: Coseismic and postseismic slip of the 2004 parkfield earthquake from space-geodetic data, Bull. Seismol. Soc. Am., 96, S269–S282, https://doi.org/10.1785/0120050818, 2006. a, b
Kaneda, H., Nakata, T., Tsutsumi, H., Kondo, H., Sugito, N., Awata, Y., Akhtar, S. S., Majid, A., Khattak, W., Awan, A. A., Yeats, R. S., Hussain, A., Ashraf, M., Wesnousky, S. G., and Kausar, A. B.: Surface rupture of the 2005 kashmir, pakistan, earthquake and its active tectonic implications, Bull. Seismol. Soc. Am., 98, 521–557, https://doi.org/10.1785/0120070073, 2008. a, b
Kennedy, J. H., Hogenson, K., Johnston, A., Kristenson, H., Lewandowski, A., Logan, T. A., Meyer, F. J., and Rine, J.: Get HyP3! SAR processing for everyone, EGU General Assembly 2021, online, 19–30 April 2021, EGU21-8973, https://doi.org/10.5194/egusphere-egu21-8973, 2021. a
Krambach, M.: swath profile, https://plugins.qgis.org/plugins/swathProfile/ (last access: August 2022), 2015. a
Lagmay, A. M., Tengonciang, A., and Uy, H.: Structural setting of the Bicol Basin and kinematic analysis of fractures on Mayon Volcano, Philippines, J. Volcanol. Geoth. Res., 144, 23–36, https://doi.org/10.1016/j.jvolgeores.2004.11.015, 2005. a
Lai, L. C., Rau, R. J., Bacolcol, T., Ker, C. M., Sapla, G., Ching, K. E., and Solidum Jr., R.: Earthquake Potential of the Creeping-to-locked Masbate Segment of the Philippine Fault Based on GPS Observations, in: vol. 2019, AGU Fall Meeting Abstracts, December 2019, San Francisco, CA, G43B-0748, 2019. a, b, c, d, e
Legaspi, C. J., Ortega, J. P., Reyes, P. R., and Riza, E. G.: Investigation of Stress Changes along the Philippine Fault Zone Using Coulomb Stress Transfer Modeling, in: GEOCON 2018, December 2018, Manila, 2018. a
Leprince, S., Ayoub, F., Klinger, Y., and Avouac, J.-P.: Co-Registration of Optically Sensed Images and Correlation (COSI-Corr): an operational methodology for ground deformation measurements, in: 2007 IEEE International Geoscience and Remote Sensing Symposium, July 2007, Barcelona, 1943–1946, https://doi.org/10.1109/IGARSS.2007.4423207, 2007. a
Lindsey, E. O., Fialko, Y., Bock, Y., Sandwell, D. T., and Bilham, R.: Localized and distributed creep along the southern San Andreas Fault, J. Geophys. Res.-Solid, 119, 7909–7922, https://doi.org/10.1002/2014JB011275, 2014. a
Llamas, D. and Marfito, B.: Geometry and structure of the offshore segments of the Philippine Fault in Central Philippines, in: GeoCon 2022: Disruptions, Transformations – Geosciences at the Forefront, December 2022, Manila, Philippines, 2022. a, b, c, d, e
Manalo, P. C., Dimalanta, C. B., Faustino-Eslava, D. V., Payot, B. D., Ramos, N. T., Queaño, K. L., Perez, A. D. C., and Yumul Jr., G. P.: Geochemical and Geophysical Characteristics of the Balud Ophiolitic Complex (BOC), Masbate Island, Philippines: Implications for its Generation, Evolution and Emplacement, Terr. Atmos. Ocean. Sci., 26, 687, https://doi.org/10.3319/tao.2015.05.19.01(tc), 2015. a, b
Manighetti, I., Mercier, A., and De Barros, L.: Fault Trace Corrugation and Segmentation as a Measure of Fault Structural Maturity, Geophys. Res. Lett., 48, e2021GL095372, https://doi.org/10.1029/2021GL095372, 2021. a
Marone, C., Scholz, C., and Bilham, R.: On the Mechanics of Earthquake Afterslip, J. Geophys. Res., 96, 8441–8452, https://doi.org/10.1029/91JB00275, 1991. a
Michel, R., Avouac, J.-P., and Taboury, J.: Measuring ground displacements from SAR amplitude images: Application to the Landers Earthquake, Geophys. Res. Lett., 26, 875–878, https://doi.org/10.1029/1999gl900138, 1999. a
micmac IGN: micmac, GitHub [code], https://github.com/micmacIGN/micmac (last access: 30 March 2024), 2024a. a
micmac IGN: stackprof, GitHub [code], https://github.com/micmacIGN/stackprof (last access: 30 March 2024), 2024b. a
Miraballes, M., Mirana, R., Ng, J., Rejuso, A., and Villanueva, F.: Report on the Rapid Assessment on the effects of the Magnitude 6.6 Earthquake in the Municipalities of Cataingan and Pio V. Corpuz, Province of Masbate, Tech. rep., Mines and Geosciences Bureau – Region V, 2020. a
Mogi, K.: Some Discussions on Aftershocks, Foresocks and Earthquake Swarms : the Fracture of a Semi-infinite Body Caused by an Inner Stress Origin and Its Relation to the Earthquake Phenomena, Bulletin of the Earthquake Research Institute, University of Tokyo, 41, 615–658, https://doi.org/10.15083/0000033716, 1963. a
Morell, K. D., Styron, R., Stirling, M., Griffin, J., Archuleta, R., and Onur, T.: Seismic Hazard Analyses From Geologic and Geomorphic Data: Current and Future Challenges, Tectonics, 39, e2018TC005365, https://doi.org/10.1029/2018TC005365, 2020. a
NDRRMC: Sitrep re Magnitude 6.6 Earthquake in Cataingan, Masbate, https://ndrrmc.gov.ph/index.php/20-incidents-monitored/4096-sitrep-re-magnitude-6-6-earthquake-in-cataingan,-masbate.html (last access: September 2023), 2020. a
Perrin, C., Manighetti, I., Ampuero, J.-P., Cappa, F., and Gaudemer, Y.: Location of largest earthquake slip and fast rupture controlled by along-strike change in fault structural maturity due to fault growth, J. Geophys. Res.-Solid, 121, 3666–3685, https://doi.org/10.1002/2015JB012671, 2016. a, b
PHIVOLCS: Historical Earthquakes in the Philippines, map, 1999. a
PHIVOLCS: Active Faults Map – Province of Masbate, https://gisweb.phivolcs.dost.gov.ph/gisweb/earthquake-volcano-related-hazard-gis-information (last access: February 2021), 2018. a
PHIVOLCS: 2020 Masbate Earthquake, https://www.phivolcs.dost.gov.ph/index.php/2-uncategorised/10490-2020-masbate-earthquake (last access: January 2021), 2020. a, b, c, d, e, f, g, h
Pinet, N. and Stephan, J. F.: The Philippine wrench fault system in the Ilocos Foothills, northwestern Luzon, Philippines, Tectonophysics, 183, 207–224, https://doi.org/10.1016/0040-1951(90)90417-7, 1990. a, b
Planet Team: Planet Application Program Interface: In Space for Life on Earth, https://api.planet.com (last access: June 2022), 2017. a
Porth, H., Müller, C., and von Daniels, C. H.: The sedimentary formations of the Visayan Basin, Philippines, Geologisches Jahrbuch Reihe B, Band B 70, 29–87, ISBN 978-3-510-96275-4, 1989. a
Pourchet, L. and Delorme, A.: StackProf, GitHub [software], https://github.com/micmacIGN/stackprof (last access: February 2023), 2021. a, b, c
Rangin, C., Le Pichon, X., Mazzotti, S., Pubellier, M., Chamot-Rooke, N., Aurelio, M., Walpersdorf, A., and Quebral, R.: Plate convergence measured by GPS across the Sundaland/Philippine Sea Plate deformed boundary: the Philippines and eastern Indonesia, Geophys. J. Int., 139, 296–316, https://doi.org/10.1046/j.1365-246X.1999.00969.x, 1999. a
Reilinger, R. E., Ergintav, S., Burgmann, R., McClusky, S., Lenk, O., Barka, A., Gurkan, O., Hearn, L., Feigl, K. L., Cakmak, R., Aktug, B., Ozener, H., and Toksoz, M. N.: Coseismic and postseismic fault slip for the 17 August 1999, M=7.5, izmit, turkey earthquake, Science, 289, 1519–1524, https://doi.org/10.1126/science.289.5484.1519, 2000. a
Rosu, A.-M., Pierrot-Deseilligny, M., Delorme, A., Binet, R., and Klinger, Y.: Measurement of ground displacement from optical satellite image correlation using the free open-source software MicMac, ISPRS J. Photogram. Remote Sens., 100, 48–59, https://doi.org/10.1016/j.isprsjprs.2014.03.002, 2015. a
Scheffler, D., Hollstein, A., Diedrich, H., Segl, K., and Hostert, P.: AROSICS: An Automated and Robust Open-Source Image Co-Registration Software for Multi-Sensor Satellite Data, Remote Sens., 9, 676, https://doi.org/10.3390/rs9070676, 2017. a
Scholz, C.: Earthquakes and friction laws, Nature, 391, 37–42, https://doi.org/10.1038/34097, 1998. a
SEASEE: Series on Seismology Volume IV Philippines, Government Printing Office, 1985. a
Seno, T.: The instantaneous rotation vector of the Philippine sea plate relative to the Eurasian plate, Tectonophysics, 42, 209–226, https://doi.org/10.1016/0040-1951(77)90168-8, 1977. a
Simborio, T., Yokoi, T., and Hara, T.: Strong ground motion simulation of the 2020 Masbate, Philippines earthquake (Mw 6.6) using Empirical Green's Function method, https://iisee.kenken.go.jp/syndb/data/20230117f70f6a30.pdf (last access: January 2023), 2022. a
Stumpf, A., Malet, J.-P., and Delacourt, C.: Correlation of satellite image time-series for the detection and monitoring of slow-moving landslides, Remote Sens. Environ., 189, 40–55, https://doi.org/10.1016/j.rse.2016.11.007, 2017. a
Tiongson, S. and Ramirez, R.: Mapping of ground surface deformations and its associated damage using SAR interferometry: a case study of the 2020 Masbate earthquake, E3S Web Conf., 347, 03014, https://doi.org/10.1051/e3sconf/202234703014, 2022. a, b, c
Tomita, F., Iinuma, T., Ohta, Y., Hino, R., Kido, M., and Uchida, N.: Improvement on spatial resolution of a coseismic slip distribution using postseismic geodetic data through a viscoelastic inversion, Earth Planets Space, 72, 84, https://doi.org/10.1186/s40623-020-01207-0, 2020. a
Treiman, J. A.: Primary surface rupture associated with the Mw 7.1 16 October 1999 hector mine earthquake, san bernardino county, california, Bull. Seismol. Soc. Am., 92, 1171–1191, https://doi.org/10.1785/0120000923, 2002. a
Tronin, A.: Remote sensing and earthquakes: A review, Phys. Chem. Earth Pt. A/B/C, 31, 138–142, https://doi.org/10.1016/j.pce.2006.02.024, 2006. a
Tsutsumi, H. and Perez, J.: Along strike variation of seismic behavior of the Philippine fault based on historical- and paleo-seismicity, in: vol. 2011, AGU Fall Meeting Abstracts, December 2011, San Francisco, CA, T43D-2366, 2011. a, b
Tsutsumi, H. and Perez, J.: Large-scale active fault map of the Philippine fault based on aerial photograph interpretation, Active Fault Res., 39, 29–37, https://doi.org/10.11462/afr.2013.39_29, 2013. a, b, c, d, e, f, g
Tsutsumi, H., Perez, J., and Lienkaemper, J.: Variation of Surface Creep Rate Along the Philippine Fault Based on Surveys of Alinement Arrays and Offset Cultural Features, in: American Geophysical Union, Fall Meeting 2016, December 2016, San Francisco, CA, 2016. a
Tymofyeyeva, E. and Fialko, Y.: Geodetic Evidence for a Blind Fault Segment at the Southern End of the San Jacinto Fault Zone, J. Geophys. Res.-Solid, 123, 878–891, https://doi.org/10.1002/2017JB014477, 2018. a
USGS: Advanced National Seismic System (ANSS) Comprehensive Catalog, https://doi.org/10.5066/F7MS3QZH, 2017. a
Velasco, A. A., Ammon, C. J., Lay, T., and Hagerty, M.: Rupture process of the 1990 Luzon, Philippines (Mw=7.7), earthquake, J. Geophys. Res.-Solid, 101, 22419–22434, https://doi.org/10.1029/96JB02290, 1996. a
Wang, K. and Fialko, Y.: Space geodetic observations and models of postseismic deformation due to the 2005 M 7.6 Kashmir (Pakistan) earthquake, J. Geophys. Res.-Solid, 119, 7306–7318, 2014. a
Wang, S., Xu, W., Xu, C., Yin, Z., Burgmann, R., Liu, L., and Jiang, G.: Changes in groundwater level possibly encourage shallow earthquakes in central australia: the 2016 petermann ranges earthquake, Geophys. Res. Lett., 46, 3189–3198, https://doi.org/10.1029/2018GL080510, 2019. a, b
Wang, S., Song, C., Li, S. S., and Li, X.: Resolving co- and early post-seismic slip variations of the 2021 MW 7.4 Madoi earthquake in east Bayan Har block with a block-wide distributed deformation mode from satellite synthetic aperture radar data, Earth Planet. Phys., 6, 108–122, https://doi.org/10.26464/epp2022007, 2022. a
Wei, M. and Sandwell, D. T.: Decorrelation of L-Band and C-Band Interferometry Over Vegetated Areas in California, IEEE T. Geosci. Remote, 48, 2942–2952, https://doi.org/10.1109/TGRS.2010.2043442, 2010. a
Wells, D. and Coppersmith, K.: New Empirical Relationships among Magnitude, Rupture Length, Rupture Width, Rupture Area, and Surface Displacement, Bull. Seismol. Soc. Am., 84, 974–1002, 1994. a, b, c
Woo, G.: Downward Counterfactual Search for Extreme Events, Front. Earth Sci., 7, 340, https://doi.org/10.3389/feart.2019.00340, 2019. a
Woo, G. and Mignan, A.: Counterfactual Analysis of Runaway Earthquakes, Seismol. Res. Lett., 89, 2266–2273, https://doi.org/10.1785/0220180138, 2018. a
Wu, J. E., McClay, K., Whitehouse, P., and Dooley, T.: 4D analogue modelling of transtensional pull-apart basins, Mar. Petrol. Geol., 26, 1608–1623, https://doi.org/10.1016/j.marpetgeo.2008.06.007, 2009. a, b
Yen, J., Lu, C., Dorsey, R. J., Kuo‐Chen, H., Chang, C., Wang, C., Chuang, R. Y., Kuo, Y., Chiu, C., Chang, Y., Bovenga, F., and Chang, W.: Insights into Seismogenic Deformation during the 2018 Hualien, Taiwan, Earthquake equence from InSAR, GPS, and Modeling, Seismol. Res. Lett., 90, 78–87, https://doi.org/10.1785/0220180228, 2018. a
Yunjun, Z., Fattahi, H., and Amelung, F.: Small baseline InSAR time series analysis: Unwrapping error correction and noise reduction, Comput. Geosci., 133, 104331, https://doi.org/10.1016/j.cageo.2019.104331, 2019. a, b