the Creative Commons Attribution 4.0 License.
the Creative Commons Attribution 4.0 License.
 | 03 Mar 2023
Differences in volcanic risk perception among Goma's population before the Nyiragongo eruption of May 2021, Virunga volcanic province (DR Congo)
Blaise Mafuko Nyandwi
Matthieu Kervyn
François Muhashy Habiyaremye
François Kervyn
Caroline Michellier
Risk perception is an essential element to consider for effective risk management at the time of eruption, especially in densely populated cities close to volcanoes like Goma in the east of the Democratic Republic of the Congo, which is highly exposed to volcanic hazards from Nyiragongo. The perception of volcanic risk involves the processes of collecting, selecting and interpreting signals about uncertain impacts of volcanic hazards. Using a questionnaire survey, this study describes the spatial differences and factors influencing the individual volcanic risk perception of 2224 adults from eight representative neighbourhoods of Goma before the May 2021 Nyiragongo eruption. A composite risk perception indicator was built from the perceived severity and perceived vulnerability. Statistical analysis of the survey's results shows that the risk perception was high (mean = 3.7 on a five-point Likert scale) and varies less with demographic and contextual factors than with cognitive and psychological factors. Volcanic hazards were perceived to be more threatening the city and its functioning than the individuals themselves. The spatial analysis shows that respondents from the eastern neighbourhoods, affected by the 2002 eruption, demonstrated a significantly higher level of risk perception than participants living in the western neighbourhoods. This study will help to improve volcanic risk awareness raising in Goma.
- Article
(5824 KB) - Full-text XML
- Companion paper
- BibTeX
- EndNote


Risk perception studies aim to answer why individuals differ in their perception of the same hazard (Slovic, 2000; Chauvin, 2018). For an individual, risk perception involves the processes of collecting, selecting and interpreting signals about uncertain impacts of natural events, activities or technologies (Slovic et al., 2013). These signals may refer to direct observations (e.g. witnessing a hazard) or information from other sources (e.g. reading about a hazard in newspapers) (Paton et al., 2008). Therefore, risk perception is related to one's personal understanding of natural hazard processes and prior experience (Gaillard and Mercer, 2013; Barclay et al., 2015), which in turn are filtered by sociodemographic factors, world view and affective judgments (Dieckmann et al., 2021; Haynes et al., 2008; Wachinger et al., 2010; Slovic and Weber, 2013).
Bubeck et al. (2012) state that a proper approach to risk requires both good science and good judgment. Thereby, Favereau et al. (2018) point out that actions and reactions, specifically to volcanic hazards, are shaped by people's perception, previous experience, risk acceptability and tolerance, especially during rapid onset eruptions, like the recent May 2021 Nyiragongo eruption in the east of the Democratic Republic of the Congo (DR Congo). Therefore, risk perception has to be regarded as an essential component of disaster risk reduction (DRR) by examining people's attitudes, judgments and feelings about risk and the role it plays in formulating preferences and making decisions under conditions of uncertainty (Donovan and Oppenheimer, 2014; Brown et al., 2015; Donovan, 2019; Merlhiot et al., 2018). Indeed, risk perception has been a matter of research for several years and has led to the development of several theories such as the protection motivation theory (PMT) (Rogers, 1975; Maddux and Rogers, 1983), the community engagement theory (CET) (Paton, 2013), the protective action decision model (Lindell and Perry, 2012) and the theory of planned behaviour (TPB) (Vinnell et al., 2021). Among these theories, the PMT is a pioneer and widely used (Rainear and Christensen, 2017). In addition, meta-analyses have shown its efficiency in its uses (Milne et al., 2000; Sommestad et al., 2015; Bamberg et al., 2017). This model has however barely been used to study volcanic risk so far (Kothe et al., 2019). It states that the individual motivation to implement risk reduction measures is based on two components: the threat appraisal and the coping appraisal (Sommestad et al., 2015). Threat appraisal examines one's perception of the extent and likelihood of a threat to generate harm, while the coping appraisal evaluate one's perception of risk mitigation measures. In accordance with Floyd et al. (2000) and Mertens et al. (2018), the present study relies on a conceptualisation of risk perception based on the PMT threat appraisal.
For DRR stakeholders, it is essential to know which factors influence a population's acceptance and choices regarding risks and whether risk perception is contrasted in specific neighbourhoods or subgroups of the population. Such research can contribute to a better contextualisation of the vulnerability of people living near active volcanoes around the world, as in the case of the Virunga volcanic province, located across the border between the Democratic Republic of the Congo (DRC) and Rwanda (Michellier et al., 2016). The Virunga volcanic province hosts two active volcanoes, Nyiragongo and Nyamuragira, generating multiple lava flow eruptions over the last century (Pouclet and Bram, 2021; Smets et al., 2015b). The city of Goma, which has more than 1 million inhabitants, is at high risk of lava flows from the southern flank of Nyiragongo.
As a pioneering study on population vulnerability in Goma, Michellier et al. (2020) evaluated the social vulnerability to volcanic hazards from Nyiragongo in the context of data scarcity. In Michellier et al. (2020), risk perception was assessed in a general way (based on the question: do you feel your household is in danger?), as well as in relation to the experience of a past geological disaster. It highlighted that risk perception and prior experience are strongly correlated, i.e. prior experience is associated with a high level of risk perception. However, while deepening that first approach, it was found that this question alone could not fully describe or assess the perception of volcanic risk in Goma. In our study, we aim at characterising the risk perception of people from different neighbourhoods across the city; looking at multiple volcanic hazards; and analysing the potential relationship to demographic, contextual, cognitive, and psychological factors. Our data were collected at the end of 2020 and therefore represent the risk perception directly prior to the May 2021 Nyiragongo eruption, which affected a significant part of the city's suburbs (Smittarello et al., 2022). In addition, this study helps to contrast most existing risk perception studies in which participants come from western countries (Henrich et al., 2010; Barrett, 2020). After defining the concepts of risk perception and its individual indicators, the collection and analysis of the survey data are explained before presenting the key results and discussing their implication for understanding volcanic risk perception. This study aims at contributing to broader research on the implementation of DRR measures for populations living near volcanoes like those in Goma.
While it began to be studied in the 1960s, particularly in the context of nuclear risk (Martin, 1989), the risk perception related to natural hazards has received increasing attention over the last 2 decades (Donovan, 2019). Bubeck et al. (2012) noticed that the definition of risk perception remained ambiguous for a long period and was used with different meanings. However, recent literature has defined risk perception as processes of collecting, selecting and interpreting signals about uncertain impacts of hazards (Donovan et al., 2017; Chauvin, 2018; Dieckmann et al., 2021). These mental processes involve quantitative or qualitative appraisals of two dimensions: likelihood and severity. Thereby, a risk perception indicator can be built from the individual appraisal of the likelihood of being personally impacted by a hazard (perceived vulnerability) and the individual appraisal of the likelihood of a hazard, as well as of the severity of its impacts on the inhabited area (perceived severity) (Barclay et al., 2015; Botterill and Mazur, 2004; Khan et al., 2019). These two components are in line with the PMT threat appraisal concepts of perceived severity and perceived vulnerability. Indeed, in the PMT framework, “perceived severity” is conceptualised as the extent to which people perceive that a hazard could have serious negative consequences and “perceived vulnerability” as the likelihood that people believe they could be personally exposed to the negative effects of the hazard (Floyd et al., 2000; Sommestad et al., 2015; Mertens et al., 2018).
2.1 Risk perception and the psychometric paradigm
The most common approach used to understand why there are individual differences in risk perception is the psychometric paradigm developed by Fischhoff et al. (1978) and modified by Slovic et al. (1986) and Sjöberg (2003). In contrast to the cultural approach, which is a qualitative understanding of risk perception (Douglas and Wildavsky, 1982), the psychometric approach seeks to quantify people's subjective assessment of risk and risk-related impacts. It argues that people make a quantitative appraisal about the current and likely risk of various hazards and the desired level of regulation of each risk (Lechowska, 2022). Therefore, the psychometric approach, used in this study, is an appropriate way to characterise factors to which risk perception is related.
2.2 Individual factors of risk perception
Wachinger et al. (2013) reviewed the main factors of risk perception, particularly in connection with natural hazards. They highlighted the influence of personal factors related to the demographic, cognitive and psychological characteristics of the individual, as well as contextual factors related to the family, community and society in which they live.
Personal factors are demographic, such as age (Knoll et al., 2017; Useche et al., 2019), gender (Bee, 2016), educational level (Carlino et al., 2008), disaster experience (Bronfman et al., 2020; Paton et al., 2000) or ownership of transport (Chauvin, 2018). In addition, personal factors can be cognitive, such as understanding of the risk processes (Sim et al., 2018) or interest in seeking risk information (Donovan et al., 2018). The perceived availability and predictive power of environmental cues (sights and sounds that are considered to indicate a hazard onset) are also cognitive factors influencing risk perception (Lindell and Perry, 2012; Perry and Lindell, 2008). In addition, personal factors are psychological, including anxiety (Lemée et al., 2019) or trust in authorities (Bronfman et al., 2016; Siegrist et al., 2005).
Contextual factors are economic, such as household income (Barclay et al., 2019, 2015), or family related, like family status or household size (Donovan, 2010; Barclay et al., 2015). Religion or other cultural dimensions are also key contextual factors shaping risk perception (Gaillard and Texier, 2010; Chester et al., 2008).
3.1 Study area
Goma, the capital city of the North Kivu province, is built in the lava field of the Nyiragongo volcano along the northern shore of Lake Kivu in eastern DRC (Fig. 1). It shares a border with the town of Gisenyi in Rwanda. It is an important humanitarian hub (Büscher et al., 2010) and an economic centre for regional trade (Vlassenroot and Büscher, 2013, 2011). Small business is one of the main sources of income, forcing the population to spread out along the roads by doing odd jobs for day-to-day survival (Syavulisembo et al., 2021; Oldenburg, 2020). Over the past 3 decades, Goma and its surroundings have been affected by several armed conflicts (Pech et al., 2018; Vlassenroot and Büscher, 2011). People from the nearby villages and towns have sought refuge in Goma for safety and comfort, resulting in the growth of the population (Van Praag et al., 2021). Therefore, the city is constantly expanding, but it is bounded (Fig. 1a) to the south by Lake Kivu, to the northwest by the Virunga National Park and to the east by the Rwandan border, forcing the expansion of the urbanised area northwards, up to the foot of the Nyiragongo volcano (Büscher et al., 2010; Pech et al., 2018; Michellier et al., 2020). From 2002 to 2020, the population of the city had doubled from half a million to more than 1 million inhabitants (INS, 2021). Urban growth is associated with an increase in a population's exposure to volcanic hazards, especially to lava flows emitted on the southern flank of the volcano.
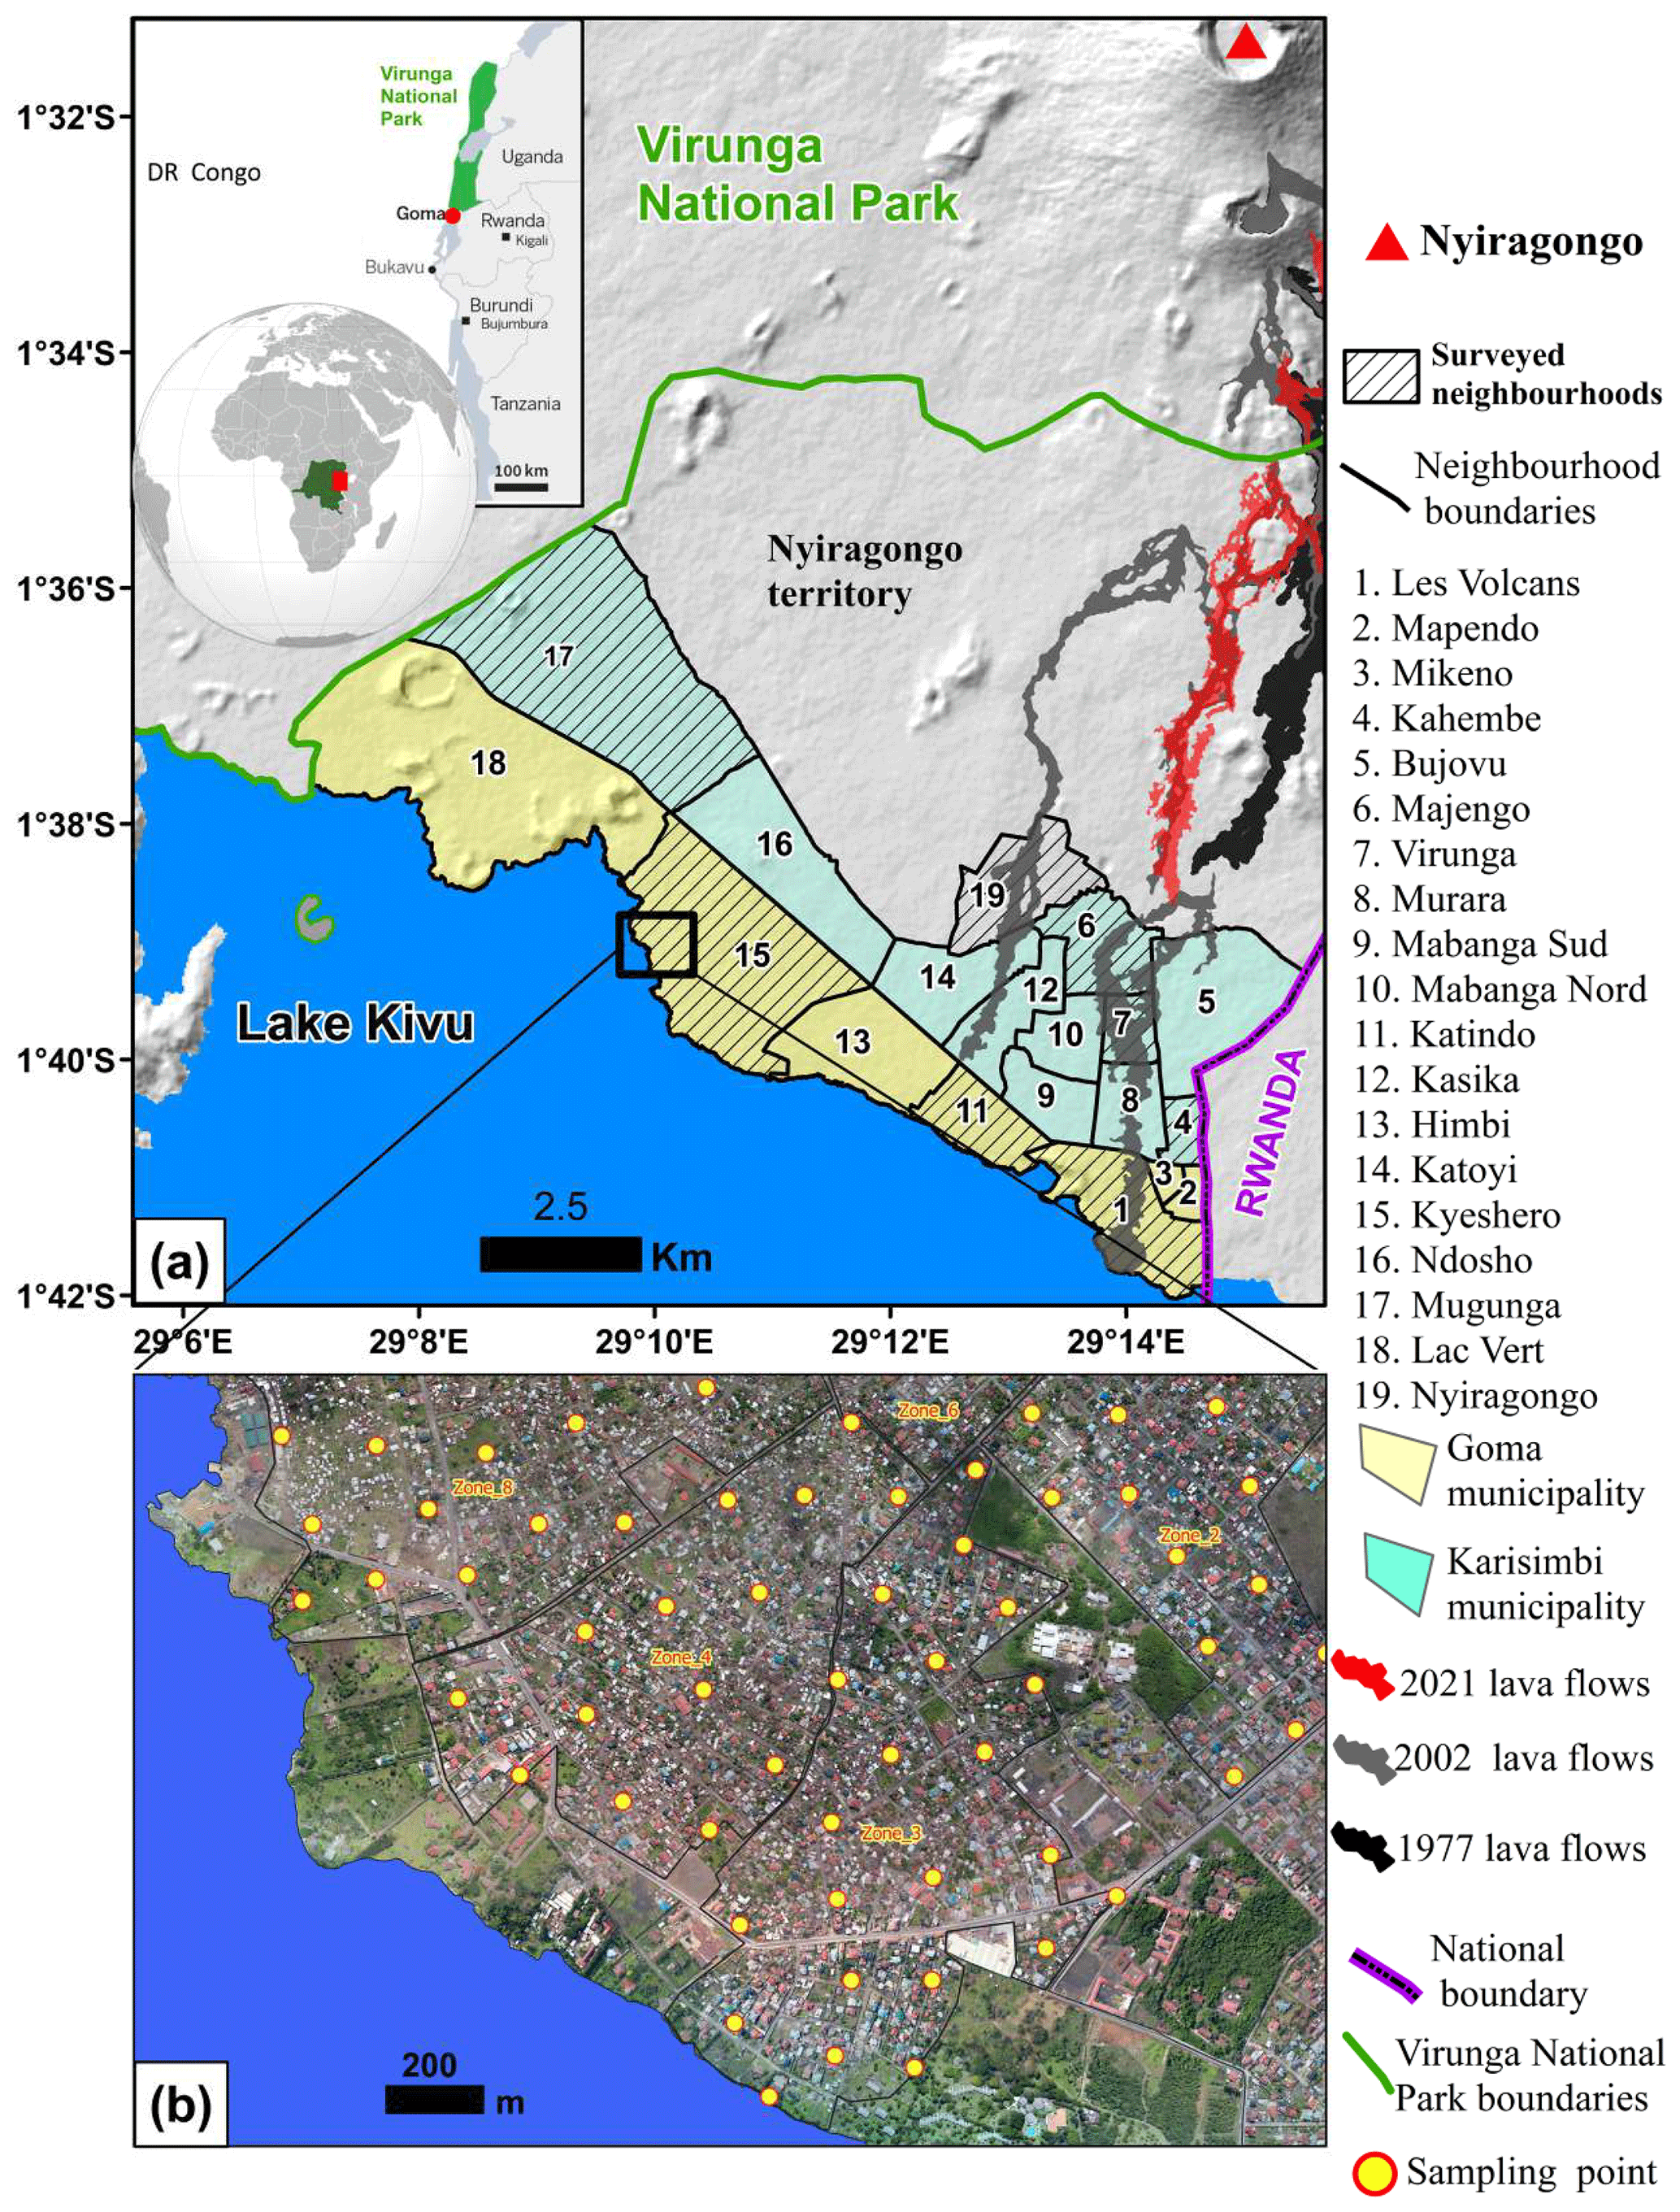
Figure 1(a) The city of Goma and the surveyed neighbourhoods with a hill shade of SRTM 1 DEM (© NASA/NGA) updated with the 2016 topography of the Nyiragongo crater (Delhaye and Smets, 2021) and (b) an example of sampling points automatically distributed by defining a shortest distance allowed between two randomly placed points plotted on a 2017 very high resolution orthomosaic picture of Goma (Smets et al., 2018). The distance was determined according to the surface of the neighbourhoods, 40 m for very wide neighbourhoods and 20 m for narrower neighbourhoods.
Nyiragongo is a stratovolcano in the Virunga volcanic province (Poppe et al., 2013). Its main crater is surrounded by two main adventive cones: Baruta and Shaheru on the northern and southern flanks respectively. The volcanic field of Nyamuragira surrounds that of Nyiragongo, and both undergo permanent CO2 degassing (Smets et al., 2010, 2015a). Since the early 1900s, an active lava lake has characterised almost continuously the activity of Nyiragongo, interrupted by three effusive flank eruptions in 1977, 2002 and 2021 (Barrière et al., 2022). Some of these eruptions were preceded by seismic swarms (Oth et al., 2017; Barrière et al., 2022), and each caused long and fast lava flows (i.e. speed of the order of 6 to 10 to 20 km h−1 in 1977 and less than 10 km h−1 in 2002) (Muhindo Syavulisembo, 2019) that came out from eruptive fissures and headed south towards the city of Goma (Favalli et al., 2009) (Fig. 1).
Two historical eruptions impacted the city before our survey in 2020. On 10 January 1977, the first one poured 20 million m3 of lava flows over 15 km2 (including 4.9 km2 within the Virunga National Park) on the northern, southern and western flanks of Nyiragongo, destroying several villages and roads north of Goma. Tazieff (1977) reported less than 100 deaths. After a relative calm period, Nyiragongo erupted on 17 January 2002 while the city was under rebel occupation (Komorowski et al., 2002). This new flank eruption, which generated lava flows, was larger (25 million m3 over 14 km2) and more destructive than that of 1977 (Wisner, 2017; Wauthier et al., 2012; Smets et al., 2015a). In less than 24 h, Goma was crossed by two lava flows, one of which reached Lake Kivu (Schmid et al., 2002). Komorowski et al. (2002) estimate that 40 people died and that 120 000 people had their homes destroyed. In addition, they note that several infrastructures were lost and evaluate the devastated part of the city at 13 %.
3.2 Questionnaire
For this risk perception study, data were collected through a questionnaire survey developed on the KoBoToolbox application installed on tablets. All questions related to perception used a five-level Likert scale. The specific questions on risk perception were constructed according to PMT (Mertens et al., 2018), as mentioned in the theoretical background of this study. The following questionnaire sections were used:
-
Demographic profile of participants. This includes gender, age, family status, religion, household size, household monthly income, education level, prior experience of a volcanic eruption and possession of a means of transport;
-
Risk perception indicator. The risk perception was assessed as an aggregated indicator of perceived severity and perceived vulnerability (Fig. 2). On the one hand, perceived severity is conceptualised as the degree to which people perceive (1) the likelihood of hazards and (2) the severity of their impacts on the city. On the other hand, perceived vulnerability is conceptualised as the perceived likelihood of being personally impacted. To better capture the risk perception of a person living in an area potentially threatened by a range of volcanic hazards such as Goma, it is critical to have several questions depending on the hazard type, as well as the range of potential impacts. Therefore, in order to obtain one indicator, an aggregation of responses obtained is required. Before aggregating the values, the internal consistency of answers was checked using Cronbach's alpha coefficient (Fig. 2). The aggregation was done according to the coefficient of variation (CV) of response values. It was done either by mean when the CV < 25 % or by median when the CV ≥ 25 %.
-
Perceived source of risk. A set of potential sources of risk related to the technological, socioeconomic, political and natural contexts of the city of Goma was proposed to the respondents. In this section, participants determined in general their perception of impacts if each of the threat proposed occurs.
-
Environmental cues and predictive power. Availability and predictive power of volcanic environmental cues are factors defined by Lindell and Perry (2012) in the protective action decision model (PDAM), and they potentially influence risk perception. Environmental cues correspond to sights and sounds from the environment that are considered to indicate a hazard onset. In the case of this study, the considered environmental cues included the ash plume from the Nyiragongo crater, the emission of volcanic gas and a loud detonation in the volcano. They express the connectedness to the volcanic environment, i.e. whether a participant is able to observe and interpret the precursors of an eruption (Han, 2021). On the one hand, the availability of environmental cues indicates the perceived degree of being potentially exposed to these environmental cues. On the other hand, the predictive power indicates the perceived degree to which these signs indicate the likely occurrence of a volcanic eruption.
-
Status induced by the reception of risk information. This includes anxiety (to what extent information regarding volcanic risk induces a degree of nervousness) and comprehension (the perceived extent of understanding volcanic risk information).
-
Trust. Trust in authorities in charge of volcanic risk management and interest in seeking information.
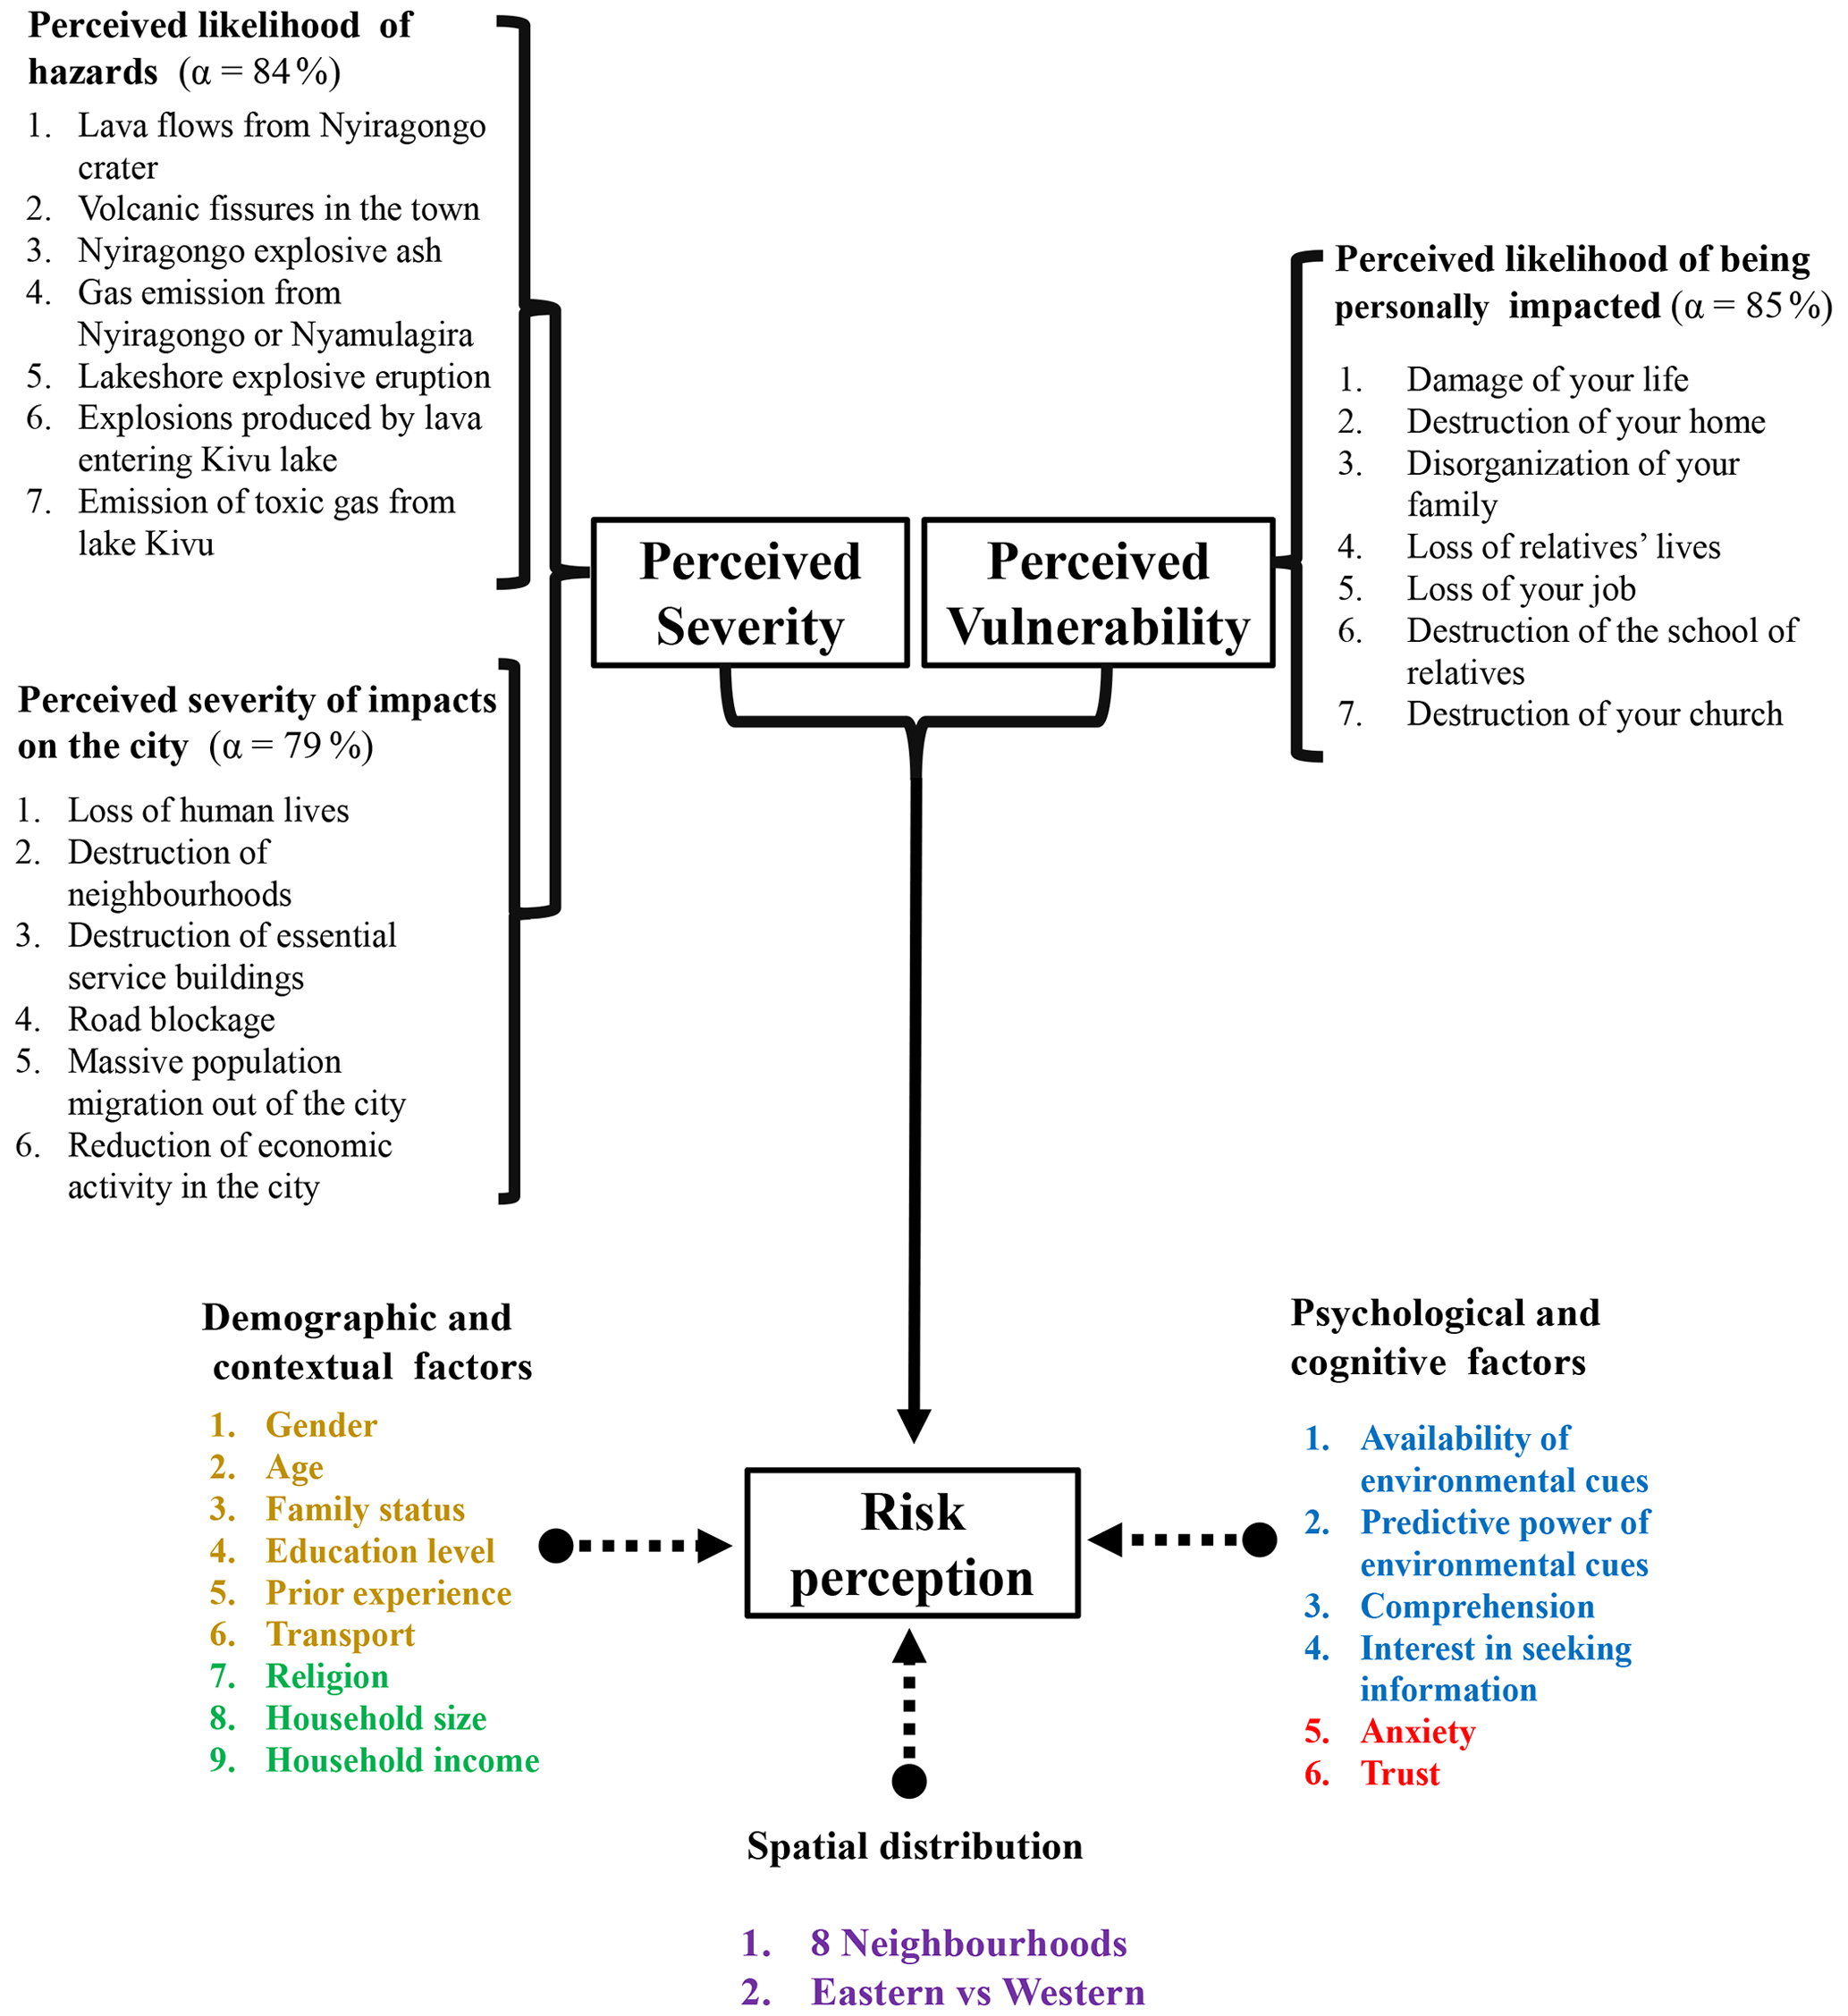
Figure 2Overview of the variables used in this research to derive an aggregated risk perception indicator from indicators of perceived severity and perceived vulnerability and the potential controlling factors for highlighting differences in risk perception. Demographic factors are highlighted in orange, contextual in green, cognitive in blue, psychological in red and spatial in purple. α represents Cronbach's alpha index measuring the internal consistency of a set of answers.
3.3 Participants
The survey was conducted in 7 out of 18 neighbourhoods of the city of Goma and in a part of the urbanised area of the Nyiragongo territory as an eighth neighbourhood (Fig. 1a). These eight representative neighbourhoods were selected based on the contrasted social vulnerability assessed in 2017 by Michellier et al. (2020a) and other criteria such as their existence in 2002 (year of last eruption at the time of survey); their spatial distribution relative to potential hazards and evacuation routes; and the existing contrasts in population density, average income, and level of education. One neighbourhood was selected to represent two or more neighbourhoods having similar characteristics.
A total of 2224 adults from the general population were surveyed (Mafuko Nyandwi, 2023a). The size of sampling was calculated from the following statistical formula (Krejcie and Morgan, 1970):
where n is the sample size, N is the population of the entire city, P is the population proportion (assumed to be 0.50 since this would provide the maximum sample size), is the table value of chi square for 1∘ of freedom at a confidence level (3.841) and y is the degree of accuracy expressed as a proportion (0.05).
According to the 2020 report of the National Institute for Statistics (INS) of the North Kivu province, the population of Goma exceeded 1 million inhabitants in 2020 (INS, 2021). With a 50 % variance of population, 3 % margin of error and 99 % confidence level, our survey's sample size should be 1831 individuals. The 2224 inhabitants surveyed is a larger sample than the minimum sample size required to be representative of the population of Goma, even considering the Nyiragongo neighbourhood. We worked with an almost equal number of participants per neighbourhood (almost 280 people per neighbourhood). This sample is also representative for each neighbourhood within a confidence interval ranging between 0.01 to 0.05.
3.4 Procedure
The data were collected between September and October 2020. In every surveyed neighbourhood, around 280 points were randomly distributed and plotted with a defined minimum distance between points using a geographical information system (Fig. 1b) on a 2017 very high resolution orthomosaic picture of Goma (Smets et al., 2018). Data were collected in one of the four households located closest to the point. We undertook the survey with a team of 16 trained enumerators. The interviews were conducted face-to-face, with a questionnaire in French. Each enumerator had a notebook with the translation of the questions into Swahili, the common local language. The interviews were conducted with people aged 18 years or above, living in the selected household. Verbal informed consent was obtained from the survey participants before the survey. A survey day started early in the morning (07:00 local time) and was also conducted during weekends, to meet parents and working adults. Each interview lasted about 35 min.
3.5 Data analyses
Descriptive statistics were used for categorical variables, such as demographic and risk perception (Harpe, 2015). A non-parametrical test of Wilcoxon–Mann–Whitney (for two-group variables) or Kruskal–Wallis (for multi-group variables) was used to determine the variation in risk perception according to demographic, contextual, cognitive and psychological variables. Statistically significant variations were represented on boxplots. Pearson (for binomial variables) or Spearman's (for Likert-scale variables or ordinal demographic variables) correlations were used to measure the correlations between potential risk perception factors and the risk perception indicator. To analyse the spatial contrast of the risk perception, a geographic information system was used.
4.1 Demographic profile of participants
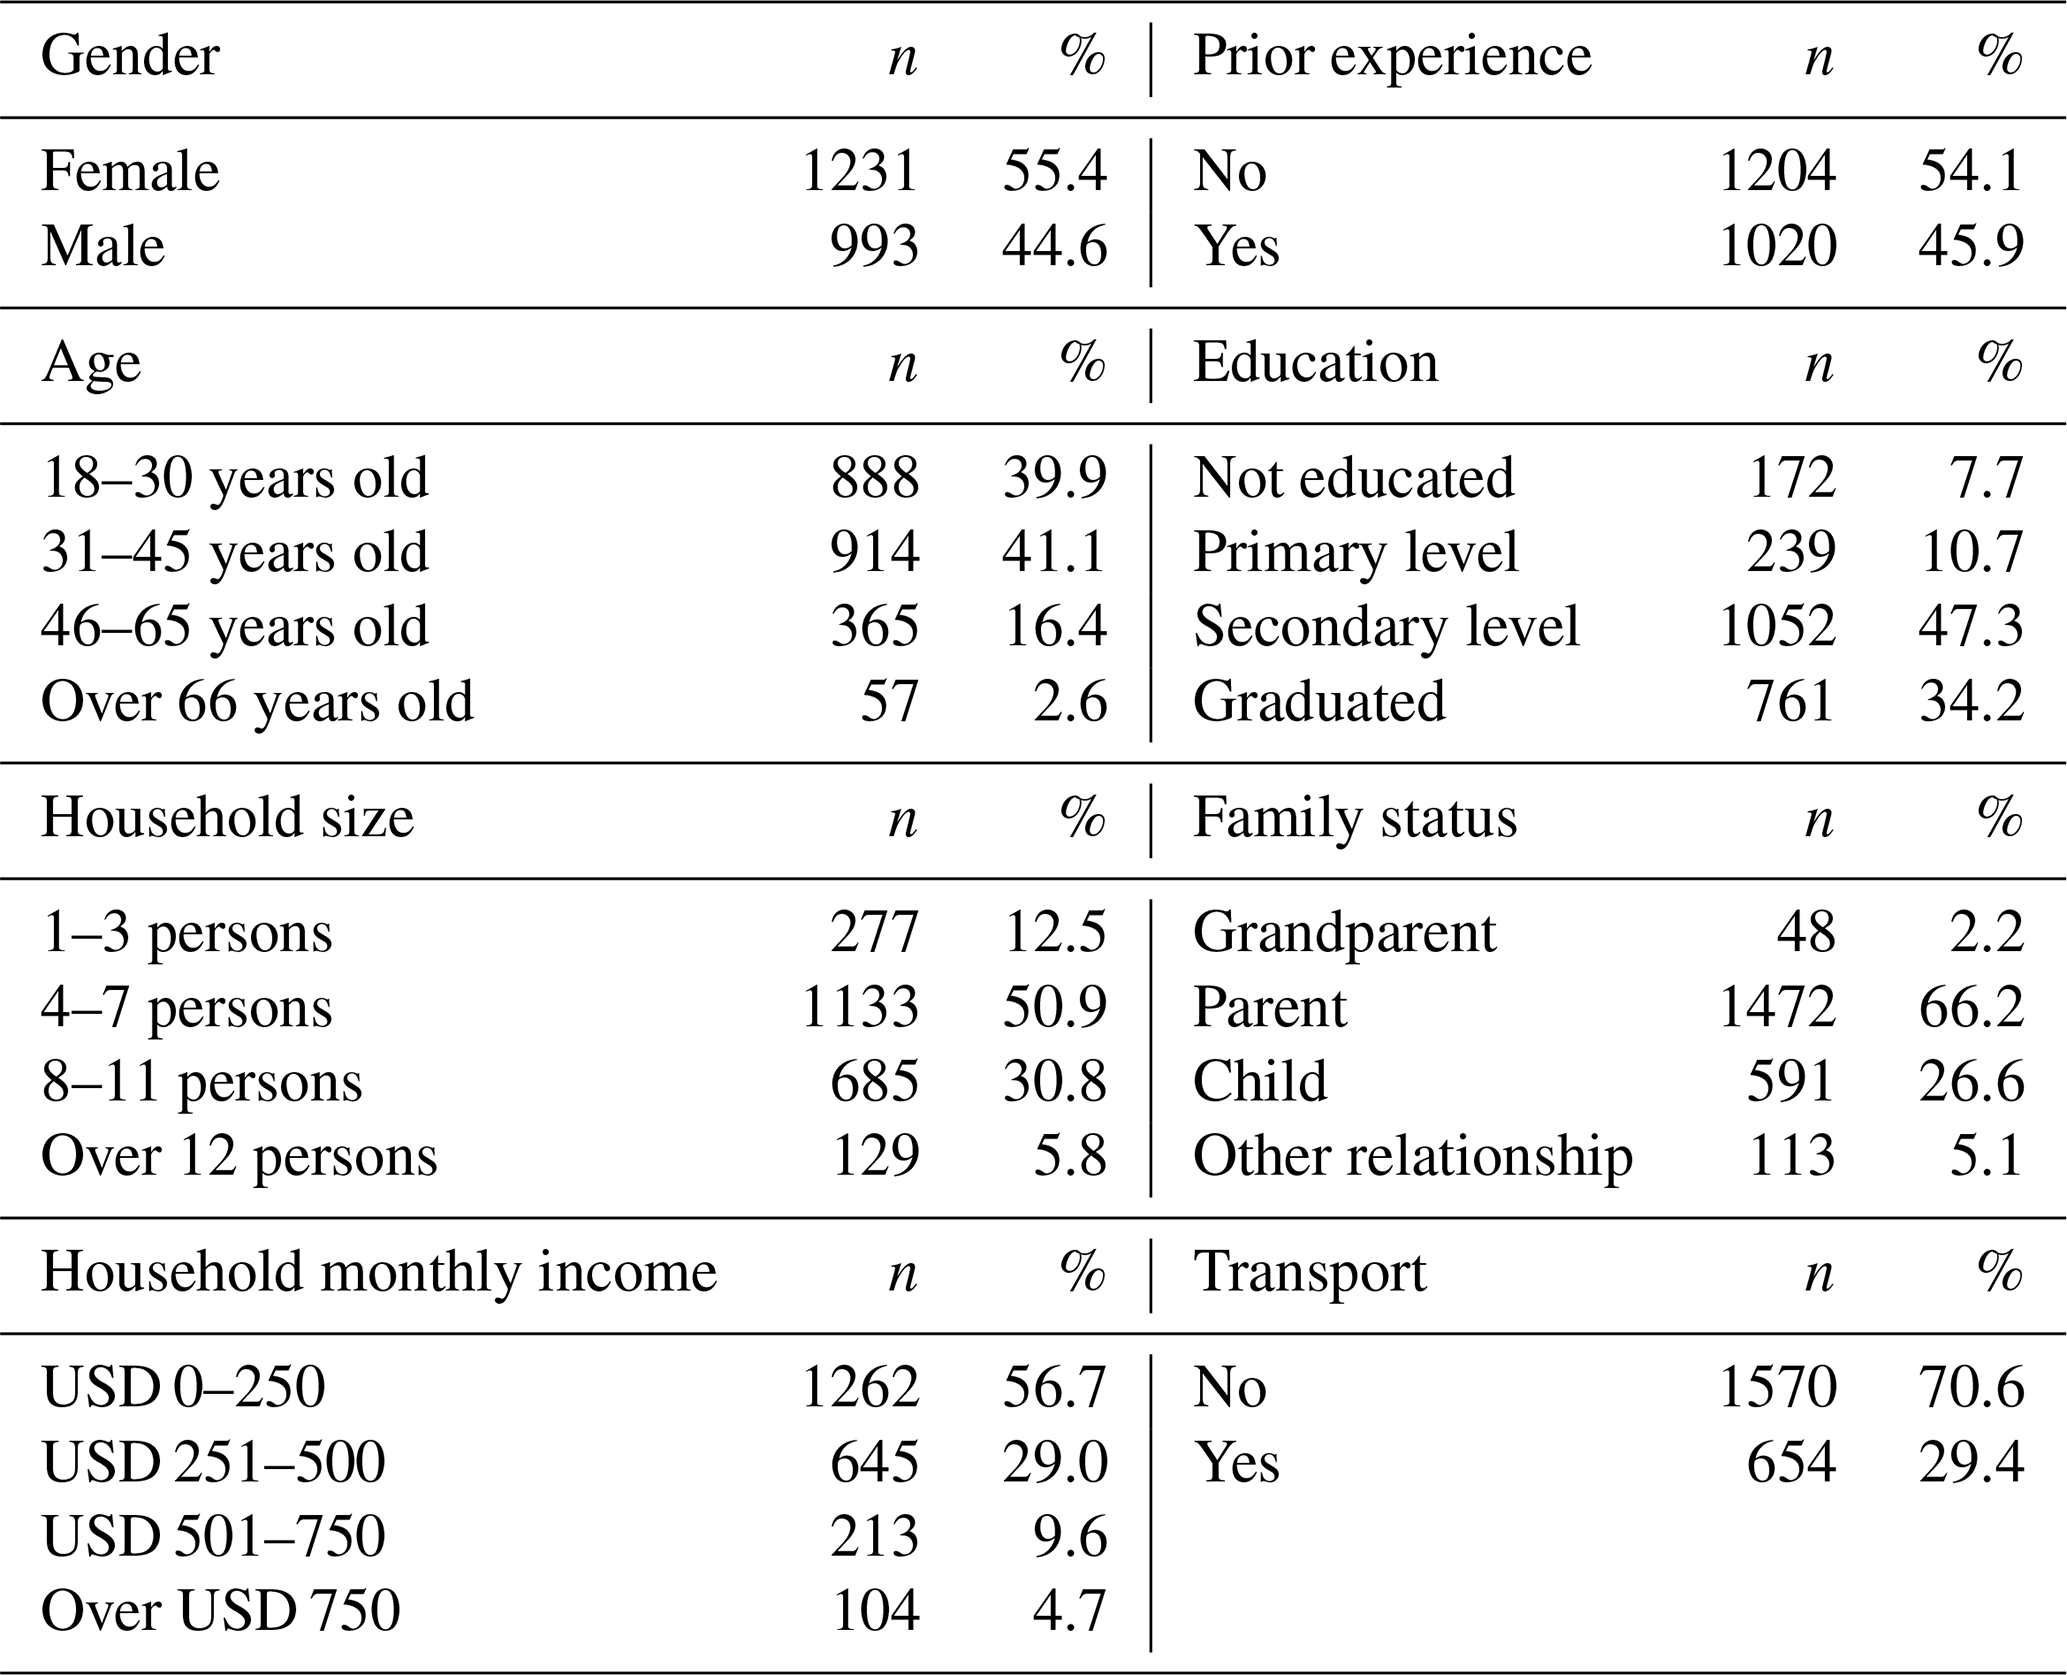
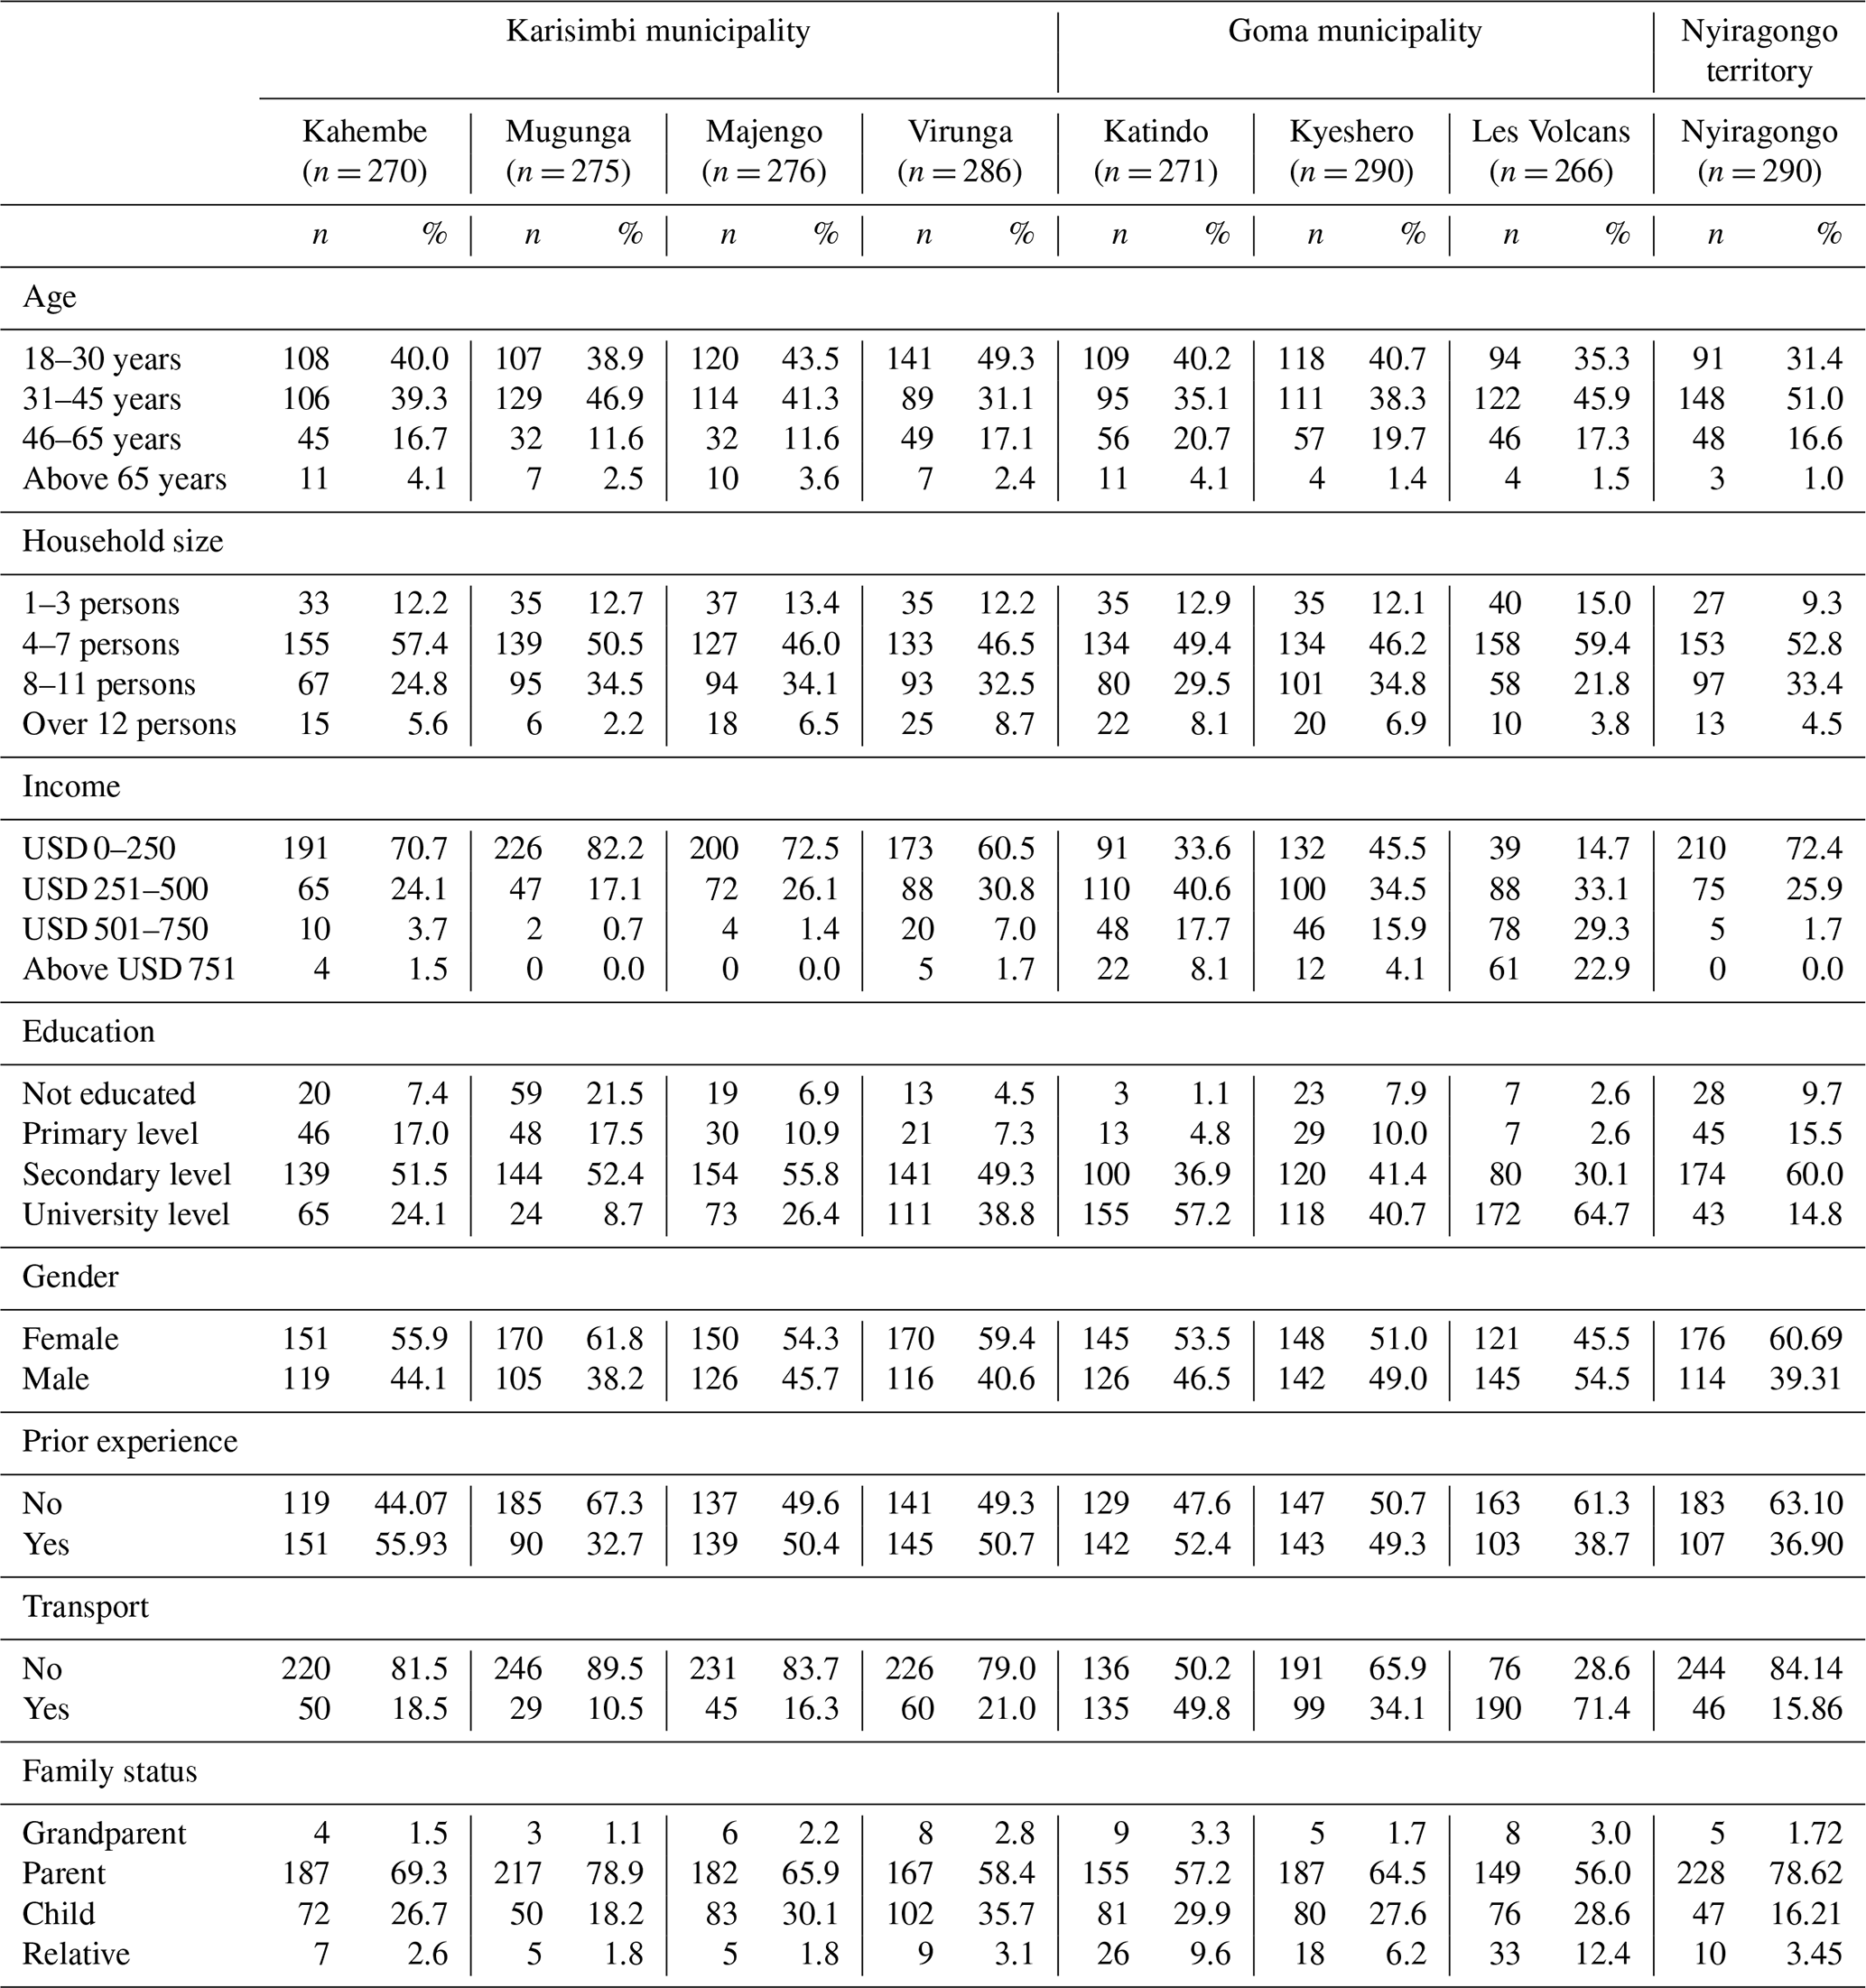
Table 1 describes the demographic profile of the survey participants. There are fewer men than women among the participants, and most of them are parents. The majority lives in large households: half of the households surveyed counts 4 to 7 persons, and 30 % have 8 to 11 persons. Despite the large household size, the average monthly income is very low. More than half of the households live on less than USD 250 per month, and another significant proportion (29 %) live on a monthly income of USD 250–500, thereby limiting access to certain services such as transport. Nevertheless, 34.2 % of the participants have a university degree, and 47.3 % achieved their secondary school completion. The high rate of participants who did not experience the 2002 eruption is an indication of the high migration reported in Goma. Table A1 in the Appendix shows the differences in demographic characteristics of participants between neighbourhoods. In general, households with a very low income live mainly in the Karisimbi municipality and the territory of Nyiragongo. In the Mugunga neighbourhood, one-third of participants are not educated, and this proportion falls to 1.7 % in Katindo or 4 % in the Les Volcans neighbourhood. To summarise, there are strong economic contrasts, but sampled respondents in the different neighbourhoods are homogenous in terms of demographic characteristic (age, gender, household size).
4.2 Risk perception
When asked to rate their perception of a range of threats, the population does not mention natural hazards as the main source of danger (Fig. 3) but rank it among its top five threats, after physical insecurity, at the same level as personal economic insecurity and above other environmental or health threats.
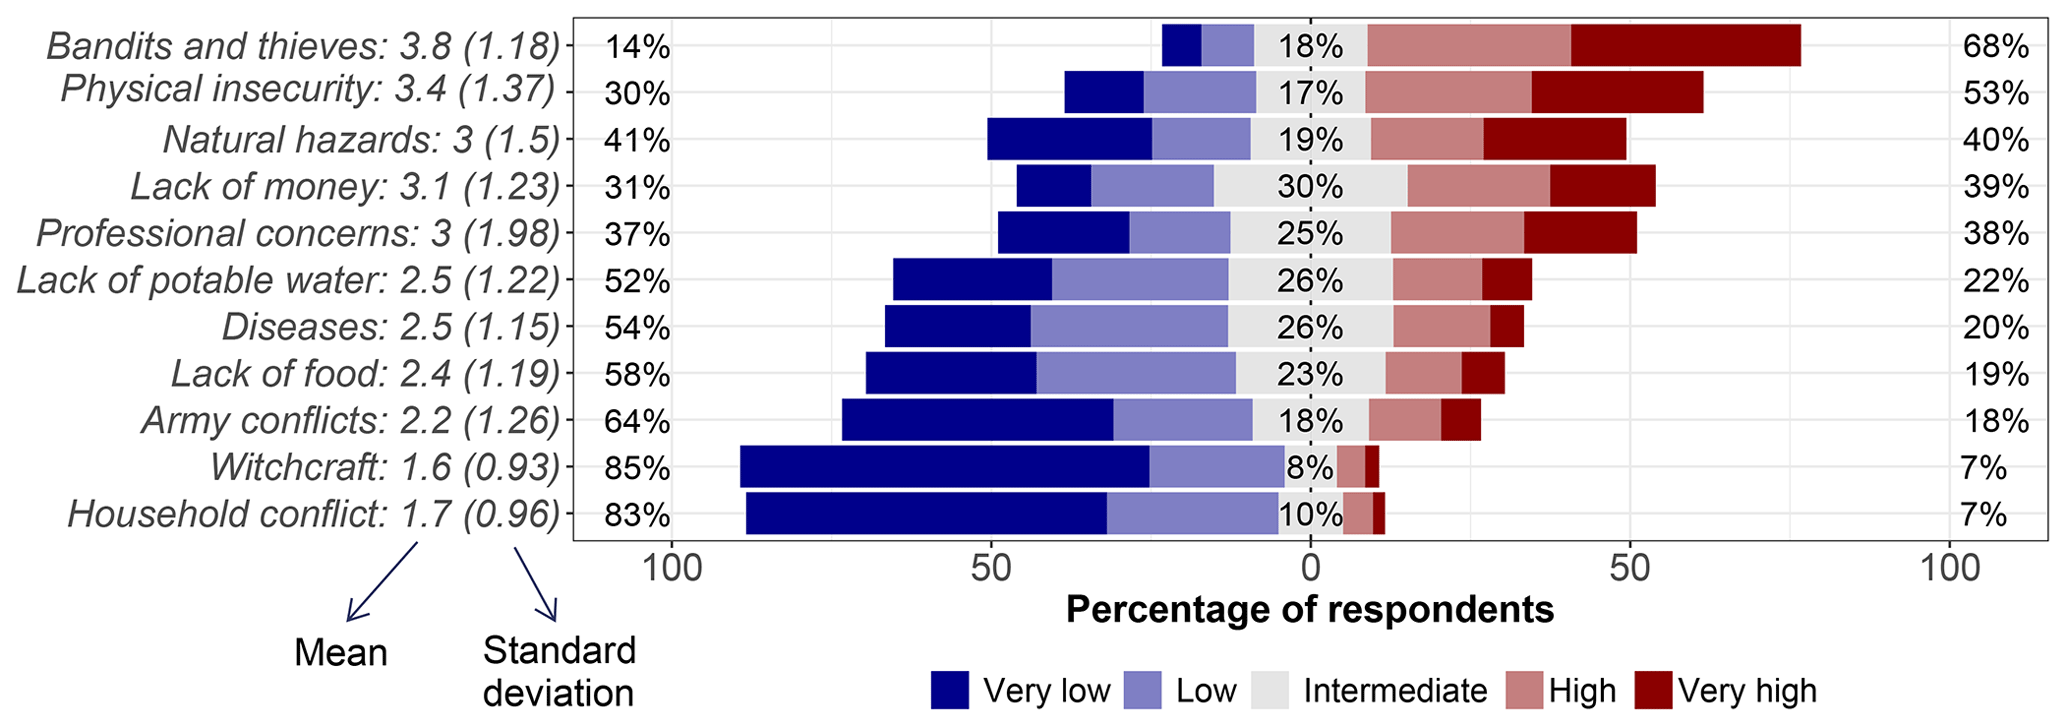
Figure 3Level of perceived likelihood of hazards as a potential source of harm to the respondent. After converting the Likert scale into a numerical scale (very low = 1 to very high = 5), the mean indicates the average perceived level of likelihood of occurrence of each hazard with a range of variation that the mean may have (standard deviation). The percentages on the right represent the proportion of those who perceived a high to very high likelihood of hazard occurrence and impact. The percentages on the left represent the proportion of those who perceive this likelihood to be low and very low. The middle percentages represent the proportion of the population with an intermediate perception level of the likelihood.
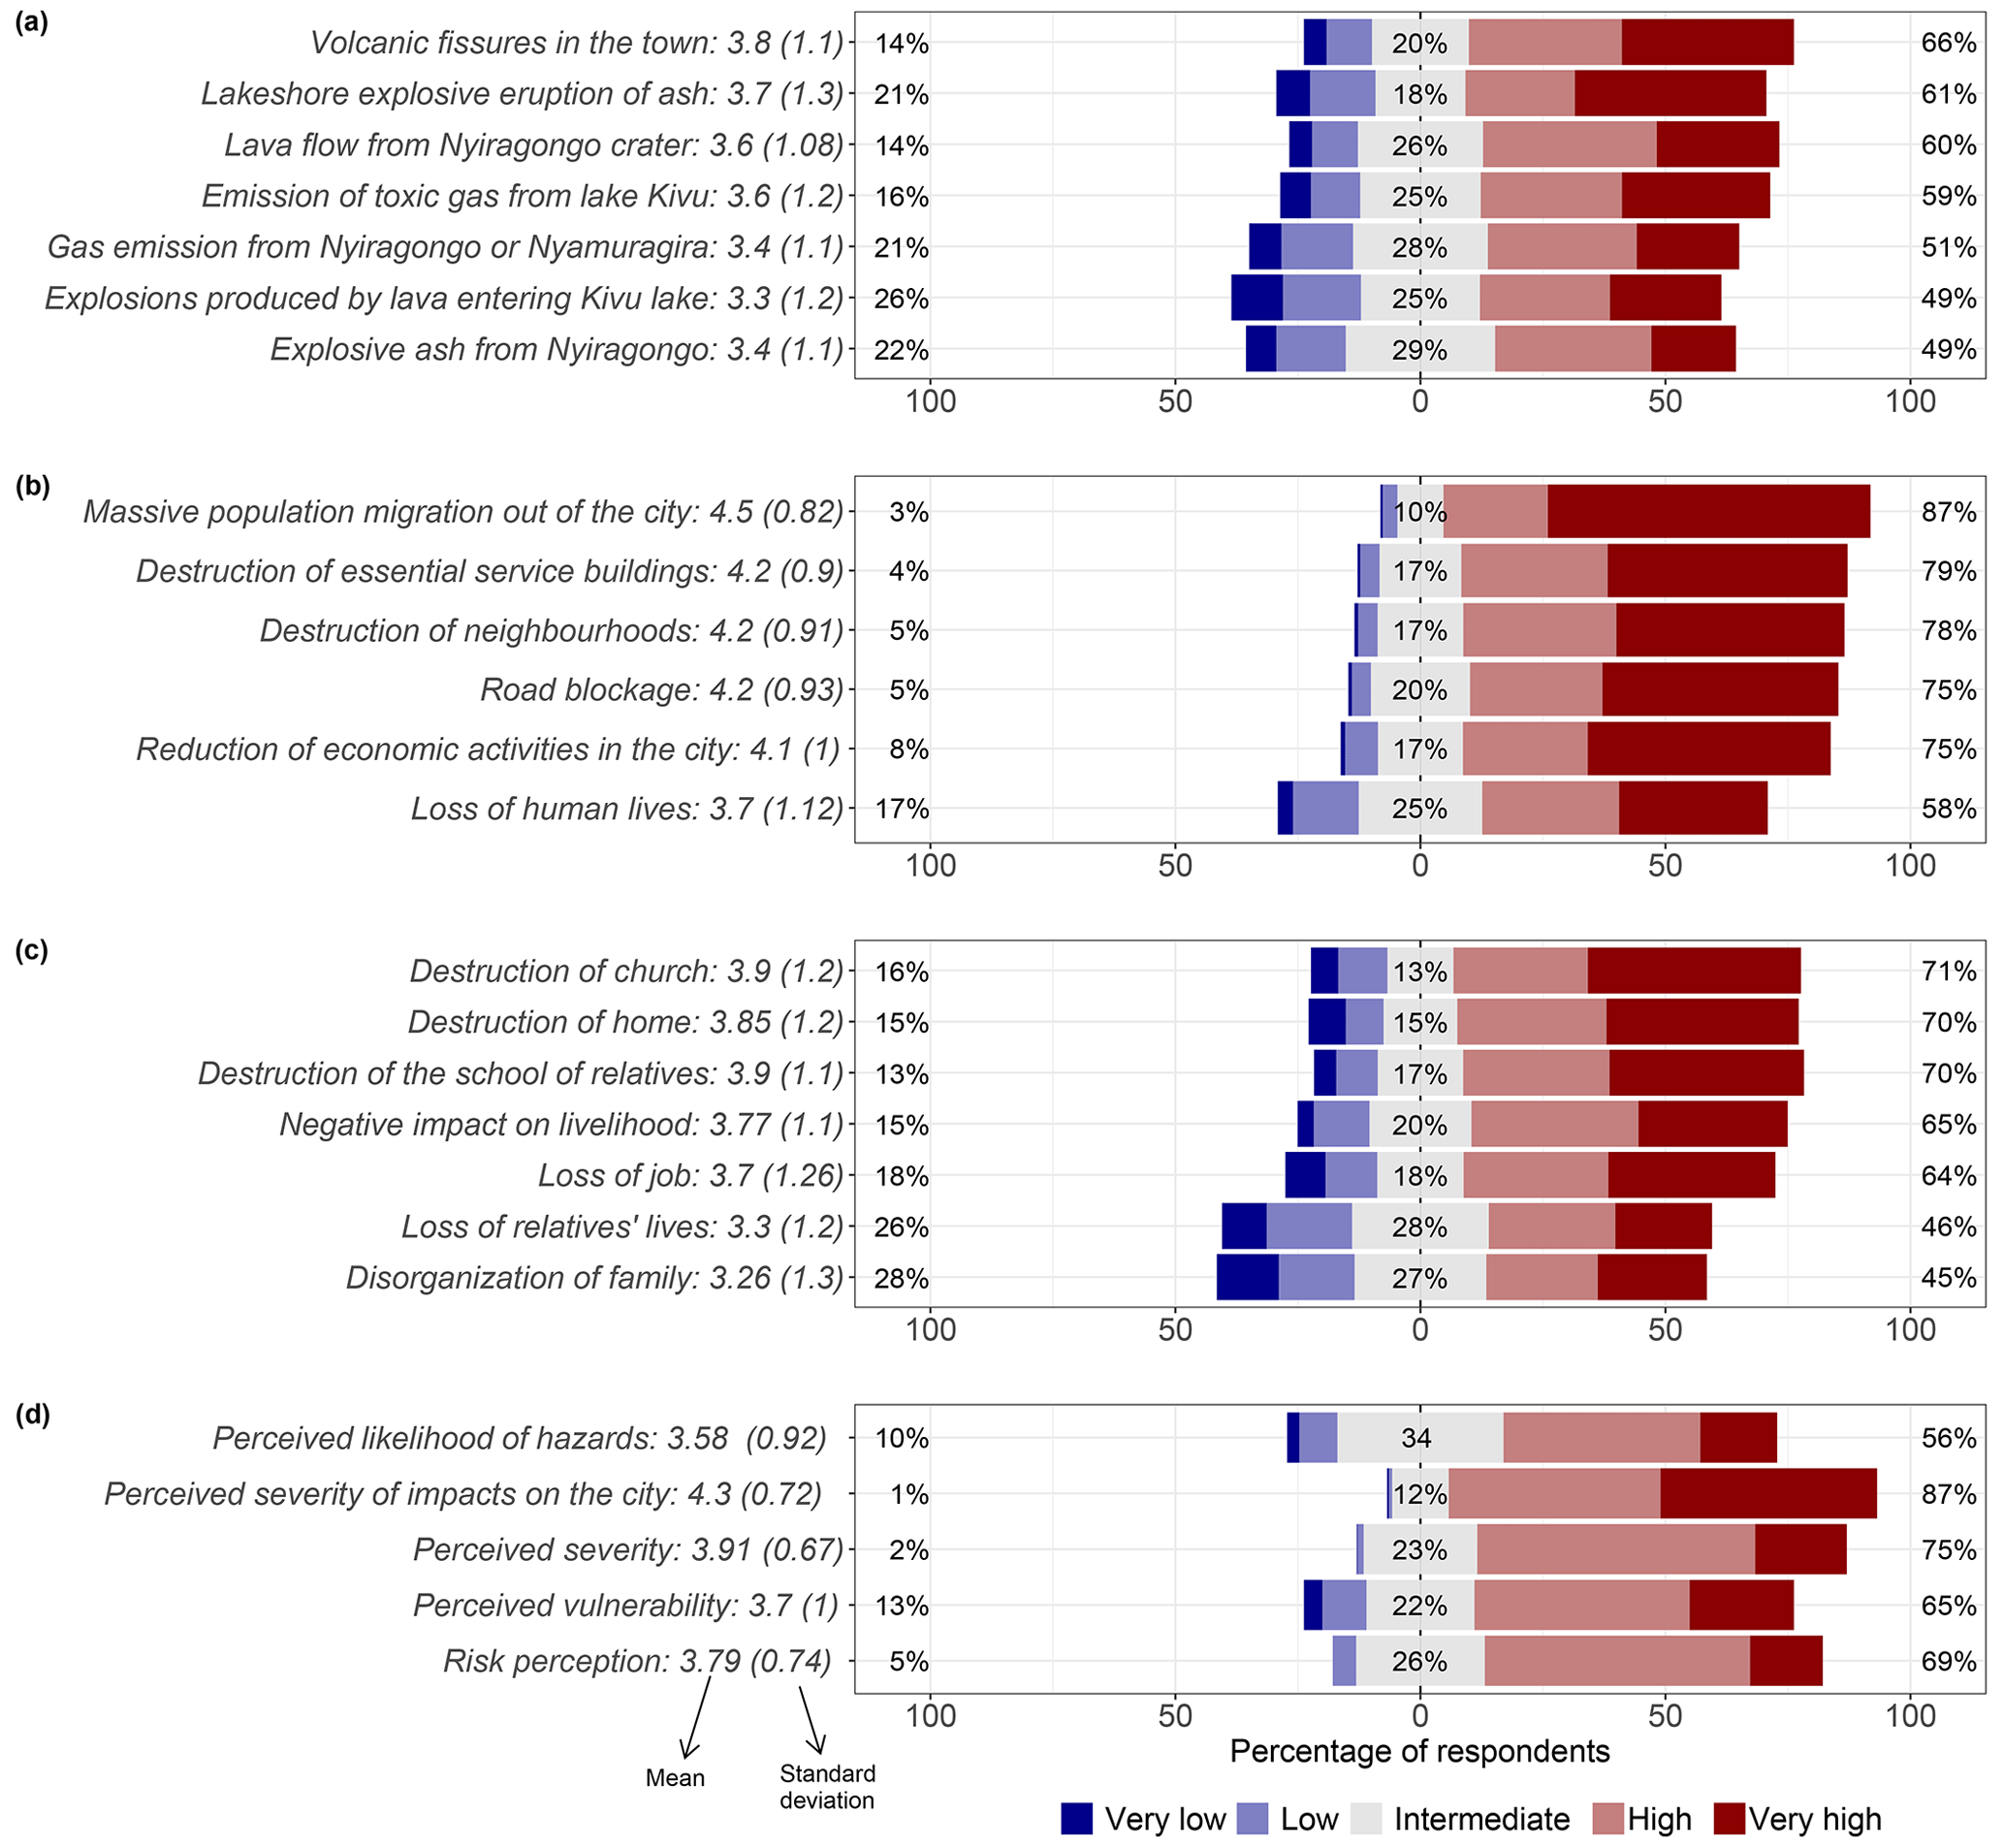
Figure 4(a) Perception of the likelihood of hazards, (b) perception of the severity of the impacts on the city, (c) perception of the likelihood of being personally impacted and (d) aggregated indicators.
When evaluating perceived severity, there is no major variation in the levels of the perceived likelihood of different hazards (Fig. 4a), as well as in the perceived severity of their impacts on the city (Fig. 4b). This similar level of perception is surprising, as several of the hazards mentioned had not occurred (i.e. release of gas from Lake Kivu, explosive eruption at the shoreline of Lake Kivu, explosive ash from Nyiragongo) in recent history at the time of the survey and thus nor their potential impacts. Although all the listed hazards are possible scenarios at Nyiragongo, their homogeneous perception is interpreted to reflect a poor understanding of the contrast between these hazard processes, rather than a proper understanding of all eruption scenarios. Regarding perceived vulnerability, most respondents have a high to very high perception of the damaging impacts on infrastructure and functioning of the society. When considering the potential impact on their own life, participants have a lower perception of the risk of loss of life and family disruption than the perception of other impacts (Fig. 4c). When indicators of perceived likelihood of hazards and the perceived severity of impacts on the city are aggregated as the perceived severity, it is higher than the perceived vulnerability (Fig. 4d), suggesting that volcanic hazards are perceived to be more threatening to the city and its functioning than the individuals themselves. In general, the perception of volcanic risk by the population of Goma was high (mean = 3.7) before the May 2021 eruption of Nyiragongo.
4.3 Factors of risk perception
Table 2 shows the results of the tests of differences in the means of risk perception according to the different potential risk perception factors. Figure 5 presents the variation of the risk perception indicator according to factors for which the Wilcoxon and Mann–Whitney or Kruskal–Wallis's test highlighted a significant contrast between the factors' categories (Table 2). The level of risk perception varies less with demographic and contextual factors than with cognitive and psychological factors. Indeed, there is a limited variation in risk perception by age group i.e. the older age group having a slightly higher risk perception, family status and prior experience of a volcanic eruption (Fig. 5a, b, c). The results interestingly highlight that respondents from households with a lower income tend to have a higher risk perception than respondents from wealthier households. Moreover, the positive relationship between risk perception and anxiety suggests that the high risk perception among the population of Goma induces fear of the impacts from volcanic hazards. The risk perception is directly proportional to the perception of availability and the predictive power of environmental cues, as well as the comprehension and interest in seeking risk information (Fig. 5d, e, f, g, i). This means, as expected, that feeling exposed to the signs and sounds that indicate an onset eruption leads to a perception of a likely occurrence of a hazard and its impacts.
Table 2Results of Wilcoxon and Kruskal–Wallis tests testing the control of different variables on risk perception. W indicates Wilcoxon's rank sum test and χ2 the value of Kruskal–Wallis's chi-squared test.
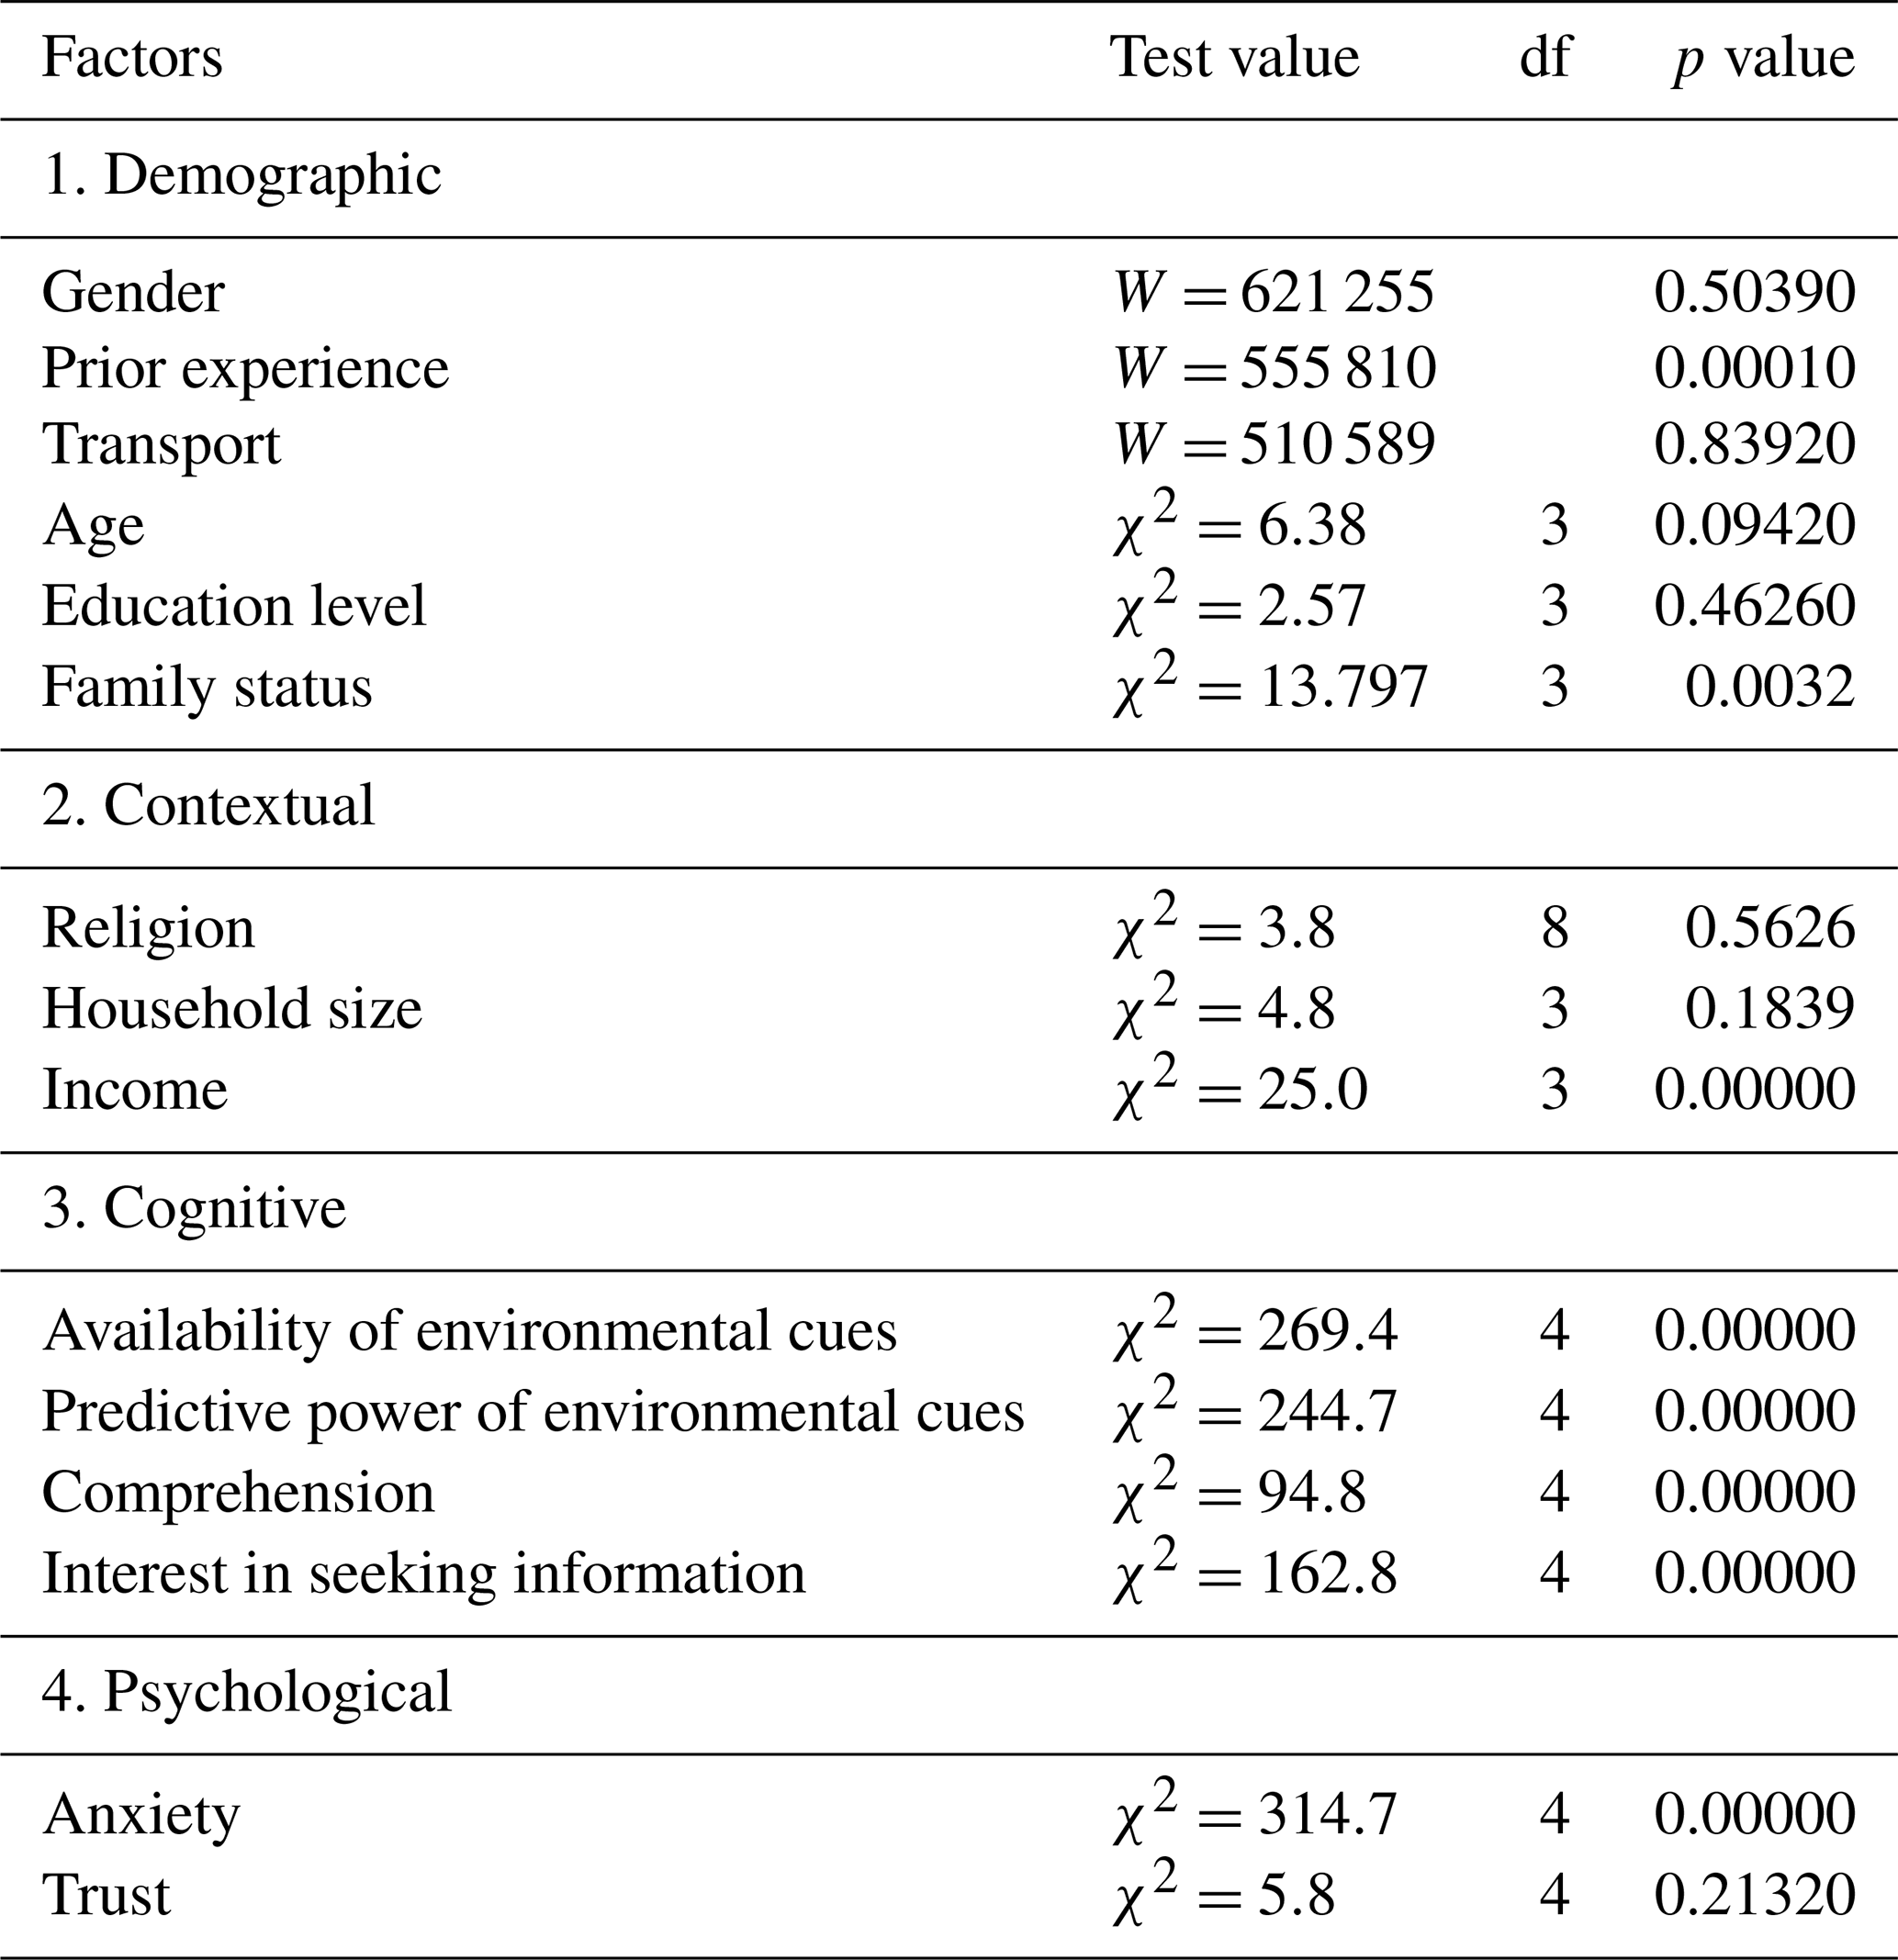
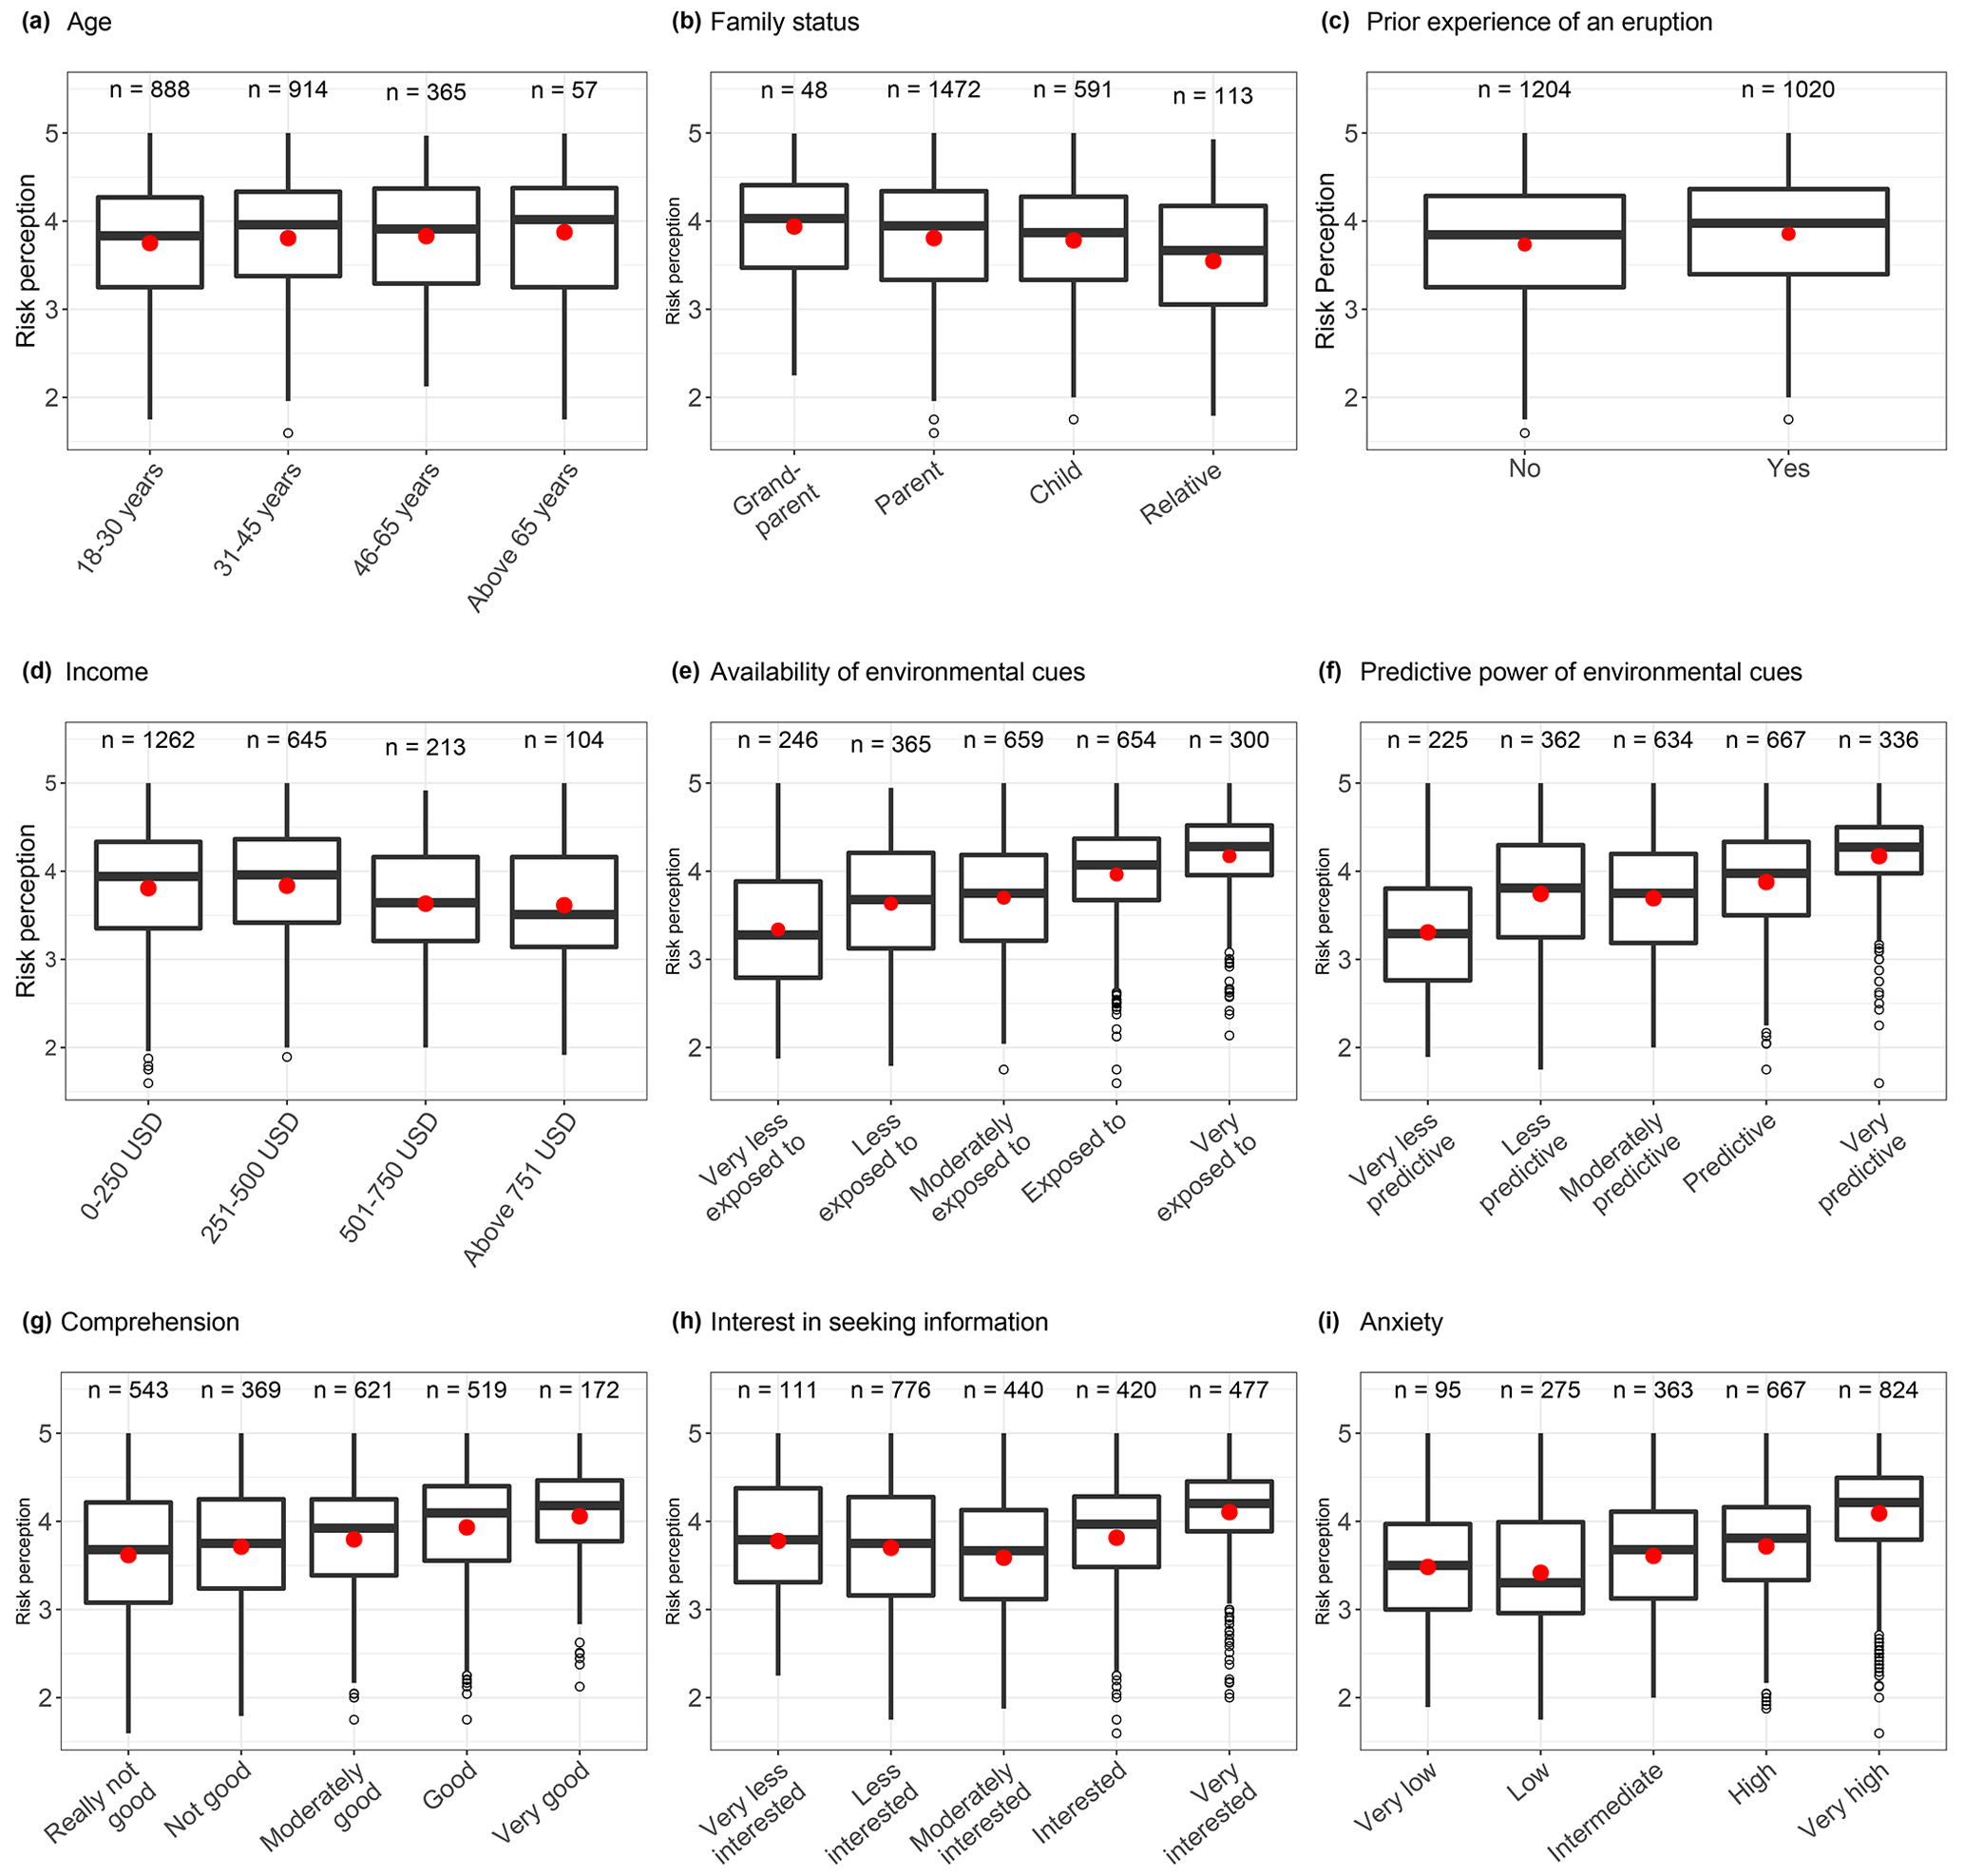
Figure 5The level of risk perception according to significant determining factors. The level of risk perception is in a numerical scale from 1 (very low) to 5 (very high). In each boxplot, the horizontal bold line represents the median, the red dot indicates the mean and the small circles indicate the outliers. Apart from family status and experience of a volcanic eruption, the levels of each factor are in an ascending order.
4.3.1 Demographic and contextual factors
Table 3 indicates the correlation of demographic variables with risk perception, as well as perceived vulnerability and severity. Risk perception has low to very low correlation with demographic and contextual factors (r < 0.1). Even though it is weak, the risk perception is negatively correlated with household income but positively with prior experience of a volcanic eruption. With age and education level, these are the only demographic and contextual factors that have a significant correlation.
Table 3Correlation matrix of demographic and contextual factors with the risk perception indicators.

p value < 0.001, p value < 0.01 and ∗ p value < 0.1.
In turn, household income is correlated with education and availability of a means of transport. Women are less educated than men (r = −0.22). Older respondents are less educated than young people (r = −0.17). As expected, older respondents more commonly reported a prior experience of a volcanic hazard. Even if it is a very low correlation, household income influences perceived vulnerability, not severity. Although risk perception is derived from the aggregation of perceived severity and vulnerability, it is more correlated with perceived vulnerability than perceived severity. Indeed, perceived vulnerability has a high standard deviation and therefore varies more between participants.
4.3.2 Cognitive and psychological factors
Correlation coefficients between cognitive and psychological factors with risk perception are indicated in Table 4. As expected, the correlation results suggest that Goma's population becomes anxious when they perceive the occurrence of hazards as likely, as well as when they perceive themselves as likely to be impacted by volcanic hazards. The trust in authorities is weakly and negatively correlated with risk perception, meaning that people with little trust in authorities have a high risk perception.
Table 4Correlation matrix of cognitive and psychological factors with the risk perception indicators.

p value < 0.001, p value < 0.01 and ∗ p value < 0.1.
Both the reported extent of comprehension and interest in seeking information about volcanic risk are positively correlated with the risk perception indicator (r = 0.20). Specifically, the comprehension of volcanic processes rather leads to a higher perceived severity than to a higher perceived vulnerability. The perception of risk is positively and significantly correlated with the perception of the predictive power of environmental cues, in contrast to the perception of the availability of precursory signals of volcanic hazard occurrence.
4.4 Spatial differences in risk perception indicators
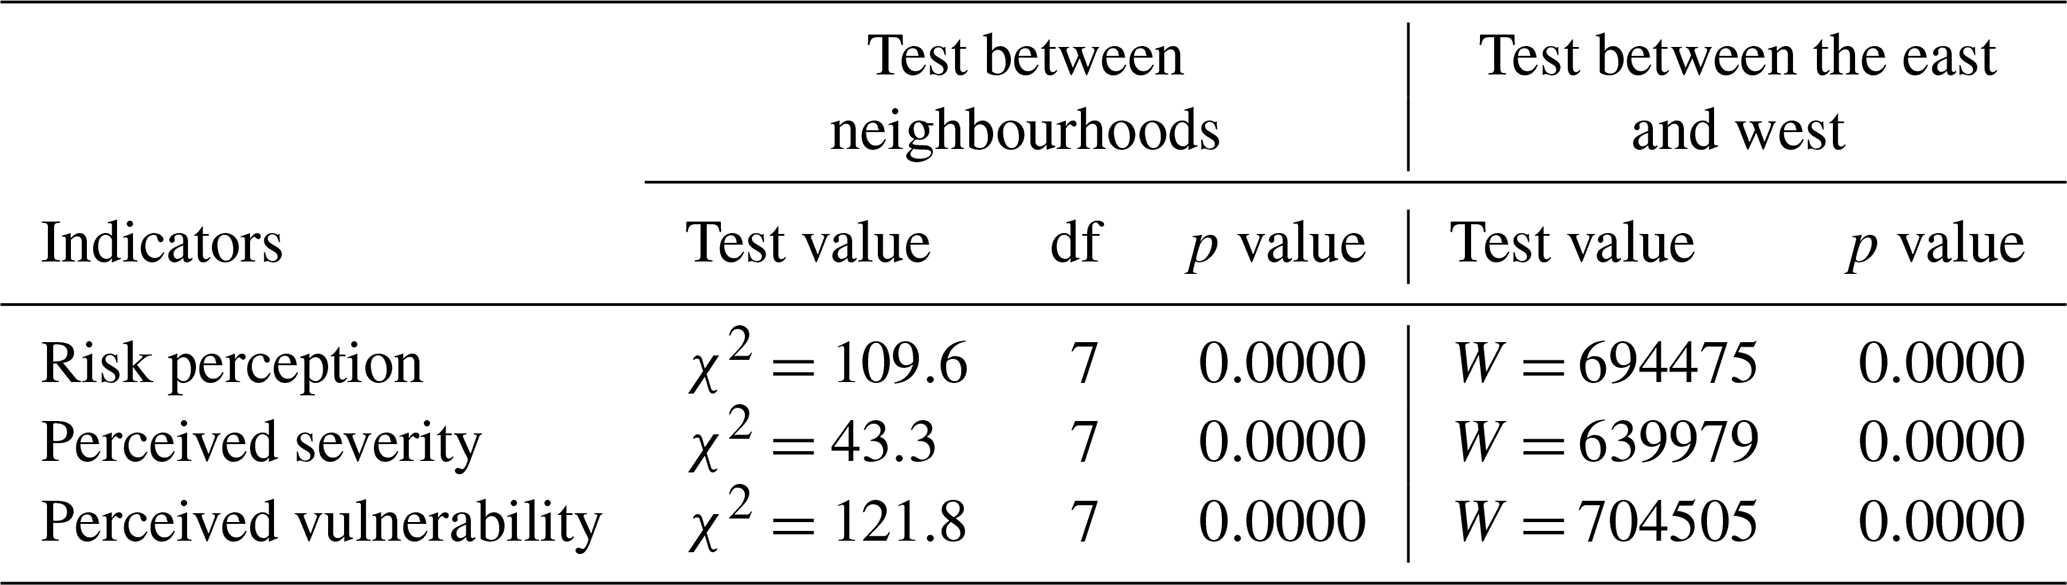
The spatial differences in risk perception indicators were assessed at two levels: between neighbourhoods and between the western and the eastern parts of the city (Fig. 6). We used a Kruskal–Wallis rank sum test for analysis between neighbourhoods and a Wilcoxon test for contrast between the western and the eastern parts of Goma. Results in Table 5 indicate that there are significant risk perception differences between neighbourhoods due to variations in perceived severity and in perceived vulnerability. In addition, a contrast was observed between the western and the eastern parts of the city. Participants living in the eastern neighbourhoods, affected by the 2002 lava flows, demonstrate a higher level of perceived risk than respondents from the western neighbourhoods. In addition, there are significant differences in both perceived severity and perceived vulnerability between participants from these two areas.

Figure 6Spatial variation of (a) perceived severity, (b) perceived vulnerability and (c) risk perception. The perception levels were converted into a numerical scale (very low = 1 to very high = 5). The mean indicates the average level of perception by neighbourhoods with a range of variation within the neighbourhood (standard deviation). The spatial variation across all neighbourhoods was determined by the coefficient of variation of the perception indicator within all the neighbourhoods. It is 36.8 % for the perceived severity, 27.0 % for the perceived vulnerability and 18.0 % for the perception of risk.
Table 5Results of Wilcoxon and Kruskal–Wallis tests testing the spatial differences in risk perception. W indicates the Wilcoxon rank sum test and χ2 the value of Kruskal–Wallis's chi-squared test.
The maps in Fig. 5 illustrate the differences in risk perception indicators per neighbourhood. The lowest levels of perceived vulnerability or severity are observed in the extreme west (Mugunga and Kyeshero), while the highest levels of these two risk perception indicators are observed in the neighbourhoods that were severely impacted in 2002 (Majengo and Virunga) and in Kahembe (the neighbourhood that hosted the Virunga and Majengo disaster victims in 2002). The risk perception as a derivative of the perceived severity and vulnerability follows the same pattern.
5.1 Factors of volcanic risk perception
According to Chauvin (2018), Barclay et al. (2015) and Haynes et al. (2008), several sociodemographic factors (gender, age, level of education, level of income, etc.) have been shown to influence risk perception. However, in Goma, prior to the May 2021 eruption, only age (Fig. 5a), family status (Fig. 5b) and monthly household income (Fig. 5d) were associated, to a limited extent, with variation of risk perception. Younger people and those who do not belong directly to the close family have a lower perception than older people and close family members (Fig. 5b). The sense of responsibility for the well-being and security of the household seems to be one of the determinants of risk perception in Goma as documented in several other case studies (Gaillard and Dibben, 2007; Gaillard and Mercer, 2013). In addition, a high household income reduces the level of risk perception (Fig. 5d). Indeed, the perceived risk of asset loss or impact on livelihoods is higher compared to the perceived impact on lives (Figs. 3, 4b and c). This can be interpreted by the fact that, although poor households have little to lose, they would experience a relatively large impact of such loss, whereas rich people having many more assets would be relatively less affected by the loss. Blake et al. (2017) argue that people who are labelled as vulnerable, especially the poor, typically find it more challenging to reconstruct their lives after a disaster strikes.
Considering the demographic factors that control risk perception in other volcanic environments around the world, mostly assessed in western countries (Barrett, 2020), family considerations do play a role in Goma. Reviewing sociodemographic factors of risk perception, Chauvin (2018) notes that gender is a determining demographic factor in controlling of risk perception in several cases, with women having a higher level of perception than men. However, in Goma, it is the economic context of the family, the position of the respondent in the household and their age that control the perception of risk. Considering these three parameters, it can be deduced that a parent or a responsible person in the household (usually the eldest of the household) with limited resources is more concerned by the household vulnerability to external hazards, and their risk perception level is higher than other family members'. Wu and Zhong (2022) highlight that people in collectivist cultures, as is the case to some extent in Goma, are better insured and supported by their nuclear and extended family members, as well as friends in their communities. Consequently, collectivist culture acts as a form of implicit mutual insurance to protect people from catastrophic losses, which leads to fewer perceived risks by family members who are not directly responsible for the household or community. Thereby, risk perception is influenced by the household's sense of responsibility and desire for well-being. Risk assessment and development of DRR strategies at the household level should be prioritised over those at the individual level.
The sub-permanent lava lake hosted in the Nyiragongo crater emits a gas plume (Arellano et al., 2017; Michellier et al., 2020), and in some inhabited neighbourhoods, there is localised emission of dry volcanic gas through fractures, called mazuku (Smets et al., 2010). Moreover, in January 2002, before the eruption, strong detonations were heard from the volcano (Komorowski et al., 2002). These are environmental evidence that most of the respondents consider warning signs as a good predictor of an imminent or starting eruption. Indeed, the predictive power of these processes is considered very high for respondents that have a high risk perception. However, Lindell and Perry (2012) warn that the perception of these environmental cues can bias interpretations of a hazard prediction. For the individual, a good knowledge of the mechanisms related to the hazard is required, as well as an understanding of the uncertainty associated with predictions of the natural event.
Our study also highlights a logical link between the level of interest in seeking information related to volcanic phenomena and the level of their understanding. It is however unclear whether the understanding is higher because people actively look for information on the volcano or whether a good understanding of the threat encourages inhabitants to further inform themselves on the volcanic activity. Both elements are associated with a high level of risk perception. Moreover, confidence in the actors involved in DRR does not influence the perception of risk (r = −0.06), but it influences the interest in seeking information (r = 0.22). This means that the population considers that it is possible to find reliable information from those actors. Finally, as advocated by Gaillard and Mercer (2013), increasing knowledge about volcanic phenomena could have a real impact on the level of risk perception.
5.2 Influence of prior disaster experience on risk perception
5.2.1 Homogenisation of the volcanic risk perception
In 2017, Michellier et al. (2020) assessed Goma residents' judgment of whether their household was at risk of a natural hazard or not. Consistent with similar studies, they found that considering one's household to be at risk was positively correlated with past experience of a geological hazard (Plattner et al., 2006; Heitz et al., 2009; Chauvin, 2018; Miceli et al., 2008; Paton et al., 2008; Lindell and Perry, 2000). However, our results (Fig. 5c) show little variation in risk perception between those who experienced the 1977/2002 eruptions (n = 1204) and those who did not (n = 1020). The correlation between eruption experience and risk perception is very weak (0.09), although positive and significant. This limited influence of experience of past eruptions – before the May 2021 eruption – on risk perception can be explained by four reasons: (1) the long period (nearly 20 years) since the last eruption prior to our survey, in agreement with Perry and Lindell (2008) and Merlhiot et al. (2018); (2) the experience of the 1977/2002 eruptions but without having suffered considerable personal damages as also found by Hall and Slothower (2009); (3) for those who have not experienced the last eruption before the May 2021 eruption, the high risk awareness maintained by the Goma Volcano Observatory's communications combined with anxiety caused by false alarms spread by social media in accordance with Mileti and O'Brien (1992); and (4) the fact that Nyiragongo is an open system volcano, with regular gas plume and a red glow at night (i.e. the activity of the volcano is well known to everyone in the city, not only those who were there during the last lava flow eruption). A further study of risk perception after the recent May 2021 eruption would allow for a better interpretation of the effect of prior experience on risk perception after a short time period. Despite this homogenisation of risk perception, the spatial analysis of our data shows differences between neighbourhoods and between the eastern (prior impacted area) and the western parts of Goma.
5.2.2 Influence of living in a prior impacted area on risk perception
Previous studies have highlighted spatial variations in the perceived severity of volcanic hazards according to the distance between the location of an inhabitant and a volcano (Quinn et al., 2019; Chester et al., 2008; Haynes et al., 2008; De la Cruz-Reyna and Tilling, 2008; Njome et al., 2010; López-Fletes et al., 2022). Goma is located 18 km south of Nyiragongo, but this volcano is clearly visible from all parts of the city. Lava flow is the main volcanic hazard, as experienced in 2002, when it crossed the city centre from north to south, and reached lake Kivu (Favalli et al., 2009, 2006). The variation in risk perception between neighbourhoods does not differ depending on whether the neighbourhood is far from the volcano or not (Fig. 5a). Brown et al. (2017) state that it is almost exclusively with the ballistic volcanic hazard that the perceived likelihood of hazards and the severity of their impacts vary with distance from the volcano. However, at the Nyiragongo volcano, the constant “visibility” of the threat and the knowledge that lava flows can extend to a large distance cause a homogeneous risk perception. Furthermore, impacts from an eruption like the one of 2002 are expected to be high and to affect the whole city (Fig. 4b).
In addition, Goma is not officially subdivided into risk zones, contrary to some volcanic areas around the world (Slovic, 1991; Capra et al., 2015; Brown et al., 2017; Tsang and Lindsay, 2020). Therefore, the perceived likelihood of volcanic hazards and the severity of their impacts on the city could not be influenced by official risk zonation, despite the fact that the hazard from lava flows is not homogenous across the city (Syavulisembo et al., 2015; Favalli et al., 2009; Michellier et al., 2020). Indeed, in Italy as a concrete example, the areas of Vesuvius and Campi Flegrei are subdivided into risk zones (red, yellow and blue zones), and a spatial variation of the perceived likelihood of hazards was observed in these different zones (Barberi et al., 2008; Ricci et al., 2013). In Goma, the existing map of lava flow probability (Favalli et al., 2009; Kervyn et al., 2022) is not sufficiently disseminated among the population, or in official documents, like the volcanic eruption contingency plan, to influence the risk perception. Therefore, it seems not to be a specific factor that pushes people living in different neighbourhoods of Goma to perceive the likelihood of the occurrence of volcanic hazards differently.
The variation in risk perception between neighbourhoods does not differ depending on whether the neighbourhood is far from the volcano or not. The highest level of risk perception is observed in the east of the city (Fig. 5c), i.e. not only the area that has been historically impacted by lava flows but also the oldest inhabited area (Komorowski et al., 2002; Michellier et al., 2020). Although the difference in the average perception per neighbourhood is limited, living in an area historically impacted by eruption influences the level of risk perception. Indeed, in an editorial review, Gaillard and Dibben (2007) showed that the spatial dimension of risk perception is closely related to memory of past events or prior experience. This demonstrates that, in some cases, it is not the individual experience that matters but rather that of a community in a neighbourhood where the impacts of past eruptions are still visible (Gaillard and Dibben, 2007). In Goma, the signs of the impact of the 2002 lava flows are still visible in the eastern neighbourhoods, and these events are part of the oral tradition, suggesting indeed that it is not so much individual experience as collective memory of the event that affects the risk perception in a specific neighbourhood. For example, during the survey in the Virunga neighbourhood, an old man told us
my neighbour used to tell me that in 2002, the volcanic eruption had surprised them with a red-hot cloud and a puff of heat. After the eruption they returned in our neighbourhood, built on lava flows. Now, those who experienced the eruption and us who did not, all of us live in the likely path of lava flow.
Participants' socioeconomic vulnerability may also affect their perception of risk. Barclay et al. (2015) realised that in most cases high conditions of vulnerability of an individual usually lead to a high level of their risk perception. For instance, Khan et al. (2019) indicate that the physical vulnerability of buildings of an inhabitant is positively and significantly correlated with their perception of earthquake risk. In Goma, Michellier et al. (2020) found that the social vulnerability of the population of Goma is high in the peripheral neighbourhoods of the city, like Mugunga, a part of Kyeshero and the Nyiragongo territory. In contrast, our results indicate that the mean level of perceived vulnerability in these peripheral neighbourhoods is low (Fig. 5b). Therefore, spatially, our results show that perceived vulnerability is weakly related to the social vulnerability index. However, the perception of being personally at risk is negatively correlated with household income. In addition, people consider losing their assets as more concerning than being physically impacted (Fig. 4b and c). As a result, the vulnerable population in the peripheral neighbourhoods of Goma is also the one that feels the least concerned by volcanic risks. Blaikie et al. (2004), Van Praag et al. (2021) and Michellier et al. (2020) highlight that in Goma social vulnerability is underpinned by political context, armed conflicts, limited access to livelihoods and dependent economies so that people are more concerned by daily survival than natural hazards (Fig. 3). Another explanation of the low perceived vulnerability in the peripheral neighbourhoods could be that these neighbourhoods are far from the path of historical lava flows.
5.3 Limitations and perspectives
This study is affected by several limitations, one of which is the demographic characterisation of respondents that did not consider the housing tenure of respondents (ownership vs. rental) and the duration of residence in a specific neighbourhood. A qualitative approach through focus groups and interviews could help to capture local interpretations of the volcanic risk depending on culture. Our survey formulation of perceived vulnerability might have led to misinterpretation between the likelihood or the impact. Thus, multiple phrasing should be tested for the same concept.
Future research on risk perception in Goma should also consider (1) the impact of the population growth by highlighting differences of risk perception according to migration status, (2) the impact of false alarms spread by social media on risk perception, (3) the relationship between perceived vulnerability and scientifically assessed social vulnerability, and (4) the influence of risk experiences in general (vicarious, life difficulties, disaster experience, experience of insecurity related to civil wars or criminality) on volcanic risk perception. As our survey was conducted prior to the 2021 eruption crisis, it would be needed to study how this eruption and the associated evacuation have affected the risk perception of inhabitants. Finally, it would be relevant to further analyse how the highlighted contrasts in risk perception impact a population's preparedness and reaction during a volcanic crisis.
By describing the risk perception of 2224 inhabitants of Goma prior to the May 2021 eruption of Nyiragongo, we highlight the main factors controlling risk perception and its spatial distribution in the city of Goma. In general, the perception of volcanic risk by the population of Goma was high. Volcanic hazards are perceived to be a bigger threat for the city and its functioning, rather than for the individuals themselves. In contrast to other populated volcanic areas, distance does not significantly affect the risk perception, but a variation between the historically impacted eastern zone and the rest of the city is noted. Demographic factors are not the key factors shaping risk perception but rather cognitive and psychological ones. Furthermore, unlike studies in other volcanic areas, the experience of a past volcanic eruption is not a key factor in shaping risk perception at an individual level; however, the spatial difference in risk perception suggests that collective memory of past events in areas affected by a previous eruption does play a role. Cognitive factors and the family context are the key factors shaping the volcanic risk perception in Goma. Therefore, to enhance risk perception in the perspective of motivating the population to be well informed and to be prepared to face the volcanic risk, awareness-raising tools that strengthen the knowledge of inhabitants and the collective memory beyond the directly affected neighbourhoods would be essential. In addition, risk assessment and development of DRR strategies at the community level should be prioritised over those at the individual level in opposition to most risk perception studies conducted in western countries (Sommestad et al., 2015; Brewer et al., 2007; Bamberg et al., 2017). Another further study testing the impact of tools to improve knowledge of volcanic phenomena would provide a better understanding of how psychological and cognitive factors can influence risk perception through risk-awareness raising.
This study also discusses how the risk perception contrasts with the vulnerability of the population of Goma as assessed by scientific methods. Indeed, we highlighted that the factors determining the social vulnerability index are not necessarily those that make the population perceive that they are vulnerable or at risk. Moreover, we pointed out that people living in the peripheral neighbourhoods, far from the historically impacted path of the lava flow, have a low perception of their likelihood of being impacted. An unexpected eruption of Nyiragongo, like the one in May 2021, with a different lava path from the one taken by the eruptions of the last century, would affect a population that considers itself not highly vulnerable. It is therefore urgent to disseminate the map of lava flow probability. Finally, considering that the occurrence of a new event changes risk perception, a follow-up study assessing the evolution of the risk perception after the eruption of May 2021 is highly needed. As a perspective, more research about risk perception should be conducted in the Global South, as in the case of Goma. It could help to better understand the difference of risk perception between individualist and collectivist cultures. As a result, this could lead to a better balance of factors controlling risk perception globally.
Table A1Detailed overview of the participant demographic characteristics across neighbourhoods.
The raw and processed data from the co-authors' research findings cannot be shared at this time, as these data are also part of ongoing PhD research. The data are on Zenodo (https://doi.org/10.5281/zenodo.7638998; Mafuko Nyandwi, 2023) and may be made public once the doctoral research is completed. The research design and questionnaire design (in French) are available upon request from the corresponding author.
BMN, CM and MK conceived the study. BMN conducted interviews, designed questionnaires, analysed the data and wrote the original draft of the manuscript, with key input and revisions from CM, MK, FMH and FK. CM and FMH provided technical advice for data collection.
The contact author has declared that none of the authors has any competing interests.
The HARISSA (Natural HAzards, RISks and Society in Africa: developing knowledge and capacities) project, under which this research was conducted, was approved by the Congolese national government (Ministry of Research and Technology) and local authorities. The survey questionnaire and research protocol were approved in terms of ethical considerations by the academic office of the University of Goma and local authorities at the municipality and neighbourhood levels in Goma. Verbal informed consent was obtained from the survey participants for their anonymised information to be published in this article.
Publisher's note: Copernicus Publications remains neutral with regard to jurisdictional claims in published maps and institutional affiliations.
We thank all respondents that participated in the survey, as well as the enumerators from the Université de Goma (UNIGOM) and the Institut Supérieur de Statistique et de Nouvelles Technologies of Goma (ISSNT) that helped to collect the data.
This work is achieved in the framework of the HARISSA project funded by the development cooperation programme of the Royal Museum for Central Africa with support of the Directorate-General for Development Cooperation and Humanitarian Aid of Belgium (RMCADGD).
This paper was edited by Amy Donovan and reviewed by David K. Chester and Emma Hudson-Doyle.
Arellano, S., Yalire, M., Galle, B., Bobrowski, N., Dingwell, A., Johansson, M., and Norman, P.: Long-term monitoring of SO2 quiescent degassing from Nyiragongo's lava lake, J. Afr. Earth Sci., 134, 866–873, https://doi.org/10.1016/j.jafrearsci.2016.07.002, 2017.
Bamberg, S., Masson, T., Brewitt, K., and Nemetschek, N.: Threat, coping and flood prevention – A meta-analysis, J. Environ. Psychol., 54, 116–126, https://doi.org/10.1016/j.jenvp.2017.08.001, 2017.
Barberi, F., Davis, M. S., Isaia, R., Nave, R., and Ricci, T.: Volcanic risk perception in the Vesuvius population, J. Volcanol. Geotherm. Res., 172, 244–258, https://doi.org/10.1016/j.jvolgeores.2007.12.011, 2008.
Barclay, J., Haynes, K., Houghton, B., and Johnston, D.: Social Processes and Volcanic Risk Reduction, in: The Encyclopedia of Volcanoes, Elsevier, 1203–1214, https://doi.org/10.1016/b978-0-12-385938-9.00069-9, 2015.
Barclay, J., Few, R., Armijos, M. T., Phillips, J. C., Pyle, D. M., Hicks, A., Brown, S. K., and Robertson, R. E. A.: Livelihoods, Wellbeing and the Risk to Life During Volcanic Eruptions, Front. Earth Sci., 7, 205, https://doi.org/10.3389/feart.2019.00205, 2019.
Barrett, H. C.: Deciding what to observe: Thoughts for a post-WEIRD generation, Evol. Hum. Behav., 41, 445–453, https://doi.org/10.1016/j.evolhumbehav.2020.05.006, 2020.
Barrière, J., D'Oreye, N., Smets, B., Oth, A., Delhaye, L., Subira, J., Mashagiro, N., Derauw, D., Smittarello, D., Syavulisembo, A. M., and Kervyn, F.: Intra-Crater Eruption Dynamics at Nyiragongo (D.R. Congo), 2002–2021, J. Geophys. Res.-Sol. Ea., 127, 2002–2021, https://doi.org/10.1029/2021JB023858, 2022.
Bee, B. A.: Power, perception, and adaptation: Exploring gender and social-environmental risk perception in northern Guanajuato, Mexico, Geoforum, 69, 71–80, https://doi.org/10.1016/j.geoforum.2015.12.006, 2016.
Blaikie, P., Cannon, T., Davis, I., and Wisner, B.: At Risk: Natural Hazards, People's Vulnerability and Disasters, 2nd edn., Routledge, https://doi.org/10.4324/9780203714775, 2004.
Blake, D., Marlowe, J., and Johnston, D.: Get prepared: Discourse for the privileged?, Int. J. Disast. Risk Reduct., 25, 283–288, https://doi.org/10.1016/j.ijdrr.2017.09.012, 2017.
Botterill, L. and Mazur, N.: Risk and risk perception: A literature review, in: Kingston Act 2604, Rural Industries Research and Development Corporation, ISBN 0642587531, 2004.
Brewer, N. T., Chapman, G. B., Gibbons, F. X., Gerrard, M., McCaul, K. D., and Weinstein, N. D.: Meta-analysis of the relationship between risk perception and health behavior: The example of vaccination, Heal. Psychol., 26, 136–145, https://doi.org/10.1037/0278-6133.26.2.136, 2007.
Bronfman, N. C., Cisternas, P. C., López-Vázquez, E., and Cifuentes, L. A.: Trust and risk perception of natural hazards: implications for risk preparedness in Chile, Nat. Hazards, 81, 307–327, https://doi.org/10.1007/s11069-015-2080-4, 2016.
Bronfman, N. C., Cisternas, P. C., Repetto, P. B., Castañeda, J. V., and Guic, E.: Understanding the Relationship Between Direct Experience and Risk Perception of Natural Hazards, Risk Anal., 40, 2057–2070, https://doi.org/10.1111/risa.13526, 2020.
Brown, S. K., Loughlin, S. C., Sparks, R. S. J., Vye-Brown, C., Barclay, J., Calder, E., Cottrell, E., Jolly, G., Komorowski, J. C., Mandeville, C., Newhall, C., Palma, J., Potter, S., and Valentine, G.: Global volcanic hazard and risk, Cambridge University press, 81–172, https://doi.org/10.1017/CBO9781316276273.004, 2015.
Brown, S. K., Jenkins, S. F., Sparks, R. S. J., Odbert, H., and Auker, M. R.: Volcanic fatalities database: analysis of volcanic threat with distance and victim classification, J. Appl. Volcanol., 6 15, https://doi.org/10.1186/s13617-017-0067-4, 2017.
Bubeck, P., Botzen, W. J. W., and Aerts, J. C. J. H.: A Review of Risk Perceptions and Other Factors that Influence Flood Mitigation Behavior, Risk Anal., 32, 1481–1495, https://doi.org/10.1111/j.1539-6924.2011.01783.x, 2012.
Büscher, K., Fellow, R., Vlassenroot, K., and Coordinator, C.: Humanitarian presence and urban development: new opportunities and contrasts in Goma, DRC, Disasters, 34, S256–S273, https://doi.org/10.1111/j.1467-7717.2010.01157.x, 2010.
Capra, L., Gavilanes-Ruiz, J. C., Bonasia, R., Saucedo-Giron, R., and Sulpizio, R.: Re-assessing volcanic hazard zonation of Volcán de Colima, México, Nat. Hazards, 76, 41–61, https://doi.org/10.1007/s11069-014-1480-1, 2015.
Carlino, S., Somma, R., and Mayberry, G. C.: Volcanic risk perception of young people in the urban areas of Vesuvius: Comparisons with other volcanic areas and implications for emergency management, J. Volcanol. Geotherm. Res., 172, 229–243, https://doi.org/10.1016/j.jvolgeores.2007.12.010, 2008.
Chauvin, B.: Individual Differences in the Judgment of Risks: Sociodemographic Characteristics, Cultural Orientation, and Level of Expertise, in: Psychological Perspectives on Risk and Risk Analysis Theory, Models, and Applications, edited by: Raue, M., Streicher, E. L., and Streicher, B., Springer International Publishing, Cham, 37–80, https://doi.org/10.1007/978-3-319-92478-6_4, 2018.
Chester, D. K., Duncan, A. M., and Dibben, C. J. L.: The importance of religion in shaping volcanic risk perception in Italy, with special reference to Vesuvius and Etna, J. Volcanol. Geotherm. Res., 172, 216–228, https://doi.org/10.1016/j.jvolgeores.2007.12.009, 2008.
De la Cruz-Reyna, S. and Tilling, R. I.: Scientific and public responses to the ongoing volcanic crisis at Popocatépetl Volcano, Mexico: Importance of an effective hazards-warning system, J. Volcanol. Geotherm. Res., 170, 121–134, https://doi.org/10.1016/j.jvolgeores.2007.09.002, 2008.
Delhaye, L. and Smets, B.: Time-Series in Structure-from-Motion Photogrammetry: Testing Co-Registration Approaches for Topographic Change Analysis, in: IGARSS 2021 – 2021 IEEE International Geoscience and Remote Sensing Symposium, 11–16 July 2021, Brussels, Belgium, IGARSS, https://doi.org/10.1109/IGARSS47720.2021.9553796, 2021.
Dieckmann, N. F., Gregory, R., Satterfield, T., Mayorga, M., and Slovic, P.: Characterizing public perceptions of social and cultural impacts in policy decisions, P. Natl. Acad. Sci. USA, 118, e2020491118, https://doi.org/10.1073/pnas.2020491118, 2021.
Donovan, A.: Critical volcanology? Thinking holistically about risk and uncertainty, Bull. Volcanol., 81, 1–20, https://doi.org/10.1007/s00445-019-1279-8, 2019.
Donovan, A. and Oppenheimer, C.: Science, policy and place in volcanic disasters: Insights from Montserrat, Environ. Sci. Policy, 39, 150–161, https://doi.org/10.1016/j.envsci.2013.08.009, 2014.
Donovan, A., Eiser, J. R., and Sparks, R. S. J.: Expert opinion and probabilistic volcanic risk assessment, J. Risk Res., 20, 693–710, https://doi.org/10.1080/13669877.2015.1115425, 2017.
Donovan, A., Ayala, I. A., Eiser, J. R., and Sparks, R. S. J.: Risk perception at a persistently active volcano: warnings and trust at Popocatépetl volcano in Mexico, 2012–2014, Bull. Volcanol., 80, 2012–2014, https://doi.org/10.1007/s00445-018-1218-0, 2018.
Donovan, K.: Doing social volcanology: Exploring volcanic culture in Indonesia, Area, 42, 117–126, https://doi.org/10.1111/j.1475-4762.2009.00899.x, 2010.
Douglas, M. and Wildavsky, A.: How Can We Know the Risks We Face? Why Risk Selection Is a Social Process, Risk Anal., 2, 49–58, https://doi.org/10.1111/j.1539-6924.1982.tb01365.x, 1982.
Favalli, M., Chirico, G. D., Papale, P., Pareschi, M. T., Coltelli, M., Lucaya, N., and Boschi, E.: Computer simulations of lava flow paths in the town of Goma, Nyiragongo volcano, Democratic Republic of Congo, J. Geophys. Res.-Sol. Ea., 111, 1–13, https://doi.org/10.1029/2004JB003527, 2006.
Favalli, M., Chirico, G. D., Papale, P., Pareschi, M. T., and Boschi, E.: Lava flow hazard at Nyiragongo volcano, D.R.C. 1. Model calibration and hazard mapping, Bull. Volcanol., 71, 363–374, https://doi.org/10.1007/s00445-008-0233-y, 2009.
Favereau, M., Robledo, L. F., and Bull, M. T.: Erratum: Analysis of risk assessment factors of individuals in volcanic hazards: Review of the last decade, J. Volcanol. Geotherm. Res., 365, 57–64, https://doi.org/10.1016/j.jvolgeores.2018.10.009, 2018.
Fischhoff, B., Slovic, P., Lichtenstein, S., Read, S., and Combs, B.: How safe is safe enough? A psychometric study of attitudes toward technological risks and benefits, Policy Sci., 9, 127–152, https://doi.org/10.1007/BF00143739, 1978.
Floyd, D. L., Prentice-Dunn, S., and Rogers, R. W.: A Meta-Analysis or research on Protection Motivation Theory, J. Appl. Soc. Psychol., 30, 407–429, 2000.
Gaillard, J. C. and Dibben, C. J. L.: Volcanic risk perception and beyond, J. Volcanol. Geotherm. Res., 172, 163–169, https://doi.org/10.1016/j.jvolgeores.2007.12.015, 2007.
Gaillard, J. C. and Mercer, J.: From knowledge to action: Bridging gaps in disaster risk reduction, Prog. Hum. Geogr., 37, 93–114, https://doi.org/10.1177/0309132512446717, 2013.
Gaillard, J. C. and Texier, P.: Religions, natural hazards, and disasters: An introduction, Religion, 40, 81–84, https://doi.org/10.1016/j.religion.2009.12.001, 2010.
Hall, T. E. and Slothower, M.: Cognitive Factors Affecting Homeowners' Reactions to Defensible Space in the Oregon Coast Range, Soc. Nat. Resour. An Int. J., 22, 95–110, https://doi.org/10.1080/08941920802392187, 2009.
Han, H.: Consumer behavior and environmental sustainability in tourism and hospitality: a review of theories, concepts, and latest research, J. Sustain. Tour., 29, 1021–1042, https://doi.org/10.1080/09669582.2021.1903019, 2021.
Harpe, S. E.: How to analyze Likert and other rating scale data, Curr. Pharm. Teach. Learn., 7, 836–850, https://doi.org/10.1016/j.cptl.2015.08.001, 2015.
Haynes, K., Barclay, J., and Pidgeon, N.: Whose reality counts? Factors affecting the perception of volcanic risk, J. Volcanol. Geotherm. Res., 172, 259–272, https://doi.org/10.1016/j.jvolgeores.2007.12.012, 2008.
Heitz, C., Spaeter, S., Auzet, A., and Glatron, S.: Local stakeholders' perception of muddy flood risk and implications for management approaches: A case study in Alsace (France), Land Use Policy, 26, 443–451, https://doi.org/10.1016/j.landusepol.2008.05.008, 2009.
Henrich, J., Heine, S. J., and Norenzayan, A.: The weirdest people in the world?, Behav. Brain Sci., 33, 61–83, https://doi.org/10.1017/S0140525X0999152X, 2010.
INS: Rapport démographique de la ville de Goma: année 2020, Goma, Institut National de Statistiques, https://www.ins-nordkivu.org/index.php, last access: 20 March 2021.
Kervyn, M., Barrette, F., Poppe, S., Smets, B., Syavulisembo, A. M., Makundi, J. K., Kahashi, Y. N., Mossoux, S., Kervyn, F., and Michellier, C.: Assessing lava flow susceptibility at neighbouring volcanoes: Nyamulagira and Nyiragongo volcanoes, Journal of Applied Volcanology, submitted, 2022.
Khan, S. U., Qureshi, M. I., Rana, I. A., and Maqsoom, A.: An empirical relationship between seismic risk perception and physical vulnerability: A case study of Malakand, Pakistan, Int. J. Disast. Risk Reduct., 41, 101317, https://doi.org/10.1016/j.ijdrr.2019.101317, 2019.
Knoll, L. J., Leung, J. T., Foulkes, L., and Blakemore, S. J.: Age-related differences in social influence on risk perception depend on the direction of influence, J. Adolesc., 60, 53–63, https://doi.org/10.1016/j.adolescence.2017.07.002, 2017.
Komorowski, J.-C., Tedesco, D., Kasereka, M., Allard, P., Papale, P., Vaselli, O., Durieux, J., Baxter, P., Halbwachs, M., Akumbe, M., Baluku, B., Briole, P., Ciraba, M., Dupin, J.-C., Etoy, O., Garcin, D., Hamaguchi, H., Houlié, N., Kavotha, K.S Lemarchand, A Lockwood, J., Lukaya, N., Mavonga, G., de Michele, M., Mpore, S., Mukambilwa, K Munyololo, F., Newhall, C., Ruch, J., Yalire, M., and Wafula, M.: The January 2002 flank eruption of Nyiragongo volcano (Democratic Republic of Congo): chronology, evidence for a tectonic rift trigger, and impact of lava flows on the city of Goma, Acta Vulcanol., 14, 27–62, 2002.
Kothe, E. J., Ling, M., North, M., Klas, A., Mullan, B. A., and Novoradovskaya, L.: Protection motivation theory and pro-environmental behaviour: A systematic mapping review, Aust. J. Psychol., 71, 411–432, https://doi.org/10.1111/ajpy.12271, 2019.
Krejcie, R. V. and Morgan, D. W.: Determining Sample Size for Research Activities, Educ. Psychol. Meas., 30, 607–610, 1970.
Lechowska, E.: Approaches in research on flood risk perception and their importance in flood risk management: a review, Nat. Hazards, 111, 2343–2378, https://doi.org/10.1007/s11069-021-05140-7, 2022.
Lemée, C., Fleury-Bahi, G., and Navarro, O.: Impact of place identity, self-efficacy and anxiety state on the relationship between coastal flooding risk perception and the willingness to cope, Front. Psychol., 10, 1–11, https://doi.org/10.3389/fpsyg.2019.00499, 2019.
Lindell, M. K. and Perry, R. W.: Household adjustment to earthquake hazard: A Review of Research, Environ. Behav., 32, 461–501, 2000.
Lindell, M. K. and Perry, R. W.: The Protective Action Decision Model: Theoretical Modifications and Additional Evidence, Risk Anal., 32, 616–632, https://doi.org/10.1111/j.1539-6924.2011.01647.x, 2012.
López-Fletes, C. A., van Loenhout, J. A. F., and Kervyn, M.: Risk Perception and Implementation of Mitigation Measures By Populations Living Near Volcán De Colima, Mexico, Hum. Ecol., 50, 435–446, https://doi.org/10.1007/s10745-021-00304-2, 2022.
Maddux, J. E. and Rogers, R. W.: Protection motivation and self-efficacy: A revised theory of fear appeals and attitude change, J. Exp. Soc. Psychol., 19, 469–479, https://doi.org/10.1016/0022-1031(83)90023-9, 1983.
Mafuko Nyandwi, B.: Risk perception among Goma population before the 2021 Nyiragongo eruption, Zenodo [data set], https://doi.org/10.5281/zenodo.7638998, 2023.
Martin, B.: The sociology of the fluoridation controversy: A Reexamination, Sociol. Q., 30, 59–76, https://doi.org/10.1111/j.1533-8525.1989.tb01511.x, 1989.
Merlhiot, G., Mermillod, M., Le Pennec, J. L., Hidalgo, S., and Mondillon, L.: Reducing uncertainty to promote appropriate decisions when facing hazardous phenomena at an active volcano, J. Appl. Soc. Psychol., 48, 227–234, https://doi.org/10.1111/jasp.12507, 2018.
Mertens, K., Jacobs, L., Maes, J., Poesen, J., Kervyn, M., and Vranken, L.: Disaster risk reduction among households exposed to landslide hazard, A crucial role for self-efficacy?, Land Use Policy, 75, 77–91, 2018.
Miceli, R., Sotgiu, I., and Settanni, M.: Disaster preparedness and perception of flood risk: A study in an alpine valley in Italy, J. Environ. Psychol., 28, 164–173, https://doi.org/10.1016/j.jenvp.2007.10.006, 2008.
Michellier, C., Pigeon, P., Kervyn, F., and Wolff, E.: Contextualizing vulnerability assessment: a support to geo-risk management in central Africa, Nat. Hazards, 82, 27–42, https://doi.org/10.1007/s11069-016-2295-z, 2016.
Michellier, C., Kervyn, M., Barette, F., Muhindo Syavulisembo, A., Kimanuka, C., Kulimushi Mataboro, S., Hage, F., Wolff, E., and Kervyn, F.: Evaluating population vulnerability to volcanic risk in a data scarcity context: The case of Goma city, Virunga volcanic province (DRCongo), Int. J. Disast. Risk Reduct., 45, 101460, https://doi.org/10.1016/j.ijdrr.2019.101460, 2020.
Mileti, D. S. and O'Brien, P. W.: Warnings during Disaster: Normalizing Communicated Risk, Soc. Probl., 39, 40–57, https://doi.org/10.2307/3096912, 1992.
Milne, S., Sheeran, P., and Orbell, S.: Prediction and intervention in health-related behavior: A meta-analytic review of protection motivation theory, J. Appl. Soc. Psychol., 30, 106–143, https://doi.org/10.1111/j.1559-1816.2000.tb02308.x, 2000.
Muhindo Syavulisembo, A.: La Variation Spatio-Temporelle de la Population et L'Analyse De L'Accessibilité à ses Ressources Vitales: Vers une meilleure gestion du risque volcanique à Goma, République démocratique du Congo, unpublished doctoral dissertation, Université libre de Bruxelles, Faculté des Sciences – I.G.E.A.T., Bruxelles, http://hdl.handle.net/2013/ULB-DIPOT:oai:dipot.ulb.ac.be:2013/297715 (last access: 24 July 2022), 2019.
Njome, M. S., Suh, C. E., Chuyong, G., and de Wit, M. J.: Volcanic risk perception in rural communities along the slopes of mount Cameroon, West-Central Africa, J. Afr. Earth Sci., 58, 608–622, https://doi.org/10.1016/j.jafrearsci.2010.08.007, 2010.
Oldenburg, S.: Maisha ni kuvumiliya–patrimonialism, progress and the ambiguities of waiting in Goma, DR Congo, Crit. African Stud., 12, 37–51, https://doi.org/10.1080/21681392.2019.1697314, 2020.
Oth, A., Barrière, J., D'Oreye, N., Mavonga, G., Subira, J., Mashagiro, N., Kadufu, B., Fiama, S., Celli, G., De Dieu Bigirande, J., Ntenge, A. J., Habonimana, L., Bakundukize, C., and Kervyn, F.: KivuSNet: The first dense broadband seismic network for the Kivu Rift Region (Western Branch of East African Rift), Seismol. Res. Lett., 88, 49–60, https://doi.org/10.1785/0220160147, 2017.
Paton, D.: Disaster Resilient Communities: Developing and testing an all-hazards theory, J. Integr. Disaster Risk Manag., 3, 1–17, https://doi.org/10.5595/idrim.2013.0050, 2013.
Paton, D., Johnston, D., Bebbington, M. S., Lai, C. D., and Houghton, B. F.: Direct and vicarious experience of volcanic hazards: Implications for risk perception and adjustment adoption, Aust. J. Emerg. Manag., 15, 58–63, 2000.
Paton, D., Smith, L., Daly, M., and Johnston, D.: Risk perception and volcanic hazard mitigation: Individual and social perspectives, J. Volcanol. Geotherm. Res., 172, 179–188, https://doi.org/10.1016/j.jvolgeores.2007.12.026, 2008.
Pech, L., Büscher, K., and Lakes, T.: Intraurban development in a city under protracted armed conflict: Patterns and actors in Goma, DR Congo, Polit. Geogr., 66, 98–112, https://doi.org/10.1016/j.polgeo.2018.08.006, 2018.
Perry, R. W. and Lindell, M. K.: Volcanic risk perception and adjustment in a multi-hazard environment, J. Volcanol. Geotherm. Res., 172, 170–178, https://doi.org/10.1016/j.jvolgeores.2007.12.006, 2008.
Plattner, Th., Plapp, T., and Hebel, B.: Integrating public risk perception into formal natural hazard risk assessment, Nat. Hazards Earth Syst. Sci., 6, 471–483, https://doi.org/10.5194/nhess-6-471-2006, 2006.
Poppe, S., Smets, B., Albino, F., Kervyn, F., and Kervyn, M.: A new volcano-structural map of the Virunga Volcanic Province, D. R. Congo and Rwanda, EGU General Assembly 2013, 7–12 April 2023, Vienna, Austria, Geophys. Res. Abstr., 15, EGU2013-7131, 2013.
Pouclet, A. and Bram, K.: Nyiragongo and Nyamuragira: a review of volcanic activity in the Kivu rift, western branch of the East African Rift System, Bull. Volcanol., 83, 10, https://doi.org/10.1007/s00445-021-01435-6, 2021.
Quinn, T., Bousquet, F., and Guerbois, C.: Changing places: The role of sense of place in perceptions of social, environmental and overdevelopment risks, Glob. Environ. Chang., 57, 101930, https://doi.org/10.1016/j.gloenvcha.2019.101930, 2019.
Rainear, A. M. and Christensen, J. L.: Protection Motivation Theory as an Explanatory Framework for Proenvironmental Behavioral Intentions, Commun. Res. Reports, 34, 239–248, https://doi.org/10.1080/08824096.2017.1286472, 2017.
Ricci, T., Barberi, F., Davis, M. S., Isaia, R., and Nave, R.: Volcanic risk perception in the Campi Flegrei area, J. Volcanol. Geotherm. Res., 254, 118–130, https://doi.org/10.1016/j.jvolgeores.2013.01.002, 2013.
Rogers, R. W.: A Protection Motivation Theory of Fear Appeals and Attitude Change1, J. Psychol., 91, 93–114, https://doi.org/10.1080/00223980.1975.9915803, 1975.
Schmid, M., Tietze, K., Halbwachs, M., Lorke, A., McGinnis, D. F., and Wüest, A.: How hazardous is the gas accumulation in Lake Kivu? Arguments for a risk assesment in light of the Nyiragongo volcano eruption of 2002, Acta Vulcanol., 14/15, 115–122, 2002.
Siegrist, M., Gutscher, H., and Earle, T. C.: Perception of risk: The influence of general trust, and general confidence, J. Risk Res., 8, 145–156, https://doi.org/10.1080/1366987032000105315, 2005.
Sim, T., Hung, L. S., Su, G. W., and Cui, K.: Interpersonal communication sources and natural hazard risk perception: a case study of a rural Chinese village, Nat. Hazards, 94, 1307–1326, https://doi.org/10.1007/s11069-018-3478-6, 2018.
Sjöberg, L.: Risk Perception is not what it seems: the Psychometric Paradigm Revisited (NEI-SE–437), edited by: Andersson, K., INIS Volume: 35, INIS Issue: 04, Reference Number: 35009763, Sweden, 2003.
Slovic, P.: Risk Perception, Risk Manag., 11, 15–16, https://doi.org/10.1111/j.1539-6924.1991.tb00559.x, 1991.
Slovic, P.: Perception of Risk, Science, 236, 280–285, https://doi.org/10.1126/science.3563507, 2000.
Slovic, P. and Weber, E. U.: Perception of Risk Posed by Extreme Events, in: Regulation of Toxic Substances and Hazardous Waste, 2nd edn., edited by: Applegate, E., Gabba, S., Laitos, J. G., and Sachs, N. J., Foundation Press, https://ssrn.com/abstract=2293086 (last access: 6 May 2022), 2013.
Slovic, P., Fischhoff, B., and Lichtenstein, S.: The Psychometric Study of Risk Perception, Risk Eval. Manag., 1, 3–24, https://doi.org/10.1007/978-1-4613-2103-3_1, 1986.
Slovic, P., Finucane, M. L., Peters, E., and MacGregor, D. G.: Risk as analysis and risk as feelings: Some thoughts about affect, reason, risk and rationality, in: The feeling of risk, Routledge, 21–36, 2013.
Smets, B., Tedesco, D., Kervyn, F., Kies, A., Vaselli, O., and Yalire, M. M.: Dry gas vents (“mazuku”) in Goma region (North-Kivu, Democratic Republic of Congo): Formation and risk assessment, J. Afr. Earth Sci., 58, 787–798, https://doi.org/10.1016/j.jafrearsci.2010.04.008, 2010.
Smets, B., Delvaux, D., Ross, K. A., Poppe, S., Kervyn, M., D'Oreye, N., Kervyn, F., Wauthier, C., Cayol, V., Smets, B., D'Oreye, N., and Kervyn, F.: Magma pathways and their interactions inferred from InSAR and stress modeling at Nyamulagira Volcano, D.R. Congo, 683, 15179–15202, https://doi.org/10.1016/j.tecto.2016.06.022, 2015a.
Smets, B., Kervyn, M., d'Oreye, N., and Kervyn, F.: Spatio-temporal dynamics of eruptions in a youthful extensional setting: Insights from Nyamulagira Volcano (D.R. Congo), in the western branch of the East African Rift, Earth-Sci. Rev., 150, 305–328, https://doi.org/10.1016/j.earscirev.2015.08.008, 2015b.
Smets, B., Michellier, C., Syavulisembo, A. M., Munganea, G., d'Oreye, N., and Kervyn, F.: Very high-resolution imaging of the city of goma (North Kivu, DR Congo) using SFM-MVS photogrammetry, in: IGARSS 2018 – 2018 IEEE International Geoscience and Remote Sensing Symposium, 22–27 July 2018, Valencia, Spain, IEEE, 3370–3373, https://doi.org/10.1109/IGARSS.2018.8517412, 2018.
Smittarello, D., Smets, B., Barrière, J., Michellier, C., Oth, A., Shreve, T., Grandin, R., Theys, N., Brenot, H., Cayol, V., Allard, P., Caudron, C., Chevrel, O., Darchambeau, F., de Buyl, P., Delhaye, L., Derauw, D., Ganci, G., Geirsson, H., Kamate Kaleghetso, E., Kambale Makundi, J., Kambale Nguomoja, I., Kasereka Mahinda, C., Kervyn, M., Kimanuka Ruriho, C., Le Mével, H., Molendijk, S., Namur, O., Poppe, S., Schmid, M., Subira, J., Wauthier, C., Yalire, M., D'Oreye, N., Kervyn, F., and Syavulisembo Muhindo, A.: Precursor-free eruption triggered by edifice rupture at Nyiragongo volcano, Nature, 609, 83–88, https://doi.org/10.1038/s41586-022-05047-8, 2022.
Sommestad, T., Karlzén, H., and Hallberg, J.: A meta-Analysis of studies on protection motivation theory and information security behaviour, Int. J. Inf. Secur. Priv., 9, 26–46, https://doi.org/10.4018/IJISP.2015010102, 2015.
Syavulisembo, A. M., Havenith, H.-B., Smets, B., d'Oreye, N., and Marti, J.: Preliminary assessment for the use of VORIS as a tool for rapid lava flow simulation at Goma Volcano Observatory, Democratic Republic of the Congo, Nat. Hazards Earth Syst. Sci., 15, 2391–2400, https://doi.org/10.5194/nhess-15-2391-2015, 2015.
Syavulisembo, A. M., Kervyn, F., Moritz, L., Eléonore, W., and Michellier, C.: Spatio-temporal location of population: Strengthening the capacities of sudden hazards risk management in Goma, DRC, Int. J. Disast. Risk Reduct., 66, 102565, https://doi.org/10.1016/j.ijdrr.2021.102565, 2021.
Tazieff, H.: An exceptional eruption: Mt. Niragongo, Jan. 10th, 1977, Bull. Volcanol., 40, 189–200, https://doi.org/10.1007/BF02596999, 1977.
Tsang, S. W. R. and Lindsay, J. M.: Lava flow crises in inhabited areas part I: Lessons learned and research gaps related to effusive, basaltic eruptions, J. Appl. Volcanol., 9, 1–26, https://doi.org/10.1186/s13617-020-00096-y, 2020.
Useche, S. A., Alonso, F., Montoro, L., and Tomas, J. M.: When age means safety: Data to assess trends and differences on rule knowledge, risk perception, aberrant and positive road behaviors, and traffic crashes of cyclists, Data Br., 22, 627–634, https://doi.org/10.1016/j.dib.2018.12.066, 2019.
Van Praag, L., Lietaer, S., and Michellier, C.: A Qualitative Study on How Perceptions of Environmental Changes are Linked to Migration in Morocco, Senegal, and DR Congo, Hum. Ecol., 50, 347–361, https://doi.org/10.1007/s10745-021-00278-1, 2021.
Vinnell, L. J., Milfont, T. L., and McClure, J.: Why do people prepare for natural hazards? Developing and testing a Theory of Planned Behaviour approach, Curr. Res. Ecol. Soc. Psychol., 2, 100011, https://doi.org/10.1016/j.cresp.2021.100011, 2021.
Vlassenroot, K. and Büscher, K.: The border city of Goma: zone of contestation or laboratory of change?, in: Urban international conference poverty in medium and small cities of developing countries, 26–28 October 2009, Brussels, Belgium, Koninklijke academie voor overzeese wetenschappen, Brussels, Belgium, 161–178, http://hdl.handle.net/1854/LU-2090440 (last access: 2 March 2023), 2011.
Vlassenroot, K. and Büscher, K.: Borderlands, Identity and Urban Development: The Case of Goma (Democratic Republic of the Congo), Urban Stud., 50, 3168–3184, https://doi.org/10.1177/0042098013487772, 2013.
Wachinger, G., Renn, O., Domènech, L., Jakobson, I., Kuhlicke, C., Lemkow, L., Pellizzoni, L., Piriz, A., Saurí, D., Scolobig, A., Steinführer, A., Supramaniam, M., Whittle, R., Bianchizza, C., Coates, T., Marchi, B. De, Jakobson, I., Kuhlicke, C., Pellizzoni, L., Piriz, A., Saurí, D., Steinführer, A., and Supramaniam, M.: Risk Perception and Natural Hazards, CapHaz-Net WP3 Report, DIALOGIK Non-Profit Institute for Communication and Cooperative Research, Stuttgart, http://caphaz-net.org/outcomes-results/CapHaz-Net_WP3_Risk-Perception.pdf (last access: 23 January 2021), 2010.
Wachinger, G., Renn, O., Begg, C., and Kuhlicke, C.: The risk perception paradox-implications for governance and communication of natural hazards, Risk Anal., 33, 1049–1065, https://doi.org/10.1111/j.1539-6924.2012.01942.x, 2013.
Wauthier, C., Cayol, V., Kervyn, F., and D'Oreye, N.: Magma sources involved in the 2002 Nyiragongo eruption, as inferred from an InSAR analysis, J. Geophys. Res.-Sol. Ea., 117, 1–20, https://doi.org/10.1029/2011JB008257, 2012.
Wisner, B.: “Build back better”? The challenge of Goma and beyond, Int. J. Disast. Risk Reduct., 26, 101–105, https://doi.org/10.1016/j.ijdrr.2017.09.027, 2017.
Wu, Z. and Zhong, S.: Individualism-Collectivism and Risk Perception Around the World, SSRN., https://doi.org/10.2139/ssrn.4129159, 2022.