the Creative Commons Attribution 4.0 License.
the Creative Commons Attribution 4.0 License.
 | 22 Feb 2023
Investigation of an extreme rainfall event during 8–12 December 2018 over central Vietnam – Part 1: Analysis and cloud-resolving simulation
Chung-Chieh Wang
Duc Van Nguyen
An extreme rainfall event occurred from 8 to 12 December 2018 along the coast of central Vietnam. The observed maximum rainfall amount in 72 h was over 900 mm and set a new record, and the associated heavy losses were also significant. The analysis of this event shows some key factors for its occurrence: (1) the interaction between the strong northeasterly winds, blowing from the Yellow Sea into the northern South China Sea (SCS), and easterly winds over the SCS in the lower troposphere (below 700 hPa). This interaction created strong low-level convergence, as the winds continued to blow into central Vietnam against the Truong Son Range, resulting in forced uplift over the coastal plains due to the terrain's barrier effect. Furthermore, the low-level convergence in this event was strong enough, and the air was unstable enough to trigger most of the convection near the shoreline (further inland). As a consequence, heavy rainfall occurred along the coastal zone and coastal sea. (2) The strong easterly wind played an important role in transporting moisture from the western North Pacific (WNP) across the Philippines and the SCS into central Vietnam. (3) The Truong Son Range also contributed to this event due to its barrier effect. (4) In addition to cumulonimbus, the low-level precipitating clouds such as nimbostratus clouds were also major contributors to rainfall accumulation for the whole event. The analyses of local thermodynamics also indicate that the southward movement of the low-level wind convergence zone caused the southward movement of the main heavy rain band during the event.
The cloud-resolving storm simulator (CReSS) was employed to simulate this record-breaking event at a grid size of 2.5 km; evaluated results show that the model simulated the surface wind well and captured the southward movement of the low-level wind convergence. The overall rainfall can be captured quite well, not only in quantity but also in its spatial distribution (with a similarity skill score (SSS) ≈0.7 and threat score (TS) >0 at 700 mm for 72 h rainfall). Thus, the CReSS model is shown to be a useful tool for both research and forecasts of heavy rainfall in Vietnam. The model performed better for the rainfall during 9–10 December 2018 but not as good on 11 December 2018. In the sensitivity test without the terrain, the model had poorly simulated the surface wind, which resulted in the model generating insufficient rainfall for this event and also not capturing the spatial distribution of the rainfall. Thus, the test confirms the important role played by the local topography for the occurrence of this event.
- Article
(12793 KB) - Full-text XML
- Companion paper
-
Supplement
(2478 KB) - BibTeX
- EndNote


Heavy to extreme rainfalls are natural disasters that often cause deaths, flooding, landslides, and erosion. Vietnam is one of the most disaster-prone countries in the world with many different types of natural disasters. In the country, central Vietnam is most affected by natural disasters and climate change, with frequent occurrences of rainstorms and extreme rainfalls. For example, during 8–12 December 2018, an extreme rainfall event (hereafter abbreviated as the D18 event) occurred along the coast of central Vietnam. The peak accumulated rainfall of 72 h (from 12:00 UTC on 8 December to 12:00 UTC on 11 December) exceeds 800 mm (Fig. 1d) at some stations . Among the stations, Da Nang (16.0∘ N, 108.2∘ E; see Fig. 1a, b) recorded 24 h rainfall amounts greater than 600 mm on 9 December and over 300 mm the next day. This extreme event resulted in 13 deaths, an estimated 1200 houses inundated, around 12 000 ha of crops destroyed, some 160 000 livestock killed, and many other economic losses (Tuoi Tre news, 2018). Furthermore, according to a publication by the Ministry of Natural Resources and Environment of Vietnam (Tran et al., 2016) regarding climate change and sea-level rise scenarios, extreme precipitation events will increase in both their frequency and intensity in the future. Hence, how to improve the ability in the quantitative precipitation forecast (QPF) of heavy rainfall events over central Vietnam is very important.
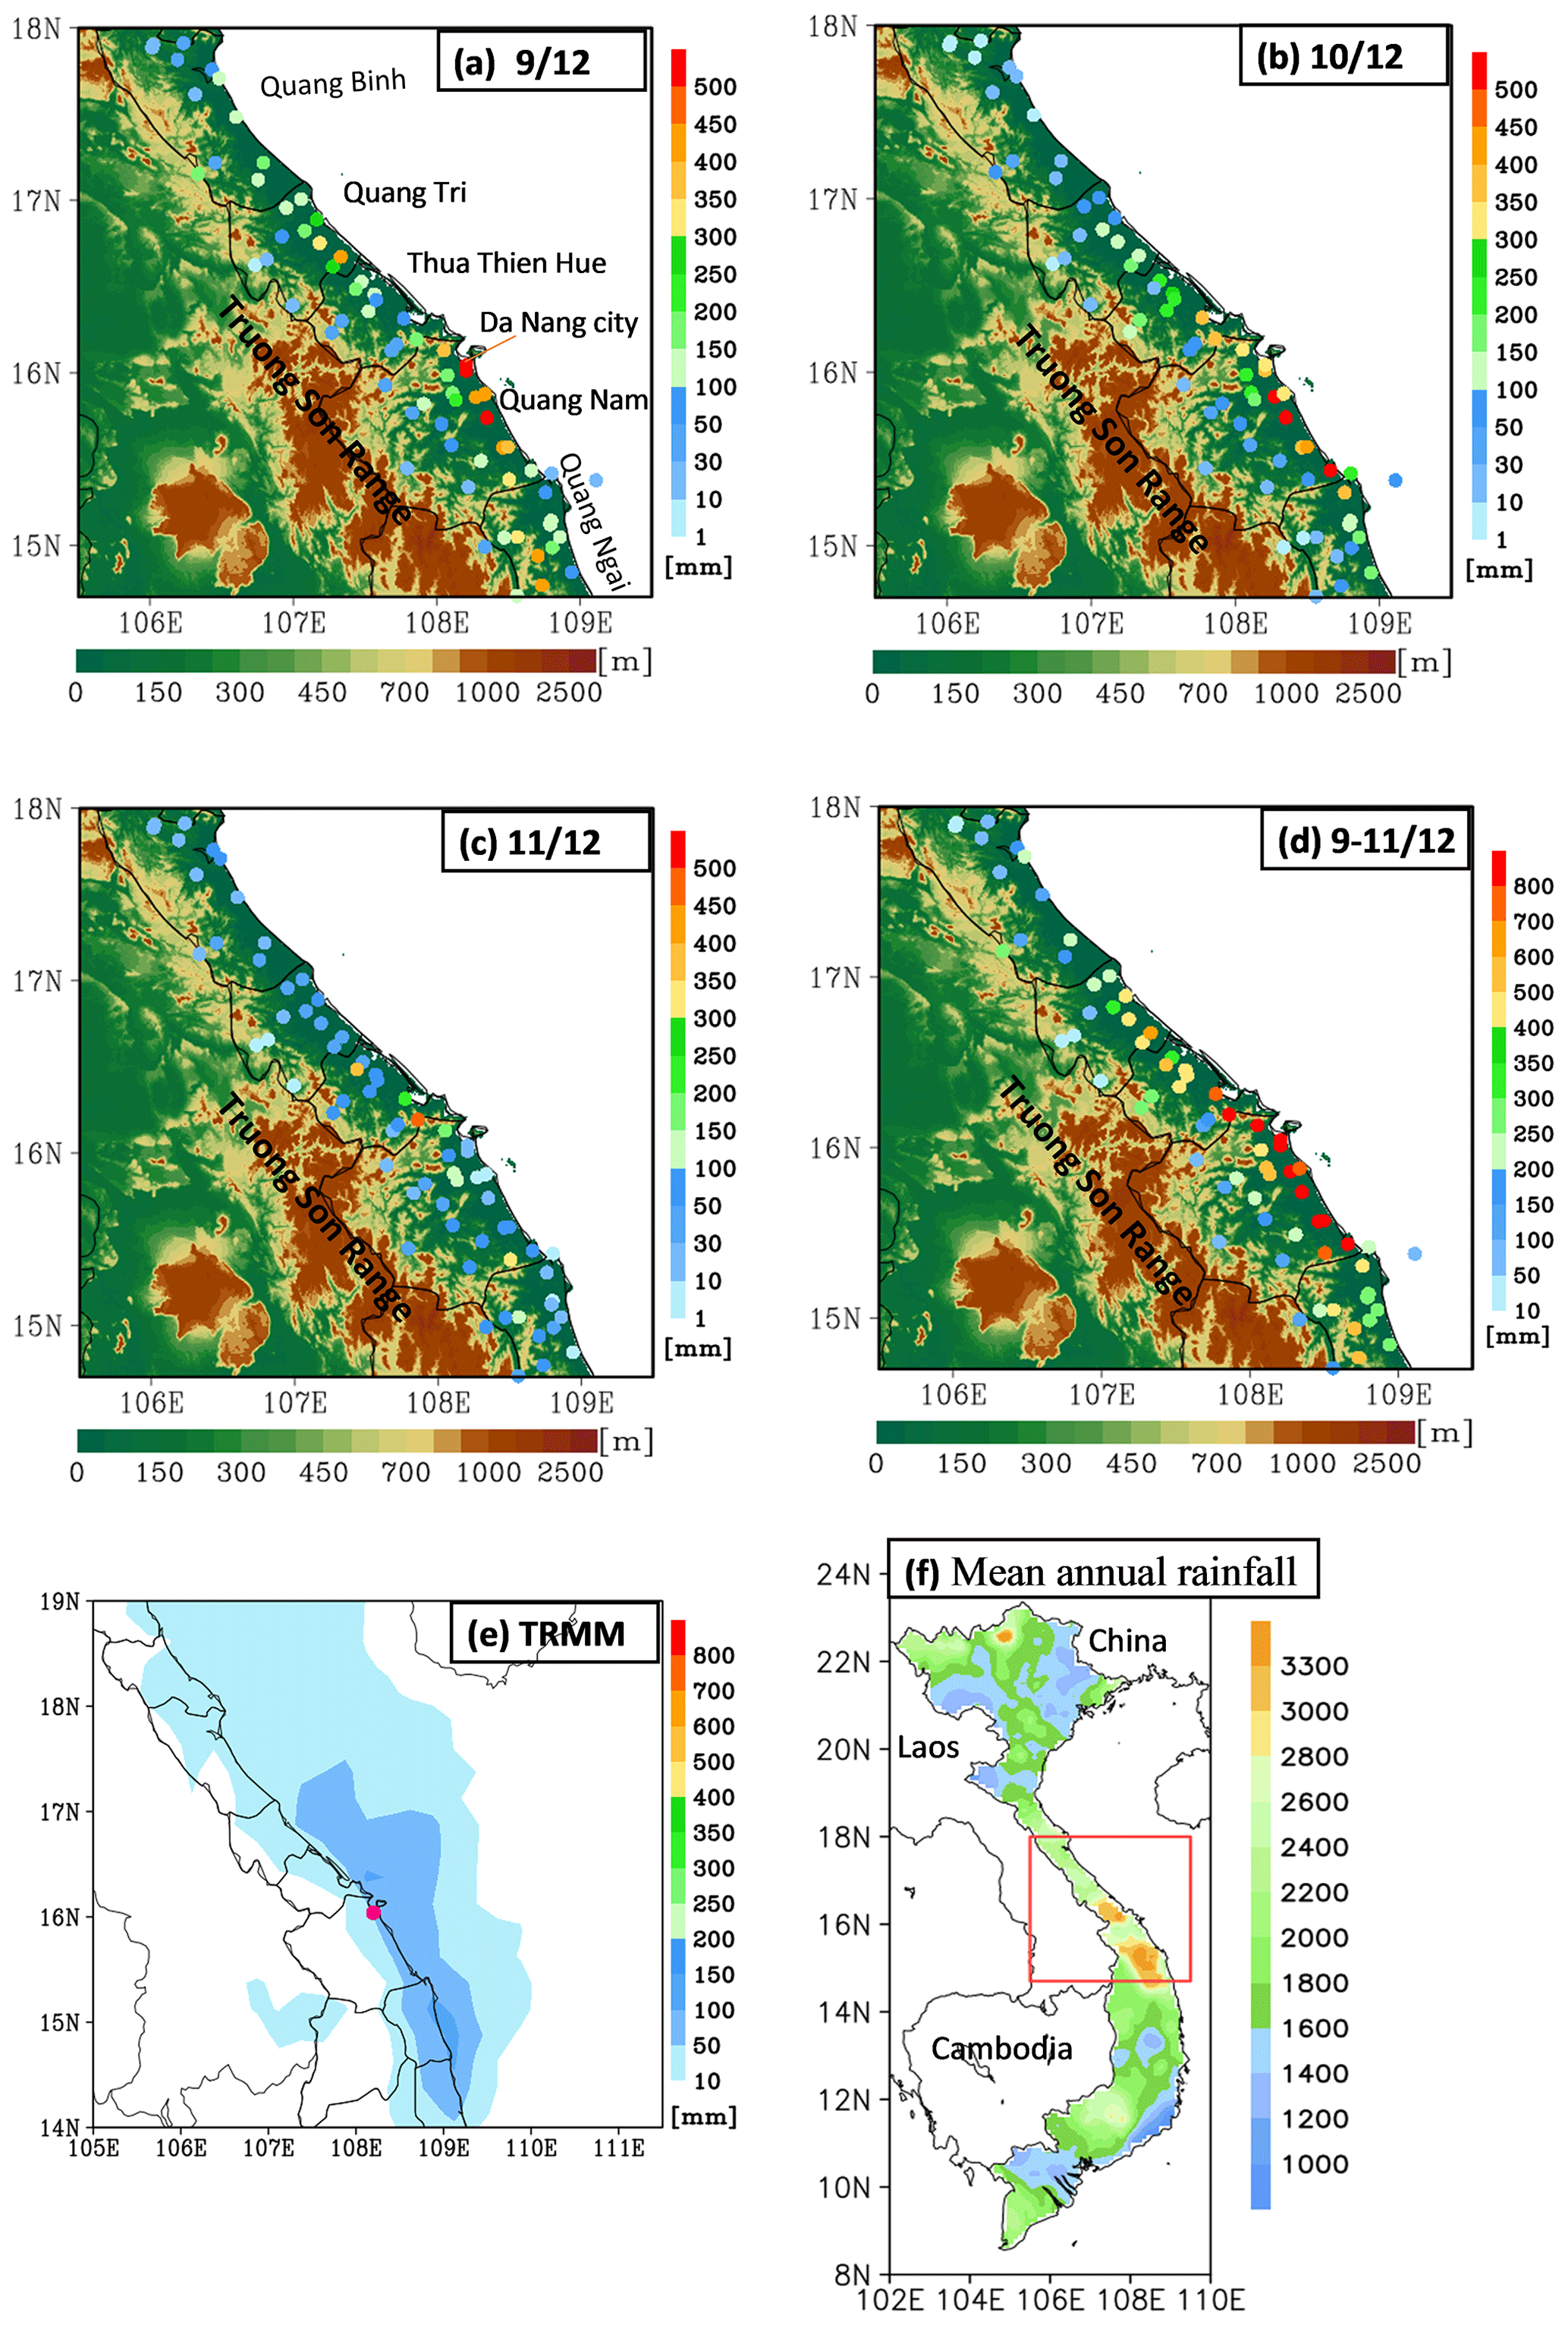
Figure 1(a) Observed 24 h accumulated rainfall (mm, color dots, 12:00–12:00 UTC) and topography (m, shaded) for 9 December. Vertical color bar for rainfall and horizontal color bar for topography. (b) As in panel (a), but for 10 December. (c) As in panel (a), but for 11 December. (d) As in panel (a), but for 72 h accumulated rainfall during 12:00 UTC on 8 December to 12:00 UTC on 11 December. (e) 72 h accumulated rainfall obtained by the Tropical Rainfall Measuring Mission (TRMM) estimate. The pink dot marks the location of Da Nang station. (f) Mean annual rainfall distribution (mm) in Vietnam from 1980 to 2010, obtained from the Vietnam Gridded Precipitation (VnGP) data, and the study area of central Vietnam (red box).
Climatologically, the central part of Vietnam is the country's rainiest region and is strongly affected by heavy to extreme rainfall, with average annual precipitation ranging from 2400 to over 3300 mm (1980–2010, Fig. 1f). The main rainy season in this region is from late fall to early winter (Yokoi and Matsumoto, 2008; Chen et al., 2012). Past studies have shown some main factors that can lead to heavy rainfall in central Vietnam, such as (1) the combined effect of cold surges that originate from northern China, (2) tropical depressions, and (3) local topography which is characterized by high mountains (<3000 m), highlands, narrow coastal plain with the narrowest place less than 100 km in width (east to west), and gradually lowers from the west to the east (Fig. 1a) (Bui, 2019; Yokoi and Matsumoto, 2008; Chen et al., 2012; Nguyen-Le and Matsumoto, 2016; van der Linden et al., 2016). According to these studies, a cool, dry continental surface high-pressure system (known as the Siberian high-pressure system) is gradually established over the continental East Asia after boreal summer in October–November. This high-pressure system's intensification and southeastward amplification lead to an episodic southward progression of cold surge into the tropics. The interaction of this cold surge and preexisting tropical disturbance over the South China Sea (SCS) and the topography in central Vietnam can bring large amounts of rainfall along the east-central coast through orographic rainfall processes.
In this study, central Vietnam is referred to as the area between 14.7 and 18∘ N (Fig. 2). Its eastern boundary is the South China Sea (SCS), and the western boundary is the border to Laos, where the Truong Son Range (also known as the Annamite Range) runs parallel to the coast. The central Vietnam includes Quang Binh, Quang Tri, Thua Thien Hue, Da Nang city, Quang Nam, and a part of Quang Ngai province. Most of the population and cities are concentrated along the coastal plain. By these characteristics of steep topography, when heavy rain occurs, it often leads to flooding and causes great damages to people and the environment.
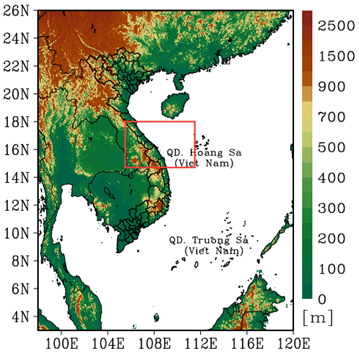
Figure 2The simulation domain of the CReSS model and topography (m) used in this study. The red box marks the study area.
Furthermore, according to Wang et al. (2017), Vietnam is impacted by about 4–6 typhoons per year. Nguyen-Thi et al. (2012) investigated the characteristic of the tropical cyclone rainfall over Vietnam in the climatology. Their results show that the tropical cyclone rainfall amount is concentrated in central Vietnam, peaking between October and November. Takahashi et al. (2009) performed a long-term simulation for September (from 1966 to 1995) using a high-resolution model. They found that the observed long-term decrease in September rainfall is due to the weakening of tropical cyclone activity over the Indochinese Peninsula. As for the impacts of El Niño–Southern Oscillation (ENSO), some studies have examined the linkages between rainfall in Vietnam and ENSO and suggested more (less) rainfall during La Niña (El Niño) years. For example, Yen et al. (2010) analyzed the interannual variation of the rainfall in fall over central Vietnam, and their results indicated a negatively correlated relationship between rainfall in central Vietnam and the sea surface temperature (SST) over the Niño 3.4 region. Besides, Vu et al. (2015) investigated the effects of ENSO on fall rainfall in central Vietnam and concluded that central Vietnam has more (less) rainfall in La Niña (El Niño) years. Finally, Wu et al. (2012) analyzed the Madden–Julian Oscillation (MJO) activity from September to November for 30 years (1981–2010) over Vietnam and showed that the MJO is also an important factor in the formation of extreme precipitation events in central Vietnam.
In recent decades, the cloud-resolving storm simulator (CReSS) has been widely known due to its good performance in QPFs. This model has been applied to study tropical cyclones, heavy to extreme rainfall events, and many other convective systems in Japan and Taiwan (e.g., Ohigashi and Tsuboki, 2007; Yamada et al., 2007; Akter and Tsuboki, 2010, 2012; Wang et al., 2015). Furthermore, the CReSS model has been used to perform routine high-resolution forecasts at the National Taiwan Normal University (NTNU) and provided a forecast member to the Taiwan Typhoon and Flood Research Institute (TTFRI) since 2010. Hence, this study employed the CReSS model to simulate the D18 event and evaluated its performance
From the review above, the important mechanisms for the heavy rainfall in some previous events over central Vietnam are revealed. However, according to Hoang Phuc Lam – National Center for Hydro-Meteorological Forecasting, it can be said that this extreme event has never happened in the past because the observed rainfall at some places in the central region has surpassed the record according to the statistics of rainfall at the end of the main rainy season (Communist Party of Vietnam Online Newspaper, 2018). Furthermore, Fig. 1a–e show that the main heavy rain band concentrated on the coastal plains and coastal sea while Fig. 1f shows that the annual mean rainfall extends into the mountain with their peak amounts over the mountain slopes. Several questions are therefore raised: What mechanisms caused this record-breaking event at such a magnitude? Was its mechanism similar to those in previous events, or was it a different one? How important was the role played by local terrain in this event? From a forecast perspective, one related question would be whether a cloud-resolving model (CRM) is capable of reproducing the D18 event? The answers to these questions will help to improve our understanding of the mechanisms that cause heavy rainfall in central Vietnam, as well as the predictability of such events in the future. Hence, the present study was carried out with an aim to answer the above questions. The remainder of this paper is organized as follows: Sect. 2 describes the datasets and methodology used in the study. The analysis and modeling results are presented in Sects. 3 and 4, respectively. Finally, the conclusions are given in Sect. 5.
2.1 Data
2.1.1 NCEP GDAS/FNL global gridded analyses and forecasts
The NCEP GDAS/FNL Global Gridded Analyses and Forecasts is provided freely by the National Centers for Environmental Prediction (NCEP). In this study, this dataset is used as the initial conditions (ICs) and boundary conditions (BCs) for the cloud-resolving model (CRM) simulation. The data are on a latitude–longitude grid with 26 levels extending from the surface to 20 hPa. The data period is from 06:00 UTC on 8 December to 00:00 UTC on 13 December 2018 at 6 h intervals. Parameters include geopotential height, zonal and meridional wind components, pressure, temperature, and relative humidity. The dataset and its detailed information are available at https://rda.ucar.edu/datasets/ds083.3 (last access: 25 October 2019).
2.1.2 The fifth generation ECMWF reanalysis data (ERA5)
The ERA5 is the fifth generation reanalysis dataset, developed by the European Centre for Medium-Range Weather Forecasts (ECMWF) to replace the ERA-Interim reanalysis. We have used these data to delineate the synoptic weather patterns during the D18 event. The horizontal resolution of this dataset is latitude–longitude at 22 selected levels from 1000 to 100 hPa and including the surface. Parameters include zonal and meridional wind components, geopotential height, specific humidity, relative humidity, temperature, vertical velocity, mean sea-level pressure, and sea surface temperature. The dataset was downloaded from 00:00 UTC on 8 December to 18:00 UTC on 11 December 2018 at 6 h intervals (Hersbach et al., 2018a, b).
2.1.3 Observation data
The daily observed rainfall data (12:00–12:00 UTC, i.e., 19:00–19:00 LST) from 8 to 12 December 2018 at 69 automated gauge stations across central Vietnam are used for case overview and verification of model results. This dataset is provided by the Mid-central Regional Hydro-Meteorological Center, Vietnam.
2.1.4 Satellite data
TRMM (TMPA) rainfall estimates
The Tropical Rainfall Measuring Mission (TRMM) multi-satellite precipitation estimates (3B42, version 7, Huffman et al., 2016) are freely provided by the NASA Goddard Earth Sciences (GES) Data and Information Services Center (DISC). The horizontal resolution of this dataset (level 3) is latitude–longitude and the time resolution is every 3 h. In this study, we used these satellite data to verify rainfall distribution over the coastal sea due to the limitation of the observation station network, we only have the observation stations inland, as shown in the Fig. 1d and e. This dataset was downloaded from 12:00 UTC on 8 December to 12:00 UTC on 11 December 2018 to analyze the D18 event.
The Himawari satellite images
The color-enhanced infrared imageries are designed mainly for the detection of convective clouds, including those from the Himawari-8 satellite. The different colors represent different cloud-top heights. Therefore, we have used these images to discern deep convection in convective clouds and precipitating clouds based on their characteristics. In this study, the dataset was downloaded from the Central Weather Bureau website, Taiwan, with a time resolution of 1 h.
2.1.5 Radar data
The column-maximum radar reflectivity data are an indispensable data source to identify precipitation and verify model results. The reflectivity data (in dBZ) cover a wide range and the values indicate rainfall intensity (the higher the dBZ, the stronger the intensity of precipitation). Therefore, we used the column-maximum radar reflectivity data over central Vietnam at 1 h intervals over 8–11 December 2018 to estimate the rainfall intensity during the D18 event. This dataset is provided by the Mid-central Regional Hydro-Meteorological Center of Vietnam.
2.1.6 The Vietnam gridded precipitation (VnGP) dataset
The Vietnam Gridded Precipitation (VnGP) data are derived based on the daily observed data from 481 rain gauges across Vietnam. This dataset has a resolution of 0.1∘ and covers the period of 1980–2010 (Nguyen-Xuan et al., 2016). In this study, this dataset is used to depict the rainfall climatology in Vietnam.
2.1.7 The Oceanic Niño index (ONI) data
The Oceanic Niño Index (ONI) data were made and provided freely by NOAA's Climate Prediction Center (CPC). The ONI data were computed by 3 month running mean of NOAA ERSST.V5 (Extended Reconstructed Sea Surface Temperature Dataset, version 5) SST anomalies in the Niño 3.4 region (5∘ N–5∘ S, 120–170∘ W), based on a changing base period which consists of multiple centered 30 year base periods. The ONI is the most commonly used index to define El Niño and La Niña events. This study used the ONI data for Niño 3.4 region to define the ENSO phase of 2018. These data are available at: https://psl.noaa.gov/data/correlation/oni.data (last access: 18 July 2022).
2.2 Model description and experiment setup
The CReSS (version 3.4.2), developed by Nagoya University, Japan (Tsuboki and Sakakibara, 2002, 2007) is used for numerical simulation of the D18 event. This model is a non-hydrostatic and compressible cloud model, designed for simulation of weather events at high (cloud-resolving) resolution. In the model, the cloud microphysics are treated explicitly at the user-selected degree of complexity, such as the bulk cold-rain scheme with six species: vapor, cloud water, cloud ice, rain, snow, and graupel (Lin et al., 1983; Cotton et al., 1986; Murakami, 1990; Murakami et al., 1994; Ikawa and Saito, 1991). Other subgrid-scale processes parameterized, such as turbulent mixing in the planetary boundary layer, as well as physical options for surface processes, including momentum and energy fluxes, short-wave and long-wave radiation are summarized in Table 1.
To study the D18 event and investigate the role played by the local terrain in this event using the CReSS model, two experiments were performed using the same model domain setting, physical options, and initial and boundary conditions. Specifically, both experiments used a single domain at 2.5 km horizontal grid spacing and a dimension of grid points (Table 1, see Fig. 2). As introduced in Sect. 2.1.1, the NCEP GDAS/FNL Global Gridded Analyses and Forecasts (, every 6 h, 26 pressure levels) was used as the ICs and BCs of the model. These experiments were started from 06:00 UTC on 8 December to 00:00 UTC on 13 December 2018 (for a simulation length of 114 h).
The only different setting between these experiments is at the lower boundary, the real terrain data at (∘) resolution (roughly 0.9 km) were provided for the control simulation (CTRL) while this was ignored for the sensitivity test without the terrain (NTRN)
The main information of these two experiments, including the domain setup and model configuration, is listed in Table 1.
Table 1The basic information of experiments.
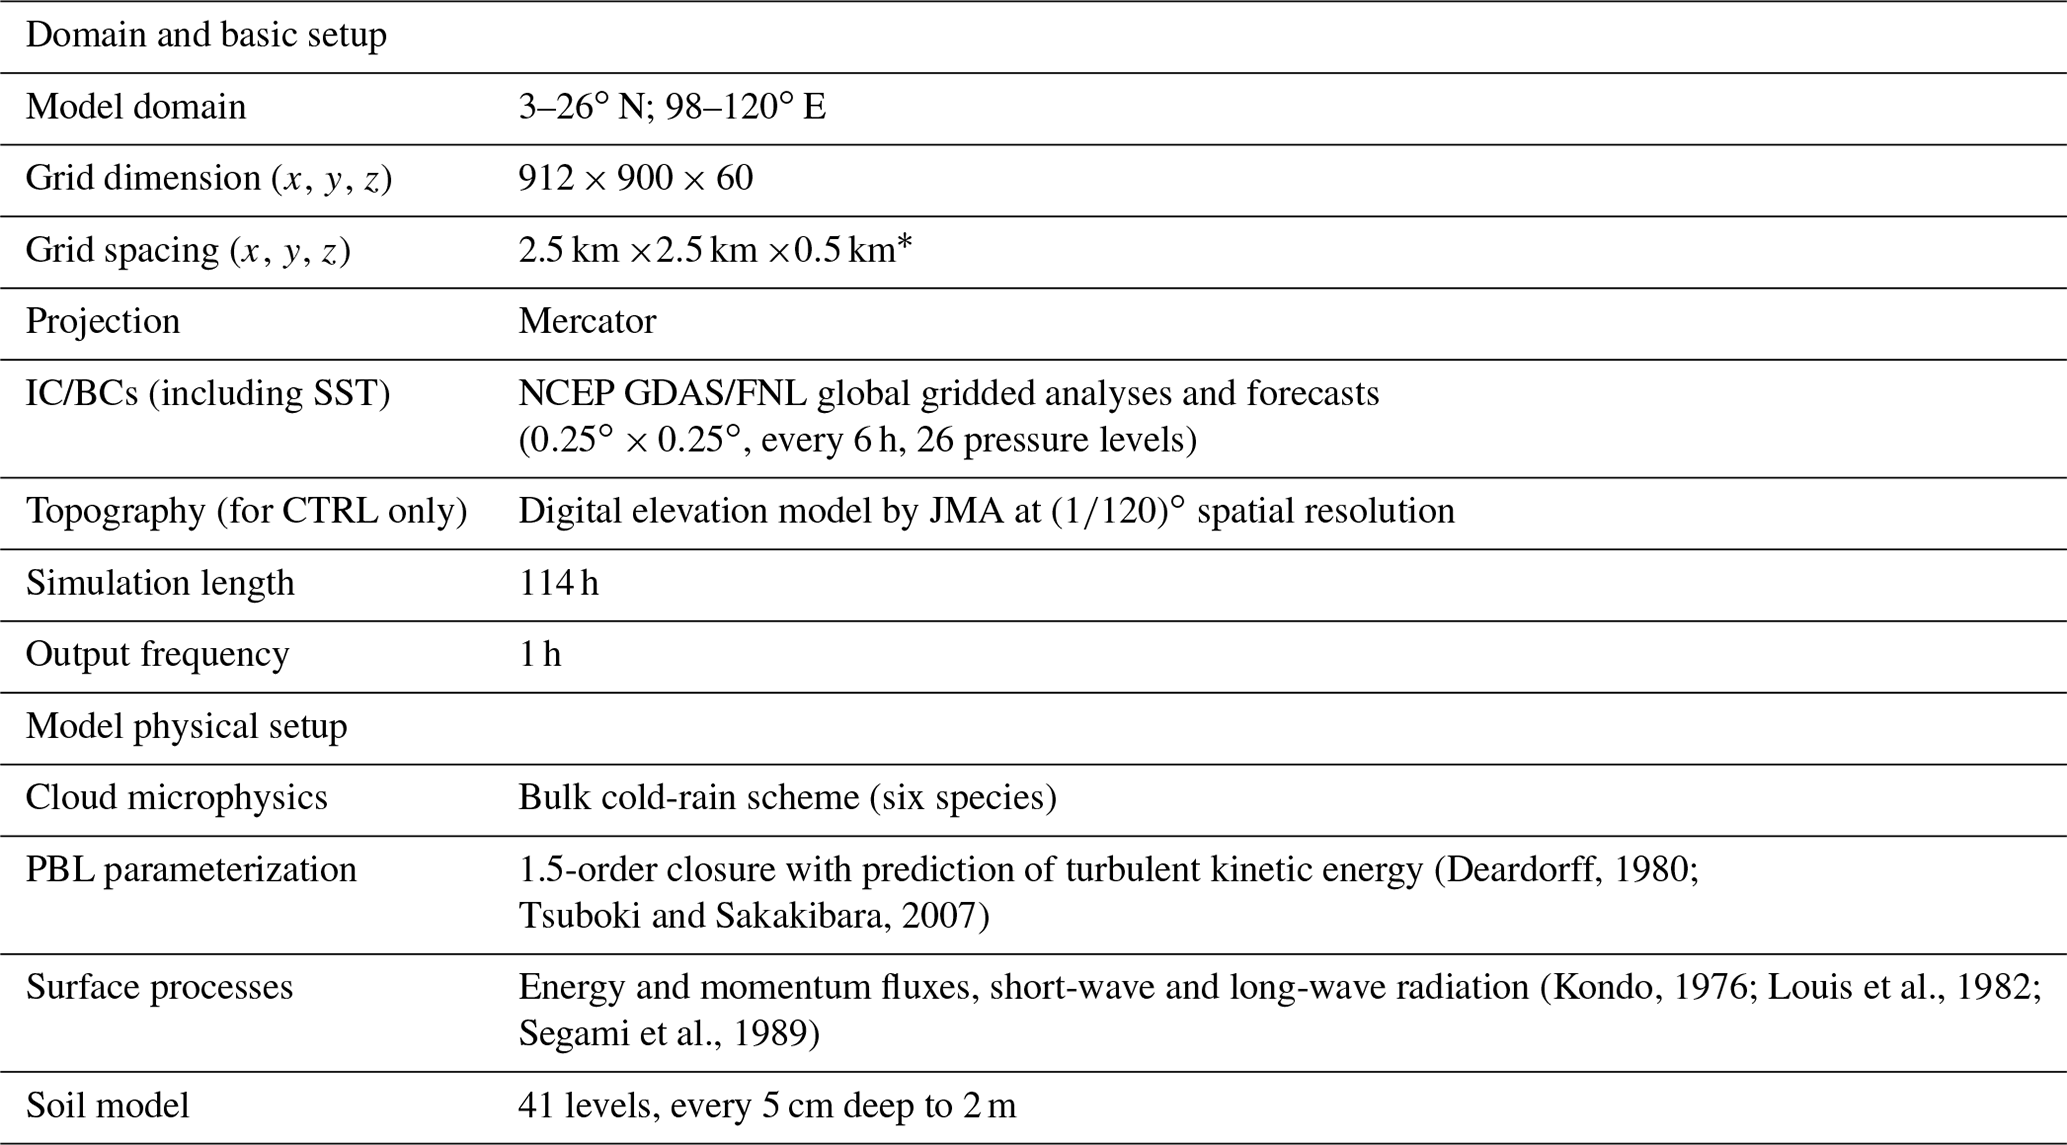
* The vertical grid spacing (Δz) of CReSS is stretched (smallest at bottom) and the averaged value is given in the parentheses.
2.3 Verification of model rainfall
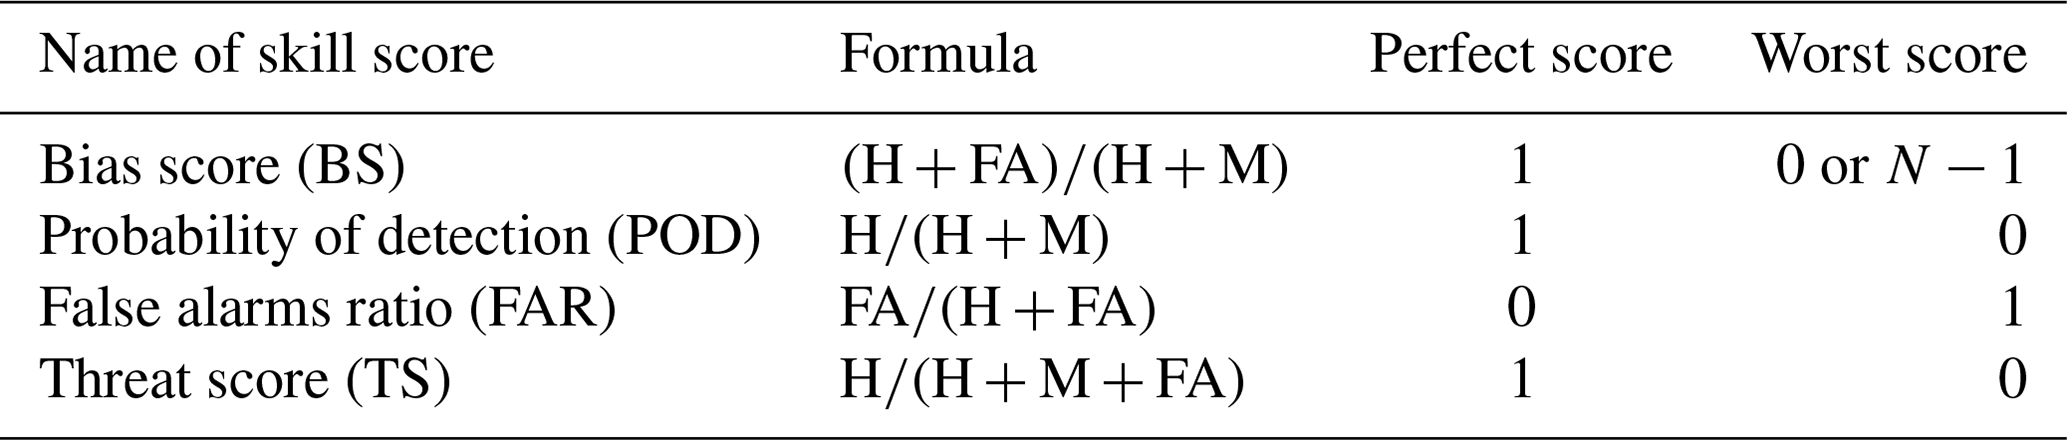
In order to verify the model-simulated rainfall, some verification methods are used, including (1) visual comparison between the model and the observation (from the 69 automated gauges over the study area), and (2) the objective verification using categorical skill scores at various rainfall thresholds from the lowest at 0.05 up to 900 mm for a 3 d total. These scores are listed in Table 2 along with their formulas, perfect value, and worst value, respectively. To apply these scores at a given threshold, the model and observed value pairs at all verification points (gauge sites here, N) are first compared and classified to construct a 2×2 contingency table (Wilks, 2006). At any given site, if the event takes place (reaching the threshold) in both model and observation, the prediction is considered a hit (H). If the event occurs only in observation but not the model, it is a miss (M). If the event is predicted in the model but not observed, it is a false alarm (FA). Finally, if both model and observation show no event, the outcome is correct rejection (CR). After all the points are classified into the above four categories, the scores can be calculated by their corresponding formula in Table 2.
Table 2List of the categorical skill scores and their formulas.
In addition to the categorical scores, the similarity skill score (SSS; Wang et al., 2022) is also applied to evaluate the model rainfall results as follows:
where N is the total number of verification points, Fi is the forecast value, and Oi is the observed value, at the ith point among N, respectively. The SSS is used to measure against the worst mean squared error (MSE) possible. The formula shows that a forecast with perfect skill has a similarity skill score (SSS) of 1, while a score of 0 means zero skill.
3.1 Rainfall and its distribution
The maximum accumulated rainfall was recorded from 9 to 11 December 2018 with a peak daily rainfall greater than 500 mm and 72 h accumulated rainfall exceeding 800 mm (Fig. 1a–d). Besides, the daily and 72 h rainfalls observed at 69 stations show that the extreme precipitation occurred along the eastern coastal plains, on the eastern side of the Truong Son Range, especially over Quang Nam province, where the Truong Son Range reaches its highest of over 2500 m (Fig. 1a–d). In addition, satellite products from the TRMM seriously underestimate the D18 event (Fig. 1e); however, they indicate that the rainfall occurred not only in coastal plains but also over the nearby ocean.
3.2 Synoptic conditions
During the D18 event, the horizontal winds at 925 hPa (averaged from 00:00 UTC on 8 December to 18:00 UTC on 11 December) over central Vietnam and the SCS are characterized by a strong convergent zone between the northeasterly winds blowing from northeastern China into northern SCS and central Vietnam and the easterly winds blowing from the western North Pacific (WNP) into the SCS (Fig. 3a). The wind speed over northern SCS and central Vietnam is over 13 m s−1. At 850 hPa, horizontal winds are predominantly easterly, with speeds of about 10–13 m s−1 (Fig. 3b). At 500 hPa, central Vietnam is affected by southeasterly winds that originated from the easterly winds over the WNP (Fig. 3c). Besides, Fig. 3 also indicates that there was no existence of any tropical cyclone during the D18 event. Therefore, tropical cyclones or the combined effect of cold surges originating from northern China and tropical depressions that have been mentioned as one of the patterns that cause heavy rainfall in central Vietnam are not the mechanisms of the D18 event.

Figure 3(a) The ERA5 averaged horizontal wind vectors (m s−1, color for speed) and geopotential height (gpm, blue contours, every 30 gpm) at the 925 hPa from 00:00 UTC on 8 December to 18:00 UTC on 11 December 2018. (b) As in panel (a), but for the 850 hPa. (c) As in panel (a), but for the 500 hPa. The black areas are where the 925 hPa level is below the ground.
From a thermodynamic perspective, the equivalent potential temperature (θe) field at 925 hPa shows that a warm and moist tropical air mass exists in central and SCS with θe values greater than 335 K, and the relative humidity is around 90 % during the D18 event (Fig. 4a). The high moisture content combines with a decrease in θe with altitude, indicating convective instability in the lower atmosphere below about 500 hPa (Fig. 4b). Furthermore, the interaction between northeasterly and easterly winds seemed to enhance instability in the lower atmosphere.
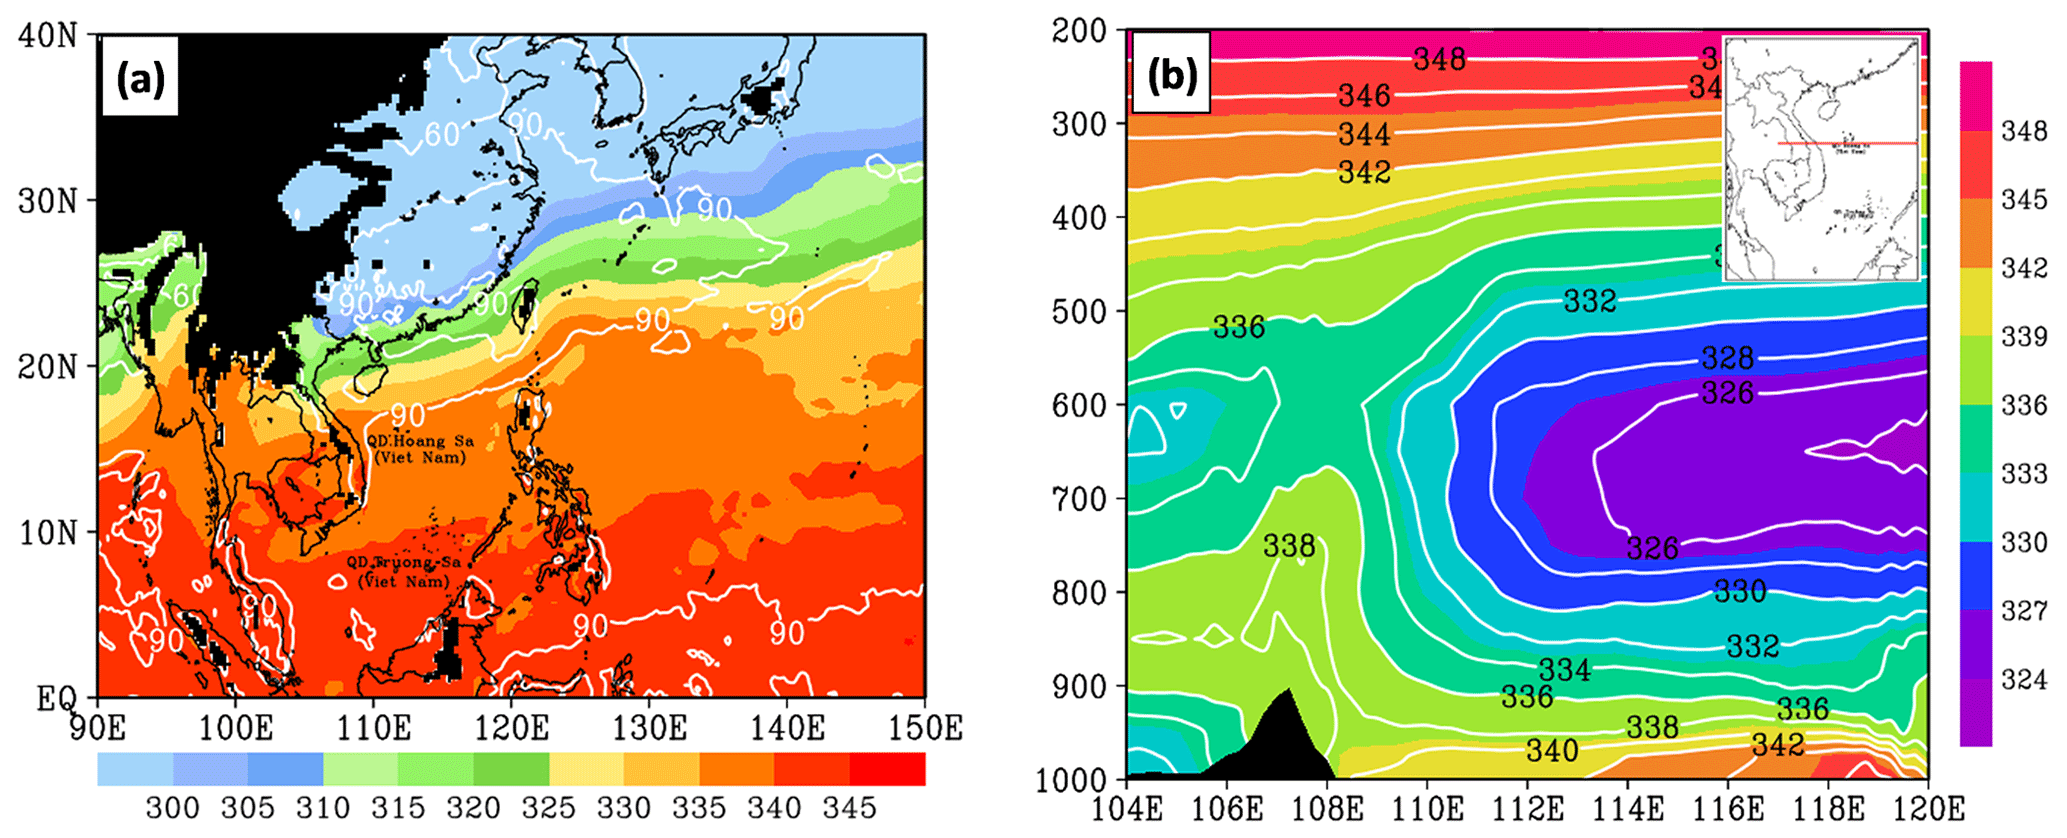
Figure 4(a) The ERA5 averaged equivalent potential temperature (K, color) and relative humidity (%, white contours, every 30 %) at 925 hPa. The black areas are where the 925 hPa level is below the ground. (b) The east–west vertical cross-section along 16∘ N (see insert) of averaged equivalent potential temperature (θe, K, color, every 5 K) from 00:00 UTC on 8 December to 18:00 UTC on 11 December 2018. The topography is dark shaded.
The above analysis suggests that the northeasterly, easterly, and southeasterly winds (see Fig. 3a–c) all played an important role in transporting unstable air into central Vietnam. Particularly, when the strong northeasterly and easterly winds at low levels and southeasterly wind at upper levels blow into central Vietnam, they bring warm, moist, and unstable air into central Vietnam. This moisture is transported to central Vietnam by strong moisture flux through the deep column from the WNP, across the Philippines and the SCS (Fig. 5a). Furthermore, the high SST of the SCS (>27 ∘C) also helps to enhance and maintain abundant moisture during this event (Fig. 5b).
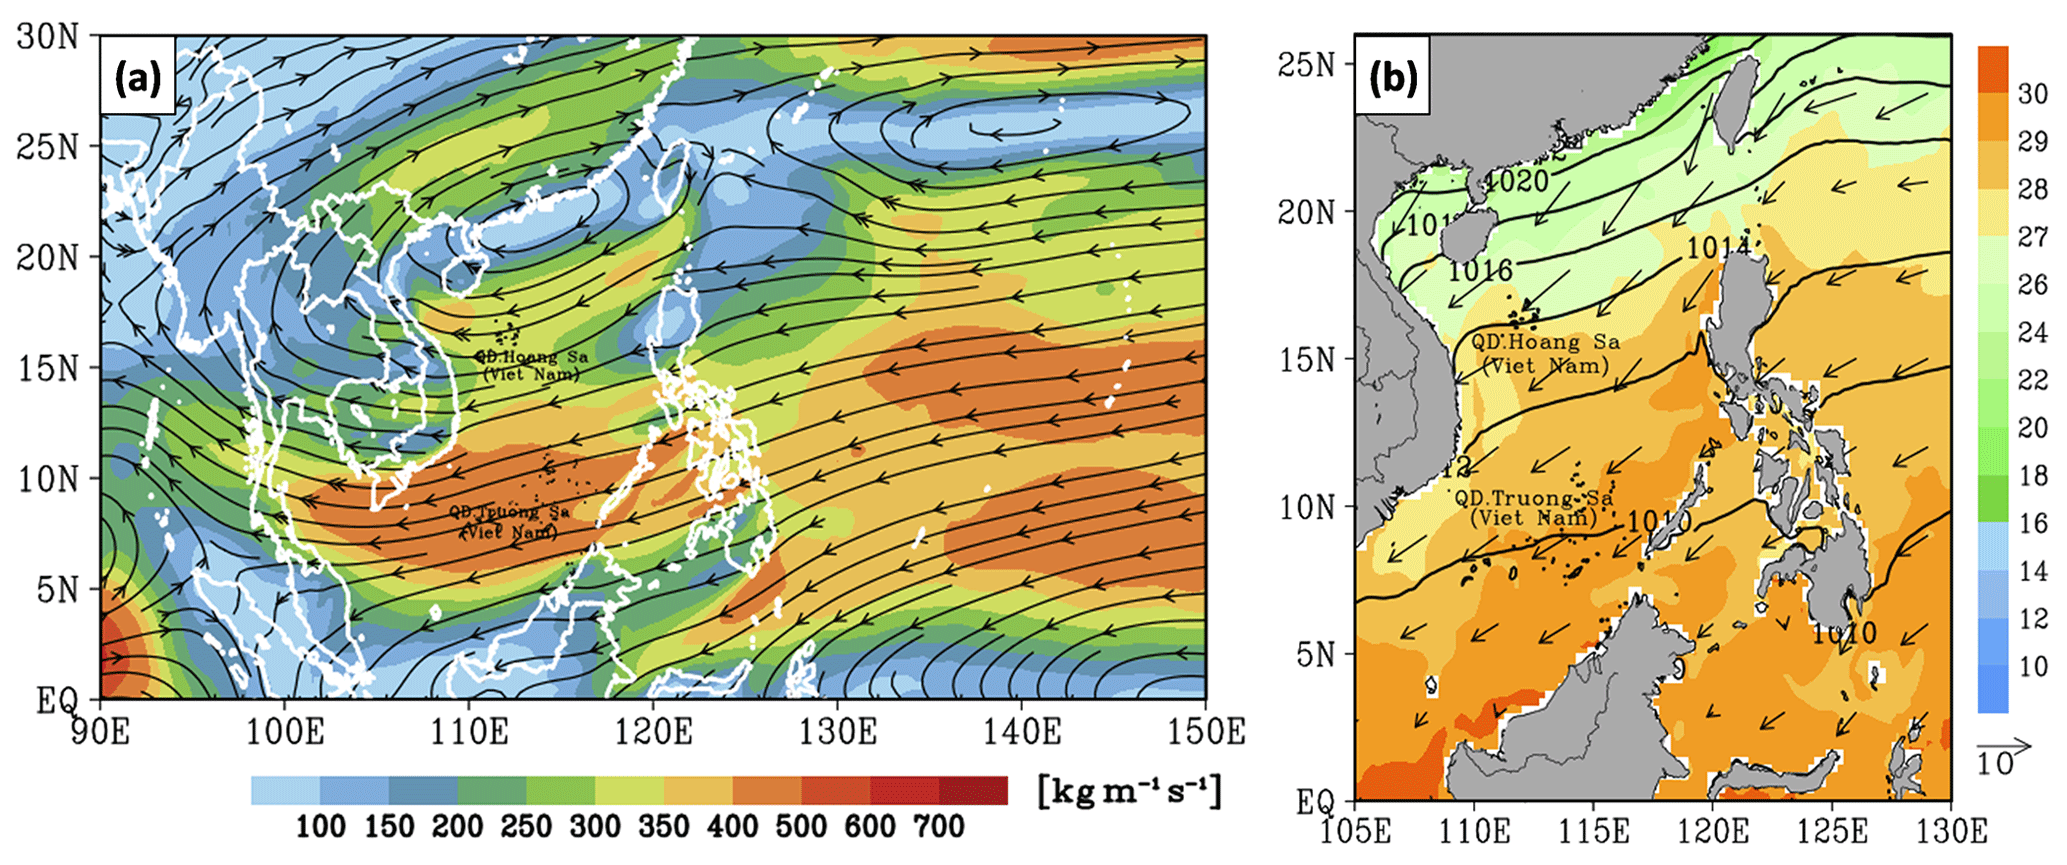
Figure 5(a) The ERA5 averaged surface and 200 hPa vertically integrated moisture flux (kg m−1 s−1). (b) The ERA5 averaged SST (∘C, color), mean sea-level pressure (hPa, isobars, every 2 hPa), and horizontal wind vectors at 10 m height (m s−1, vector), from 00:00 UTC on 8 December to 18:00 UTC on 11 December 2018.
Consequently, the atmospheric conditions and local topographic characteristics in interaction result in moisture convergence and forced uplift in the lower troposphere during the D18 event. This can be seen in Fig. 6, where extensive rising motion occurs in the lower troposphere along coastal Vietnam, with a maximum value of −1.2 Pa s−1. Besides, Fig. 6a–b also indicate that the strong northeasterly wind along with warm, moist, and unstable air is blocked by the Truong Son Range. This pattern suggests that the Truong Son Range also played an important role in the development of heavy rainfall in central Vietnam in D18. In detail, when the northeasterly and easterly winds at low levels blow into central Vietnam and become blocked by the Truong Son Range, which is located along the border of Vietnam and Laos, forced uplift is resulted at the windward side, with downward motion over the lee side (in Laos, Fig. 6b). Furthermore, the low-level convergence in this event was strong enough (Fig. 3a), and the air was unstable enough (Fig. 4b) to trigger most of the convection near the shoreline (further inland, Fig. 6a).

Figure 6(a) The ERA5 the south–north vertical cross-section along 107.5∘ E (see insert) of averaged horizontal wind (m s−1, vectors) and vertical motions (Pa s−1; white contours, negative for upward motion), and relative humidity (%, shaded), from 00:00 UTC on 8 December to 18:00 UTC on 11 December 2018. The topography is dark shaded. (b) As in panel (a), but for the vertical cross-section along 16∘ N.
As described above, when the strong northeasterly and easterly winds at low levels blow into central Vietnam, they bring warm, moist, and unstable air that originated in the WNP and is enhanced over the SCS. Then, this air is blocked by the Truong Son Range, which has a height of around 2 km, leading to forced convergence and upward motion at low levels and divergence further above. These conditions consequently lead to moisture flux convergence of over g kg−1 s−1 at 925 hPa (Fig. 7a) and moisture flux divergence at 850 hPa with comparable magnitudes (Fig. 7b). This divergence reduces sharply further up toward the middle and upper levels (Fig. 7c). These factors create a moist atmosphere with a precipitable water amount (through the deep column) exceeding 50 mm during the D18 event (Fig. 7d). The above atmospheric ingredients and characteristics in local topography in combination created favorable environmental conditions to trigger orographic rainfall. As a consequence, the D18 event happened.
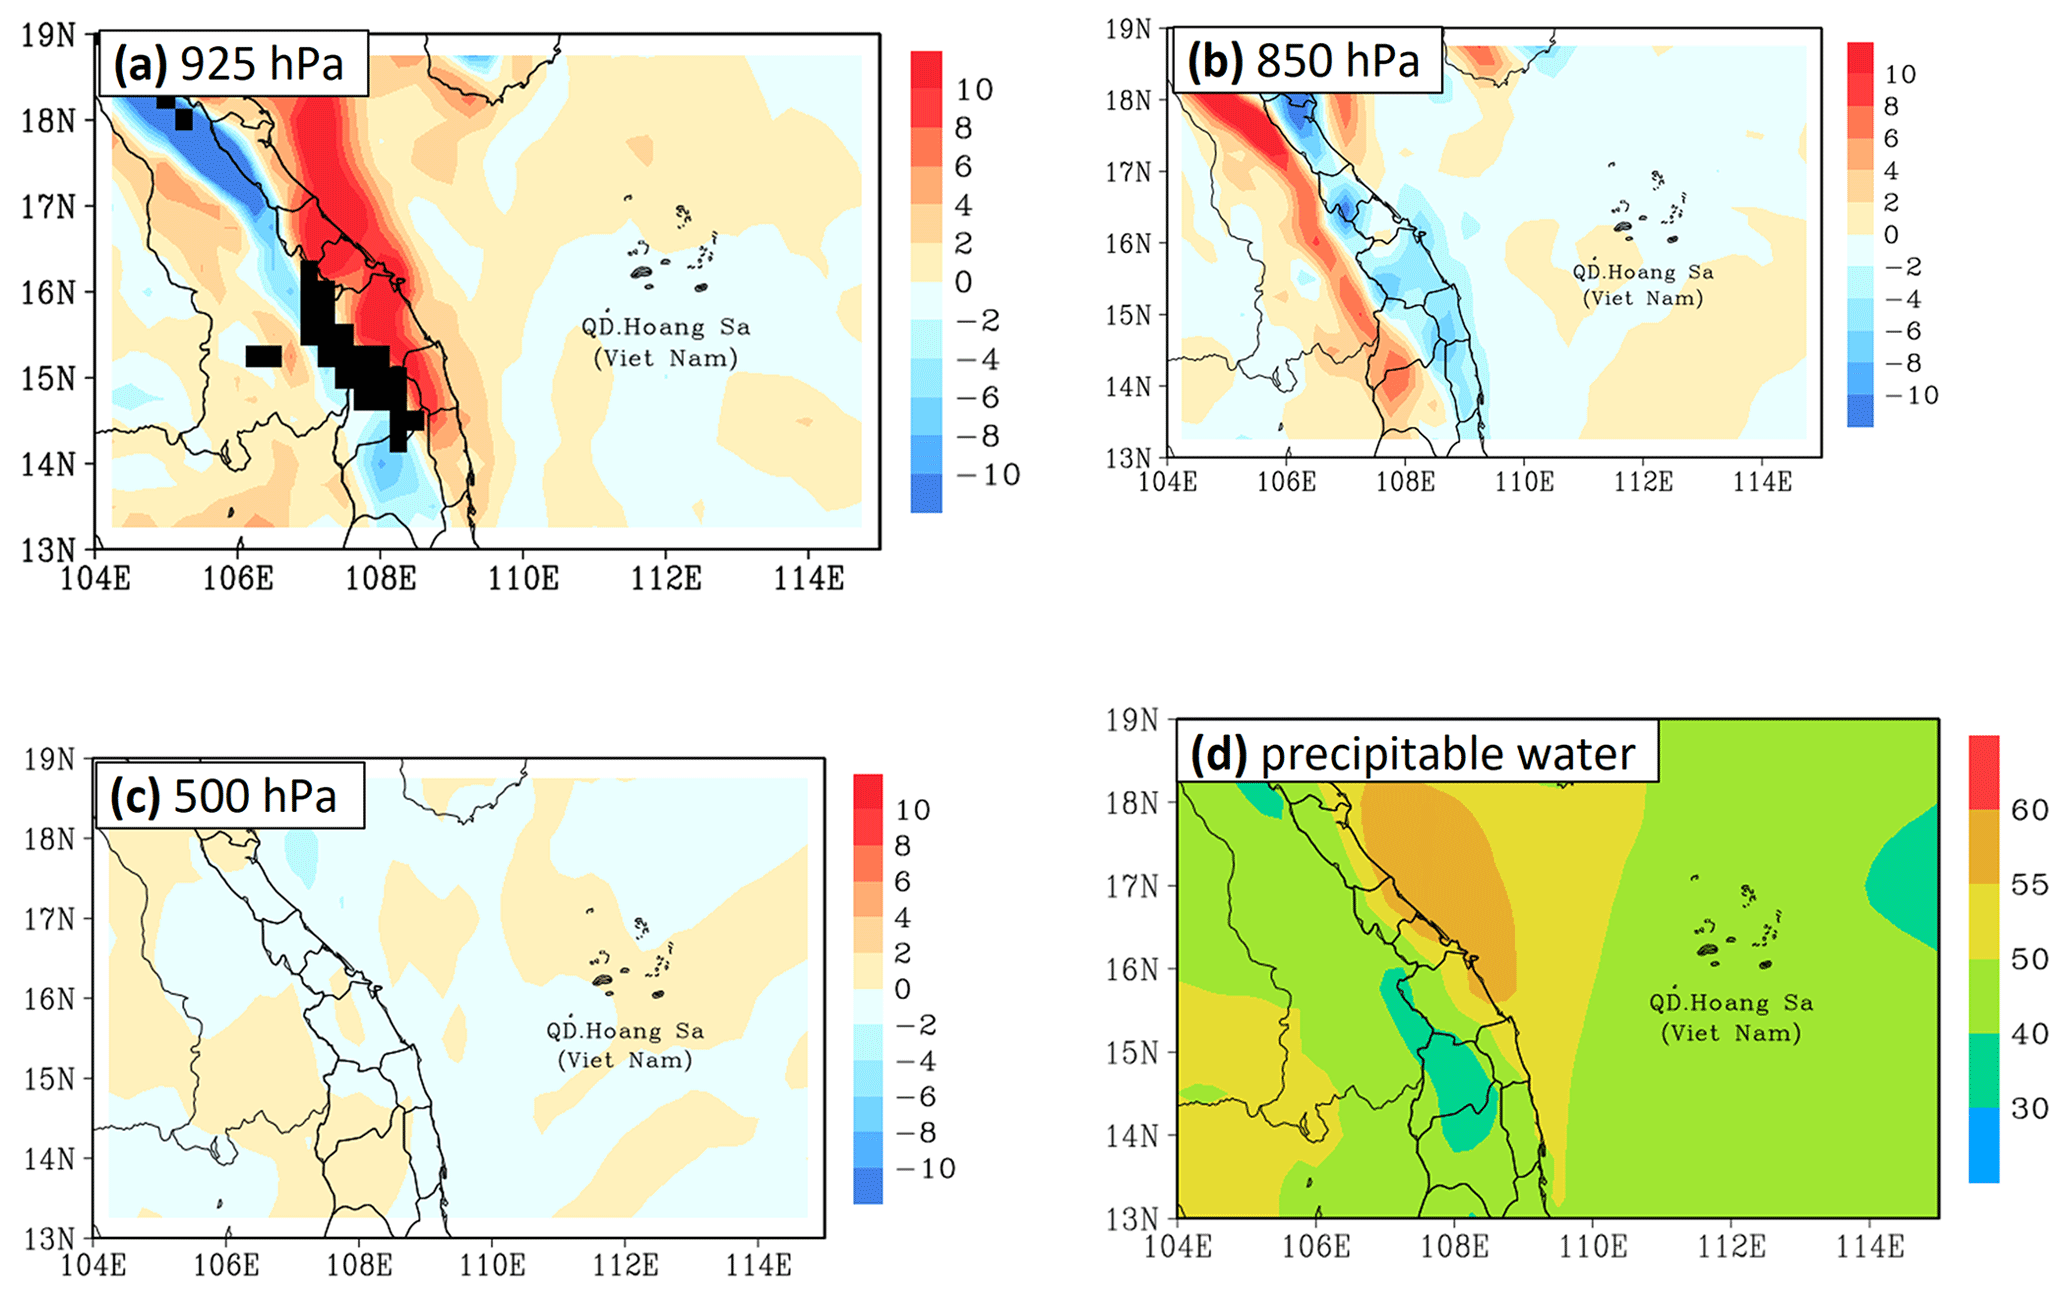
Figure 7(a) The ERA5 averaged moisture convergence/divergence (, g kg−1 s−1, shaded, positive for convergence) at the 925 hPa, from 00:00 UTC on 8 December to 18:00 UTC on 11 December 2018. The black areas are where the 925 hPa level is below the ground. (b) As in panel (a), but for the 850 hPa. (c) As in panel (a), but for the 500 hPa. (d) The ERA5 averaged precipitable water between surface and 200 hPa (mm), from 00:00 UTC on 8 December to 18:00 UTC on 11 December 2018.
Besides investigating the synoptic-scale atmospheric conditions above, this study also verified the impact of intraseasonal oscillations in the tropical atmosphere on the D18 event. To be more specific, Fig. 8a reveals that the MJO in the Western Pacific was not active in early December 2018 as well as during the D18 event. Figure 8b indicates that the last 3 months of 2018 are a fairly weak El Niño phase. In addition, previous studies showed that central Vietnam had less rainfall in the El Niño years. Therefore, MJO and ENSO are also not the cause and have no impact on the D18 event.
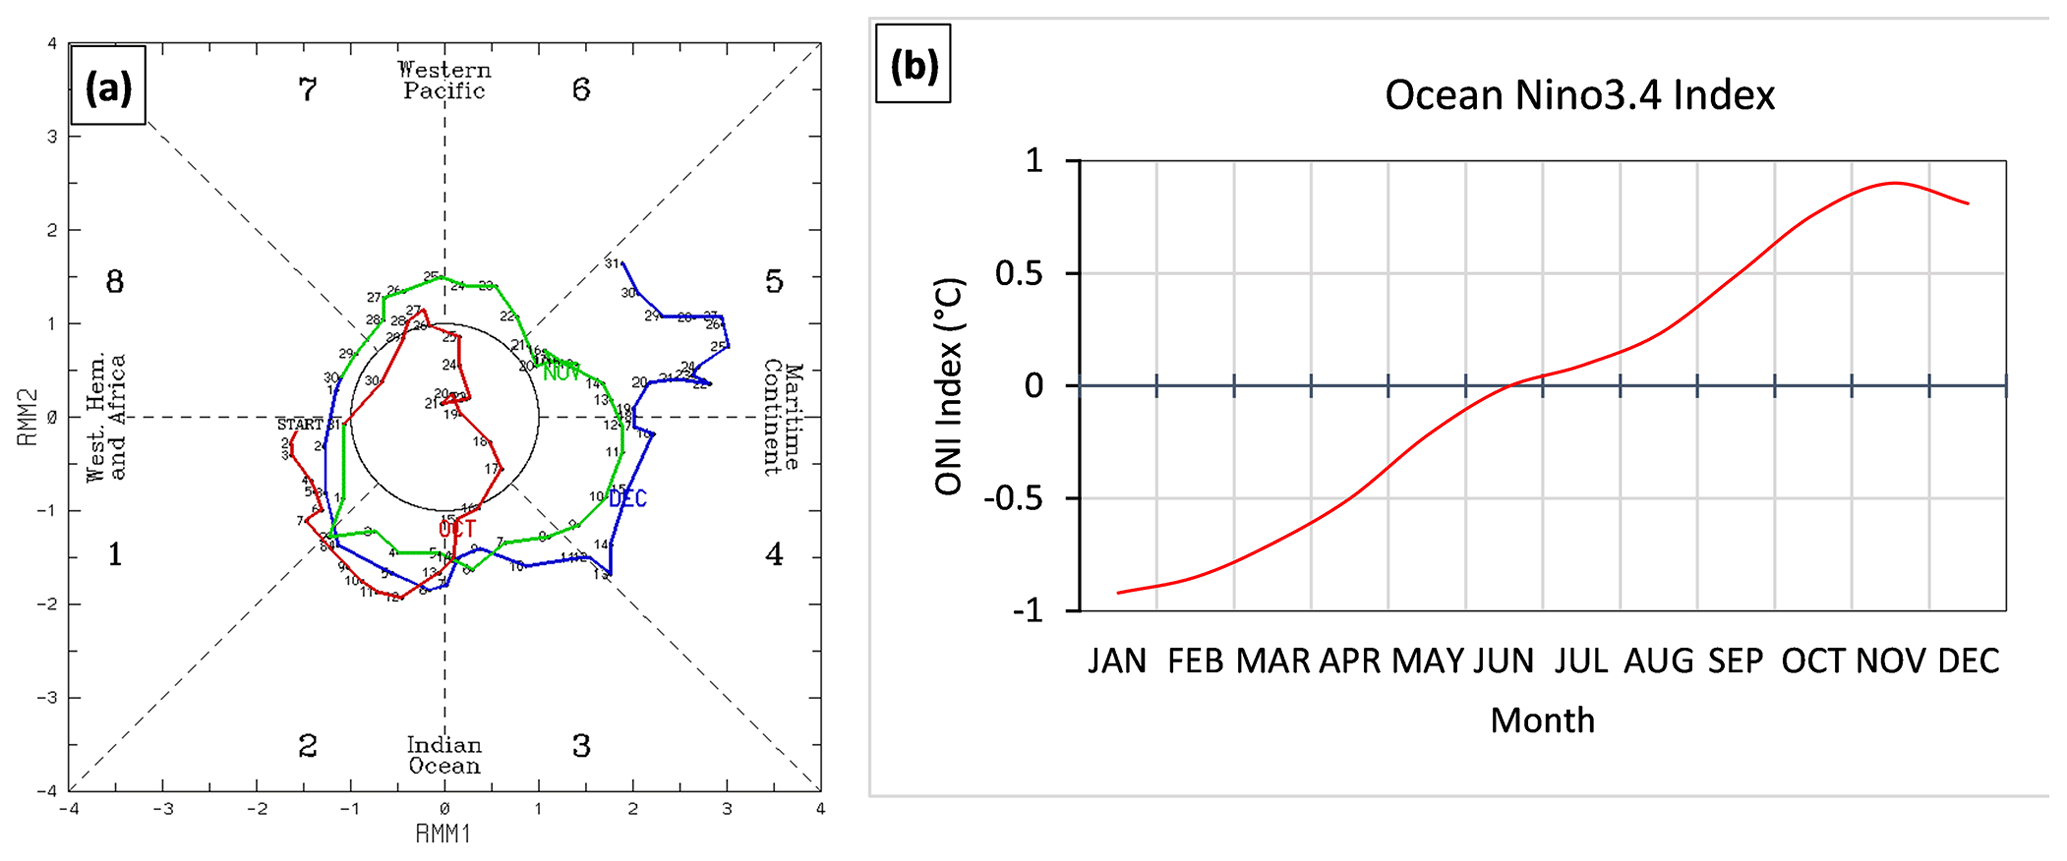
Figure 8(a) Location of the Madden–Julian Oscillation (MJO) and the strength through eight different areas along the Equator around the globe with labeled dots for each day. The red line is for October, the green line is for November, and the blue line is for December. Source: Commonwealth of Australia 2019, Bureau of Meteorology. (b) The Oceanic Niño Index (ONI) of the Niño 3.4 region (5∘ N–5∘ S, 120–170∘ W) for 2018.
3.3 The local thermodynamic conditions prior to the D18 event
Figure 9 shows these conditions at 12:00 UTC on 8 December 2018. At this time, there is a strong convergence zone of the low-level northeasterly wind carrying the moisture over the north of the study area and near the shoreline (Fig. 9a, b). The northeasterly wind convergence led to a low-level moisture convergence both inland and over the coastal sea. This happened as the low-level northeasterly wind carrying the moisture blew to central Vietnam and interacted with local topography; the low-level northeasterly flow reduced in speed over a wide area (Fig. 6), leading to a strong moisture flux convergence at low-level both inland and near the shoreline and moisture flux divergence at the upper level (Fig. 9c, d). Due to the convergence of northeasterly wind and moisture that mainly occurred in the north of latitude 16, the rising motion in the south of latitude 16 mainly happened at low-level (less than 700 hPa, Fig. 9e) due to the block by the Truong Son range. Furthermore, this process occurred in a warm and unstable atmosphere (refer to Fig. 4), creating a favorable environmental condition to trigger most of the convection near the shoreline instead of over the slopes (further inland) by forced uplift of the terrain. Hence, precipitable water between the surface and 200 hPa exceeding 55 mm just formed over the coastal zone of the north of the study area (Fig. 9f). Consequently, heavy rainfall only concentrated around the coastal zone. These analyses are suitable for satellite and radar data.
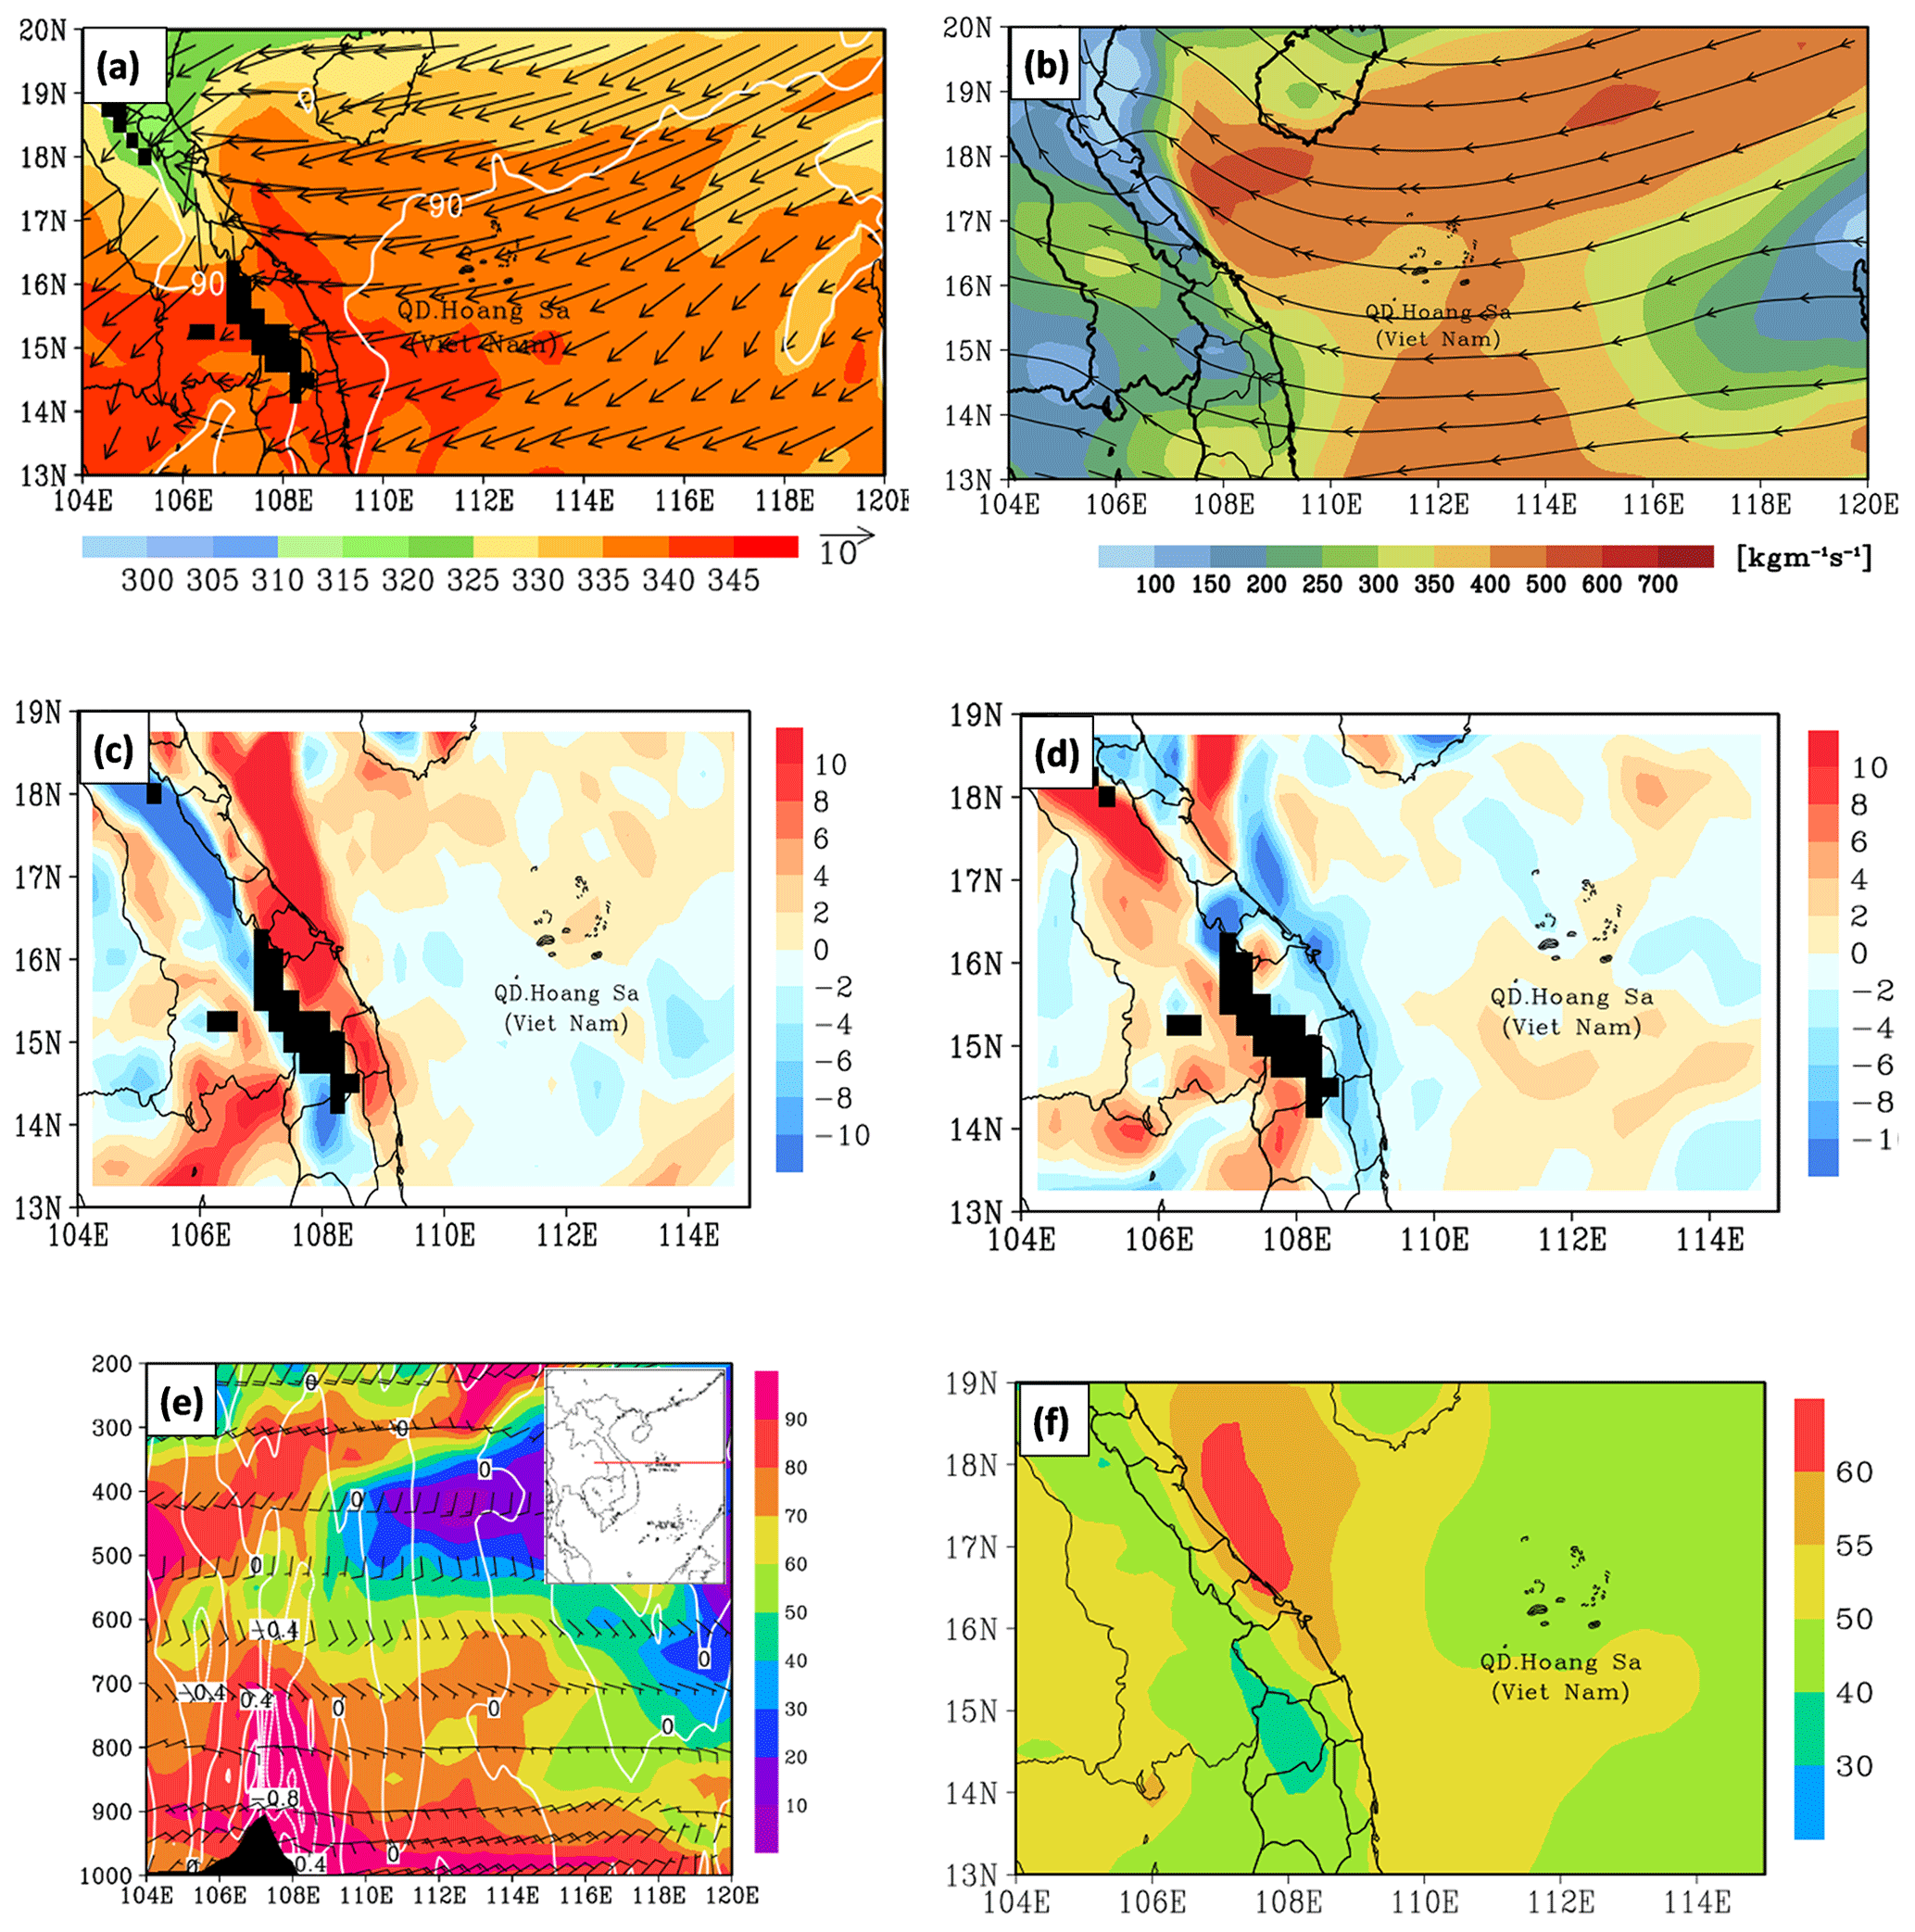
Figure 9(a) The ERA5 θe (K, shaded), horizontal winds (m s−1, vector), and relative humidity (%, white contours, every 30 %) at 925 hPa. The black areas are where the 925 hPa level is below the ground. (b) Surface and 200 hPa vertically integrated moisture flux (kg m−1 s−1). (c) The moisture convergence/divergence (, g kg−1 s−1, shaded, positive for convergence) at the 925 hPa. The blacked areas are where the 925 hPa level is below the ground. (d) The moisture convergence/divergence (, g kg−1 s−1, shaded, positive for convergence) at the 850 hPa. The blacked areas are where the 925 hPa level is below the ground. (e) East–west vertical cross-section along 16∘ N (see insert) of vertical motions (Pa s−1, white contours), relative humidity (%, shaded), and horizontal winds (m s−1, vector). The topography is black shaded. (f) Precipitable water between surface and 200 hPa (mm)
To be more specific, on satellite imageries from 12:00 UTC on 8 December to 11:00 UTC on 9 December (Fig. S1 in the Supplement), a series of deep convective clouds (cumulonimbi, or Cb) first form over northern and central Vietnam and Laos on 8 December 2018, with mainly a northeast–southwest to east–west alignment. With blackbody temperatures (TB) below −42 ∘C, several isolated deep cells also develop near the coast over the southern part of the study area after 02:00 UTC on 9 December (Fig. S1). Generally, these deep Cb clouds tend to move slowly offshore and weaken after a few hours. Meanwhile, the study area is also covered by precipitating clouds known as nimbostratus (Ns) that are not as deep, with cloud-top TB at −20 to 0 ∘C and above (Fig. S1). These Ns clouds first form over the northern part of the study area and then grow and expand southward along the coast, eventually covering the entire study area on 9 December (Fig. S1). As analyzed above, both deep Cb clouds and the persistent Ns clouds produced long-lasting rainfall for hours, starting along the coast from 12:00 to 17:00 UTC on 8 December. After that, the rain area extends both inland and over the coastal sea (Fig. S2). The rainfall intensity is the greatest from 20:00 UTC on 8 December to 02:00 UTC on 9 December, with a column-maximum radar reflectivity dBZ (Fig. S2). Afterwards, the rainfall intensity decreases to some extent but remains rather steadily at 15–35 dBZ (Fig. S2). While the precipitation is not too intense, it falls persistently over many hours, leading to high 24 h rainfall accumulation at some locations. Thus, the local thermodynamic conditions seem to hold for many hours and lead to the continuous development of precipitating clouds during much of 8 December.
At 12:00 UTC on 9 December, a warm, moist, and unstable atmosphere is still maintained over central Vietnam and the SCS, with θe>335 K (Figs. 10a and 4). However, the strong convergence of the low-level northeasterly wind carrying the moisture in Ha Tinh and Quang Tri provinces moved southward to Quang Tri and Quang Nam provinces (Fig. 10a). The southward movement of this wind convergence zone was dragging along the movement of the low-level moisture convergence (Fig. 10c, d). Besides, Fig. 10e shows that the low-level uplifting motion is stronger than the previous day due to most of the strong northeasterly wind zone being blocked by the Truong Son range. Besides, the southward movement of the northeasterly wind and moisture convergence zone also led to the southward movement of precipitable water between the surface and 200 hPa to the coastal zone between Quang Binh and Quang Tri provinces (Fig. 10f). As a result, the main heavy rainfall also moved southward to this area. Moreover, these thermodynamic conditions played a role to sustain the development of precipitating clouds on 9 December. This also coincides with observed satellite and radar data. In detail, on this day (since 12:00 UTC), satellite imageries also show some characteristics of deep convection over the coastal area (Fig. S3), but the cloud-top temperatures, in general, are not as cold as on 8 December. Meanwhile, the lower precipitating Ns clouds cover much of the study area from 12:00 UTC on 9 December to 03:00 UTC on 10 December, then they gradually disintegrate (Fig. S3). These clouds kept producing rainfall for the whole day, with the higher Cmax values (∼40 dBZ) and rainfall intensity from 12:00 UTC on 9 December to around 00:00 UTC on 10 December (Fig. S4), mainly over the coastal plain and nearby sea. After that, the rain gradually decreases in both intensity and areal coverage.
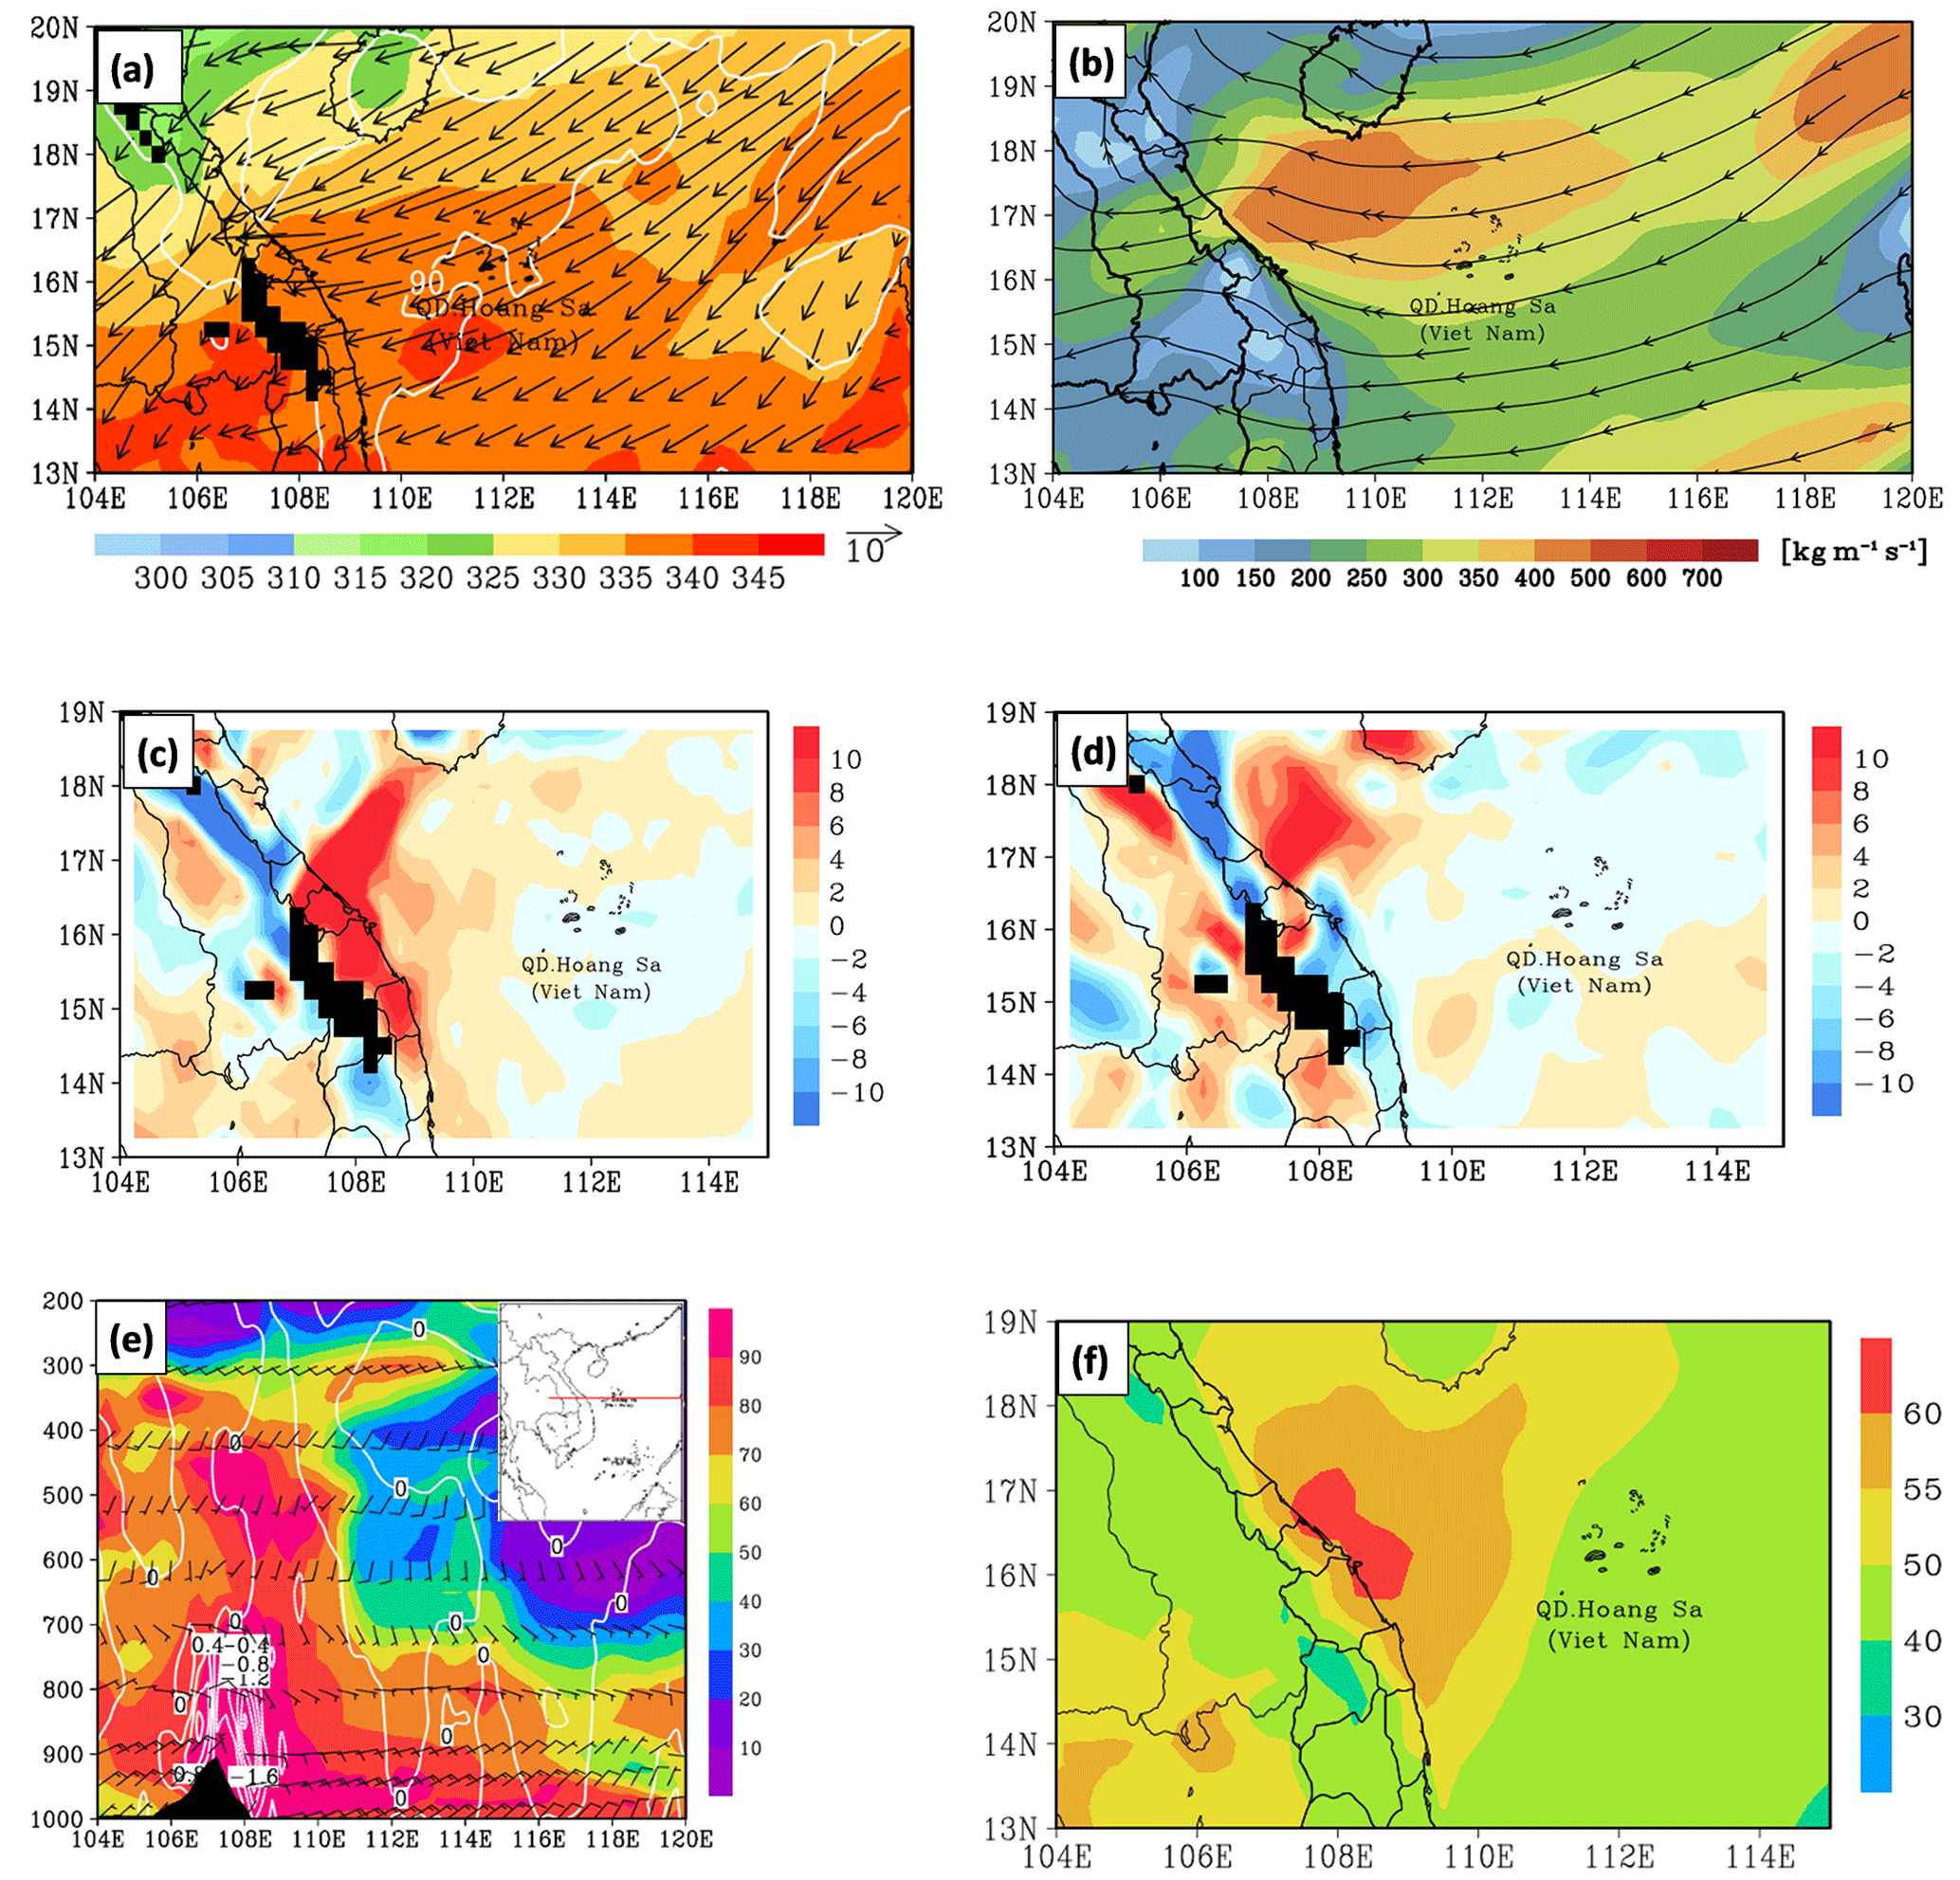
Figure 10As in Fig. 9, except for 12:00 UTC on 9 December 2018.
At 12:00 UTC on 10 December, the atmosphere remains very moist with a precipitable water amount of 55 mm (Fig. 11f). Some of the local dynamical and thermodynamical parameters, however, are reduced from 1 d earlier and become not as favorable, including the velocity of northeasterly wind, the upward motion over central Vietnam (Fig. 11e), moisture flux (Fig. 11b), and precipitable water amount (Fig. 11f). Hence, the development of precipitating clouds also reduces significantly on this day and mostly exist offshore over the ocean (Fig. S5). Compared to the past 2 d, the development of convective cells is also reduced. Near the coast, only three convective cells developed on 10 December, one at 14:00 UTC, the second at 20:00 UTC, and the third one shortly after 22:00 UTC. Furthermore, moving eastward and offshore after formation, these relatively small cells spend only 1–3 h over land. In general, the environmental conditions become less favorable for developing rain clouds after 12:00 UTC on 10 December. Consequently, there is a significant decrease in rainfall, which occurs mainly during 12:00–16:00 UTC then weakens with time (Fig. S6).
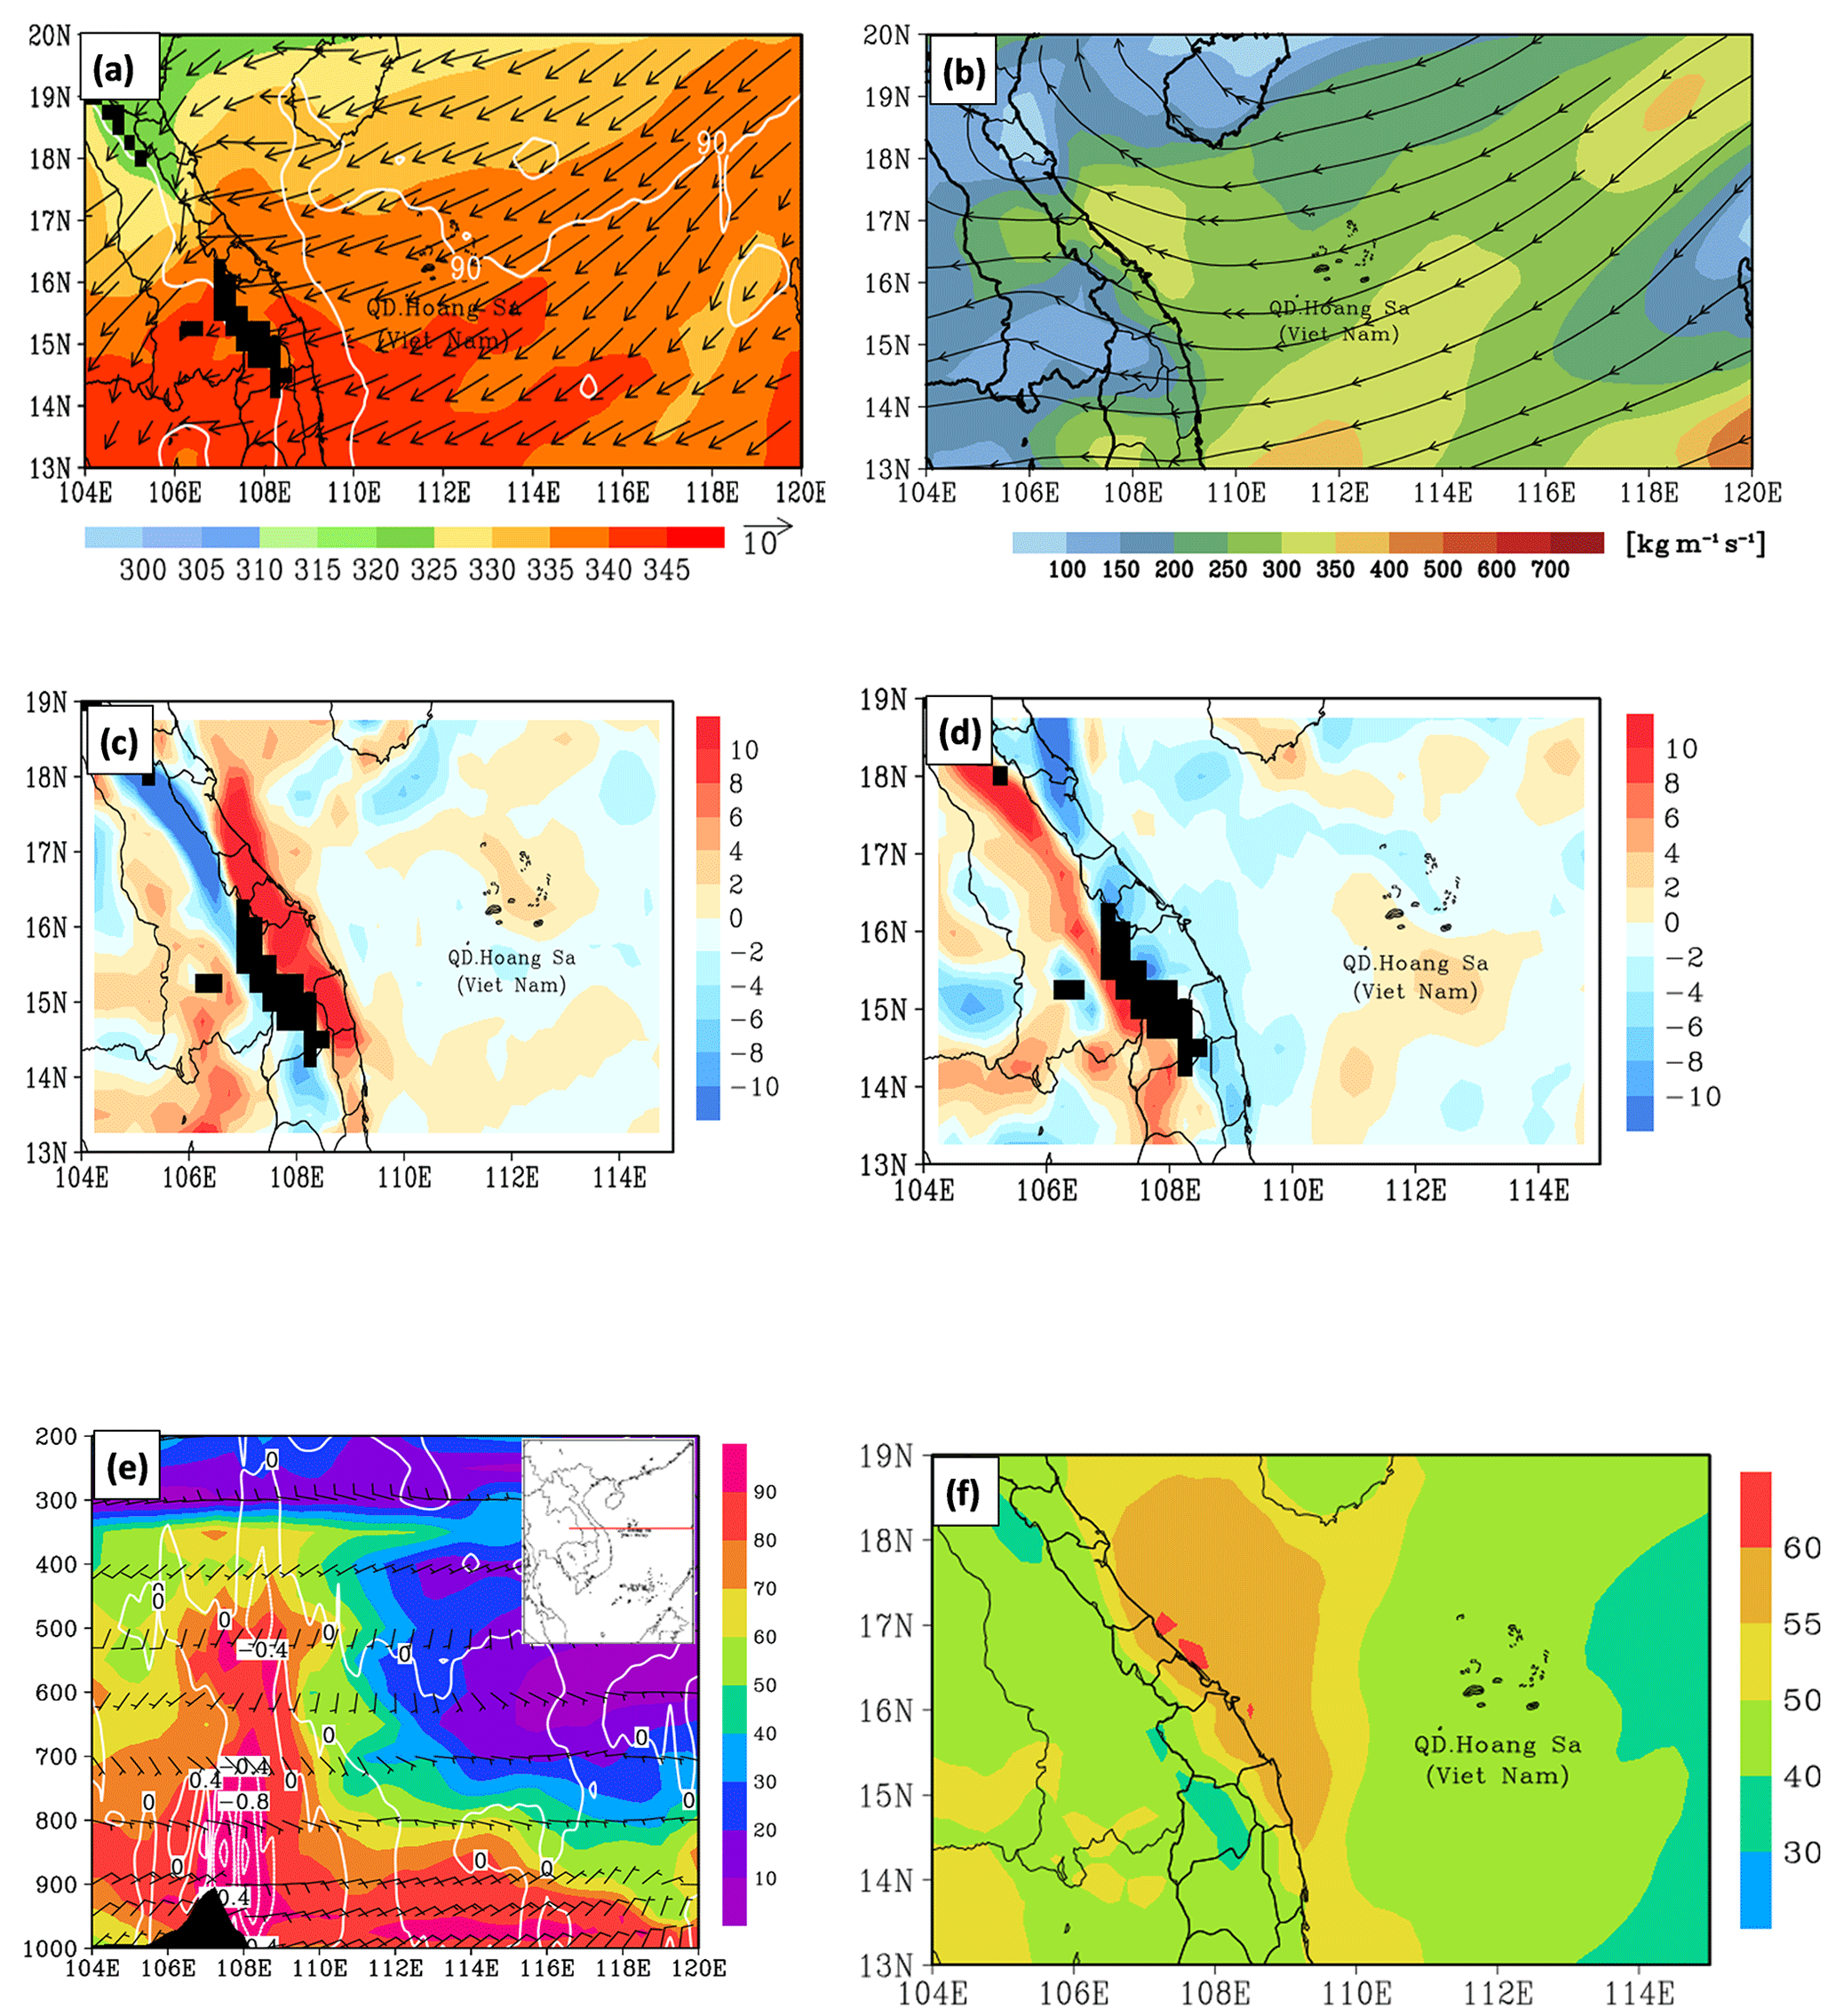
Figure 11As in Fig. 9, except for 12:00 UTC on 10 December 2018.
In this section, the model simulation results are used to investigate the role of topography in the development of clouds and rainfall in the D18 event, and the CReSS model is also evaluated for its ability to reproduce the event over the study area.
Figure 12 presents the daily averaged surface horizontal winds and daily rainfall in CTRL and NTRN for each of the 3 d from 9 to 11 December 2018. In CTRL, the model has simulated the surface wind well. As a result, the model produced a maximum 24 h rainfall of around 400 mm on 9 December (Fig. 12a), roughly comparable in magnitude to the observation (Fig. 12c). While one should bear in mind that the limited number of rain gauges have a smaller coverage area and cannot resolve the detailed distribution of rainfall (see Fig. 1a), the model rainfall in CTRL is slightly more offshore north of 16∘ N but more inland near 16∘ N, thus is not as abundant along the coast compared to the observation. In other words, model rainfall has some location errors but the magnitude is comparable by visual inspection.
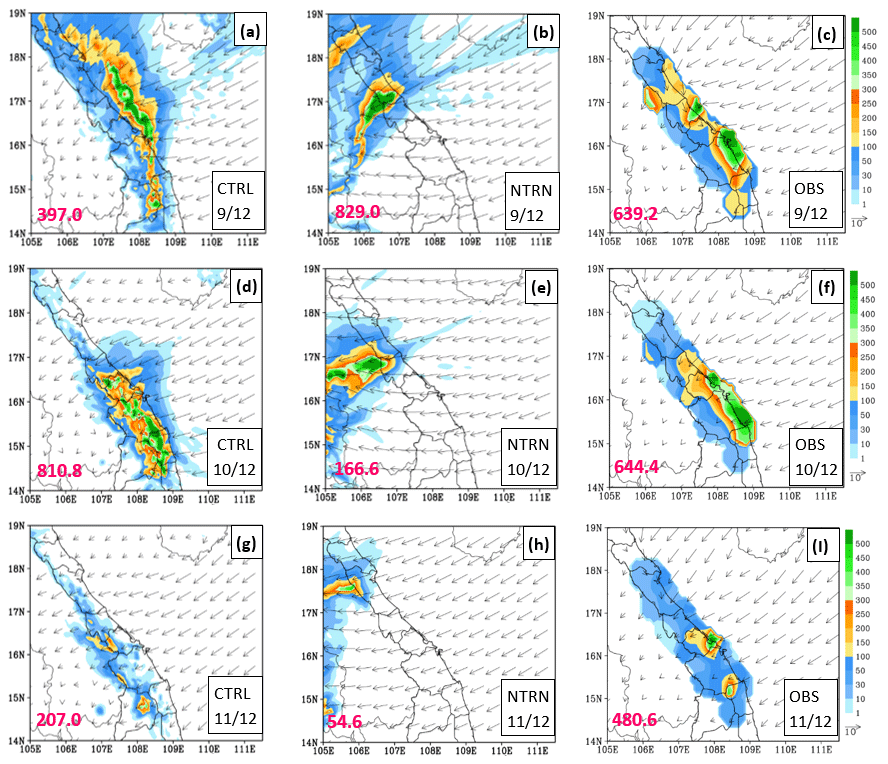
Figure 12Simulated daily mean surface horizontal wind vectors (m s−1, reference length at panels c, f, i) and 24 h accumulated rainfall (mm, color) in CTRL (a, d, g) and NTRN (b, e, h), and the observed rainfall at gauge sites (OBS), overlaid with the daily mean surface wind vectors derived from the ERA5 data (c, f, i). From top to bottom they are as follows: (a–c) 9 December, (d–f) 10 December, and (g–i) 11 December 2018. The pink number at the lower left indicates the maximum value of 24 h rainfall.
An objective and more quantitative verification of model rainfall can be provided by the threat score (TS) computed at the rain-gauge sites, which shows that the model has high scores at low thresholds of ≤10 mm (per 24 h) but gradually decreases toward higher thresholds (Fig. 13a, red curve). In particular, the TS is about 0.5 at 25–50 mm, below 0.2 above 160 mm, and about 0.1 at 350 mm. Eventually, the TS drops to zero at 500 mm, which is not too far from the observed peak rainfall of over 500 mm (at Da Nang, see Fig. 1a). The bias score (BS) confirms that the model does not produce enough rainfall over the coastal plains, as its value drops from about 1.0 at 0.05 mm to below 0.4 at and above 250 mm. As another objective measure of overall quality of prediction, the SSS is about 0.5 for 9 December. Overall, the model appears to produce too much rainfall offshore north of 16∘ N and not enough rainfall along the coast, and to some extent this might be linked to its surface wind coming more from the east-northeast, compared to northeast in the ERA5 analysis (Fig. 12a, c), leading to somewhat different locations of low-level convergence of wind and moisture.
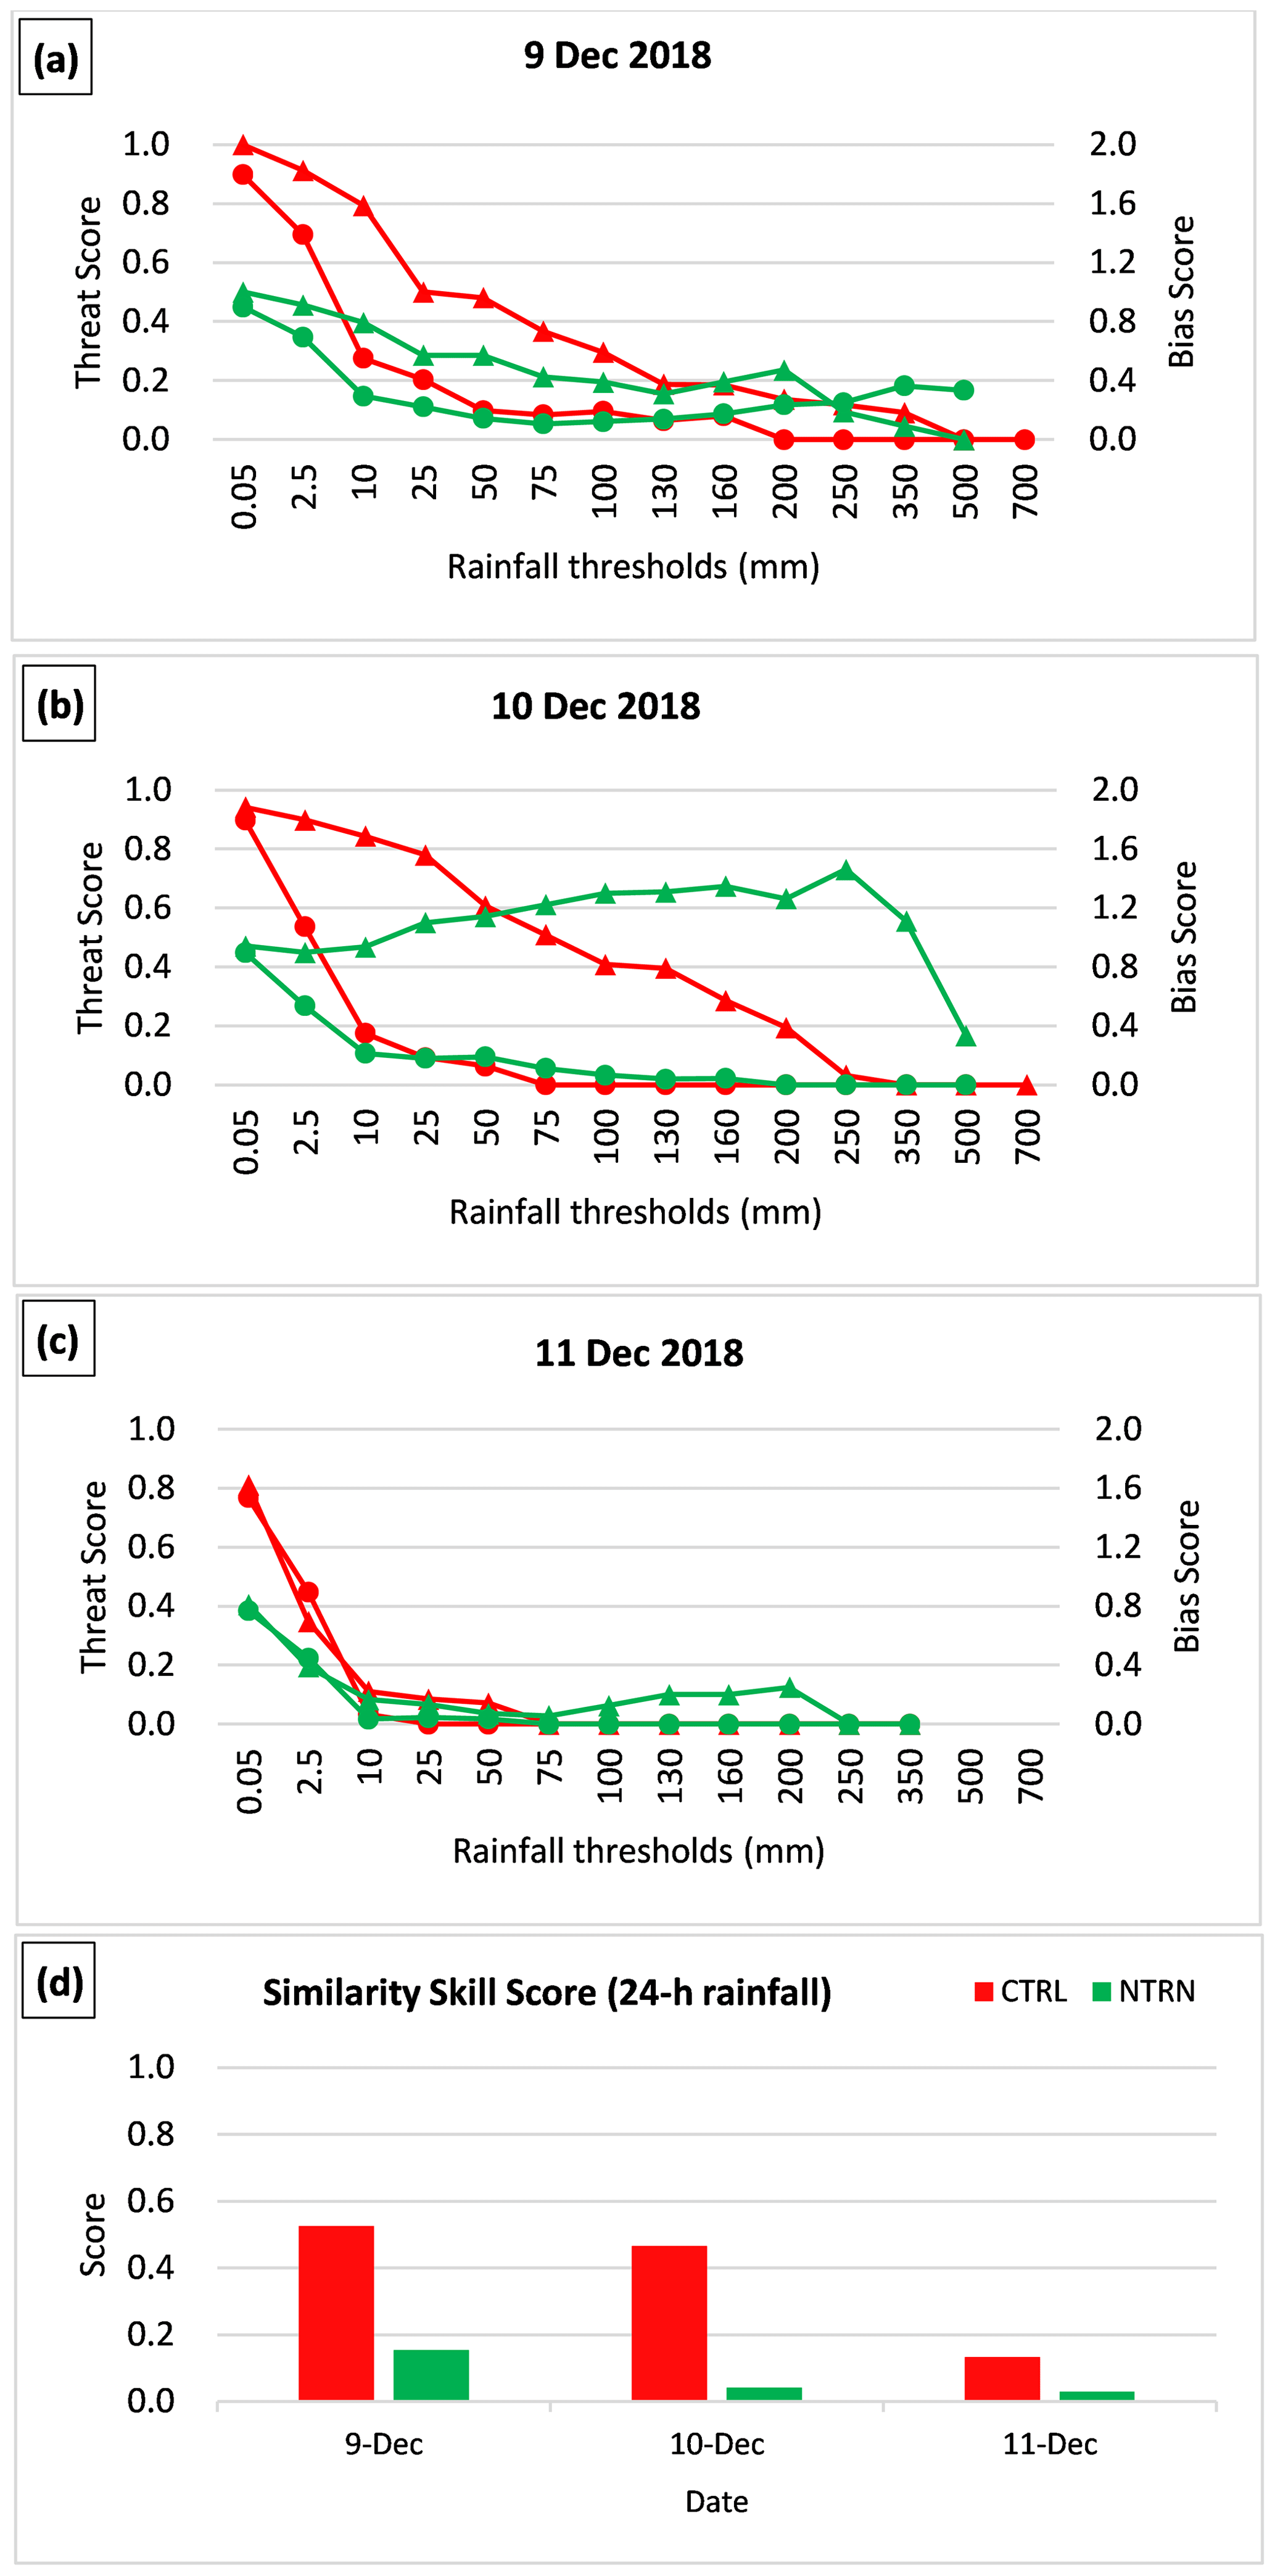
Figure 13(a–c) The threat scores (red) and bias scores (green) of 24 h accumulated rainfall for the CTRL (curve with triangles) and NTRN (curve with dots) experiments for the 3 d of 9–11 December 2018. (d) Similarity skill score (SSS) of 24 h accumulated rainfall for the two experiments.
For 10 December, while similar differences in prevailing surface winds still exist between model simulation and ERA5 data, the model captured the southward movement of the northeasterly wind. Therefore, the model had well captured the southward movement of the main heavy rainfall. The rainfall location has improved with better agreement with the observation (Fig. 12d, f) but was generally slightly more inland and not right on the coast. Both over 600 mm, the observed and simulated peak daily rainfall values are again comparable. Due to the improvement in spatial pattern, the TS values exhibit higher values than those for the previous day across low to middle thresholds (up to 200 mm) but reduce to zero at 250 mm (Fig. 13b), while the SSS (near 0.46) is only slightly reduced (Fig. 13d). In agreement with the better TS values, the BS remains between 0.8 and about 1.4 from low thresholds up to 350 mm and drops to about 0.35 at 500 mm (Fig. 13b).
For 11 December, the model does not simulate the rainfall field well, as its rainfall is displaced toward the Truong Son Range (and the border to Laos), instead of over the coastal plain as observed (Fig. 12g, i). The spatial coverage of model rainfall is smaller and the peak amount (∼200 mm) also lower compared to the rain-gauge data, while the surface wind appears weaker than the ERA5 data as well. While the observed peak amount became lower as the D18 event was coming to an end, the TS values also decrease rapidly with threshold, and are close to 0.1 at just 10 mm and become zero at and above 70 mm (Fig. 13c). Consistent with the inadequate amount over land, the BS values also decrease rapidly with thresholds, from about 0.8 at 0.05 mm to below 0.3 over 100–200 mm. For this day, the SSS is only about 0.14 and significantly lower than the values for 9 and 10 December (Fig. 13d). Possibly also related to the weaker surface winds in the model, the less-than-ideal results of rainfall may be affected by the longer range of integration at 66–90 h for 11 December.
To test the impact of topography in the D18 event, the NTRN experiment was carried out. Without the terrain, the model had not simulated the surface wind well. Consequently, the rainfall as simulated by CReSS would be displaced much more inland from the coastal region for all 3 d of 9–11 December (Fig. 12b, e, h), and more importantly, the pattern would no longer be elongated and parallel to the coast, even though the peak amounts are similar to the observation. Thus, the topography was fundamental in determining the basic rainfall area and pattern in the D18 event. With incorrect distributions, the TS values (Fig. 13, green curves) are much lower and drop to below 0.2 at thresholds above 10–25 mm for all 3 d. The thresholds at which the TS values decrease to zero are 200, 75, and 25, respectively for the 3 d, and much lower than those in the CTRL, especially for 9 and 10 December. The BS values in the NTRN also tend to be lower than those in the CTRL, sometimes much lower, reflecting its incorrect location and thus little rainfall at gauge sites with rainfall in reality. The SSS values are also much lower, with values near 0.16, 0.04, and 0.04 for the 3 d. Without the topography, the surface wind pattern near the coast and over land would be much stronger and very different, due to the lack of its blocking and uplifting effects, and also the associated thermodynamic effects.
For the D18 event as a whole, the 3 d total rainfall distribution produced by the model compares quite favorably with the observation in both quantity and spatial pattern (Fig. 14a, c), with generally minor displacement errors more toward inland at around 15–16∘ N. Despite these errors, the spatial distribution of rainfall in the model corresponds well to the zone of low-level moisture convergence in the ERA5 analysis (Fig. 7a). In agreement with visual assessment, the TS values of the 72 h QPFs are quite high across even heavy rainfall thresholds: around 0.8 at 100 mm (per 72 h), close to 0.5 at 200 mm, above 0.2 at 350 mm, and 0.1 at 700 mm, with an overall SSS ≈0.7 (Fig. 14d, e). As shown, the rainfall fields for individual days in D18 are very different without the topography in NTRN, and the same is true for the whole event (Fig. 14b). The TS values also indicate a much lower skill in QPF, with a TS below 0.2 at ≥50 mm (per 72 h) and TS =0 at ≥350 mm, BS below 0.35 at ≥10 mm, and also an overall SSS of less than 0.1 (Fig. 14d, e). The results in Figs. 12 and 14 also indicate a significant wind-blocking effect by the Truong Son Range. In CTRL, the surface northeasterly winds commonly exceed 10 m s−1 in speed over the SCS but are reduced significantly (and even to near-zero speed) near the Annamite Range (and in Laos). On the contrary, there is no reduction in speed as the winds blow across central Vietnam in NTRN, without the blocking effect of the topography.

Figure 14(a–c) As in Fig. 12a–c, except for 3 d averaged surface horizontal wind vectors and 72 h accumulated rainfall over 9–11 December 2018. (d, e) As in Fig. 13c, d, except for TS and SSS values of the 72 h accumulated rainfall over 9–11 December 2018.
In this study, the extreme precipitation event that occurred on 8–12 December 2018 along the coast of central Vietnam is analyzed, and the simulation results by a CRM (the CReSS model) is evaluated. The major findings are summarized below.
Analysis on the D18 event has revealed several key factors which led to this record-breaking rainfall event: first, for all 4 d from 8 to 11 December, the strong northeasterly winds in the lower troposphere blew from the Yellow Sea into the SCS, and interacted with strong low-level easterly winds (below 700 hPa) over the SCS. This interaction strengthened the upstream easterly to northeasterly winds and generated strong low-level convergence, as the winds blew into central Vietnam and were blocked by the Truong Son Range, the low-level northeasterly flow reduced in speed and led to moisture flux convergence and rising motion along the coast of Vietnam persistently. Consequently, heavy rainfall was produced along the coast of central Vietnam. Second, the strong easterly winds played an important role in transporting moisture from the WNP, across the Philippines and the SCS, into central Vietnam. Third, the Truong Son Range also played an important role in this event due to its barrier effect. Finally, the high SST of the SCS (>27 ∘C) also acted to help replenish the moisture in this event. This above mechanism in the D18 event is different from those documented in previous studies. Particularly, according to previous studies, the heavy and extreme rainfall events are usually due to the multi-interaction between the northeasterly wind and preexisting tropical disturbance over the SCS and local topography, or tropical cyclone, or impacts by ENSO or MJO. However, these factors have not appeared during the D18 event. Therefore, we suggest that the interaction of the northeasterly and easterly winds in the moist, unstable atmospheric, and local topography can also lead to heavy precipitation events along the central coastal plains of Vietnam. Another interesting finding of this study is that even though short periods of heavy rainfall from deep convection also contributed, the extreme rainfall of the D18 event was mainly from the persistent rain from nimbostratus clouds (Ns) that do not possess a high reflectivity or a very cold cloud top.
One of the features of the D18 event is that the main heavy rain band moved from the north to south of the study area during the event. The analysis of the local thermodynamics reveals the movement of the convergent northeasterly wind zone in the north of the study area from north to south. This movement dragged along the movement of the convergent moisture zone. The movement of convergent moisture zone results in a precipitation water column moving from north to south. Consequently, the main heavy rain band moved from north to south.
The evaluation of model simulation results at a grid size of 2.5 km indicates the following. In the CTRL, the model has simulated the surface wind well and captured the wind convergence's southward movement. Therefore, the CReSS model has reproduced this event's rainfall field quite well, for both daily and 3 d accumulations, but with some displacement errors. In terms of objective verification skill scores, in particular, CReSS displays high skills at heavy rainfall thresholds for both daily rainfall (TS ≥0.1 at 200–350 mm and SSS ≈0.5 for 9 and 10 December) and 72 h total (TS ≈0.1 at 700 mm and SSS ≈0.7). However, the rainfall simulation is less ideal for 11 December (TS drops to zero at thresholds ≥75 mm), which had less rainfall and is at a longer range (than the previous 2 d). Besides, the model also captured the southward movement of the main heavy rain band during the event, as seen in the observed data. In the sensitivity test of NTRN where the topography is removed, the model has poorly simulated the surface wind and did not capture the southward movement of the wind convergence zone. This led to the model producing a different rainfall pattern that was not along the coast as observed (and in CTRL), thus confirming the important role by the Truong Son Range in this event. In addition, the evaluation of simulation results also shows that the CReSS model has simulated the surface winds well, both in their direction and magnitude.
Generally, these results enhanced our knowledge about the mechanisms which cause the heavy rainfall in central Vietnam, as well as explained features of the D18 event. The above result also shows the promising capacity of the CReSS model for research and forecast of heavy rainfall in Vietnam. In a follow-up paper, a set of high-resolution time-lagged ensemble prediction is performed using the CReSS model, and the predictability of the D18 event will be evaluated.
The CReSS model used in this study and its user's guide are available at the model website at http://www.rain.hyarc.nagoya-u.ac.jp/~tsuboki/cress_html/src_cress/CReSS2223_users_guide_eng.pdf (last access: 1 May 2019; Tsuboki and Sakakibara, 2007).
The supplement related to this article is available online at: https://doi.org/10.5194/nhess-23-771-2023-supplement.
DVN prepared datasets, executed the model experiments, performed the analysis, and prepared the first draft of the manuscript. CCW also prepared the first draft and provided the funding, guidance and suggestions during the study, and they participated in the revision of the manuscript.
The contact author has declared that none of the authors has any competing interests.
Publisher’s note: Copernicus Publications remains neutral with regard to jurisdictional claims in published maps and institutional affiliations.
We thank Nguyen Tien Toan at Mid-central Regional Hydro-Meteorological Center, Vietnam for kindly providing the observed rainfall and radar data, as well as his comments. We acknowledge the free use of ECMWF ERA5 from Copernicus Climate Change Service (C3S) Climate Data Store (CDS) https://www.ecmwf.int/en/forecasts/datasets/reanalysis-datasets/era5 (last access: 14 June 2021). The Vietnam Gridded Precipitation rainfall dataset is available at http://danida.vnu.edu.vn/cpis/en/content/gridded-precipitation-data-of-vietnam.html (last access: 19 November 2019). The TRMM 3B42 satellite data are available from https://disc.gsfc.nasa.gov/datasets/TRMM_3B42_7/summary (last access: 10 December 2019). The IR1 Himawari images data are from the Central Weather Bureau, Taiwan at https://www.cwb.gov.tw (last access: 1 June 2019).
This study was supported by the National Science and Technology Council (NSTC) of Taiwan under grant nos. MOST 111-2111-M-003-005 and MOST 111-2625-M-003-001 and also by the Vietnam Institute of Meteorology, Hydrology and Climate Change under grant no. ĐTĐL.CN.119/21.
This paper was edited by Gregor C. Leckebusch and reviewed by two anonymous referees.
Akter, N. and Tsuboki, K.: Characteristics of Supercells in the Rainband of Numerically Simulated Cyclone Sidr, SOLA, 6A, 25–28, https://doi.org/10.2151/sola.6A-007, 2010.
Akter, N. and Tsuboki, K.: Numerical Simulation of Cyclone Sidr Using a Cloud-Resolving Model: Characteristics and Formation Process of an Outer Rainband, Mon. Weather Rev., 140, 789–810, https://doi.org/10.1175/2011MWR3643.1, 2012.
Bui, M. T.: Extratropical forcing of submonthly variations of rainfall in Vietnam, J. Climate, 32, 2329–2348, 2019.
Chen, T.-C., Tsay, J.-D., Yen, M.-C., and Matsumoto, J.: Interannual variation of the late fall rainfall in central Vietnam, J. Climate, 25, 392–413, 2012.
Communist Party of Vietnam Online Newspaper: https://dangcongsan.vn/xa-hoi/mua-lon-tai-mien-trung-la-bieu- hien-ro-ret-cua-bien-doi-khi-hau—507626.html (last access: 1 October 2022), 2018.
Cotton, W. R., Tripoli, G. J., Rauber, R. M., and Mulvihill, E. A.: Numerical simulation of the effects of varying ice crystal nucleation rates and aggregation processes on orographic snowfall, J. Appl. Meteorol. Clim., 25, 1658–1680, 1986.
Deardorff, J. W.: Stratocumulus-capped mixed layers derived from a three-dimensional model, Bound.-Lay. Meteorol., 18, 495–527, 1980.
Hersbach, H., Bell, B., Berrisford, P., Biavati, G., Horányi, A., Muñoz Sabater, J., Nicolas, J., Peubey, C., Radu, R., Rozum, I., Schepers, D., Simmons, A., Soci, C., Dee, D., and Thépaut, J.-N.: ERA5 hourly data on pressure levels from 1959 to present. Copernicus Climate Change Service (C3S) Climate Data Store (CDS), https://doi.org/10.24381/cds.bd0915c6, 2018a.
Hersbach, H., Bell, B., Berrisford, P., Biavati, G., Horányi, A., Muñoz Sabater, J., Nicolas, J., Peubey, C., Radu, R., Rozum, I., Schepers, D., Simmons, A., Soci, C., Dee, D., and Thépaut, J.-N.: ERA5 hourly data on single levels from 1959 to present, Copernicus Climate Change Service (C3S) Climate Data Store (CDS), https://doi.org/10.24381/cds.adbb2d47, 2018b.
Huffman, G. J., Bolvin, D. T., Nelkin, E. J., and Adler, R. F.: TRMM (TMPA) Precipitation L3 1 day 0.25 degree x 0.25 degree V7 (TRMM_3B42_Daily), edited by: Savtchenko, A., Goddard Earth Sciences Data and Information Services Center (GES DISC), https://doi.org/10.5067/TRMM/TMPA/DAY/7, 2016.
Ikawa, M. and Saito, K.: Description of a non-hydrostatic model developed at the Forecast Research Department of the MRI, MRI Technical report 28, Japan Meteorological Agency, Tsukuba, Japan, ISSN: 0386-4049, 1991.
Kondo, J.: Heat balance of the China Sea during the air mass transformation experiment, J. Meteorol. Soc. Jpn., 54, 382–398, https://doi.org/10.2151/jmsj1965.54.6_382, 1976.
Lin, Y.-L., Farley, R. D., and Orville, H. D.: Bulk parameterization of the snow field in a cloud model, J. Appl. Meteorol. Clim., 22, 1065–1092, 1983.
Louis, J. F., Tiedtke, M., and Geleyn, J. F.: A short history of the operational PBL parameterization at ECMWF, in: Proceedings of Workshop on Planetary Boundary Layer Parameterization, 25–27 November 1981, Shinfield Park, Reading, UK, 59–79, 1982.
Murakami, M.: Numerical modeling of dynamical and microphysical evolution of an isolated convective cloud – the 19 July 1981 CCOPE cloud, J. Meteorol. Soc. Jpn., 68, 107–128, 1990.
Murakami, M., Clark. T. L., and Hall, W. D.: Numerical simulations of convective snow clouds over the Sea of Japan: Two-dimensional simulation of mixed layer development and convective snow cloud formation, J. Meteorol. Soc. Jpn. 72, 43–62, 1994.
Nguyen-Le, D. and Matsumoto, J.: Delayed withdrawal of the autumn rainy season over central Vietnam in recent decades. Int. J. Climatol., 36, 3002–3019, 2016.
Nguyen-Thi, H. A., Matsumoto, J., Ngo-Duc, T., and Endo, N.: Long-term trends in tropical cyclone rainfall in Vietnam. J. Agrofor. Environ., 6(2), 89–92, 2012.
Nguyen-Xuan, T., Ngo-Duc, T., Kamimera, H., Trinh-Tuan, L., Matsumoto, J., Inoue, T., and Phan-Van, T.: The Vietnam Gridded Precipitation (VnGP) Dataset: Construction and validation, SOLA, 12, 291–296, https://doi.org/10.2151/sola.2016-057, 2016.
Ohigashi, T. and Tsuboki, K.: Shift and intensification processes of the Japan-Sea Polar-Airmass Convergence Zone associated with the passage of a mid-tropospheric cold core, J. Meteorol. Soc. Jpn., 85, 633–662, 2007.
Segami, A., Kurihara, K., Nakamura, H., Ueno, M., Takano, I., and Tatsumi, Y.: Operational mesoscale weather prediction with Japan Spectral Model, J. Meteorol. Soc. Jpn., 67, 907–924, https://doi.org/10.2151/jmsj1965.67.5_907, 1989.
Takahashi, H. G., Yoshikane, T., Hara, M., and Yasunari, T.: High-resolution regional climate simulations of the longterm decrease in September rainfall over Indochina, Atmos. Sci. Let., 10, 14–18, https://doi.org/10.1002/asl.203, 2009.
Tran, T., Nguyen, V. T., Huynh, T. L. H., Mai, V. K., Nguyen, X. H., and Doan, H. P.: The Climate Change and Sea Level Rise Scenarios for Viet Nam, The Ministry of Natural Resources and Environment, 170 pp., 2016.
Tsuboki, K. and Sakakibara, A.: Large-Scale Parallel Computing of Cloud Resolving Storm Simulator, in: High Performance Computing. ISHPC 2002, edited by: Zima, H. P., Joe, K., Sato, M., Seo, Y., and Shimasaki, M., Lecture Notes in Computer Science, Vol. 2327, Springer, Berlin, Heidelberg, https://doi.org/10.1007/3-540-47847-7_21, 2002.
Tsuboki, K. and Sakakibara, A.: Numerical Prediction of HighImpact Weather Systems: The Textbook for the Seventeenth IHP Training Course in 2007, Hydrospheric Atmospheric Research Center, Nagoya University, Nagoya, Japan, and UNESCO, Paris, France, 273 pp., http://www.rain.hyarc.nagoya-u.ac.jp/~tsuboki/cress_html/src_cress/CReSS2223_users_guide_eng.pdf (last access: 1 May 2019), 2007.
Tuoi Tre news: https://tuoitre.vn/mien-trung-tiep-tuc-mua-lon- 14-nguoi-chet-va-mat-tich-20181212201907413.htm (last access: 10 March 2019), 2018.
van der Linden, R., Fink, A. H., Phan-Van, T., and Trinh-Tuan, L.: Synoptic-dynamic analysis of early dry-season rainfall events in the Vietnamese central highlands, Mon. Weather Rev., 144, 1509–1527, https://doi.org/10.1175/MWR-D-15-0265.1, 2016.
Vu, V. T., Nguyen, T. H., Nguyen, V. T., Nguyen, V. H., Pham, T. T. H., and Nguyen, T. L.: Effects of ENSO on Autumn Rainfall in Central Vietnam, Adv. Meteorol., 2015, 264373, https://doi.org/10.1155/2015/264373, 2015.
Wang, C.-C., Lin, B.-X., Chen, C.-T., and Lo, S.-H.: Quantifying the effects of long-term climate change on tropical cyclone rainfall using cloud-resolving models: Examples of two landfall typhoons in Taiwan, J. Climate, 28, 66–85, https://doi.org/10.1175/JCLI-D-14-00044.1, 2015.
Wang, C. G., Liang, J., and Hodges, K. I.: Projections of tropical cyclones affecting Vietnam under climate change: Downscaled HadGEM2-ES using PRECIS 2.1, Q. J. Roy. Meteor. Soc., 143, 1844–1859, https://doi.org/10.1002/qj.3046, 2017.
Wang, C.-C., Tsai, C.-H., Jou, B. J.-D., and David, S. J.: Time-Lagged Ensemble Quantitative Precipitation Forecasts for Three Landfalling Typhoons in the Philippines Using the CReSS Model, Part I: Description and Verification against Rain-Gauge Observations, Atmosphere, 13, 1193, https://doi.org/10.3390/atmos13081193, 2022.
Wilks, D. S.: Statistical Methods in the Atmospheric Sciences, Academic Press, 648 pp., ISBN 13: 978-0-12-751966-1, 10: 0-12-751966-1, 2006.
Wu, P., Fukutomi, Y., and Matsumoto, J.: The impact of intraseasonal oscillations in the tropical atmosphere on the formation of extreme central Vietnam precipitation, SOLA, 8, 57–60, https://doi.org/10.2151/sola.2012-015, 2012.
Yamada, H., Geng, B., Uyeda, H., and Tsuboky, K.: Role of the Heated Landmass on the Evolution and Duration of a Heavy Rain Episode over a Meiyu-Baiu Frontal Zone, J. Meteorol. Soc. Jpn., 85, 687–709, 2007.
Yen, M. C., Chen, T.-C., Hu, H.-L., Tzeng, R.-Y., Dinh, D. T., Nguyen, T. T. T., and Wong, C. J.: Interannual variation of the fall rainfall in Central Vietnam, J. Meteorol. Soc. Jpn., 89A, 259–270, https://doi.org/10.2151/jmsj.2011-A16, 2010.
Yokoi, S. and Matsumoto, J.: Collaborative effects of cold surge and tropical depression–type disturbance on heavy rainfall in central Vietnam, Mon. Weather Rev., 136, 3275–3287, https://doi.org/10.1175/2008MWR2456.1, 2008.