the Creative Commons Attribution 4.0 License.
the Creative Commons Attribution 4.0 License.
 | 15 Feb 2023
Increased spatial extent and likelihood of compound long-duration dry and hot events in China, 1961–2014
Douglas Maraun
Albert Ossó
Jianping Tang
Compound dry and hot events can cause aggregated damage compared with isolated hazards. Although increasing attention has been paid to compound dry and hot events, the persistence of such hazards is rarely investigated. Moreover, little attention has been paid to the simultaneous evolution process of such hazards in space and time. Based on observations during 1961–2014, the spatiotemporal characteristics of compound long-duration dry and hot (LDDH) events in China during the summer season are investigated on both a grid basis and a 3D event basis. Grid-scale LDDH events mainly occur in eastern China, especially over northeastern areas. Most regions have experienced a pronounced increase in the likelihood of LDDH events, which is dominated by increasing temperatures. From a 3D perspective, 146 spatiotemporal LDDH (SLDDH) events are detected and grouped into 9 spatial patterns. Over time, there is a significant increase in the frequency and spatial extent of SLDDH events. Consistent with the grid-scale LDDH events, hotspots of SLDDH events mainly occur in northern China, such as the Northeast China, North China and Qinghai clusters, which are accompanied by a high occurrence frequency and large affected areas greater than 300 000 km2.
- Article
(10540 KB) - Full-text XML
- BibTeX
- EndNote


Extreme weather and climate events such as droughts and heat waves are commonly analyzed in terms of univariate statistics like dry spells and heat wave intensity (Dosio et al., 2018; Trenberth et al., 2014). However, extreme events often result from a combination of interacting drivers and hazards. Such compound events can lead to more severe environmental and societal impacts than single hazards (Leonard et al., 2014; Zscheischler et al., 2020). Therefore, traditional risk assessment considering single drivers may substantially underestimate the associated risks (Raymond et al., 2020). A typical compound event in almost all regions of the world is compound dry and hot (DH) events, which have devastating effects on agricultural production, water security and human health (Pfleiderer et al., 2019; Zscheischler and Fischer, 2020).
Compound dry and hot events have received increasing attention in recent years. Both observations and model simulations suggest more frequent compound hot and dry conditions in recent decades across the entire globe (Hao et al., 2018; Sarhadi et al., 2018). At the regional scale, a substantial increase in concurrent dry and hot extremes has been observed in the United States (Alizadeh et al., 2020; Mazdiyasni and AghaKouchak, 2015), India (Sharma and Mujumdar, 2017), Europe (Manning et al., 2019; Sutanto et al., 2020) and China (Chen et al., 2019; Li et al., 2019; Lu et al., 2018). There is strong evidence that future global warming will lead to a higher likelihood of compound dry and hot summers (Coffel et al., 2019; Sarhadi et al., 2018; Zscheischler and Seneviratne, 2017).
Most previous studies focus on the occurrence frequency and severity of compound dry and hot events. However, the persistence of compound extremes is rarely investigated. Prolonged periods of dry and hot conditions, such as those over Europe in 2018, can increase the risks of soil moisture droughts and wildfires and cause tremendous adverse impacts on agriculture and society (Manning et al., 2018). Given the severe impact of persistent extremes, effective risk management requires a comprehensive assessment of the characteristics and possible changes in such long-duration extreme events. Previous studies indicate that summer weather has become more persistent over recent decades due to anomalous atmospheric circulation patterns and global warming (Coumou and De Luca, 2020; Pfleiderer et al., 2019). More long-duration extremes have been observed recently (Breinl et al., 2020; Kornhuber et al., 2019; Zscheischler and Fischer, 2020). It is not yet clear whether the characteristics of persistent compound dry and hot events have changed in the past decades and what the potential drivers are. Furthermore, most studies identify compound dry and hot conditions using accumulated precipitation deficits at monthly or seasonal timescales, for instance, with the standardized precipitation index (SPI; Mckee et al., 1993), which does not quantify the duration of the events. While recent work by Yu and Zhai (2020) highlighted an increased persistence of compound dry and hot events averaged across China, the regional patterns and the potential drivers of change for the occurrence of compound long-duration dry and hot (LDDH) events in China remain unexplored.
Moreover, existing studies mainly identify DH events at individual stations or grid points, based on which they estimate the regional characteristics of DH events. But extreme events such as droughts and heat waves are not local (grid-point) phenomena and generally have a specific impacted area and duration (Ren et al., 2012, 2018). There is a lack of systematic research on the spatial characteristics (3D structure) of compound dry and hot events. An event-based identification of spatiotemporal LDDH (SLDDH) events could facilitate tracking the daily spatiotemporal dynamics of SLDDH events and understanding the associated physical drivers. The detection of SLDDH events needs data with sufficient resolution that provide large-scale climate information, such as satellite measurements and large weather station networks. Further, while few studies have found a significant increase in the spatial extent of compound dry and hot events in different regions of the world (Sharma and Mujumdar, 2017; Yu and Zhai, 2020), they focus on DH events at specific stations or grid points and consider the spatial extent as the fraction of land covered (not necessarily contiguously). The spatial extent, specifically, of contiguous areas simultaneously affected by a DH event (Vogel et al., 2020), is rarely examined.
Here we analyze the spatial and temporal variations in the compound long-duration dry and hot events over China on both a grid basis and a 3D event basis. Following Manning et al. (2019), we define compound long-duration dry and hot events at a grid scale as extended dry periods that co-occur with extreme temperatures. This definition using a daily time step allows us to better understand the features of individual events. Spatiotemporal compound long-duration dry and hot events are detected and quantified, considering both the spatial and temporal coherence of concurrent dry and hot processes.
2.1 Data
The daily precipitation and daily maximum temperature (Tmax) from the homogenized gridded observational dataset CN05.1 are used to identify and characterize LDDH events from 1961 to 2014 (Wu and Gao, 2013). This dataset is based on interpolations from 2416 meteorological stations across China and has a spatial resolution of 0.25∘. It has been widely applied for model evaluation and climate change detection (Yang et al., 2019b; Zhou et al., 2016). Note that the station density in western China is lower than in eastern China, leading to a great uncertainty in this region, with the largest uncertainty over the northern part of the Tibetan Plateau and Taklimakan Desert in southern Xinjiang (Peng and Zhou, 2017; Wu and Gao, 2013).
2.2 Event definition
2.2.1 Grid-scale compound long-duration dry and hot events
We identify LDDH events locally following the definition by Manning et al. (2019). Long-duration dry and hot events are persistent dry spells accompanied by extremely hot temperatures and can be characterized by their duration (DUR) and magnitude (MAG). Here DUR is the number of consecutive days with precipitation below 1 mm, and the MAG of each event is the hottest daily maximum temperature during the dry period. Thus, for each dry spell, there is a (DUR, MAG) pair. DUR is similar to the CDD definition (consecutive dry days; Sillmann et al., 2013), while MAG is similar to TXx (maximum value of daily maximum temperature; Alexander et al., 2006) and HWA (heat wave amplitude; Perkins and Alexander, 2013). To account for regional differences, in each grid cell, the concurrent exceedances of DUR and MAG above the individual 95th percentiles (i.e., DUR95 and MAG95) during 1961–2014 are defined as compound long-duration dry and hot events.
Our definition of persistent meteorological droughts using a percentile threshold of the number of consecutive dry days is consistent with previous studies. For example, using the 80th percentile of dry-spell duration, Raymond et al. (2016) revealed the spatiotemporal characteristics of prolonged dry spells in the Mediterranean and analyzed the associated synoptic atmospheric conditions (Raymond et al., 2018). Zhang et al. (2019) gave a definition based on the CDD 95th percentile for the extreme drought in northern China. Building on previous work on persistent meteorological droughts, we introduce a high temperature threshold (MAG95) to identify compound long-duration dry and hot conditions. Our results are not sensitive to the choice of climatological periods and percentile thresholds used to define the LDDH events (not shown). We focus our analysis on LDDH events in boreal summer (June, July and August) because of their high frequency and severe socioeconomic effects during this season (Ridder et al., 2020).
Once grid-scale LDDH events are identified, five metrics are calculated for each year and each grid box. These include the following:
-
count – the number of LDDH events occurring in a year,
-
duration – the annual average DUR across events in each year,
-
magnitude – annual average MAG across events in each year,
-
total days – the total number of LDDH days within a year and
-
timing – the annual average onset date across events in each year.
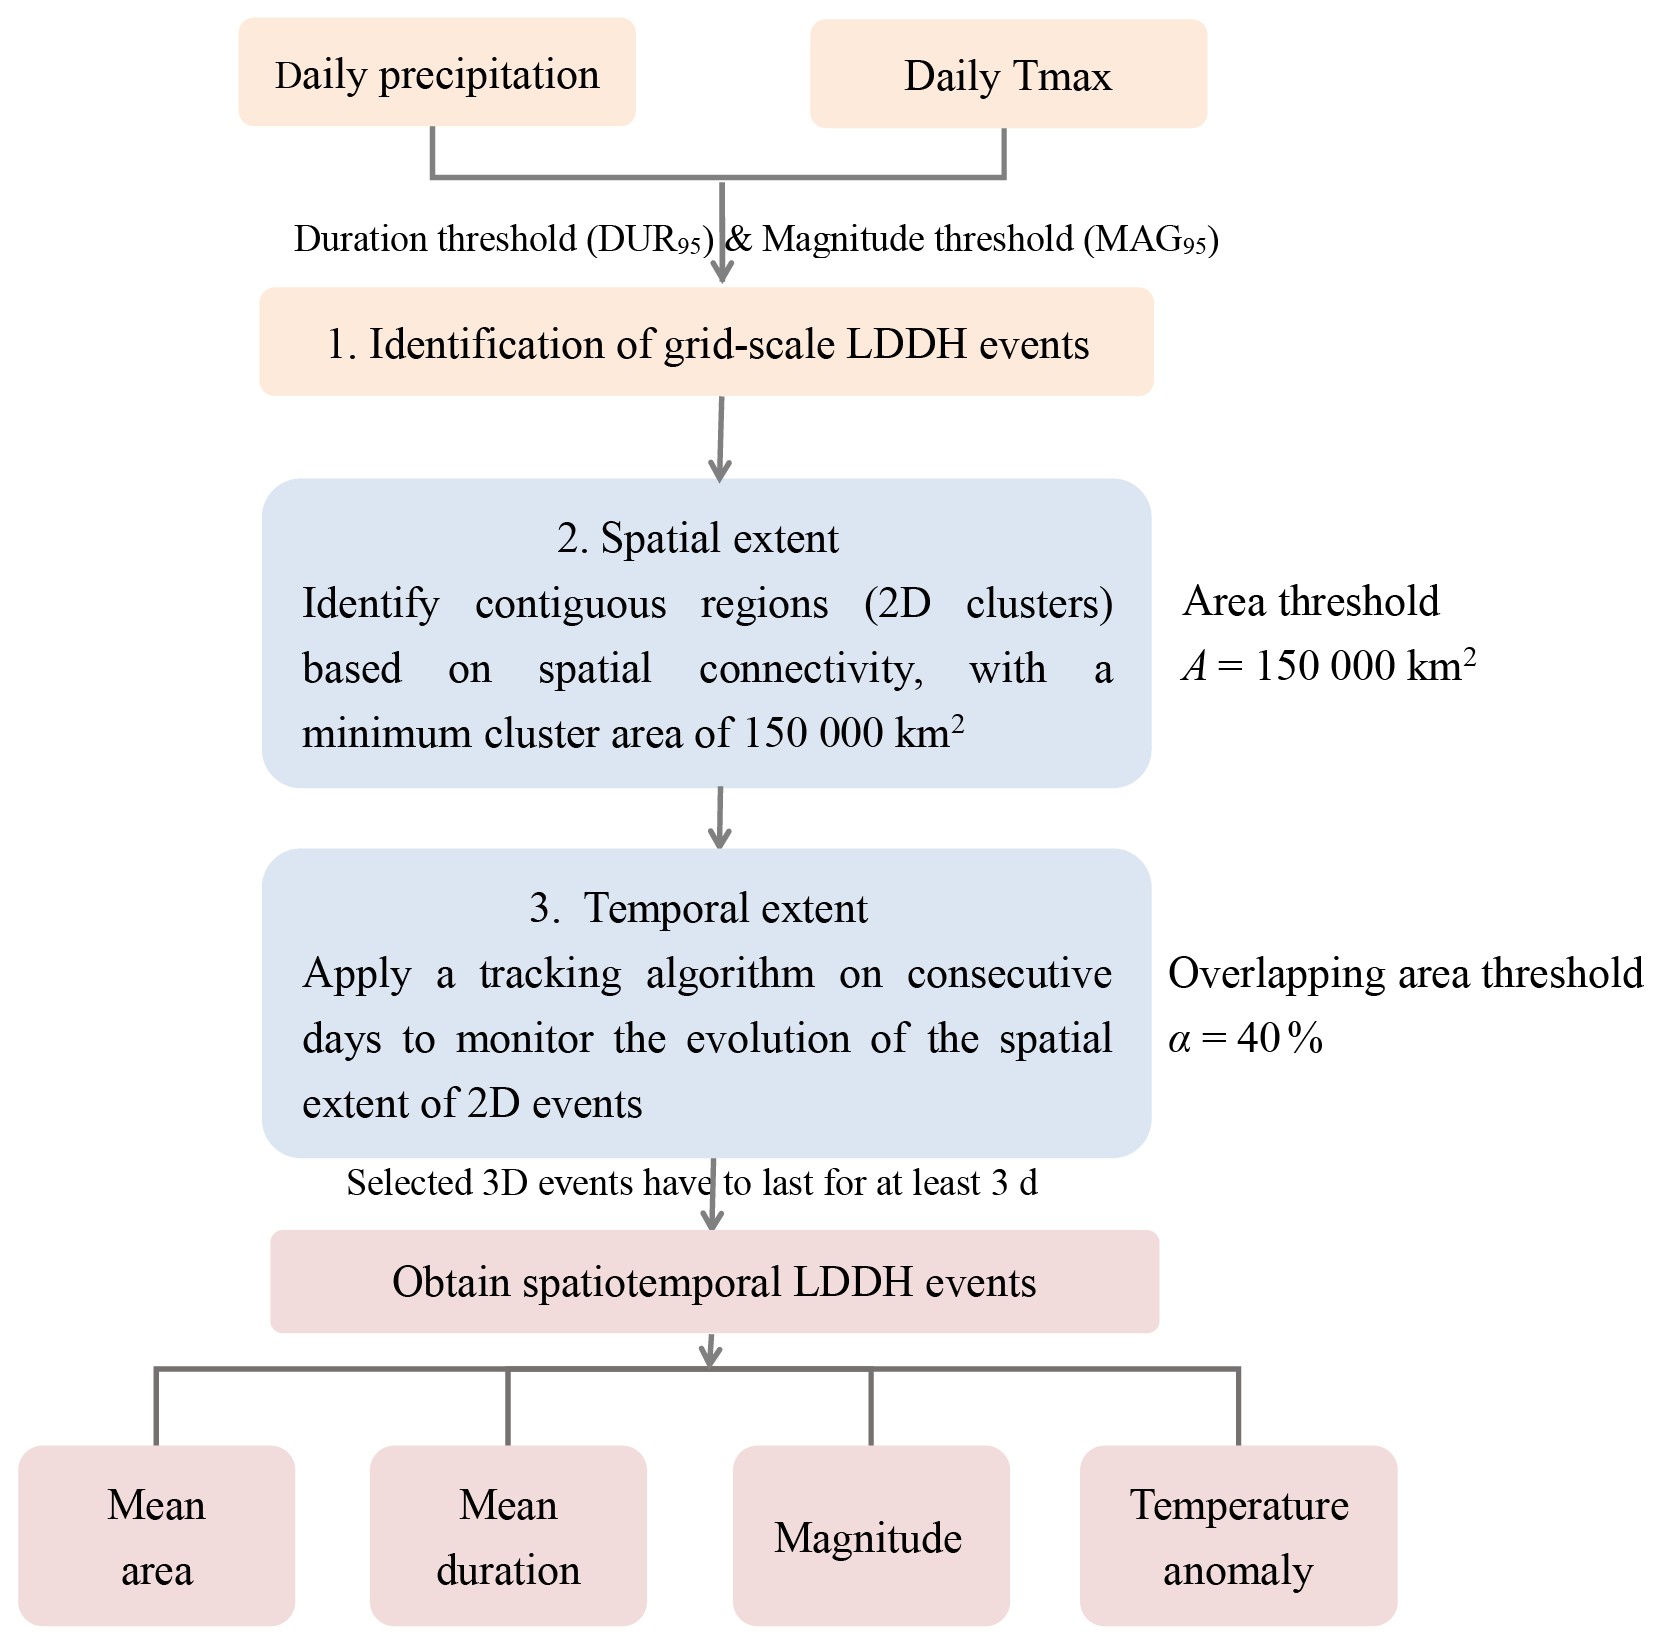
Figure 1Flow chart for the identification of spatiotemporal compound long-duration dry and hot events.
2.2.2 Spatiotemporal compound long-duration dry and hot events
When considering extreme events as a spatiotemporal phenomenon covering certain spatial areas over a period, a spatiotemporal compound long-duration dry and hot event is defined as a contiguous dry and hot region that lasts for several consecutive days. This approach allows for tracking the development of the spatiotemporal LDDH events. First, the LDDH events are identified for each grid point, and then we consider the spatial coherence and temporal persistence of these events to identify SLDDH events. This algorithm is similar to the detection approach of regional drought proposed by Andreadis et al. (2005) and regional heat wave provided by Stefanon et al. (2012) and Lyon et al. (2019). The detailed detection approach is as follows (Fig. 1):
-
Hazard thresholds. The grid-scale LDDH events are detected according to Sect. 2.2.1 as the joint exceedances of the thresholds DUR95 and MAG95.
-
Spatial extent. For each day, spatially contiguous dry and hot regions (2D clusters) are identified by applying the connected components algorithm in the R package wvtool (Sugiyama and Kobayashi, 2016). A minimum area threshold A of 150 000 km2 is used to eliminate the influence of small-scale extremes (Andreadis et al., 2005; Sheffield et al., 2009). This area threshold is determined through sensitivity analysis (A= 50 000, 100 000, 150 000, 200 000 km2) and in line with drought studies in China based on soil moisture (Wang et al., 2011) and PDSI (Palmer Drought Severity Index; Shao et al., 2018).
-
Temporal extent. The contiguous regions under concurrent dry and hot conditions are tracked through time by looking at overlapping areas between 2D clusters on consecutive days. If the overlap is greater than 40 %, the clusters are considered one single event. We have tested different overlapping area thresholds α ranging from 35 % to 45 % and found little difference among different choices of α. As in Lopez et al. (2018), a minimum of 3 consecutive days of SLDDH events is required to exclude short-duration events.
Characteristics such as the mean impacted area, mean duration, magnitude and temperature anomaly are quantified for each spatiotemporal LDDH event. The mean impacted area is defined as the average daily spatial extent throughout the lifespan of an event. Mean duration is computed as the duration averaged across all grid points contributing to the SLDDH event. The magnitude and temperature anomaly of the SLDDH events are calculated as the average daily extreme high temperature and average daily high-temperature intensity, respectively. The extreme high temperature is the Tmax averaged over all grid points of the event, and the daily high-temperature intensity is the average of Tmax exceeding the 1961–2014 daily climatology across all grid points within the event, both of which are calculated for each day of the SLDDH events.
2.3 Cluster analysis
Cluster analysis is widely used to classify extreme events (Aladaileh et al., 2019; Lopez et al., 2018; Stefanon et al., 2012; Wang et al., 2018). Here we apply a hierarchical clustering algorithm (Rokach and Maimon, 2005) to identify clusters of SLDDH events over China following their geographical location and analyze their associated characteristics. The clustering is based on Euclidean distance with the Ward criterion, which minimizes the intracluster variance (Raymond et al., 2016; Ward, 1963). The final number of clusters is determined according to the intracluster distance and silhouette coefficient index (Kaufman and Rousseeuw, 2009).
2.4 Return periods
The return period (RP) is an important way to quantify the risk of extreme events (Salas and Obeysekera, 2014). For compound events, a multidimensional RP is required. Here the bivariate return period of LDDH events is calculated using the “AND” case, representing the average waiting time between events where both duration and magnitude exceed the respective thresholds (i.e., DUR95 and MAG95). A parametric copula-based bivariate probability distribution developed by Bevacqua et al. (2019) is applied to selected events with DUR and MAG that are simultaneously high, using the respective thresholds DURsel and MAGsel (90th percentiles). As in Manning et al. (2019), locations with a small sample size (fewer than 20 events) are not analyzed. These cases are found in some parts of the Tibetan Plateau. The bivariate return period is calculated as
where μ is the average interarrival time between the selected events. FDUR and FMAG are the marginal cumulative distribution functions (CDFs) of DUR and MAG exceeding the selection threshold, respectively, while FDM is the joint probability distribution of DUR and MAG. C is the copula (Serinaldi, 2015) describing the dependence between the selected (DUR, MAG) pairs.
At each grid point, we select an appropriate copula to model the dependence structure based on the Akaike information criterion (Akaike, 1974) with the R package VineCopula (Schepsmeier et al., 2016); 10 possible copula families are considered: Gaussian, t, Clayton, Gumbel, Frank, Joe, BB1, BB6, BB7 and BB8. The marginal distributions of duration and magnitude above the selection thresholds are modeled with an exponential distribution and generalized Pareto distribution, respectively. The goodness of fit of copulas and marginals is tested according to the Cramér–von Mises statistic (Genest et al., 2009).
2.5 Partitioning of return period variations
Using the method proposed by Bevacqua et al. (2019), three experiments are used to assess the contribution of changes in event (1) duration and (2) magnitude and (3) their dependence on the changes in the return period. This method has been successfully applied to attribute changes in DH events (Manning et al., 2019) and compound flooding (Bevacqua et al., 2020) regarding their underlying drivers. As in previous studies (Kong et al., 2020; Manning et al., 2019; Sharma and Mujumdar, 2017), available records are divided into two halves to quantify the changes in past decades: 1961–1987 (ref, reference period) and 1988–2014 (pres, present period). For experiment i, the relative change in the return period is given as
where RPref and are the return periods for the reference period and each experiment, respectively. Experiment 1 only considers the variation in the overall marginal distribution of duration from the reference to the present period. Given the variables DURref and DURpres, we first obtain DURexp 1, which has the marginal distribution of DUR in the present period using ), where and are the empirical CDFs. Then we compute the return period based on (DURexp 1, MAGref) with Eq. (1). The effect of changes in magnitude distribution (experiment 2) can be calculated similarly. In experiment 3, we define and . Thus DURexp 3 and MAGexp 3 share the same Spearman correlation and tail dependence with that of the present, but the marginal distribution is that during the reference period. The joint probability using DURexp 3 and MAGexp 3 allows us to illustrate how the changes in the dependence structure influence the likelihood variations. The significance of the return period changes is identified by comparing with the 90 % confidence interval of RPref due to natural variability. This confidence interval is estimated with a bootstrap approach (Bevacqua et al., 2020; Guerreiro et al., 2018; Manning et al., 2019) by resampling the calendar years of precipitation and Tmax bivariate time series 1000 times, which could preserve the autocorrelation of the variables.
3.1 Grid-scale compound long-duration dry and hot events
3.1.1 Spatial and temporal characteristics
Figure 2 shows the spatial pattern of climatological summertime frequency, duration, magnitude, total days and onset timing of grid-scale LDDH events during 1961–2014. Large spatial variations are prevalent in the frequency of LDDH events, with higher occurrences in eastern than in western China. Grid-scale LDDH events occur most frequently over northeastern China and, to a lesser extent, along the middle and lower reaches of the Yangtze River basin (YRB). The duration of LDDH events increases from southeastern to northwestern China (Fig. 2b). Although with a relatively low occurrence frequency, LDDH events in Northwest China are most persistent, with a duration of more than 60 d. Durations are shorter on the southeastern coast (around 7 d). Regarding the temperature magnitude of the LDDH events (Fig. 2c), higher values are located in Northwest China, followed by central-eastern China, whereas the Tibetan Plateau with high altitudes has lower temperatures. The total number of LDDH days (Fig. 2d) is heterogeneously distributed across the country, with the northern regions and the YRB experiencing relatively more concurrent dry and hot days.
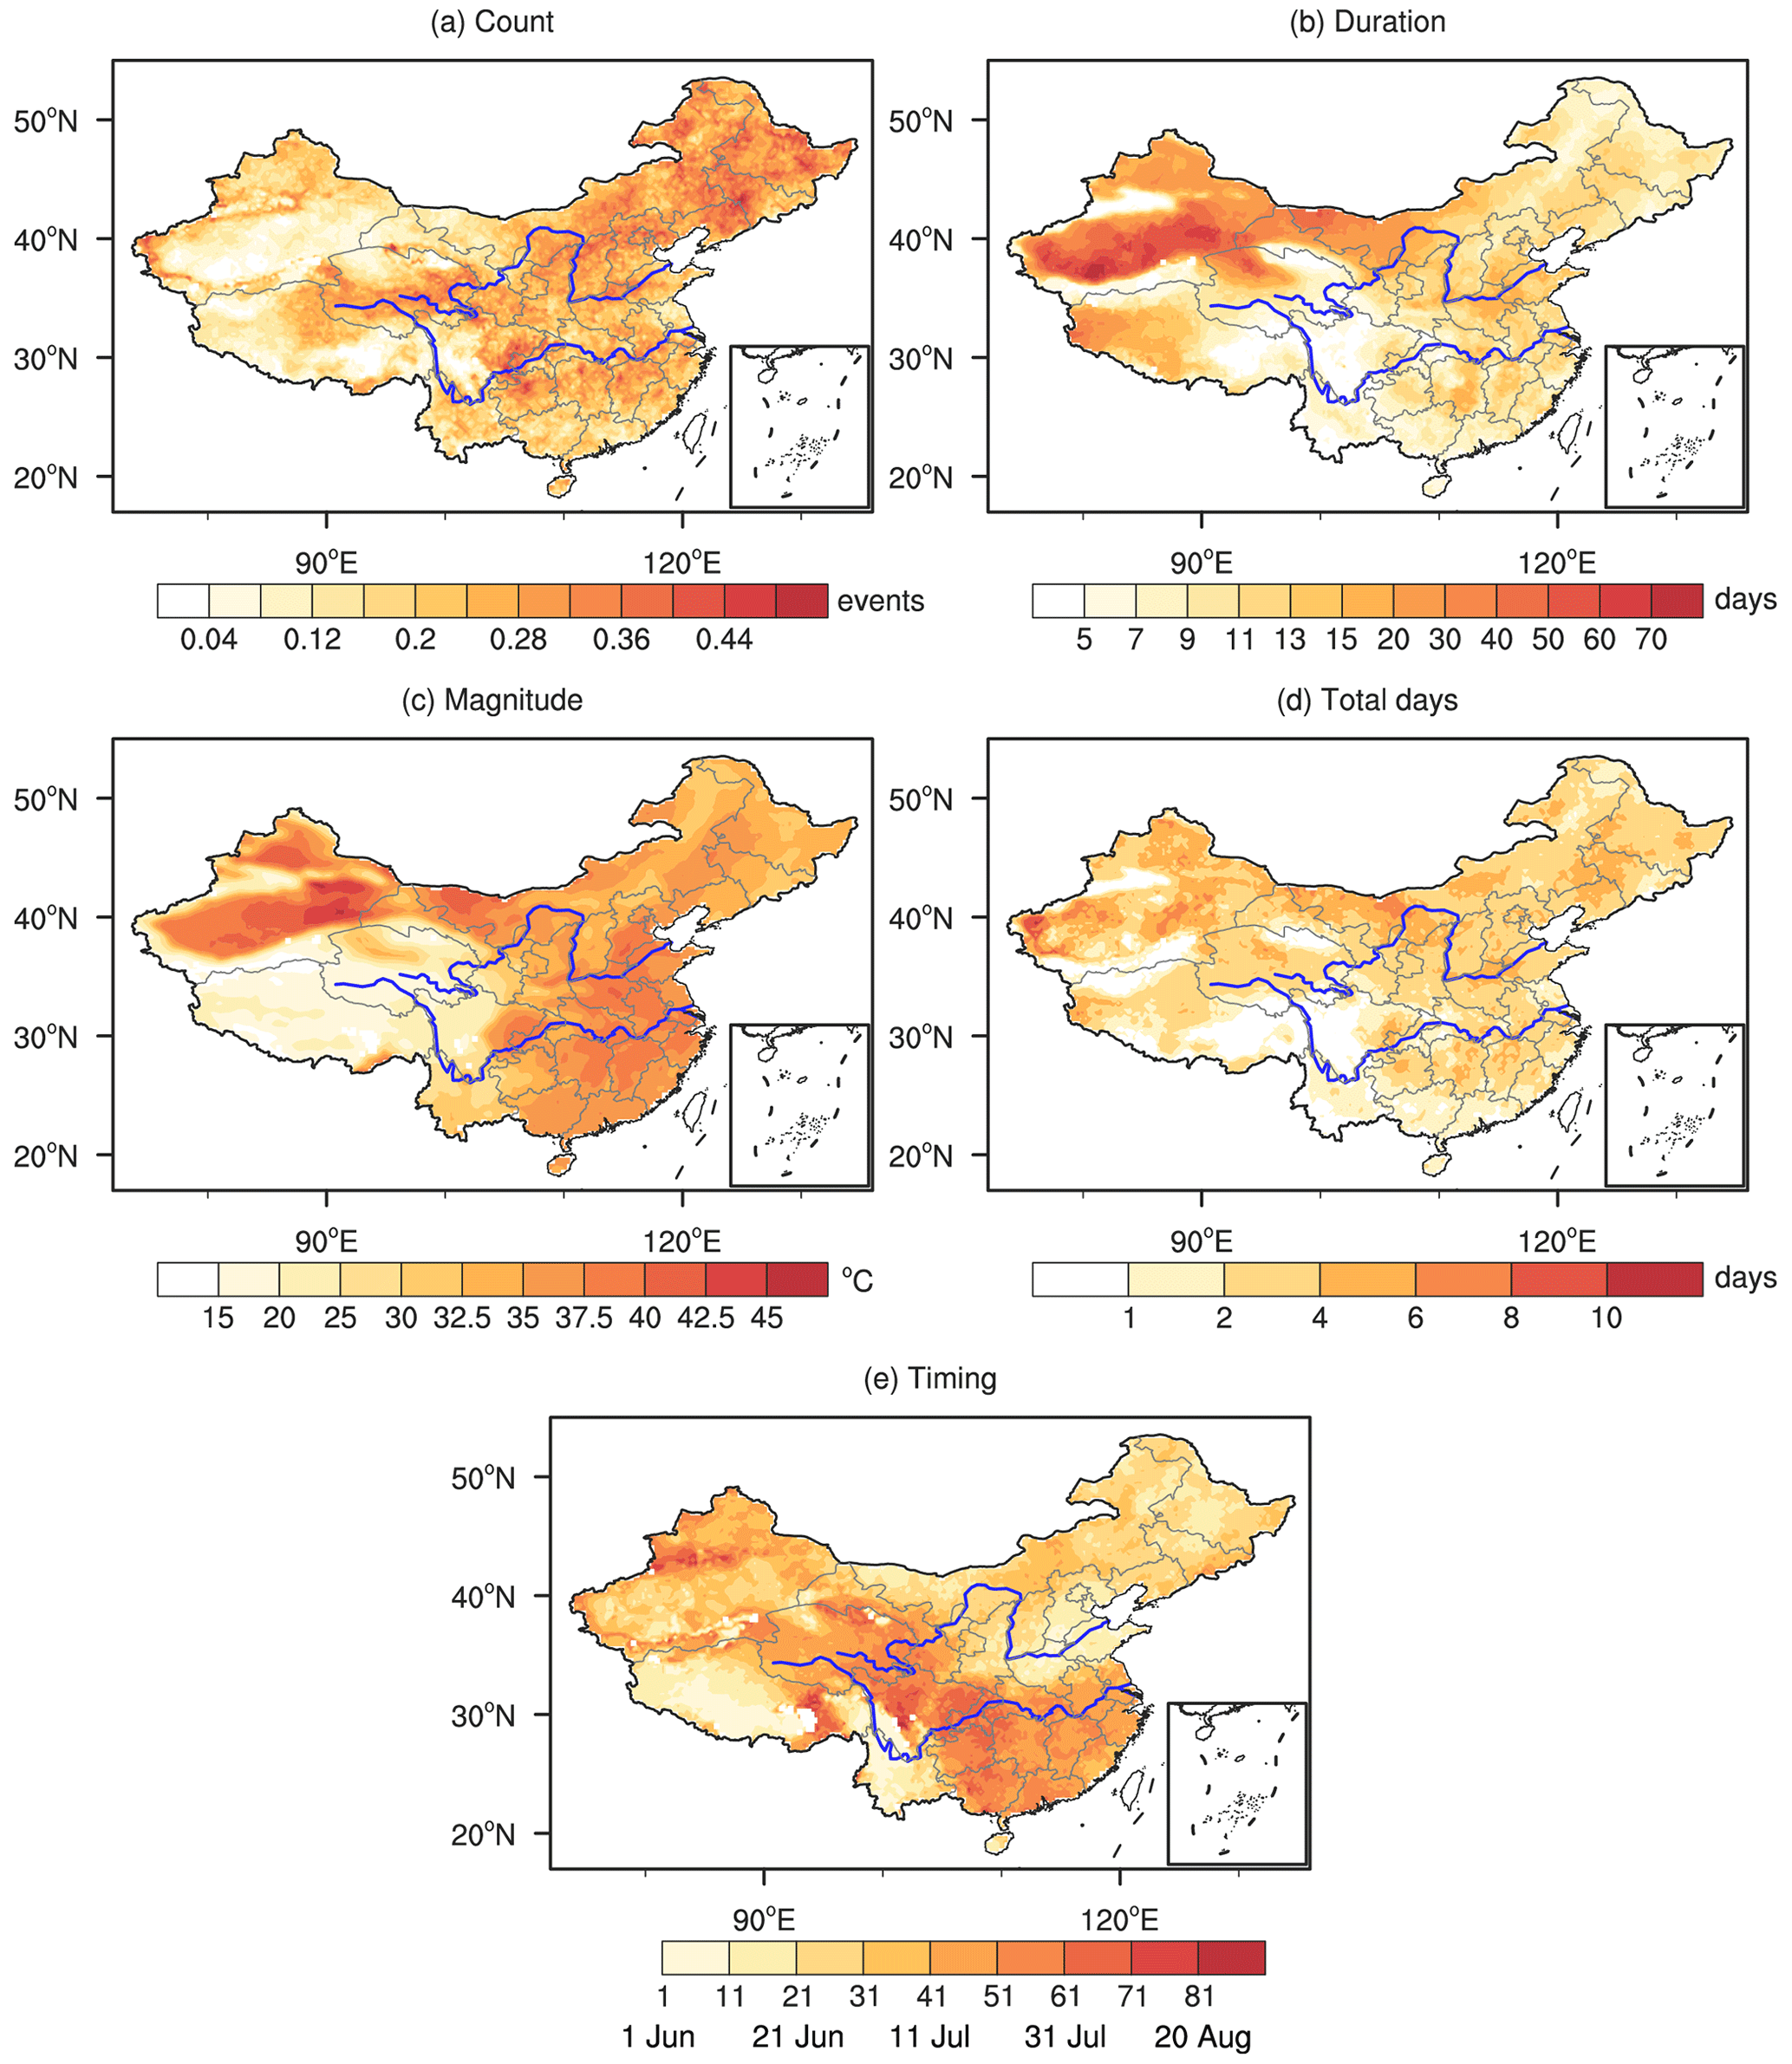
Figure 2Maps of characteristics of grid-scale compound long-duration dry and hot events in the study area. Shown are the annual mean (a) number of events, (b) duration, (c) magnitude, (d) total number of days and (e) onset timing over the period 1961–2014. The timing is represented as the days since 1 June and 1 corresponds to 1 June.
There are pronounced differences in the onset timing of LDDH events in summer (Fig. 2e). In Yunnan and North China, grid-scale LDDH events, on average, start in early and mid June. Relatively late occurrence of LDDH events is found over the Yangtze River basin, where the concurrent extremes generally start in mid-to-late July. This is consistent with the northward advance of the East Asian summer monsoon (Ding and Chan, 2005). With the rain belt located in northern China, the Yangtze River basin is under the control of the western Pacific subtropical high, which is conducive to the formation and development of extreme high temperatures and drought (Li et al., 2015; Wang et al., 2016). The results compare well with those based on gauge observations (not shown), confirming the validity of the gridded dataset for this analysis.
The spatial distribution of linear trends of the grid-scale LDDH event number and total days from 1961 to 2014 is presented in Fig. 3. Most parts of China have experienced an increased occurrence of compound long-duration dry and hot events (Fig. 3a). The largest increase has occurred in Northeast China, Inner Mongolia, Yunnan in Southwest China and the coastal area of southeastern China. Conversely, the grid-scale LDDH event frequency decreases over western Northwest China and central-eastern China. This agrees with Zhang and Zhou (2015), who have found a decrease in drought conditions over Northwest China since the 1950s. Similar results have been reported by Li et al. (2019), which identified DH events in Northwest China based on a monthly drought index using station data. The trend distribution of LDDH days (Fig. 3b) largely mirrors that of the number of LDDH events, with an increasing trend in most areas. Averaged across the whole country, both the number of events and LDDH days exhibit a statistically significant increasing trend over China (Fig. 3c–d), indicating that persistent DH events have become more frequent.
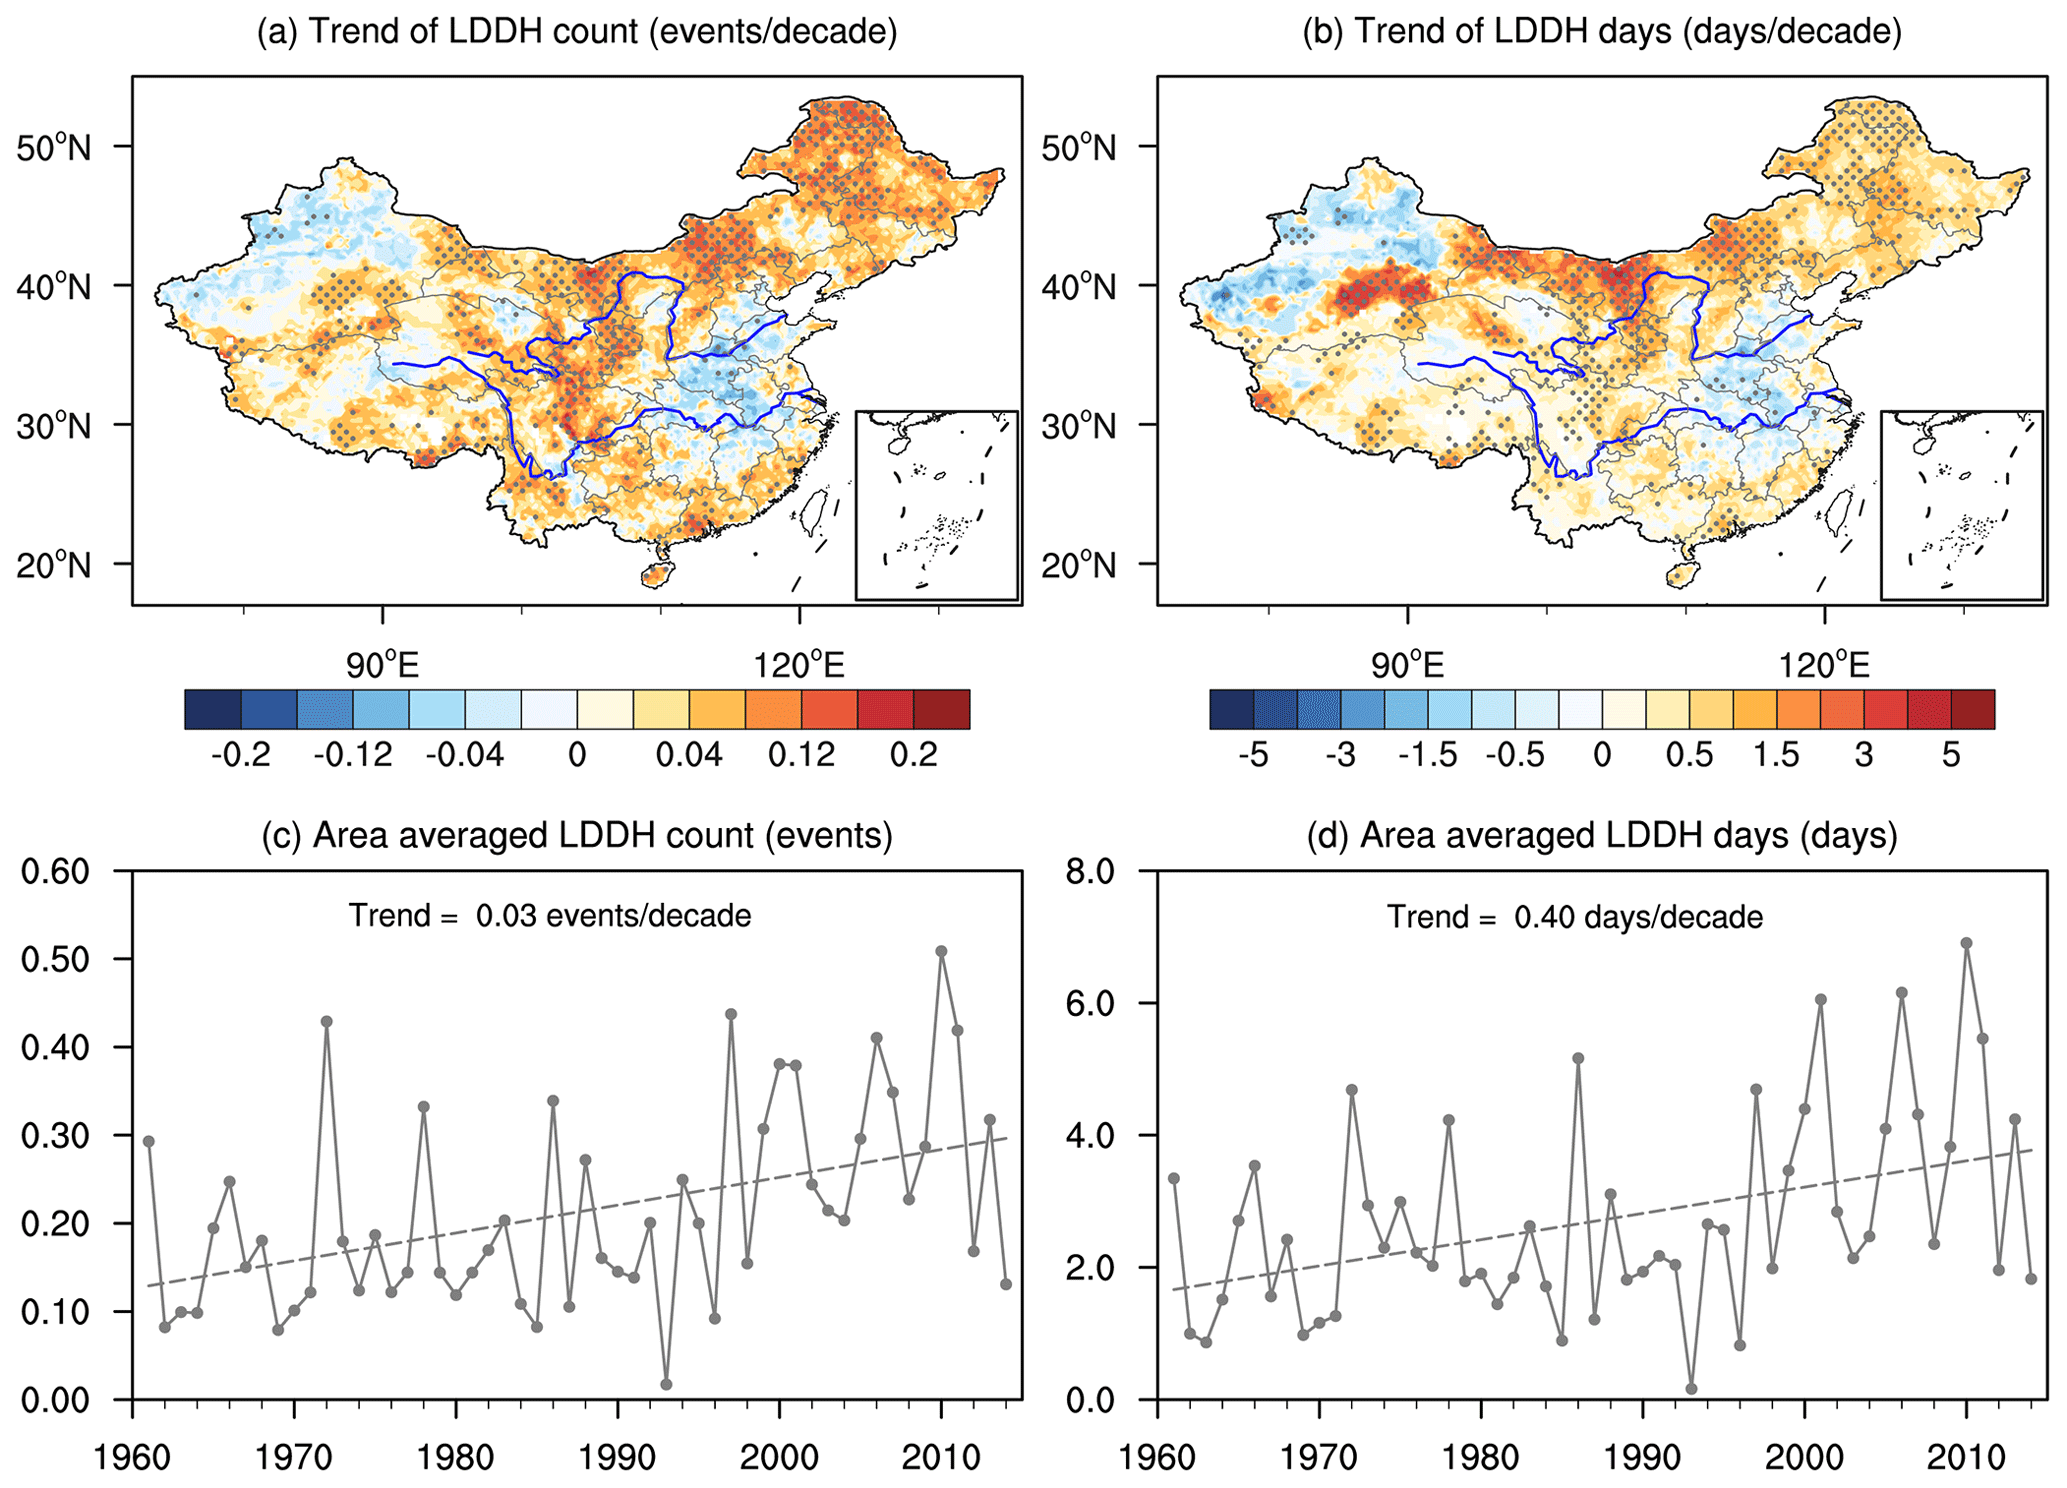
Figure 3Trends in the seasonal number of grid-scale (a) LDDH events and (b) LDDH days over the period 1961–2014. Stippling denotes statistically significant trends at the 90 % confidence level. Regionally averaged time series of annual mean LDDH event (c) count and (d) total days. The dashed line shows the linear trend.
3.1.2 Changes in the LDDH event probability and drivers of changes
In this section, we investigate the occurrence probability of grid-scale LDDH events using a multivariate framework following Manning et al. (2019). We divide the observations into two halves to assess whether compound extremes have changed in the past decades. The geographical occurrence probability of grid-scale LDDH events expressed as the return period is shown in Fig. 4. Regions with low return periods are more likely to suffer from this hazard. A robust difference is found for the LDDH events between the two periods (Fig. 4a–b). During 1961–1987, prolonged meteorological drought and extremely high temperatures frequently co-occur in central-eastern China, Northeast China and western Northwest China. During the present period (1988–2014), return periods decrease by more than 40 % relative to 1961–1987 across large areas of China, especially over Northeast China, Inner Mongolia, the Sichuan basin, the southeastern coast and some areas in the Tibetan Plateau (Fig. 4c), corresponding to an increase in occurrence probability by more than 67 %. Areas with a pronounced increase in LDDH event probability between the two periods generally coincide with regions exhibiting a significant positive trend in the number of grid-scale LDDH events during the entire observation period (Fig. 3a). This indicates the robustness of changes in grid-scale LDDH events. Compared to 1961–1987, the fraction of areas experiencing return periods lower than 5 years increases from 33 % to 59 % in 1988–2014. In contrast, LDDH event probability decreases substantially over some areas of Northwest China and central-eastern China. Overall, a higher frequency of LDDH events is detected for the present climate compared to the reference period, with a clear shift of the whole distribution towards lower return periods (Fig. 4d).
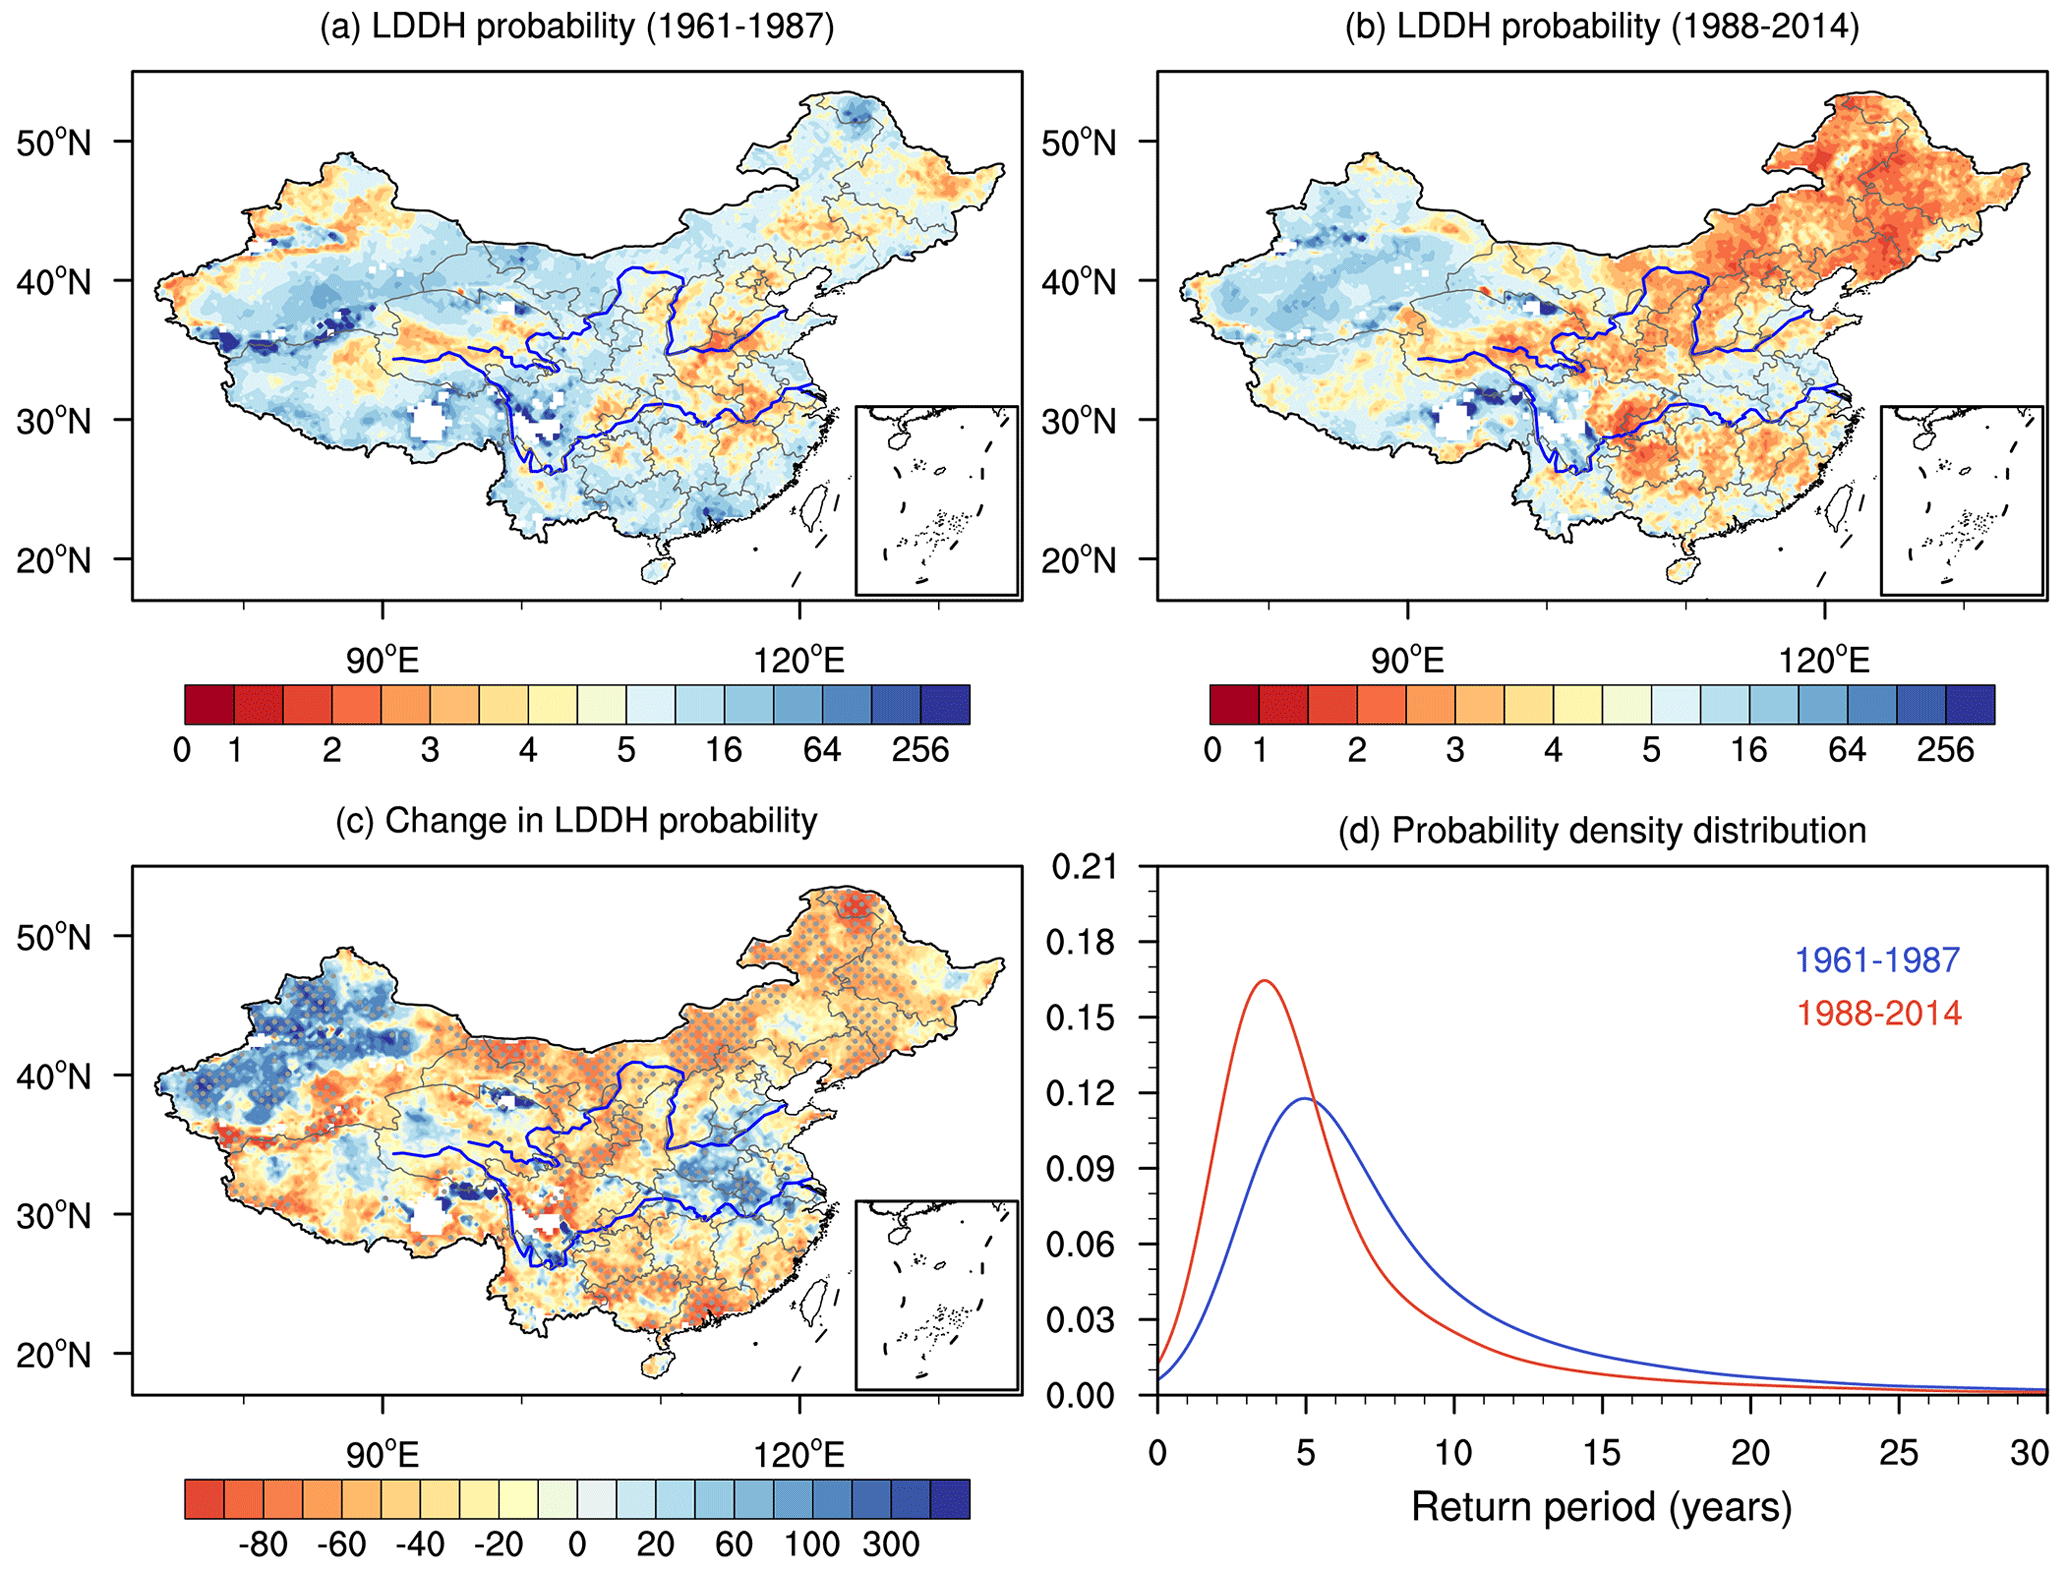
Figure 4Return periods (years) of compound long-duration dry and hot events for (a) 1961–1987 and (b) 1988–2014. (c) Percentage changes (%) across the study area for 1988–2014 relative to 1961–1987. Stippling indicates locations with significant changes at the 90 % confidence interval. (d) Probability density functions based on all grid points for the two periods.
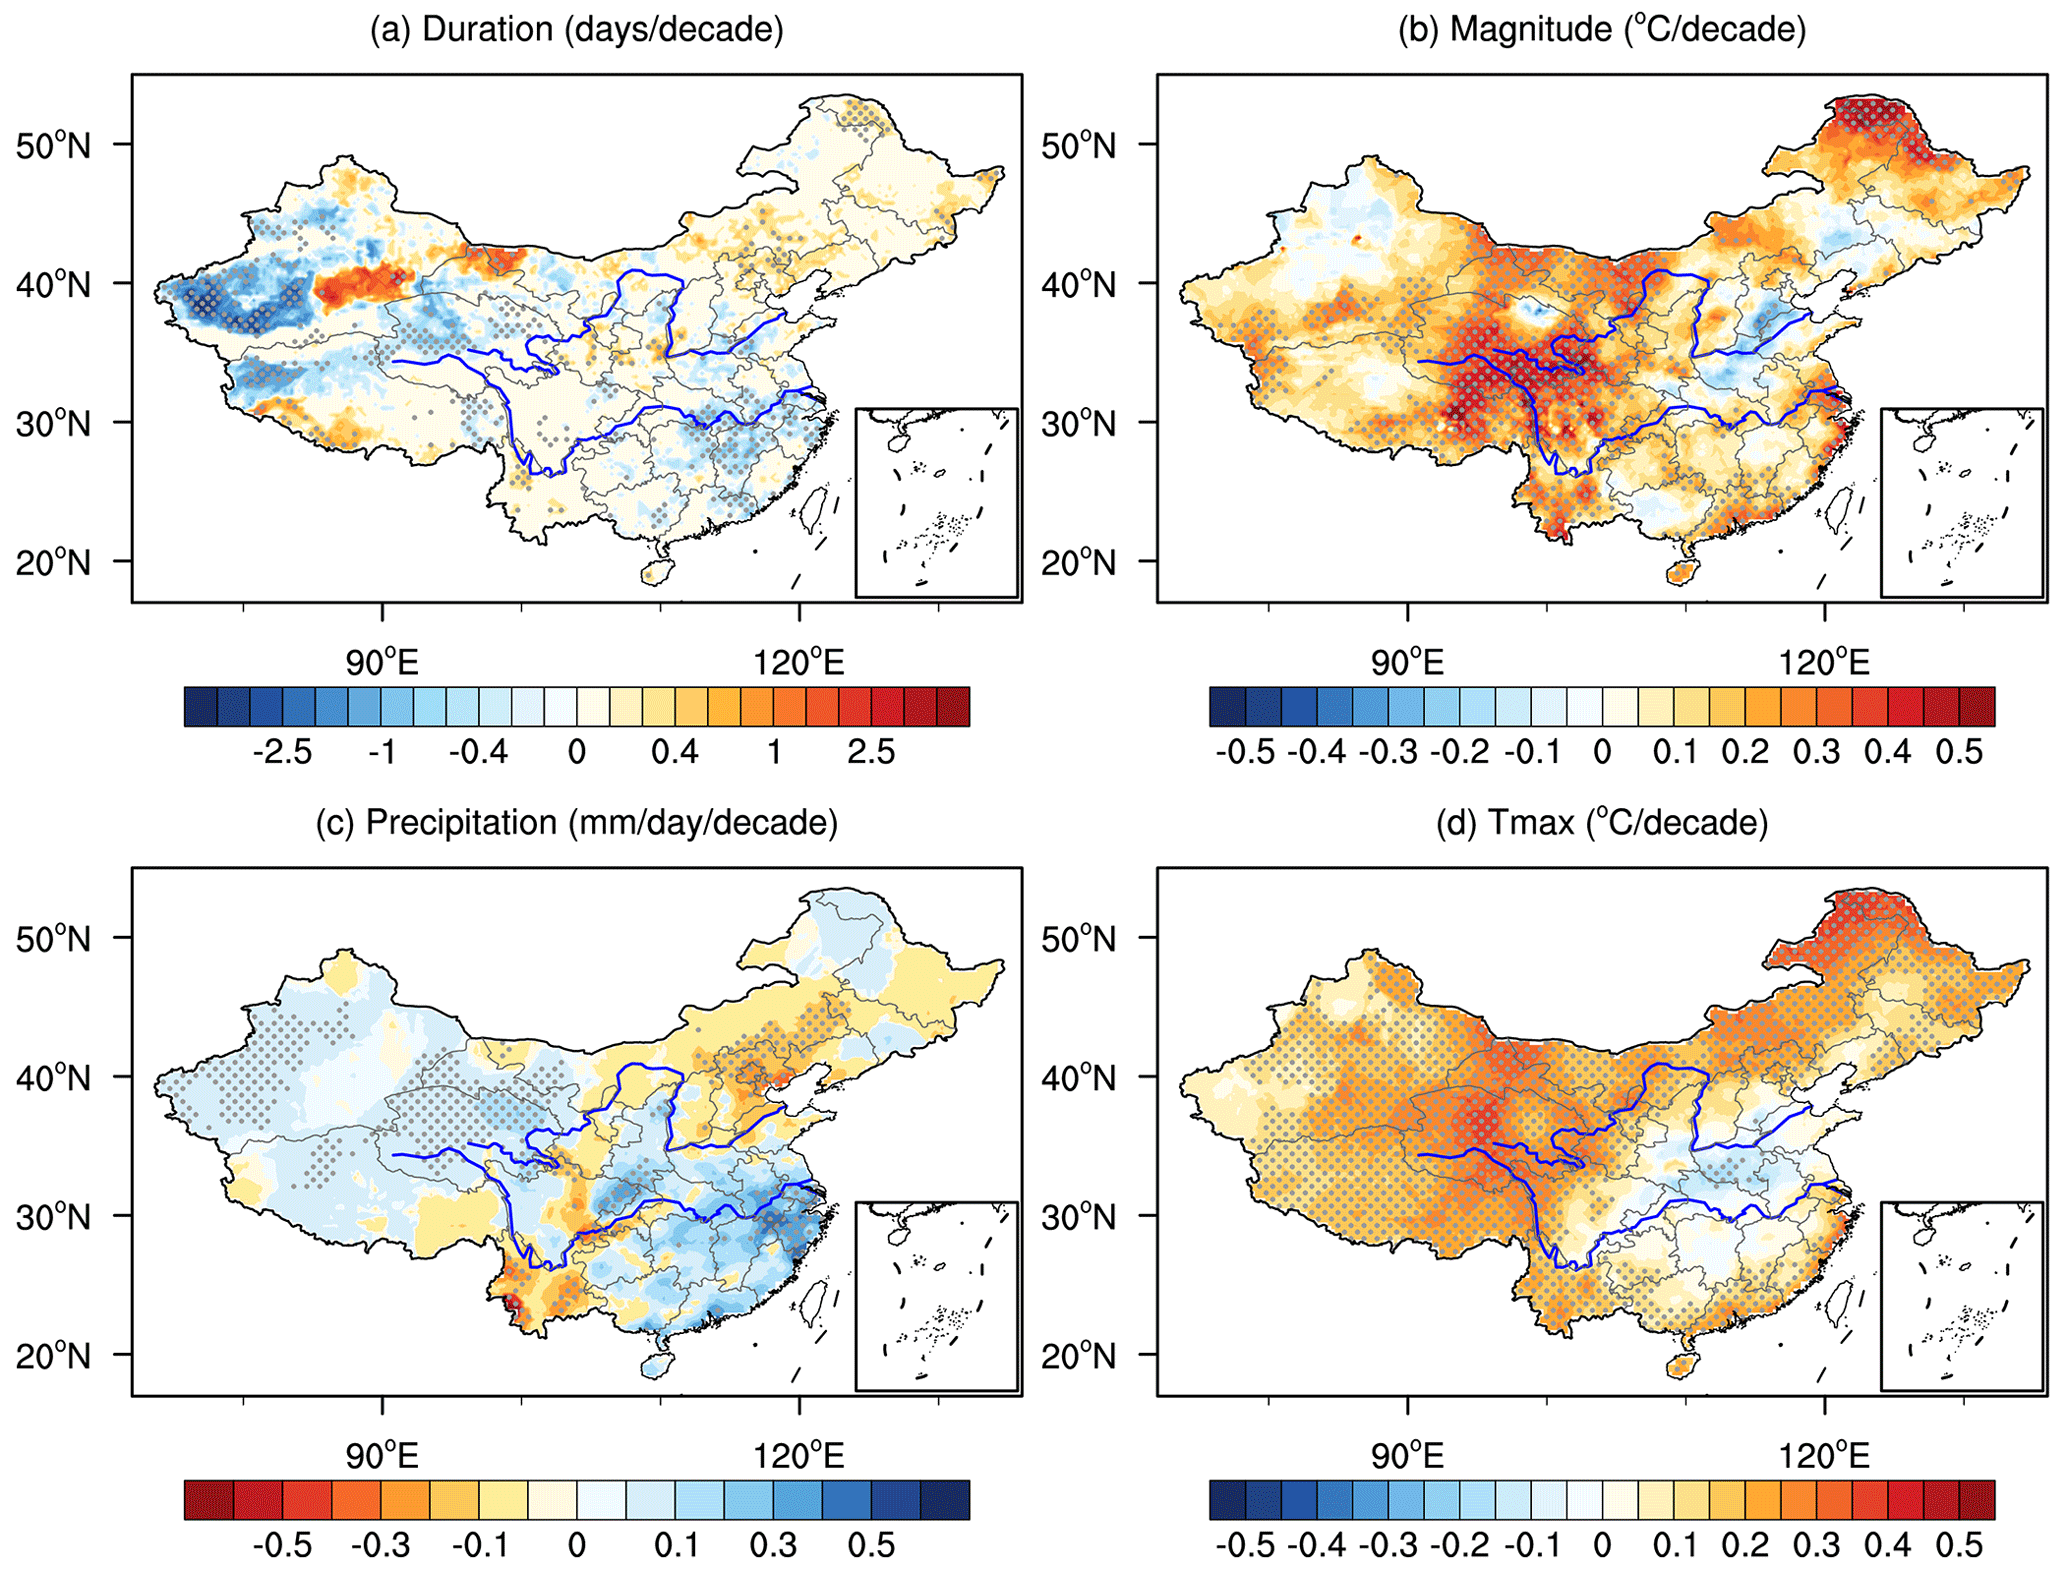
Figure 5Decadal trends for the summer maxima of (a) duration and (b) magnitude during 1961–2014. Trends for summer mean (c) precipitation and (d) Tmax. Stippling indicates significance at the 90 % confidence level.
To investigate the causes of variations in grid-scale LDDH events, we first show the temporal changes in annual maximum DUR and MAG during the summer of 1961–2014 (Fig. 5). Consistent with the southern flood and northern drought pattern of summer precipitation over eastern China (Fig. 5c), maximum DUR has increased in Northeast China and significantly decreased over the Yangtze River valley (Fig. 5a). The changes in drought duration have been explained to be attributed to anthropogenic climate change (Sarhadi et al., 2018; Zhang et al., 2017) and natural variability such as the Pacific Decadal Oscillation (McCabe et al., 2004; Zhang and Zhou, 2015). A substantial increase in precipitation is associated with a pronounced decrease in dry-spell duration over western Northwest China. This agrees with Shi et al. (2007), who reported a climate shift from warm–dry to warm–wet in the mid 1980s over the arid region of Northwest China, possibly related to an increase in atmospheric water vapor and an accelerated water cycle in response to global warming. Although with only a small decrease or even notable increase in temperature during DH events, most parts of Northwest China are 4 times less likely to experience long-lasting DH events (Fig. 4c), indicating the dominant role of a wetting climate and hence a shortened duration of dry spells in this region. MAG shows a spatially similar but stronger warming trend than the summer mean maximum temperature over most areas of China, particularly over parts of Northeast China and the eastern edge of the Tibetan Plateau, with an increasing rate exceeding 0.4 ∘C per decade (Fig. 5b). This suggests that dry spells over these regions have warmed by at least 2 ∘C during the past 54 years, which may increase the risk of agricultural drought. In comparison, although mostly nonsignificant at the point level, the MAG of DH events has decreased by 0.2 ∘C per decade in some regions of central-eastern China. The combined effect of the decreases in both DUR and MAG may partly explain the decreased probability of LDDH events over central-eastern China (Fig. 4c). Existing studies suggested that such cooling and wetting trends in central China during summer could be linked to a weakening of the East Asian summer monsoon (Yu et al., 2004; Zhou et al., 2009), which is related to the variations in sea surface temperatures of the Indian Ocean and the equatorial eastern Pacific (Gong and Ho, 2002; Hu et al., 2003; Zhao et al., 2010). Also, anthropogenic aerosols have been suggested to contribute to the observed changes in summer precipitation and temperature over eastern China (Dong et al., 2019; Li et al., 2007; Ye et al., 2013).
In addition to changes in DUR and MAG, variations in the dependence between DUR and MAG may also influence LDDH event risk. Following the method developed by Bevacqua et al. (2019), we quantitatively estimate the contributions from these potential drivers to the observed probability changes in persistent DH events (Fig. 6). Generally, changes in MAG appear to be the primary driver of changes in LDDH event probability. Increased MAG increases the concurrence frequency across most parts of China, with a relative contribution exceeding 67 % (RP = −40 %) over regions stretching from Northeast to Southwest China, southern Tibet and southeastern China (Fig. 6b). A large contribution to changes in LDDH event probability can be attributed to an increased dependence between DUR and MAG in some of these areas. However, over regions with a decreased frequency of LDDH events, the dominant drivers are different. For example, the DUR variability accounts for most of the variability in LDDH events in Northwest China, followed by the influence of MAG. Whereas the influence of decreasing temperatures prevails in most parts of central-eastern China, the decrease in LDDH events along the lower reaches of the Yangtze River is mainly related to a decrease in dependence and shortened dry spells. These decreases in the dependence between DUR and MAG are overall consistent with the findings of He et al. (2015) and Hao et al. (2019), who demonstrated a weakened negative relationship between precipitation and temperature during summer in part of eastern China. Generally, large increases in MAG dominate the increased probability of LDDH events, highlighting the predominantly thermodynamic response of LDDH events to global warming.
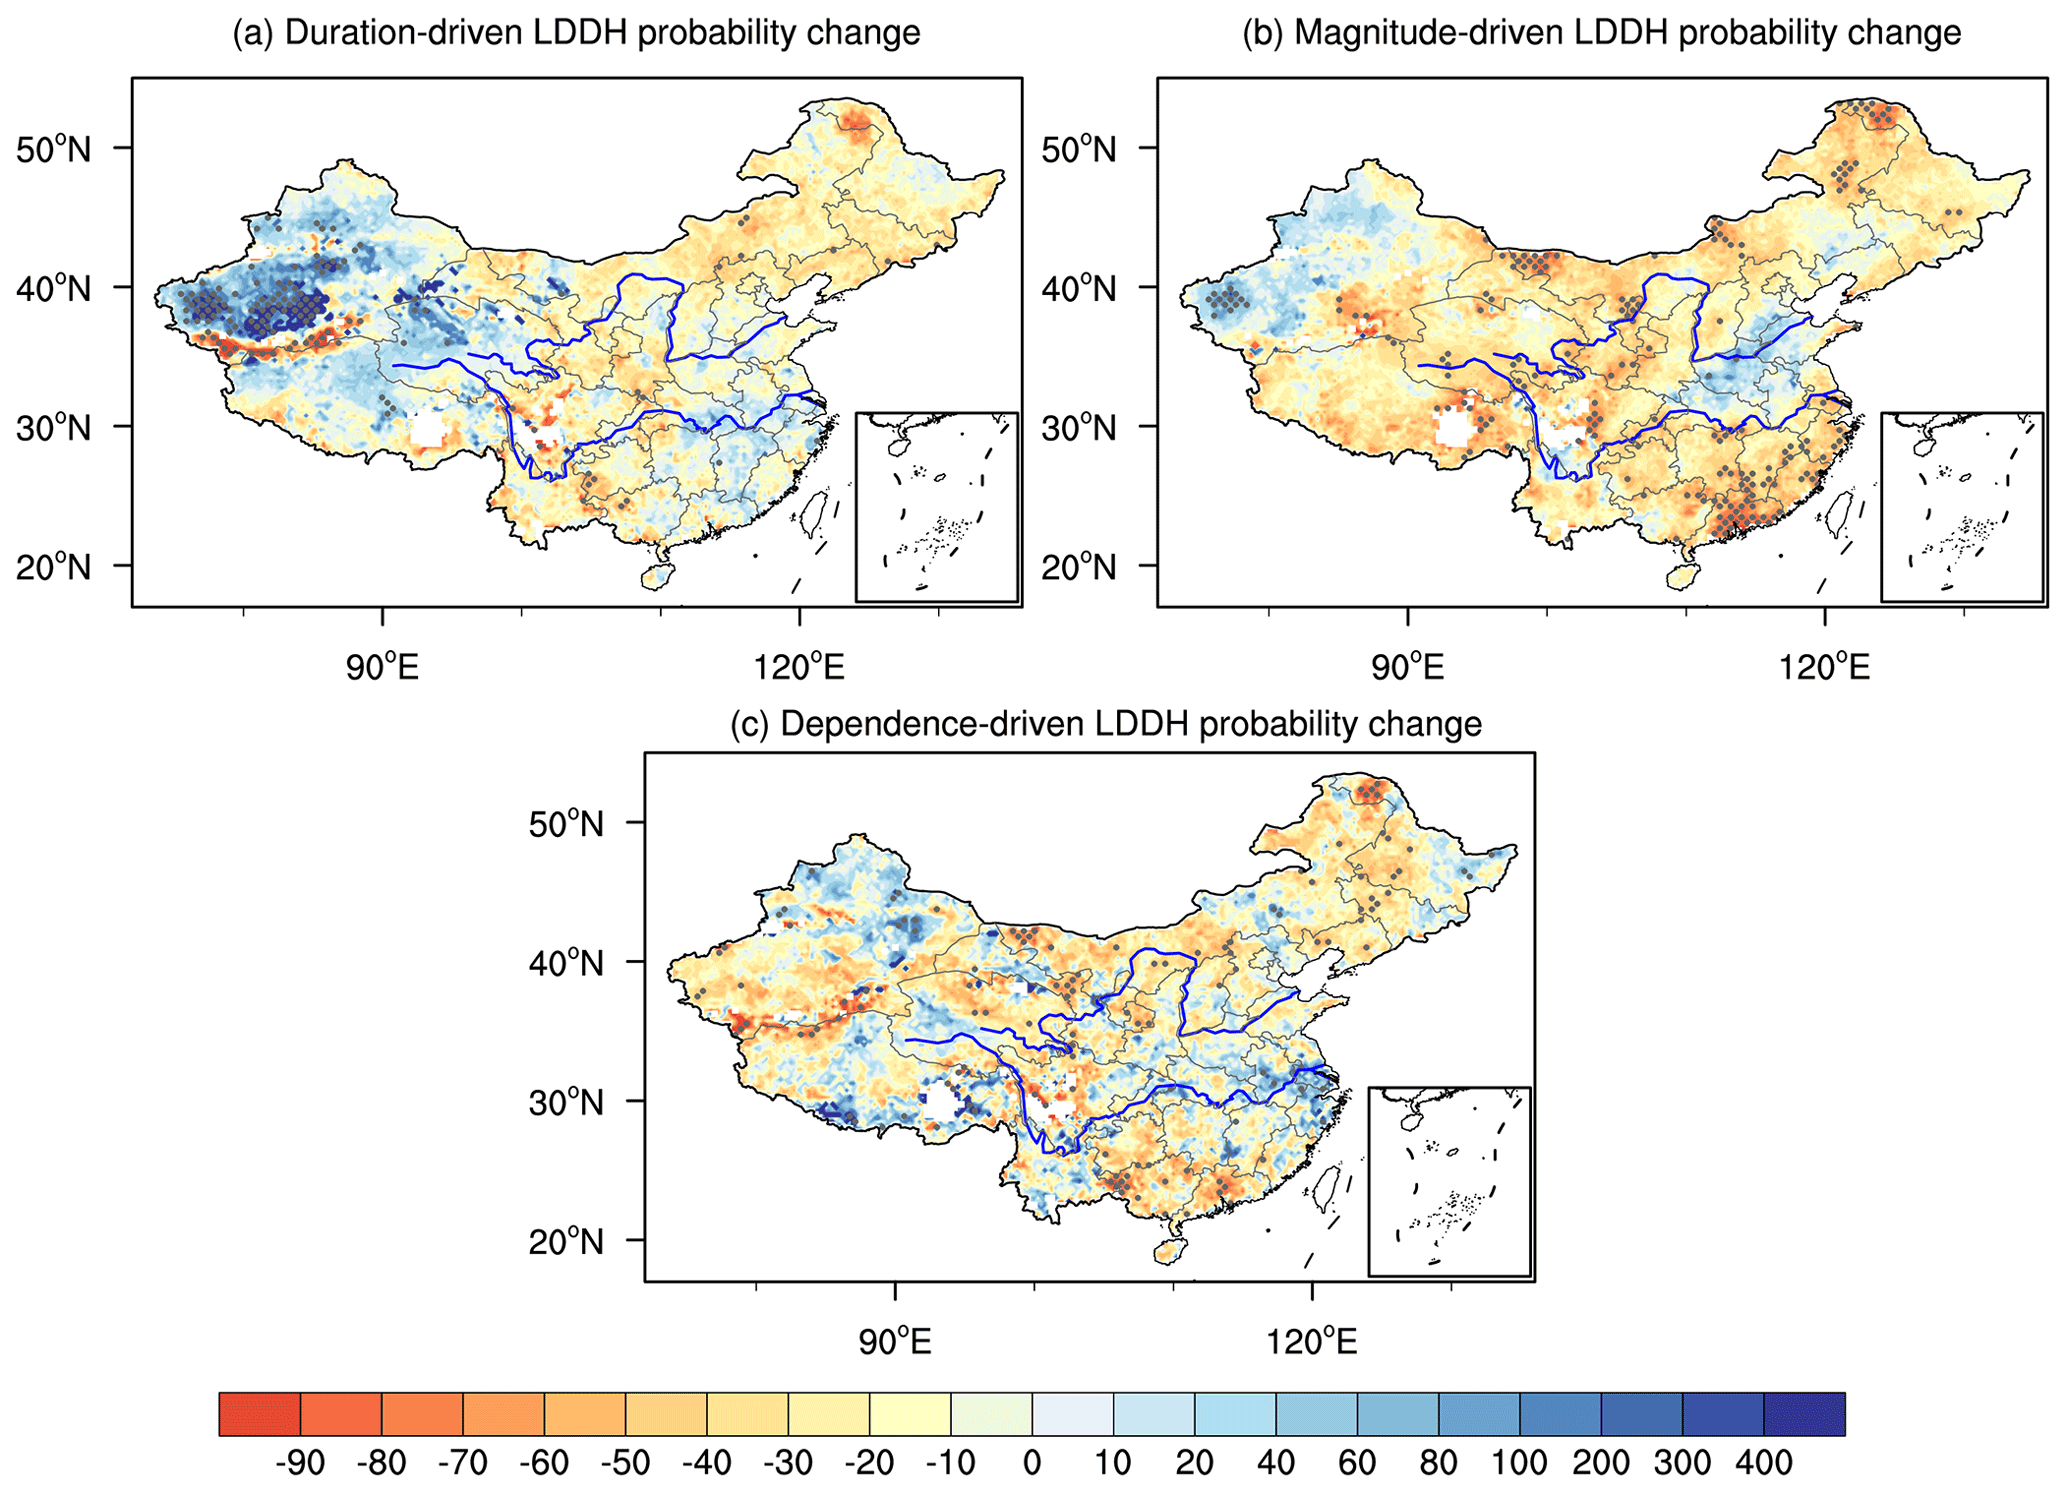
Figure 6Changes (%) in return periods of compound long-duration dry and hot events between 1988–2014 and 1961–1987 due to changes in the marginal distribution of (a) duration, (b) magnitude, and (c) dependence between duration and magnitude. Statistically significant changes are shown by stippling.
3.2 Spatiotemporal compound long-duration dry and hot events
3.2.1 Climatological characteristics
In addition to the grid-based results, an event-based analysis is conducted to further understand the spatiotemporal evolution of compound extremes. In total, 146 spatiotemporal LDDH events are identified during 1961–2014. There is a significant positive correlation between the mean area and the mean duration of the spatiotemporal LDDH events (Fig. 7). This indicates that the SLDDH events with a longer duration are likely to have a larger spatial extent. The boxplot shows that the mean duration of SLDDH events is generally 6–11 d (interquartile range), with a median of about 9 d, while few extreme events can last for more than 30 d. Note that the mean duration of the spatiotemporal events refers to the average duration of all cells during the event. When looking at the number of days between the onset and the end day, the duration of the SLDDH events mainly ranges between 7 and 14 d, with a median of 10 d (not shown). The mean contiguous area impacted by SLDDH events varies between 200 000 and 330 000 km2.
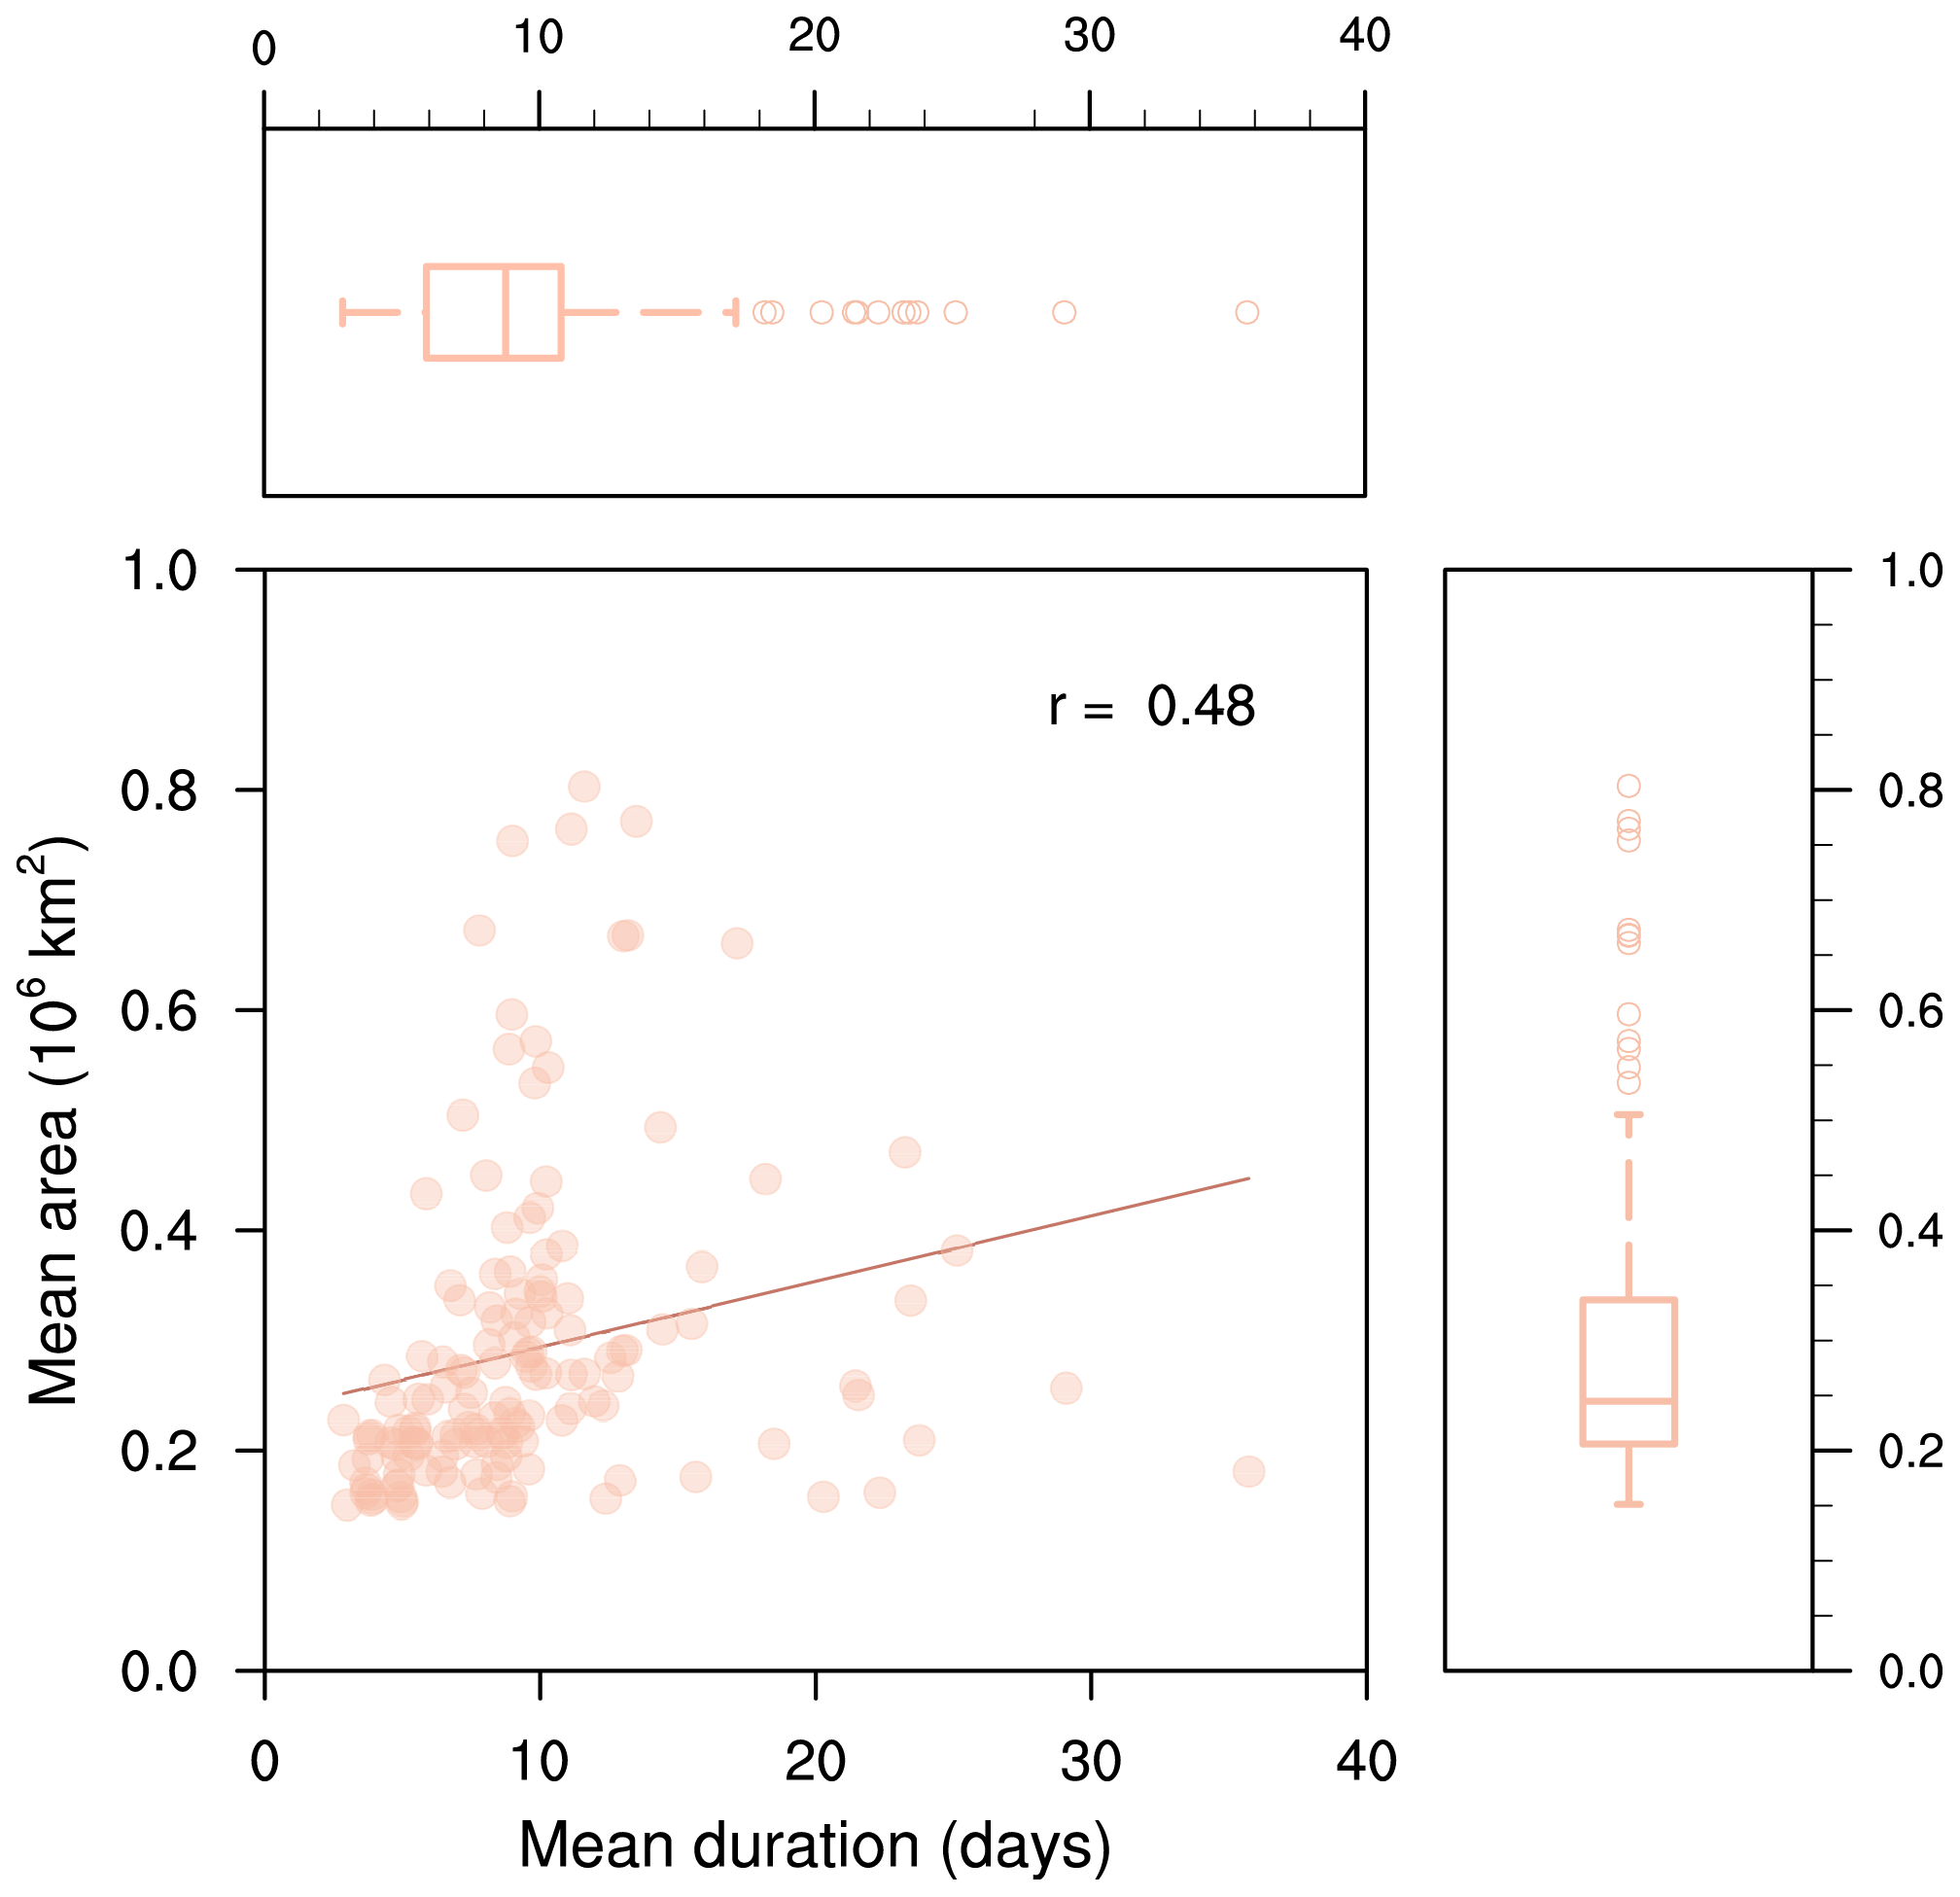
Figure 7Scatterplot of mean duration and mean area for each spatiotemporal compound long-duration dry and hot event during 1961–2014. The red line is a least-squares line of best fit. The Spearman correlation coefficient (r= 0.48, p < 0.05) is shown in the figure. The upper and right panels show the boxplot of mean duration and mean area, respectively. The box represents the interquartile range with the horizontal line indicating the median, with whiskers expanding from the minimum to the maximum and outliers being shown as circles.

Figure 8Time series of the SLDDH event (a) count and annual maximum value of (b) mean duration, (c) mean area and (d) magnitude over 1961–2014. The dashed line shows the linear trend.
Variations in the annual characteristics of the SLDDH events are presented in Fig. 8. Both the event number and mean area of SLDDH events display a significant increasing trend during the past 54 years. The annual maximum value of mean duration slightly increases by 0.4 d per decade. Spatiotemporal LDDH events occur on average 2.7 times per year, increasing about 0.37 times per decade (Fig. 8a). The highest occurrence frequency of SLDDH events is 11 and occurred in 2011. The severe 2011 hot and dry event over Southwest China was record-breaking and resulted in damaging impacts on crop production (Lin et al., 2015; Lu et al., 2014; Sun et al., 2012). The contiguous area affected by SLDDH events has expanded significantly with a rate of 40 000 km2 per decade, according to the trend in annual maximum values (Fig. 8c). The largest spatial extension of SLDDH events is observed from the late 1990s to mid 2000s. The SLDDH events in the 1970s and since the 1990s have larger magnitudes. Overall, the spatiotemporal compound long-duration dry and hot events are becoming more frequent and impacting larger areas. The increased contiguous areas affected by SLDDH events could cause dramatic losses of agricultural production and populations in highly populated and agricultural regions (He et al., 2022; Zscheischler and Fischer, 2020), such as eastern China. A potential consequence of this fast-increasing frequency and spatial expansion of persistent DH events is a growing threat to food production and the electricity supply (Kim et al., 2022). In addition, more frequent and widespread large-scale SLDDH events may aggravate the risk of tree mortality and wildfires (Anderegg et al., 2013; Zscheischler et al., 2018), leading to an increase in the occurrence of sequential fire and dust extremes (Yu and Ginoux, 2022).
3.2.2 Typical SLDDH event clusters over China
Using the hierarchical clustering algorithm (Sect. 2.3), nine typical SLDDH event clusters are distinguished. The spatial distribution of these clusters is shown in Fig. 9. Shading indicates the percentage of SLDDH days affecting each grid point for each cluster. The nine clusters generally cover the whole of China and are mainly located over the northern Tibetan Plateau (C1), North China (C2), Qinghai Province (C3), Yunnan (C4), northern Xinjiang (C5), Northeast China (C6), southern Xinjiang (C7), the middle and lower reaches of the YRB (C8), and the Sichuan–Chongqing region (C9), respectively. The C6 cluster centered over Northeast China occurs most frequently, including 31 spatiotemporal compound events, followed by the North China (C2, Fig. 9b) and Qinghai (C3, Fig. 9c) clusters, including 27 and 20 SLDDH events, respectively. Overall, the SLDDH events occur more frequently in northern China and less in southern China, which is consistent with the grid-based results.
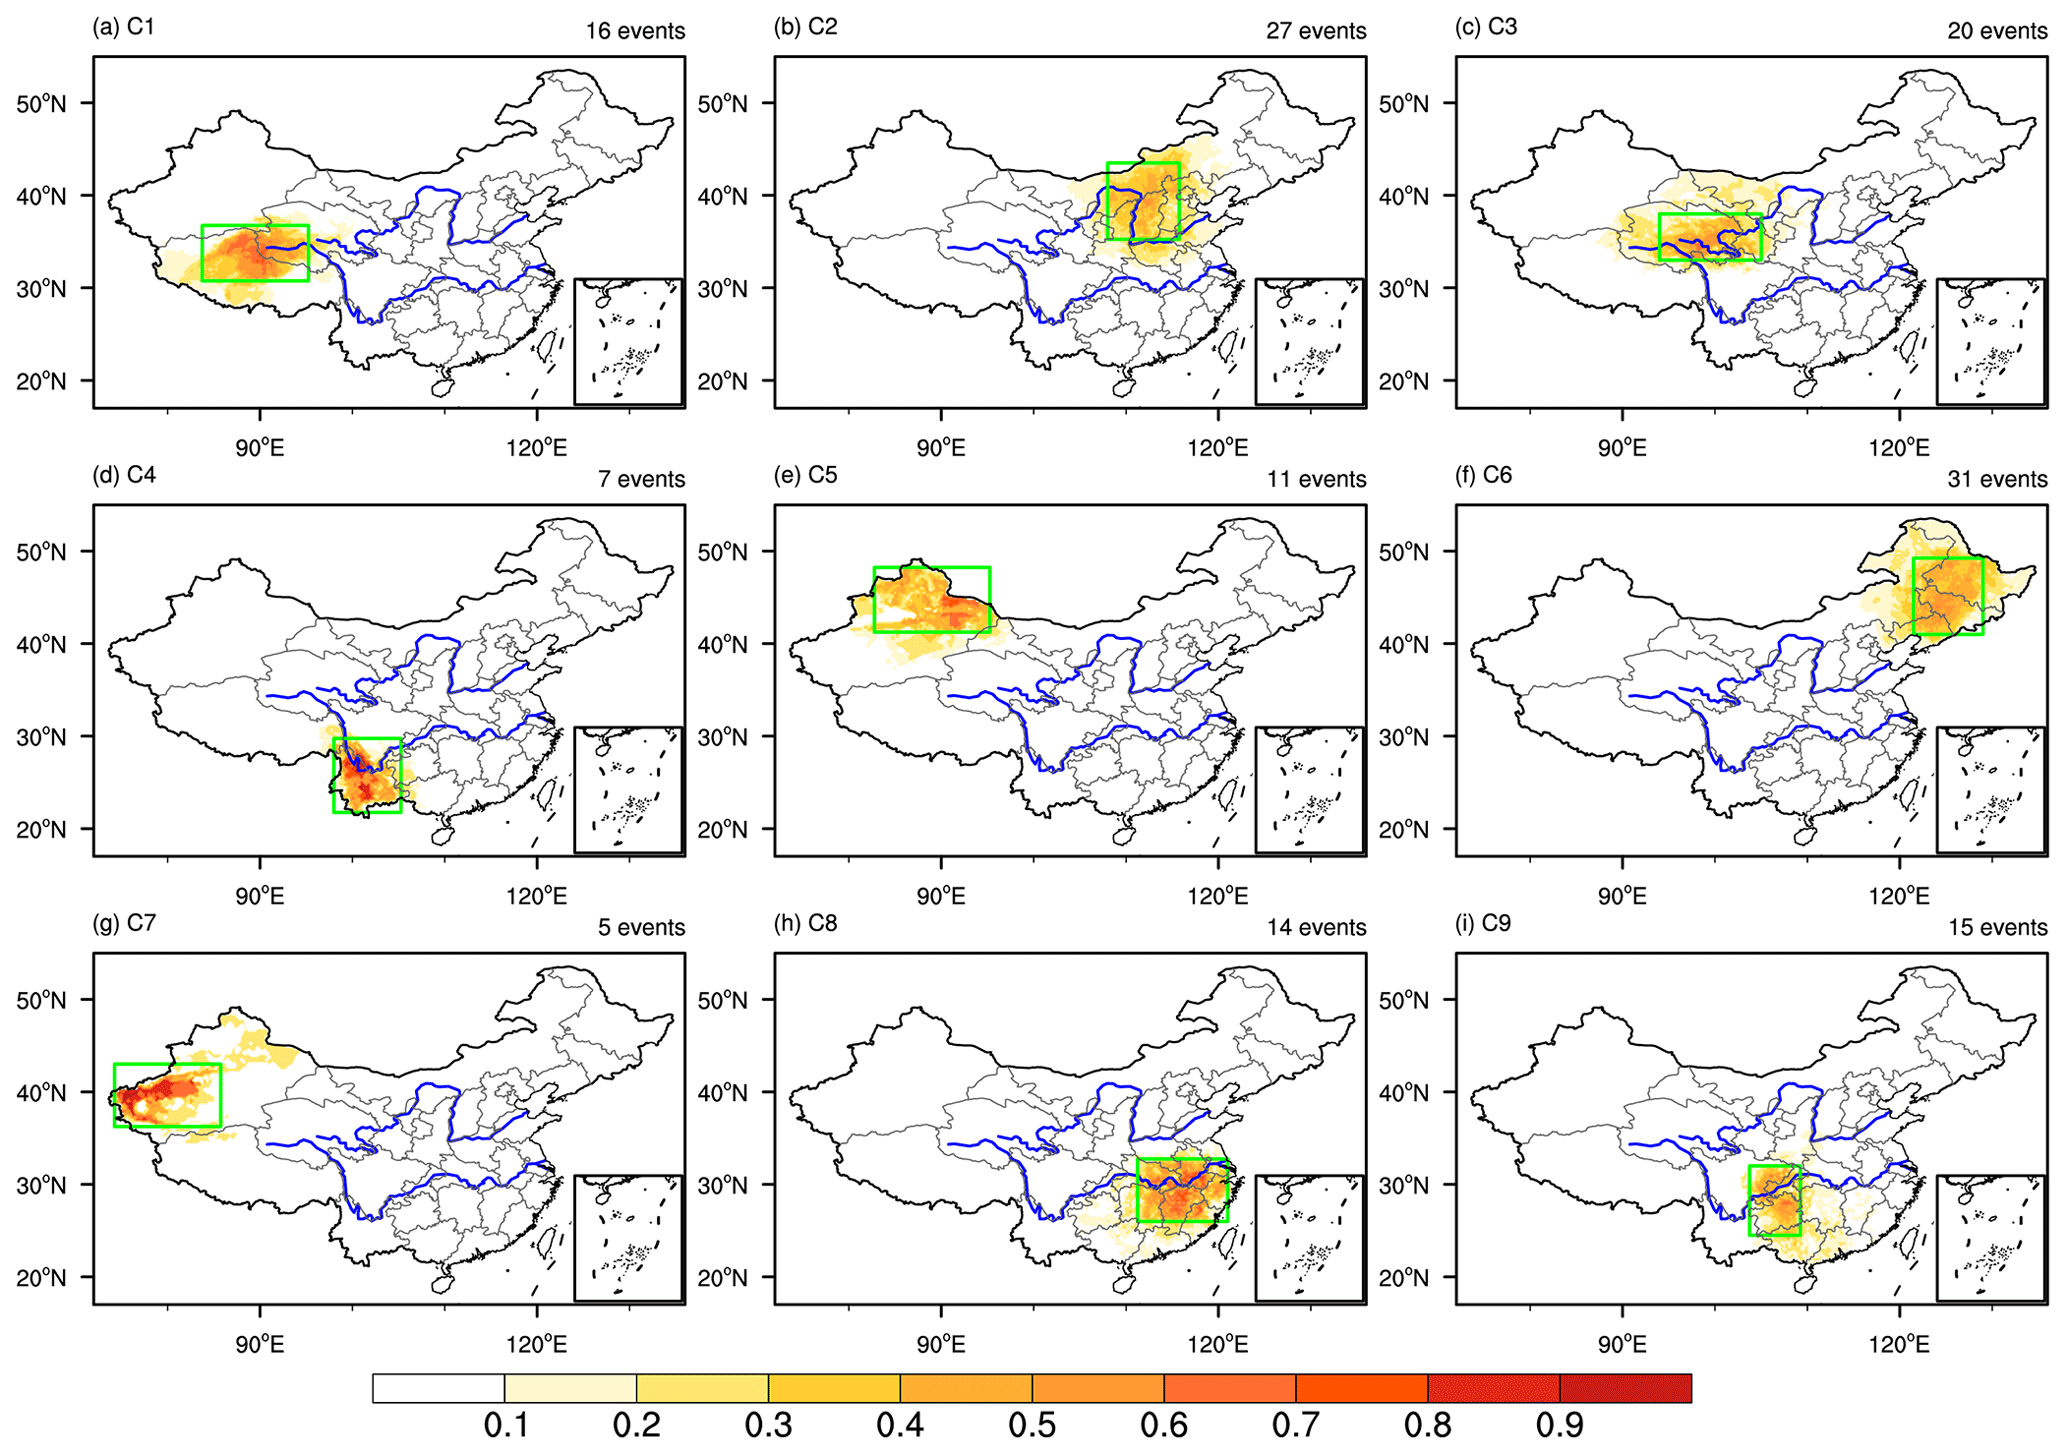
Figure 9The spatial pattern of nine SLDDH event clusters in the study area. For each cluster, shading represents the percentage of SLDDH days affecting each grid point. The number of events in each cluster is listed in the upper-right corner of each panel.
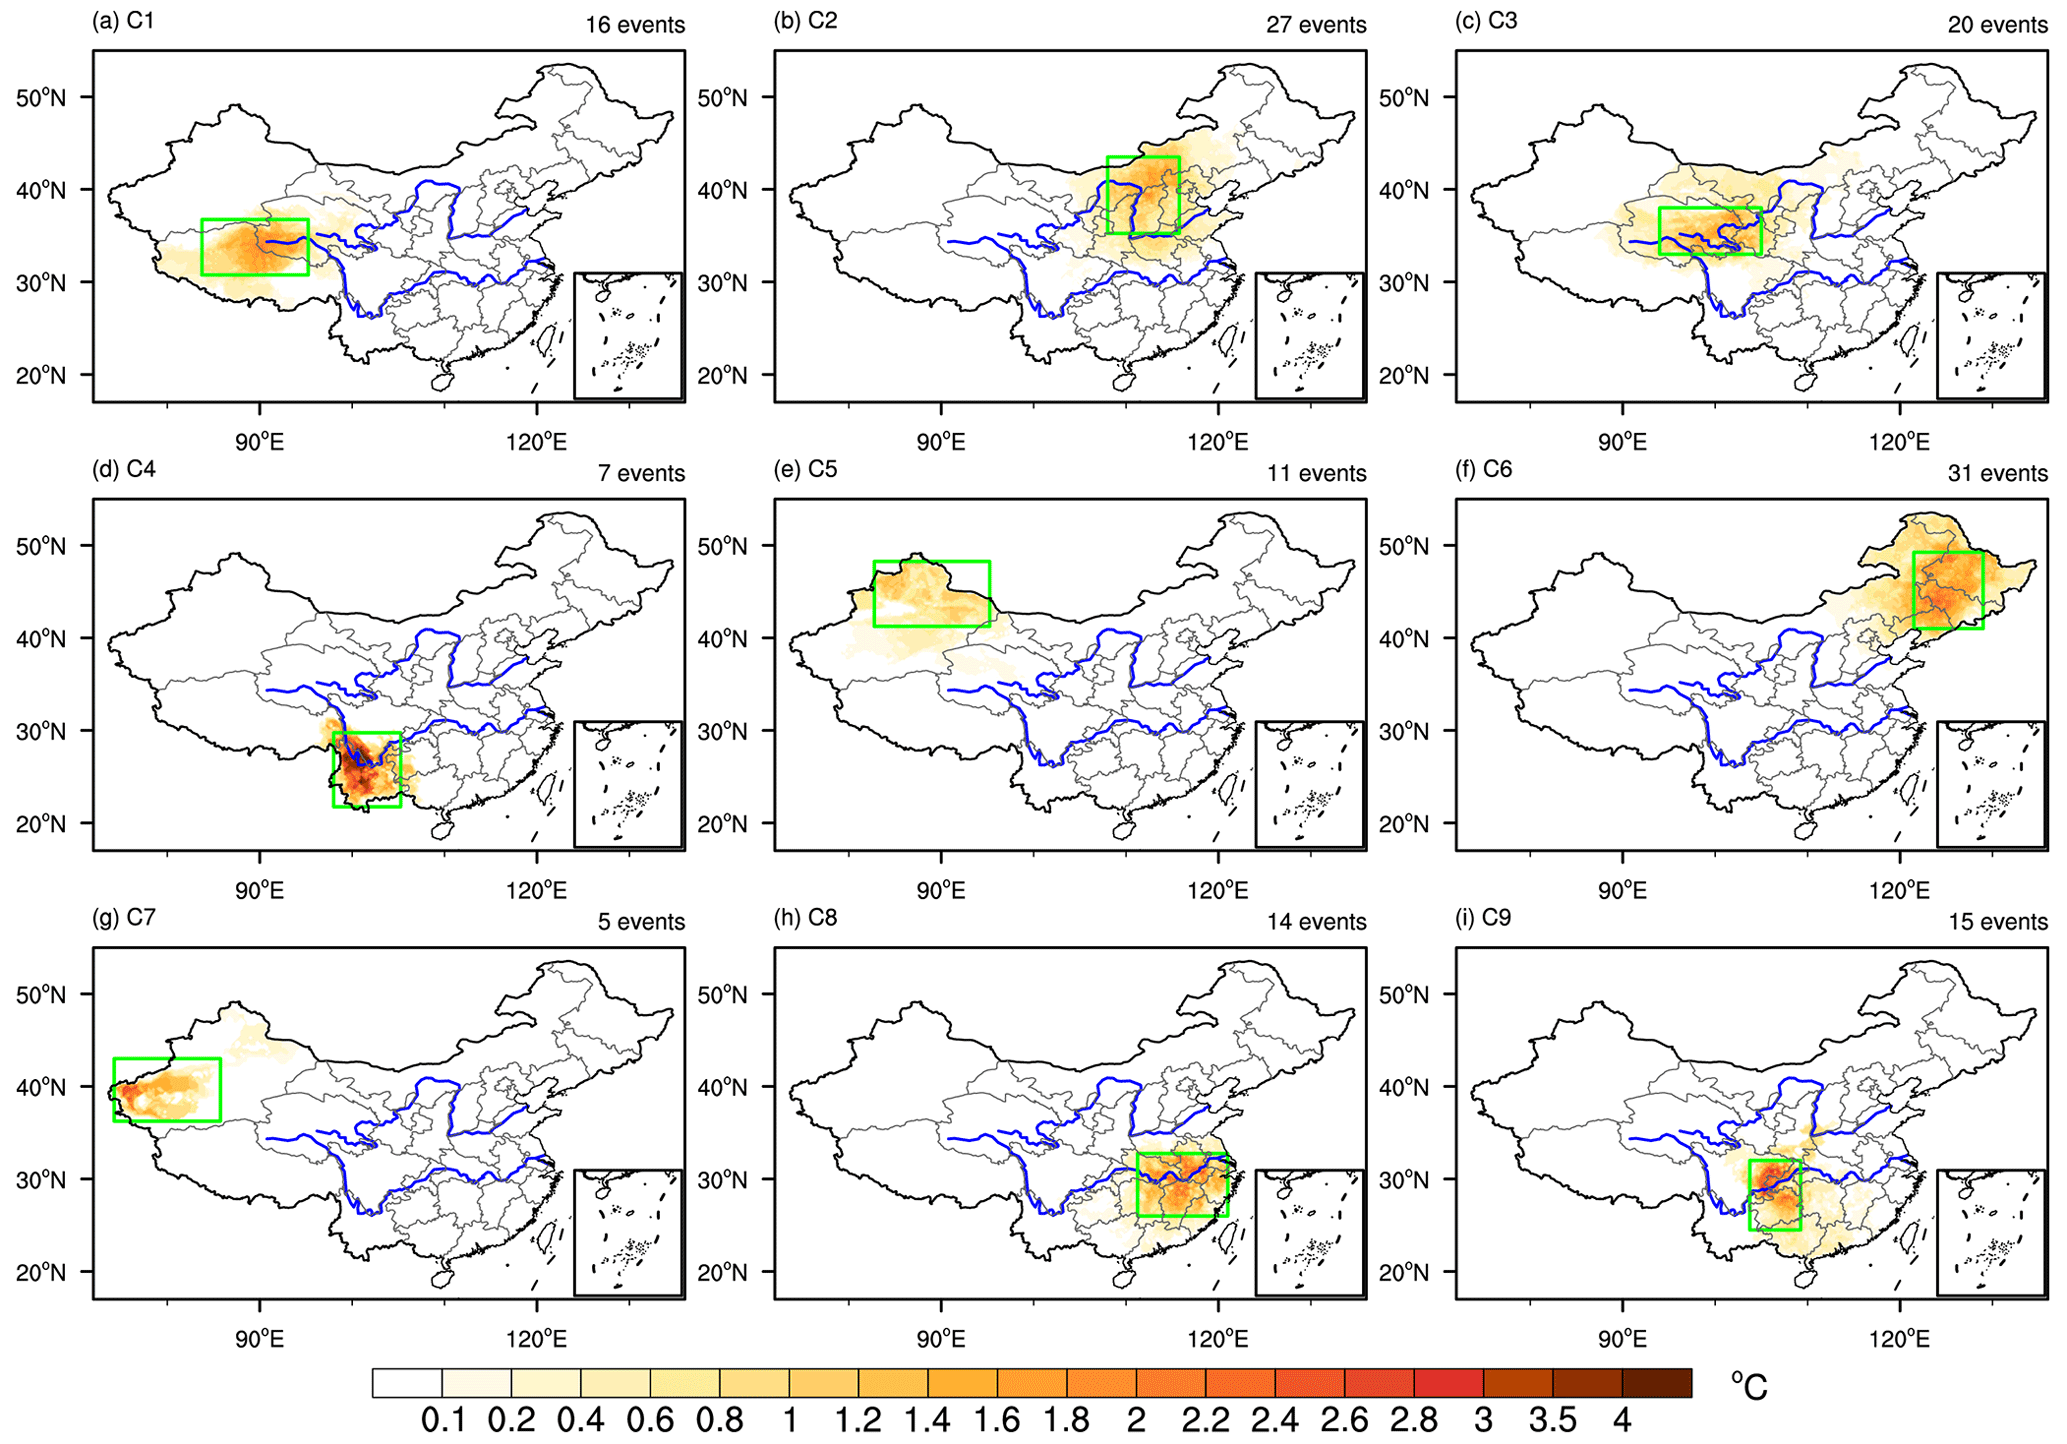
Figure 10Same as Fig. 9 but for the average of the daily Tmax anomaly (relative to the daily climatology) of all events in each cluster.
Although the Yunnan (C4) cluster only includes seven events, it has the highest-temperature anomaly (> 4 ∘C) (Fig. 10d). Large high-temperature anomalies are also apparent along the middle and lower reaches of the Yangtze River (i.e., C8 and C9, Fig. 10h–i). Consistent with the spatial pattern of temperature magnitude of grid-scale LDDH events (Fig. 2c), the spatiotemporal events show higher magnitude in the northern Xinjiang (C5) and southern Xinjiang (C7) clusters (Fig. 11b). However, these two clusters have relatively weak temperature anomalies (Fig. 10e, g), which may be related to the high-temperature climatology in those regions. The temperature anomaly of the C1 cluster over the northern Tibetan Plateau can reach up to about 3 ∘C, although the magnitude there is relatively low (approximately 15 ∘C) due to its high topography (Fig. 11b).
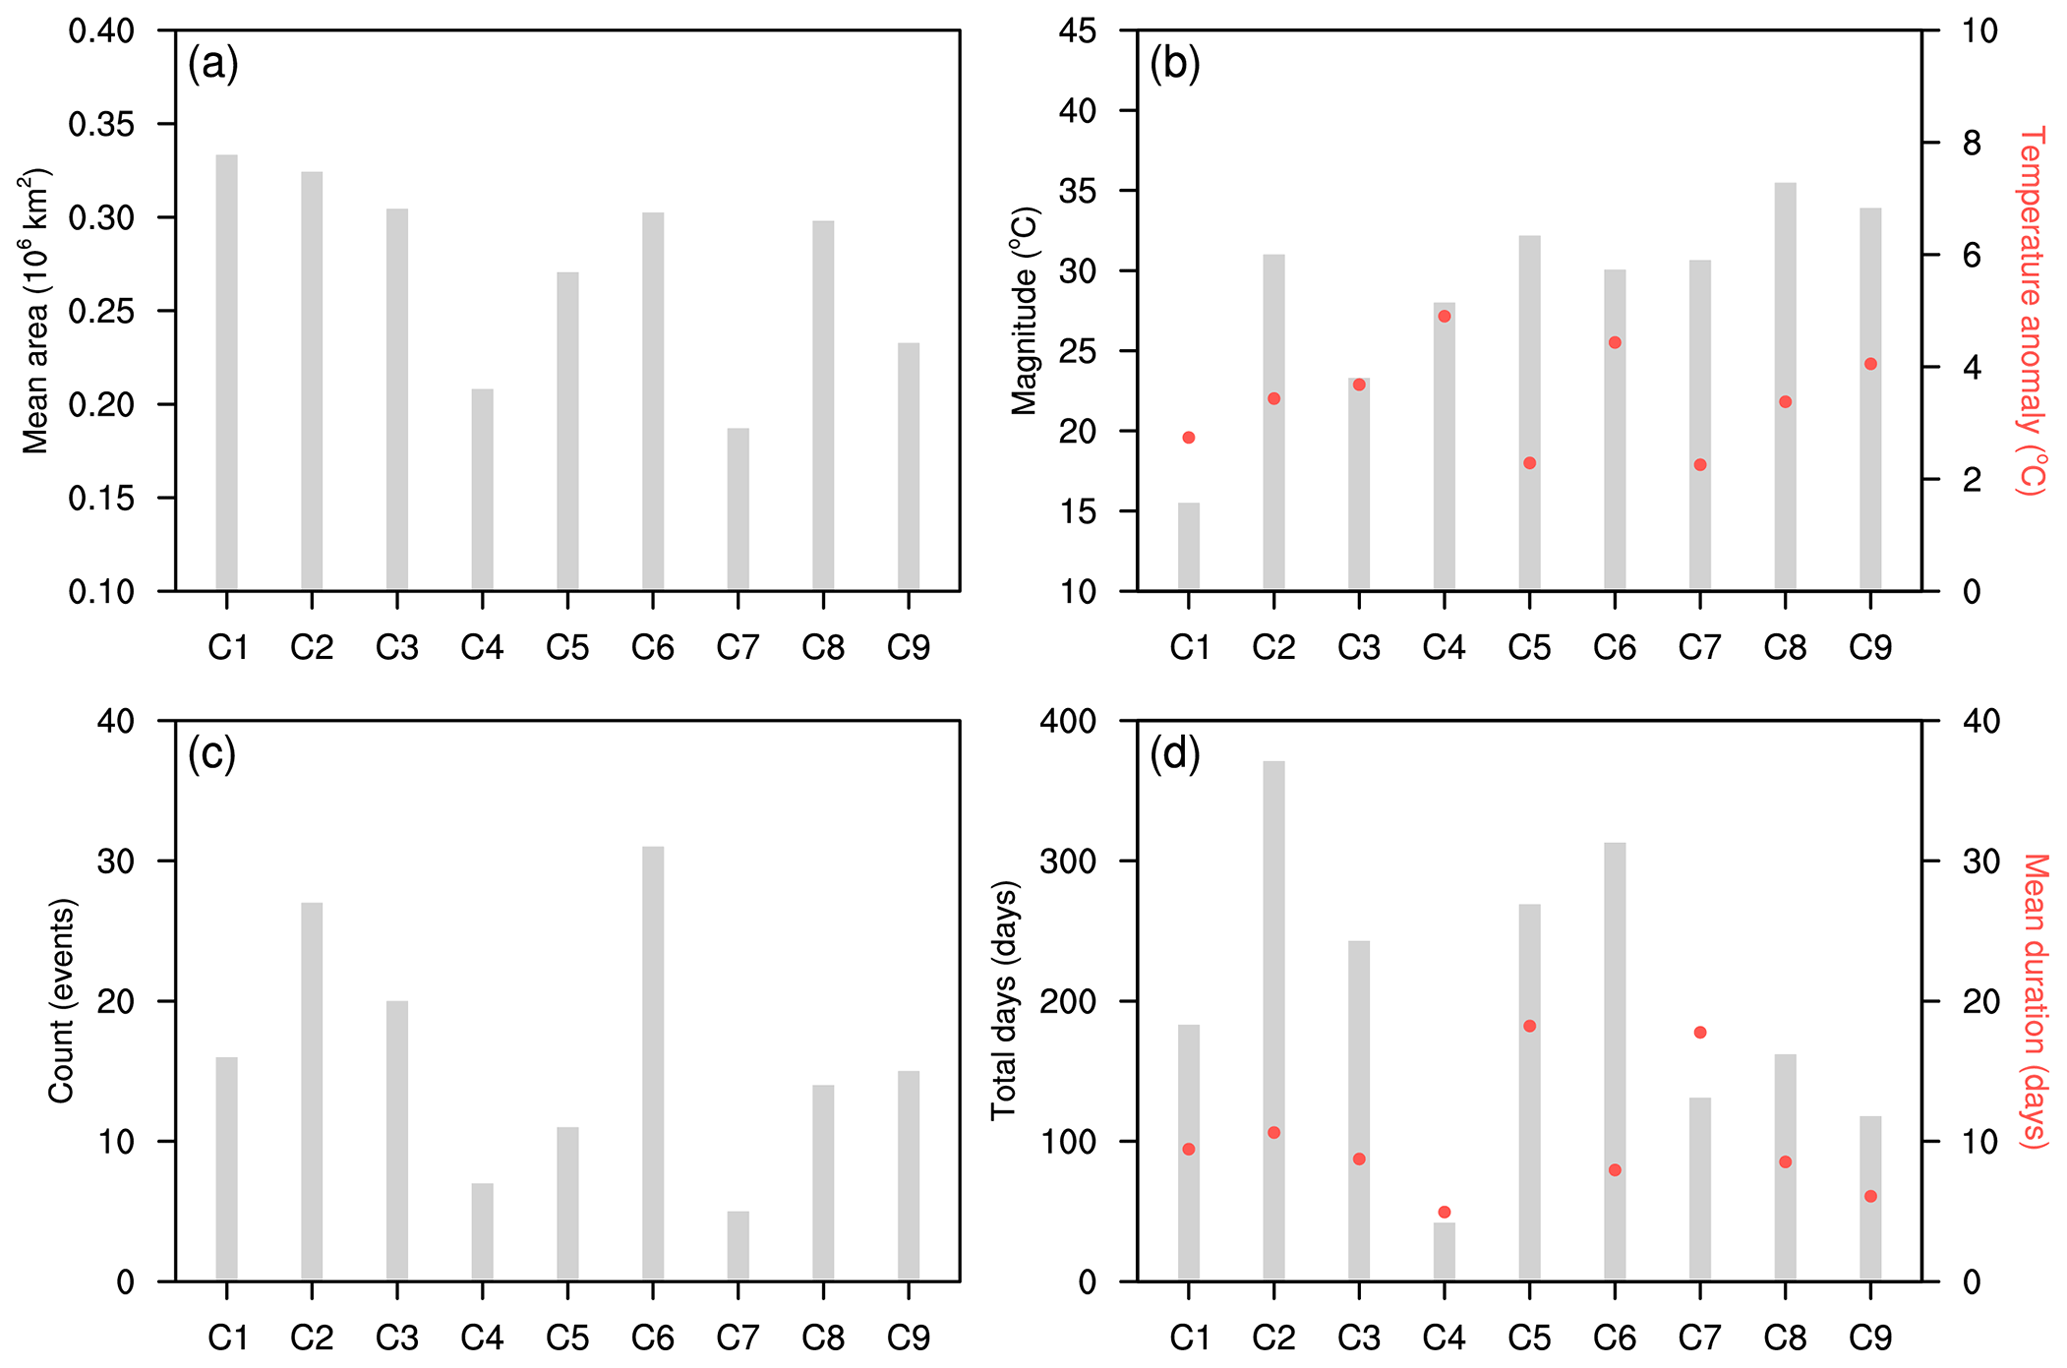
Figure 11Characteristics of the nine SLDDH clusters during 1961–2014. The average (a) mean area, (b) magnitude (histogram) and temperature anomaly (dot), (c) count, and (d) total days (histogram) and mean duration (dot) of all events per cluster.
The spatial extent (Fig. 11a) of SLDDH events in northern China is generally larger than in southern China. The contiguous affected area of SLDDH events over the northern Tibetan Plateau, in North China, in Qinghai and in Northeast China (C1, C2, C3 and C6) exceeds 300 000 km2 per event. SLDDH events over the middle and lower reaches of the Yangtze River basin (C8) also cover a large area, about 298 000 km2. The Xinjiang region (C5 and C7) has the longest SLDDH events, with an average duration of up to 18 d, while Yunnan (C4) displays the shortest SLDDH events (about 5 d). Hotspots of frequency occurrence occur in northern regions such as Northeast China (C6), North China (C2) and Qinghai (C3). Large spatial variations are prevalent in the total days of SLDDH events (Fig. 11d). The highest total number of SLDDH days exceeding 300 is found in North China (C2) and Northeast China (C6), which may result from the higher occurrence frequency of SLDDH events in these areas (Fig. 11c). Relatively high values of SLDDH days reaching 269 are also seen over northern Xinjiang (C5), which may be attributed to the longer duration there. Conversely, Yunnan (C4) is only affected by SLDDH events for a total of 42 d.
There is a clear seasonality of the SLDDH events, with most events (45.9 %) beginning in June (Fig. 12a). Note that the events are identified during summer from June to August. This might contribute to the low number of events in August. We test the sensitivity of our results to the cutoff by comparison with the results considering the events overlapping these months that end after this period. We find that the seasonality of SLDDH events is robust regarding the cutoff days of the analysis period (not shown). Whereas most of the events over northwestern regions (i.e., Xinjiang and Qinghai, C3, C5, and C7) and the YRB (C8) generally start in July (Fig. 12b), the SLDDH events in the Sichuan–Chongqing region (C9) mainly occur from July to August and peak in August. The onset timing of SLDDH events is similar to that of grid-scale LDDH events (Fig. 2e), reflecting the influence of the summer monsoon and topography in different regions.
The occurrence of SLDDH events shows an obvious interdecadal variability in the past 54 years (Fig. 12c). For the western region of China, the events over southern Xinjiang (C7) mainly occur in the 1970s and rarely happen after the 1990s, whereas 64 % of events in northern Xinjiang (C5) occur from the 1960s to 1980s. Spatiotemporal LDDH events in the northern Tibetan Plateau (C1) are relatively more frequent in the 1980s and 1990s. The events over Yunnan (C4) occur much more frequently after 2010, which is consistent with the increase in the frequency of high temperature and droughts (Gao et al., 2021; Yang et al., 2019a). For eastern China, the frequency of SLDDH events has increased substantially after the 1990s, especially in the Sichuan–Chongqing region (C9), where the SLDDH events rarely occur before the 1990s. For the middle and lower reaches of the Yangtze River (C8), SLDDH events are more frequent in the 1960s to 1980s and 2000s but less frequent in the 1990s.
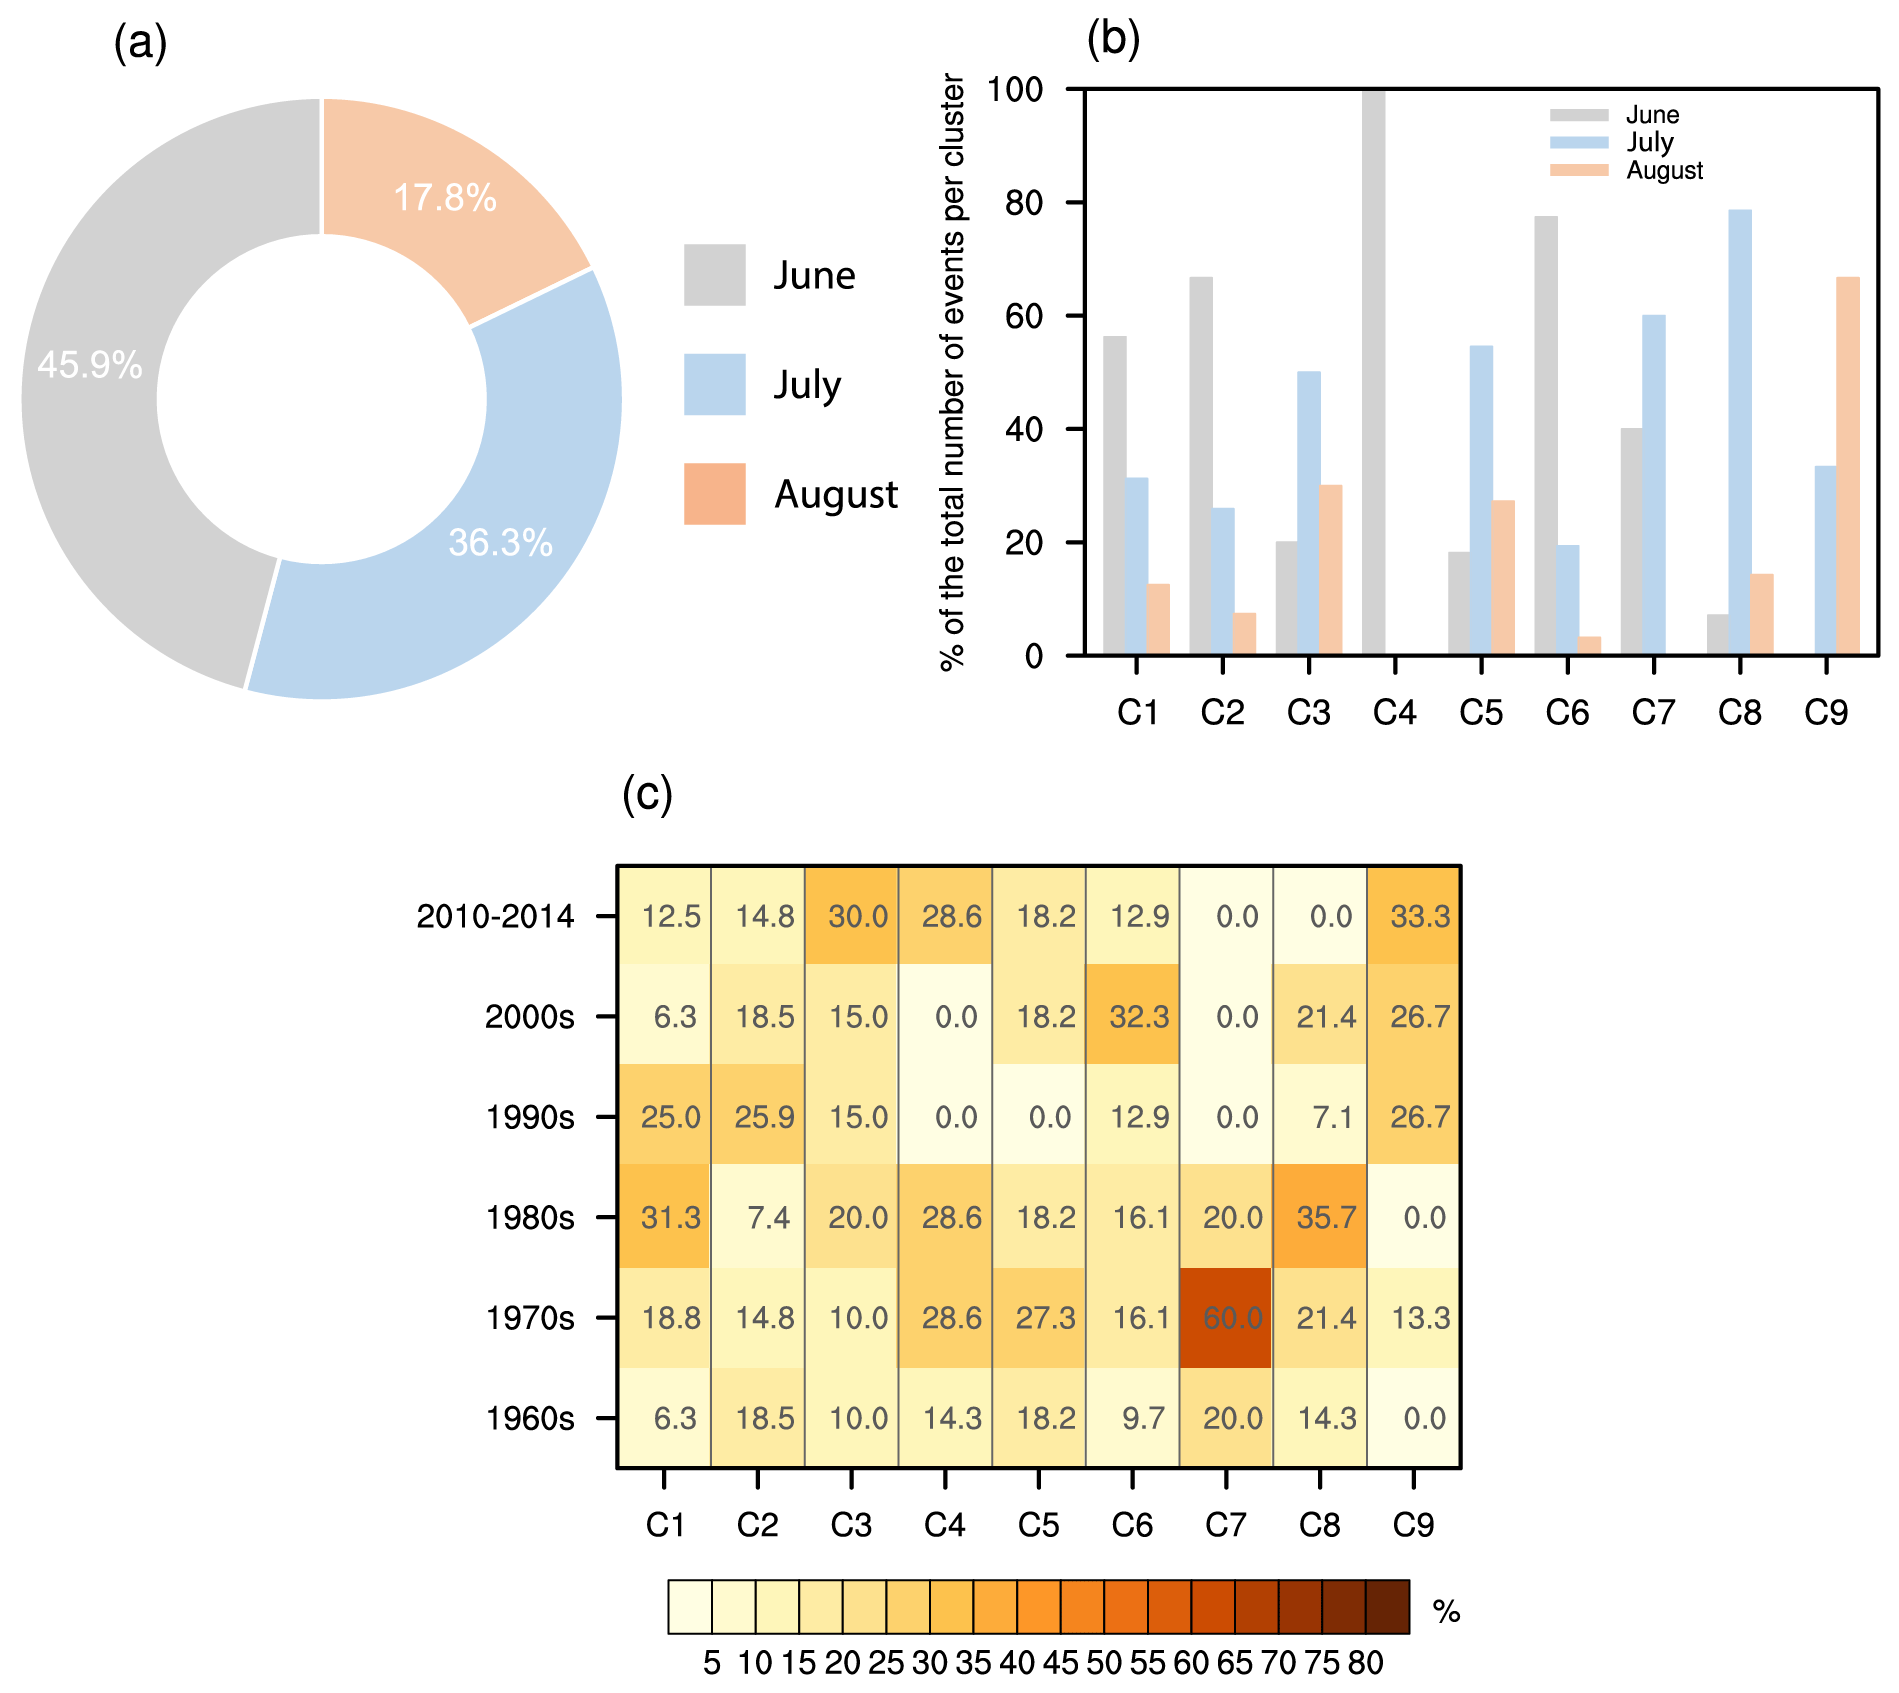
Figure 12(a) The seasonality of the SLDDH events; the number shows the percentage of events starting in each month. (b) The percentage of events starting during each month for each cluster. (c) The percentage occurrence of SLDDH events for each cluster in different decades.
We investigate the spatiotemporal characteristics and occurrence probability of long-duration meteorological droughts that co-occur with extreme temperatures during summer in China. Unlike most studies that mainly focused on monthly or longer-timescale drought backgrounds, we identify dry spells at a daily timescale and focus on the persistence of co-occurring dry and hot conditions. Compound long-duration dry and hot events are investigated on both a grid and 3D event basis.
During 1961–2014, grid-scale LDDH events primarily occur in eastern China, especially in the northern part of the country. Hotspots include northeastern China and the middle and lower reaches of the Yangtze River basin. Although Xinjiang is a region with few LDDH events, the events there are most persistent and accompanied by the highest-temperature magnitudes. Notably, high-temperature magnitudes are also apparent in central-eastern China. Averaged across the country, the frequency of the grid-scale LDDH events in China has increased significantly in the past 54 years. Increases in LDDH event frequency are found across much of the country, most notably in Northeast China, in Inner Mongolia, in the Sichuan basin and on China's southeastern coast. However, the likelihood of LDDH events has decreased over most of Northwest and central-eastern China.
The increased likelihood of LDDH events is mainly associated with increasing temperatures. Similar results have been found in Europe (Manning et al., 2019) and the United States (Alizadeh et al., 2020), where global warming dominates the increase in the concurrent droughts and heat waves in recent decades. An exception is found in western Northwest China, where shortened dry spells are the primary driver of the decreased frequency of LDDH events. Similarly, change in DUR contributes more than that of temperature along the lower reaches of the Yangtze River. Our quantitative analysis corroborates previous studies (Kong et al., 2020; Yu and Zhai, 2020), which highlighted the role of a reduction in drought occurrences in the decrease in DH events in the south-central region. Moreover, we find a predominant effect of decreases in the dependence on the reduction in DH probability in the south-central region. The underlying mechanisms for the changes in dependence structure (Hao et al., 2019), especially tail dependencies of compound extremes (Zscheischler et al., 2021), require further study.
A total of 146 spatiotemporal LDDH events are identified and grouped into 9 clusters. The large-scale SLDDH events mainly occur in northern China, such as Northeast China, North China and Qinghai, where the events generally cover a larger area than other regions, with an average affected area greater than 300 000 km2. Although the SLDDH events centered over Yunnan have the shortest duration, a relatively small affected area and low frequency, the temperature anomaly is severe and can reach up to around 5 ∘C. The onset timing of SLDDH events has obvious seasonality. SLDDH events mostly begin in June, while the events in northwestern China and the YRB generally start in July. There is a substantial increase in the occurrence frequency and annual maximum spatial extent of SLDDH events, with magnitudes of 0.37 times and 40 000 km2 per decade, respectively. Both grid-scale and 3D analyses show a more frequent occurrence of compound long-duration dry and hot events under past warming conditions, indicating an increased probability of long-lasting compound events.
Our study provides a first characterization of where compound long-duration dry and hot events might occur in China and how these events have changed. While most existing studies analyze DH events on a grid or station basis, we investigate the spatiotemporal variation in LDDH events from a 3D event-based perspective by considering connectivity in both space and time. Compound long-lasting dry and hot extremes occur more frequently with global warming, and quantitative detection and attribution analysis could help better understand the role of different anthropogenic forcings. It should be noted that our results are based on gridded data, which may have uncertainties due to station density, especially over western China with relatively few stations. It would be interesting to compare the results with those of station observations. Although we find a dominant role of rising temperatures for the increased probability of LDDH events, improved understanding of the physical drivers (e.g., atmospheric conditions and land–atmosphere feedback) of the identified changes is essential for event prediction and risk management of such persistent compound events. Further studies could extend the approach taken here to identify the characteristics of compound long-duration dry and hot events in future climates and their impacts considering regional vulnerability and exposure.
The observational dataset is available at http://climatechange-data.cn/resource/detail?id=228 (Wu and Gao, 2013).
YY, DM, AO and JT conceived the study. YY analyzed the data and wrote the manuscript draft. DM, AO and JT provided comments and revised the manuscript. All authors discussed the results and contributed to the final manuscript.
The contact author has declared that none of the authors has any competing interests.
Publisher’s note: Copernicus Publications remains neutral with regard to jurisdictional claims in published maps and institutional affiliations.
This work is supported by the Jiangsu Collaborative Innovation Center for Climate Change. Yi Yang is supported by the China Scholarship Council and Program A for Outstanding PhD Candidate of Nanjing University.
This research has been supported by the National Key Research and Development Program of China (grant no. 2018YFA0606003).
This paper was edited by Paolo Tarolli and reviewed by two anonymous referees.
Akaike, H.: A new look at the statistical model identification, IEEE T. Automat. Contr., 19, 716–723, https://doi.org/10.1109/TAC.1974.1100705, 1974.
Aladaileh, H., Al Qinna, M., Karoly, B., Al-Karablieh, E., and Rakonczai, J.: An investigation into the spatial and temporal variability of the meteorological drought in Jordan, Climate, 7, 82, https://doi.org/10.3390/cli7060082, 2019.
Alexander, L. V., Zhang, X., Peterson, T. C., Caesar, J., Gleason, B., Klein Tank, A. M. G., Haylock, M., Collins, D., Trewin, B., Rahimzadeh, F., Tagipour, A., Rupa Kumar, K., Revadekar, J., Griffiths, G., Vincent, L., Stephenson, D. B., Burn, J., Aguilar, E., Brunet, M., Taylor, M., New, M., Zhai, P., Rusticucci, M., and Vazquez-Aguirre, J. L.: Global observed changes in daily climate extremes of temperature and precipitation, J. Geophys. Res.-Atmos., 111, D05109, https://doi.org/10.1029/2005JD006290, 2006.
Alizadeh, M. R., Adamowski, J., Nikoo, M. R., AghaKouchak, A., Dennison, P., and Sadegh, M.: A century of observations reveals increasing likelihood of continental-scale compound dry-hot extremes, Science Advances, 6, eaaz4571, https://doi.org/10.1126/sciadv.aaz4571, 2020.
Anderegg, W. R., Kane, J. M., and Anderegg, L. D.: Consequences of widespread tree mortality triggered by drought and temperature stress, Nat. Clim. Change, 3, 30–36, https://doi.org/10.1038/nclimate1635, 2013.
Andreadis, K. M., Clark, E. A., Wood, A. W., Hamlet, A. F., and Lettenmaier, D. P.: Twentieth-century drought in the conterminous United States, J. Hydrometeorol., 6(6), 985-1001, https://doi.org/10.1175/JHM450.1, 2005.
Bevacqua, E., Maraun, D., Vousdoukas, M. I., Voukouvalas, E., Vrac, M., Mentaschi, L., and Widmann, M.: Higher probability of compound flooding from precipitation and storm surge in Europe under anthropogenic climate change, Science Advances, 5, eaaw5531, https://doi.org/10.1126/sciadv.aaw5531, 2019.
Bevacqua, E., Vousdoukas, M. I., Zappa, G., Hodges, K., Shepherd, T. G., Maraun, D., Mentaschi, L., and Feyen, L.: More meteorological events that drive compound coastal flooding are projected under climate change, Communications Earth and Environment, 1, 1–11, https://doi.org/10.1038/s43247-020-00044-z, 2020.
Breinl, K., Di Baldassarre, G., Mazzoleni, M., Lun, D., and Vico, G.: Extreme dry and wet spells face changes in their duration and timing, Environ. Res. Lett., 15, 074040, https://doi.org/10.1088/1748-9326/ab7d05, 2020.
Chen, L., Chen, X., Cheng, L., Zhou, P., and Liu, Z.: Compound hot droughts over China: Identification, risk patterns and variations, Atmos. Res., 227, 210–219, https://doi.org/10.1016/j.atmosres.2019.05.009, 2019.
Coffel, E. D., Keith, B., Lesk, C., Horton, R. M., Bower, E., Lee, J., and Mankin, J. S.: Future hot and dry years worsen Nile Basin water scarcity despite projected precipitation increases, Earth's Future, 7, 967–977, https://doi.org/10.1029/2019EF001247, 2019.
Coumou, D. and De Luca, P.: Global warming makes weather in boreal summer more persistent, Weather Clim. Dynam. Discuss. [preprint], https://doi.org/10.5194/wcd-2020-40, 2020.
Ding, Y. and Chan, C.: The East Asian summer monsoon: an overview, Meteorol. Atmos. Phys., 89, 117–142, https://doi.org/10.1007/s00703-005-0125-z, 2005.
Dong, B., Wilcox, L. J., Highwood, E. J., and Sutton, R. T.: Impacts of recent decadal changes in Asian aerosols on the East Asian summer monsoon: roles of aerosol-radiation and aerosol-cloud interactions, Clim. Dynam., 53, 3235–3256, https://doi.org/10.1007/s00382-019-04698-0, 2019.
Dosio, A., Mentaschi, L., Fischer, E. M., and Wyser, K.: Extreme heat waves under 1.5∘ and 2∘ global warming, Environ. Res. Lett., 13, 054006, https://doi.org/10.1088/1748-9326/aab827, 2018.
Gao, H., Luo, Y., Jiang, X., Zhang, D. L., Chen, Y., Wang, Y., and Shen, X.: A Statistical Analysis of Extreme Hot Characteristics and Their Relationships with Urbanization in Southern China during 1971–2020, J. Appl. Meteorol. Clim., 60, 1301–1317, https://doi.org/10.1175/JAMC-D-21-0012.1, 2021.
Genest, C., Rémillard, B., and Beaudoin, D.: Goodness-of-fit tests for copulas: A review and a power study, Insurance: Mathematics and economics, 44, 199–213, https://doi.org/10.1016/j.insmatheco.2007.10.005, 2009.
Gong, D. Y. and Ho, C. H.: Shift in the summer rainfall over the Yangtze River valley in the late 1970s, Geophys. Res. Lett., 29, 78-1–78-4, https://doi.org/10.1029/2001GL014523, 2002.
Guerreiro, S. B., Fowler, H. J., Barbero, R., Westra, S., Lenderink, G., Blenkinsop, S., Lewis, E., and Li X. F.: Detection of continental-scale intensification of hourly rainfall extremes, Nat. Clim. Change, 8, 803–807, https://doi.org/10.1038/s41558-018-0245-3, 2018.
Hao, Z., Hao, F., Singh, V. P., and Zhang, X.: Changes in the severity of compound drought and hot extremes over global land areas, Environ. Res. Lett., 13, 124022, https://doi.org/10.1088/1748-9326/aaee96, 2018.
Hao, Z., Phillips, T. J., Hao, F., and Wu, X.: Changes in the dependence between global precipitation and temperature from observations and model simulations, Int. J. Climatol., 39, 4895–4906, https://doi.org/10.1002/joc.6111, 2019.
He, B., Wang, H. L., Wang, Q. F., and Di, Z. H.: A quantitative assessment of the relationship between precipitation deficits and air temperature variations, J. Geophys. Res.-Atmos., 120, 5951–5961, https://doi.org/10.1002/2015JD023463, 2015.
He, Y., Fang, J., Xu, W., and Shi, P.: Substantial increase of compound droughts and heatwaves in wheat growing seasons worldwide, Int. J. Climatol., 42, 5038–5054, https://doi.org/10.1002/joc.7518, 2022.
Hu, Z. Z., Yang, S., and Wu, R.: Long-term climate variations in China and global warming signals, J. Geophys. Res.-Atmos., 108, 4614, https://doi.org/10.1029/2003JD003651, 2003.
Kaufman, L. and Rousseeuw, P. J.: Finding groups in data: an introduction to cluster analysis, Vol. 344, John Wiley & Sons, ISBN 9780470317488, 2009.
Kim, Y., Choi, Y., and Min, S. K.: Future changes in heat wave characteristics and their impacts on the electricity demand in South Korea, Weather and Climate Extremes, 37, 100485, https://doi.org/10.1016/j.wace.2022.100485, 2022.
Kong, Q., Guerreiro, S. B., Blenkinsop, S., Li, X. F., and Fowler, H. J.: Increases in summertime concurrent drought and heatwave in Eastern China, Weather and Climate Extremes, 28, 100242, https://doi.org/10.1016/j.wace.2019.100242, 2020.
Kornhuber, K., Osprey, S., Coumou, D., Petri, S., Petoukhov, V., Rahmstorf, S., and Gray, L.: Extreme weather events in early summer 2018 connected by a recurrent hemispheric wave-7 pattern, Environ. Res. Lett., 14, 054002, https://doi.org/10.1088/1748-9326/ab13bf, 2019.
Leonard, M., Westra, S., Phatak, A., Lambert, M., van den Hurk, B., McInnes, K., Risbey, J., Schuster, S., Jakob, D., and Stafford-Smith, M.: A compound event framework for understanding extreme impacts, WIRES. Clim. Change, 5, 113–128, https://doi.org/10.1002/wcc.252, 2014.
Li, J., Ding, T., Jia, X., and Zhao, X.: Analysis on the extreme heat wave over China around Yangtze River region in the summer of 2013 and its main contributing factors, Adv. Meteorol., 2015, 706713, https://doi.org/10.1155/2015/706713, 2015.
Li, L., Wang, B., and Zhou, T.: Contributions of natural and anthropogenic forcings to the summer cooling over eastern China: An AGCM study, Geophys. Res. Lett., 34, L18807, https://doi.org/10.1029/2007GL030541, 2007.
Li, X., You, Q., Ren, G., Wang, S., Zhang, Y., Yang, J., and Zheng, G.: Concurrent droughts and hot extremes in northwest China from 1961 to 2017, Int. J. Climatol., 39, 2186–2196, https://doi.org/10.1002/joc.5944, 2019.
Lin, W., Wen, C., Wen, Z., and Gang, H.: Drought in Southwest China: a review, Atmospheric and Oceanic Science Letters, 8, 339–344, https://doi.org/10.3878/AOSL20150043, 2015.
Lopez, H., West, R., Dong, S., Goni, G., Kirtman, B., Lee, S. K., and Atlas, R.: Early emergence of anthropogenically forced heat waves in the western United States and Great Lakes, Nat. Clim. Change, 8, 414–420, https://doi.org/10.1038/s41558-018-0116-y, 2018.
Lu, E., Cai, W., Jiang, Z., Zhang, Q., Zhang, C., Higgins, R. W., and Halpert, M. S.: The day-to-day monitoring of the 2011 severe drought in China, Clim. Dynam., 43, 1–9, https://doi.org/10.1007/s00382-013-1987-2, 2014.
Lu, Y., Hu, H., Li, C., and Tian, F.: Increasing compound events of extreme hot and dry days during growing seasons of wheat and maize in China, Sci. Rep.-UK, 8, 1–8, https://doi.org/10.1038/s41598-018-34215-y, 2018.
Lyon, B., Barnston, A. G., Coffel, E., and Horton, R. M.: Projected increase in the spatial extent of contiguous US summer heat waves and associated attributes, Environ. Res. Lett., 14, 114029, https://doi.org/10.1088/1748-9326/ab4b41, 2019.
Manning, C., Widmann, M., Bevacqua, E., Van Loon, A. F., Maraun, D., and Vrac, M.: Soil moisture drought in Europe: a compound event of precipitation and potential evapotranspiration on multiple time scales, J. Hydrometeorol., 19, 1255–1271, https://doi.org/10.1175/JHM-D-18-0017.1, 2018.
Manning, C., Widmann, M., Bevacqua, E., Van Loon, A. F., Maraun, D., and Vrac, M.: Increased probability of compound long-duration dry and hot events in Europe during summer (1950–2013), Environ. Res. Lett., 14, 094006, https://doi.org/10.1088/1748-9326/ab23bf, 2019.
Mazdiyasni, O. and AghaKouchak, A.: Substantial increase in concurrent droughts and heatwaves in the United States, P. Natl. Acad. Sci. USA, 112, 11484–11489, https://doi.org/10.1073/pnas.1422945112, 2015.
McCabe, G. J., Palecki, M. A., and Betancourt, J. L.: Pacific and Atlantic Ocean influences on multidecadal drought frequency in the United States, P. Natl. Acad. Sci. USA, 101, 4136–4141, https://doi.org/10.1073/pnas.0306738101, 2004.
McKee, T. B., Doesken, N. J., and Kleist, J.: The relationship of drought frequency and duration to time scales, in: Proceedings of the 8th Conference on Applied Climatology, Anaheim, California, 17–22 January 1993, 179–184, 1993.
Peng, D. and Zhou, T.: Why was the arid and semiarid northwest China getting wetter in the recent decades?, J. Geophys. Res.-Atmos., 122, 9060–9075, https://doi.org/10.1002/2016JD026424, 2017.
Perkins, S. E. and Alexander, L. V.: On the measurement of heat waves, J. Climate, 26, 4500–4517, https://doi.org/10.1175/JCLI-D-12-00383.1, 2013.
Pfleiderer, P., Schleussner, C. F., Kornhuber, K., and Coumou, D.: Summer weather becomes more persistent in a 2∘ world, Nat. Clim. Change, 9, 666–671, https://doi.org/10.1038/s41558-019-0555-0, 2019.
Raymond, C., Horton, R. M., Zscheischler, J., Martius, O., AghaKouchak, A., Balch, J., Bowen, S. G., Camargo, S. J., Hess, J., Kornhuber, K., Oppenheimer, M., Ruane, A. C., Wahl, T., and White, K.: Understanding and managing connected extreme events, Nat. Clim. Change, 10, 611–621, https://doi.org/10.1038/s41558-020-0790-4, 2020.
Raymond, F., Ullmann, A., Camberlin, P., Drobinski, P., and Smith, C. C.: Extreme dry spell detection and climatology over the Mediterranean Basin during the wet season, Geophys. Res. Lett., 43, 7196–7204, https://doi.org/10.1002/2016GL069758, 2016.
Raymond, F., Ullmann, A., Camberlin, P., Oueslati, B., and Drobinski, P.: Atmospheric conditions and weather regimes associated with extreme winter dry spells over the Mediterranean basin, Clim. Dynam., 50, 4437–4453, https://doi.org/10.1007/s00382-017-3884-6, 2018.
Ren, F., Cui, D., Gong, Z., Wang, Y., Zou, X., Li, Y., Wang, S., and Wang, X.: An objective identification technique for regional extreme events, J. Climate, 25, 7015–7027, https://doi.org/10.1175/JCLI-D-11-00489.1, 2012.
Ren, F. M., Trewin, B., Brunet, M., Dushmanta, P., Walter, A., Baddour, O., and Korber, M.: A research progress review on regional extreme events, Advances in Climate Change Research, 9, 161–169, https://doi.org/10.1016/j.accre.2018.08.001, 2018.
Ridder, N. N., Pitman, A. J., Westra, S., Ukkola, A., Do Hong, X., Bador, M., Hirsch, A. L., Evans, J. P., Luca, A. D., and Zscheischler, J.: Global hotspots for the occurrence of compound events, Nat. Commun., 11, 1–10, https://doi.org/10.1038/s41467-020-19639-3, 2020.
Rokach, L. and Maimon, O.: Clustering methods, in: Data mining and knowledge discovery handbook, Springer, 321–352, ISBN 9780387244358, 2005.
Salas, J. D. and Obeysekera, J.: Revisiting the concepts of return period and risk for nonstationary hydrologic extreme events, J. Hydrol. Eng., 19, 554–568, https://doi.org/10.1061/(ASCE)HE.1943-5584.0000820, 2014.
Sarhadi, A., Ausín, M. C., Wiper, M. P., Touma, D., and Diffenbaugh, N. S.: Multidimensional risk in a nonstationary climate: Joint probability of increasingly severe warm and dry conditions, Science Advances, 4, eaau3487, https://doi.org/10.1126/sciadv.aau3487, 2018.
Schepsmeier, U., Stoeber, J., Brechmann, E. C., Graeler, B., Nagler, T., Erhardt, T., Almeida, C., Min, A., Czado, C., Hofmann, M., Killiches, M., Joe, H., and Vatter, T.: Statistical Inference of Vine Copulas, R package version 2.0.5, https://CRAN.R-project.org/package=VineCopula (last access: 14 October 2022), 2016.
Serinaldi, F.: Dismissing return periods!, Stoch. Env. Res. Risk A., 29, 1179–1189, https://doi.org/10.1007/s00477-014-0916-1, 2015.
Shao, D., Chen, S., Tan, X., and Gu, W.: Drought characteristics over China during 1980–2015, Int. J. Climatol., 38, 3532–3545, https://doi.org/10.1002/joc.5515, 2018.
Sharma, S. and Mujumdar, P.: Increasing frequency and spatial extent of concurrent meteorological droughts and heatwaves in India, Sci. Rep.-UK, 7, 1–9, https://doi.org/10.1038/s41598-017-15896-3, 2017.
Sheffield, J., Andreadis, K. M., Wood, E. F., and Lettenmaier, D. P.: Global and continental drought in the second half of the twentieth century: Severity-area-duration analysis and temporal variability of large-scale events, J. Climate, 22, 1962–1981, https://doi.org/10.1175/2008JCLI2722.1, 2009.
Shi, Y., Shen, Y., Kang, E., Li, D., Ding, Y., Zhang, G., and Hu, R.: Recent and future climate change in northwest China, Climatic change, 80, 379–393, https://doi.org/10.1007/s10584-006-9121-7, 2007.
Sillmann, J., Kharin, V. V., Zhang, X., Zwiers, F. W., and Bronaugh, D.: Climate extremes indices in the CMIP5 multimodel ensemble: Part 1. Model evaluation in the present climate, J. Geophys. Res.-Atmos., 118, 1716–1733, https://doi.org/10.1002/jgrd.50203, 2013.
Stefanon, M., D'Andrea, F., and Drobinski, P.: Heatwave classification over Europe and the Mediterranean region, Environ. Res. Lett., 7, 014023, https://doi.org/10.1088/1748-9326/7/1/014023, 2012.
Sugiyama, J. and Kobayashi, K.: wvtool: Image Tools for Automated Wood Identification, https://rdocumentation.org/packages/wvtool/versions/1.0 (last access: 22 July 2022), 2016.
Sun, L., Ren, F., Wang, Z., Liu, Y., Liu, Y., Wang, P., and Wang, D.: Analysis of Climate Anomaly and Causation in August 2011, Meteor. Mon., 38, 615–622, 2012.
Sutanto, S. J., Vitolo, C., Di Napoli, C., D'Andrea, M., and Van Lanen, H. A.: Heatwaves, droughts, and fires: Exploring compound and cascading dry hazards at the pan-European scale, Environ. Int., 134, 105276, https://doi.org/10.1016/j.envint.2019.105276, 2020.
Trenberth, K. E., Dai, A., Van Der Schrier, G., Jones, P. D., Barichivich, J., Briffa, K. R., and Sheffield, J.: Global warming and changes in drought, Nat. Clim. Change, 4, 17–22, https://doi.org/10.1038/nclimate2067, 2014.
Vogel, M. M., Zscheischler, J., Fischer, E. M., and Seneviratne, S. I.: Development of future heatwaves for different hazard thresholds, J. Geophys. Res.-Atmos., 125, e2019JD032070, https://doi.org/10.1029/2019JD032070, 2020.
Wang, A., Lettenmaier, D. P., and Sheffield, J.: Soil moisture drought in China, 1950–2006, J. Climate, 24, 3257-3271, https://doi.org/10.1175/2011JCLI3733.1, 2011.
Wang, P., Tang, J., Wang, S., Dong, X., and Fang, J.: Regional heatwaves in china: a cluster analysis, Clim. Dynam., 50, 1901–1917, https://doi.org/10.1007/s00382-017-3728-4, 2018.
Wang, W., Zhou, W., Li, X., Wang, X., and Wang, D.: Synoptic-scale characteristics and atmospheric controls of summer heat waves in China, Clim. Dynam., 46, 2923–2941, https://doi.org/10.1007/s00382-015-2741-8, 2016.
Ward Jr., J. H.: Hierarchical grouping to optimize an objective function, J. Am. Stat. Assoc., 58, 236–244, https://doi.org/10.1080/01621459.1963.10500845, 1963.
Wu, J. and Gao, X. J.: A gridded daily observation dataset over China region and comparison with the other datasets, Chinese J. Geophys., 56, 1102–1111, https://doi.org/10.6038/cjg20130406, 2013 (in Chinese, data available at: http://climatechange-data.cn/resource/detail?id=228, last access: 8 February 2023).
Yang, C., Tuo, Y., Ma, J., and Zhang, D.: Spatial and Temporal Evolution Characteristics of Drought in Yunnan Province from 1969 to 2018 Based on SPI/SPEI, Water Air Soil Poll., 230, 1–13, https://doi.org/10.1007/s11270-019-4287-6, 2019a.
Yang, Y., Tang, J., Xiong, Z., Wang, S., and Yuan, J.: An intercomparison of multiple statistical downscaling methods for daily precipitation and temperature over China: future climate projections, Clim. Dynam., 52, 6749–6771, https://doi.org/10.1007/s00382-018-4543-2, 2019b.
Ye, J., Li, W., Li, L., and Zhang, F.: “North drying and south wetting” summer precipitation trend over China and its potential linkage with aerosol loading, Atmos. Res., 125, 12–19, 2013.
Yu, R. and Zhai, P.: More frequent and widespread persistent compound drought and heat event observed in China, Sci. Rep.-UK, 10, 1–7, https://doi.org/10.1038/s41598-020-71312-3, 2020.
Yu, R., Wang, B., and Zhou, T.: Tropospheric cooling and summer monsoon weakening trend over East Asia, Geophys. Res. Lett., 31, L22212, https://doi.org/10.1029/2004GL021270, 2004.
Yu, Y. and Ginoux, P.: Enhanced dust emission following large wildfires due to vegetation disturbance, Nat. Geosci., 15, 878–884, https://doi.org/10.1038/s41561-022-01046-6, 2022.
Zhang, J., Chen, H., and Zhang, Q.: Extreme drought in the recent two decades in northern China resulting from Eurasian warming, Clim. Dynam., 52, 2885–2902, https://doi.org/10.1007/s00382-018-4312-2, 2019.
Zhang, L., and Zhou, T.: Drought over East Asia: a review, J. Climate, 28, 3375–3399, https://doi.org/10.1175/JCLI-D-14-00259.1, 2015.
Zhang, L., Wu, P., and Zhou, T.: Aerosol forcing of extreme summer drought over North China, Environ. Res. Lett., 12, 034020, https://doi.org/10.1088/1748-9326/aa5fb3, 2017.
Zhao, P., Yang, S., and Yu, R.: Long-term changes in rainfall over eastern China and large-scale atmospheric circulation associated with recent global warming, J. Climate, 23, 1544–1562, https://doi.org/10.1175/2009JCLI2660.1, 2010.
Zhou, B., Xu, Y., Wu, J., Dong, S., and Shi, Y.: Changes in temperature and precipitation extreme indices over China: analysis of a high-resolution grid dataset, Int. J. Climatol., 36, 1051–1066, https://doi.org/10.1002/joc.4400, 2016.
Zhou, T. J., Gong, D. Y., Li, J., Li, B.: Detecting and understanding the multi-decadal variability of the East Asian Summer Monsoon Recent progress and state of affairs, Meteorol. Z., 18, 455–467, https://doi.org/10.1127/0941-2948/2009/0396, 2009.
Zscheischler, J. and Fischer, E. M.: The record-breaking compound hot and dry 2018 growing season in Germany, Weather and Climate Extremes, 29, 100270, https://doi.org/10.1016/j.wace.2020.100270, 2020.
Zscheischler, J. and Seneviratne, S. I.: Dependence of drivers affects risks associated with compound events, Science Advances, 3, e1700263, https://doi.org/10.1126/sciadv.1700263, 2017.
Zscheischler, J., Martius, O., Westra, S., Bevacqua, E., Raymond, C., Horton, R. M., Hurk, B., AghaKouchak, A., Jézéquel, A., Mahecha, M. D., Maraun, D., Ramos, A. M., Ridder, N. N., Thiery, W., and Vignotto, E.: A typology of compound weather and climate events, Nature Reviews Earth & Environment, 1, 333–347, https://doi.org/10.1038/s43017-020-0060-z, 2020.
Zscheischler, J., Westra, S., Van Den Hurk, B. J. J. M., Seneviratne, S. I., Ward, P. J., Pitman, A., Aghakouchak, A., Bresch, D. N., Leonard, M., Wahl, T., and Zhang, X.: Future climate risk from compound events, Nat. Clim. Change, 8, 469–477, https://doi.org/10.1038/s41558-018-0156-3, 2018.
Zscheischler, J., Naveau, P., Martius, O., Engelke, S., and Raible, C. C.: Evaluating the dependence structure of compound precipitation and wind speed extremes, Earth Syst. Dynam., 12, 1–16, https://doi.org/10.5194/esd-12-1-2021, 2021.