the Creative Commons Attribution 4.0 License.
the Creative Commons Attribution 4.0 License.
 | 09 Feb 2023
Coastal extreme sea levels in the Caribbean Sea induced by tropical cyclones
Ariadna Martín
Angel Amores
Alejandro Orfila
Tim Toomey
Every year the Caribbean Sea faces the passage of several tropical cyclones that generate coastal extreme sea levels with potential strong and hazardous impacts. In this work we simulate the storm surges and wind waves induced by a set of 1000 tropical cyclones over the Caribbean Sea that are representative of the present-day climate. These events have been extracted from a global database of synthetic tropical cyclones spanning a 10 000-year period. The atmospheric forcing fields, associated with the set of tropical cyclones, are used to feed a coupled hydrodynamic–wave model with high resolution (∼ 2 km) along the continental and island coasts. Given the large number of events modelled, our results allow detailed statistical analyses of the magnitude and mechanisms of coastal extreme sea levels, as well as the identification of one of the most exposed areas to both storm surges and extreme wind waves.
- Article
(7389 KB) - Full-text XML
-
Supplement
(2432 KB) - BibTeX
- EndNote


Tropical cyclones (TCs) are among the most hazardous natural disasters, significantly affecting population safety, economies and ecosystems in coastal areas. The eastern coast of Central and North America are among the most affected regions by these events worldwide (Needham et al., 2015). Here we focus on the coastal regions of the Caribbean Sea, an area far less investigated when compared to the Gulf of Mexico in spite of its exposure to TCs being similar. With a relatively small landmass and total population (∼ 44 million people based on the latest United Nations estimates; woldometers, 2020), the Caribbean has experienced, in the past 2 decades, 163 storm events (hurricanes and storm surges) affecting a total of 25.8 million people and resulting in more than 5000 deaths (Centre for Research on the Epidemiology of Disasters, 2020). Moreover, the Caribbean Sea contains more than 700 islands. The characteristics of these tropical islands (i.e their size, coastal population density, morphology, elevation and coastal defences) make them particularly vulnerable territories to the impact of low-frequency and high-intensity events, such as TCs (Pillet et al., 2019b; Duvat et al., 2017; Giuliani and Peduzzi, 2011). Even for some of these small island nations, the damage caused by TCs can exceed the size of their economies. This is the case of Dominica, which in 2017 was affected by Hurricane Maria causing a damage cost estimated at 226 % of its 2016 gross domestic product (GDP) (GFDRR, 2017). Another example is Grenada, affected by Hurricane Ivan in 2004 that caused economic damage exceeding 200 % of their GDP (ECLAC, 2004). As the socio-economy of small islands depends on the preservation of the coastal zone, it is crucial to investigate and support hurricane risk mitigation efforts in these areas.
TCs are a relatively rare phenomenon with around 90 (±10) formations per year globally. In addition, historical records of TCs are in general scarce, since reliable TC datasets are only available from 1980 onwards (Bloemendaal et al., 2020). In consequence, there have been earlier studies that are limited to particular small areas, islands or bays where observations are available during the passage of a TC. This is the case, for example, of Batabanó, Samaná Bay, Guadeloupe and Dominica (Arenal et al., 1998; Krien et al., 2015). One way to overcome the historical lack of observations of TCs is the generation of synthetic hurricane databases, built consistently with the observed TC characteristics that allow more robust statistical analyses of TC frequency and intensities and that can be used to evaluate the associated risks (Appendini et al., 2017; Lin et al., 2014). This study will take advantage of one of these synthetic hurricane databases by Bloemendaal et al. (2020), which is used here to provide an unified Caribbean-wide view of the marine hazards generated by TCs. This dataset contains hurricanes and tropical storms; therefore we are going to refer to all the dataset as TCs. The amount and geographical consistency of synthetic data permit us to perform a spatially coherent study along all Caribbean coastlines instead of investigating single events. In particular, we focus on the ocean hazards generated by TCs in terms of wind waves and storm surges using a set of 1000 TCs extracted from the synthetic dataset combined with a fully coupled hydrodynamic–wave model. This is the first time, to our knowledge, that both mechanisms responsible for coastal hazards have been investigated together and at basin scale in this region in a consistent manner. We analyse in detail the outputs of the numerical simulations to quantify the role of the different forcing factors in affecting coastal extreme sea levels from TCs, namely the atmospheric pressure, the wind and the wind waves.
This paper is structured as follows: in Sect. 2 we describe the different datasets used with the hydrodynamic model. Section 3 includes the results of wind waves and sea surface elevation along the Caribbean coastlines. Summary and conclusions are given in Sect. 4.
2.1 Data
The tracks of synthetic TCs were extracted from the STORM (Synthetic Tropical cyclOne geneRation Model) dataset (Bloemendaal et al., 2020). It consists of 10 000 years of TCs over the globe obtained using a fully statistical model approach fed with observed TC tracks and is thus representative of present-day climate conditions. This dataset provides, for each TC, its track, minimum pressure, maximum wind speed and the radius of maximum wind speed (Rmax) with a 3-hourly time step during its lifetime. Within the 10 000-year synthetic TCs available in the STORM dataset, 25 494 of them affected the Caribbean Sea (∼2.5 TCs yr−1). This rate is in agreement with the 2.7 TCs yr−1 observed from 1944 to 1970 (Goldenberg et al., 2001) and the 2.47 TCs yr−1 published in Chenoweth (2006) computed from 155 years of records. Among the entire set of TCs affecting the Caribbean, we aim to select a subsample in such a way that it is statistically consistent with the original sample in terms of the TC intensity and its spatial distribution (Fig. 1) and is, at the same time, small enough to perform basin-wide numerical simulations. There are several methods to select a subsample that is consistent with a larger dataset (e.g. K means; Enríquez et al., 2020; maximum dissimilarity algorithm; Camus et al., 2011). Among the different options, we follow Toomey et al. (2022) to choose the size of the subsample. This consists of comparing the probability distribution functions (PDFs) of the original dataset (corresponding to the 25 494 TCs) to the selected samples (with sizes ranging between 10 to 10 000 events) on the basis of two statistical tests, namely the root-mean-square deviation (RMSD; Fig. 1a) and the correlation (Fig. 1b). This process was performed 1000 times for each size of the subsamples (selecting randomly the events each time) and for both the maximum wind speed and the spatial distribution of the TC track PDFs. In this case the PDF is built using the number of TCs (counting each time step) passing through each pixel of the grid. The spatial domain has been divided into 2∘ bins, represented in Fig. 1, while for the maximum wind speed distribution the bins size was fixed at 2 m s−1. We seek to determine a size for the subsample that is a good representation of the original distribution and also small enough to perform the numerical simulations described in Sect. 2.3 within a reasonable computational time. Our results (Fig. 1a and c) indicate that a subsample of 1000 TCs is statistically consistent with the original distribution both in intensity and spatial distribution in this area. The maps in Fig. 1 represent this behaviour, showing the percentage of TCs per pixel for the total sample (panel e) and the selected subsample (1000 TCs, panel f).
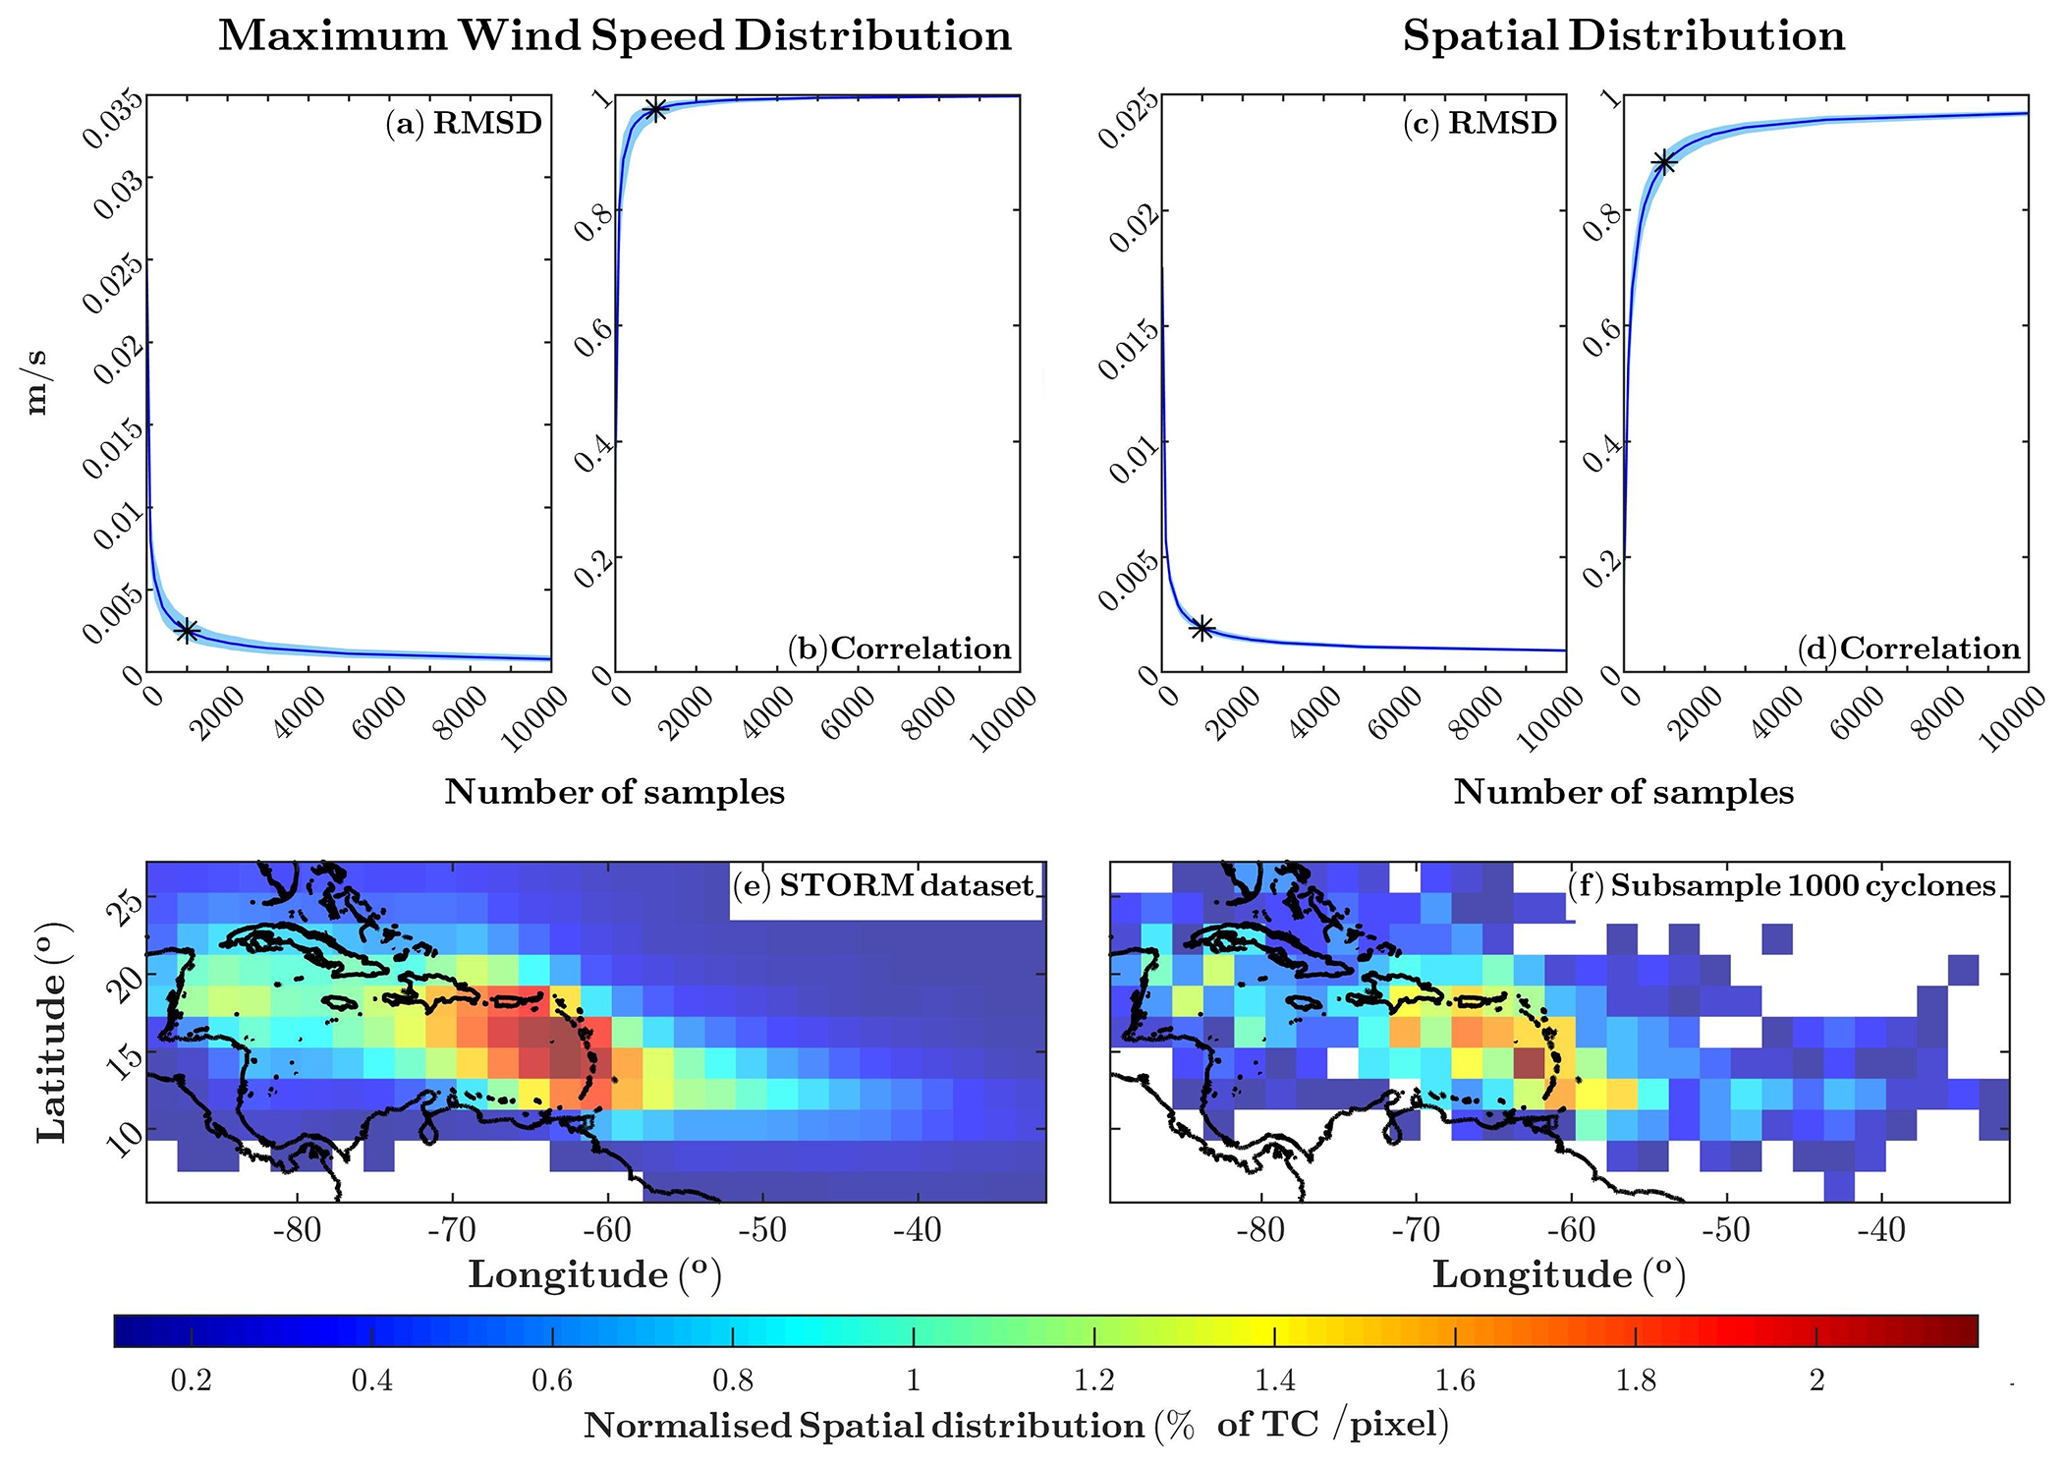
Figure 1Statistical tests carried out on the Caribbean cyclone subsamples using the following as variables: the maximum speed for (a) and (b) and the spatial distribution for (c) and (d). The blue line represents the median, and the light blue part represents the range of values between the percentiles 95 and 5 in each panel. Units of (c) are the normalised number of TC per pixel, where the normalisation is defined as the number of TCs affecting each pixel divided by the total. Panels (e) and (f) represent, respectively, the percentage of cyclones per pixel for the total sample (∼ 25 000 TCs) and the subsample selected for the project (∼ 1000 TCs), marked in the rest of the panels.
In addition to the synthetic TCs described above, five real events were studied (see Table 1). These have been selected for model validation because observations for buoys and/or tide gauges were available. To recreate the atmospheric fields of these events, the maximum wind speed and minimum pressure along the track were extracted from IBTrACS (Knapp et al., 2010, 2018), with a temporal resolution of 3 h, so the output is directly comparable with the synthetic data. The radius of maximum wind speed (Rmax) is also necessary to build the associated 2D fields (see Sect. 2.2). This is available in IBTrACS only after the year 2000, so all five selected events belong to the last 20 years of data.
Coastal sea-level observations from tide gauges and wind-wave measurements from in situ buoys have been used to validate the numerical simulation of the already mentioned five real hurricanes. Sea-level data were obtained from GESLA dataset version 2 (https://gesla.org/, last access: 8 September 2020; Woodworth et al., 2016), which contains a total of 46 sea-level records in the Caribbean Sea. Unfortunately, given their location they contain very few footprints of TCs, further reduced due to the limited period after the year 2000. We have considered only peaks of sea level exceeding 0.4 m. Only three TCs in two different tide gauges fulfil this criterion for this period of time. To compare with the sea surface elevation, SSE, of the model that only accounts for the contribution of the TC, we compute the non-tidal residual using the UTide function for the complete record. The wind-wave measurements were retrieved from the National Data Buoy Center (1971) (NOAA, https://www.ncei.noaa.gov/archive/accession/NDBC-CMANWx, last access: 2 September 2020). A total of 34 buoys were available inside the area of study, 27 of which are found inside the Caribbean Sea and 7 in the nearby Atlantic Ocean. In contrast to tide gauge data, more wave observations were available from buoys. This adds two more TCs, resulting in a total of five TCs and 15 buoys used for the validation of wind waves. All instruments selected are shown in Fig. 2.
Table 1List of the TCs used for the validation along with their respective buoys and tide gauges used in the validation.


Figure 2Domain of simulation (with the inset indicating the global region) and the computational grid. The colours represent the distance between nodes in the computational grid, with the spatial resolution varying with depth. Thick black lines represent the open boundaries of the model domain. Black markers represent the location of buoys and tide gauges used for the validation, with the shape indicating the corresponding TC, as in Table 1. In some cases, the same instrument is used for various cases, with the exact position denoted by white lines.
2.2 Generation of 2D fields from synthetic tracks
The 1000 synthetic TC tracks extracted from the STORM dataset were used to build the 2D atmospheric fields required to force the hydrodynamic model. Atmospheric pressure and surface wind fields for each TC were generated onto a 5 km regular grid using the same temporal resolution of the synthetic tracks (3 h). The wind field accounts for a translational component that drives the TC forward and a cyclonic component. The former was calculated using the track, while the radial component was calculated based on the empirical Holland wind profile (Holland, 1980) with the latest revision of the formulation (Holland et al., 2010). This formulation has been extensively used for reconstructing hurricane wind fields (Sitkowski et al., 2011; Boose, 2004). Translational and circular wind velocity components were added after setting the translational component to zero at distances greater than 300 km from the hurricane eye (Holland, 1980; Holland et al., 2010). The final step for the wind fields consists of reducing the velocity by 20 % over land areas (Willoughby and Black, 1996).
2.3 Hydrodynamical model
We simulated storm surges and wind waves caused by the 2D fields derived from the synthetic and the five real TCs over the Caribbean Sea using the latest version (5.8) of the SCHISM model (Semi-implicit Cross-scale Hydroscience Integrated System Model; Zhang et al., 2016), a state-of-the-art cross-scale hydrodynamic model, which is a derivative product built from the original SELFE (Zhang and Baptista, 2008). Here we have used the hydrodynamic core in its depth-average (2DH) barotropic mode fully coupled with the spectral wave model WWM-III (Roland et al., 2012).
The bathymetry used for the hydrodynamic model and the spectral wave model was GEBCO 2020 (available at https://www.gebco.net/data_and_products/gridded_bathymetry_data, last access: 28 August 2020; GEBCO, 2020) on a 15 arcsec geographic latitude and longitude grid, which in the Caribbean Sea region corresponds to ∼450 m. Both models were implemented using the same unstructured grid (generated using the triangle algorithm; Shewchuk, 1996) that covers the whole Caribbean Sea and part of the Atlantic Ocean with a total of 135 759 nodes (Fig. 2). The spatial resolution varies as a function of the depth, within a range of around 40 km in open ocean down to ∼2 km along the coastlines. The coastline used was downloaded from https://osmdata.openstreetmap.de/data/coastlines.html (last access: 27 August 2020), which, on average, has a spatial resolution of approximately 40 m (OpenStreetMap contributors, 2017). The resolution of the coastline was reduced to 2 km except in areas with abrupt changes in the coastline.
The computational domain (Fig. 2) was chosen to include the prevailing TC incoming directions. Although TCs affecting the Caribbean Sea can develop further inside the Atlantic Ocean, from the coast of West Africa, the selected domain is large enough to allow a correct generation and propagation of the wind waves originated by TCs affecting the Antilles (i.e. it accommodates enough space for the wind fetch to act). There are two open boundaries in the model, both with free elevation and velocity forced to 0, corresponding to the Atlantic Ocean boundary and the region between Cuba and Mexico (black lines in Fig. 2).
The spectral domain for the wind-wave model has been fixed to 24 bins for both direction (i.e. 15∘ bins) and frequency (ranging between 0.04 to 0.6 Hz). For the bottom friction the Manning's drag coefficient was fixed to 0.02, and the wind stress was calculated using the Pond and Pickard formulation (Pond and Pickard, 1983), used for the hydrodynamic model, while for the fully coupled run the wind surface stress is calculated directly using the forcing fields, which has proven to be superior to the former when waves are available (Bertin et al., 2015). The computational time step was set to 10 min for the hydrodynamical model and 30 min for the wave model. The selected variables (significant wave height (Hs), sea surface elevation, air pressure, wind speed, wave peak period (Tp) and wave peak direction (Dp)) were saved every hour. The model configuration was defined after model validation using the five real events, with a reasonable computational cost (see Sect. 3.2).
To analyse the role of the different contributions of the atmospheric forcing fields, i.e. atmospheric pressure, wind and the wind waves, four different numerical simulations where performed for each TC: (1) a fully coupled run between the hydrodynamic model and the wind-wave module that takes into account all contributions, as well as their coupling; (2) a run using only the hydrodynamic model forced with atmospheric pressure and wind; here the contribution of the wind waves is excluded; (3) a hydrodynamic model run forced using only the atmospheric pressure, in which the winds were fixed to 0 m s−1; and (4) a hydrodynamic model run forced only by the wind, setting the atmospheric pressure constant to 101 325 Pa. Finally, the contribution of the wind waves was extracted from the differences between runs number 1 and 2 which accounts for all the couplings, while the effects of the atmospheric pressure and wind could directly be quantified from simulations 3 and 4, respectively. The method for obtaining the pure contribution of each factor, as well as the synergistic effect due to the mutual interactions among two or more of these factors, should be carried out using 2n simulations, where n is the number of forcings to be separated. Thus, the wind and pressure contributions were correctly separated, while the wind-wave contribution implicitly includes all the couplings with the other forcing interactions (wind waves–wind, wind waves–pressure and the wind waves–pressure–wind term), which we assume are small compared to the main contribution of wind waves (Amores et al., 2020).
The computational time of each TC was ∼3 h for the fully coupled runs using only one CPU. In our case, we used 20 processors, which allowed us to reduce the computational time to approximately 10 d by running simultaneously 20 TCs. For the hydrodynamic runs in which the wind-wave model is not used, the total computational time was about 2 d per configuration (including the 1000 TCs). This leads to a total computational time of approximately 2 weeks.
2.4 Computation of return levels
Return levels for extreme coastal waves and sea surface elevation (SSE) at every coastal grid point have been calculated using a generalised Pareto distribution (GPD) fitted to all values over a chosen threshold. Using POT (peaks over threshold) analysis, together with GPD, increases the number of measurements included in the analysis and correspondingly reduces the statistical uncertainty of quantile variances (Brabson and Palutikof, 2000). Studying return periods for events such as TCs adds a difficulty in selecting the threshold, since by definition they are all extremes. However, each event affects different areas of the Caribbean Sea, so it is not appropriate for setting a common threshold for the entire area of study; rather, the threshold has been chosen for every grid point. For this purpose, the data at each grid point have been adjusted to a GPD successively, each time removing one value from the adjustment. The threshold is considered the point where the GPD stabilises and all the return levels remain constant regardless of the value of the threshold. We consider this point as the threshold of the extremes of each grid point.
3.1 Characteristics of TCs affecting the Caribbean Sea
The characteristics of the TCs affecting the Caribbean coastlines are represented in Fig. 3 in terms of their intensity and frequency. The top panels show the median (panel a) and 95th percentile (panel b) of the maximum wind speed of TCs reaching the coastlines (note the different colour scales). The number of TCs affecting the coasts (and for which the speeds are represented in the upper panels) is mapped in Fig. 3c, showing a well-defined geographic pattern: while the eastern part of the basin receives more than three TCs per decade, the western coasts are affected on average by less than one per decade. The lower impacts in this region can be related to the decrease in the Coriolis force towards the Equator and the consequent low probability, less than 1 % yr−1 (Torres and Tsimplis, 2014), of TCs turning southwards to these coasts. The southern coast of the Caribbean (north of South America) barely sees any TCs because of their prevailing travelling direction towards the west-northwest, which suggests that the energy is dissipated before reaching those coasts. The areas affected by a larger number of TCs include the West Indies and the islands of La Española (Dominican Republic and Haiti) and Puerto Rico, which are heavily exposed to Atlantic TCs. Given the clear spatial differences, it is important to distinguish two different families of TCs, which can be classified depending on their region of origin, either in the Atlantic Ocean or inside the Caribbean Sea. Each one of these families has a distinct footprint along the Caribbean coastlines, with the eastern part of the Caribbean Sea being affected only by TCs generated in the Atlantic Ocean and the western coasts being hit by both families although primarily by those originating within the same basin. This pattern is displayed in Fig. 3e and f, where the median intensities of the two families of TCs affecting each coastal point are represented. The TCs from the Atlantic Ocean (panel f) are the more intense, reaching maximum speeds exceeding 200 km h−1, and also more frequent (66.1 %), while these values are around 125 km h−1 and 33.9 % for TCs generated within the Caribbean (note the different colour scales in the maps). Interestingly, the most intense TCs hit the western part of the Caribbean coastlines; the reason is that these TCs, which are strong in origin, are further intensified during their trip through the warm Caribbean Sea. Regarding the areas exposed to both families of TCs, the western part of Cuba is the area hit by the most intense TCs. Although the TCs affecting the lesser Antilles are not the most intense ones, the greater number of them makes this area one of the most exposed to their impacts.
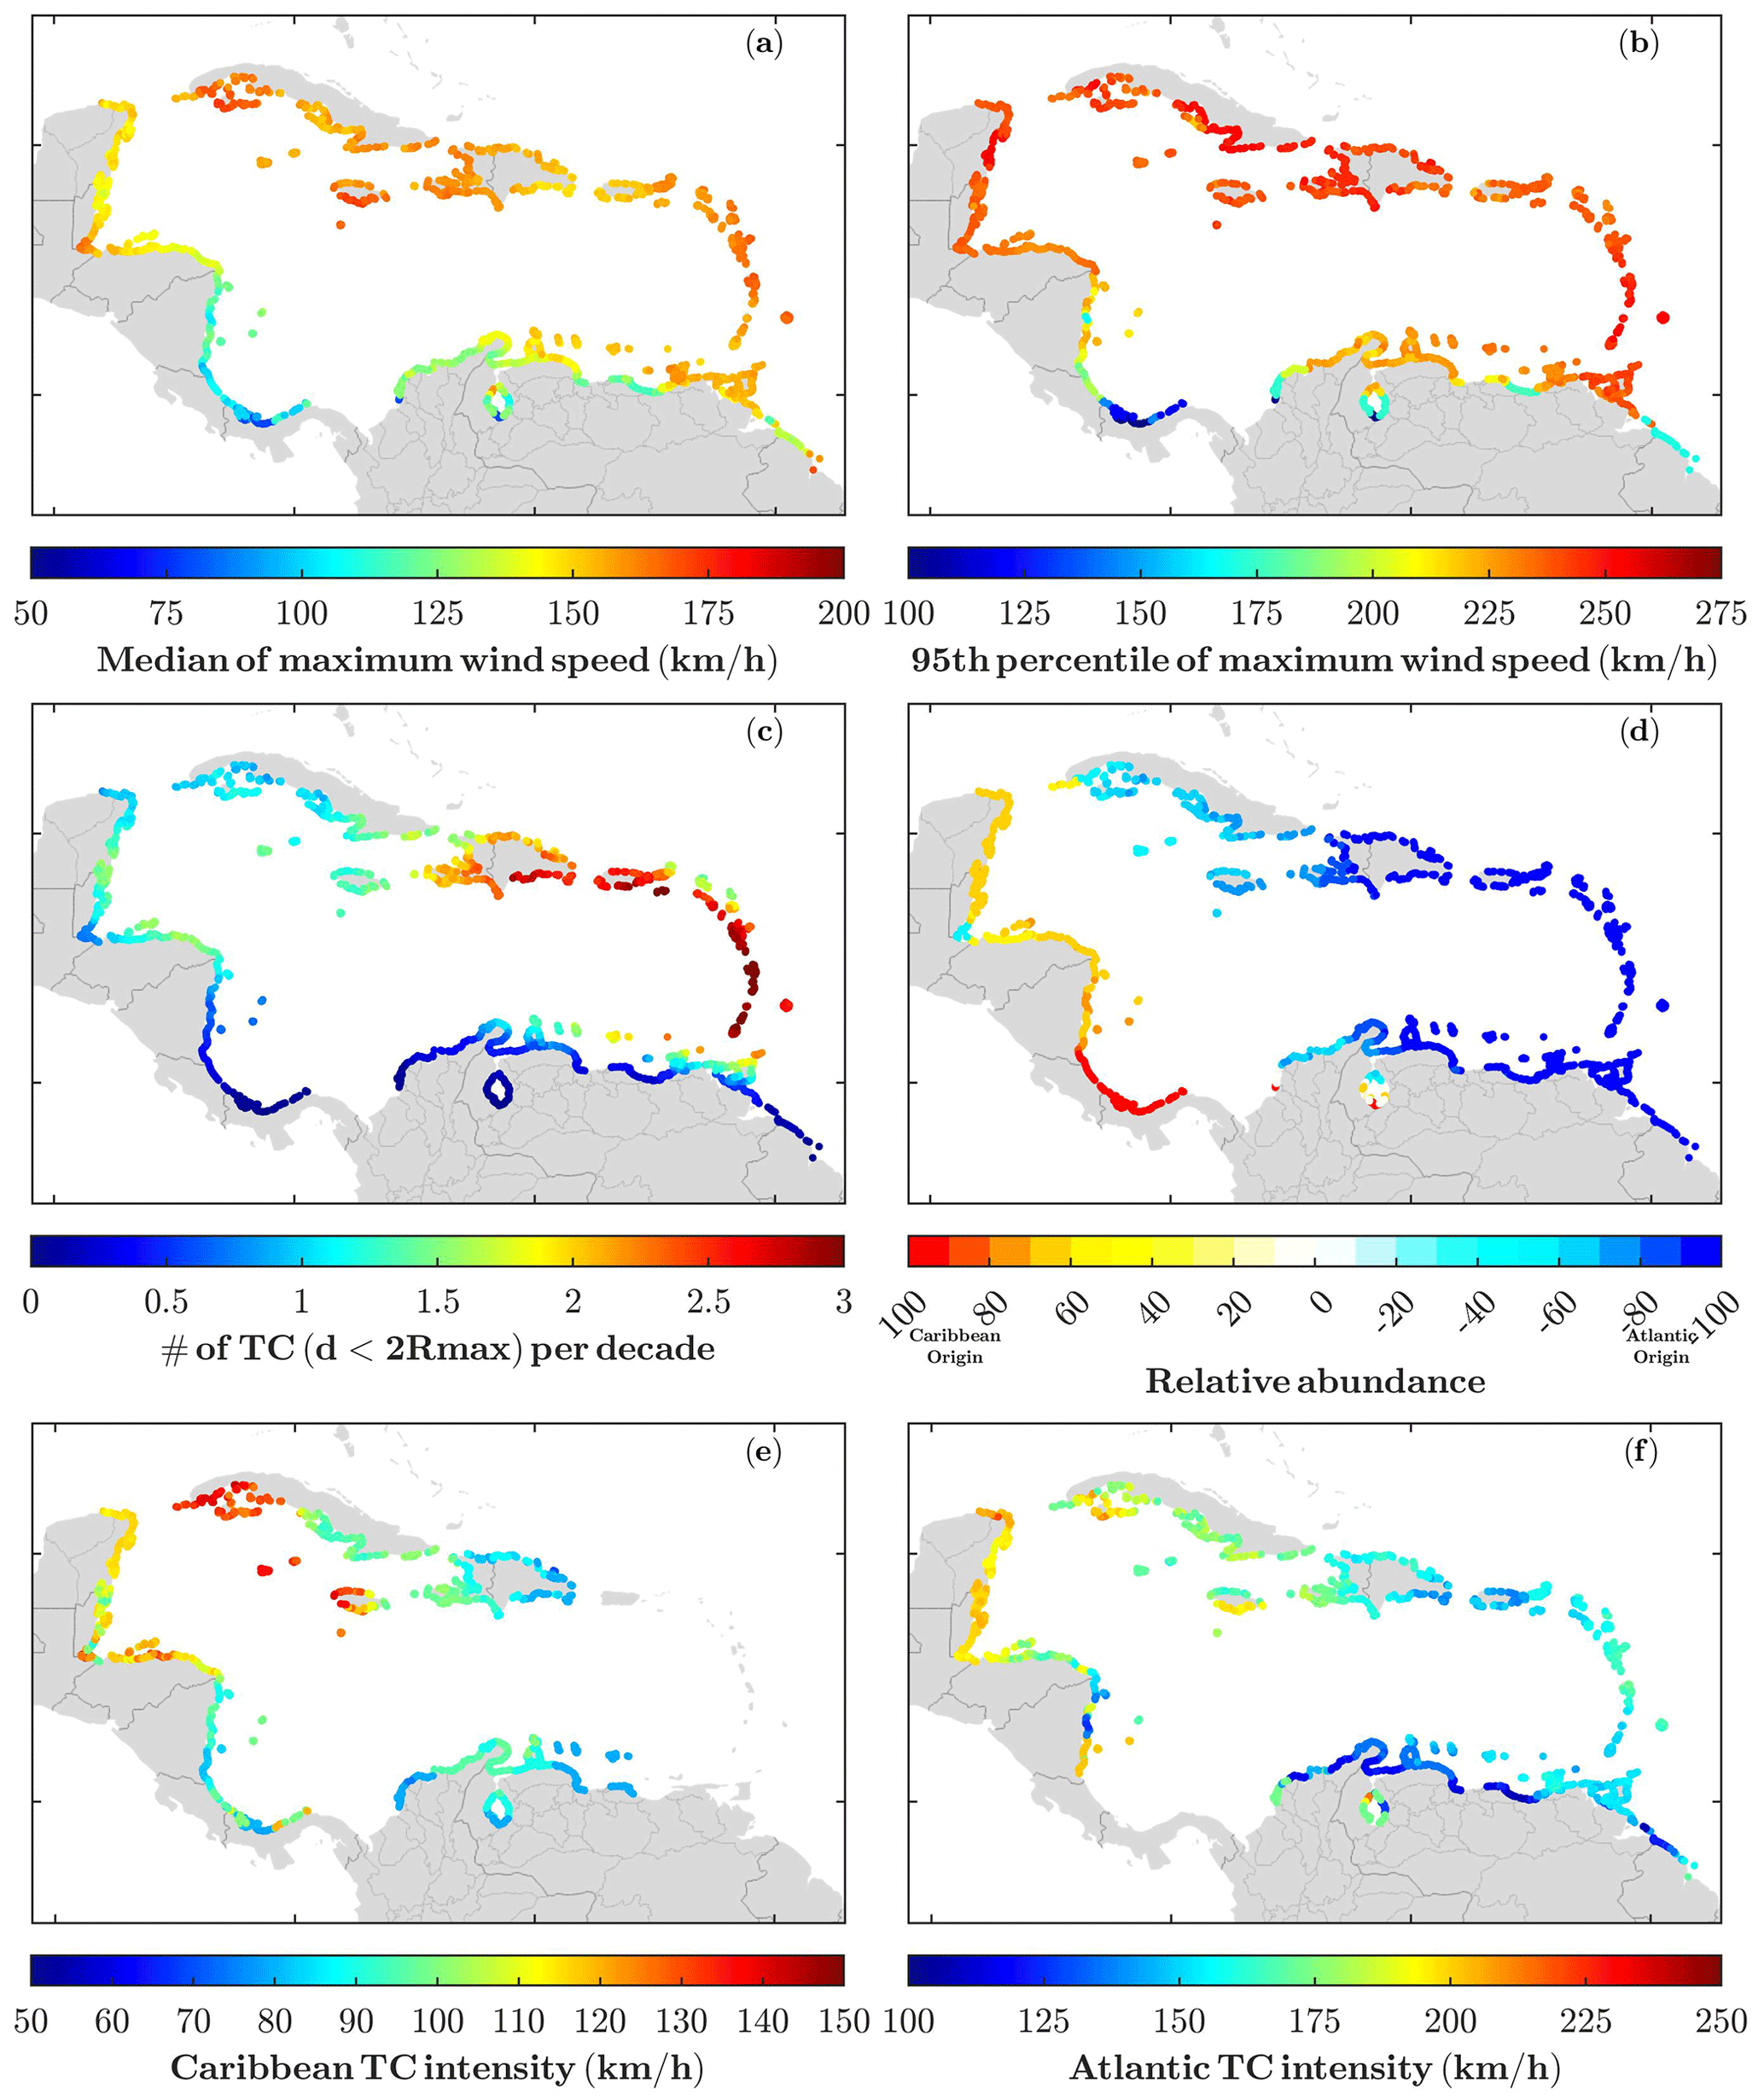
Figure 3Characteristics of TCs affecting the Caribbean coasts. The top panels (a, b) show the intensity of the selected subset of TCs in terms of the mean and the 95th percentile of the maximum wind speed when they reach the coastline. Panel (c) shows the number of TCs per decade affecting each coastline, considering that a coastal grid point is affected if it is within a radius smaller than twice Rmax. Panel (d) represents the family of TCs (Atlantic or Caribbean) that most affect every grid point in percentage. In this way, 0 is obtained if both families affect equally, and in colour is the percentage of the one that affects more. The entire red zone is dominated by TCs generated in the interior of the Caribbean Sea, while the blue zone is more influenced by TCs of the Atlantic Basin. Finally, (e) and (f) show the median maximum wind speed of TCs from each family.
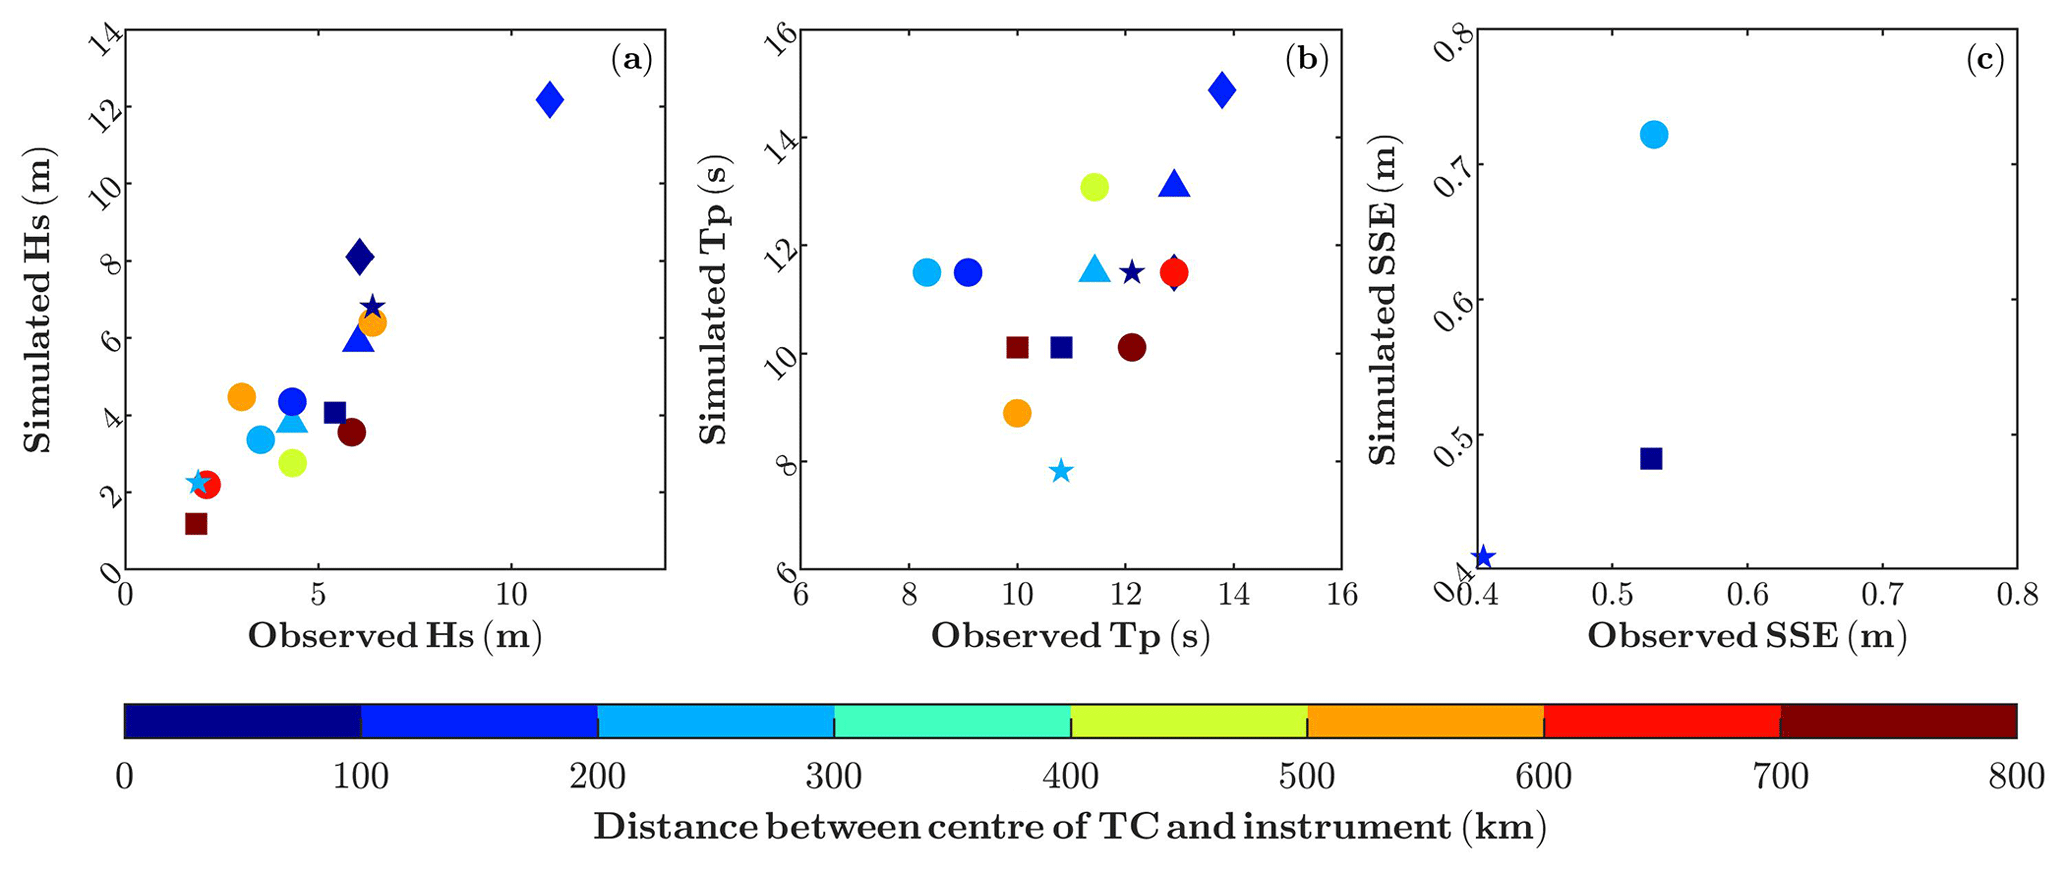
Figure 4Comparison between modelled Hs (a), Tp at the maximum of Hs (b) and SSE (c) with the observations from in situ buoys (a, b) and tide gauges (c). The forms indicate the TC (see Table 1), and the colours correspond to the distances between the eye of the TC and each instrument at the moment of the largest observed value (see Fig. 2).
These results have been obtained using the TCs from the selected subset. When the same maps are produced with the complete TC dataset, the patterns are essentially identical with the only exception being in the number of Caribbean TCs and their intensities affecting the Antilles (see Fig. S1c in the Supplement). The difference comes from a few TCs in the complete dataset that are generated in the Caribbean Sea and move in a predominantly eastward instead of westward direction. This is an extremely rare phenomenon, accounting for less than 20 TCs from the 25 494 available in the dataset, which represents less than 0.001 % of the total number of TCs generated in the Caribbean Sea. Thus, it is not surprising that they are not represented in the subset. Landfall patterns are a very important factor in the calculation of TC risk. Figures 3 and S1 show a clear agreement between the subset and the complete dataset from STORM. However, there are some discrepancies in the number of landfalls per year between STORM and IBTrACS due to a substantial difference in the year-to-year landfall counts of the IBTrACS dataset. Yet, on average, the landfall counts of the two datasets are within 1 standard deviation of each other (Bloemendaal et al., 2020).
3.2 Model validation
The performance of the methodology, including the construction of synthetic atmospheric fields and the ocean model, has been tested against all available in situ observations of Hs, Tp and SSE. To do so, all TCs within IBTrACS for which maximum wind speed, minimum pressure along the track and radius of the maximum wind speed are available have been used. This limits the number of events, since radius is only available after the year 2000. The TCs that fulfil these criteria and for which there exist in situ observations are listed in Table 1. Results are plotted in Fig. 4 in terms of maximum modelled and observed values. For the model, the closest grid point to the buoy or the tide gauge is chosen. Note that the number of observations for Hs is significantly larger than those for SSE. This is because there are few TCs that have passed close enough to a tide gauge since the year 2000 (Torres and Tsimplis, 2014). Our criterion is that at least a sea-level peak of 0.4 m must be recorded to be linked to a TC.
In general, there is a good agreement between observed and modelled maxima, especially for the wave data (Fig. 4a and b). We therefore conclude that the methodology is accurate enough to represent the response of the ocean to incoming TCs in the Caribbean Sea. Shortcomings of the results and the model setup will be discussed later in the last section.
3.3 Coastal wind waves induced by TCs
The metric chosen to characterise the wave hazards induced by TCs along the coastlines has been defined as the 99th percentile of the set of maximum Hs for each TC at every coastal grid point (i.e. a measure of the 10th most intense TC from the 1000 simulated for each particular location). The results are mapped in Fig. 5, which includes an inset with a zoom of in the Lesser Antilles. The highest values, exceeding 10 m and reaching almost 20 m in some areas, are found in the West Indies, including the islands of La Española (Dominican Republic and Haiti) and Puerto Rico, as well as on the Caribbean coast of Mexico. It is worth noting that the highest waves hitting the Lesser Antilles (Fig. 5b) are found on their eastern coasts, as expected as they are mainly hit by TCs of Atlantic origin travelling westwards. The Atlantic TCs, which are generally more intense than those generated in the Caribbean Sea (Fig. 3e and f), cause high waves in the central Atlantic Basin that have a long fetch before reaching the Antilles. These islands act as a barrier and prevent the large waves from entering the Caribbean Sea. After crossing the Antilles, these TCs continue travelling inside the Caribbean Sea, but the generated waves are less intense partly due to the smaller fetch area compared to their paths in the Atlantic Ocean.
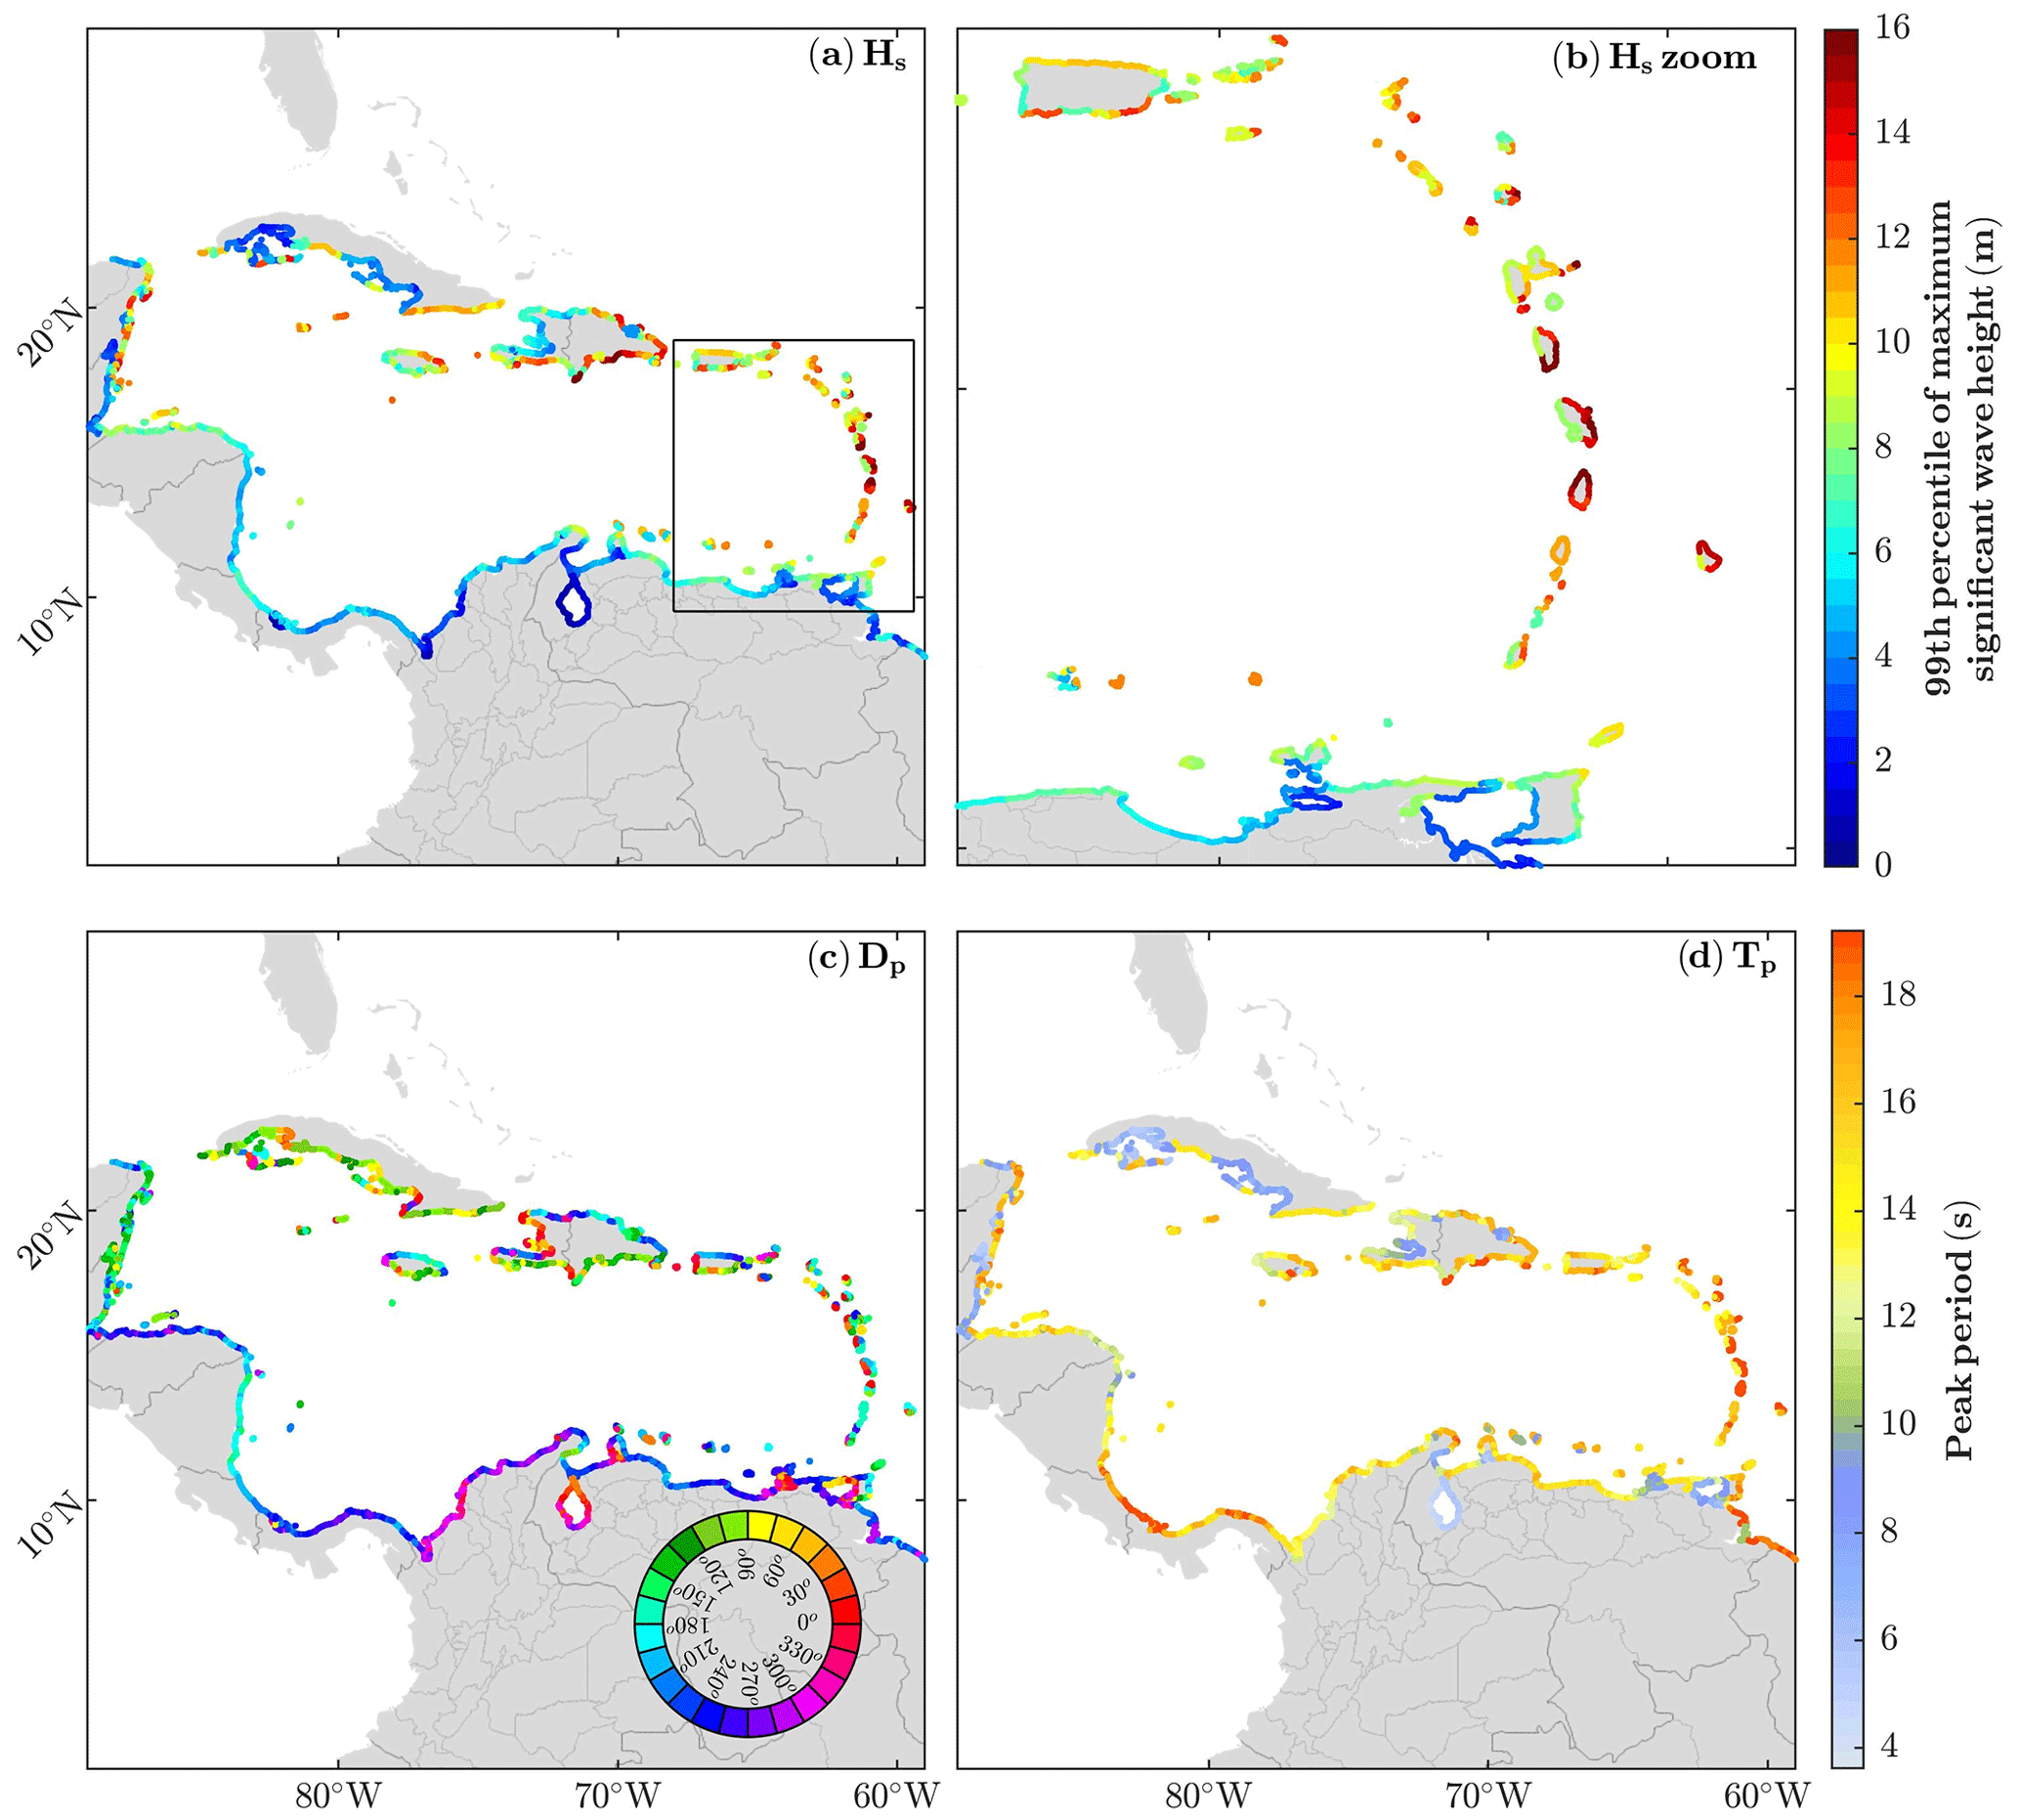
Figure 5Fully coupled simulation results. Both (a) and (b) represent the 99th percentile of the maximum Hs (that is, the value corresponding to the 10th most intense TC) for the whole domain (a) and a zoom on the Antilles area (b). Panels (c) and (d) are the peak direction (Dp), in nautical convention, and the median of peak period (Tp) for waves over the 99th percentile, respectively. All panels were calculated using the nearest point to coast at a depth of 20 m to avoid problems with relatively coarse shore resolution.
The peak direction (Dp) of wave propagation along the Caribbean coastlines is perpendicular to the coast due to wave refraction, regardless of the TC family (Fig. 5c). The main peak period (Tp) found in the Caribbean region for TC-generated ocean waves (Fig. 5d) has values between 14 and 18 s. Shorter periods (around 6 s) are observed in areas with the greatest influence of TCs originating inside the Caribbean Sea (Fig. 3.1b), in particularly protected areas such as the southern coast of Cuba or the coast of Belize, or in the enclosed bay of Haiti where its capital city, Port-au-Prince, is located. Other protected areas with low Tp include Lake Maracaibo in Venezuela and the Gulf of Paria in Trinidad and Tobago, although here Hs is negligible.
3.4 Sea surface elevation induced by TCs
Following the same metric used for waves, the 99th percentile of the set of the maximum SSE for each TC at every coastal point has been used to describe the spatial distribution of extreme SSE generated by TCs (Fig. 6). Here we focus on total SSE changes and its counterparts caused by the atmospheric pressure, by winds and by wave setup, which is the elevation of the sea surface due to breaking waves (Gregory et al., 2019). To do that, four different numerical simulations were performed for each TC as explained in Sect. 2.3.
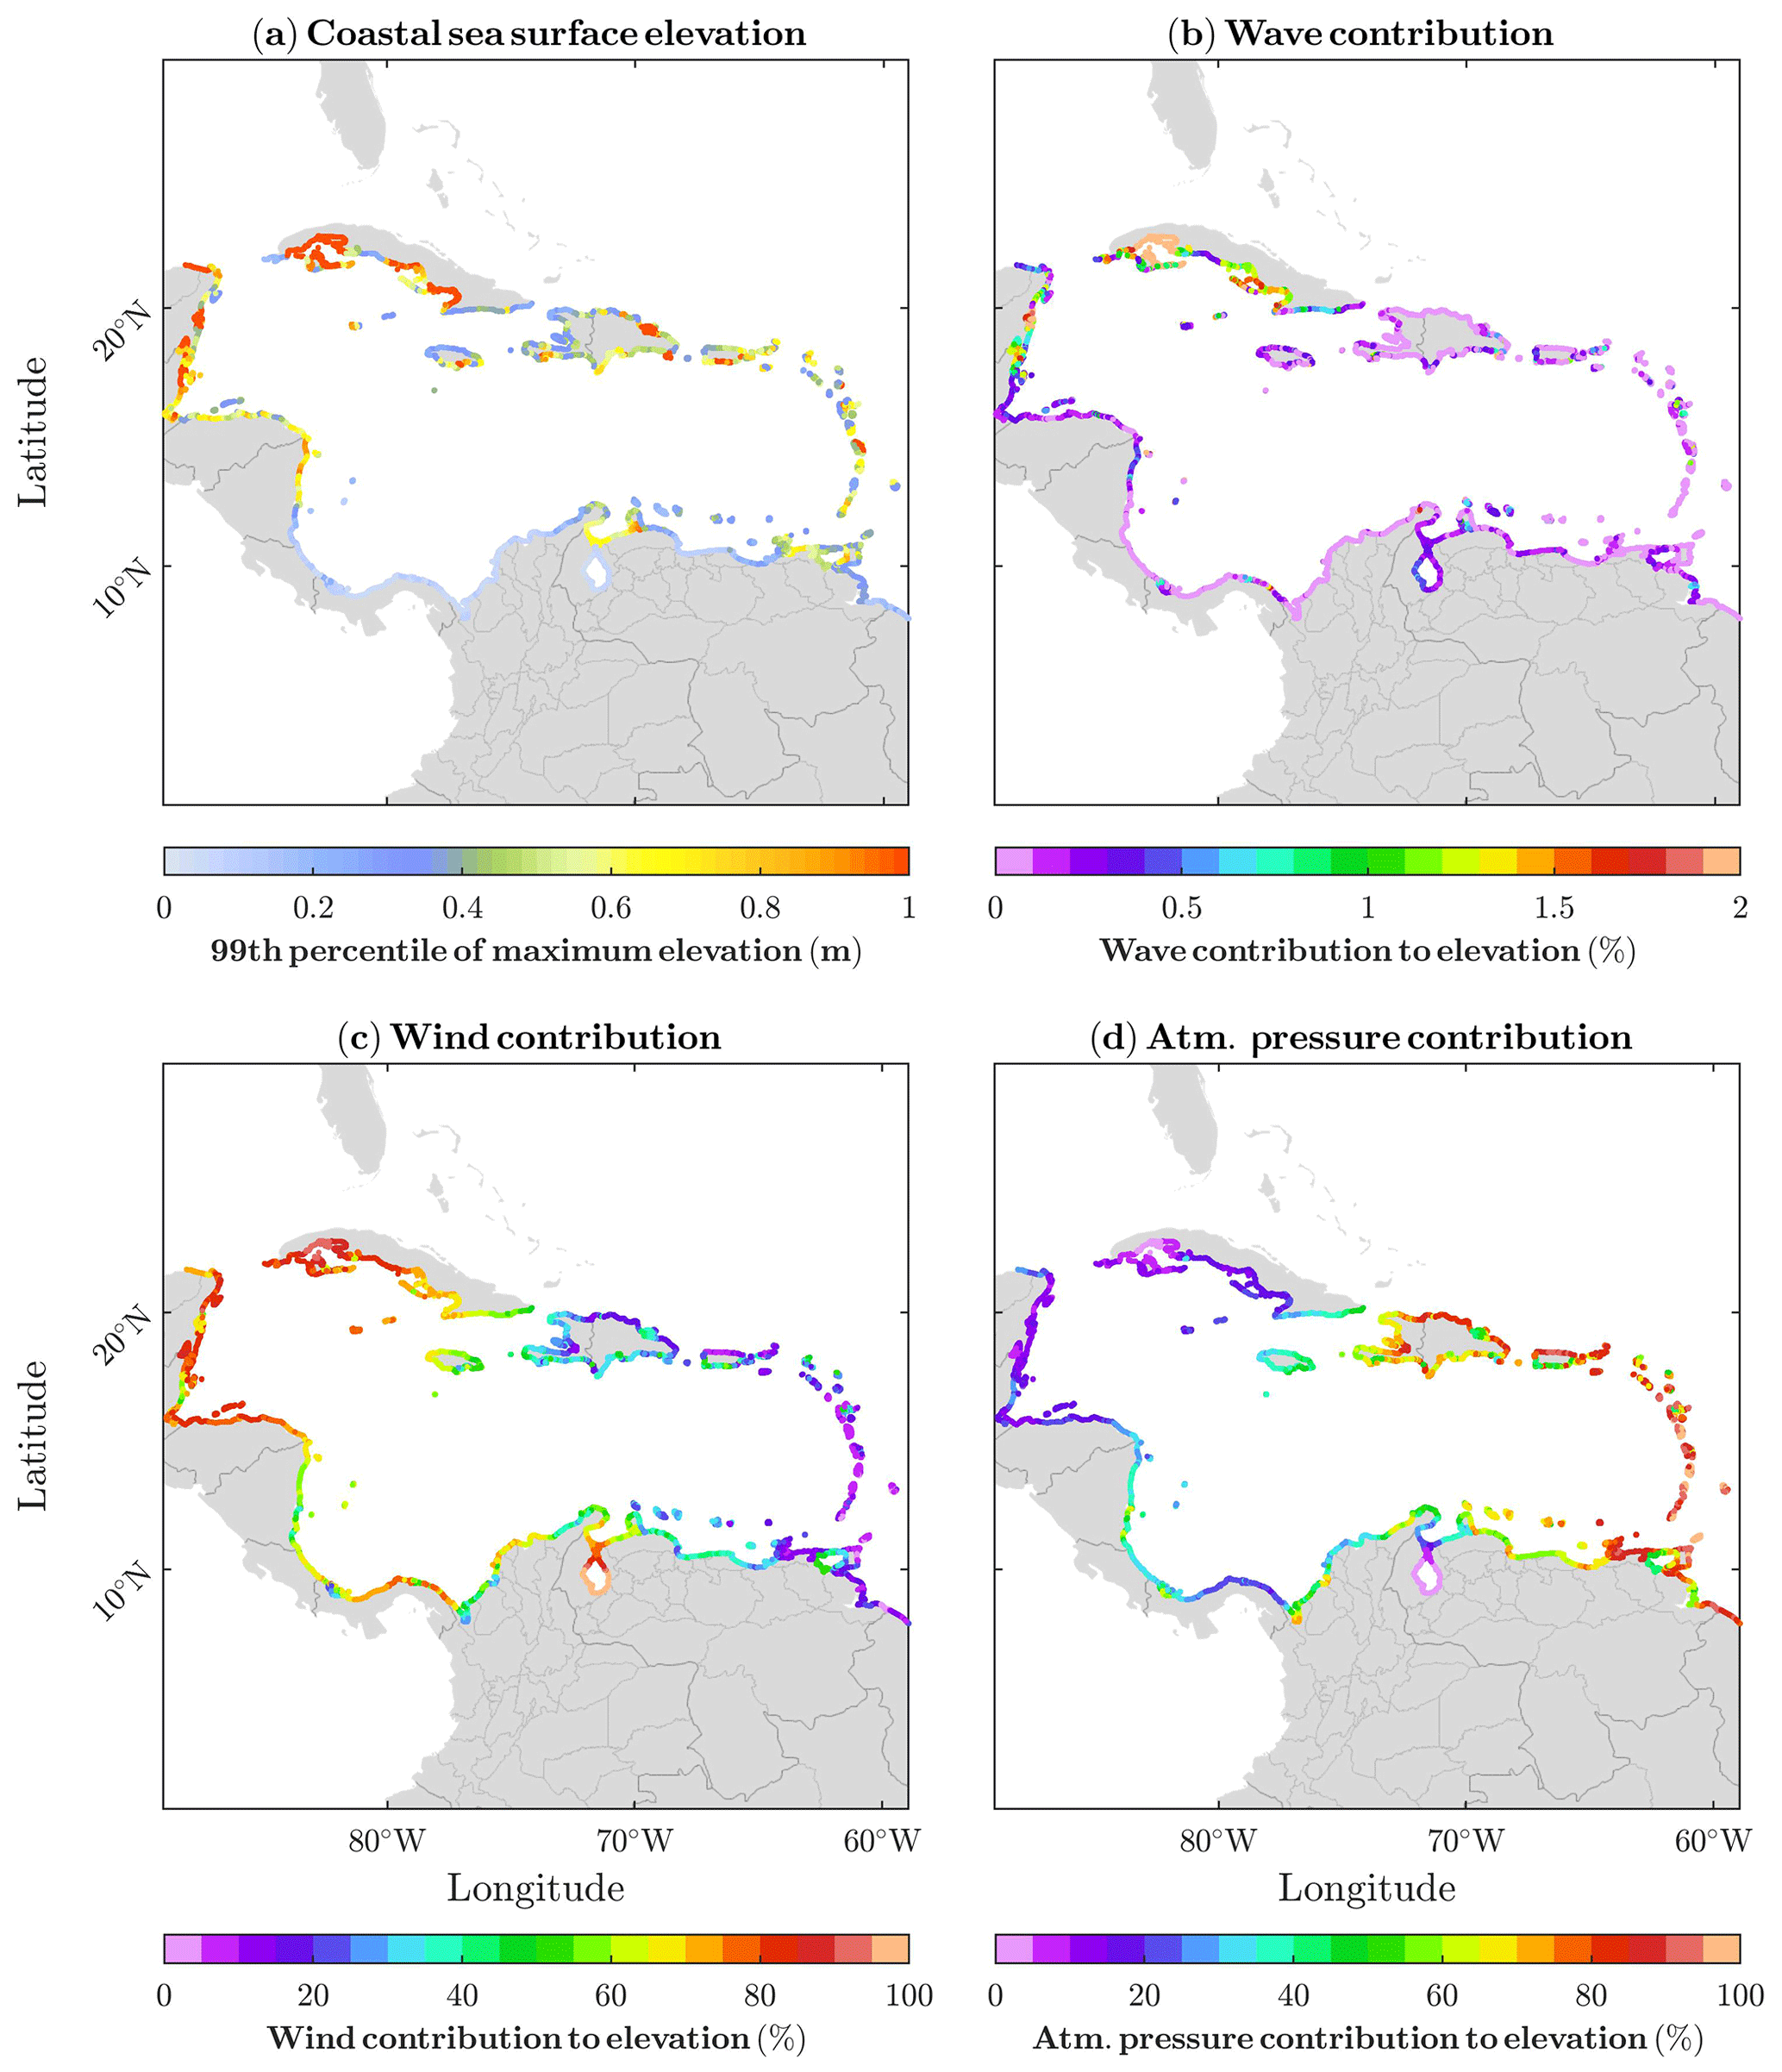
Figure 6The 99th percentile of the maximum sea surface elevation (a value that corresponds to the 10th most intense TC at each grid point) along the Caribbean coast (a) and its contributions: wave setup (b), wind (c) and atmospheric pressure (d) in absolute terms. All panels were calculated using the nearest point to coast at a depth of 20 m to avoid problems with relatively coarse shore resolution.
The largest values of coastal SSE (>2 m) (Fig. 6a) are found along the coastlines of Cuba and Belize, where the Hs is lower (Fig. 5a) because of their shallow coastal waters that favour the wind setup. SSE values as low as 20 cm are obtained along the southern coasts of the basin, far from the main pathway of TCs (Fig. 3c). Regarding the role of each component to the total SSE, the wave setup is negligible almost everywhere (Fig. 6a). Its contribution reaches a maximum of around 25 cm in the shallow areas of Belize, Mexico and the southern coast of Cuba, mentioned before, and it represents less than 5 % of the total contribution (see Fig. S2b) to the SSE. The reason is that the wave setup is very likely underestimated due to the relatively coarse coastal resolution of the model grid that is not able to represent properly the shallow water-wave dynamics. Wind setup (Fig. 6c) is the most important contribution, specially on the western Caribbean coastlines where it can reach up to 2 m. The eastern coasts are dominated by the effects of the low atmospheric pressure associated with TCs (Fig. 6d, note the different colour scales), with a contribution of around 0.5 m in this area. Further analysis of the link between atmospheric pressure and SSE value is done in Fig. S3. If for each coastal point the number of TCs at a distance less than twice the Rmax are selected, a very similar pattern to the atmospheric pressure contribution to the total SSE emerges (Fig. 3c). Summarising, in terms of SSE induced by TCs, the eastern Caribbean coastlines are mainly affected by the atmospheric pressure contribution, while the main driver in the western area is the wind setup. These geographic patterns are the result of the combination of two different mechanisms: (1) the crossing of TCs of Atlantic origin over the eastern coasts leaving their footprint in atmospheric pressure and (2) the shallow continental shelf along the western coasts that allows the water to accumulate due to the effect of the wind. The effects of wave setup are not accounted for due to the model's spatial resolution, so the numbers of SSE represent a lower bound of TC-induced coastal sea-level extremes.
3.5 Return levels of coastal waves and sea surface elevation
Return levels for periods ranging between 1 and 500 years, specifically for 10, 50, 100, 200 and 500 years, have been computed following the method described in Sect. 2.4. The return levels associated with the 100-year return period of Hs and SSE generated by TCs are shown in Fig. 7a and b, respectively. The spatial distribution of the return levels for the Hs (Fig. 7a) and SSE (Fig. 7b) mimics the geographic patterns in Figs. 5a and 6a, respectively, as expected. The 100-year return periods of Hs exceed 12 m in the West Indies and most of the northern Caribbean boundary, including Puerto Rico, Dominican Republic and the eastern part of Cuba. Cuba is also affected by the largest SSE (panel b) reaching up to 2 m. High return levels of SSE are also observed on the coast of Mexico, Belize and a small part of Guatemala. Finally, the southern Caribbean coast, once again, has the lowest values of both Hs and SSE return levels, being in some places even null, such as the coasts of Panama. These are, therefore, the safer coastlines in the Caribbean Sea in terms of coastal hazards, as far as TCs are concerned.
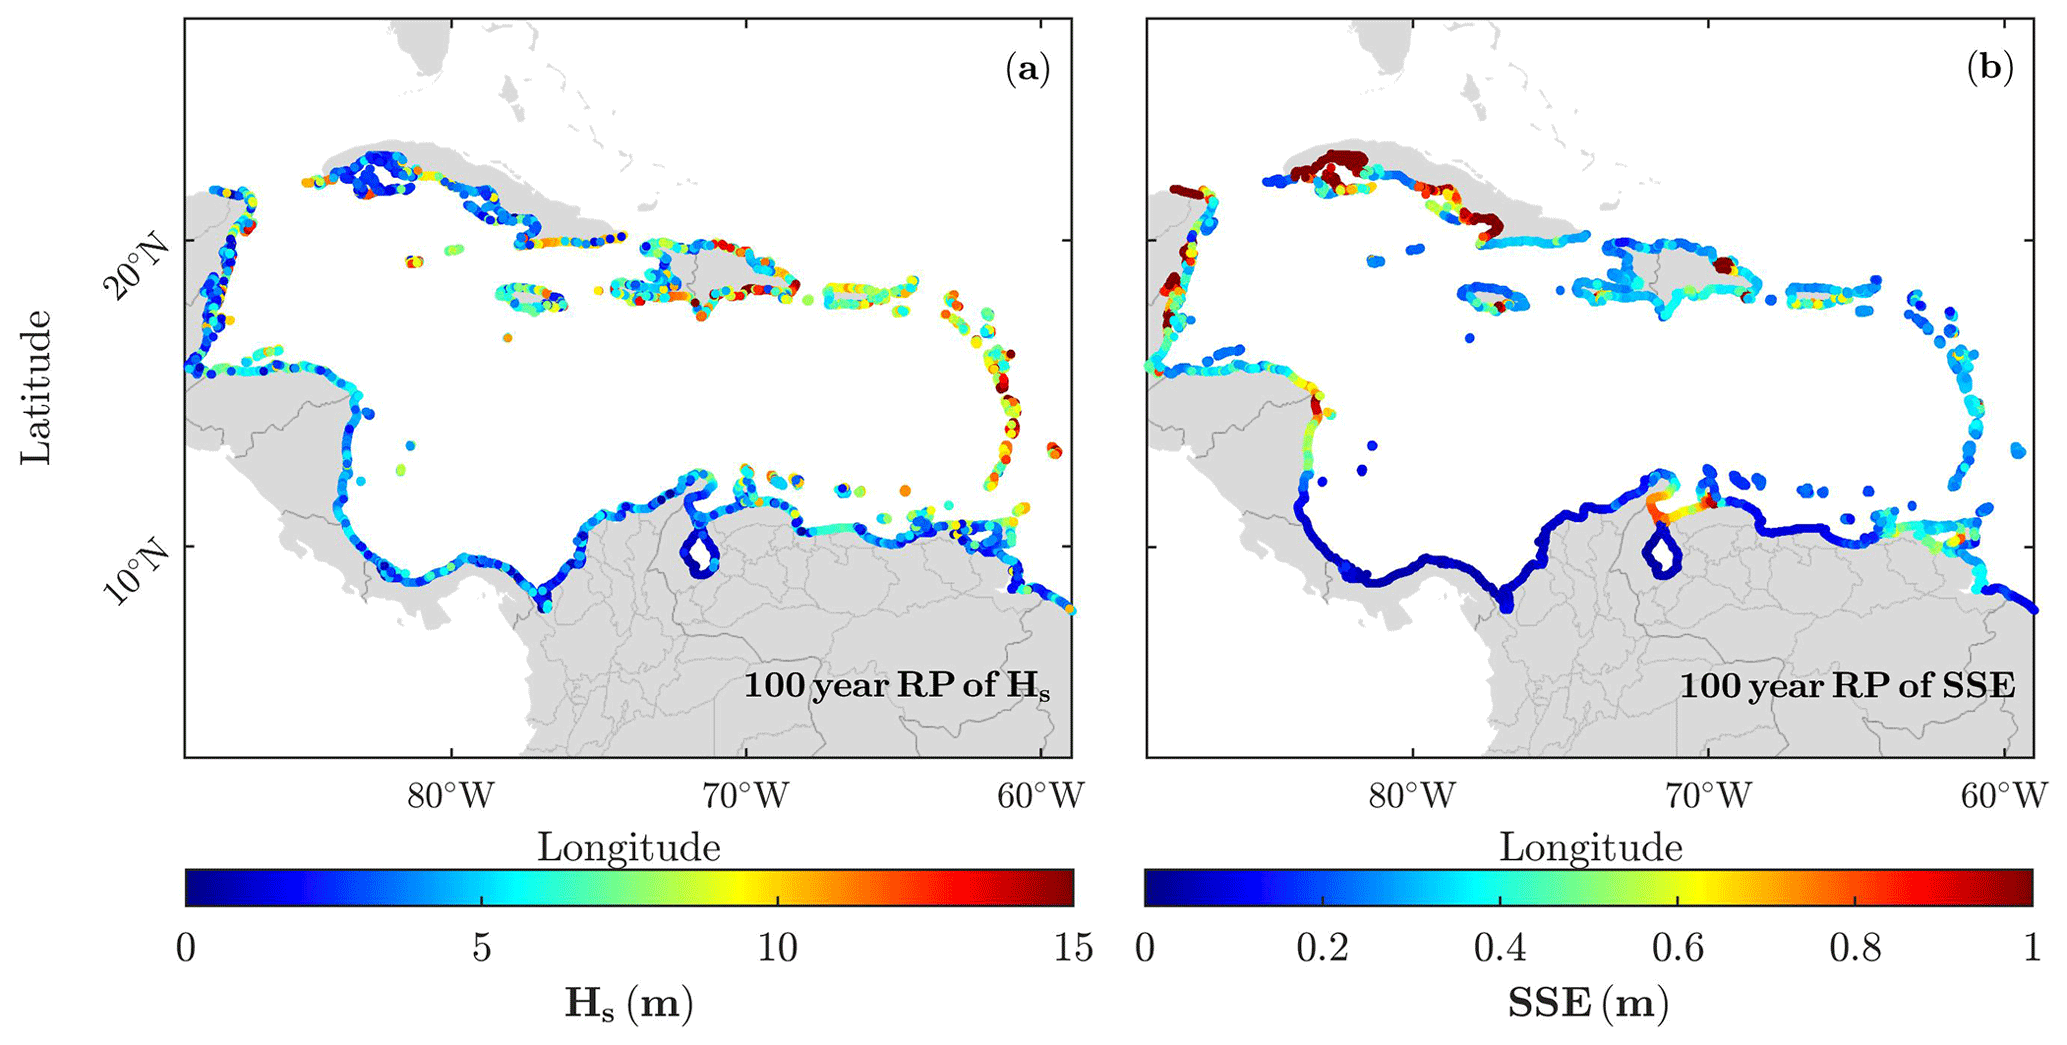
Figure 7Return levels of the variables Hs (a) and SSE (b) for the 100-year return period.
The Caribbean Sea is a region prone to the passage and impacts of TCs, generated either in the Atlantic Ocean or within the basin. Historical records of major TCs indicate that the largest ones usually impact Atlantic-facing eastern coasts. Hurricane Hugo, which hit Guadeloupe and Puerto Rico in 1989, caused severe damage in low-lying coastal areas, in both fatalities (56 people) and property (USD 17.4 billion) (Krien et al., 2015). More recent examples are Hurricane Maria in 2017, a category 5 tropical cyclone that caused almost 200 deaths (Pasch et al., 2023), although later counts reached 3000 fatalities (https://www.nytimes.com/2018/08/28/us/puerto-rico-hurricane-maria-deaths.html, last access: 20 October 2021), and Hurricane Irma, which affected the same area 2 weeks later (Cangialosi et al., 2018), proving that the West Indies are an oversea region that lies within the tracks of powerful hurricanes originating in the Atlantic Basin. In the northern area, the coasts of the Dominican Republic stand out as another hot spot of large wind waves induced by TCs, specially on its southern side near the capital, Santo Domingo, with Hs exceeding 14 m. This is one of the most heavily populated and densely built-up areas of the island and is, consequently, most exposed to hurricane-induced hazards. This was evidenced by Hurricane David, a category 5 TC that hit this island in 1979 and was responsible for 2068 deaths, 2000 of which occurred in its capital (Hebert, 1980).
In this study we have analysed, for the first time, the coastal extreme sea levels generated by present-day tropical cyclones in the Caribbean Sea by numerically simulating the sea-level elevations and the wind waves from 1000 synthetic tracks selected from the STORM dataset. Two well-differentiated families of TCs have been identified depending on their generation region (Fig. 3): the Atlantic Basin family, formed by very powerful TCs that mainly affect the coasts of the Antilles, Puerto Rico, La Española and Cuba, and the Caribbean Basin family which generates off the coast of Honduras and mainly affects the eastern coasts of the Caribbean Sea. The main differences between both families, besides their generation area, are (1) the length of their tracks, the Atlantic TCs having longer lifetimes travelling longer distances before their first landfall; and (2) their intensity (maximum wind speed), the Atlantic TCs being much more intense than the Caribbean TCs due to their longer lifetimes travelling over a warm sea. The projected changes in the large-scale steering flow from increasing greenhouse gases are expected to change their genesis location and shift their tracks (Colbert et al., 2013). These changes would affect both families differently, declining the frequency of Caribbean hurricanes and increasing those of the Atlantic Basin. For the latter, an eastward shift on their tracks is also expected, which would translate into a decrease in the number of Atlantic TCs affecting the Caribbean coasts. However, due to an increase in the sea surface temperature (SST), the hurricane season will, most likely, extend; therefore a higher number of TCs could potentially affect these areas (Bustos Usta and Torres Parra, 2021).
Our results show that the Atlantic-facing eastern coast of the Caribbean Basin is the one affected by the largest waves generated by TCs (Fig. 5), easily exceeding 10 m of Hs and being especially large in the Lesser Antilles (Barbados, Saint Lucia, Martinique and Dominica), where Hs can reach 16 m, corresponding to a 50-year return period. Previous studies, limited to some sectors of the Caribbean coastlines, have also identified other regions as heavily affected by the wind waves generated by TCs. For example, Pillet et al. (2019a) identified as one of the most vulnerable areas the east coast of the West Indies, affected by Hs larger than 15 m, and Montoya et al. (2018) pointed to the northern area of the Caribbean Sea, near Jamaica, Puerto Rico, Dominican Republic and Haiti, as the regions inside the Caribbean Sea with the largest 30-year return-level Hs of up to 12 m. These are in agreement with our findings. Ignoring possible changes in the tracks of hurricanes affecting the Caribbean Basin (Colbert et al., 2013), changes in Hs from TC intensification due to rising sea surface temperatures are expected to be minor, with the largest increase not exceeding 25 cm in the Colombian Basin (Kleptsova et al., 2021). As a result patterns of Hs would remain similar to those seen in Figs. 5 and 7. However, this is not the case if the effects of the projected increase in intensity of such hurricanes are considered (Murakami et al., 2014), as these could result in higher return levels than those calculated.
The largest sea surface elevations generated by TCs were found along the northwestern area of the Caribbean Sea (Cuba, Mexico and Belize) in agreement with Torres and Tsimplis (2014). Note that this study includes the contribution from tide, eddies and seasonal cycle, while here only the hydrodynamic response is considered. SSE is very dependent on the morphology of the coastlines, which in this case is formed by very narrow and shallow bays located behind cays that allow the generation of storm surges larger than 2 m, provided that the shelf is well represented in the model bathymetry. Indeed, the largest storm surges registered in the Caribbean Sea are in the Gulf of Batabanó (Cuba) with a value of more than 2 m (Arenal et al., 1998, 2016). In contrast, the TC-induced SSE in the Antilles, the area affected by the most intense TCs, is not among the largest simulated (<0.5 m). In this case, the lack of a continental shelf or narrow and shallow bays behind cays in front of the coastlines do not allow the accumulation of water, having as a result smaller SSEs than other regions affected by less-intense TCs. Another SSE hot spot is located in the northern coast of Nicaragua with values exceeding 0.8 m. This section of coastline, which is mainly affected by the less-intense Caribbean TCs, has a wide and shallow continental shelf, prone to the development of storm surges. The smaller SSE values were found on the southern coastlines of the Caribbean Basin because this region is not affected by TCs at all (Fig. 3). Higher return levels of SSE are also observed along the coasts of Mexico and Belize, as well as some parts of Guatemala, with values that agree with those found by Dullaart et al. (2021a). Despite Dullaart et al. (2021a) including tides, these are almost negligible in this area, so our return periods are directly comparable. All these zones are flooding hot areas where, in concordance with Dullaart et al. (2021b), the number of people exposed to a flood event relative to the global population due to a TC storm surge contribution is especially large (>90 %), both in Cuba and Belize. It is worth noticing that the SSE in the Yucatán Channel, between Mexico and Cuba, may be overestimated because it is part of one of the boundaries of the model.
We have also investigated the contribution of each mechanism (atmospheric pressure, wind setup and wave setup) to the total SSE, which strongly varies between different regions of the Caribbean Sea. The largest contribution of the atmospheric pressure is found in areas located along the TC tracks. The wind contribution is strongly related to the morphology of the coast and continental shelves. Wave setup contributions are also located in shallow areas that allow the accumulation of water. However, this contribution is underestimated due to the relatively coarse resolution of the model grid that prevents reproducing properly the wave transformation in shallow waters. Mean sea-level rise will increase the water depths and is likely to cause a decrease in the contribution of wind setup and wave setup (Kleptsova et al., 2021) while keeping the atmospheric pressure contribution equal. Despite this decrease in the contribution of the wind setup, mean sea-level rise is still responsible for the positive trends observed in sea-level extremes (Torres and Tsimplis, 2014).
This study provides a regional overview of the coastal hazards induced by TC in the Caribbean Sea. The model simulations provide a complete mapping of the extreme wind waves and storm surges along the coasts and identifies the dominant mechanisms, as well as the type of TC (in terms of their origin) and the areas that are most affected by each of them along with return levels for return periods of 10, 20, 50, 100, 200 and 500 years. Limitations of our study include the following: (1) the fact that our forcing fields have been generated using synthetic tracks and using parameterised pressure and wind profiles possibly leading to inaccurate 2D fields; (2) low bathymetry resolution which causes (3) underestimated wave setup; and (4) a possible SSE overestimation may be taking place in the Yucatán Channel since it is part of one of the open boundaries of the model.
The return levels of Hs and SSE corresponding to 10, 50, 100, 200 and 500 years along all coastal grid points, along with the data (latitude, longitude, Rmax, minimum pressure and maximum wind speed) for the TC subsample and the results (maximum of SSE and Hs, median of Tp and Dp) for all simulations, are available at the data repository https://doi.org/10.5281/zenodo.7069110 (Martín et al., 2023).
The supplement related to this article is available online at: https://doi.org/10.5194/nhess-23-587-2023-supplement.
AA, MM and AO conceived the work and designed the numerical experiments. AM retrieved the atmospheric forcings, performed the numerical simulations and analysed the outputs with the guidance of TT. All the authors contributed to the outline and writing of the manuscript.
The contact author has declared that none of the authors has any competing interests.
Publisher’s note: Copernicus Publications remains neutral with regard to jurisdictional claims in published maps and institutional affiliations.
This article is part of the special issue “Coastal hazards and hydro-meteorological extremes”. It is not associated with a conference.
Grant PID2021-124085OB-I00 funded by MCIN/AEI/10.13039/501100011033/FEDER,EU and grant RTI2018-093941-B-C31 funded by MCIN/AEI/10.13039/501100011033 and by “ERDF A way of making Europe”.
This paper was edited by Joanna Staneva and reviewed by Rafael Torres and two anonymous referees.
Amores, A., Marcos, M., Carrió, D. S., and Gómez-Pujol, L.: Coastal impacts of Storm Gloria (January 2020) over the north-western Mediterranean, Nat. Hazards Earth Syst. Sci., 20, 1955–1968, https://doi.org/10.5194/nhess-20-1955-2020, 2020. a
Appendini, C. M., Pedrozo-Acuña, A., Meza-Padilla, R., Torres-Freyermuth, A., Cerezo-Mota, R., López-González, J., and Ruiz-Salcines, P.: On the role of climate change on wind waves generated by tropical cyclones in the Gulf of Mexico, Coast. Eng. J., 59, 1740001, https://doi.org/10.1142/S0578563417400010, 2017. a
Arenal, I. M., Parrado, R. P., García, I. S., Concepción, O. G., Pérez, M. B., Allen, Y. J., Padrón, P. B., and Pérez, A. L.: THE COASTAL FLOODS IN THE CUBAN TERRITORY, THE MOST SENSITIVE AREAS AND THE POSSIBLE IMPACT OF THE CLIMATE CHANGE, Institute of Meteorology, 23, 50–62, 1998. a, b
Arenal, I. M., Baños, I. H., Valdés, E. G., Mayo, A. H., Rodríguez, O. O. D., Llamo, A. V., and Zas, J. A. R.: The Coastal Flood Regime around Cuba, the Thermohaline Structure Influence and Its Climate Tendencies, Environ. Ecol. Res., 4, 37–49, https://doi.org/10.13189/eer.2016.040201, 2016. a
Bertin, X., Li, K., Roland, A., and Bidlot, J.-R.: The contribution of short-waves in storm surges: Two case studies in the Bay of Biscay, Cont. Shelf Res., 96, 1–15, https://doi.org/10.1016/j.csr.2015.01.005, 2015. a
Bloemendaal, N., Haigh, I. D., de Moel, H., Muis, S., Haarsma, R. J., and Aerts, J. C.: Generation of a global synthetic tropical cyclone hazard dataset using STORM, Scientific data, 7, 1–12, https://doi.org/10.1038/s41597-020-0381-2, 2020. a, b, c, d
Boose, E.: A method for reconstructing historical hurricanes, in: Hurricanes and Typhoons: Past, Present, and Future, Vol. 99, Columbia University Press, 2004. a
Brabson, B. and Palutikof, J.: Tests of the generalized Pareto distribution for predicting extreme wind speeds, J. Appl. Meteorol., 39, 1627–1640, https://doi.org/10.1175/1520-0450(2000)039<1627:TOTGPD>2.0.CO;2, 2000. a
Bustos Usta, D. F. and Torres Parra, R. R.: Ocean and atmosphere changes in the Caribbean Sea during the twenty-first century using CMIP5 models, Ocean Dynam., 71, 757–777, https://doi.org/10.1007/s10236-021-01462-z, 2021. a
Camus, P., Mendez, F. J., Medina, R., and Cofiño, A. S.: Analysis of clustering and selection algorithms for the study of multivariate wave climate, Coast. Eng., 58, 453–462, https://doi.org/10.1016/j.coastaleng.2011.02.003, 2011. a
Cangialosi, J. P., Latto, A. S., and Berg, R.: Hurricane Irma (AL112017), National Hurricane Center Tropical Cyclone Report, 111, 2018. a
Centre for Research on the Epidemiology of Disasters: The Human Cost of Disasters. An Overview of the Last 20 Years (2000–2019), 2020. a
Chenoweth, M.: A reassessment of historical Atlantic basin tropical cyclone activity, 1700–1855, Climatic Change, 76, 169–240, https://doi.org/10.1007/s10584-005-9005-2, 2006. a
Colbert, A. J., Soden, B. J., Vecchi, G. A., and Kirtman, B. P.: The impact of anthropogenic climate change on North Atlantic tropical cyclone tracks, J. Climate, 26, 4088–4095, https://doi.org/10.1175/JCLI-D-12-00342.1, 2013. a, b
Dullaart, J., Muis, S., Bloemendaal, N., Chertova, M. V., Couasnon, A., and Aerts, J. C.: Accounting for tropical cyclones more than doubles the global population exposed to low-probability coastal flooding, Commun. Earth Environ., 2, 1–11, https://doi.org/10.1038/s43247-021-00204-9, 2021a. a, b
Dullaart, J. C., Muis, S., Bloemendaal, N., Chertova, M. V., Couasnon, A., and Aerts, J. C.: Accounting for tropical cyclones more than doubles the global population exposed to low-probability coastal flooding, Commun. Earth Environ., 2, 1–11, https://doi.org/10.1038/s43247-021-00204-9, 2021b. a
Duvat, V. K., Magnan, A. K., Wise, R. M., Hay, J. E., Fazey, I., Hinkel, J., Stojanovic, T., Yamano, H., and Ballu, V.: Trajectories of exposure and vulnerability of small islands to climate change, WIREs Clim. Change, 8, e478, https://doi.org/10.1002/wcc.478, 2017. a
ECLAC: The impact of hurricane Ivan in the Cayman Islands, Economic Commission for Latin America and the Caribbean, https://www.cepal.org/en/publications/25728-impact-hurricane-ivan-cayman-islands (last access: 5 September 2021), 2004. a
Enríquez, A. R., Wahl, T., Marcos, M., and Haigh, I. D.: Spatial Footprints of Storm Surges Along the Global Coastlines, J. Geophys. Res.-Oceans, 125, e2020JC016367, https://doi.org/10.1029/2020JC016367, 2020. a
GEBCO: General Bathymetric Chart of the Ocean, https://www.gebco.net/, last access: 9 October 2020. a
GFDRR: Post-Disaster Needs Assessment Hurricane Maria, Global Facility for Disaster Reduction and Recovery, https://www.gfdrr.org/sites/default/files/publication/Dominica_mp_012418_web.pdf (last access: 7 September 2021), 2017. a
Giuliani, G. and Peduzzi, P.: The PREVIEW Global Risk Data Platform: a geoportal to serve and share global data on risk to natural hazards, Nat. Hazards Earth Syst. Sci., 11, 53–66, https://doi.org/10.5194/nhess-11-53-2011, 2011. a
Goldenberg, S. B., Landsea, C. W., Mestas-Nuñez, A. M., and Gray, W. M.: The recent increase in Atlantic hurricane activity: Causes and implications, Science, 293, 474–479, https://doi.org/10.1126/science.1060040, 2001. a
Gregory, J. M., Griffies, S. M., Hughes, C. W., Lowe, J. A., Church, J. A., Fukimori, I., Gomez, N., Kopp, R. E., Landerer, F., Le Cozannet, G., Ponte, R. M., Stammer, D., Tamisiea, M. E., and van de Wal, R. S. W.: Concepts and terminology for sea level: Mean, variability and change, both local and global, Surv. Geophys., 40, 1251–1289, https://doi.org/10.1007/s10712-019-09525-z, 2019. a
Hebert, P. J.: Atlantic hurricane season of 1979, Mon. Weather Rev., 108, 973–990, https://doi.org/10.1175/1520-0493(1980)108<0973:AHSO>2.0.CO;2, 1980. a
Holland, G. J.: An analytic model of the wind and pressure profiles in hurricanes, Mon. Weather Rev., 108, 1212–1218, 1980. a, b
Holland, G. J., Belanger, J. I., and Fritz, A.: A revised model for radial profiles of hurricane winds, Mon. Weather Rev., 138, 4393–4401, https://doi.org/10.1175/2010MWR3317.1, 2010. a, b
Kleptsova, O. S., Dijkstra, H. A., van Westen, R. M., van der Boog, C. G., Katsman, C. A., James, R. K., Bouma, T. J., Klees, R., Riva, R. E., Slobbe, D. C., Zijlema, M., and Pietrzak, J. D.: Impacts of Tropical Cyclones on the Caribbean Under Future Climate Conditions, J. Geophys. Res.-Oceans, 126, e2020JC016869, https://doi.org/10.1029/2020JC016869, 2021. a, b
Knapp, K. R., Kruk, M. C., Levinson, D. H., Diamond, H. J., and Neumann, C. J.: The international best track archive for climate stewardship (IBTrACS) unifying tropical cyclone data, B. Am. Meteorol. Soc., 91, 363–376, https://doi.org/10.1175/2009BAMS2755.1, 2010. a
Knapp, K. R., Diamond, H. J., Kossin, J. P., Kruk, M. C., and Schreck, C.: International Best Track Archive for Climate Stewardship (IBTrACS) Project, Version 4, NOAA National Centers for Environmental Information, https://doi.org/10.25921/82ty-9e16, 2018. a
Krien, Y., Dudon, B., Roger, J., and Zahibo, N.: Probabilistic hurricane-induced storm surge hazard assessment in Guadeloupe, Lesser Antilles, Nat. Hazards Earth Syst. Sci., 15, 1711–1720, https://doi.org/10.5194/nhess-15-1711-2015, 2015. a, b
Lin, N., Lane, P., Emanuel, K. A., Sullivan, R. M., and Donnelly, J. P.: Heightened hurricane surge risk in northwest Florida revealed from climatological-hydrodynamic modeling and paleorecord reconstruction, J. Geophys. Res.-Atmos., 119, 8606–8623, https://doi.org/10.1002/2014JD021584, 2014. a
Martín, A., Amores, A., Orfila, A., Toomey, T., and Marcos, M.: Return levels of Hs and SSE corresponding to 10, 50, 100, 200 and 500 years along all coastal grid points, along with the data (latitude, longitude, Rmax, minimum pressure and maximum wind speed) for the TC's subsample, and the results (Maximum of SSE and Hs, Median of Tp and Dp) for all simulations, Zenodo [data set], https://doi.org/10.5281/zenodo.7069110, 2023. a
Montoya, R. D., Menendez, M., and Osorio, A. F.: Exploring changes in Caribbean hurricane-induced wave heights, Ocean Eng., 163, 126–135, https://doi.org/10.1016/j.oceaneng.2018.05.032, 2018. a
Murakami, H., Li, T., and Hus, P.-C.: Contributing factors to the recent high level of accumulated cyclone energy (ACE) and power dissipation index (PDI) in the North Atlantic, J. Climate, 27, 3023–3034, https://doi.org/10.1175/JCLI-D-13-00394.1, 2014. a
Needham, H. F., Keim, B. D., and Sathiaraj, D.: A review of tropical cyclone-generated storm surges: Global data sources, observations, and impacts, Rev. Geophys., 53, 545–591, https://doi.org/10.1002/2014RG000477, 2015. a
OpenStreetMap contributors: Planet dump, https://planet.osm.org and https://www.openstreetmap.org (last access: 27 August 2020), 2017. a
Pasch, R. J., Penny, A. B., and Berg, R.: Hurricane Maria (AL152017), National Hurricane Center Tropical Cyclone Report, https://www.nhc.noaa.gov/data/tcr/AL152017_Maria.pdf, last access: 3 February 2023. a
Pillet, V., Duvat, V. K., Krien, Y., Cécé, R., Arnaud, G., and Pignon-Mussaud, C.: Assessing the impacts of shoreline hardening on beach response to hurricanes: Saint-Barthélemy, Lesser Antilles, Ocean Coast. Manage., 174, 71–91, https://doi.org/10.1016/j.ocecoaman.2019.03.021, 2019a. a
Pillet, V., Duvat, V. K., Krien, Y., Cécé, R., Arnaud, G., and Pignon-Mussaud, C.: Assessing the impacts of shoreline hardening on beach response to hurricanes: Saint-Barthélemy, Lesser Antilles, Ocean Coast. Manage., 174, 71–91, https://doi.org/10.1016/j.ocecoaman.2019.03.021, 2019b. a
Pond, S. and Pickard, G. L.: Introductory dynamical oceanography, Butterworth-Heinemann, ISBN 9780080570549, 1983. a
Roland, A., Zhang, Y. J., Wang, H. V., Meng, Y., Teng, Y.-C., Maderich, V., Brovchenko, I., Dutour-Sikiric, M., and Zanke, U.: A fully coupled 3D wave-current interaction model on unstructured grids, J. Geophys. Res.-Oceans, 117, C00J33, https://doi.org/10.1029/2012JC007952, 2012. a
Shewchuk, J. R.: Triangle: Engineering a 2D quality mesh generator and Delaunay triangulator, in: Workshop on Applied Computational Geometry, edited by: Lin, M. C. and Manocha, D., 203–222, Springer, https://doi.org/10.1007/BFb0014497, 1996. a
Sitkowski, M., Kossin, J. P., and Rozoff, C. M.: Intensity and structure changes during hurricane eyewall replacement cycles, Mon. Weather Rev., 139, 3829–3847, https://doi.org/10.1175/MWR-D-11-00034.1, 2011. a
Toomey, T., Amores, A., Marcos, M., Orfila, A., and Romero, R.: Coastal Hazards of Tropical-Like Cyclones Over the Mediterranean Sea, J. Geophys. Res.-Oceans, 127, e2021JC017964, https://doi.org/10.1029/2021JC017964, 2022. a
Torres, R. R. and Tsimplis, M. N.: Sea level extremes in the Caribbean Sea, J. Geophys. Res.-Oceans, 119, 4714–4731, https://doi.org/10.1002/2014JC009929, 2014. a, b, c, d
Willoughby, H. and Black, P.: Hurricane Andrew in Florida: Dynamics of a disaster, B. Am. Meteorol. Soc., 77, 543–550, https://doi.org/10.1175/1520-0477(1996)077<0543:HAIFDO>2.0.CO;2, 1996. a
woldometers: Caribbean Population, https://www.worldometers.info/world-population/caribbean-population, last access: 21 August 2020. a
Woodworth, P. L., Hunter, J. R., Marcos, M., Caldwell, P., Menéndez, M., and Haigh, I.: Towards a global higher-frequency sea level dataset, Geosci. Data J., 3, 50–59, https://doi.org/10.1002/gdj3.42, 2016. a
Zhang, Y. and Baptista, A. M.: SELFE: A semi-implicit Eulerian–Lagrangian finite-element model for cross-scale ocean circulation, Ocean Model., 21, 71–96, https://doi.org/10.1016/j.ocemod.2007.11.005, 2008. a
Zhang, Y. J., Ye, F., Stanev, E. V., and Grashorn, S.: Seamless cross-scale modeling with SCHISM, Ocean Model., 102, 64–81, https://doi.org/10.1016/j.ocemod.2016.05.002, 2016. a