the Creative Commons Attribution 4.0 License.
the Creative Commons Attribution 4.0 License.
 | 12 Jan 2023
Assessing agriculture's vulnerability to drought in European pre-Alpine regions
Ruth Stephan
Stefano Terzi
Mathilde Erfurt
Silvia Cocuccioni
Kerstin Stahl
Marc Zebisch
Droughts are natural hazards that lead to severe impacts in the agricultural sector. Mountain regions are thought to have abundant water, but have experienced unprecedented drought conditions as climate change is affecting their environments more rapidly than other places. The effect radiates by reducing water availability well beyond the mountains' geographical locations. This study aims to improve the understanding of agriculture's vulnerability to drought in Europe's pre-Alpine region, considering two case studies that have been severely impacted in the past. We applied a mixed-method approach combining the knowledge of regional experts with quantitative data analyses in order to define the region-specific vulnerability based on experts' identified factors. We implemented two aggregation methods by combining the vulnerability factors that could be supported with subregional data. Whereas the equal weighting method combines all factors with the same weight, the expert weighting method combines the factors with varying weight based on the expert's opinion. These two methods resulted in vulnerability maps with the expert weighting showing a higher vulnerability, and partly relocating the medium and lower vulnerabilities to other subregions within the case study regions. In general, the experts confirmed the resulting subregions with higher vulnerability. They also acknowledged the value of mapping vulnerability by adopting different aggregation methods confirming that this can serve as a sensitivity analysis. The identified factors contributing most to the regions' vulnerability point to the potential of adaptation strategies decreasing the agriculture's vulnerability to drought that could enable better preparedness. Apart from region-specific differences, in both study regions the presence of irrigation infrastructure and soil texture are among the most important conditions that could be managed to some extent in order to decrease the regions' vulnerability. Throughout the analyses, the study benefited from the exchange with the experts by getting an in-depth understanding of the regional context with feedback relations between the factors contributing to vulnerability. Qualitative narratives provided during the semi-structured interviews supported a better characterization of local vulnerability conditions and helped to better identify quantitative indicators as proxies to describe the selected vulnerability factors. Thus, we recommend applying this mixed-method approach to close the gap between science and practitioners.
- Article
(8032 KB) - Full-text XML
-
Supplement
(3019 KB) - BibTeX
- EndNote


Past and recent droughts have led to severe environmental, social, and economic impacts in many regions of the world. The combination of climate change exacerbation and the rising pressures on water demand from socio-economic activities affects the intensity and frequency of drought conditions (Van Loon et al., 2016; IPCC, 2022). This is particularly relevant in mountain regions where climate change effects are occurring more rapidly than in other places, with consequences on their water tower role and water provision to downstream areas (Beniston and Stoffel, 2014; Immerzeel et al., 2020; Terzi et al., 2021). Recent drought events highlighted the vulnerability of the European Alps and areas dependent on water from the Alps such as pre-Alpine regions to unexpected conditions of reduced water availability (Hanel et al., 2018; Laaha et al., 2017). Stephan et al. (2021) showed that within the European Alps a wide range of drought impacts occurred in different socio-economic sectors, with agriculture and the public water supply most impacted.
Drought impacts are triggered by the natural hazard itself, such as the intensity, duration, frequency, and extent of water deficits, but local exposure and vulnerability characteristics shape them (Hagenlocher et al., 2019). While the drought hazard components have been investigated and a set of indices are already established and available to describe hydroclimatic variations in terms of precipitation (e.g. SPI) and evapotranspiration (e.g. SPEI) in the Alpine region (e.g. Haslinger and Blöschl, 2017), the characterization of drought vulnerability and exposure still remains a challenge. Multiple conceptual frameworks of vulnerability in the context of natural hazard assessments have been developed (Birkmann et al., 2013; González Tánago et al., 2016). The Intergovernmental Panel on Climate Change (IPCC) provides the risk concept definition, where exposure refers to “the presence of people, livelihoods, species or ecosystems, environmental functions, services, and resources, infrastructure, or economic, social, or cultural assets in places and settings that could be adversely affected” by a drought hazard and vulnerability refers to the “the propensity or predisposition to be adversely affected” (IPCC, 2012, p. 1048) due to the system's sensitivity or susceptibility combined with a lack of short-term coping capacity and long-term adaptive capacity. In case of drought risk assessments, an example of a short-term coping capacity is the existence of an irrigation system to reduce agricultural impacts, while the development of an agricultural system increasing the water use efficiency refers to a long-term adaptive capacity. Although exposure and vulnerability are internationally recognized as important drivers of drought risk processes and final impacts, their operational assessment is still discussed and in development. In particular, drought vulnerability studies for pre-Alpine areas characterized by heterogeneous conditions are rare, possibly due to data limitations. So far studies exist on the aspects of vulnerability in forest growth and for impacts on pasture (e.g. Hartl-Meier et al., 2014). Melkonyan (2014) carried out a study to assess socio-economic vulnerability of the agricultural sector in the mountainous region of Armenia.
Moreover, various approaches have been applied often relying on either quantitative or qualitative data and hence covering only specific aspects of drought risk processes. The selection of the underlying approach often depends on the study's spatial scale, as well as on the data availability. Most studies that adopt a quantitative approach focus on the large scale (e.g. national or global level; Meza et al., 2020; Carrão et al., 2016), where datasets on socio-economic conditions are freely available. Additionally, data on past drought impacts are also often only available on a large scale but are necessary for an effective validation of the assessment. Regional datasets on socio-economic conditions are indeed often lacking, leading to an underrepresentation or omission of regional risk conditions. Therefore, regional or local studies often follow a qualitative approach to assess vulnerability, e.g. by involving the local communities in the process of understanding the vulnerability dimensions (Ayantunde et al., 2015; Birhanu et al., 2017; Martin et al., 2016). The results of these two approaches have rarely been combined or compared.
For these reasons, this study considers the impact chains (IC), a mixed-method approach recognized as a valuable methodology to integrate both quantitative and qualitative information into the description of the hazard, exposure, and vulnerability components for advancing the assessments of drought risk conditions (Schneiderbauer et al., 2020; Zebisch et al., 2021). The IC provides a guideline to systematically identify, select, and assess relevant factors involved in risk processes through the combination of quantitative data with information coming from local experts and stakeholders (GIZ and EURAC, 2017). This process is particularly important for evaluations of the vulnerability and exposure components since no standard set of factors exists to identify and characterize vulnerability to drought in agriculture.
Besides the identification of vulnerability factors, expert knowledge is used to weigh different factors in the mapping of an overall vulnerability index (Zebisch et al., 2021). This is often adopted when certain factors are perceived to be more important than others and thus have a greater (or lesser) influence on the overall vulnerability. In the context of impact chains, equal weighting is applied more often than other weighting methods. Moreover, a comparison of different weighting methods in order to analyse the effect of such choice on the final vulnerability assessment has rarely been done.
This study applies a vulnerability assessment approach in two case studies located in the European pre-Alpine region. The case study regions “Thurgau” in Switzerland and “Podravska” in Slovenia have experienced severe drought impacts in recent years and need to improve their resilience (Zorn and Hrvatin, 2015; Komac et al., 2019; DROUGHT-CH, 2022). The overarching objective is to systematically identify vulnerability factors linked to agricultural production that can contribute to impacts during a drought. By doing so, we aim to assess how factors vary spatially in the considered study regions and analyse the region-specific character of vulnerability.
Subordinate methodological research questions are as follows:
-
To what degree can we characterize vulnerability to drought in the two case studies by combining experts' opinions with the openly accessible data?
-
How sensitive is the final vulnerability assessment to different weighting methods for the vulnerability factors?
We selected the two study regions of Thurgau in Switzerland and Podravska in Slovenia due to the increasing number of reported drought impacts in agriculture in both regions, despite their proximity to the water-rich conditions in the European mountainous regions (Stephan et al., 2021). Most impacts archived in the Alpine Drought Impact report Inventory (EDIIALPS) report consequences on agriculture and livestock farming, highlighting the agricultural sector of both regions as vulnerable to drought in the past. According to the EDIIALPS, in Thurgau most impacts occurred in 2015 and 2018, whereas in Podravska most impacts occurred in 2003 and 2017. In Thurgau, reports claimed a reduced productivity of annual and permanent crop cultivation and shortages of feed and water for livestock as the majority of the regions' drought impacts. For example, the EDIIALPS archives an article with a comment from a local farmer in Stettfurt about the significant crop failures:
Production was down by 30 to 40 %. Especially iceberg lettuce had to be irrigated, because they were sensitive to the drought due to their small root system. Irrigation had to be done even at night, so water from the Stettfurt public utility company had to be used in part, which was much more expensive than the water from the Lauche River that he usually used.
In Podravska the reports are clearly dominated by reduced productivity of annual crop cultivation, often with yield losses ≥ 30 %. For example, the Drought Management Centre for Southeastern Europe stated in 2017, “Agricultural drought […] worsened over June and July. Most affected were regions of northeastern and southern half of Slovenia where maize completely stopped. […] yield was reduced by 30–50 %. Hay production was seriously affected as well.” (DMCSEE, 2017).
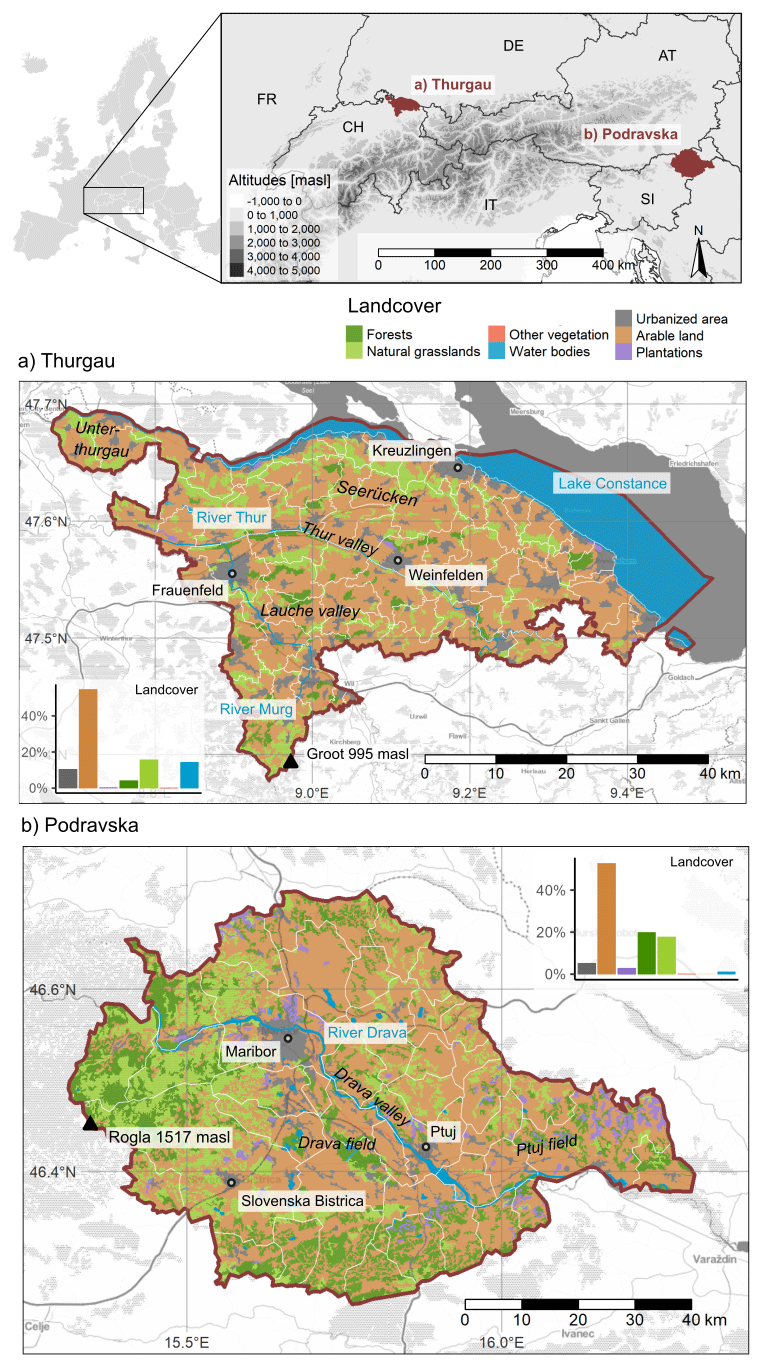
Figure 1The two study regions (a) Thurgau and (b) Podravska within the European mountain region. The political border of the study regions is marked in red, and the LAU2 regions are marked with white. The black labels present the most important cities and common known subareas (italic). The blue labels present the largest important rivers and lakes. The colours present the regional land cover adapted and modified by the Corine Land Cover (CLC, 2022). The land cover's share is shown in the histograms.
Both Thurgau and Podravska are characterized by extensive areas of agricultural land (Fig. 1) that make them particularly exposed to drought conditions, while showing different societal and economic conditions influencing the vulnerability of the agricultural sector. Moreover, they are also part of the Alpine Drought Observatory (ADO, https://www.alpine-space.org/projects/ado, last access: 10 August 2022), an Interreg project aiming to improve the understanding of drought processes and impacts towards increasing levels of drought preparedness through monitoring. Thurgau is known for its agriculturally shaped landscape reaching from specialty crops on the coast of Lake Constance to high elevation pastures (https://www.landschaftsqualitaet-tg.ch/, last access: 10 August 2022). This study region covers 991.77 km2, 54 % of which are covered by agricultural land (Fig. 1; CLC, 2022), with a total of 2531 farms in 2019. The main agricultural type (51 %) consists of natural meadows and pastures, followed by cropland (33 %), managed meadows (9 %), and vegetables, fruit, vines, and berries (6.5 %) (LID, 2007). Thurgau had 279 547 inhabitants in 2019 (SFSO, 2022) resulting in a population density of 324 inhabitants km−2. Podravska's landscape varies from hilly lowlands mainly along the river Drava up to 1517 m.a.s.l. in the western mountainous part. The region covers an area of 2170 km2, more than double the size of Thurgau. In 2019, the region had 324 875 inhabitants and thus a lower population density (149.7 inhabitants km−2) than Thurgau (“population” from SURS, 2022). In Podravska more than 30 % of the total area is utilized as agricultural land with a total of 10 990 agricultural holdings in 2016, and almost one third of these are located in mountainous areas (“agriculture, forestry and fishery” from SURS, 2022).
This study applies a mixed-method approach based on qualitative and quantitative information for the assessment of the agriculture's vulnerability to drought conditions in the case studies regions Thurgau and Podravska. Following the guidelines of the vulnerability sourcebook (Fritzsche et al., 2014), our study approach was based on an initial exploratory phase during the ADO project meeting held online on the 24 September 2020. During the group discussion, experts from both study areas provided a first regional overview of the drought issues through the creation of impact chains following the model by Zebisch et al. (2021). For this study we then considered these impact chains as context for further discussions and refinements focusing on the vulnerability factors and their characteristics. Starting from this context, the methodological approach presented here is composed of five consequential phases for the assessment of vulnerability considering its spatial variability within both case study regions: (1) identification of vulnerability factors (Sect. 3.1), (2) data acquisition and indicators selection (Sect. 3.2), (3) pre-processing, normalization, and direction (Sect. 3.3), (4) weighting and aggregating (Sect. 4.4), and (5) participatory validation (Sect. 3.5, Fig. 2).
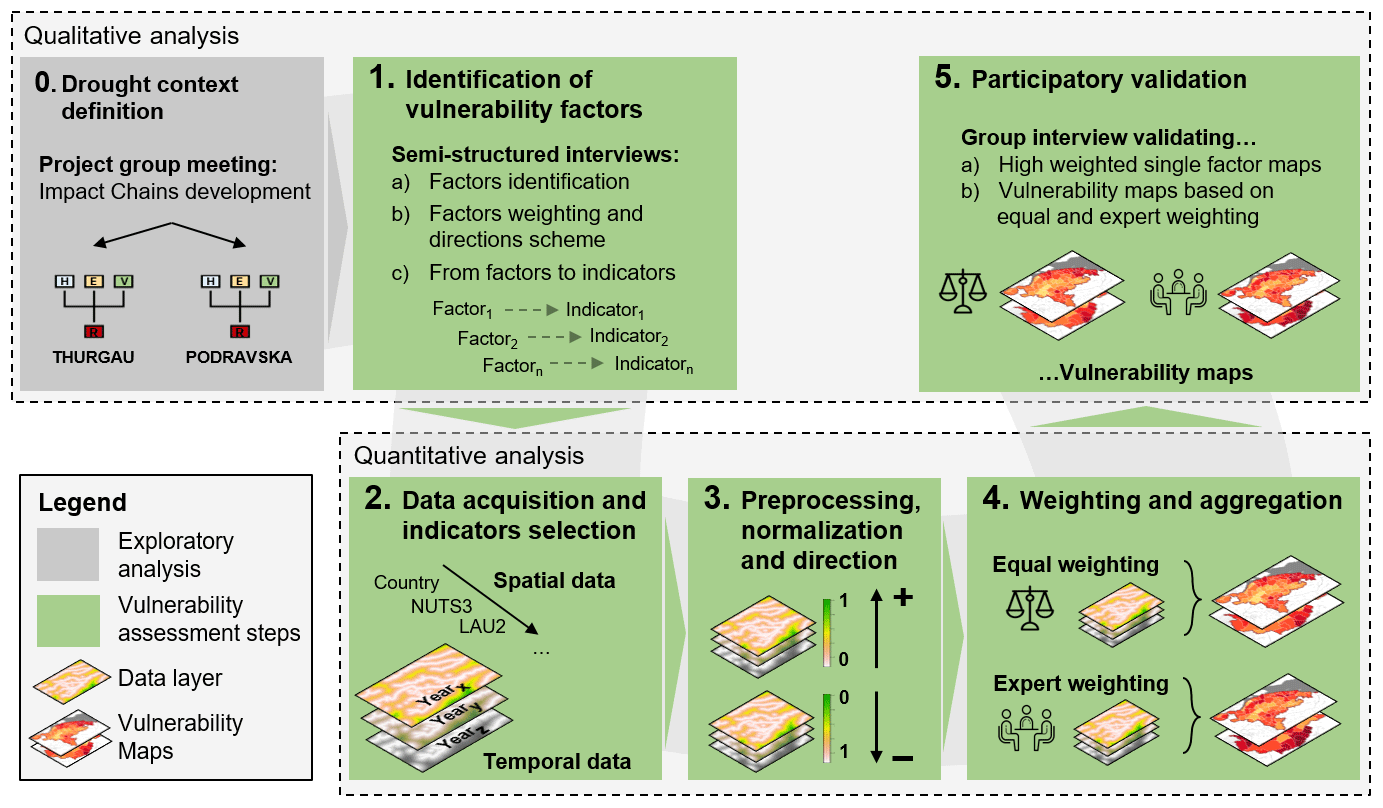
Figure 2Conceptual overview of the methodological steps for the drought vulnerability assessment. The grey box represents the preliminary group discussion on agricultural drought while the green boxes refer to the five consequential phases for a spatial assessment of drought vulnerability.
3.1 Identification of vulnerability factors
The set of factors used to describe vulnerability to drought in agriculture was generated through semi-structured interviews with nine high-level experts identified as key people with extensive expertise and knowledge on the two case studies, and they were held from the 24 August to 9 September 2021. Each discussion followed a flexible interactive structure (reported in Sect. S1 in the Supplement) allowing it to integrate the established questions with further information on the context and expertise from each participant. The interviews aimed to identify the perceived factors making the regions' agriculture vulnerable to drought and whether these factors increase or decrease the vulnerability. Throughout the whole assessment we considered only those factors that had been identified by the involved experts in order to account for their knowledge on factors relevant to the regions. Further, the participants assigned an importance to each of the identified factors from a low–medium–high scale of relevance. Finally, at the end of each interview we gathered information from the participants on which quantitative indicators from local biophysical and socio-economic datasets they deemed suitable to describe the spatial characteristics of the identified factors.
3.2 Data acquisition and indicator selection
In order to quantitatively describe the identified vulnerability factors, we scanned the datasets proposed by the interviewed participants to select suitable indicators matching the meaning of each factor. In addition, we searched databases from authorities at regional (e.g Amt für Geoinformation Thurgau, 2022), national (e.g. Swiss Federal Statistical Office, SFSO, 2022; Statistical Office of the Republic of Slovenia, SURS, 2022) to the European scale (e.g. European Environment Agency, EEA, 2022; European Soil Data Centre, ESDAC, 2022). Data availability and accessibility proved highly variable. If two different sources offered the same dataset to describe suitable indicators we prioritized the most recent and local dataset, as we aimed for current data with a spatial resolution as high as possible and at least with a subregional resolution of LAU1 regions.
3.3 Pre-processing, normalization, and direction
Depending on the type of data and data availability, we gathered continuous and categorical data for both study regions. We transformed the categorical data into (a) continuous data by ordering the categories, or into (b) presence–absence data with the presence of the most important category according to the responses of the interview participants. In order to facilitate the analyses all available datasets were rasterized to grid data with the boundaries of Thurgau and Podravska and their region-specific projection. Thus, we gathered one raster layer for each indicator (ri) representing the factor quantitatively, if subregional data are available.
In the next step, we directed ri according to the increasing and decreasing effect on the regions' vulnerability resulting from the interviews with the experts, similar to Meza et al. (2020). We transformed indicator layers with presence–absence data to values of “1” if presence has an increasing effect and to values of “0” if absence has an decreasing effect. Regarding the other indicator layers, we multiplied ri with “+1” if the indicator increases the vulnerability, or we multiplied the values of ri with “−1” if the indicator decreases the vulnerability. Then, we normalized the directed indicator layers to account for different value ranges and units. Both steps are applied as follows:
where represents the directed and normalized indicator layer, ri represents the indicator layer with the original values from its data source(s), d represents the direction factor in order to assign an increasing “+1” or decreasing “−1” effect, represents the minimum value across ri, and represents the maximum value across ri. That means presents with “0” the lowest possible vulnerability according to the indicator layer ri and with “1” the highest possible vulnerability according to the indicator layer ri. All other values are transformed in-between with increasing values representing increasing vulnerability.
3.4 Weighting and aggregation
We applied two different weighting methods to calculate the vulnerability index V: the equal-based weighting method (Veq) and the expert-based weighting method (Vex). For each method the assigned weights to the indicators sum up to 1, and thus can be seen as proportional weights dependent on the method. We aggregated the weighted indicators by summing them up. Practically, we added the weighted raster layers corresponding to the indicators for each method. According to Fig. 1 the agricultural land is very heterogeneously distributed, wherefore we masked the summed indicators with the region-specific agricultural land by setting to zero the indicators' values in non-agricultural areas. By doing so, we accounted for the density of agricultural areas over the whole area within each LAU2 region in the next step. We aggregated the summed indicators at each LAU2 region within Thurgau and Podravska, calculating mean values of vulnerability for each LAU2 region. The final maps enable a comparison of the two weighting methods for both study regions. The above described weighting methods are specified in the following.
For Veq we assigned to each indicator i the same weight as follows:
where n represents the total number of all factors, represents the directed and normalized indicator layer (Eq. 1), and represents the weight of indicator i that equals in this method to . In Eq. (3) we aggregated the weighted rasters by summing them up to the equal-based vulnerability method Veq.
To gather Vex, we used the importance rating Impr by the interview participants from the low–medium–high scale and the frequency, how often a factor was named. We weighted each corresponding indicator i with the expert-weight as follows:
where represents the experts' weight of indicator i, Impr represents the importance rate on the low–medium–high scale translated into the integers 1–2–3, pi, r represents the number of the experts who weighted indicator i with the weight r. Wtot represents the total weight assigned to all indicators, and n represents the total number of all indicators. Analogue to the equal weighting method, we weighted each indicator layer with the corresponding weight and summed up these weighted raster layers to calculate Vex as follows:
3.5 Participatory validation
In order to validate the results, we conducted one group interview involving the previously consulted experts for each case study. We held the group interviews between the 10 and 21 June 2022 following the same structure (reported in Sect. S2). Firstly, we asked the experts to identify the most and least vulnerable subregions across Thurgau and Podravska based on their past experiences in dealing with drought events. Secondly, we presented the maps displaying the most important vulnerability factors and asked their opinions on the differences displayed across the study regions. Thirdly, we presented the final (aggregated) vulnerability maps according to the two weighting methods, and we asked for feedback on both the most and least vulnerable regions. Finally, we asked them to provide their opinion on the differences between the maps based on the two weighting methods and which one provides a better description of real drought vulnerability conditions in agriculture.
4.1 Factors and indicators describing the region-specific vulnerability
During the semi-structured interviews the experts named in total 31 unique factors describing vulnerability to agricultural drought impacts (see Table 1). The experts identified 10 common factors for both study regions, whereas they identified 6 factors solely for Thurgau and 13 factors solely for Podravska (Fig. S1). The common factors were altitudes, distance to large water bodies, share of drought resistant crop types, farm size, humus content, presence of irrigation infrastructure, slope, soil texture, topsoil depth, and water holding capacity. The unique factors for Thurgau were south-facing area, share of intensive livestock, share of pastures, political conservative vote, share of specialty crops, and type of irrigation infrastructure. The unique factors for Podravska were distance to mountains, landscape diversity, water permits, accessibility to local food market, farm diversification, intensity of farming, absence of drought policies, food price, agro-technical measures, clear landownership, compensations, farmers' age, and farmers' education. Thus, the identified factors describe various aspects of vulnerability, such as geographic conditions (e.g. elevation, south-facing), hydrological characteristics (e.g. distance to large water bodies), soil characteristics (e.g. water holding capacity), agricultural practices (e.g. intensive farming), agricultural infrastructure (e.g. irrigation infrastructure), farmers background and willingness to change (e.g. farmers education and political conservative vote), and drought policies (e.g. compensations). In comparison, the experts from Podravska claimed more and a wider range of factors describing the regions' vulnerability than the experts from Thurgau.
EU-DEM (2022)EU-Hydro (2022)FOEN (2022)SFSO (2022)ESDAC (2022)CLC (2022)SFSO (2022)SFSO (2022)CLC (2022)Amt für Geoinformation Thurgau (2022)Amt für Geoinformation Thurgau (2022)Amt für Geoinformation Thurgau (2022)ESDAC (2022)SURS (2022)INSPIRE (2022)EU-Hydro (2022)INSPIRE (2022)European Mountain Areas (2022)SURS (2022)SURS (2022)ESDAC (2022)SURS (2022)INSPIRE (2022)CLC (2022)CLC (2022)INSPIRE (2022)ESDAC (2022)ESDAC (2022)INSPIRE (2022)Table 1Set of factors the interview participants used to describe vulnerability to agricultural drought impacts and that could be supported with data in Thurgau and Podravska. The data source, data type, data range, the direction, the latest update, and the spatial resolution of the data is shown.
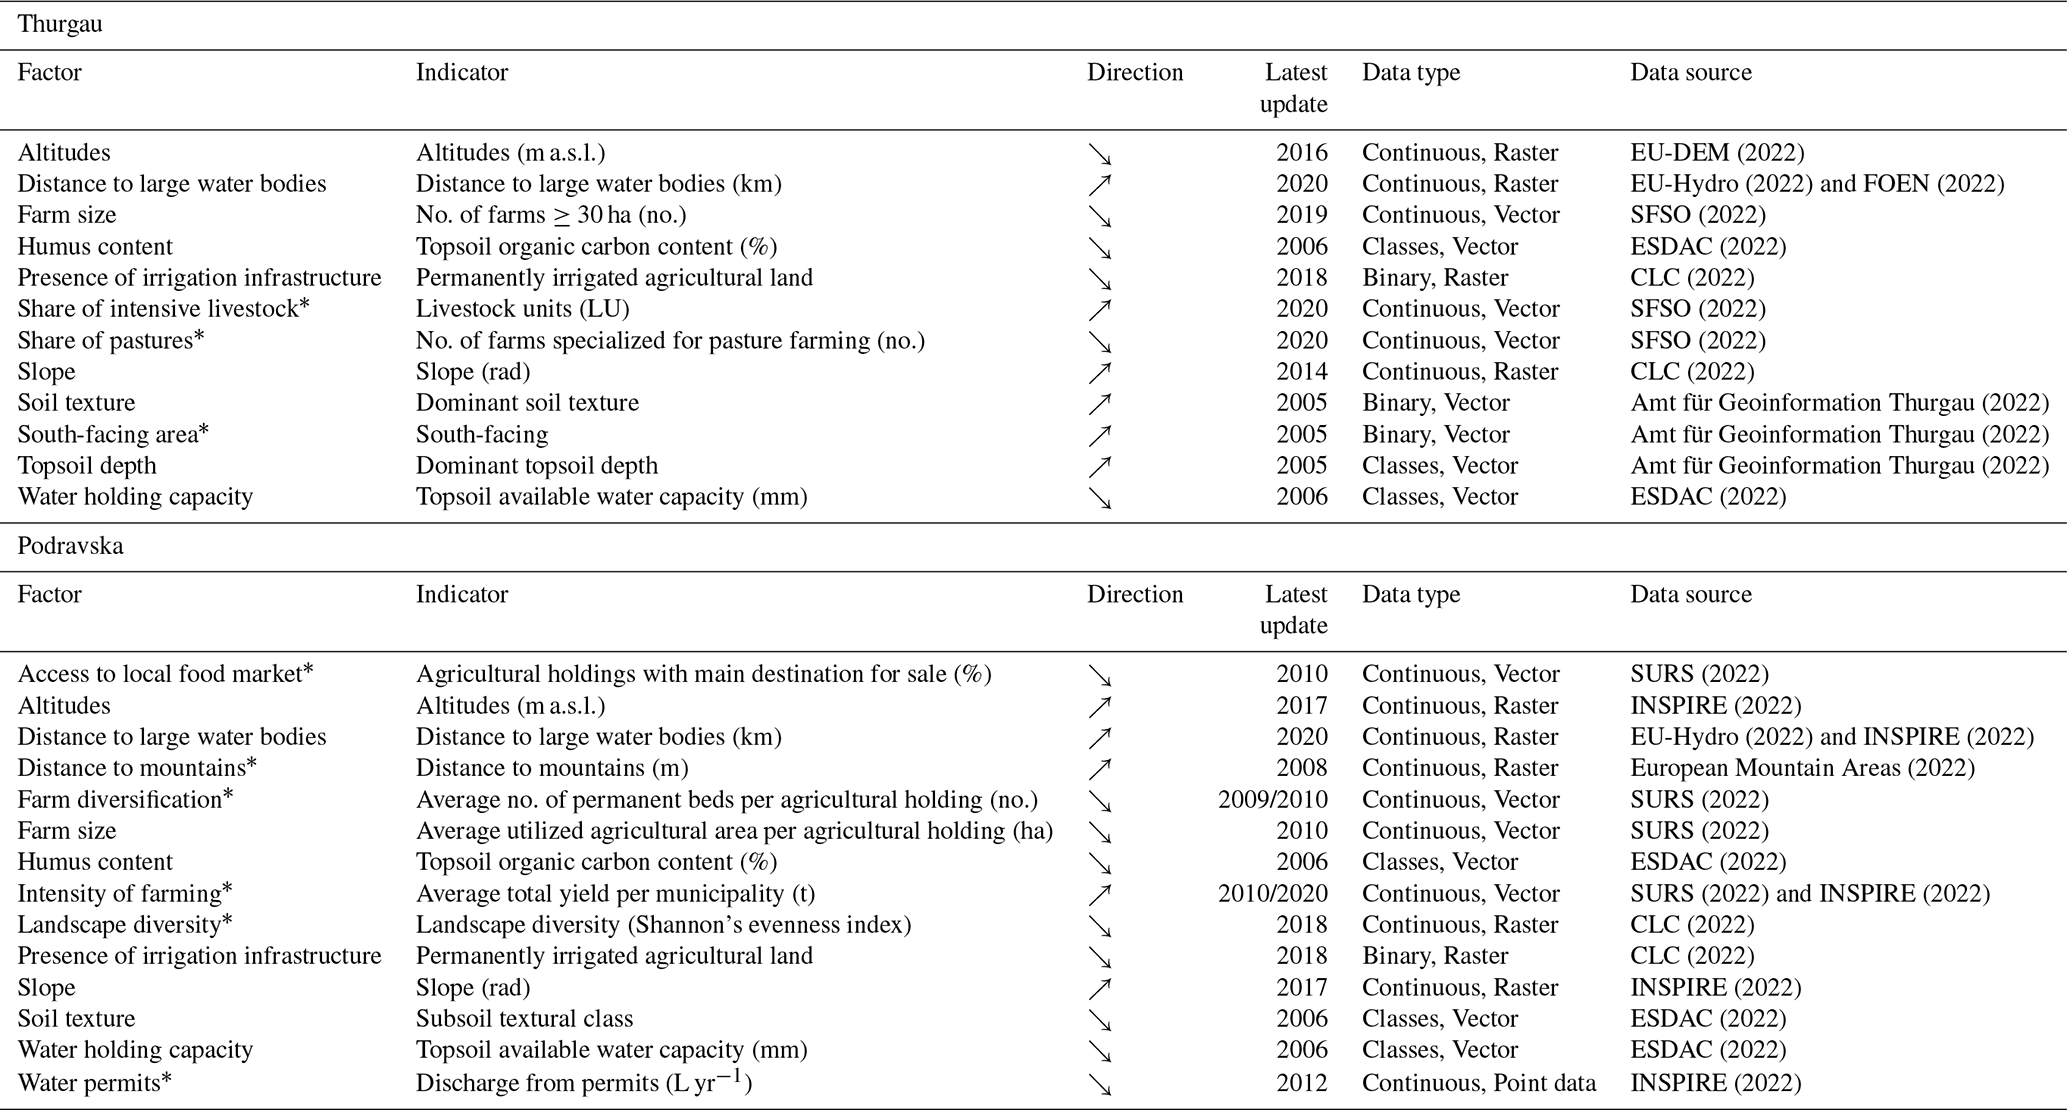
Marked with “∗” for factors only mentioned for either Thurgau or Podravska, the remaining were mentioned for both study regions.
For both regions we found suitable indicators with subregional data from various sources to cover a majority of the identified vulnerability factors (see Table 1, Fig. S1). However, we were not able to support with subregional data 6 out of 18 factors in Thurgau and 11 out of 25 factors in Podravska. For both regions we used data from the European Environment Agency (EEA, 2022) and from the European Soil Data Centre (ESDAC, 2022). Regarding Thurgau, we used data from national sources as the Swiss Federal Statistical Office (SFSO, 2022) and the Swiss Federal Office of Environment (FOEN, 2022), and data from regional sources the Office for Geoinformation by Thurgau (Amt für Geoinformation Thurgau, 2022). Regarding Podravska, we used data from the Statistical Office of the Republic of Slovenia (SURS, 2022) and from the INSPIRE Slovenian Data Portal (INSPIRE, 2022).
Some factors could be easily described through indicators supported by data available at the subregional scale. In these cases the factors, originally described by the experts, were fully represented by the selected indicators. For example, with the digital elevation model by the EEA we could represent the factor of slope with the indicator slope measured in radians. In addition, with a combination of shapefiles by the EU-Hydro – River Network Database respectively (EU-Hydro, 2022) for large rivers, reservoirs, and lakes we could represent the factor of distance to large water bodies by calculating this distance for each location in both case studies. For other factors we were forced to select proxy indicators which were either more specific or only covering a partial aspect of the overall concept provided by the experts during the interviews. For example, for the factor of presence of irrigation infrastructure we found information about the presence or absence of permanently irrigated agricultural land across both study regions and used this as a representative indicator. For example, in Thurgau we used the indicator dominant soil texture with classes from clay to sand to describe the factor of soil texture as a whole, and we used the indicator livestock units for the factor of share of intensive livestock. This way, we could support a majority of 12 factors in Thurgau and a majority of 14 factors in Podravska with data from indicators (Table 1).
For some indicators the data are static over time, such as elevation. For indicators that show a temporal development we were able to find recent data, such as number of farms > 30 ha (from 2019 in Thurgau) and average utilized agricultural area per agricultural holding (from 2010 in Podravska). Regarding the available spatial resolution in Thurgau, we found shapefiles with different spatial resolution for five indicators, raster files with a resolution at least of 25 hectares for four indicators, and data for LAU1 regions for three indicators. In Podravska, we found raster files with a resolution of at least 25 hectares for six indicators, data for LAU2 regions for four indicators, with different spatial resolution for three indicators, and point data for one indicator. Most of the factors are represented by indicators with continuous data (respectively n = 6 and n = 10), followed by indicators with categorical data (n = 4 and n = 3) and by indicators with binary data (n = 2 and n = 1).
4.2 Vulnerability Thurgau
Thurgau's vulnerability is calculated with 12 factors for both the equal weighting method and the expert weighting method (Fig. 3). The following five factors were attributed a greater importance by the experts and were therefore assigned with higher weights and accounting for a total of 71 % of the total vulnerability: distance to large water bodies, humus content, presence of irrigation infrastructure, soil texture, and water holding capacity, whereas the other factors lost weight in the expert weighting method, specifically the factor of slope.
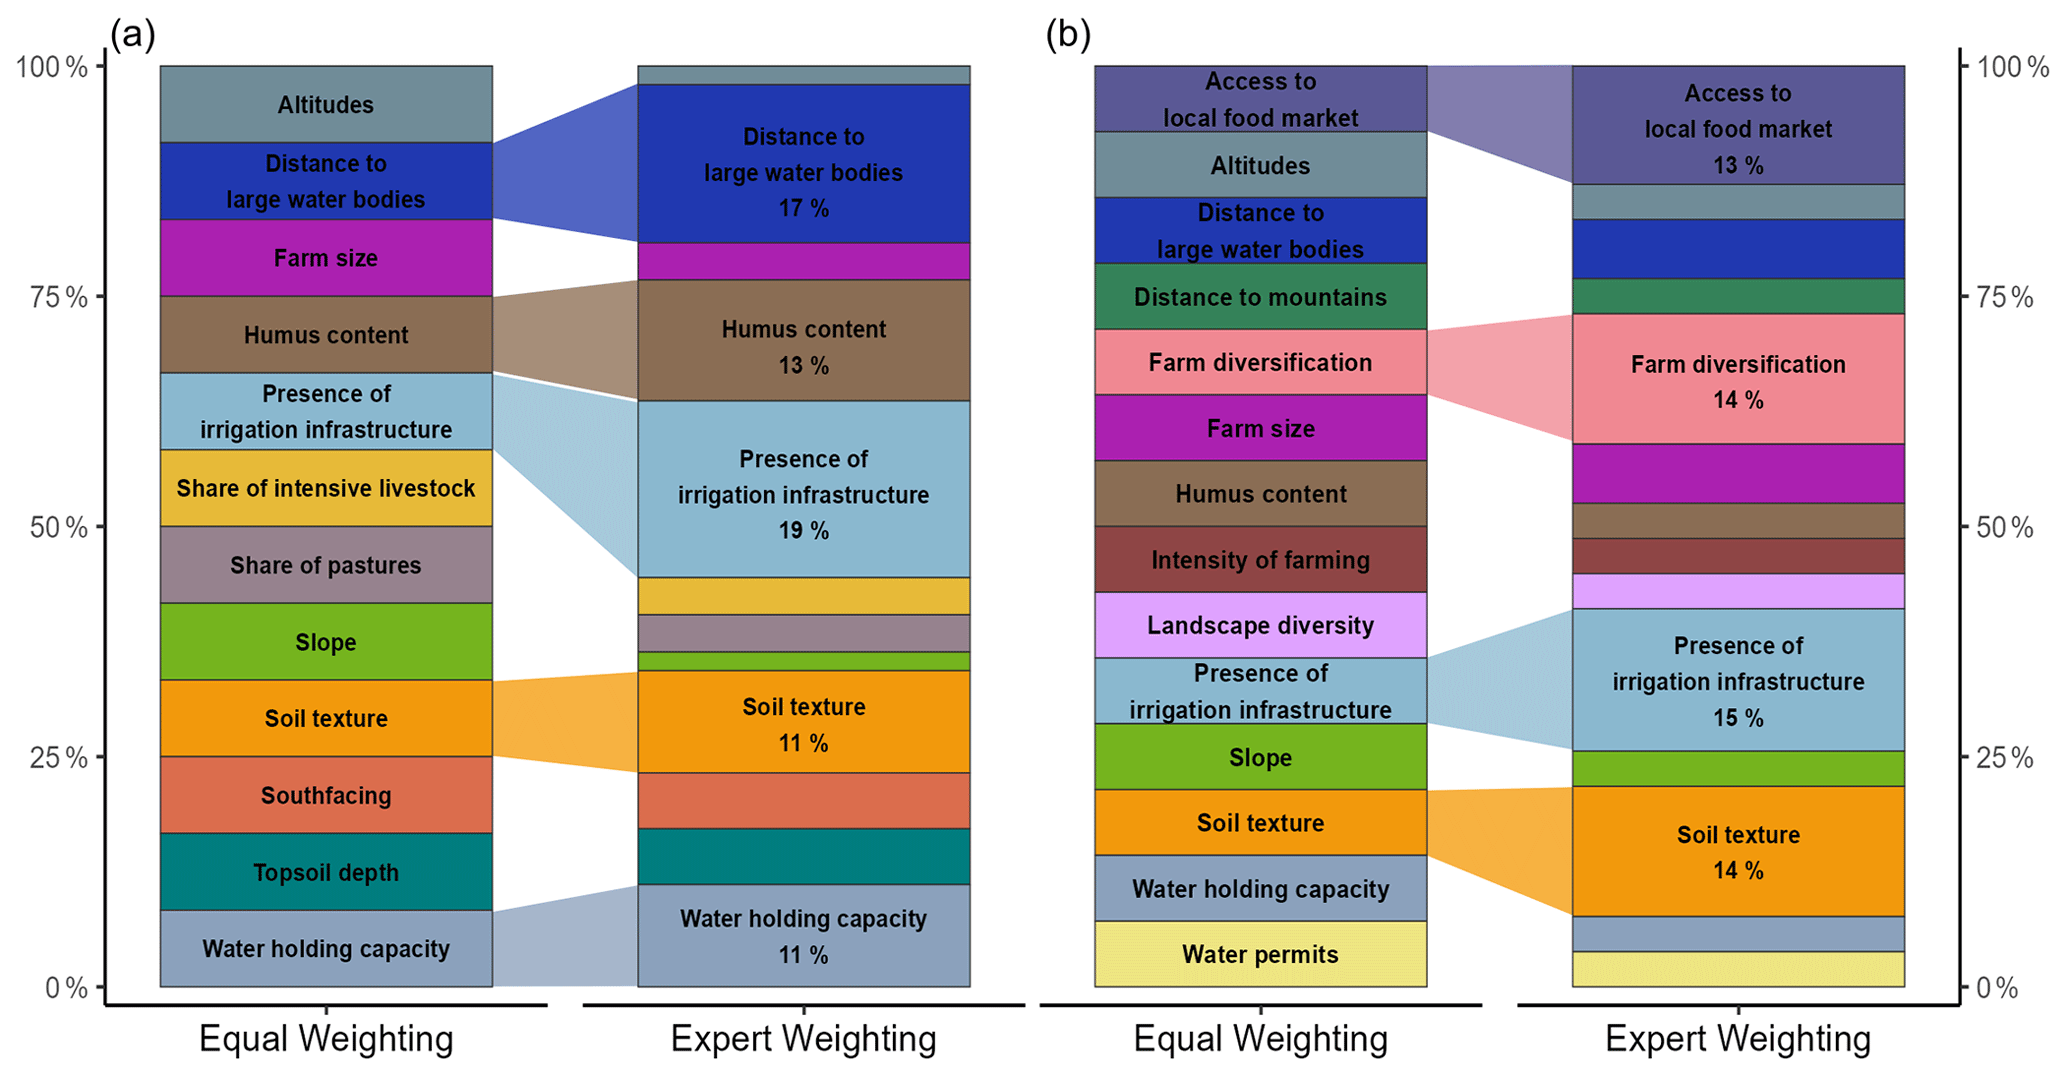
Figure 3The identified vulnerability factors for (a) Thurgau and (b) Podravska that could be supported with subregional data. The size of each factor within the bars corresponds to the weight comparing the equal weighting method with the expert weighting method.
Each mapped factor shows higher and lower vulnerabilities across the region according to the indicator values (Fig. S2). The increasing and decreasing effect of the factor depends on the direction defined by the experts (Table 1). The factor with the highest weight according to the experts is the presence of irrigation infrastructure which accounts for 19 % of the total vulnerability. Permanently irrigated land is relatively equally distributed across Thurgau. The LAU2 regions covered most with irrigation infrastructure are in the central north of Thurgau (Homburg, Kemmental). Regions least covered with irrigation infrastructure are in the higher elevation regions of the south (Fischingen) and east of the city of Constance and along the coast (Berlingen, Gottlieben). The second most important factor is distance to large water bodies accounting for 17 % of the total vulnerability. This mapped factor presents lower vulnerability along the coast; the rivers Rhine, Thur, and Murg; and around larger water reservoirs and lakes mostly located in the northeast. Subsequently, the highest vulnerabilities related to this factor occur in the LAU2 regions in-between the rivers and lakes (Homburg, Raperswilen, Wäldi) and in the mountainous south (Fischingen). The third most important factor in Thurgau is humus content, accounting for 13 % of the total vulnerability. The best-fitting indicator supporting this factor is called topsoil organic carbon content (%) and is offered by the European Soil Database (ESDAC, 2022). This categorical indicator presents higher carbon content and thus a lower vulnerability in the LAU2 regions located along the river Thur (Hüttlingen, Fellben-Wellhausen, Hohentannen), while 21 LAU2 regions spread across Thurgau present very low carbon content < 1 % spread across the study region. The fourth and fifth most important factors are soil texture and water holding capacity. For soil texture we used data from the Amt für Geoinformationen, which present the dominant topsoil texture with five classes from clay to clay-rich sand that we transformed in three classes with sand as the most vulnerable texture and clay as the least vulnerable texture, as described by the experts (Table 1). Only a few areas spread across Thurgau are covered with sandy soils and are thus most vulnerable (Basadingen-Schlattingen, Felben-Wellhausen, Lommis), whereas Thurgau is mostly covered by clay and silt, decreasing the vulnerability. For the factor of water holding capacity we used the indicator topsoil available water capacity from the European Soil Database (ESDAC, 2022). This indicator presents a very high capacity (> 190 mm) along the river Thur (Märstetten, Felben-Wellhausen, Wigoltingen). In contrast, lowest capacities (< 99 mm) are presented for several LAU2 regions along the coastline and close to the river Rhine. Accordingly, the LAU2 regions in the south are less and in the north are more vulnerable with respect to this factor.

Figure 4Thurgau's most important factors (bold title) masked with agricultural used land and describing the regions' vulnerability according to the experts (Fig. 3) supported by data of the indicators (see legend). The factor's increasing or decreasing effect on the vulnerability is indicated by the arrow in the map (bottom right) and by the colour choice (the darker the colour, the higher the vulnerability). LAU2 regions are indicated by black borders and labelled when showing relatively high or low vulnerability.
In order to represent the overall vulnerability, we summed all factor raster layers and set to zero all non-agricultural areas in order to compute a mean value of vulnerability for each LAU2 region according to the equal (Veq) and expert (Vex) weighting methods (Fig. 4 and Table S5). To identify the agricultural areas we used regional data from the Office for Geoinformation by Thurgau (Amt für Geoinformation Thurgau, 2022).
The five highest Veq towards agricultural drought impacts occur in the central north and northeast part of Thurgau indicated for Raperswilen, Berg, Dozwil, Wigoltingen, and Lommis. All these LAU2 regions show a high share of agricultural land over the total region land, hence making them more exposed to possible drought impacts. In particular, although Raperswilen, Wigoltingen, and Lommis show a larger presence of irrigation infrastructure, many other factors, such as distance to large water bodies, humus content, and water holding capacity, contribute to an increased vulnerability (Fig. 4). Differently from Raperswilen, Wigoltingen, and Lommis, the LAU2 regions of Dozwil and Berg show a lower presence of irrigation infrastructure, but low humus content and water holding capacity. The five lowest Veq are located in the central and southern part of Thurgau (Fischingen, Bichelsee-Balterswil, Bettwiesen, Wilen, Wuppenau). For those regions, almost all underlying factors show moderate to low values besides presence of irrigation infrastructure and share of intensive livestock having higher values. Additionally, a low share of agricultural land drives the low vulnerability (Fig. 4). The highest vulnerability calculated with the expert-based method shows some differences in the spatial distribution of LAU2 regions with the northwest increasing in vulnerability. In particular, the region of Raperswilen is again ranked first, followed by Herdern, Homburg, Wäldi, and Uesslingen-Buch. Across these LAU2 regions, the factors of water holding capacity, humus content, and distance to large water bodies present high vulnerability, apart from Uesslingen-Buch with a relatively short distance to the river Thur (Fig. 4). In contrast, the factor of soil texture presents these regions covered mostly by clay, and the factor of presence of irrigation infrastructure displays almost all regions covered with irrigation systems, both decreasing vulnerability. However, the combined effect of a large share of agricultural land and visible patches of high vulnerability values across the factors of distance to large water bodies, humus content, and water holding capacity contribute to the final high vulnerability values. The LAU2 regions with the five lowest Vex are almost the same as for the equal-weights method with lowest values reported for Fischingen, Bichelsee-Balterswil, Wilen, Bettwiesen, and Berlingen.
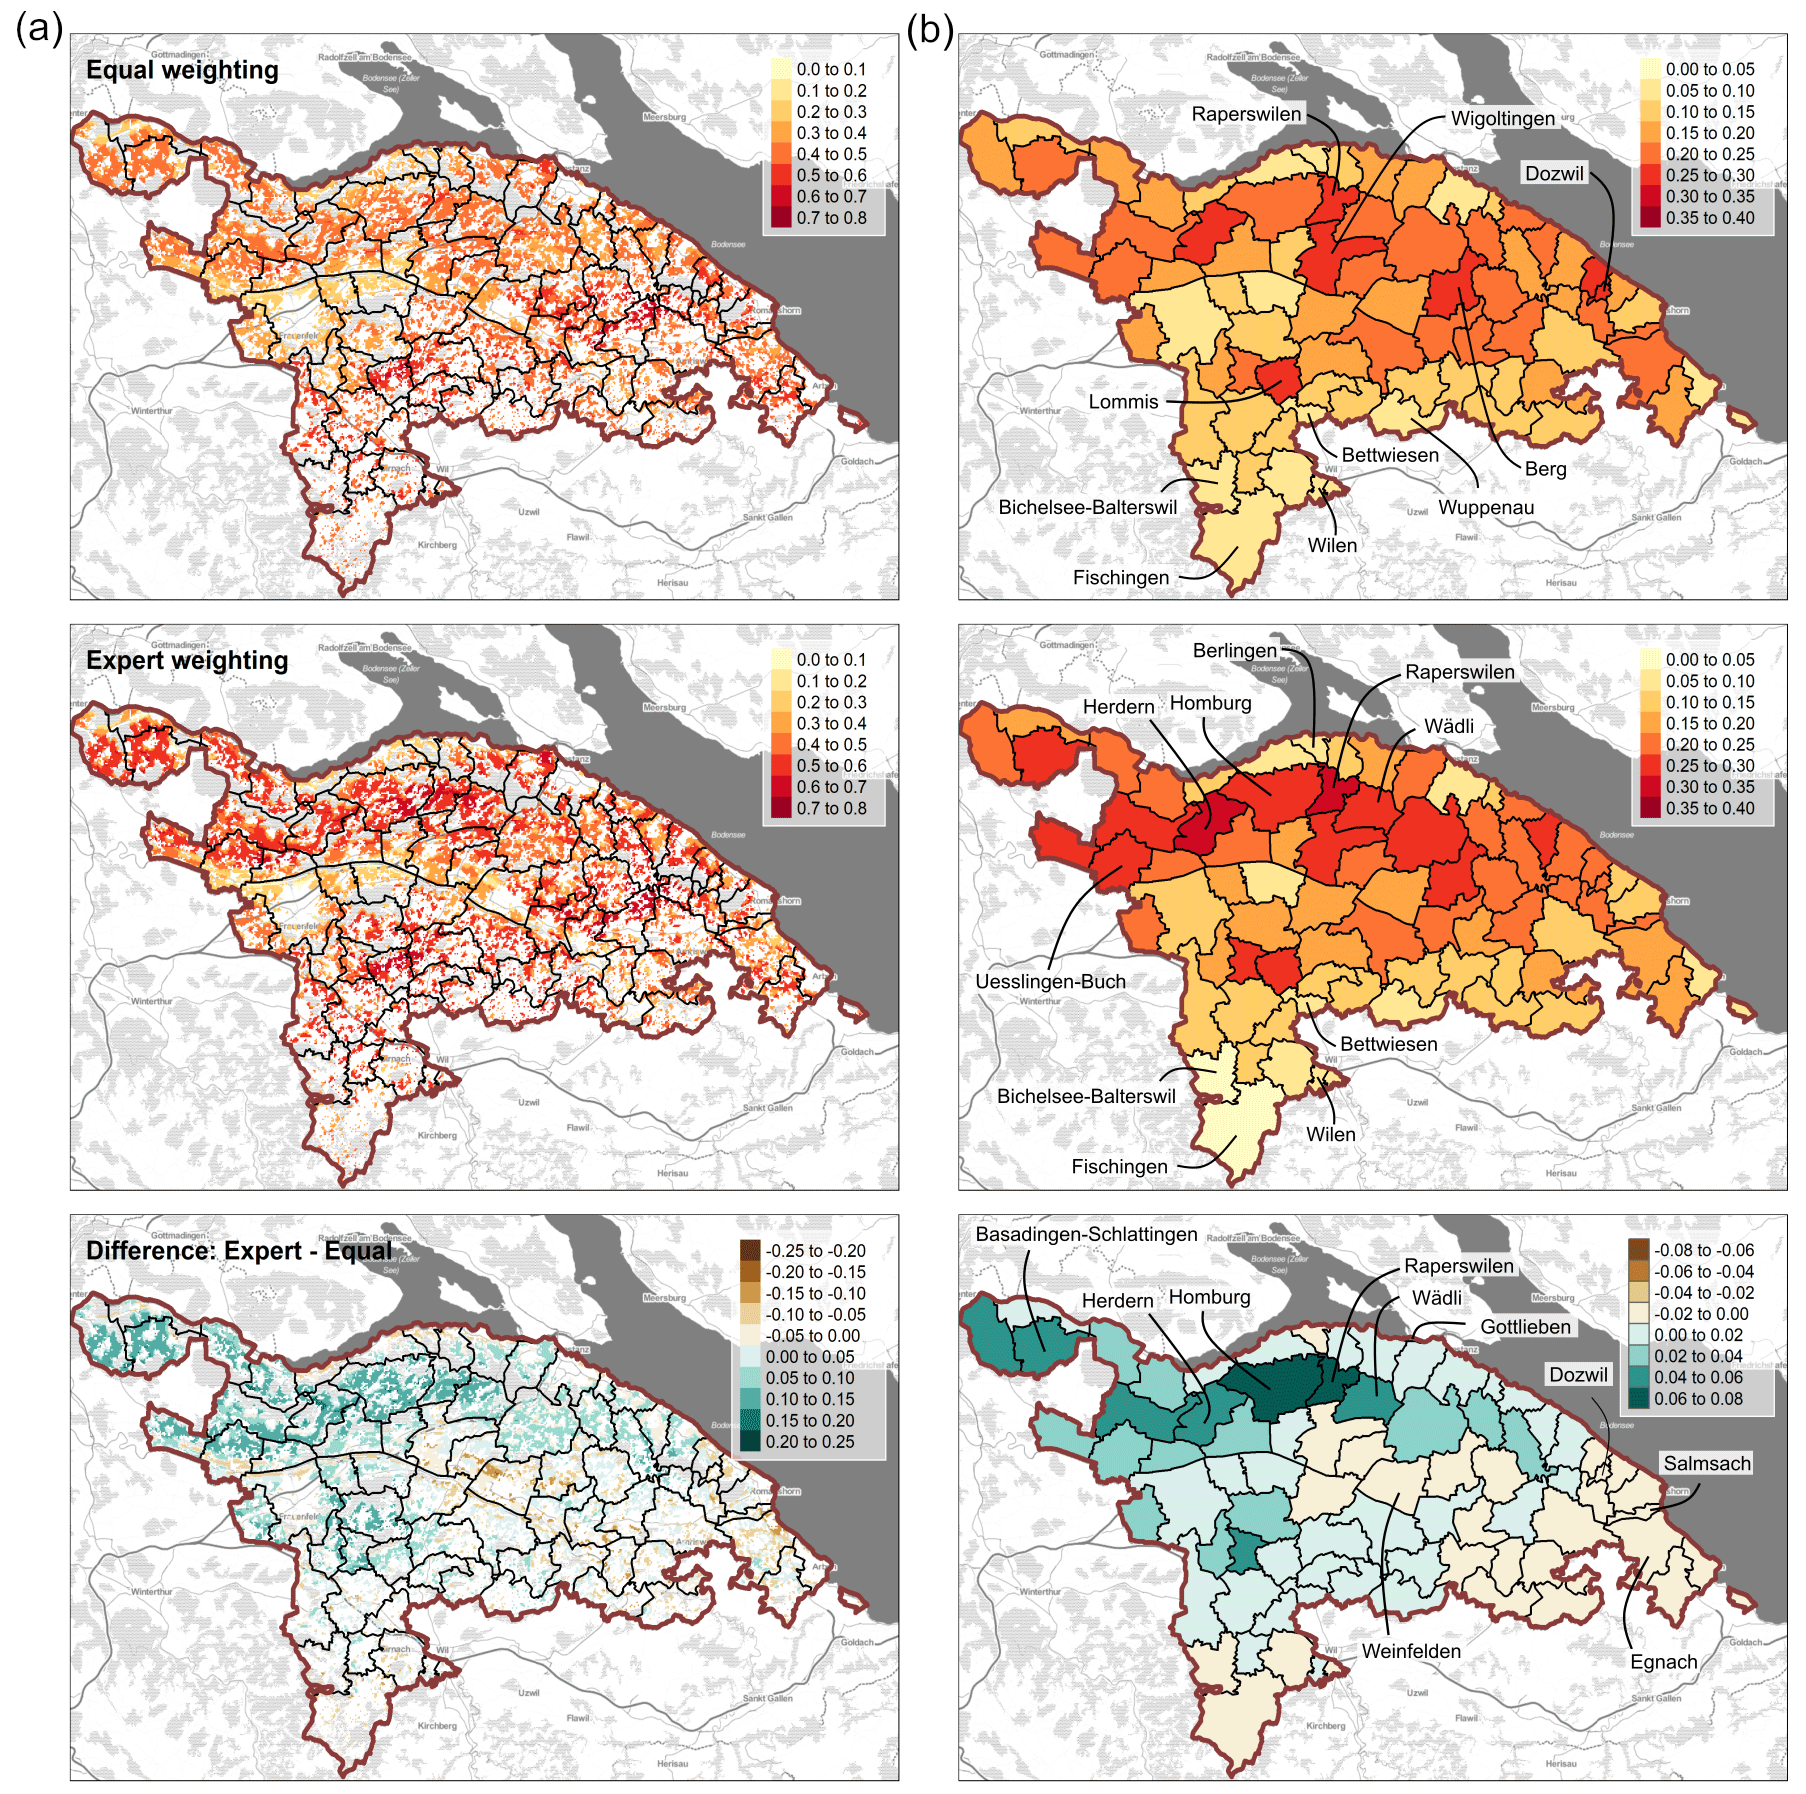
Figure 5The mapped results of equal weighting, expert weighting methods, and their difference across Podravska. On the left (a), masked with agricultural used land and before aggregation on LAU2 regions (black borders). On the right (b), after aggregation for each LAU2 region. LAU2 regions are labelled when showing relatively high or low vulnerability, or relevant differences between the weighting methods.
From a comparative point of view, (Fig. 5, bottom row) results from Vex point to the northwest part of Thurgau with higher vulnerability to drought in agriculture driven by the spatial cluster from the factors distance to large water bodies, water holding capacity, and soil texture. The LAU2 regions showing higher vulnerability are mostly located between the river Rhine and Lake Constance (Homburg, Raperswilen, Herdern, Basadingen-Schlattingen, Wäldi). In contrast, regions with decreased vulnerability are located in the northeast (Dozwil, Salmsach, Egnach) and north (Gottlieben), and in central Thurgau (Weinfelden).
During the participatory validation with Thurgau's experts, the most important factors (Fig. 4) have been discussed regarding their correctness. The experts agreed that in general all these factors present plausible patterns across the region. However, they expected more irrigation in the “Thur valley”, the valley along the river Thur (Fig. 1). They explained that this valley is intensively used for agricultural purposes, and therefore they expected more irrigation infrastructure. As well, they expected less clay-rich soil with clay in this area, because of the high amount of gravel in the valley, typically a sign for sandy soils. They concluded that due to the intensive use for agriculture in the Thur valley, the soil conditions could be modified due to adapted cultivation techniques. Regarding the factor of soil texture, they confirmed the clay-rich but sandy soils in “Unterthurgau” covering the regions Diessenhofen, Schlatt, and Basadingen-Schlattingen in northwestern Thurgau, and the “Lauche valley”, the valley along the river Lauche (Fig. 1). Furthermore, they confirmed the clay-rich soils along the so-called “Seerücken”, a hill range up to 723 m.a.s.l. between Lake Constance and the river Thur (Fig. 1, https://peter-hug.ch/lexikon/1888_bild/45_0487, last access: 10 August 2022). Regarding the factor of humus content, they questioned the low amount of topsoil organic carbon content along the Seerücken. Regarding the mapped vulnerability of agriculture to drought, the experts confirmed that both maps present reasonable differences across Thurgau with higher vulnerability in the north compared to the south. However, the experts highlighted the vulnerability map based on the expert weighting method, because of the better presentation of known hotspot regions. Specifically, the experts pointed to hotspot regions along the Seerücken and to the hotspot Unterthurgau (Fig. 1). The expert weighting method presents all these hotspot regions with higher vulnerability compared to the equal weighting method (Fig. 5, Table S5).
The reasons for as well as the differences between the hotspot regions with high vulnerability have been discussed during the interview. The experts report the Seerücken and Unterthurgau as impacted regularly in the past. However, they explained that Unterthurgau has access to (irrigation) water from the river Rhine and from a large groundwater aquifer filled by the lake and the Rhine. Thus drought typically leads to impacts on agriculture if soil moisture is abnormally low. This is different regarding the Seerücken, during drought conditions typically characterized by low soil moisture, but additionally by low river discharges leading to impacts on agriculture. The experts pointed to the Lauche valley that is specifically better highlighted by the expert weighting method as the regions Stettfurt and Lommis are presented as more vulnerable compared to other regions (Table S5). The experts presented the Lauche as a medium-sized river delivering water for several uses that is quickly overused during drought conditions. Subsequently, in the past user conflicts on irrigation occurred regularly first in the Lauche valley, which is also the case in the current dry situation (21 June 2022).
4.3 Vulnerability Podravska
Podravska's vulnerability is calculated considering 14 factors for both the equal weighting and the expert weighting method (Fig. 3 and Table S6). Within them, the four factors of access to local food market, farm diversification, presence of irrigation infrastructures, and soil texture increased their weights in the expert weighting scheme accounting for a total of 56 % of the overall vulnerability weight.
According to the experts, the most influential factor is the presence of irrigation infrastructure, which accounts for 15 % of the total vulnerability. Irrigated areas are mainly located in the flat areas along the Drava and Polskava rivers, which are crossing from northwest and southwest to east of the Podravska region (Miklavž na Dravskem Polju, Starše, Kidričevo, Hajdina, Markovci, Gorišnica). Areas covered the least with irrigation infrastructure are mainly located in the outer parts of Podravska and at a higher elevation. The second and third most important factors are soil texture and farm diversification, accounting for 14 % of the total vulnerability. Although most of the areas in Podravska show coarser soil texture values with higher contribution to vulnerability, some clay and silt soils patches are located in the central southern area (municipalities of Slovenska Bistrica, Rače–Fram, Kidričevo, Majšperk, and Makole), along the Pesnica river in the northeast part of Podravska, and also close to the municipalities of Ormož and Središče ob Dravi. The factor of farm diversification refers to the presence of additional incomes for farmers, particularly focusing on the possibility of hosting tourists, as highlighted by the experts. As for the factor of soil texture, the factor of farm diversification shows a general condition of homogeneous low values. Only the municipalities of Maribor, Šentilj, Cerkvenjak, and Ormož showed higher values in the number of permanent beds per agricultural holding, which is making them less dependent on the agricultural income, hence more diversified and less vulnerable to potential drought impacts. The fourth most important factor of access to local food market showed a more heterogeneous situation with lower values mainly in the northern part (Šentilj) and in the southern part (Poljčane, Makole, Žetale, Podlehnik, Cirkulane, and Zavrč). The highest values were found for the municipality of Kidričevo, where more than 66 % of the agricultural holdings have 'for sale' as their main destination of their products, followed by Gorišnica with 58.9 %, Rače–Fram with 58.7 %, and Hoče – Slivnica with 56.8 %. The lowest values were found for Podlehnik 18.8 % and Cirkulane 14.4 % in the southern part, where the agricultural holding products are mainly intended for own consumption.
Similarly to the Thurgau case study, we summed all factor raster layers and set to zero all non-agricultural areas in order to compute a mean value of vulnerability for each LAU2 region according to the equal (Veq) and expert (Vex) weighting methods (Fig. 7). To identify the agricultural areas we used regional data on agriculture parcels with declared crop from the INSPIRE Slovenian data portal.
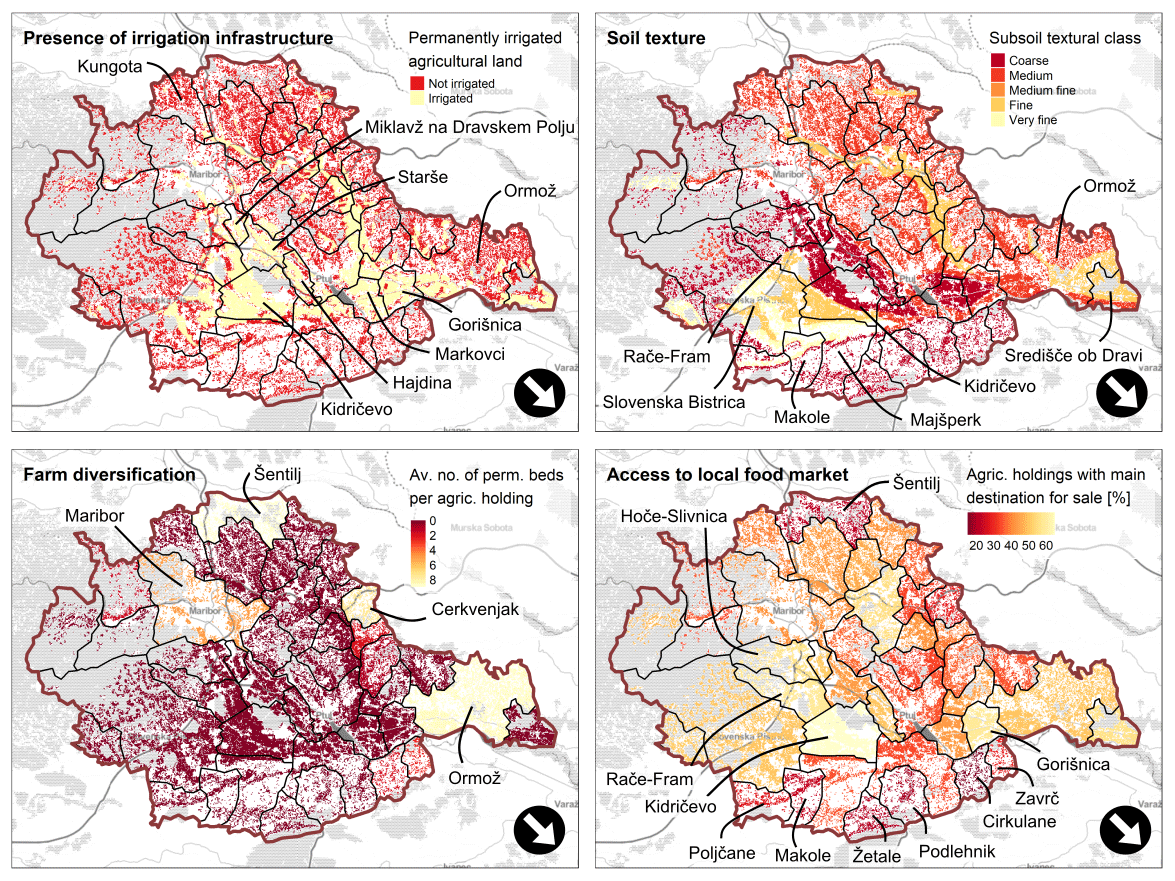
Figure 6Podravska's most important factors (bold title) masked with agricultural used land and describing the regions' vulnerability according to the experts (Fig. 3), supported by data of the indicators (see legend). The factor's increasing or decreasing effect on the vulnerability is indicated by the arrow in the map (bottom right) and by the colour choice (the darker the colour, the higher the vulnerability). LAU2 regions are indicated by black borders and labelled when showing relatively high or low vulnerability.

Figure 7The mapped results of equal weighting, expert weighting methods, and their difference across Podravska. On the left (a), masked with agricultural used land and before aggregation on LAU2 regions (black borders). On the right (b), after aggregation for each LAU2 region. LAU2 regions are labelled when showing relatively high or low vulnerability, or relevant differences between the weighting methods.
The five highest Veq towards agricultural drought impacts occur in the northeast part of Podravska. The highest Veq is indicated for Trnovska vas, followed by Sveti Jurij v Slov. goricah, Destrnik, Benedikt, and Sveti Andraž v Slovenskih goricah. Moreover, other LAU2 regions with high values are still located in the northeast of Podravska. These regions show a high share of agricultural areas combined to low values in terms for presence of irrigation infrastructure, soil texture, farm diversification, and access to local food market (Fig. 6), but also for other factors with lower weight on the overall vulnerability such as distance to mountains, intensity of farming, and humus content (Fig. S3).
The five lowest Veq towards agricultural drought impacts are located in the northwest and southwest parts of Podravska. In particular, Ruše shows the lowest Veq value, followed by Lovrenc na Pohorju, Selnica ob Dravi, Maribor, and Poljčane. These regions show a low share of agricultural areas for each LAU2 region since they are close to mountains with forest as the main land cover type or with large urban areas as for the case of Maribor. Within these regions, the agricultural areas are located along the Drava river and benefit from the low distance to the main urban areas in terms of farm diversification.
The expert weighting method shows the highest values of vulnerability in the northeast part of Podravska with the five highest LAU2 regions being almost the same as for the equal weighting (Sveti Jurij v Slov. goricah, Benedikt, Trnovska vas, Destrnik, and Pesnica, Fig. 7b, Table S6). The shift in highest values of LAU2 regions is visible in the difference between the two maps at the bottom of Fig. 7, with Sveti Jurij v Slov. goricah showing the highest increase driven, among others, by the large share of agricultural areas without the presence of irrigation, a coarse soil texture, and low values of farm diversification.
The lowest values of vulnerability from the expert weighting method are also still located in the northwest and southwest part of Podravska without changes in the rank of the LAU2 regions (Ruše, Lovrenc na Pohorju, Selnica ob Dravi, Maribor, and Poljane).
Comparing the expert weighting results with the equal weighting results (Fig. 7, at the bottom) there are only positive variations coming from higher weights by the experts compared to the equal weighting scheme. This points to a generalized worsening of vulnerability conditions as represented by the experts in Podravska. The LAU2 regions showing higher vulnerability are mostly located in the north and central south of Podravska: Sveti Jurij v Slov. goricah, Gorišnica, Kungota, Benedikt, and Starše. In contrast, the regions with least changes between the two methods are spread across Podravska (Središče ob Dravi, Kidričevo, Ruše, Lovrenc na Pohorju, Sveti Andraž v Slovenskih goricah).
During the participatory validation with the experts from Podravska, we discussed each map of the most important vulnerability factors (Fig. 6). The experts agreed that most shallow soils with coarse texture and subsequently higher vulnerability are close to rivers and springs. Therefore, they pointed to the so-called “Drava valley” along the river Drava and the lowlands that are presented with coarse soils by the factor of soil texture in Fig. 6. Regarding the presence of irrigation infrastructure, the experts confirmed that still a large part of Podravska is not irrigated yet, which is causing problems in the north, northeast, and south. In contrast, they expected the east (especially Ormož) to be more covered with irrigation infrastructure, and questioned if the data source from the EEA Copernicus Land Monitoring Service published in 2018 is correctly displaying the current situation. The experts agreed on the spatial distribution of the factor farm diversification with the regions Maribor, Ormož, and Šentilj showing farms with a higher touristic share due to the presence of vineyards and orchards often offering touristic opportunities. Regarding the factor of access to local food market, they agreed that farms around cities usually have higher access to food markets, as they can sell their products, which is partly displayed around Maribor. However, they expected the east part of Podravska (e.g. Ormož) to have less access to food markets, as the markets there are less developed.
Regarding the final vulnerability maps of agriculture to drought, the experts did not prefer one map out of the two methods, as they both show the main vulnerable regions across Podravska with higher vulnerability in the northeast, in the south, and in the centre of Podravska. They pointed to the fact that subjectivity is less prominent within the equal weighting method, and that the expert weighting method should be validated in depth with local farmers working on the field. In particular, they pointed to the Drava valley and the lowlands called “Ptuj field” and “Drava field” (Fig. 1), as regions having already experienced drought impacts, as they are characterized by shallow soils with low water holding capacity. Nevertheless, the experts agreed that the Drava valley is among the most vulnerable regions in Podravska, because of the intensive production, whereas the vulnerability maps display the north and south as the most vulnerable. Focusing on the northeast and the south, the experts pointed to more hilly conditions and less organized water distribution for irrigation making these areas more vulnerable, which is correctly displayed in Fig. 7. The experts agreed that the western part of Podravska is less vulnerable, as this mountainous region is not intensively used for agriculture but more covered with forests. They also confirmed that the east is less vulnerable (Ormož), although more recent data should be considered to capture the local characteristics of lower access to local food market and higher values of presence of irrigation infrastructure.
5.1 Strengths and weaknesses of the mixed-method approach
This study applied a mixed-method approach with the aim to fully grasp the regions' vulnerability to drought combining qualitative expert knowledge with quantitative data mapping. While the mixed-method approach introduced some simplifications, it also allowed the study to overcome the limitations of applying qualitative and quantitative methods separately.
Answering the first research question, the degree to which vulnerability could be characterized quantitatively was mainly limited by data accessibility. One of the main limitations when performing such local analysis is the availability of suitable quantitative data to support the identified factors. The involvement and exchange of information with local experts proved to be crucial to obtaining references and datasets. Nevertheless, for Thurgau we were unable to find subregional data for 6 out of 18 factors, and for Podravska for 11 out of 25 (Fig. S1). This included, e.g. data for the type of irrigation infrastructure, the share of drought prone and drought resistant species, presence of drought management strategies, farmers age and education, and political conservative vote. In addition, not all data supporting the factors have proven to be fully suitable to describe the factors highlighted by the experts. For example, the no. of beds per agricultural holding representing the factor farm diversification in Podravska simplifies the initial meaning that farms with complementary activities are less vulnerable to drought. The here-selected indicators partly described the corresponding factors, but with the agreement of the experts were included in the assessment, as no better data were accessible.
When quantitative data were available, we applied data from different timescales, resolutions, and units in a pragmatic way. While this introduced some degree of uncertainty to map the current condition, it represented the best possible way to combine multiple information. Moreover, most of the selected factors either are static in time (e.g. altitudes) or require years to show changes at a regional level (e.g. presence of irrigation infrastructures). The challenge to unify various units and value ranges in order to aggregate the data is typical of vulnerability assessment. The literature presents several methods to do so, ranging between building classes and normalizing the values (OECD and JRC, 2008). We normalized the data to avoid additional subjectivity on how to define the classes for each factor and making them easy to interpret. Consequently, we based our final results on mean values in LAU2 regions, avoiding over interpretation. The experts confirmed the need for higher-resolution vulnerability maps for local planning but acknowledged the interpretability and validity of the results.
The vulnerability maps are dependent on the selected experts. In general, the perception of important vulnerability factors might vary substantially between the interviewed persons and their background, such as politicians, water suppliers, or farmers (van Duinen et al., 2015). To avoid biased ratings and the omission of important factors, one option is to reach a saturation point by interviewing as many persons as possible and to use a statistical measure to receive a final weight (Glaser et al., 1968; Guest et al., 2006). However, this is time costly and might display the current opinion and not the best knowledge based on experience with drought conditions. Another option is to question multiple experts from different fields in order to cover specific possible perceptions (Bogner and Menz, 2009). To reduce such biases, we asked regional experts with agricultural, political, and scientific backgrounds to best cover various aspects (i.e. department of agriculture and infrastructure in rural areas; department of environment, water construction and hydrometry; Swiss Federal Institute for Forest; Snow and Landscape Research WSL; Slovenian Environment Agency ARSO; Chamber of Agriculture and Forestry KGZS).
The participatory approach enabled the resulting vulnerability map based on the expert weighting method to be compared to the map resulting from equal weighting of factors. Thus, the mixed-method approach offers the possibility to compare two vulnerability “scenarios”, which is usually not implemented in vulnerability assessments (Hagenlocher et al., 2019). These scenarios provided a wider perspective on potential conditions to address, an advantage acknowledged by the experts during the group interview validation. Such a perspective helps to inform stakeholders and decision makers in particular when results are difficult to validate through quantitative data only. Our experience with the validation confirms the suggestion by Menk et al. (2022) that the inclusion of an expert weighting scenario guarantees a higher level of involvement of local stakeholders.
At each step of the analysis this exchange provided additional information, especially on local features that cannot or are not fully described by the mapped data. In particular, qualitative narratives, as provided during the semi-structured interviews and the group discussions, integrated and supported a better characterization of local vulnerability conditions. This region-specific knowledge of how drought leads to agricultural impacts in the study regions integrates knowledge that external people might not have. Examples are the case of access to local food markets in Podravska and share of pastures in Thurgau. Hence, the mixed-method approach substantially increased the degree to which the region-specific vulnerability could be characterized confirming that the “bottom-up and participatory appraisal” (Zebisch et al., 2021) increases the legitimacy of results while supporting a clear communication and bridging the gap between science and practitioners.
5.2 Sensitivity of region-specific vulnerability
Results from the vulnerability assessment highlighted how the type of weighting methods can affect each region's specific vulnerability, answering the second research question. The equal weighting method is a simple and easily computable method (Kienberger et al., 2016; Becker et al., 2014; Schneiderbauer et al., 2020) that provides a neutral description of the geographical variation of vulnerability conditions, but shows some limitations. In particular, the weight of each factor is dependent on the number of factors included in the analyses. This means, the more factors are considered the less weight is assigned to each factor. This reduces the effect of each factor on the final vulnerability map. Subsequently, factors with a wider range get more influence. In our study regions, these weights were rather similar, as we could identify and supply 12 factors with data in Thurgau, meaning each factor weighs ≈ 0.08, and 14 factors in Podravska, meaning each factor weights ≈ 0.07. The expert weighting method uses the experts' opinion built on specific knowledge of regional drought leading to agricultural impacts in the study regions. The importance rating enabled the experts to assign a higher influence of single factors and respective conditions on the final vulnerability map (Sect. 3.1). For example, the distance to large water bodies received substantially higher weight in both study regions than the equal weights. Thus, the expert weighting method benefits by integrating region-specifics that might be missed by the other method.
The difference resulting from the two scenarios could be interpreted as the sensitivity of the regional vulnerability. Across Thurgau, the expert weighting method showed higher vulnerability in the northwest and lower vulnerability in the east and according to the experts led to a better representation of hot-spot regions. Therefore, the experts prioritized this method. Across Podravska the scenarios diverged less and the experts also did not select one map as a better representation of the regions' vulnerability, but favoured the equal weighting method due to the neutral description. The provision of two possible outcomes increased the engagement and led to critical questions about the subregional sensitivity.
As both scenarios were static and did not employ dynamic approaches, they can only capture part of the complexity of drought vulnerability and risk (Hagenlocher et al., 2019; Blauhut, 2020). For a better characterization, feedback relations and cross-connections between conditions contributing to vulnerability are required. In drought research, vulnerability models allowing such non-linearities are rarely implemented due to the lack of impact data validating the results. Models based on the identified factors would need to consider collinearity between potential predictors and thus require statistical analysis.
5.3 Towards adaptation and potential transferability
During the vulnerability assessment, we identified a range of factors characterizing vulnerability conditions to drought in agriculture in both regions (Sect. 4.1). Some factors represent a sensitivity to static physical terrain conditions (e.g. altitude), while others were associated with conditions that can be changed in time, such as presence of infrastructures (e.g. irrigation) or farming features (e.g. livestock presence and farm size). Within this context, it is crucial to understand what are the factors to leverage the maximum decrease in vulnerability through tailored adaptation strategies. In particular, in both regions the involved experts weighted the presence of irrigation infrastructure as the factor with the highest importance. This result provided information at a spatial level (Figs. 4 and 6) on the areas with the highest potential to decrease vulnerability through the implementation of efficient irrigation systems (e.g. drop irrigation).
In Thurgau, humus content, water holding capacity, and soil texture are the other most important factors. Their conditions might be somewhat improved by the type and extent of agricultural practices, such as diversified crop rotations, providing organic matters to the soil (e.g. plant residues, organic fertilizer), keep the soil properly limed, and apply site-specific cultivation practices to avoid erosion and compaction (Wezel et al., 2014; Hobbs et al., 2008). While some of these practices might already be locally implemented, a regional variation of these factors' values requires widespread practices implemented over years.
In Podravska, farm diversification and access to local food markets presented high potential to decrease vulnerability. In the case of farm diversification, farmers could diversify their intake, for example creating or increasing their touristic offers in order to be less dependent on the pure agricultural production. According to the experts, the owners of vineyards and orchards already offer overnight stays in apartments or touristic tours, a strategy that other farms could implement. Moreover, to increase the access to local food markets, farmers rely on the existence of food markets nearby. This is typically the case for farms close to large cities such as Maribor or Ptuj, but not in rural areas distant from urban centres. Improving road connectivity in rural areas to urban centres or developing cooperative partnerships could enable access to food markets with a higher variety of agricultural products, as farms could combine their products and share transportation costs (Mather and Preston, 1980).
While some of these adaptation strategies are already implemented in parts of both regions, the mixed-method approach shows which factor to prioritize and where to intervene in order to trigger the largest decrease in agricultural vulnerability to drought conditions. The presented strategies range from land-use planning, over farm cultivation techniques, towards policies that strengthen the agricultural sector to better cope with drought. Further adaptation planning should integrate them with the available local infrastructural and financial resources through efficient communication among stakeholders from agriculture, policy, and science.
The study's focus on region-specific vulnerability raises the question which results, and general conclusions might be transferable to other study regions. The here-identified factors contributing to vulnerability to drought point to both common and region-specific influences. The majority of the identified factors were solely mentioned for one of the regions demonstrating the limitation to extrapolate the factor selection or the expert weights to other regions. Nonetheless, 10 common factors were identified, which point to similar underlying processes leading to drought impacts on agriculture. Thus, the common factor selection could serve as a baseline for other regions. Specifically, the factors of presence of irrigation infrastructure and soil texture played a major role in both regions and, in conclusion, can be considered as generally important for agriculture's vulnerability to drought in pre-Alpine regions. Regarding the other common factors, the importance rating differed slightly between the case studies, wherefore the relevance of these factors for other regions needs further information.
The results offer a starting point for a common baseline vulnerability, but suggest the necessity for region-specific adaptation planning. The steps of the presented mixed-method approach offer a blueprint for such a combination and enable a comprehensive understanding of the region-specific context of conditions driving or mitigating vulnerability to drought.
Drought vulnerability is defined by various regional and local factors, which differ depending on the region's conditions and on the regions' adaptation due to experiences of past drought impacts. In this study, we identified a wide range of vulnerability factors with differences and similarities among the two case study regions highlighting the complexity of vulnerability and the difficulty to upscale the results to other, respectively larger regions, such as the whole Alpine space. For both case study regions we could not support all vulnerability factors with data, a restriction that can be interpreted as uncertainty of the presented results. Additionally, the different weighting methods aggregating vulnerability factors can serve as a measure of sensitivity towards the calculation approach. Being aware of the range of sensitivity and uncertainty, the final results can be embedded better in the region-specific context, which is essential for any planning and adaptation strategies. Even though this comes along with limitations in the quantitative part of the mixed-method approach, the resulting vulnerability maps were in general confirmed by the regional experts showing that we might not need to draw the complete picture of all facets defining vulnerability. Other regions can benefit from the approach presented here and tailor the participatory approach with their regional experts to identify the region-specific context and to validate the quantitative results. This can increase the acceptance of scientific results and subsequently closes the gap between science and practitioners highlighting the benefits of the mixed-method approach that combines quantitative with qualitative analyses. Future developments for the assessments of agriculture vulnerability to drought should address the challenge of upscaling local vulnerability assessments to other areas according to their similar biophysical and socio-economic conditions. Moreover, an upscaled analysis can lead to a better integration of the vulnerability assessment results into a drought risk assessment at larger scales, advancing the identification of risk hotspots and those factors to leverage for adaptation.
Overall, the results of this vulnerability assessment identified a range of adaptation strategies dependent on regional resources and efficient communication between the agricultural, political, and scientific professionals. Many facets of the described adaptation strategies to decrease vulnerability to drought are in accordance with sustainability goals and climate change adaptation, demonstrating the need to move from emergency actions to better preparedness. In order to better understand and quantitatively describe feedback relations and interactions between vulnerability factors, the development of drought vulnerability models integrating non-linearities is required, a field still highly underexplored.
The data we used are clarified and summarized in Table 1 and are publicly available. Table 1, column “Data source”, refers to the reference list where there are links to the corresponding data portals.
The supplement related to this article is available online at: https://doi.org/10.5194/nhess-23-45-2023-supplement.
All authors designed the analysis; RS, ST, SC, and ME prepared the data and implemented the formal analysis. RS and ST visualized the results. All authors contributed substantially to the discussion of the content. RS, ST, SC, and ME prepared the original draft, and KS and MZ contributed to the writing process.
The contact author has declared that none of the authors has any competing interests.
Publisher's note: Copernicus Publications remains neutral with regard to jurisdictional claims in published maps and institutional affiliations.
This research was funded by the EU Interreg. Alpine Space Programme project ADO (Alpine Space Observatory; grant no. ASP940). Additional funding was provided by the Provincia autonoma di Bolzano – Alto Adige within the AquaMount project (grant no. D59C20000160003). We acknowledge all the experts involved in this study for their time and support. We thank our ADO partners from Podravska and Thurgau for their effort and support in data collection.
This research has been supported by the EU Interreg. Alpine Space Programme project ADO (Alpine Space Observatory; grant no. ASP940) and the Provincia autonoma di Bolzano – Alto Adige within the AquaMount project (grant no. D59C20000160003).
This open-access publication was funded by the University of Freiburg.
This paper was edited by Brunella Bonaccorso and reviewed by Iolanda Borzì and David J. Peres.
Amt für Geoinformation Thurgau: Geoinformation for the Kanton Thurgau [data set], https://geoinformation.tg.ch/, last access: 15 March 2022. a, b, c, d, e, f
Ayantunde, A. A., Turner, M. D., and Kalilou, A.: Participatory analysis of vulnerability to drought in three agro-pastoral communities in the West African Sahel, Pastoralism, 5, 1–11, 2015. a
Becker, D., Renner, K., and Schneiderbauer, S.: Assessing and Mapping Climate Change Vulnerability with the Help of GIS: Example of Burundi: GI_Forum, Geospatial Innovation for Society, 101–104, http://austriaca.at/0xc1aa5576_0x0030d408.pdf (last access: 10 August 2022), 2014. a
Beniston, M. and Stoffel, M.: Assessing the impacts of climatic change on mountain water resources, Sci. Total Environ., 493, 1129–1137, https://doi.org/10.1016/j.scitotenv.2013.11.122, 2014. a
Birhanu, Z., Ambelu, A., Berhanu, N., Tesfaye, A., and Woldemichael, K.: Understanding resilience dimensions and adaptive strategies to the impact of recurrent droughts in Borana Zone, Oromia Region, Ethiopia: A grounded theory approach, Int. J. Env. Res. Pub. He., 14, 118, https://doi.org/10.3390/ijerph14020118, 2017. a
Birkmann, J., Cardona, O. D., Carreño, M. L., Barbat, A. H., Pelling, M., Schneiderbauer, S., Kienberger, S., Keiler, M., Alexander, D., and Zeil, P.: Framing vulnerability, risk and societal responses: the MOVE framework, Nat. Hazards, 67, 193–211, 2013. a
Blauhut, V.: The triple complexity of drought risk analysis and its visualisation via mapping: a review across scales and sectors, Earth-Sci. Rev., 210, 103345, https://doi.org/10.1016/j.earscirev.2020.103345, 2020. a
Bogner, A. and Menz, W.: The theory-generating expert interview: epistemological interest, forms of knowledge, interaction, in: Interviewing experts, 43–80, Springer, ISBN 978-0-230-22019-5, 2009. a
Carrão, H., Naumann, G., and Barbosa, P.: Mapping global patterns of drought risk: An empirical framework based on sub-national estimates of hazard, exposure and vulnerability, Global Environ. Chang., 39, 108–124, https://doi.org/10.1016/j.gloenvcha.2016.04.012, 2016. a
CLC: Copernicus Land Monitoring Service – Corine Land Cover [data set], https://land.copernicus.eu/pan-european/corine-land-cover/, last access: 15 June 2022. a, b, c, d, e, f
DMCSEE: Drought Mitigation Centre for Southeastern Europe, Drought monitoring bulletin: Overview from February to September 2017, http://www.dmcsee.org/uploads/file/430_dmcsee_bulletin_season2017.pdf (last access: 10 August 2022), 2017. a
DROUGHT-CH: Early recognition of critical drought and low flow conditions in Switzerland, http://www.drought.ch, last access: 20 July 2022. a
EEA: European Environment Agency [data set], https://www.eea.europa.eu/, last access: 15 March 2022. a, b
ESDAC: European Soil Data Centre: Thematic centre for soil related data in Europe [data set], https://esdac.jrc.ec.europa.eu/, last access: 15 March 2022. a, b, c, d, e, f, g, h, i
EU-DEM: Copernicus Land Monitoring Service – EU-DEM [data set], https://land.copernicus.eu/imagery-in-situ/eu-dem/eu-dem-v1.1/view, last access: 15 March 2022. a
EU-Hydro: EU-Hydro – River Network Database, Version 1.3 [data set], https://land.copernicus.eu/imagery-in-situ/eu-hydro/eu-hydro-river-network-database?tab=mapview, last access: 15 March 2022. a, b, c
European Mountain Areas: European Mountain Areas – Version 1 [data set], https://www.eea.europa.eu/data-and-maps/data/european-mountain-areas, last access: 15 March 2022. a
FOEN: Federal Office for the Environment: Federal Centre of Excellence for the Environment [data set], https://www.bafu.admin.ch/bafu/en/home.html, last access: 15 March 2022. a, b
Fritzsche, K., Schneiderbauer, S., Bubeck, P., Kienberger, S., Buth, M., Zebisch, M., and Kahlenborn, W.: The Vulnerability Sourcebook: Concept and guidelines for standardised vulnerability assessments, Deutsche Gesellschaft für Internationale Zusammenarbeit (GIZ) GmbH, https://www.adaptationcommunity.net/download/va/vulnerability-guides-manuals-reports/vuln_source_2017_EN.pdf (last access: 10 January 2023), 2014. a
GIZ and EURAC: Risk supplement to the vulnerability sourcebook, Guidance on How to Apply the Vulnerability Sourcebook's Approach with the New IPCC AR5 Concept of Climate Risk, Deutsche Gesellschaft für Internationale Zusammenarbeit (GIZ) GmbH, http://www.adaptationcommunity.net/wp-content/uploads/2017/10/GIZ-2017_Risk-Supplement-to-the-Vulnerability-Sourcebook.pdf (last access: 10 January 2023), 2017. a
Glaser, B. G., Strauss, A. L., and Strutzel, E.: The discovery of grounded theory; strategies for qualitative research, Nurs. Res., 17, p. 364, https://doi.org/10.1097/00006199-196807000-00014, 1968. a
González Tánago, I., Urquijo, J., Blauhut, V., Villarroya, F., and de Stefano, L.: Learning from experience: a systematic review of assessments of vulnerability to drought, Nat. Hazards, 80, 951–973, https://doi.org/10.1007/s11069-015-2006-1, 2016. a
Guest, G., Bunce, A., and Johnson, L.: How many interviews are enough? An experiment with data saturation and variability, Field Method., 18, 59–82, 2006. a
Hagenlocher, M., Meza, I., Anderson, C. C., Min, A., Renaud, F. G., Walz, Y., Siebert, S., and Sebesvari, Z.: Drought vulnerability and risk assessments: state of the art, persistent gaps, and research agenda, Environ. Res. Lett., 14, 083002, https://doi.org/10.1088/1748-9326/ab225d, 2019. a, b, c
Hanel, M., Rakovec, O., Markonis, Y., Máca, P., Samaniego, L., Kyselý, J., and Kumar, R.: Revisiting the recent European droughts from a long-term perspective, Sci. Rep., 8, 1–11, 2018. a
Hartl-Meier, C., Zang, C., Dittmar, C., Esper, J., Göttlein, A., and Rothe, A.: Vulnerability of Norway spruce to climate change in mountain forests of the European Alps, Clim. Res., 60, 119–132, 2014. a
Haslinger, K. and Blöschl, G.: Space-Time Patterns of Meteorological Drought Events in the European Greater Alpine Region Over the Past 210 Years, Water Resour. Res., 53, 9807–9823, https://doi.org/10.1002/2017WR020797, 2017. a
Hobbs, P. R., Sayre, K., and Gupta, R.: The role of conservation agriculture in sustainable agriculture, Philos. T. Roy. Soc. Lond. B, 363, 543–555, https://doi.org/10.1098/rstb.2007.2169, 2008. a
Immerzeel, W. W., Lutz, A. F., Andrade, M., Bahl, A., Biemans, H., Bolch, T., Hyde, S., Brumby, S., Davies, B. J., Elmore, A. C., Emmer, A., Feng, M., Fernández, A., Haritashya, U., Kargel, J. S., Koppes, M., Kraaijenbrink, P. D. A., Kulkarni, A. V., Mayewski, P. A., Nepal, S., Pacheco, P., Painter, T. H., Pellicciotti, F., Rajaram, H., Rupper, S., Sinisalo, A., Shrestha, A. B., Viviroli, D., Wada, Y., Xiao, C., Yao, T., and Baillie, J. E. M.: Importance and vulnerability of the world's water towers, Nature, 577, 364–369, https://doi.org/10.1038/s41586-019-1822-y, 2020. a
INSPIRE: Slovenian Data Portal [data set], https://eprostor.gov.si, last access: 15 March 2022. a, b, c, d, e, f
IPCC: Managing the Risks of Extreme Events and Disasters to Advance Climate Change Adaptation: A Special Report of Working Groups I and II of the Intergovernmental Panel on Climate Change, Special Report of the IPCC, edited by: Field, C. B., Barros, V., Stocker, T. F., Qin, D., Dokken, D. J., Ebi, K. L., Mastrandrea, M. D., Mach, K. J., Plattner, G.-K., Allen, S. K., Tignor, M., and Midgley, P. M., Cambridge University Press, Cambridge, UK, and New York, NY, USA, 582 pp., ISBN 978-1-107-02506-6, 2012. a
IPCC: Climate Change 2022: Impacts, Adaptation and Vulnerability. Contribution of Working Group II to the Sixth Assessment Report of the Intergovernmental Panel on Climate Change, edited by: Pörtner, H.-O., Roberts, D. C., Tignor, M., Poloczanska, E. S., Mintenbeck, K., Alegría, A., Craig, M., Langsdorf, S., Löschke, S., Möller, V., Okem, A., and Rama, B., Cambridge University Press, Cambridge University Press, Cambridge, UK and New York, NY, USA, 3056 pp., https://www.ipcc.ch/report/ar6/wg2/ (last access: 10 January 2023), 2022. a
Kienberger, S., Borderon, M., Bollin, C., and Jell, B.: Climate change vulnerability assessment in Mauritania: Reflections on data quality, spatial scales, aggregation and visualizations, GI_Forum Journal, 1, 167–175, 2016. a
Komac, B., Ferk, M., Pipan, P., Tičar, J., and Zorn, M.: Nat. Hazards in Slovenia, The Geography of Slovenia. World Regional Geography Book Series, Springer, Cham, 259–277, https://doi.org/10.1007/978-3-030-14066-3_17, 2019. a
Laaha, G., Gauster, T., Tallaksen, L. M., Vidal, J.-P., Stahl, K., Prudhomme, C., Heudorfer, B., Vlnas, R., Ionita, M., Van Lanen, H. A. J., Adler, M.-J., Caillouet, L., Delus, C., Fendekova, M., Gailliez, S., Hannaford, J., Kingston, D., Van Loon, A. F., Mediero, L., Osuch, M., Romanowicz, R., Sauquet, E., Stagge, J. H., and Wong, W. K.: The European 2015 drought from a hydrological perspective, Hydrol. Earth Syst. Sci., 21, 3001–3024, https://doi.org/10.5194/hess-21-3001-2017, 2017. a
LID: Landwirtschaftlicher Informationsdienst: Thurgauer Landwirtschaft Zum Anfassen, https://www.lid.ch/fileadmin/lid/Produkte/Kantonsbroschueren/55263_Broschuere_Thurgauer-Landwirtschaft.pdf (last access: 10 August 2022), 2007. a
Martin, R., Linstädter, A., Frank, K., and Müller, B.: Livelihood security in face of drought–assessing the vulnerability of pastoral households, Environ. Model. Softw., 75, 414–423, 2016. a
Mather, J. W. and Preston, H. J.: Cooperative benefits and limitations, Cooperative information report; no. 1, Sect. 3, https://www.rd.usda.gov/files/cir1sec3.pdf (last access: 10 August 2022), 1980. a
Melkonyan, A.: Environmental and socio-economic vulnerability of agricultural sector in Armenia, Sci. Total Environ., 488, 333–342, 2014. a
Menk, L., Terzi, S., Zebisch, M., Rome, E., Lückerath, D., Milde, K., and Kienberger, S.: Climate Change Impact Chains: A Review of Applications, Challenges, and Opportunities for Climate Risk and Vulnerability Assessments, Weather Clim. Soc., 14, 619–636, https://doi.org/10.1175/WCAS-D-21-0014.1, 2022. a
Meza, I., Siebert, S., Döll, P., Kusche, J., Herbert, C., Eyshi Rezaei, E., Nouri, H., Gerdener, H., Popat, E., Frischen, J., Naumann, G., Vogt, J. V., Walz, Y., Sebesvari, Z., and Hagenlocher, M.: Global-scale drought risk assessment for agricultural systems, Nat. Hazards Earth Syst. Sci., 20, 695–712, https://doi.org/10.5194/nhess-20-695-2020, 2020. a, b
OECD and JRC: Handbook on constructing composite indicators: methodology and user guide: Methodology and user guide, ISBN 978-92-64-04345-9, https://knowledge4policy.ec.europa.eu/sites/default/files/jrc47008_handbook_final.pdf (last access: 10 January 2022), 2008. a
Schneiderbauer, S., Baunach, D., Pedoth, L., Renner, K., Fritzsche, K., Bollin, C., Pregnolato, M., Zebisch, M., Liersch, S., Del Rivas López, M. R., and Ruzima, S.: Spatial-Explicit Climate Change Vulnerability Assessments Based on Impact Chains. Findings from a Case Study in Burundi, Sustainability, 12, 6354, https://doi.org/10.3390/su12166354, 2020. a, b
SFSO: Swiss Federal Statistical Office: Statistical data on Switzerland [data set], https://www.bfs.admin.ch, last access: 15 March 2022. a, b, c, d, e, f
Stephan, R., Erfurt, M., Terzi, S., Žun, M., Kristan, B., Haslinger, K., and Stahl, K.: An inventory of Alpine drought impact reports to explore past droughts in a mountain region, Nat. Hazards Earth Syst. Sci., 21, 2485–2501, https://doi.org/10.5194/nhess-21-2485-2021, 2021. a, b
SURS: Statistical Office of the Republic of Slovenia: Statistical data provided by SURS [data set], https://www.stat.si/StatWeb/, last access: 15 March 2022. a, b, c, d, e, f, g, h
Terzi, S., Sušnik, J., Schneiderbauer, S., Torresan, S., and Critto, A.: Stochastic system dynamics modelling for climate change water scarcity assessment of a reservoir in the Italian Alps, Nat. Hazards Earth Syst. Sci., 21, 3519–3537, https://doi.org/10.5194/nhess-21-3519-2021, 2021. a
van Duinen, R., Filatova, T., Geurts, P., and van der Veen, A.: Empirical analysis of farmers' drought risk perception: Objective factors, personal circumstances, and social influence, Risk Anal., 35, 741–755, 2015. a
Van Loon, A. F., Stahl, K., Di Baldassarre, G., Clark, J., Rangecroft, S., Wanders, N., Gleeson, T., Van Dijk, A. I. J. M., Tallaksen, L. M., Hannaford, J., Uijlenhoet, R., Teuling, A. J., Hannah, D. M., Sheffield, J., Svoboda, M., Verbeiren, B., Wagener, T., and Van Lanen, H. A. J.: Drought in a human-modified world: reframing drought definitions, understanding, and analysis approaches, Hydrol. Earth Syst. Sci., 20, 3631–3650, https://doi.org/10.5194/hess-20-3631-2016, 2016. a
Wezel, A., Casagrande, M., Celette, F., Vian, J.-F., Ferrer, A., and Peigné, J.: Agroecological practices for sustainable agriculture. A review, Agron. Sustain. Dev., 34, 1–20, 2014. a
Zebisch, M., Schneiderbauer, S., Fritzsche, K., Bubeck, P., Kienberger, S., Kahlenborn, W., Schwan, S., and Below, T.: The vulnerability sourcebook and climate impact chains – a standardised framework for a climate vulnerability and risk assessment, Int. J. Clim. Chang., 13, 35–59, https://doi.org/10.1108/IJCCSM-07-2019-0042, 2021. a, b, c, d
Zorn, M. and Hrvatin, M.: Damage caused by Natural Disasters in Slovenia between 1991 and 2008, Acta Geobalcanica, 1, 33–43, https://doi.org/10.18509/AGB.2015.04, 2015. a