the Creative Commons Attribution 4.0 License.
the Creative Commons Attribution 4.0 License.
 | 20 Nov 2023
Back analysis of a building collapse under snow and rain loads in a Mediterranean area
Isabelle Ousset
Damien Raynaud
Thierry Faug
At the end of February 2018 the Mediterranean area of Montpellier in France was struck by a significant snowfall that turned into an intense rain event caused by an exceptional atmospheric situation. This rain-on-snow event produced pronounced damage to many buildings of different types. In this study, we report a detailed back analysis of the roof collapse of a large building, namely Irstea Cévennes. Attention is paid to the dynamics of the climatic event, on the one hand, and the mechanical response of the metal roof structure to different snow and rain loads, on the other hand. The former aspect relies on multiple sources of information that provide reliable estimates of snow heights in the area before the rain came into play and substantially modified the load on the roof. The latter aspect relies on detailed finite-element simulations of the mechanical behavior of the roof structure in order to assess the pressure due to snow and rain loading, which could theoretically lead to failure. By combining the two approaches, it is possible to reconstruct the most probable scenario for the roof failure before its full collapse. As an example of building behavior and vulnerability to an atypical rain-on-snow event in the Mediterranean area of France, this detailed case study provides useful key points to be considered in the future for a better mitigation of such events in non-mountainous areas.
- Article
(7099 KB) - Full-text XML
-
Supplement
(5546 KB) - BibTeX
- EndNote


In the framework of snowfalls, there are a number of reported cases of roof collapses caused by snow loads outside mountainous areas. The following events that occurred during the past 2 decades can be mentioned:
-
in France, the collapse of the roof of a warehouse in Satolas-et-Bonce in the department of Isère and of a supermarket in Bricquebec in the department of Manche (January 2010); several collapses of roofs in western France (at least nine store roofs in the department of Manche) in March 2013; and a lot of damage to shops in the department of Hérault at the end of February 2018 in the cities of Béziers, Lattes, Montpellier and Pérols (see examples shown in Fig. 1);
-
in Europe, the collapse of a self-weighted metallic roof in Spain in March 2004 (del Coz Díaz et al., 2012); the collapse of a public fair pavilion in Italy during February 2001 (Brencich, 2010); the total collapse of the Katowice fair building in Poland, which caused 65 deaths and 180 injuries in January 2006 (Biegus and Rykaluk, 2009); the collapse of the Bad Reichenhall ice rink roof in Germany, which led to 15 deaths in the same month (Winter and Kreuzinger, 2008); the collapse of a gymnasium roof in Switzerland in 2009 (Piskoty et al., 2013); the collapse of a store hall in Gdańsk (Poland) in February 2010 (Biegus and Kowal, 2013); and the collapse of a shopping facility in Poland during January 2015 (Krentowski et al., 2019); and
-
in other regions of the world, collapses of truss roof structures in Turkey in February 2003 (Caglayan and Yuksel, 2008) as well as during January and October 2015 (Piroglu and Ozakgul, 2016; Altunişik et al., 2017) and many roof collapses in the northeastern United States (O'Rourke and Wikoff, 2014) during the winter of 2010–2011.
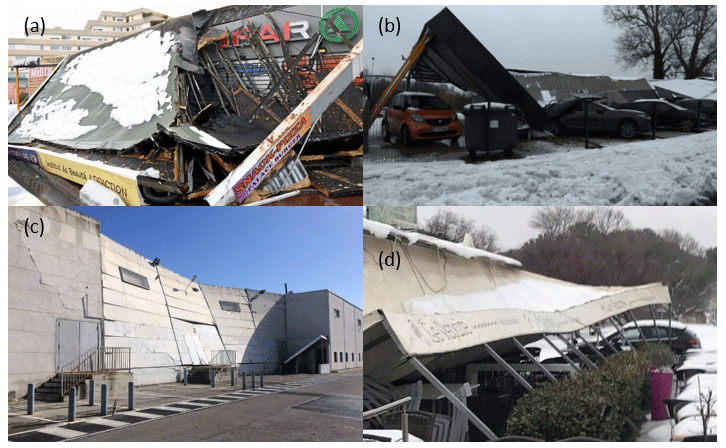
Figure 1Roof collapses due to heavy snowfalls that occurred on 28 February and 1 March 2018 in the surroundings of Montpellier, France: collapses of (a) the Estanove shopping center in Montpellier (photo credit: © Jean-Michel Mart), (b) a car wash station in Lattes (photo credit: © Le Petit Journal de Lattes), (c) the Darty store in Pérols (photo credit: © France 3 LR / Sébastien Banus) and (d) a restaurant in La Grande-Motte (photo credit: © France 3).
The principal source of explanation given in the literature for these building collapses is a stronger (greater than the standard) snowfall hazard (Strasser, 2008; Holický and Sýkora, 2009; Geis et al., 2012; Le Roux et al., 2020). It should be noted that a poor design or insufficient material strengths may sometimes be identified as another main reason for the collapse (Biegus and Rykaluk, 2009; Caglayan and Yuksel, 2008; Brencich, 2010; del Coz Díaz et al., 2012; Biegus and Kowal, 2013; Piskoty et al., 2013; O'Rourke and Wikoff, 2014; Altunişik et al., 2017; Krentowski et al., 2019). In a large meta-analysis of building failures related to snow loads, Geis (2011) found that these incidents are commonly attributed to the large amount of snow, followed by problems in the design of the building, melting snow and rain-on-snow events.
Roof collapses due to rain-on-snow surcharges can happen in situations where the temperature is close to 0 ∘C during the snow event. In the United States, the potential rain-on-snow surcharge of roof snow loads has been discussed in detail by O'Rourke and Downey (2001) and is taken into account in the building standards (ASCE, 2013). Canada considers the direct sum of the snow load and the rain load (Canadian Commission on Building and Fire Codes, 2010). Rain-on-snow surcharges have been the subject of several studies in Japan (Otsuki et al., 2016; Takahashi et al., 2016) following a rain-on-snow event that occurred in February 2014 in the Kanto region and where the additional rain on the snow load caused the collapse of many large-span structures. Using controlled outdoor experiments where rain is added to a snow cover, Otsuki et al. (2017) show that rain contributes to a larger increase in the snow load for larger roofs with smaller slope angles due to the time it takes for the water to reach the eaves. In Europe, Eurocode 1 provides guidelines for the calculation of the design snow load (AFNOR, 2007). Eurocode 1 specifies that in areas where rain on snow may cause melting followed by frost, the values of loads due to snow on the roof must be increased, especially if snow and ice can block the roof drainage system. The NF EN 1991-1-3 standard stipulates that roof snow load must be increased by 0.2 kN m−2 when the slope for water flow is lower than 3 %, in order to account for the snow density increase resulting from difficulties in water drainage in the case of rain.
The current paper reports a detailed and specific case study of a roof collapse of a scientific laboratory (formerly Irstea, now INRAE, the Institut National de Recherche pour l'Agriculture, l'alimentation et l'Environnement) which occurred on 1 March around 18:00 LT following an intense rain-on-snow event in a Mediterranean area. Several roof collapses took place in this area in the same period (see Fig. 1).
Figure 2 shows the main damage observed during a field visit on 18 March 2018, shortly after the collapse of the experimental hall of the Irstea Cévennes building in the central part of the structure, in the east–west direction. The western and eastern facades were heavily damaged, as seen in Fig. 2a and c. On the contrary, the other two facades (see Fig. 2b and d) were much less damaged due to the presence of the inner concrete walls of the offices and the inner metal frames of the laboratory rooms along the southern and northern facades, respectively. Local damage observed on structural elements consists of (i) buckling and bending of the roof tubular profiles, (ii) bending and shear of the tubular supporting pylons, and (iii) cracking on the walls of the offices (see close-up views of the damage shown in Fig. S3 in the Supplement).
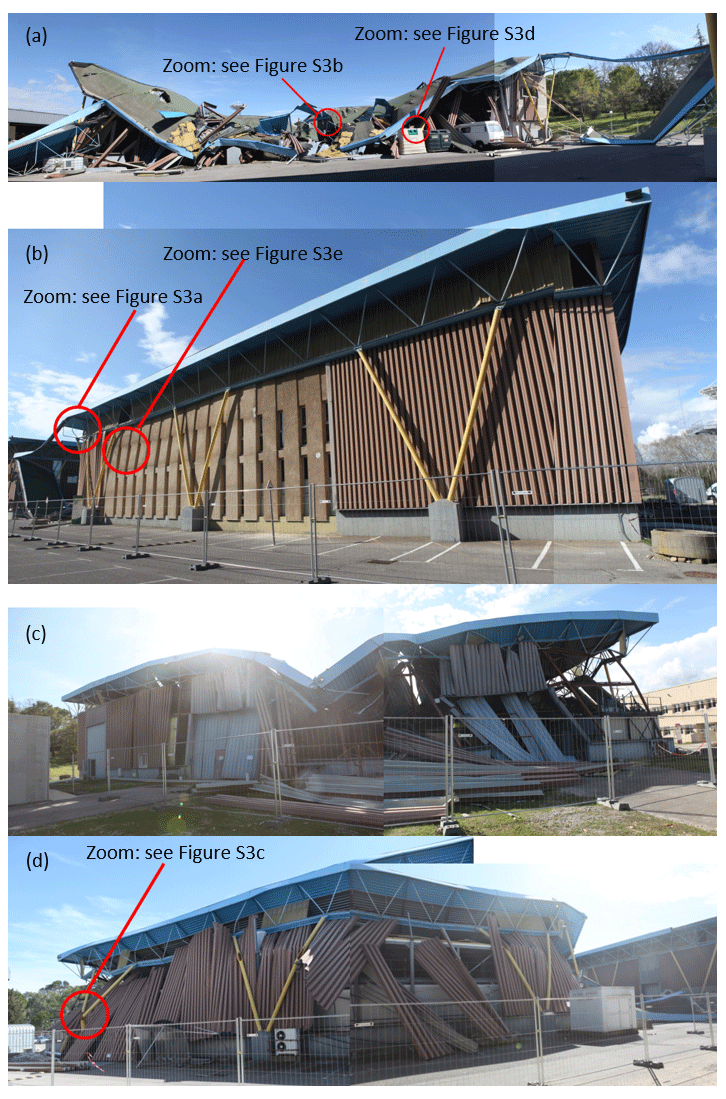
Figure 2Different pictures showing the extent of damage as observed on 18 March 2018 on the western (a), southern (b), eastern (c) and northern (d) facades of the Irstea Cévennes building.
This study aims at fulfilling the following two objectives: (1) what is the most likely load at the time of the collapse, and how does it compare to the characteristic values (e.g., Eurocode snow loads)? (2) What is the most likely scenario for the roof failure? That is, how did the structure reach a critical state which led to its collapse? We first present the meteorological event consisting of a snowfall followed by rain at the time of the roof collapse in Sect. 2 using multiple sources of information: outputs from the AROME numerical model, which is the French fine-mesh numerical weather forecast service model; social network testimonies; and weather observations. Section 3 presents finite-element simulations of the mechanical behavior of the building subject to different pressure fields representing snow and rain loads. Section 4 makes the link between Sects. 3 and 2 and presents a detailed description of the most probable scenario for the roof collapse of the Irstea Cévennes building. This example of a roof collapse caused by an intense rain-on-snow event that occurred in the Mediterranean area is also used to emphasize a number of questions that need to be addressed in the future; in particular, what improvements can be proposed to minimize the risk of a roof collapse due to snow and rain loading in those areas?
2.1 An exceptional atmospheric situation
At the end of February 2018, France, and more generally Europe, was subject to wintry weather conditions. A disordered polar vortex unleashed a very cold air mass through central Europe around 24–25 February. Driven by a powerful anticyclone localized in Scandinavia and a sustained eastern flux, this cold spell spread over western Europe during the following days, resulting in the most intense cold spell over Europe since February 2012, which is referred to as the “beast from the east”.
Figure 3 presents the outputs of the high-resolution AROME model for different times and lead times. The regional AROME model assimilates various types of observations (radar, ground measurement data, radio, satellite radiances; see Bouttier and Roulet, 2008) and must be interpreted with care. AROME outputs provide interesting information regarding the spatiotemporal dynamics of the meteorological event. Four parameters are represented: temperature at 850 hPa, temperature at 2 m, wind at 10 m, and precipitation amount accumulated in 1 h.
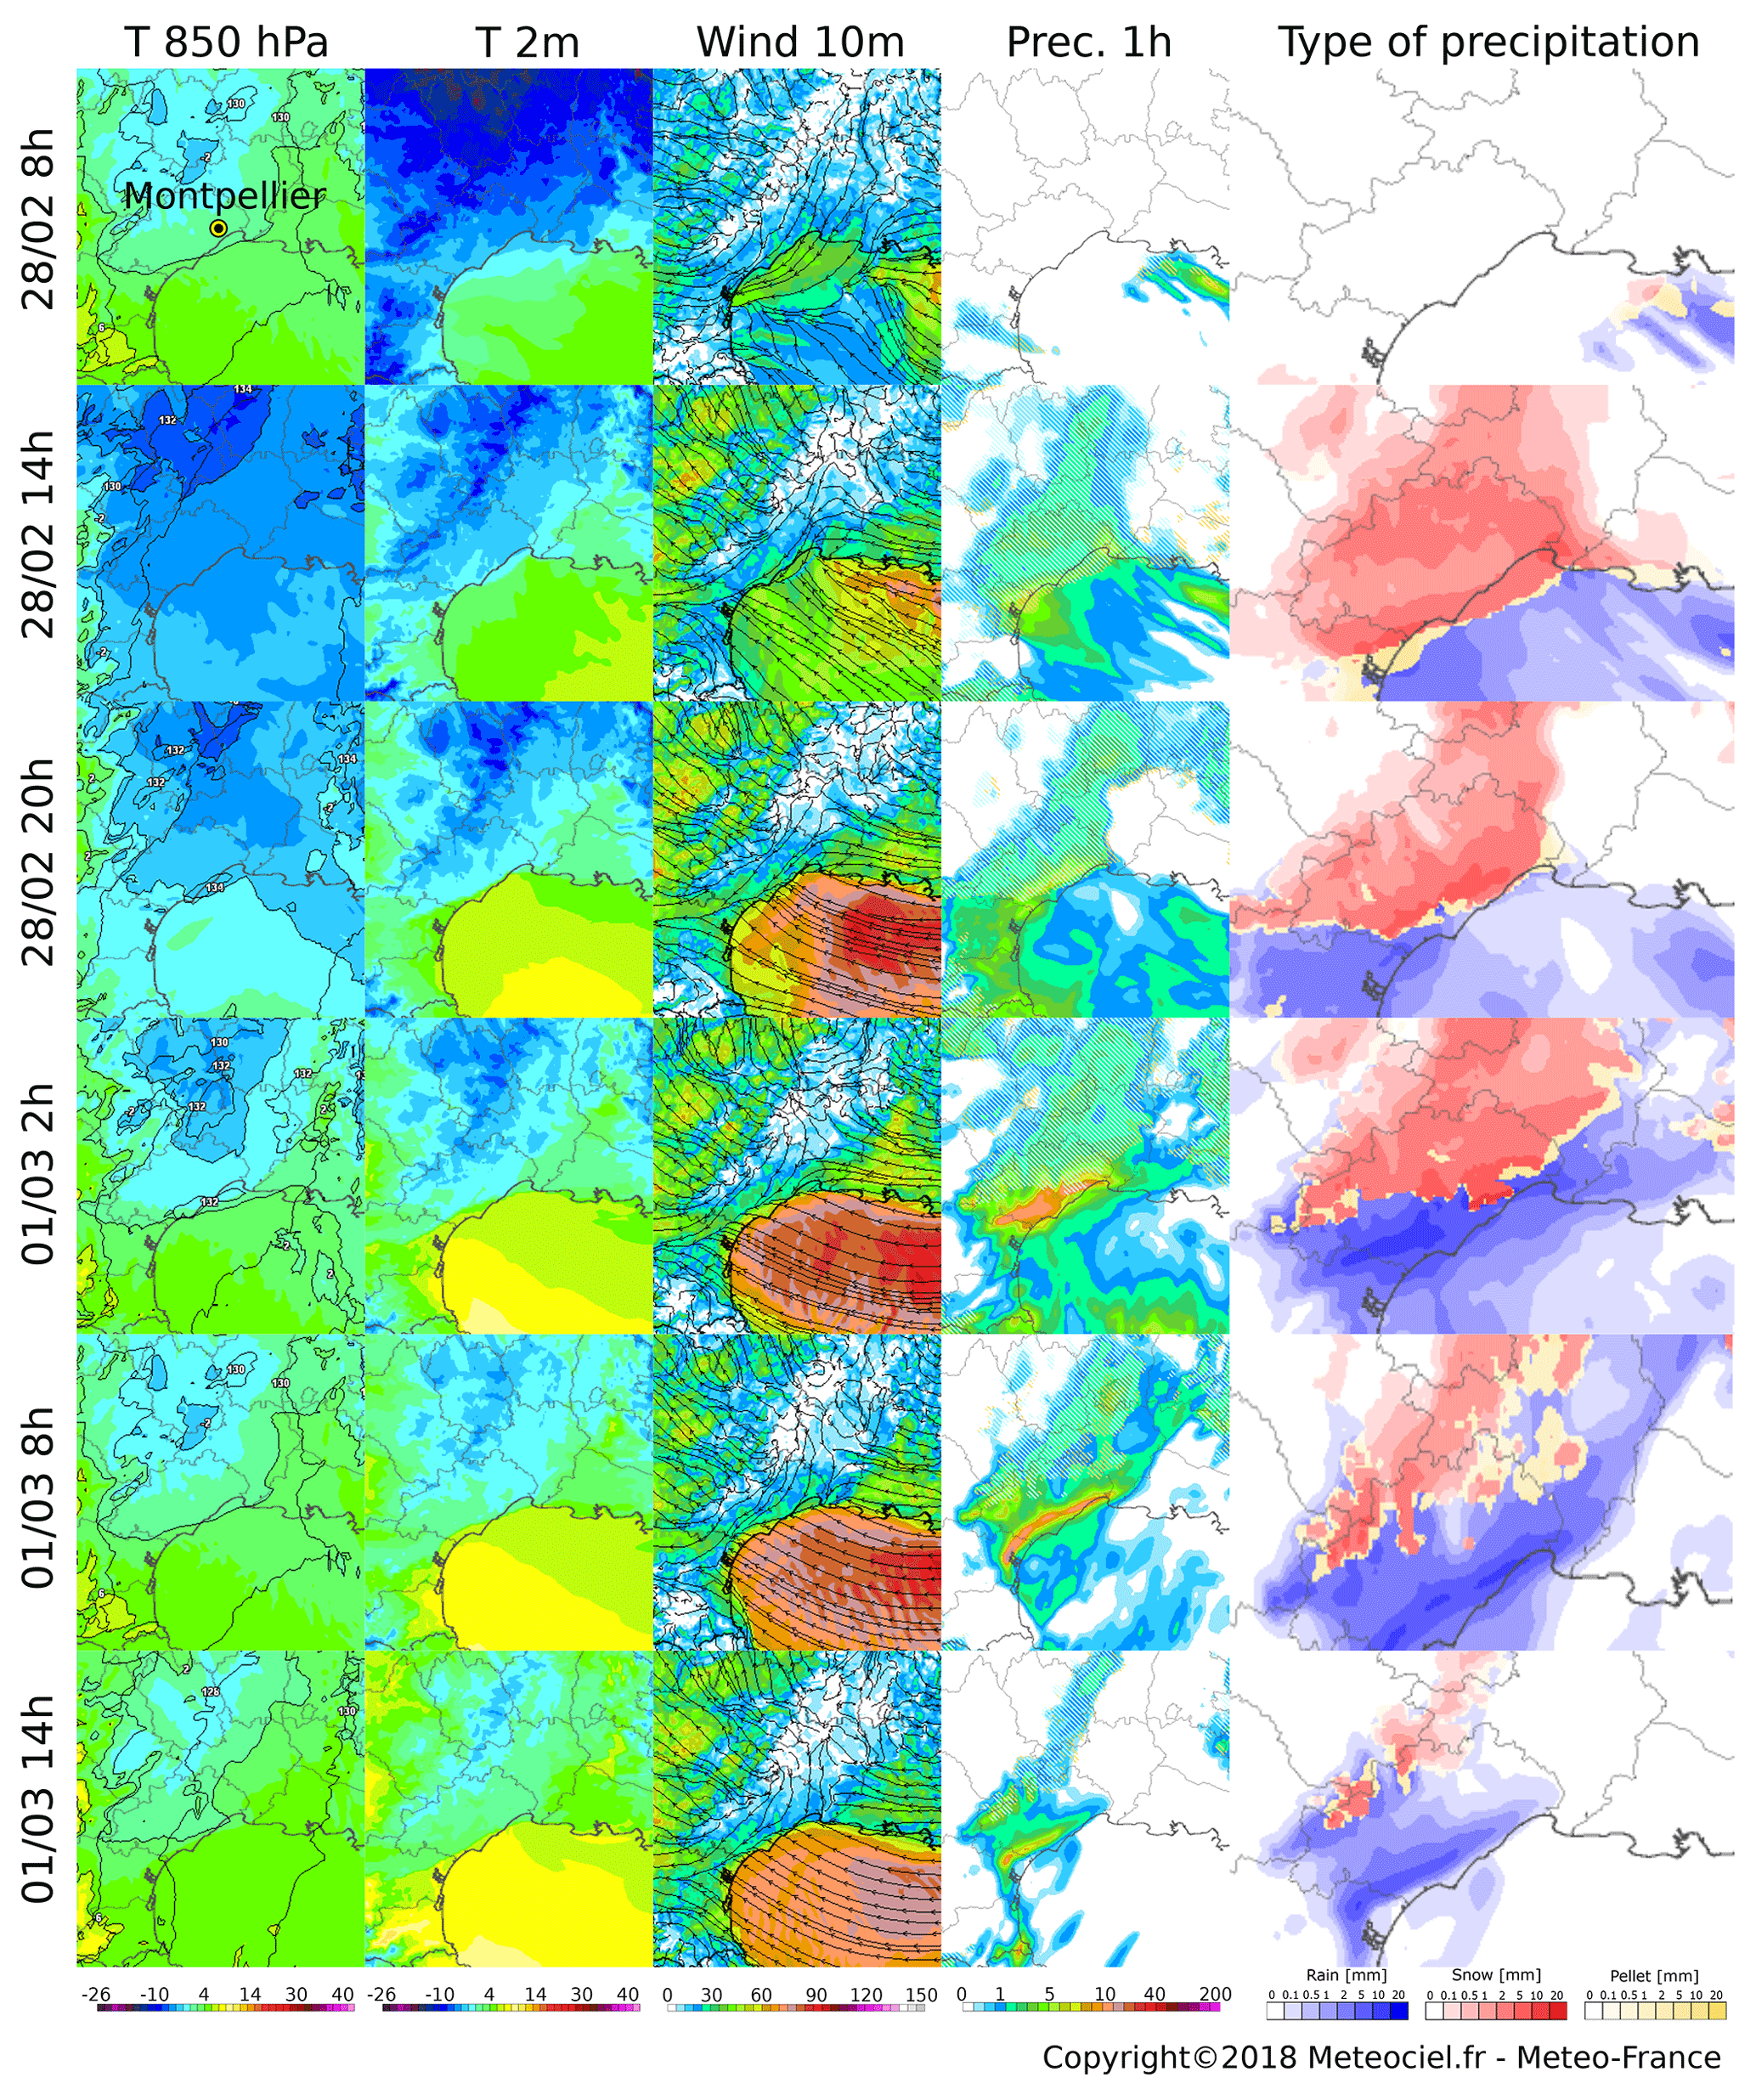
Figure 3Outputs of the high-resolution AROME model for the following parameters: temperature at 850 hPa [∘C], temperature at 2 m [∘C], wind at 10 m [km h−1], precipitation amount accumulated in 1 h [mm] and the corresponding type of precipitation (rain, snow or ice pellet). The maps shown in each row correspond to different runs for a 1 h lead time, from 28 February at 08:00 LT to 1 March at 14:00 LT. Source: Météo-France.
This event can be described as follows:
-
28 February 2018, 08:00 – formation of a convergence zone. On 28 February, at 08:00 LT, just before the beginning of the snow storm, temperatures are very cold over lands in the region, in altitude (−6 ∘C at 850 hPa, corresponding to about 1500 m) and on the ground (between −2 and 6 ∘C at 2 m). We can observe a line of convergence on the sea, with, on the one side, cold air brought from the northeast related to the cold spell and, on the other side, winds from the southeast bringing warm air. This convergence zone will generate vertical fluxes and will create this atmospheric disturbance at the origin of important snow and rain accumulations.
-
28 February 2021, 14:00 – beginning of the snowfall. At 14:00 LT, important precipitation amounts occur around the convergence zone, mainly along the coast but also offshore. At the northwest of this zone (Montpellier, Béziers), despite a slight and progressive increase in temperature at the ground and in altitude, the supply of cold air from the north leads to solid precipitation only.
-
28 February 2018, 20:00 – snow event. Between 20:00 and 02:00 LT, winds from the southeast intensify, and precipitation amounts on Montpellier increase. The AROME model shows a temporary movement of the convergence zone from the plains. Then, a northeast flux with cold air at low altitudes leads to snow again in the surroundings of Montpellier.
-
1 March 2018, 02:00 – warming and rainfall get stronger. During the night between 28 February 2018 and 1 March 2018, warming is rising at high altitudes (from −3 ∘C at 18:00 LT to 0 ∘C at 02:00 LT at 1500 m), and rainfall becomes dominant.
-
1 March 2018, 08:00 – intense rain event. In the morning of 1 March 2018, despite the persistence of the convergence zone and cold ground temperatures, warming in altitude is too important, and precipitation only falls as rain. The collapse took place at around 18:00 LT.
2.2 An intense rain-on-snow event
This rain-on-snow event is atypical in the region of Montpellier considering the accumulated amount of precipitation and the amount of precipitation fallen as snow. Ground measurements indicate that snow depths of more than 25 cm have occurred only five times since the 1950s (35 cm in February 1954, 35 cm during the winter of 1962–1963, 27 cm on 14–16 January 1987, 28 cm on 22 January 1992 and the event described here). The empirical return period of the snow event alone exceeds 10 years (five events in 70 years). What makes the rain-on-snow event particularly unusual is the large amount of rainfall that followed the snow event. Its occurrence can be explained by the following main elements:
-
the presence of very cold air at all altitudes and in particular at the low troposphere
-
the blocking of a strong convergence zone leading to an intense rain-on-snow event
-
the preservation of this convergence zone and cold wind supply from the northeast around Montpellier.
The last column of Fig. 3 presents the evolution of the type of precipitation simulated by the AROME model for a 1 h lead time. AROME clearly simulates an intense snow event from 28 February 2018 at 14:00 LT until the end of the day, followed by a rain-on-snow event during the night. An intense rain event brought large amounts of liquid precipitation during the whole day of 1 March 2018.
2.3 Snow accumulation
Météo Languedoc is an association providing various sources of information about weather forecasts and natural risks in the region around Montpellier. These exceptional data are described in detail on their website (https://www.meteolanguedoc.com/evenements-majeurs-en-languedoc-roussillon/episode-neigeux-du-28-fevrier-2018-jusqu-a-35-cm-pres-de-montpellier/p513, last access: 5 September 2023) and include different types of information about the meteorological event, including photos from amateurs following their Facebook page (https://fr-fr.facebook.com/MeteoLanguedoc/, last access: 5 September 2023). Through their Facebook page, Météo Languedoc asked their 120 000 followers to provide observations and photos supporting these observations. Thanks to the collection of 5000 responses, a robust estimation of the depth of the snowpack at the end of the snow event was obtained, leading to the interpolated field of snow accumulation provided in Fig. 4. The data clearly show that the snow depth was more important north of Montpellier, likely due to a hill separating the city center from the Lavalette site.
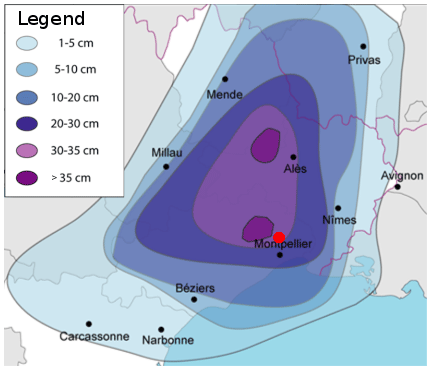
Figure 4Snow accumulation during the snow event of 28 February 2018, based on 5000 testimonies. The red marker shows the position of the collapsed building. Source: Météo Languedoc.
2.4 Estimation of the snow load at the time of the collapse
Figure 5 shows the evolution of the temperature and rain and snow amounts according to two different and independent sources of information:
-
Just next to the center of Irstea in Montpellier, a weather station (the Lavalette station) records various meteorological parameters, including temperature and rain. For this station, the tipping-bucket rain gauge is not heated, and snow probably blocked the rain gauge according to the operator of the station.
-
SAFRAN reanalysis (Vidal et al., 2010) provides weather parameters at a resolution of 8 km over France, using a dense gauge network. However, this network does not include the station at Lavalette.
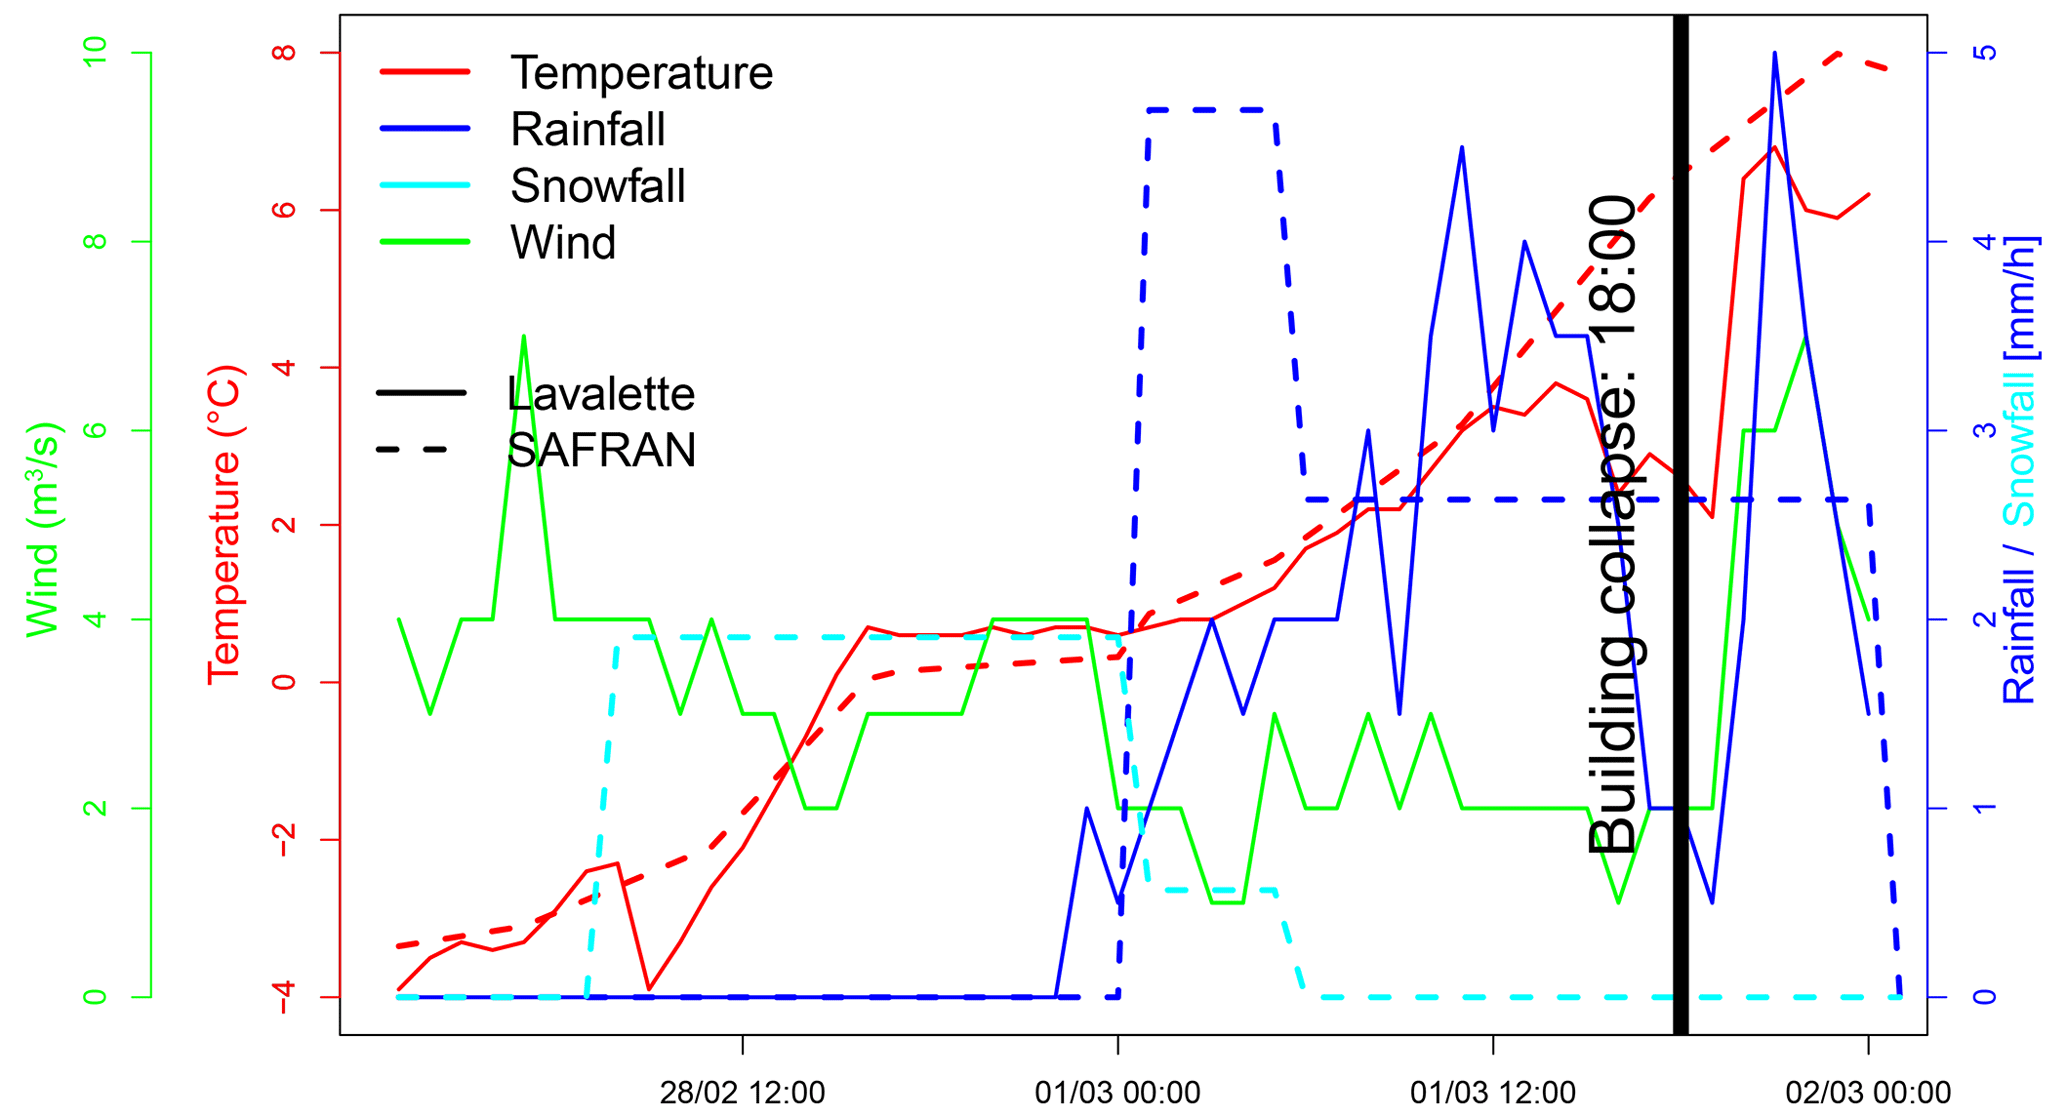
Figure 5Weather observations at the station of Lavalette (solid lines) and SAFRAN reanalysis at the grid point covering the Irstea building (dashed lines).
Both sources of information clearly show the increase in temperature from the morning of 28 February 2018 until the building collapse. SAFRAN reanalysis records an accumulation of snow water equivalent of 35 mm followed by 58 mm of rainfall before the collapse, with a rain–snow transition during the night between 28 February and 1 March. The rain gauge, which might have underestimated the rainfall accumulation due to the presence of snow in the receptacle, records 45 mm.
The different sources of information (outputs from the AROME model, social network testimonies, weather data) on the snow and rain event lead to the following scenario. It can be considered with little uncertainty that the snow depth in the area was between 30 and 35 cm, on cold ground. Since the Irstea building was located right next to the 30 cm curve (see Fig. 4), 30 cm is considered the best estimate, but there is uncertainty around this estimate.
The snow had a density of about 250 kg m−3 before the rain event, based on the fact that most of the Facebook testimonies reported a heavy snow type, which is typical of a Mediterranean area. As indicated above, the snowfall was followed by 50 to 60 mm of rainfall. Colbeck (1977) indicates that rain can contribute up to 50 % of the roof load for flat roofs with 10 m parallel flow to gutters, which corresponds closely to the specifications of the Irstea Cévennes building. Figure S5 shows the roof drainage system of the Irstea Cévennes building. The roof had a slight slope of 1 % on each side of a peak line oriented north–south, which allows rainwater to flow towards the east or west of the building and drain through 20 cm high outlets located at the base of the low walls on the roof edges. There were four outlets at the ends of the northern and southern edges, one in the middle of the western edge and two at the quarter and three-quarter points of the eastern edge, as indicated by the red arrows in Fig. 6a. In our case, it is likely that this drainage system was inefficient due to the combination of both (i) a small roof slope and (ii) large distances between the outlets (13 m in the north–south direction and 40 m in the east–west direction). Colbeck (1977) indicates that “Snow covered roof … would certainly collapse if a rainstorm were of sufficient duration to allow complete wetting of the unsaturated layer and full development of the saturated layer”. Here, 18 h of continuous rainfall with an average intensity of around 3 mm h−1 certainly contributed to the saturation of the snow layer. As we are not able to assess the quantity of water that could reach the outlets at the time of the collapse (which also depends on the structure deformation due to the snow load, as discussed below), it is assumed in the present analysis that the total load corresponds to the addition of the snow load and the rain load. We also assume that the initial snow load (before the rain) on the roof is equal to the snow load on the ground for several reasons. Firstly, the roof slope was low, and there was a small wall around the edges of the roof. Secondly, the wind was not significant enough to modify the snow distribution on the roof. Finally, the observed temperatures suggest that there was no snowmelt during the snowfall event.
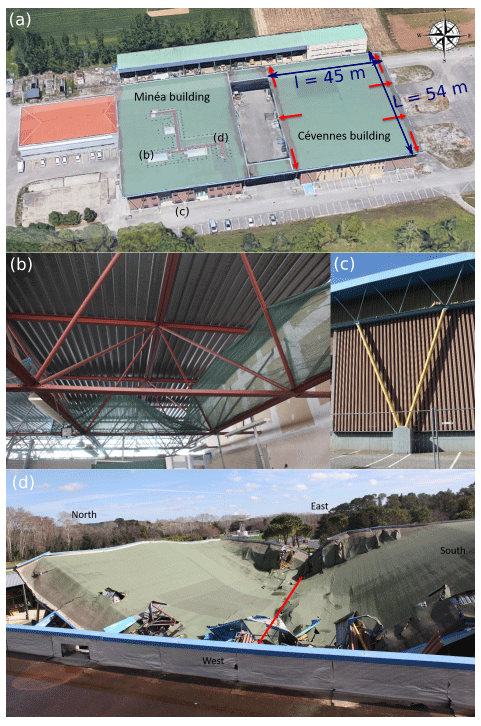
Figure 6(a) Overview of the Irstea Cévennes building before the damage, with rainwater drainage points indicated by the red arrows. The dimensions of the roof are given in blue, and the height of the building is 10 m. The letters indicate where the photos of the other subplots were taken (photo credit: © Google Earth 2014, adapted by Isabelle Ousset). (b and c) View of the supporting structure of the Irstea Cévennes building before its damage: (b) red-colored metal roof frame and (c) supporting tubular pylons (in yellow) along the facades. (d) Overview of the damaged Irstea Cévennes building. The red line indicates the direction perpendicular to the direction of the main deflection of the roof after the collapse.
In the remainder of this study, we thus assume that at the time of the collapse, which occurred on 1 March at around 18:00 LT, the snow and rain load is the outcome of 30 cm of initial snow with a density of 250 kg m−3 (which corresponds to a load of about 736 N m−2) and 50 to 60 mm of rainfall (i.e., an additional load of 490–589 N m−2). This results in a snow and rain load of about 1226 to 1325 N m−2.
3.1 Initial state of the building (before collapse)
The Cévennes building was an experimental hall built in 1982 in the Lavalette domain in Montpellier, in the southeast of France. At the time of its failure, it housed a wind tunnel and a mezzanine level built in 2014 along the northern facade and offices on two floors along the southern facade. Figure 6 gives an overview of the Cévennes building before and after the damage. The dimensions of the roof were l=45 m in the east–west direction, L=54 m in the north–south direction and a height of 10 m.
The supporting structure of the building consisted of three-dimensional vertical metal trusses designed to support the flat roof (see sketches in Fig. S1), which in turn were supported by metal tubular pylons that were arranged along the facades of the building. The lattice structure, consisting of welded or bolted elements, extends over the entire roof area and resists all forces acting on it. For the southern, western and northern facades of the building, the tubular pylons consisted of two round tubular profiles arranged in a V shape and sealed on concrete blocks anchored to the ground (see photograph in Fig. 6c, sketches in Fig. S1a and b, and the geometric properties of the structure in Table S1 in the Supplement). For the eastern facade of the building, the tubular pylons consisted of rectangular tubular profiles and a Saint Andrew's cross obtained with T profiles (Fig. S1c). It should be noted that no such tubular pylons were placed inside the building in order to allow the movement of large vehicles, such as agricultural tractors.
The initial state of the building before the event is known with some uncertainty. In particular, past damage may have already occurred before the 2018 event and may have altered the initial integrity of the structure. For example, although the building studied is not located in an area with intense snow events, it has had to support heavy loads on (at least) three occasions since its construction:
-
around 27 cm on 14–16 January 1987
-
around 28 cm on 22 January 1992
-
less than 10 cm on 7 March 2010.
It is important to note that the snow event of 22 January 1992 was probably followed by rain, for which SAFRAN records provide a cumulative amount of 8 mm of rain approximately 36 h after the snowfall. To the best of our knowledge, no survey of the structure of the Cévennes and Minéa buildings was carried out between the date of their construction and the 2018 incident. Following this event, only a technical opinion on the strength of the adjacent Minéa building was requested. This report concluded that the overall strength of the structure was satisfactory but identified a number of points requiring vigilance:
-
significant stagnation of rainwater on the roof;
-
slight buckling (within manufacturing tolerance) and traces of corrosion on some profiles (angles and tubular profiles) at the level of the roof metal frame;
-
buckling of one of the profiles of a Saint Andrew's cross;
-
V columns in satisfactory condition, with slight corrosion on the head and anchor plate;
-
presence of cracks (on several blocks) and spalling, revealing the reinforcement (on one block) on the basal concrete blocks for anchoring the V columns.
Given the limited information available on previous events and any damage that may have resulted from temporary loads applied to the structure in the past, this study has not taken into account any such deterioration of the structure.
Finally, it should be noted that no changes were made to the supporting structure from the time of its construction to the time of its collapse. The only changes made were to the interior (ground-supported mezzanines) in 2014.
3.2 Distribution of the snow and rain loads on the roof
We have little information about the depth and spatial distribution of the initial snow on the roof. As the entire site was evacuated in the early afternoon of 1 March, only the caretaker was present at the time of the building collapse, but he did not observe how the snow was distributed on the roof. Given that the wind velocity on both days was only between 1 and 4 m s−1, it is unlikely that the wind could have affected the distribution of snow on the roof. However, the distribution of the snow and rain load may have varied over time due to a complex interaction between the overall structure and the dynamics of the snow cover, which gradually became wet. It seems likely that the distribution of the initial snow load (before rainfall) was nearly uniform due to the low slope of the roof combined with the light wind during the snowfall. As indicated in Sect. 2.4, it is assumed that the rainwater remained on the roof until the complete collapse of the building. In order to try to gain some insight into different scenarios of spatial load distribution, three different (virtual) cases are studied, as shown in Fig. 7a:
- a.
Uniform distribution. This is the reference case where the load distribution due to snow and rain is uniformly distributed.
- b.
Non-uniform distribution with greater water depth at the edges. Water flowed rapidly towards the edges of the roof (assuming that the slope angle was sufficient).
- c.
Non-uniform distribution with greater water depth in the center. Water mainly accumulated in the center of the roof.
For the two non-uniform distributions, we considered a snow load distribution that was initially uniform before rain came into play, as in the first case.
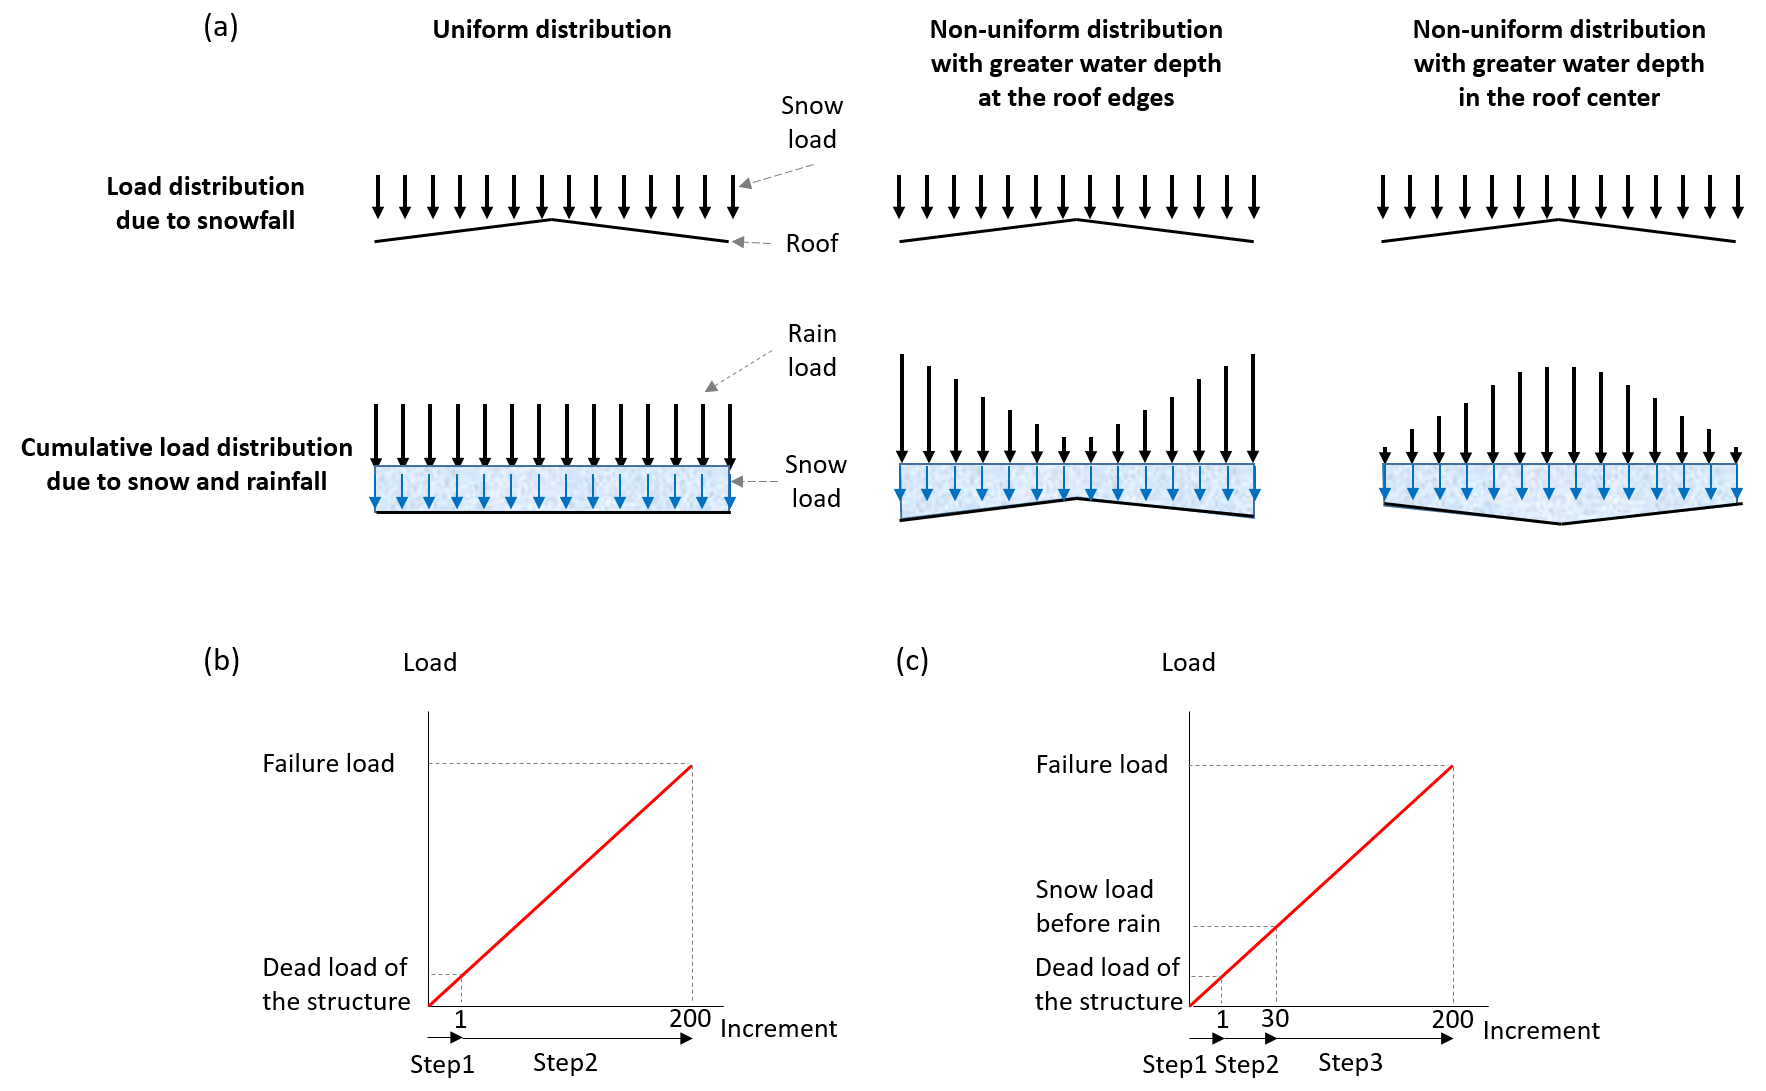
Figure 7(a) Different assumptions made for the spatial distribution of snow and rain loads and (b and c) load evolution by incrementation for pushover analyses in the cases of a uniform distribution (b) and a non-uniform distribution (c) of rain loads. Note that the increment numbers of steps 2 and 3 are given here as examples only.
3.3 Finite-element simulations
In order to investigate in detail the mechanical response of the Irstea Cévennes building and thus better understand its collapse under the snow and rain load, the metal supporting structure was modeled using different Abaqus finite-element (FE) models (Dassault Systemes, 2017; see Sect. S2 in the Supplement for additional details). Two types of analyses are performed:
-
The pushover analysis provides load values associated with different types of failure criteria, which can be interpreted as critical impacts on the structure with different levels of severity.
-
The buckling analysis indicates which specific elements of the structure were the most likely to be at the origin of the roof collapse.
Pushover analyses are quasi-static analyses (without dynamic effects) that determine how far the building can go before it collapses completely or partially. Figure 7 illustrates the main steps of this analysis. The first step (step 1 in Fig. 7b and c) takes into account the self-weight of the structure. Then the snow and rain pressure on the structure is gradually and linearly incremented to mimic the load increase during the rain-on-snow event until the structure fails by reaching either the elastic limit of the material or the ultimate limit of the material for a snow and rain pressure equal to the failure force. This linear increase is performed in one step for uniform loads (step 2 in Fig. 7b) and two steps for non-uniform loads (steps 2 and 3 in Fig. 7c). In the latter case, step 2 corresponds to the increase in the uniform load of snow before the rain, whereas step 3 corresponds to the increase in the non-uniform load of water on the snowpack.
Secondly, a non-linear buckling analysis is carried out in two steps:
-
A linear or eigenvalue buckling analysis is performed to obtain the theoretical load values at which buckling of the structure, idealized as elastic, occurs with different buckling mode shapes (so-called eigenvalue modes), as shown in Fig. 8. This analysis is carried out by using the subspace iteration method (a simple method for approximating the eigenvalues of matrices) after a static step that takes into account the self-weight of the structure.
-
A non-linear buckling analysis is performed by using the incremental static Riks procedure of Abaqus, integrating material non-linearities and geometric imperfections corresponding to the displacement results of the linear buckling analysis, in order to estimate the most realistic critical buckling bifurcation pressure. Only the first mode shape is considered to define the geometric imperfections. The corresponding displacements are multiplied by an argument equal to 1 % of the thickness of the crossbar, i.e., 0.5 mm, which corresponds to the manufacturing tolerance of a round tubular profile with an external diameter of less than 75 mm.
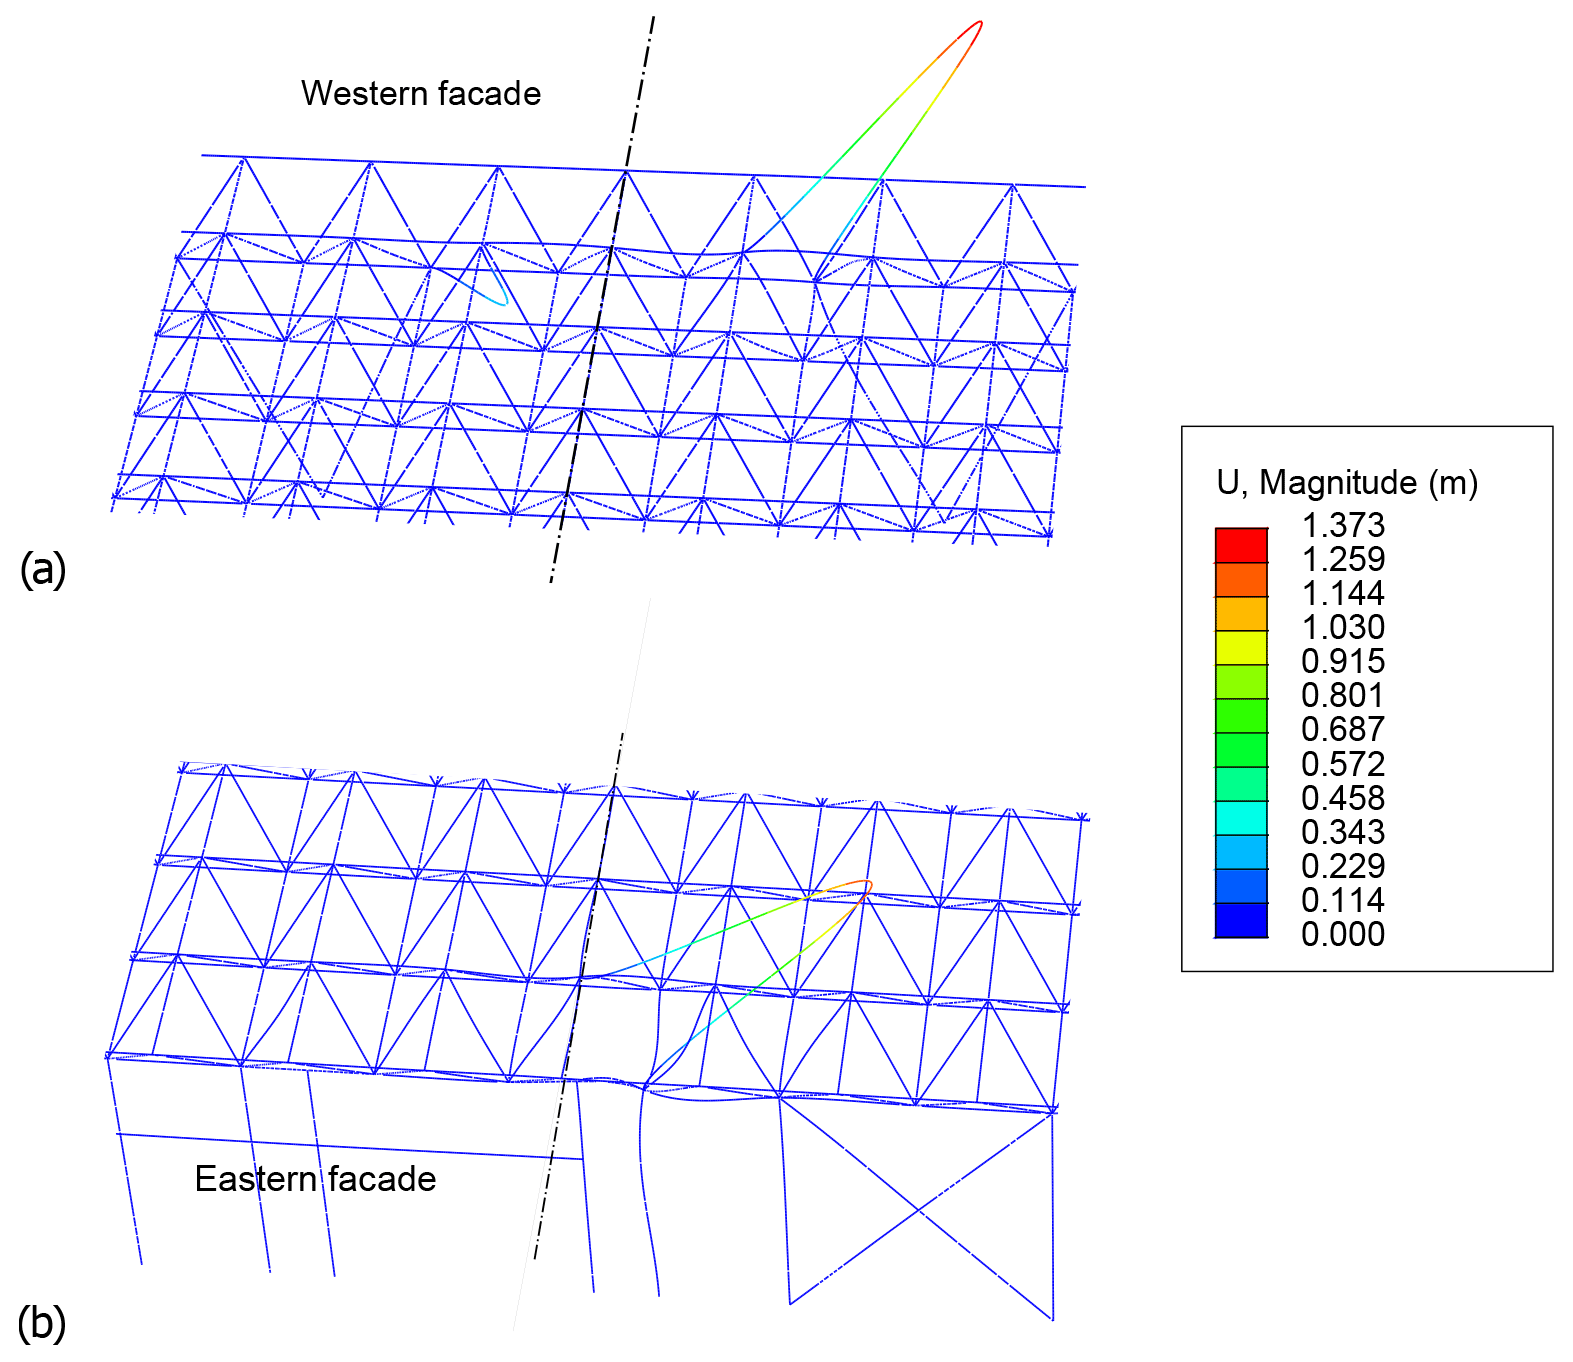
Figure 8Buckling mode shapes of the structure under a uniform snow and rain pressure field (deformation scale factor = 5.4): (a) first mode, above the western facade, and (b) fifth mode, above the eastern facade.
These numerical tests do not describe the full (dynamic) collapse of the roof but are intended to identify the critical loads at which significant deformation and damage could start to occur before the collapse, considering different failure criteria (FC):
-
FCBD is the deflection threshold equal to 0.225 m, which corresponds to the acceptable beam deflection (vertical displacement that can be observed at the center of the roof) equal to of the width of the building l=45 m.
-
FCHD is the horizontal displacement threshold at the top of the columns equal to m.
-
FCy is the critical stress state with an accumulation of stresses equal to the yield strength of steel in a given location of the FE model. This so-called elastic limit indicates the limit of the elastic behavior of the structure, i.e., the beginning of irreversible deformations.
-
FCu is the critical stress state with an accumulation of stresses equal to the ultimate strength of steel. This so-called ultimate limit of the material corresponds to the maximum load that the structure can withstand before a local material rupture.
-
FCLB is the first eigenvalue buckling load assessed by the linear buckling analysis.
-
FCNLB is the non-linear buckling load corresponding to the bifurcation buckling load that causes the actual buckling, taking into account the geometric imperfections.
The first two failure criteria deal with global damage to the structure and are part of the serviceability limit states (SLSs). The other failure criteria correspond to ultimate limit states (ULSs). These criteria indicate the onset of deterioration that could potentially have a significant impact on the structure and ultimately lead to its collapse.
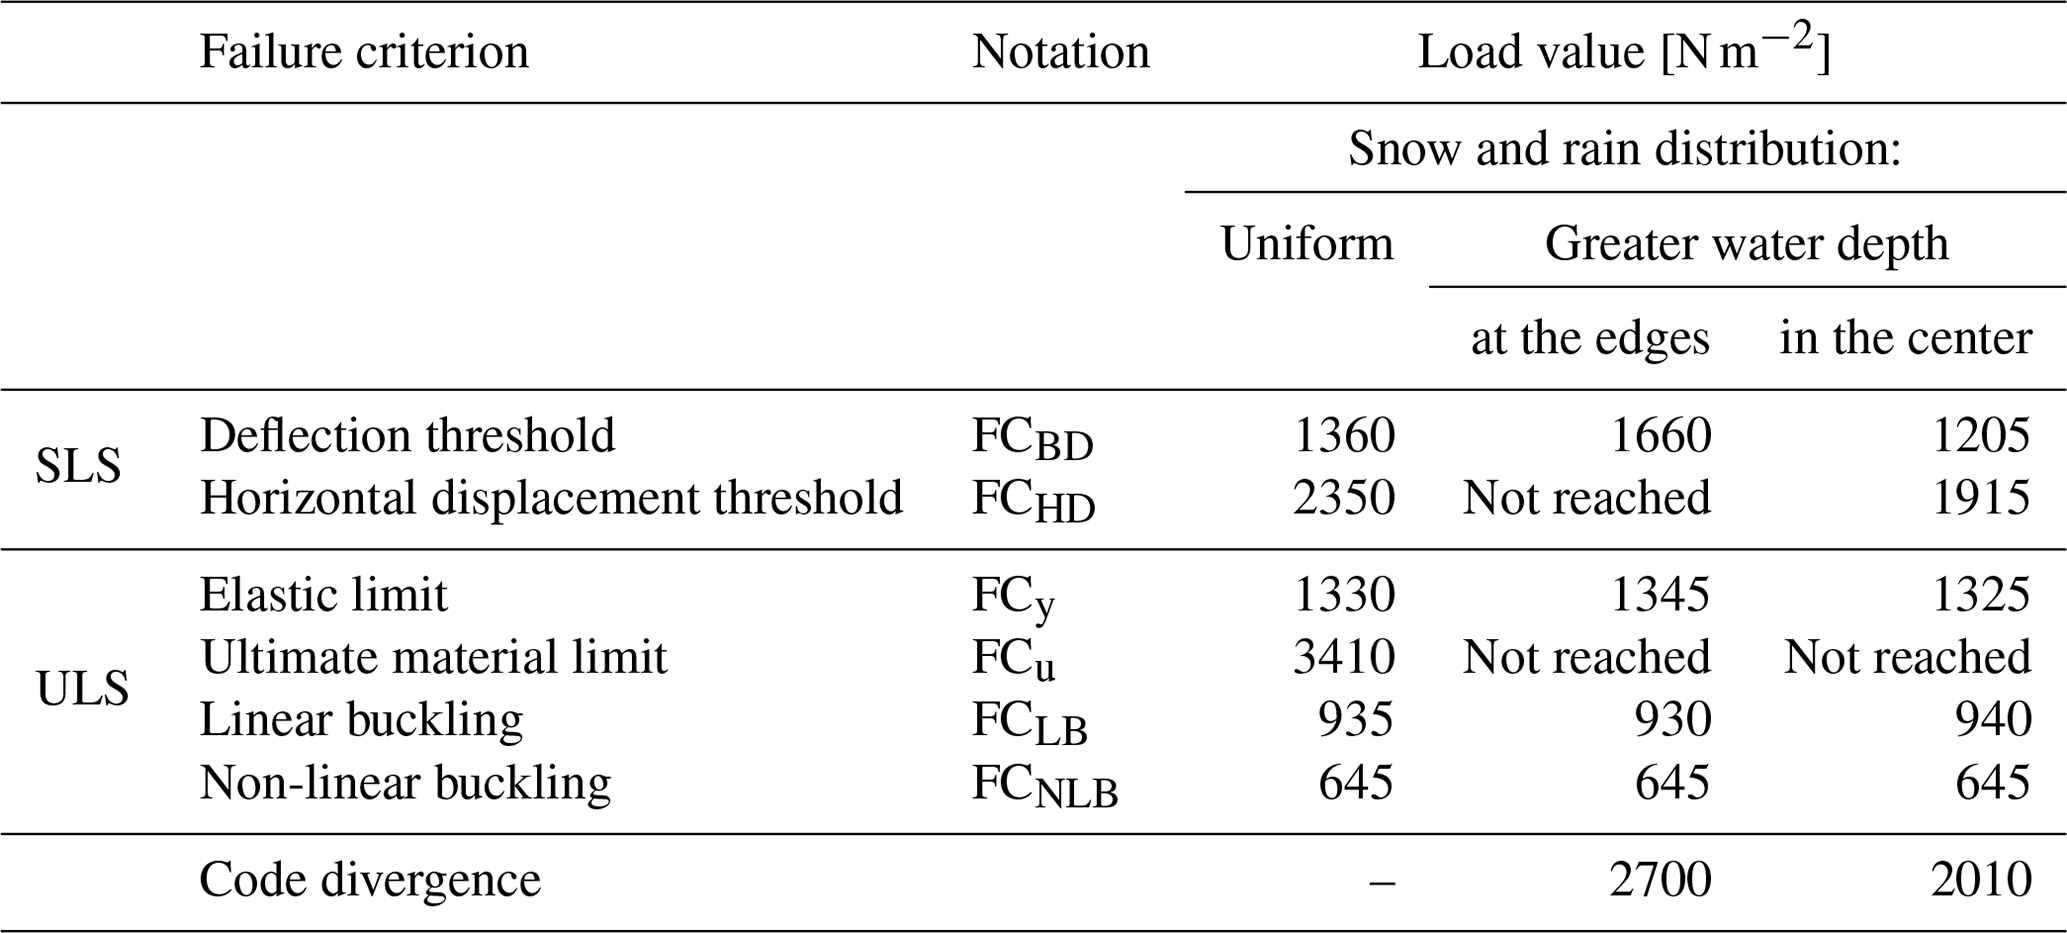
Table 1 summarizes the different critical load values obtained from the FE simulations that lead to the failure of the structure, considering the different criteria mentioned above, under the three different assumptions of snow and rain load distribution. The values obtained for these critical loads vary over a wide range from 645 to 3410 N m−2 depending on the failure criterion and the distribution of the pressure field. Section 4 further discusses these different critical loads and compares them with the estimated snow and rain load of about 1226 to 1325 N m−2 provided in Sect. 2.
Table 1Load values leading to the failure of the supporting structure calculated from the FE simulations according to different failure criteria (see text for details) and a consideration of three scenarios for the distribution of the snow and rain load: uniform distribution (snow and rain), non-uniform distribution with greater water depth at the edges after uniform snowfall and non-uniform distribution with greater water depth in the center after uniform snowfall. The last row of the table indicates the loads at which code divergence was observed (when the considered failure criterion was not reached).
The FE simulations allow us to gain further insight into the detailed behavior of the structure. Figure 9 shows the stress fields of the structure obtained from the pushover simulations and corresponding to the three types of distributions for a snow and rain load of 1325 N m−2. In the three cases, the maximum stresses occur on the crossbars located at the perimeter of the roof (above the western and eastern facades in the first two cases and above the four facades in the last case) and, in the cases of uniform distribution and non-uniform distribution with greater water depth in the center, on the bottom horizontal T profiles located in the central part of the roof. Stresses (slightly) above the yield strength of the material occur only on two crossbars located above the eastern facades and are prone to buckling.
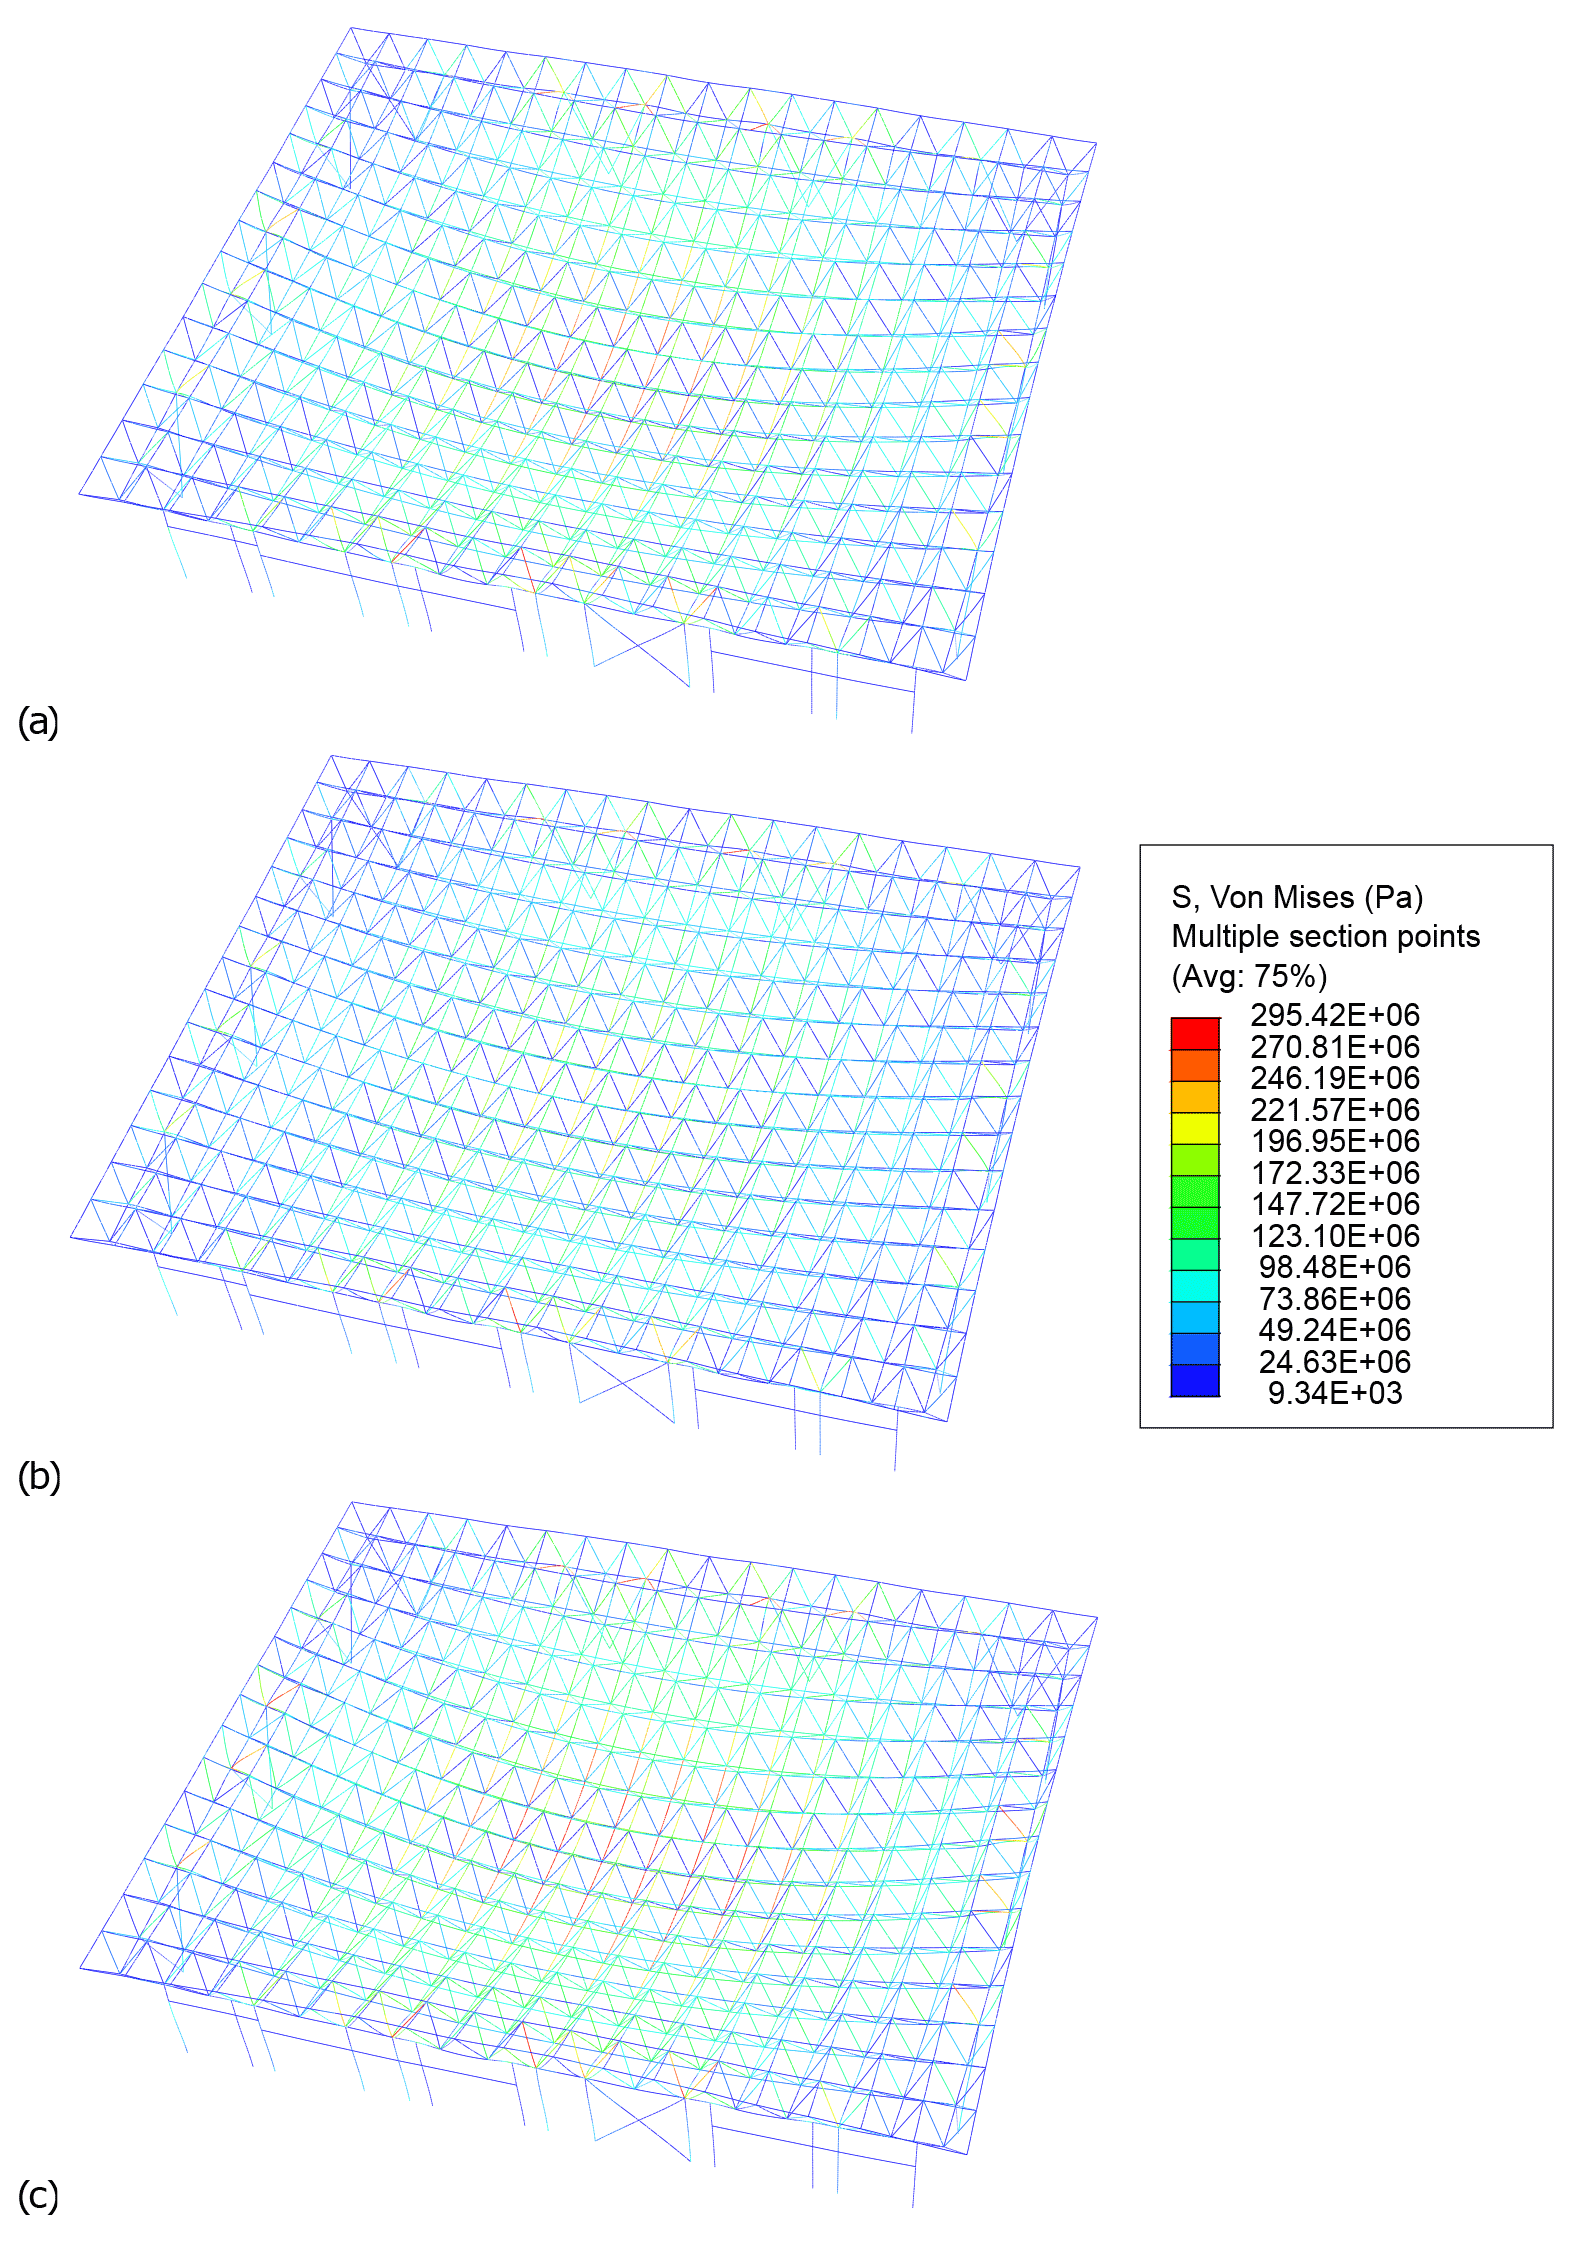
Figure 9Von Mises stress field (Pa) inside the structure at the real snow and rain load of 1325 N m−2, given by the FE model simulation for the different assumptions made for the spatial distribution of snow and rain: (a) uniform, (b) non-uniform with greater water depth at the edges and (c) non-uniform with greater water depth in the center (a deformation scale factor of 25 is applied to highlight the contrasts).
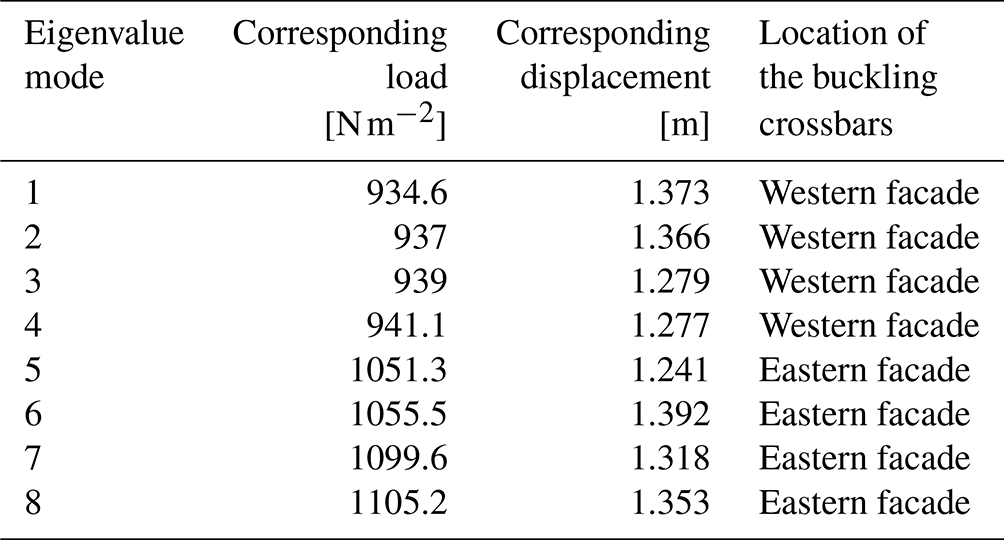
The results of the linear buckling analysis for a uniform snow and rain pressure field are summarized in Table 2 and Fig. 8. The analysis shows that buckling occurs locally. For each of the first eight eigenvalue modes considered, only one or two crossbar(s) located at the western or eastern perimeter of the roof and on either side of the east–west axis of the structure buckle with a shape similar to that of the first and fifth modes shown in Fig. 8. Table 2 provides information on the buckling load, displacement and location of crossbars prone to buckling for each eigenvalue mode. The information shows that buckling occurs first at the crossbars above the western facade and then above the eastern facade. Similar results (not shown) are obtained for the other two cases of non-uniform snow and rain pressure distributions with greater water depth either at the edges or in the center of the roof.
Table 2Results of the eigenvalue buckling analysis of the structure (linear buckling) under a uniform snow and rain pressure field.
These results clearly indicate that the failure was due to both buckling of the crossbars (primary cause) and bending of the bottom horizontal T profiles (aggravating effect). Other damage, such as that observed on the round tubular columns shown in Fig. S3c and d, probably occurred during the collapse of the structure. No such damage was observed on the nearby building, whereas slight buckling was observed on its roof. This subsequent damage was further modified by the presence of the offices and mezzanine walls along the northern and southern facades (see Fig. S3e).
This section aims to further link the results from the snow and rain hazard (Sect. 2) and FE simulations that include pushover tests and a buckling analysis (Sect. 3) to identify the most probable factors that led to the collapse of the Irstea Cévennes building.
4.1 Building collapse analysis of the rain-on-snow event of February 2018
Figure 10 compares the critical loads that would cause a failure according to the FE simulations (Table 1) with the initial snow load of 736 N m−2 before the rain and the final snow and rain load values of 1226 to 1325 N m−2 estimated from different sources of observations in Sect. 2.
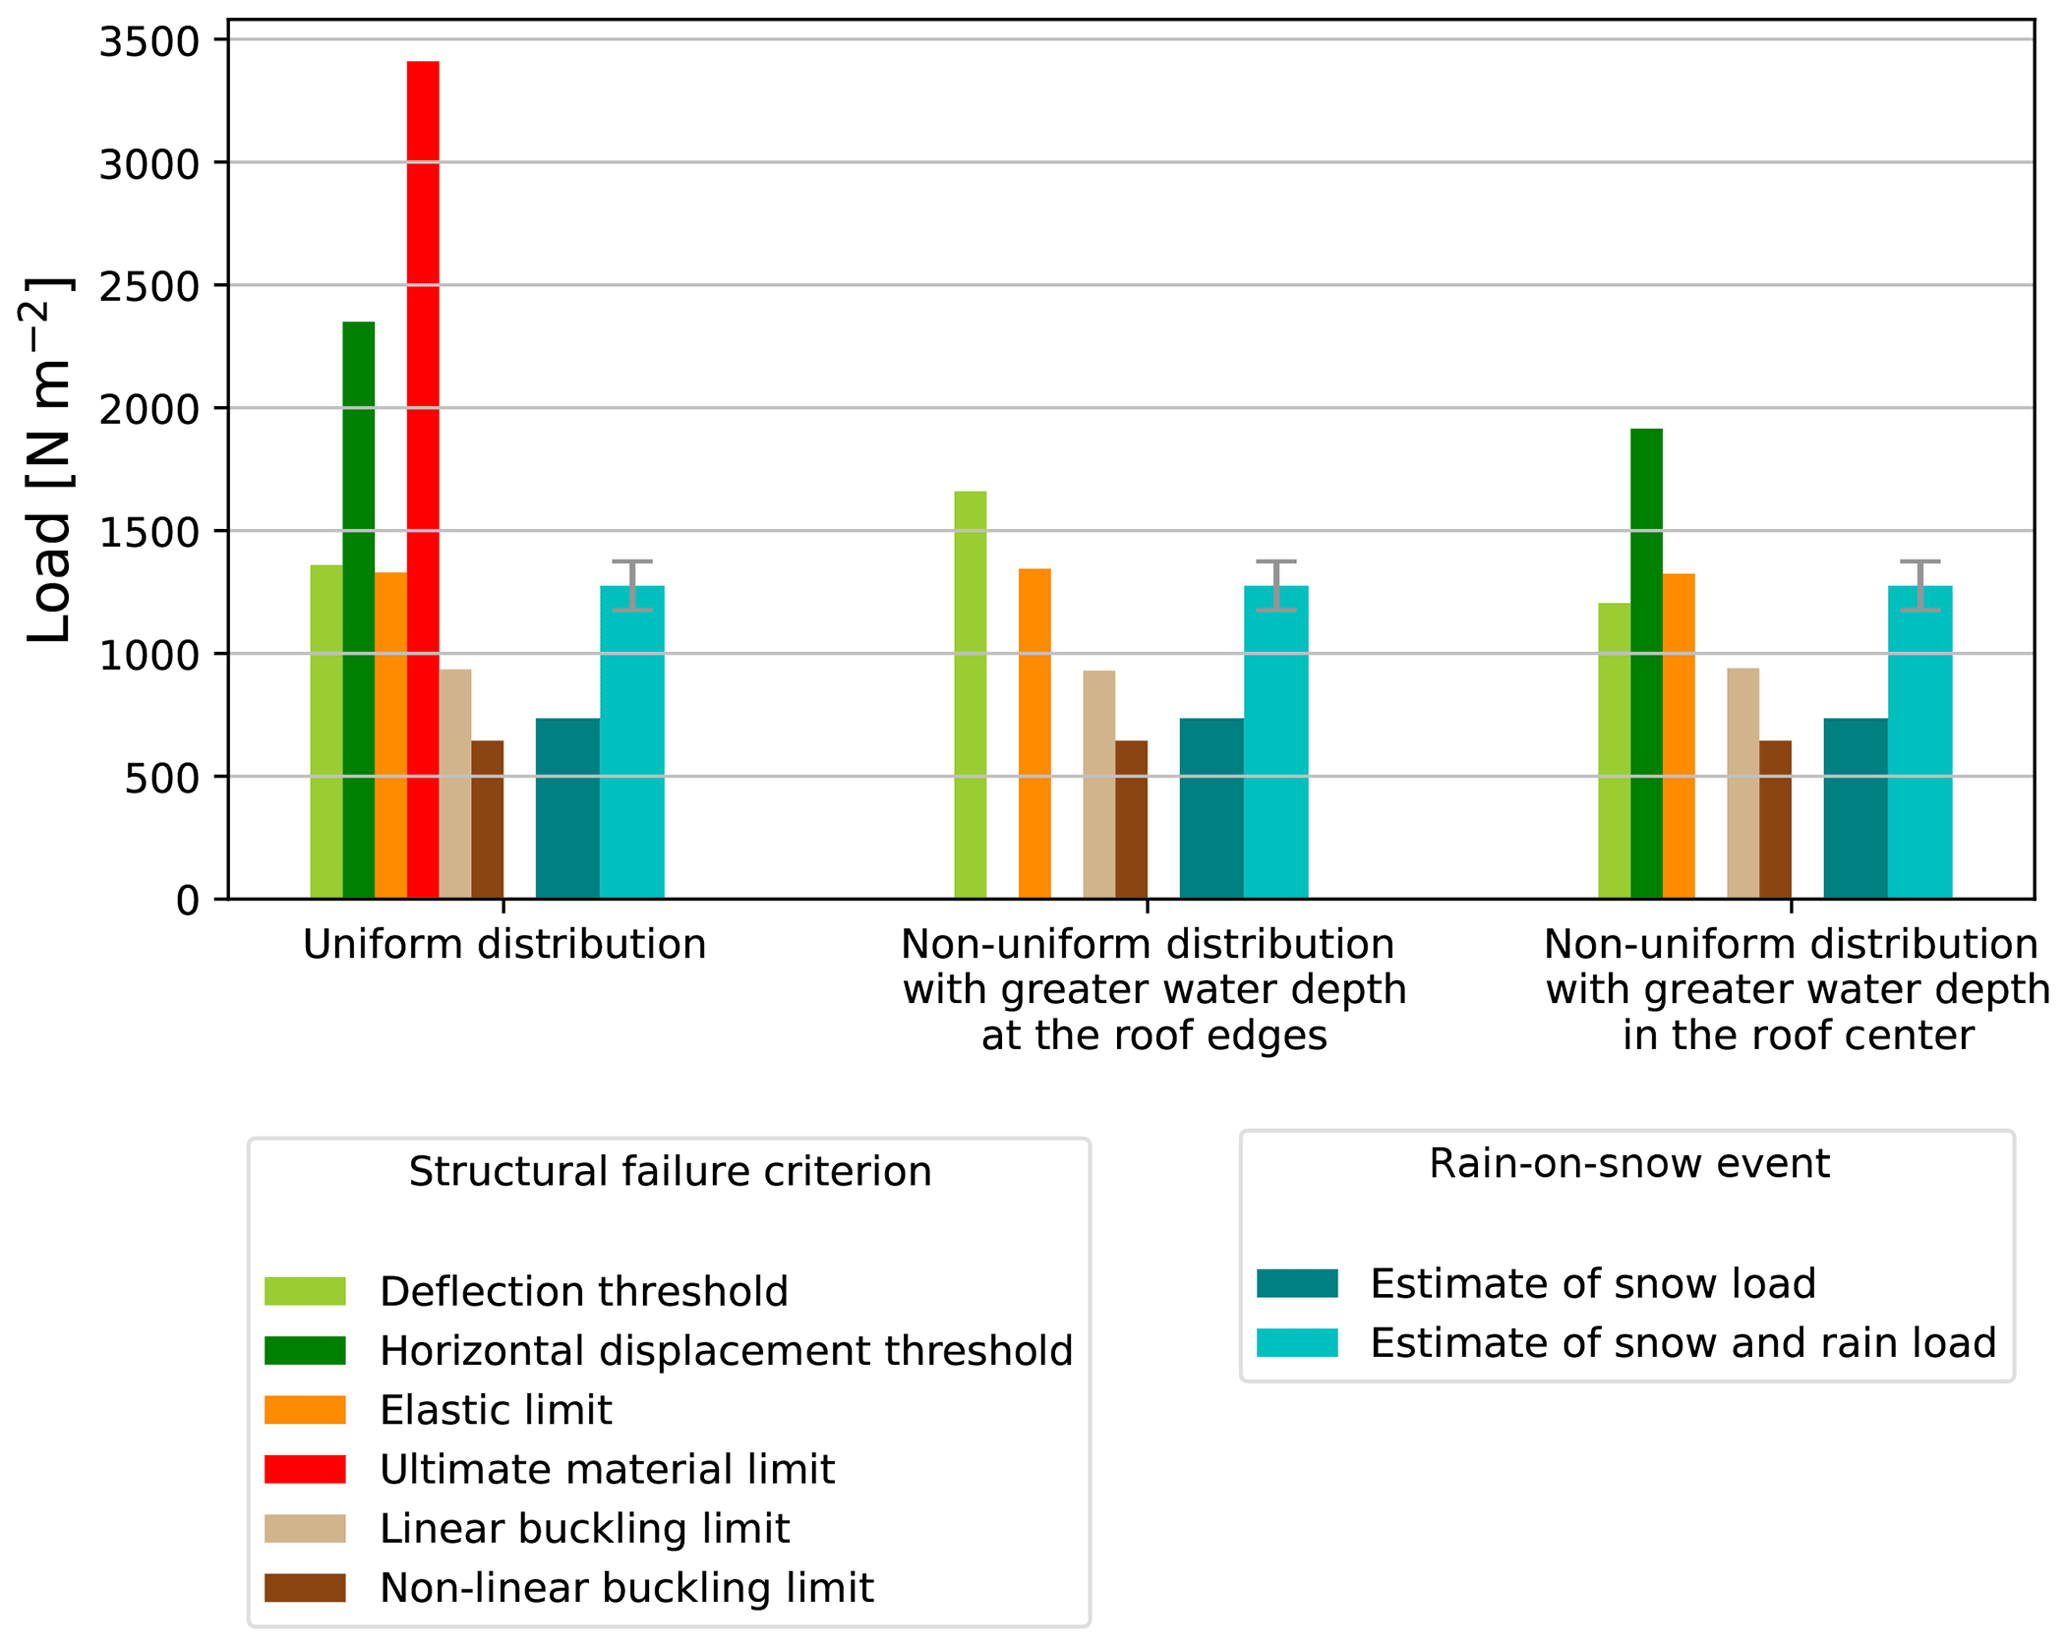
Figure 10Comparison of the snow loads leading to different failure criteria of the Cévennes building, as calculated by FE model simulations, with the estimated scenario for the rain-on-snow event of 2018, as back analyzed in Sect. 2, in the different cases of snow and rain pressure fields. The structure fails when the observed snow and rain load (on the right, for each assumption of snow and rain distribution) is greater than the calculated failure load (on the left). The latter calculated failure load could not be obtained when code divergence was observed, thus explaining the empty bars in the case of non-uniform rain distributions (see Table 1).
The maximum critical load of 3410 N m−2 (in red in Fig. 10) corresponds to the ultimate limit of the material under uniform pressure distribution and is well above the estimated value for the snow and rain load of 1226–1325 N m−2 (in cyan). Note that for non-uniform snow pressure fields, the ultimate material limit is not reached due to numerical instabilities (lack of convergence). The values obtained from the horizontal displacement criterion are also well above the estimated range of 1226–1325 N m−2. The pushover FE simulations thus suggest that neither the ultimate material limit nor the critical horizontal displacement was reached at the time just before the collapse, regardless of the scenario for rain load spatial distribution.
The minimum of 645 N m−2 (in brown) corresponds to the non-linear buckling load. This value is just below the uniform initial snow load before the rain (736 N m−2) (in teal) and does not depend on the assumption made for the distribution of the rain load. In contrast, the linear buckling analysis gives higher values for the load corresponding to the first eigenvalue mode (from 935 to 945 N m−2). All of these critical buckling loads (in beige) are well below the snow and rain load estimates. This means that this failure could have occurred with the observed snow and rain load. In addition, although it should be noted that the buckling failures remained localized (on a few crossbars located at the eastern and western edges, as shown in Sect. 3 and Fig. 8), they occur on both sides of the east–west axis along which the structure collapsed, as shown in Fig. 6d. Thus, it is very likely that buckling was involved at some stage in the roof collapse.
For a uniform load distribution, the other failure criteria (the elastic limit and the beam deflection) give intermediate values in the range 1330–1360 N m−2, just above the snow and rain load estimates. For the scenario with greater water depth at the edges, the critical load values increase, particularly for the beam deflection criterion, which puts the structure on the safe side. For the scenario with water flowing towards the center of the roof, both critical load values (elastic limit, beam deflection) decrease close to or below the snow and rain load estimates.
In summary, the FE simulations indicate different situations where the critical load values were below (or very close to) the snow and rain load estimates and thus could lead to critical damage and failure of the structure during the 2018 snow and rain event. According to the linear and non-linear buckling analysis, buckling has likely been critical regardless of the scenario for the distribution of the snow and rain load, indicating a weakness in the structure. In addition, based on the elastic limit criterion and the beam deflection criterion, the load concentration in the center of the roof (most likely due to water accumulation in the center of the roof) has probably been an aggravating factor at some stage. However, it must be pointed out that the order and the interactions between these different mechanical responses (buckling, beam deflection) are not taken into account by the FE simulations.
4.2 Structural back analysis
In Sect. S3, we discuss in detail the regulations on snow action on structures: those enforced at the time of the construction of the Irstea Cévennes building and those enforced at the time of the building collapse. By comparing the regulations with the FE Abaqus calculations in terms of the load applied to the structure, we show that the Irstea Cévennes building was certainly built correctly according to the previous French regulations (of 1965), if we do not take into account the results of the non-linear buckling analysis, since the consideration of imperfections in the design of metal structures was introduced in the regulations after the construction of this building (in 1983). It can also be concluded that, at the time of its collapse in 2018, the building did not comply with the new regulations; in fact, the critical buckling load of the structure (estimated to be 645 N m−2) was lower than the design accidental snow load resulting from Eurocode 1 (equal to 1280 N m−2; see Sect. S3).
This section aims to identify the weaknesses of the structure subject to the extreme climatic event (the estimated snow and rain load of 1226–1325 N m−2 was indeed close to the design exceptional snow load resulting from Eurocode 1; see Fig. S8) to possibly explain the collapse. Firstly, as indicated above, the crossbars at the eastern and western perimeters of the lattice roof were clearly prone to buckling. Although this buckling was localized, it gradually weakened the structure and could have potentially contributed to its collapse. Similar phenomena were also observed in the nearby building after the 2018 incident (Fig. 6). Secondly, since large vehicles (agricultural tractors) were to be used inside the building, no load-bearing walls were built inside. This resulted in a very large span of the roof trusses. Even if the deflection threshold FCBD is respected, the FE simulations show that the snow and rain have led to an important deflection of the lattice (Fig. 9). It should be noted that the nearby building, similar to the one that collapsed, resisted the February 2018 event and is still standing on the site. This nearby building contains a number of offices and therefore has some internal load-bearing walls. This may be an indication that these walls within the structure are likely to be effective in preventing significant deflection.
Finally, the roof rain drainage system, consisting exclusively of vertical openings located in the lower part of the roof perimeter (see Fig. S5) combined with a near-flat roof, probably contributed to a very poor evacuation of the rain immediately after the snow event, leading to a significant increase in the load carried by the roof. In the future, it would be interesting to perform more thorough studies of rainwater drainage on near-flat roofs during rain-on-snow events, following the efforts made by Colbeck (1977), O'Rourke and Downey (2001), and Otsuki et al. (2017). It is important to clarify the effectiveness of different drainage solutions under snowy roof conditions and to make appropriate recommendations regarding the required roof slopes and the selection and design of downstream drainage devices.
Using multiple sources of information regarding the 2018 meteorological event in terms of snow and rain amounts and detailed simulations of the behavior of the roof structure subject to loads, this study provides a detailed back analysis of the interactions between the snow cover and the structure. Concerning the meteorological event, while intense snow events are unusual in this area, this type of event can occur when winter storms bring important masses of cold air from northern Europe to the south (see the recent event in Madrid; Smart, 2021). In Montpellier, snow depths around or above 30 cm have been recorded several times in the past (35 cm in February 1954, 35 cm during the winter of 1962–1963, 27 cm on 14–16 January 1987, 28 cm on 22 January 1992). For this event in Montpellier, the snow–rain transition led to a saturated and overweight load. A detailed understanding of the meteorological event has been consolidated using various sources of information: weather stations, numerical weather model outputs, meteorological reanalysis and numerous testimonies obtained using social networks (Facebook).
This study proposes an assessment of the response of the structure to incremented load values under quasi-static conditions, as well as a buckling analysis. Different scenarios for the distribution of the pressure field imparted to the structure have been studied. Based on the results obtained, the collapse of the Irstea Cévennes building can be explained by a combination of several factors. First, the structure was susceptible to significant buckling and, to a lesser extent, to bending (although it was designed in accordance with the regulations on this aspect). Secondly, the collapse was probably caused by the rain-on-snow surcharge. Furthermore, it seems evident that geometric imperfections were not considered in the design of the structure, resulting in its vulnerability to buckling (also observed in the neighboring Minea building). The fact that the resulting load exceeded the critical load, leading to roof failure, is certainly due to the additional water on the initial snowpack. Such a rain-on-snow scenario is considered in the regulations, but it appears that in the particular chronicle of the 2018 event (significant amounts of snow and then rain), the resulting overload was greater than the design scenario.
SAFRAN meteorological data are owned by Météo-France and can be obtained under certain legal, regulatory and contractual conditions – as “public information”, in application of law no. 78-753 of 17 July 1978, for purposes other than the public service mission for which the information was produced or received by Météo-France. Meteorological data from the Lavalette station and the codes/data used to implement Abaqus finite-element models are available upon reasonable request by contacting the corresponding author directly.
The supplement related to this article is available online at: https://doi.org/10.5194/nhess-23-3509-2023-supplement.
TF coordinated and supervised the back-analysis study. GE and DR performed the meteorological event analysis. IO carried out the FE model simulations. All authors discussed the results and co-wrote the paper.
The contact author has declared that none of the authors has any competing interests.
Publisher's note: Copernicus Publications remains neutral with regard to jurisdictional claims made in the text, published maps, institutional affiliations, or any other geographical representation in this paper. While Copernicus Publications makes every effort to include appropriate place names, the final responsibility lies with the authors.
The authors thank Mohamed Naaim for encouraging this research. They are grateful to Météo Languedoc and Meteociel for sharing meteorological information and resources. They also thank Jean-Luc Descrismes and Sylvain Labbé of INRAE for providing all available information about the Irstea Cévennes building. Finally, the authors are grateful to the editor, Yves Bühler, and the numerous referees for their insightful comments on previous versions of the manuscript.
This paper was edited by Yves Bühler and reviewed by Stefan Margreth, Miroslav Sýkora, and two anonymous referees.
AFNOR: NF EN 1991-1-3/NA: Eurocode 1: Actions sur les structures – Partie 1–3: Actions générales – charges de neige. Annexe nationale à la NF EN 1991-1-3, Association Francaise de Normalisation (AFNOR), 2007. a
Altunişik, A., Ateş, S., and Hüsem, M.: Lateral buckling failure of steel cantilever roof of a tribune due to snow loads, Eng. Fail. Anal., 72, 67–78, https://doi.org/10.1016/j.engfailanal.2016.12.010, 2017. a, b
ASCE: Minimum Design Loads for Buildings and Other Structures – ASCE/SEI 7–10, Tech. rep., https://doi.org/10.1061/9780784412916, 2013. a
Biegus, A. and Kowal, A.: Collapse of halls made from cold-formed steel sheets, Eng. Fail. Anal., 31, 189–194, https://doi.org/10.1016/j.engfailanal.2012.12.009, 2013. a, b
Biegus, A. and Rykaluk, K.: Collapse of Katowice Fair Building, Eng. Fail. Anal., 16, 1643–1654, https://doi.org/10.1016/j.engfailanal.2008.11.008, 2009. a, b
Bouttier, F. and Roulet, B.: Arome, the new high resolution model of Meteo-France, The European forecaster – Newsletter of the WGCEF (Printed by Meteo-France), 13, 27–30, http://www.euroforecaster.org/newsletter13/arome.pdf (last access: 13 November 2023), 2008. a
Brencich, A.: Collapse of an industrial steel shed: A case study for basic errors in computational structural engineering and control procedures, Eng. Fail. Anal., 17, 213–225, https://doi.org/10.1016/j.engfailanal.2009.06.015, 2010. a, b
Caglayan, O. and Yuksel, E.: Experimental and finite element investigations on the collapse of a Mero space truss roof structure – A case study, Eng. Fail. Anal., 15, 458–470, https://doi.org/10.1016/j.engfailanal.2007.05.005, 2008. a, b
Canadian Commission on Building and Fire Codes: National Building Code of Canada: 2010, Tech. rep., National Research Council of Canada, https://doi.org/10.4224/40001268, 2010. a
Colbeck, S. C.: Roof loads resulting from rain on snow: results of a physical model, Can. J. Civil Eng., 4, 482–490, https://doi.org/10.1139/l77-057, 1977. a, b, c
Dassault Systemes: Abaqus/Standard. Version 11.2., Tech. rep., Providence, RI: Dassault Systemes Simulia Corp., 2017. a
del Coz Díaz, J., Álvarez Rabanal, F., García Nieto, P., Roces-García, J., and Alonso-Estébanez, A.: Nonlinear buckling and failure analysis of a self-weighted metallic roof with and without skylights by FEM, Eng. Fail. Anal., 26, 65–80, https://doi.org/10.1016/j.engfailanal.2012.07.019, 2012. a, b
Geis, J., Strobel, K., and Liel, A.: Snow-Induced Building Failures, J. Perform. Constr. Fac., 26, 377–388, https://doi.org/10.1061/(ASCE)CF.1943-5509.0000222, 2012. a
Geis, J. M.: The Effects of Snow Loading on Lightweight Metal Buildings with Open-Web Steel Joists, Master's thesis, University of Colorado, https://scholar.colorado.edu/concern/graduate_thesis_or_dissertations/n583xv25x (last access: 15 November 2023), 2011. a
Holický, M. and Sýkora, M.: Failures of Roofs under Snow Load: Causes and Reliability Analysis, American Society of Civil Engineers, 444–453, https://doi.org/10.1061/41082(362)45, 2009. a
Krentowski, J., Chyzy, T., Dunaj, P., and Dunaj, P.: Delayed catastrophe of a steel roofing structure of a shopping facility, Eng. Fail. Anal., 98, 72–82, https://doi.org/10.1016/j.engfailanal.2019.01.082, 2019. a, b
Le Roux, E., Evin, G., Eckert, N., Blanchet, J., and Morin, S.: Non-stationary extreme value analysis of ground snow loads in the French Alps: a comparison with building standards, Nat. Hazards Earth Syst. Sci., 20, 2961–2977, https://doi.org/10.5194/nhess-20-2961-2020, 2020. a
O'Rourke, M. and Downey, C.: Rain-on-Snow Surcharge for Roof Design, J. Struct. Eng., 127, 74–79, https://doi.org/10.1061/(ASCE)0733-9445(2001)127:1(74), 2001. a, b
O'Rourke, M. and Wikoff, J.: Snow-Related Roof Collapse during the winter of 2010–2011: Implications for Building Codes, American Society of Civil Engineers, https://doi.org/10.1061/9780784478240, 2014. a, b
Otsuki, M., Takahashi, T., Saito, Y., Tsutsumi, T., and Hitomitsu, K.: Study on evaluation of roof snow load considering rain-on-snow surcharge: Statistical evaluation of snow cover and precipitation in winter in Japan, in: Snow engineering: recent advances, ICSE 2016, 8th International Conference on Snow Engineering, Nantes, France, 14–17 June 2016, 166–172, 2016. a
Otsuki, M., Takahashi, T., Tomabechi, T., Chiba, T., Tsutsumi, T., Kamiishi, I., Kikitsu, H., Iwata, Y., Ishihara, T., and Okuda, Y.: Study on Estimation Method for Surcharge Snow Load Due to Rainfall, Journal of Structural and Construction Engineering (Transactions of AIJ), 82, 1329–1338, https://doi.org/10.3130/aijs.82.1329, 2017. a, b
Piroglu, F. and Ozakgul, K.: Partial collapses experienced for a steel space truss roof structure induced by ice ponds, Eng. Fail. Anal., 60, 155–165, https://doi.org/10.1016/j.engfailanal.2015.11.039, 2016. a
Piskoty, G., Wullschleger, L., Loser, R., Herwig, A., Tuchschmid, M., and Terrasi, G.: Failure analysis of a collapsed flat gymnasium roof, Eng. Fail. Anal., 35, 104–113, https://doi.org/10.1016/j.engfailanal.2012.12.006, special issue on ICEFA V- Part 1, 2013. a, b
Smart, D.: Storm Filomena 8 January 2021, Weather, 76, 98–99, https://doi.org/10.1002/wea.3950, 2021. a
Strasser, U.: Snow loads in a changing climate: new risks?, Nat. Hazards Earth Syst. Sci., 8, 1–8, https://doi.org/10.5194/nhess-8-1-2008, 2008. a
Takahashi, T., Takahiro, C., and Kazuki, N.: Structural damage caused by rain-on-snow load in Japan, in: Snow engineering: recent advances, ICSE 2016, 8th International Conference on Snow Engineering, Nantes, France, 14–17 June 2016, 173–178, 2016. a
Vidal, J.-P., Martin, E., Franchistéguy, L., Baillon, M., and Soubeyroux, J.-M.: A 50 year high-resolution atmospheric reanalysis over France with the Safran system, Int. J. Climatol., 30, 1627–1644, https://doi.org/10.1002/joc.2003, 2010. a
Winter, S. and Kreuzinger, H.: The Bad Reichenhall ice-arena collapse and the necessary consequences for wide span timber structures, in: 10th World Conference on Timber Engineering, vol. 4, 1978–1985, Miyazaki, Japan, ISBN 978-1-61567-088-8 , 2008. a