the Creative Commons Attribution 4.0 License.
the Creative Commons Attribution 4.0 License.
 | 15 Nov 2023
A wave-resolving modeling study of rip current variability, rip hazard, and swimmer escape strategies on an embayed beach
Huaiwei Yang
Fujiang Yu
Yi Gao
Benxia Li
Chuang Xing
Drownings due to rip currents are a major threat to beach safety. In this study a high-resolution Boussinesq model with a modified wave-resolving Lagrangian tracking module has been applied to a 2 km long embayed beach, Dadonghai of Sanya, Hainan Island, with the purpose of studying rip current variability, real-time rip hazard identification, and the optimal swimmer escape strategies. The beach stage evolves periodically at the study site and plays an important role in the long-term modulation of the occurrence and strength of rip currents according to the modeling. A series of tests are designed and confirm that rip current strength is closely related to wave properties and tidal levels. Spectral analysis of output time series at specific points shows that the modeled rip currents fluctuate on the orders of 1 and 10 min, which suggests the effects of wave-group-forced infragravity (IG) and very-low-frequency (VLF) motions. Rip hazard levels are defined by combining rip strength and its duration. An attempt to use the GPU-accelerated FUNWAVE-TVD (Total Variation Diminishing version of the Fully Nonlinear Boussinesq Wave Model) embedded with the spectral wave model WAM6-GPU (GPU version of the third-generation spectral wave model WAM Cycle 6) exhibits its capability to evaluate rip hazard levels in real time. One of the differences of the present study from previous works is that the random, wave-resolving tracking of virtual swimmers is performed with 1 m resolution to study beach safety strategies. The results demonstrate that multiple factors contribute to the survival of swimmers caught in the rip currents, including surf-zone bathymetry, rip strength, fine-scale flow patterns, the bather's position, and swimming ability. For weak-to-moderate rip currents and longshore currents, swim onshore consistently seems to be the most successful strategy across all the scenarios in this study. Higher surf-zone exit rates along Dadonghai beach are not favorable for stay afloat action, which puts swimmers at a higher risk of being expelled to deeper water. The effects of wave randomness of incoming wave trains and assignment of wave-following coefficients on Lagrangian tracking are also discussed.
- Article
(14076 KB) - Full-text XML
- BibTeX
- EndNote


Rip currents are narrow jets of offshore-directed flow that originated in the surf zone. Strong rip currents can reach above speeds of 0.5–1.0 m s−1 and persist for minutes, thus taking swimmers of all ability levels into deeper water (Dalrymple et al., 2011; Castelle et al., 2016b). It has been reported that the majority of bather drowning and beach rescue efforts worldwide are related to rip currents (Brighton et al., 2013; Arun Kumar and Prasad, 2014; Brewster et al., 2019; Castelle et al., 2020). In China, concerns about rip hazards are being raised as more coastal fatalities are being reported (Li, 2016; Zhang et al., 2021). Taking Dadonghai beach, Hainan Island, as an example, more than 100 rescues and 7 deaths have been recorded in less than a month from 1 to 23 August 2013, according to online reports (Li and Zhu, 2018). Therefore, a better understanding of rip hazards is necessary for educating the public in order to avoid rip-current-related drownings.
Wave breaking, by constantly producing onshore momentum and mass fluxes, is the main driving force behind surf-zone hydrodynamics. Momentum and mass should remain conserved to balance these fluxes by introducing change in the mean water level near the shoreline, which provides a hydrostatic force, or a bottom friction force, due to wave-induced currents (Shepard, 1936; Bowen, 1969). It is widely accepted that rip currents are generated by alongshore variations in breaking wave heights. In the bar–trough beach, an idealized rip current system is depicted as feeder currents, rip neck, exit flow, and rip head (MacMahan et al., 2006). Incident waves break over the sandbars and result in the formation of longshore feeder currents usually flowing along or behind the sandbar. The feeder currents converge into a narrow and fast-flowing rip neck and then exit through incised rip channels.
The nearshore circulation is temporally unstable and spatially variable, which makes the accurate identification and modeling of rip current hazard a difficult task. Temporal variations induced by the changes in the incident wave conditions, tidal modulation, very-low-frequency (VLF) motions, and infragravity motions all contribute to the dynamic signature of the rip current circulations (Reniers et al., 2010). Observations and modeling studies suggest increasing rip strength under higher wave forcing and lower tidal levels (Castelle et al., 2020). Oblique incident waves are inclined to generate strong alongshore currents, which deflect to the offshore direction by the headland or rigid boundary. Rip currents also pulsate at a lower frequency in response to incident wave groups. The shape of the morphology (i.e., orientation, width, and rip spacing) also determines the rip current patterns, scales, and magnitude (Dalrymple et al., 2011). The modeling of the localized features requires fine resolution of up to 1 m, which used to be limited by computing power.
It is important to relate knowledge on rip current dynamics with rip hazard mitigation activities. To reduce rip current hazards and keep beaches safe, a series of concerns need to be addressed: what the level of the rip hazard is on a specific beach and how swimmers caught in a rip should react to survive. There are multiple ways to quantify or forecast rip current hazards. For bathymetrically controlled rip currents, their hazard can be inferred based on the beach morphodynamic state model proposed by Masselink and Short (1993). However, as rip currents can be present during all evolving beach stages, meteorological and hydrodynamic factors should be included. By establishing an empirical relationship among rip-related rescues, weather, wave conditions, tidal levels, and other factors (Engle et al., 2002; Dusek and Seim, 2013), rip hazard levels can be indirectly predicted for a specific beach. Since the method is empirically based, derivation of a universal relation is questionable, and its validity needs to be calibrated individually. Recently, a framework of predicting rip hazard by using numerical tools has been proposed and implemented in Korea (Kim et al., 2013; Eom et al., 2014). With the aid of high-performance computing (HPC) and GPU acceleration, high-resolution beach-scale modeling of wave-driven currents is practicable using meteorological and spectral wave forecasting as forcing conditions and thus provides a promising way to assess real-time rip current hazard in a specific region (Yuan et al., 2020).
Another category of studies focuses on field and modeling studies of the optimum current escape strategies. Field studies require the participation of experienced swimmers capable of implementing different swimming strategies as instructed. Three typical swimming strategies tested in these studies are stay afloat, swim parallel, and swim onshore. Field tests organized by McCarroll et al. (2014) and Van Leeuwen et al. (2016) found that there were not versatile escaping strategies for swimmers caught in the rip currents, as significant variations in environmental factors (i.e., beach morphology, wave conditions) and resulting rip current flow regimes exist. McCarroll et al. (2015) attached a swimmer-tracking and safety evaluation module to the nearshore hydrodynamic model XBeach-SB based on depth-averaged shallow-water equations. Although XBeach-SB is a phase-averaged surf-zone model, it offers an additional advantage compared to other phase-averaged models through its ability to resolve wave-group-generated infragravity (IG) motions, vortical currents at VLF timescales. By seeding a number of swimmers in a single rip current system, a series of scenarios and sensitivity tests are implemented to seek a preferable escape strategy. The results showed that low-speed and continuous swimming may be more effective than floating, while the choice of the best swimming direction is closely related to the starting position and rip spacing, as well as more complex factors. Similar research has been conducted by Castelle et al. (2016a) on multiple rip channels along an open beach in France. Simulations showed that subtle changes in the bar–rip morphology had a large impact on the rip flow field and in turn on the alongshore variability in the optimal rip current escape strategy.
To date, most rip hazard simulations have been performed by time averaging the phase of gravity waves. Due to the episodic and non-stationary nature of rip current flows, phase-resolving models, also known as Boussinesq-type models (BTMs), are preferable for studying rip current dynamics and for capturing random, instantaneous trajectories of swimmers (Castelle et al., 2016a). In this study, a phase-resolving BTM accelerated by GPU, namely FUNWAVE-GPU (Shi et al., 2012; Yuan et al., 2020), is used to explore rip current variability, rip hazard, and swimmer escaping strategies at Dadonghai, an embayed sandy beach with irregular rip channels in Sanya, Hainan Island. A four-grade fine-scale rip hazard map based on a numerical assessment of rip current strength and duration is presented. The swimmer-tracking and safety evaluation module proposed by McCarroll et al. (2015) is coupled to FUNWAVE-GPU to explore the swimming escape strategies. This study is part of ongoing efforts to construct rip hazard forecasting and mitigation systems for rip-prone beaches in China.
The paper is organized as follows. Section 2 provides an introduction to the study site in terms of its hydrodynamic background and beach morphology. In Sect. 3, numerical approaches to rip hazard grading and swimmer escape strategies are briefly described. The results are presented in Sect. 4 and further discussed in Sect. 5. Conclusions are made in Sect. 6.
The study site is Dadonghai beach, which is a medium-energy, micro-tidal, embayed beach at the southern tip of Sanya, Hainan Island (Fig. 1). Generally, Dadonghai exhibits a mixed semi-diurnal tidal cycle, with an averaged micro-tidal range of 1.2 m throughout the year. The beach faces south with a horizontal span of roughly 2 km. The west end of the bay is shallow and has a coastal coral reef beneath the surface, while the east end is characterized by bedrock covered with a mixture of cobbles and boulders, suggesting a high wave-energy environment. Tourists flock to Dadonghai due to its preferable climate and clear sand throughout the year, and most of them are from inland China and foreign countries. The daily tourist reception reaches more than 5000 d−1 during the peak period. The study site was selected as it is marked as a high-risk beach with rip drownings reported annually.
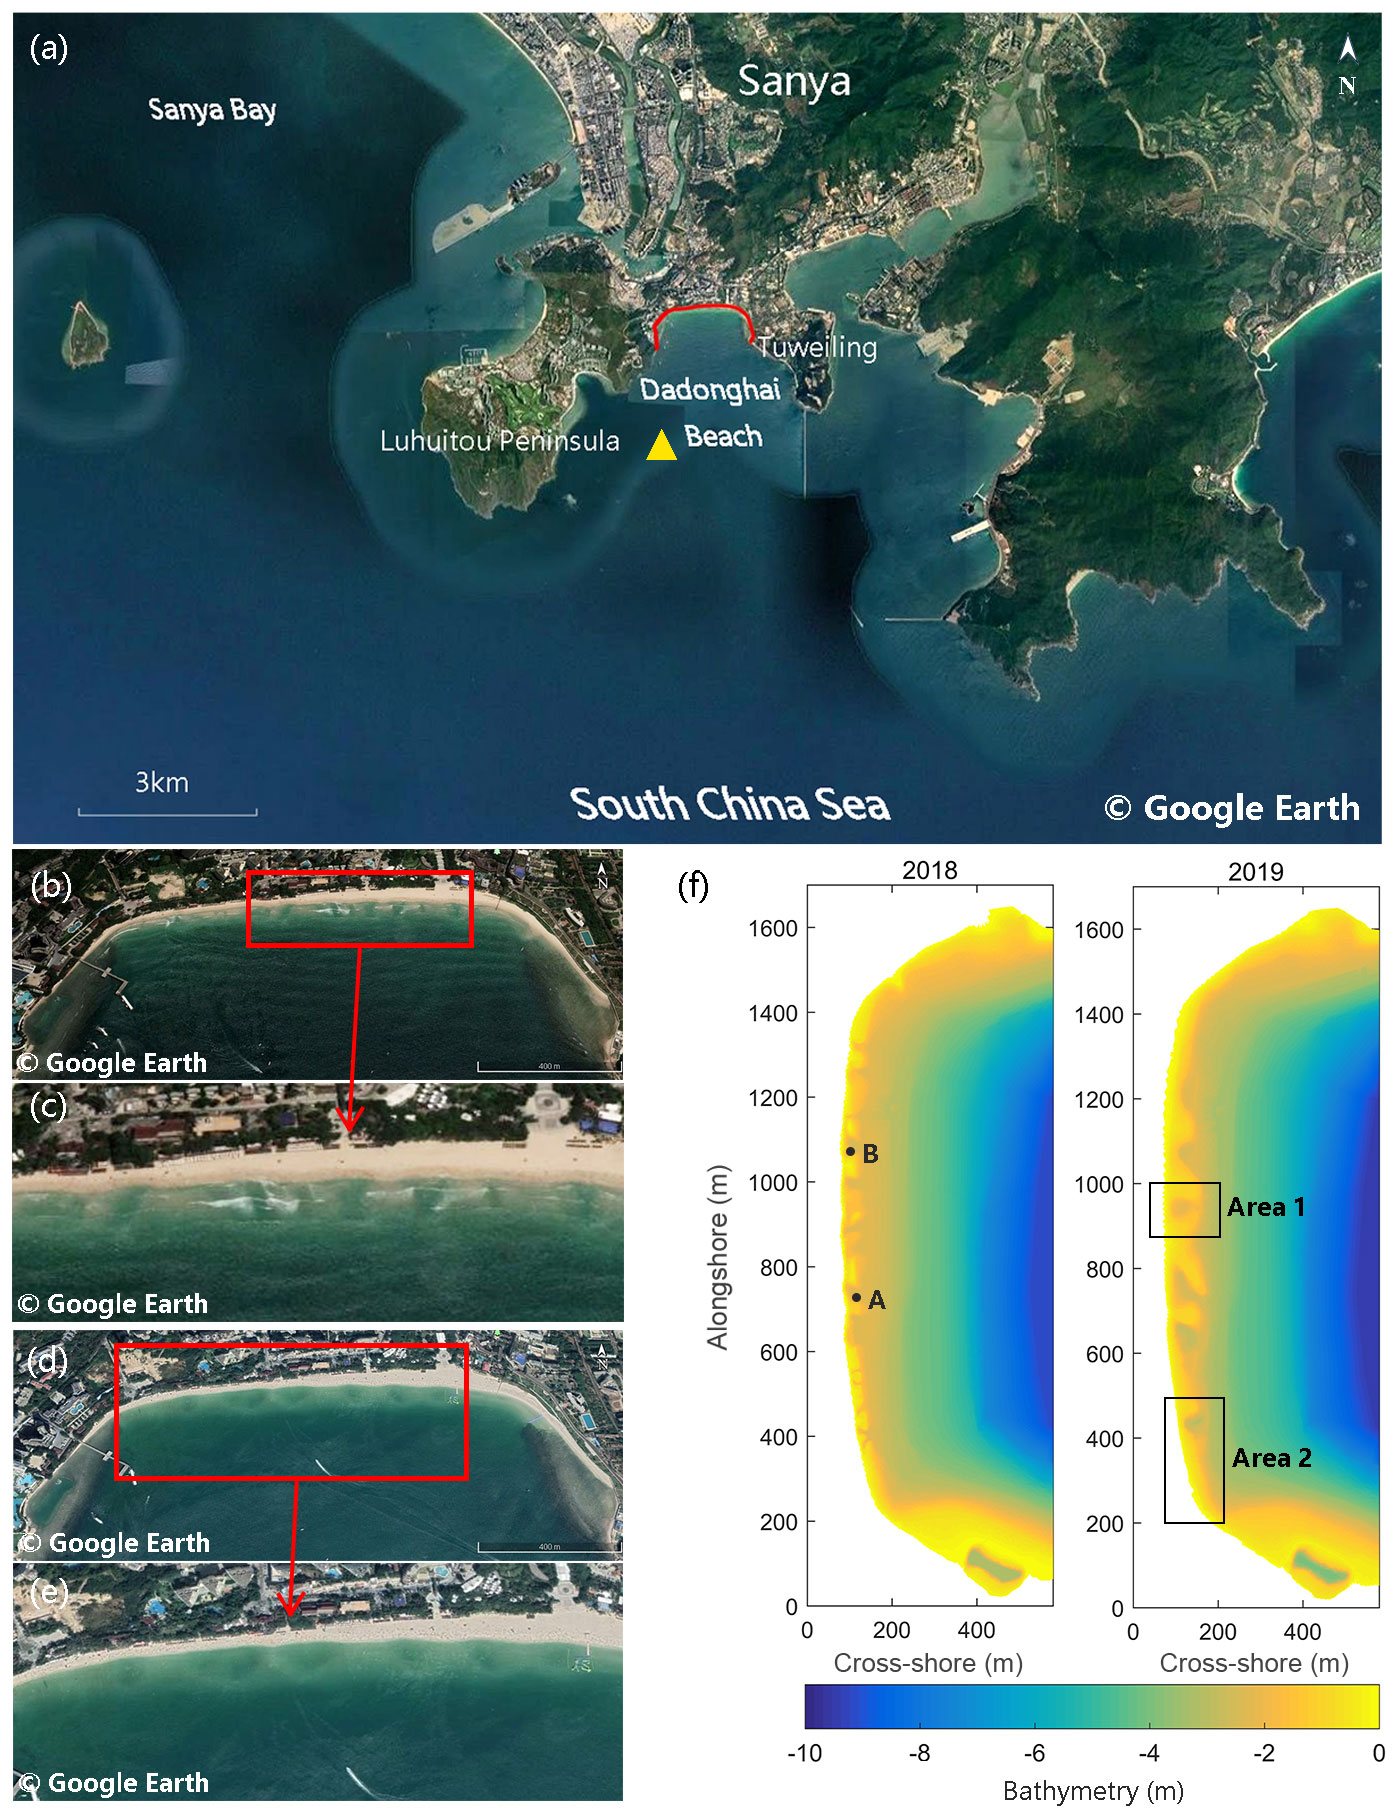
Figure 1Map of Dadonghai beach, Sanya (a), with satellite images collected on 7 August 2018 and 26 December 2019 (b–e). The satellite-derived bathymetry contours with spatial resolution of 1 m are displayed with orientation rotated 90∘ clockwise (f). Gauge A and Gauge B are set to investigate rip current variability. Virtual swimmers are evenly seeded within Areas 1 and 2 marked by two red rectangles, with the purpose of studying swimmer escape strategies. The wave hindcast point is denoted with a yellow triangle. The image source is © Google Earth.
2.1 Surf-zone bathymetry
Two satellite images were acquired from Google Earth's historical database on 7 August 2018 and 26 December 2019 when the sea state was calm. The images feature a typically complex beach planform composed of crescentic or transverse bars and rip channels with irregular configurations. A mild slope with straight and parallel contours exists seaward of the surf zone. As highlighted in Fig. 1b–e, two sets of the surf-zone bathymetry suggest slightly different beach stages. The former exhibits a shore-connected transverse sandbar with incised rip channels. White foam corresponding to breaking waves highlights the presence of shallow bars, and darker areas represent deeper rip channels that penetrate through the bars, while in the subsequent image collected in 2019, the rhythmic crescentic bar with wider yet shallower rips can be observed. Compared with the former morphology, it is supposed to generate weaker rip currents (Wright and Short, 1984).
Compared to extensive sonar or in situ measurements of depth, shallow bathymetry can be evaluated quickly and cost-effectively by remote-sensing images. In this study, by establishing a site-specific linear relationship between pixel colors and depths, nearshore bathymetry at Dadonghai was mapped and interpolated to 1 m resolution. Although this inversion may not produce bathymetry that is as accurate as other approaches, it can be operationalized for rip hazard forecast in the future owing to its simplicity with respect to locating sandbars and shoals, as well as availability of satellite imagery (Radermacher et al., 2018). It should be noted that the in situ echo sounder survey was not performed in August 2018 and December 2019 for this study. For the biggest part of Dadonghai bay, the depth data for the color–depth correlation were from the nautical chart published by the China Navigation Press with a scale of 1:25 000, which was converted to the mean tidal level (MTL) based on the datum at the Sanya tidal gauge nearby. Surf-zone bathymetry is constantly changing on multiple temporal scales. For the surf zone that is not covered by the nautical chart, only very limited field data collected in October 2019 were available to derive the color–depth relation along the surf zone. The derived bathymetry was then rotated 90∘ to align the shoreline with the vertical axis. The rotation is necessary for FUNWAVE to apply an irregular wavemaker.
2.2 Wave conditions
Based on an analysis of the 30-year wave hindcast dataset developed by the National Marine Environmental Forecasting Center of China (NMEFC), wave conditions immediately off the coast of Dadonghai bay are assessed. The wave point for analysis is located at 18.2∘ N, 109.5∘ E, which is denoted as a yellow triangle in Fig. 1a. According to the wave rose diagram of the 30-year-long wave hindcast (Fig. 2a), generally Dadonghai bay receives waves from two prevailing directions, including powerful typhoon swells mainly from the south and monsoon swells from the southeast. The 1 d moving average on the hourly wave hindcast in 2018 is performed and shown in Fig. 2d for further analysis. Waves during the summer months are relatively more energetic than in winter immediately off the coast of Dadonghai bay, which is interspersed with high-energy events associated with typhoon activities in the northern South China Sea (SCS). Typhoons can send long-period swells to Dadonghai bay. Wave-buoy observations along the slope of the northern SCS demonstrate that while the peak wave period during the winter monsoon is between 4–8 s, it is capable of reaching up to 10–14 s during the passage of the tropical cyclones in summer (Xu et al., 2017; Tian et al., 2020). As shown in Fig. 2c, these storm waves arrive over a wide spread of directions from SE to SW. As typhoons enter the northern SCS and move west, the directions of waves received by Dadonghai bay vary over time. Two prominent peaks in July and August are explained by two typhoons moving westward through the northern SCS in the summer of 2018, leading to elevated significant wave heights of 1.5–2.5 and 2.0–4.0 m (without a 1 d moving average), respectively. Strong typhoon swells persist for a week. During the winter months, the prevailing winter monsoon constantly produces northeastern wind waves in the northern SCS with a significant wave height of more than 2–3 m. However, as the monsoon swells propagate into the bay from the open sea, the waves decrease in height and are diffracted to the southeast due to shelter of the peninsula to the east (Fig. 2b). The hourly significant wave height off the coast of Dadonghai bay generally varies below 1.0 m and can reach up to 2.0 m with the outbreak of monsoons.
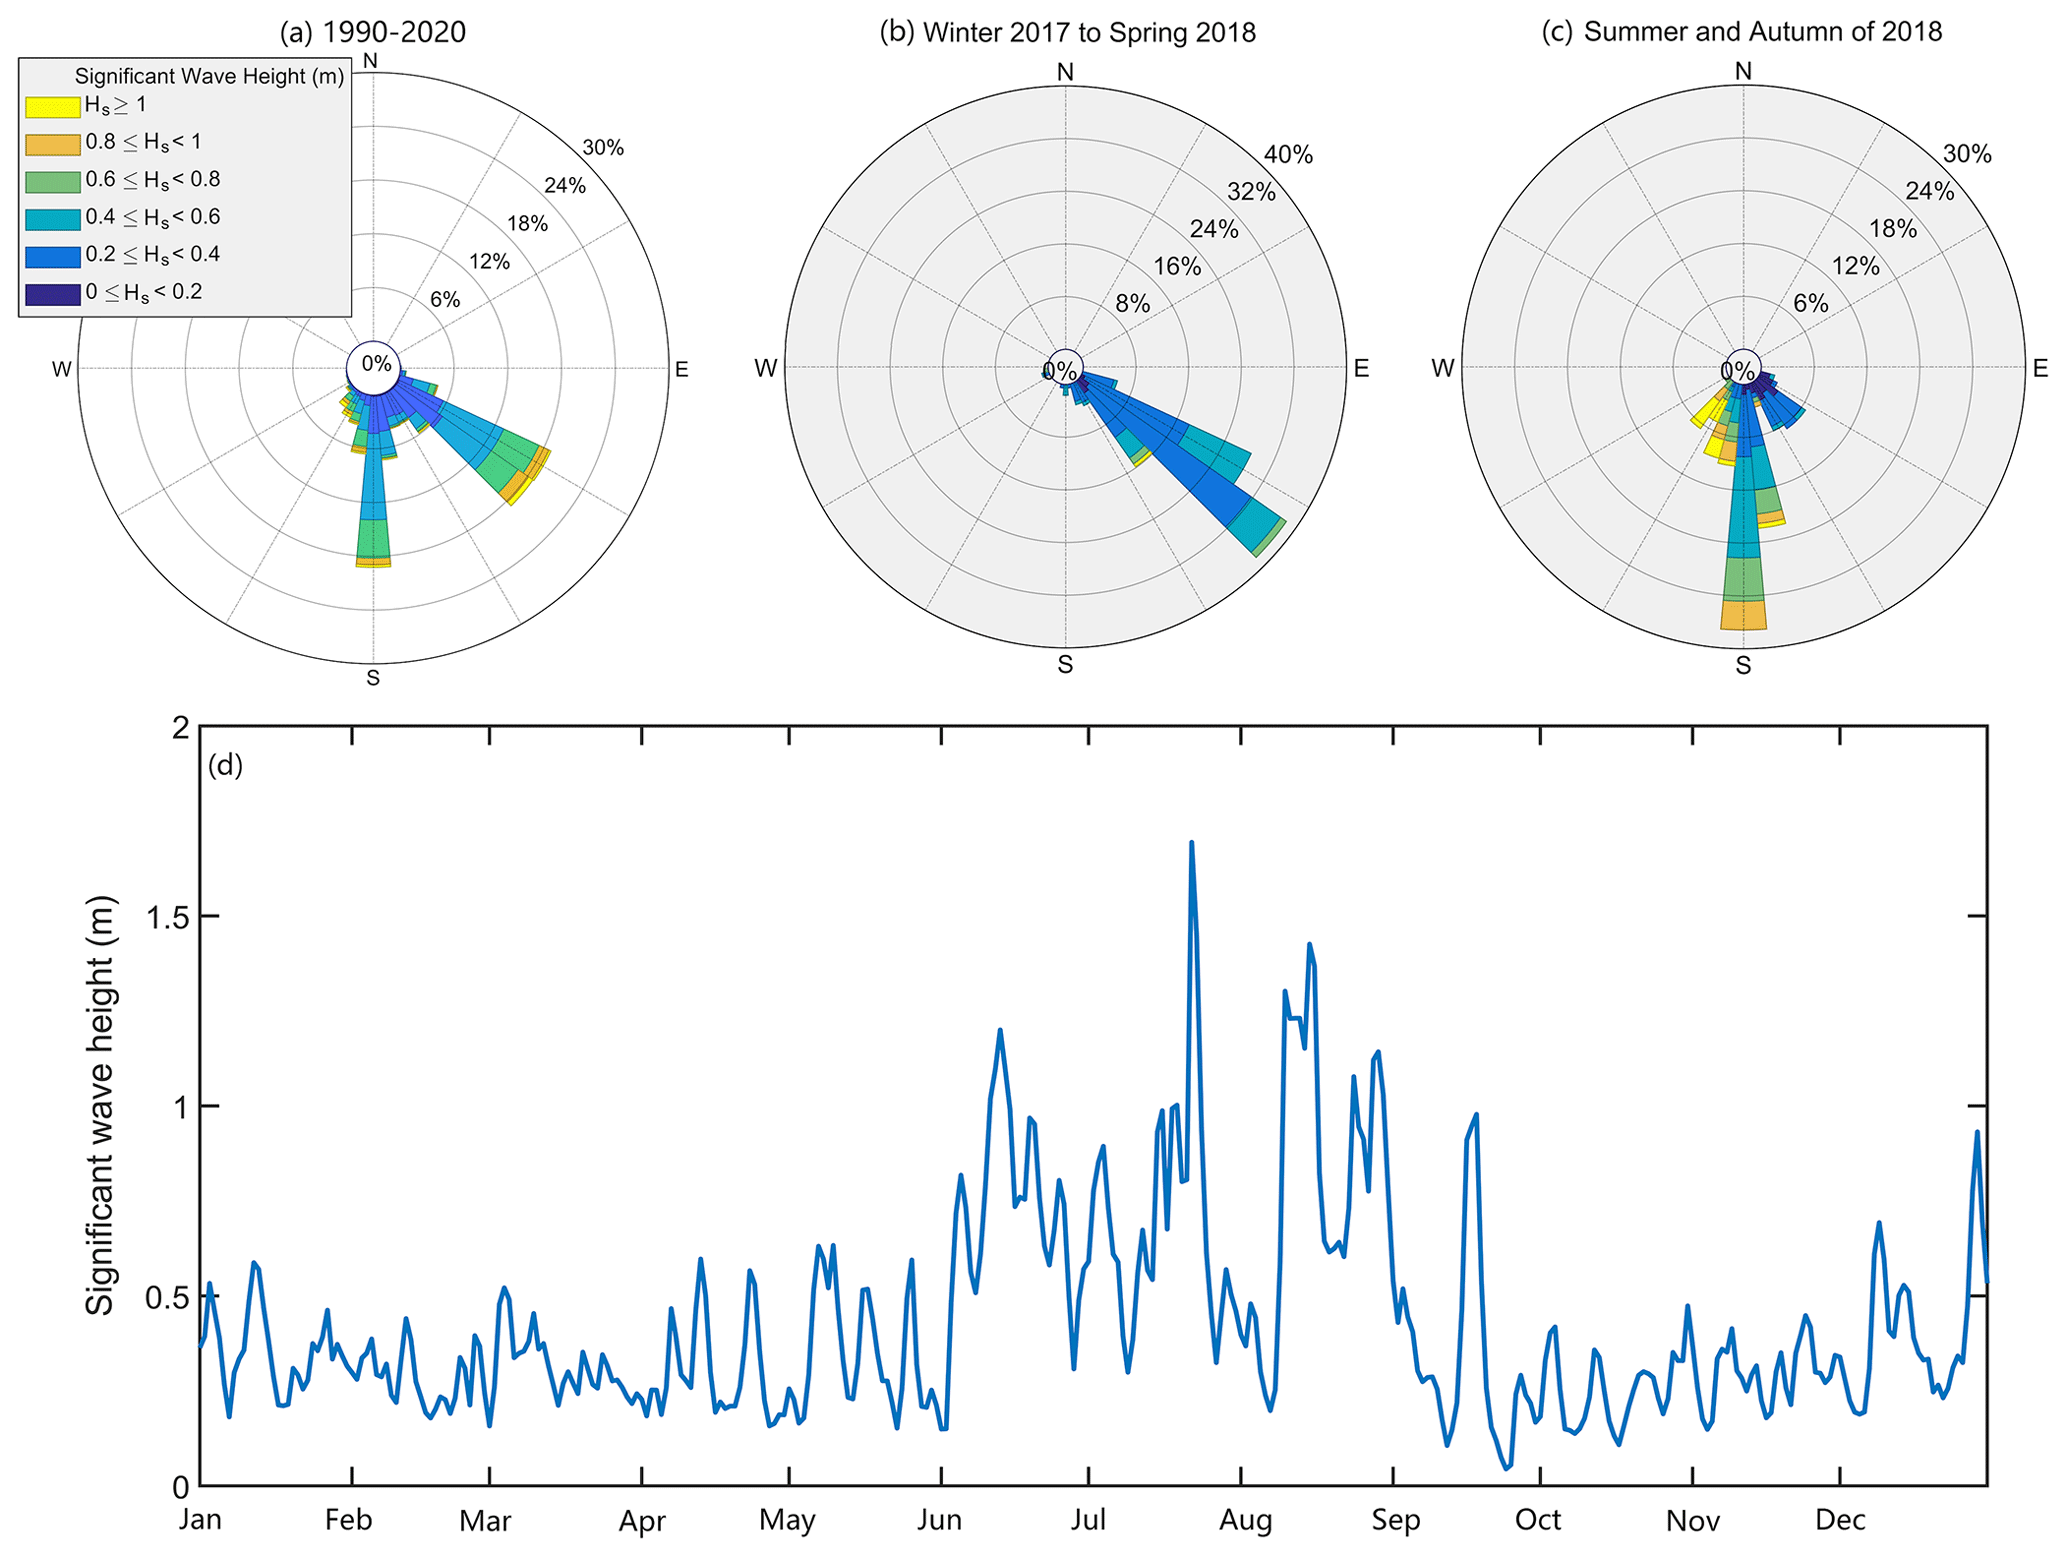
Figure 2Wave climate in the study site. Panel (a) is the wave rose diagram of the 30-year-long time series of wave hindcasts at a wave point immediately off the coast of Dadonghai bay (18.2∘ N, 109.5∘ E); panels (b)–(c) are the wave rose diagrams for winter monsoon and summer typhoon seasons, respectively; and panel (d) is the 1 d averaged time series of significant wave height in 2018.
Accordingly, various wave conditions representative of winter monsoon swells and summer typhoon swells are used in the following modeling studies of rip variability.
3.1 Numerical model
Phase-resolving Boussinesq-type wave models have proven to be robust tools for modeling surface waves and wave-driven processes in the nearshore region (Shi et al., 2012; Chen et al., 1999, 2003; Geiman et al., 2011). In this paper, we use the FUNWAVE-TVD (Total Variation Diminishing version of the Fully Nonlinear Boussinesq Wave Model) to simulate rip current dynamics. Due to the existence of high-order dispersive terms, FUNWAVE-TVD is more computationally demanding compared with shallow-water equation solvers (Kirby, 2016). To address this problem, a multi-GPU-accelerated version of FUNWAVE-TVD (FUNWAVE-GPU) has recently been developed (Yuan et al., 2020).
In this study, random, directionally incident waves are generated, propagated shoreward, and then shoaled and broken, finally producing the wave setup in the surf zone. The computation domain is 1678 × 659 m2. The cross-shore and alongshore grid size is chosen to be 1 m with variable time steps determined by the Courant–Friedrichs–Lewy (CFL) stability condition. The fine resolution is required to resolve wave-induced flow behavior with different scales. In this study the time step is usually smaller than 0.04 s, which is necessary to resolve individual waves. A constant bottom drag coefficient of 0.0025 in the quadratic friction formula was applied (Zhang et al., 2022). The directional irregular wavemaker is placed at 10 m water depth offshore, which is approximately 500 m away from the shoreline. The wavemaker can generate random, normal, or oblique incident waves with a specified peak amplitude, period, and incident angle. The absorbing boundary conditions are placed behind the wavemaker. The offshore sponge layer has a width of 100 m and is used to absorb outward-propagating waves. Wave breaking is modeled by two schemes implemented in the FUNWAVE – either the shock-capturing scheme of Tonelli and Petti (2009) or the eddy-viscosity scheme following Kennedy et al. (2000). The latter scheme is used in this study. The wave-driven flow field is obtained by averaging the instantaneous fluid particle velocity over two wave periods.
Unlike previous studies on rip current dynamics and bather tracking using wave-averaging models with coarser grid resolution, this study provides a chance to showcase to what extent the tracking can be different with wave-resolving and wave-averaged flow velocities.
3.2 Hydrodynamic settings
Prediction of nearshore circulation is important for swimmer safety and for estimating surf-zone dispersion of sediments and pollutants. Rip currents are forced by incoming waves and modulated by tidal elevation and other low-frequency motions (MacMahan et al., 2006). In this study, the hydrodynamic response of rip currents is examined through a series of numerical tests with varying offshore wave forcing conditions and tidal elevations. Shallow bathymetry within the surf zone largely dictates where incident waves break; thus two sets of bathymetries shown in Fig. 1b–e are also applied. In each simulation, the model runs for 50 min, with the first 10 min neglected due to a cold startup.
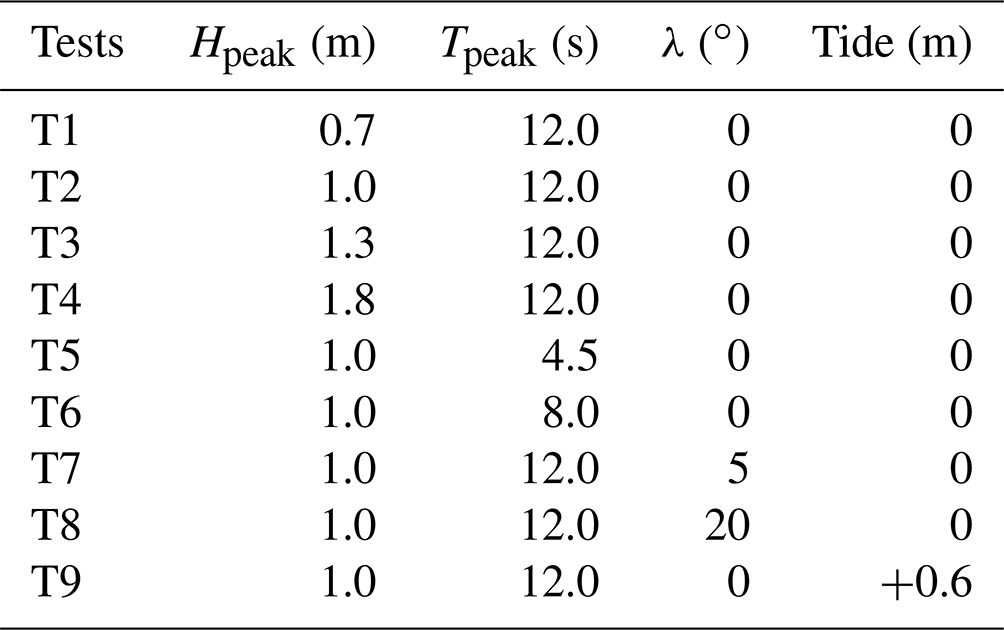
The model input is summarized in Table 1. The peak significant wave height and period range from 0.7 to 1.8 m and from 4.5 to 12.0 s, respectively. The incident angle varies from a shore-normal direction (0∘) to an oblique incident direction (20∘). Tidal elevation is considered by adjusting the input bathymetry according to the averaged tidal range at Dadonghai beach. The wave conditions given in these nine tests are representative of summer typhoon swells and winter monsoon swells and are hereafter referred to as T1–T9.
Table 1Model input for sensitivity tests (T1–T9) of rip currents on incident wave conditions and tidal levels.
3.3 Rip hazard levels
In this study the rip currents are defined as the offshore-directed flow with direction values falling between 135 and 225∘ clockwise from the north. The rip strength is divided into four intervals shown in the header row of Table 2. For each rip strength interval, its duration is the accumulated time period (trip) when the velocity falls into the corresponding interval during the entire simulation period (tmodeling). Rip duration is simply measured by and is categorized as the four levels listed in the first column of Table 2. To quantify rip hazard, here we propose the term rip hazard level and define it as a combination of rip strength and duration. The classification is summarized in Table 2. Grade I denotes the highest rip hazard level, potentially posing the greatest danger to bathers, and Grade IV is the lowest. Rip hazard levels are evaluated at locations where the water depth is deeper than 0.8 m. Below this depth, it is assumed that an adult of average height is capable of standing firmly in the water even under high-energy wave conditions.
Table 2Classification of rip hazard based on the rip strength (m s−1) and rip duration .
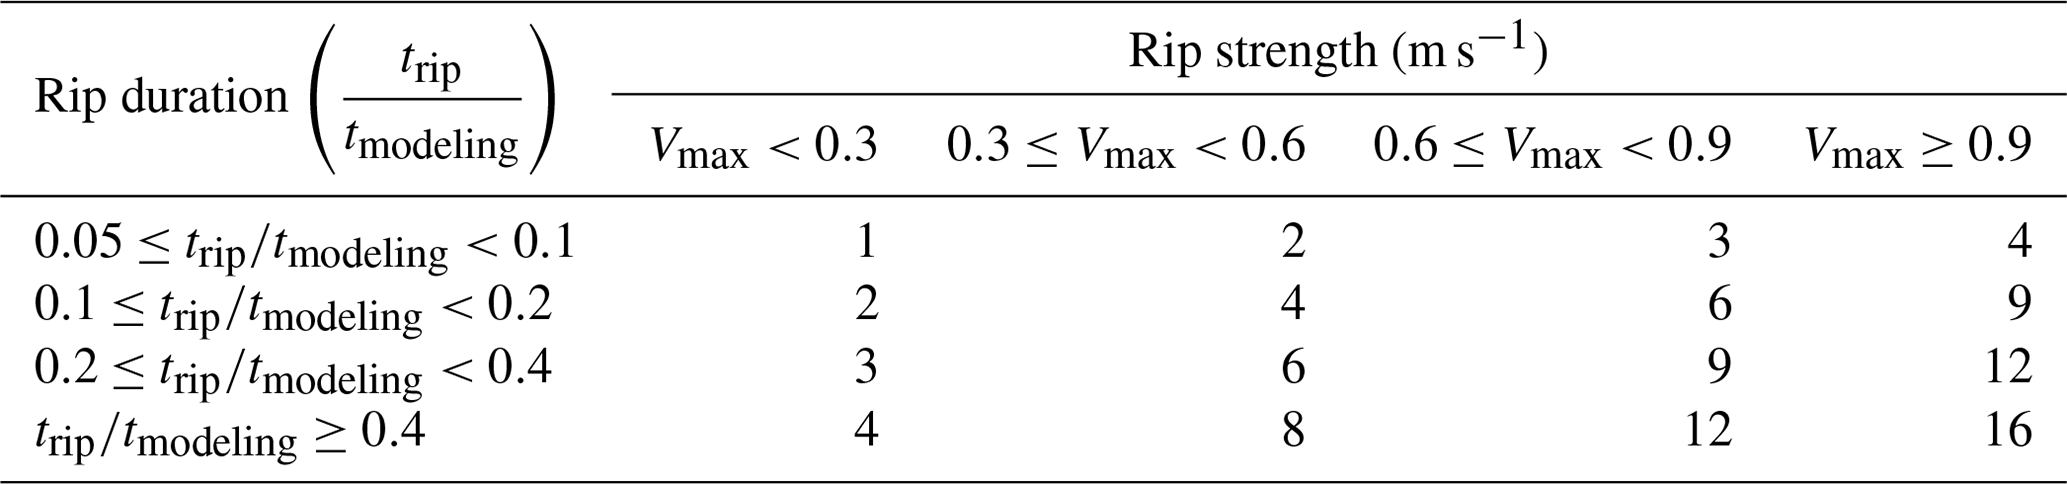
Rip hazard level: Grade IV ∈ [1,4], Grade III ∈ [5,8], Grade II ∈ [9,12], Grade I ∈ [13,16].
3.4 Phase-resolving tracking of swimmers and safety criteria
The existing Lagrangian tracking module of FUNWAVE has been modified to simulate the movement of swimmers with a combination of instantaneous, random wave motions () and swimming velocities (Us), as shown in Eq. (1). The effect of individual waves on swimmers can be resolved due to the phase-resolving nature of Boussinesq-type wave models. Swimmers are initially seeded as particles in the surf zone with the wave orbital motion and the mean depth interpolated from the neighboring four grid points at each time step △t. Each particle is also assigned with a fixed swimming velocity and direction at each △t. cf is defined as the wave-following factor of the swimmers, which accounts for the correction of drifting speed. In this study cf=0.8 is adopted following previous studies (McCarroll et al., 2015; Castelle et al., 2016a). A sensitivity study of this factor is also included in the Discussion.
The safety check of swimmers follows the work of McCarroll et al. (2015), which established a local hazard rating (HR) criterion (Eq. 2) to check whether swimmers have reached a safe state:
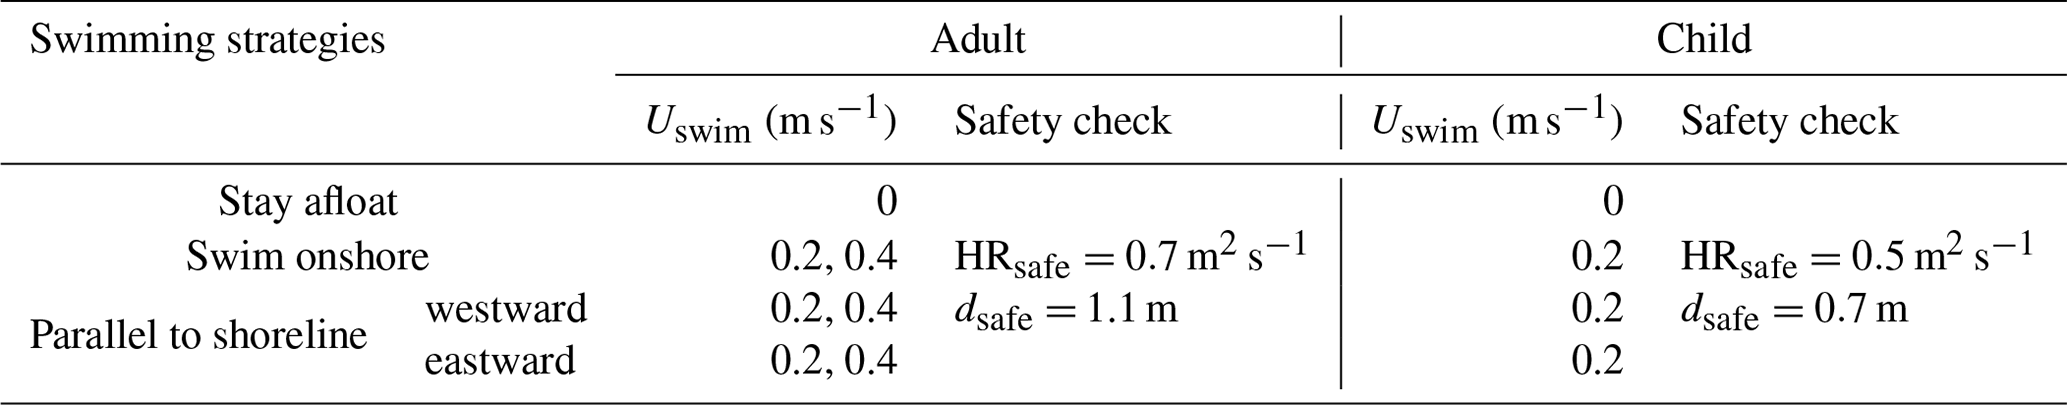
where is the mean water depth, and is the wave-averaged flow velocity. As shown in Table 3, a successful escape should demonstrate that the swimmer is at a position where either the mean water depth or the HR value is below a threshold (dsafe or HRsafe). The rip escape simulation is performed in the domains indicated in Fig. 1 by red rectangles. The swimmers are uniformly seeded in the rip channels with a spacing of 5 m when the modeling reaches a steady state. Although elite swimmers can propel themselves at up to 1 m s−1 in still water, here we assume that the average swimmers caught in rip currents have a swimming velocity of 0.2–0.4 m s−1. Swimmers are supposed to be exhausted and are thus removed from the subsequent simulation when a maximum time period of 10 min is exceeded. The escape time (tsafe) is recorded after each swimmer reaches the safe state. Three escape strategies, as suggested by McCarroll et al. (2015) and Castelle et al. (2016a), are tested in the study, including stay afloat, swim onshore, and swim parallel to the shoreline. For the stay afloat strategy, Uswim equals 0, suggesting swimmers move completely with ambient wave motions. Table 3 provides a summary on rip escape strategies and safety check criteria. Adults and children have different swimming capabilities and safety check conditions.
Table 3Configurations of rip escape strategies and safety check criteria.
4.1 Hydrodynamic response to wave conditions and surf-zone bathymetry
By applying two sets of beach morphologies obtained in 2018 and 2019 to the simulations, the snapshots of nearshore circulation forced by different wave climates and tidal conditions are shown in Figs. 3–4. In Fig. 3a–d, the most prominent feature is that two opposite embayment-scale longshore currents originate from both ends of the bay with the maximum flow velocity reaching 0.9 m s−1. The incident waves shoal and break at both headlands immediately after entering the embayment and in turn produce alongshore variable wave setups, creating longshore currents. The presence of strong lateral shear in the cross-shore direction leads to the meandering of the longshore flow, which gradually deflects to the offshore direction at x=600 and 1400 m. This feature is also visible in the CCTV images of Dadonghai beach (Fig. 9 in Li, 2016, and Fig. 6 in Wang et al., 2018) at the same location. Swimmers who are caught in these mega-rips may exit the surf zone rapidly. The rip current dynamic within the red rectangle is enlarged in Fig. 3e–l. The incised rip channels with uneven spacing produce complex surf-zone flow regimes. Generally, rip currents get stronger with increasing incident wave height. For the test case Hs=1.0 m and Tp=12 s, an intense shore-normal rip current (0.6 m s−1) at x=900 m is generated with stable feeder currents from neighboring sandbars. This well-established rip extends more than 150 m offshore and persists over the entire simulation. The simulation shows considerable vibration in the rip direction and accompanied vortex structures.
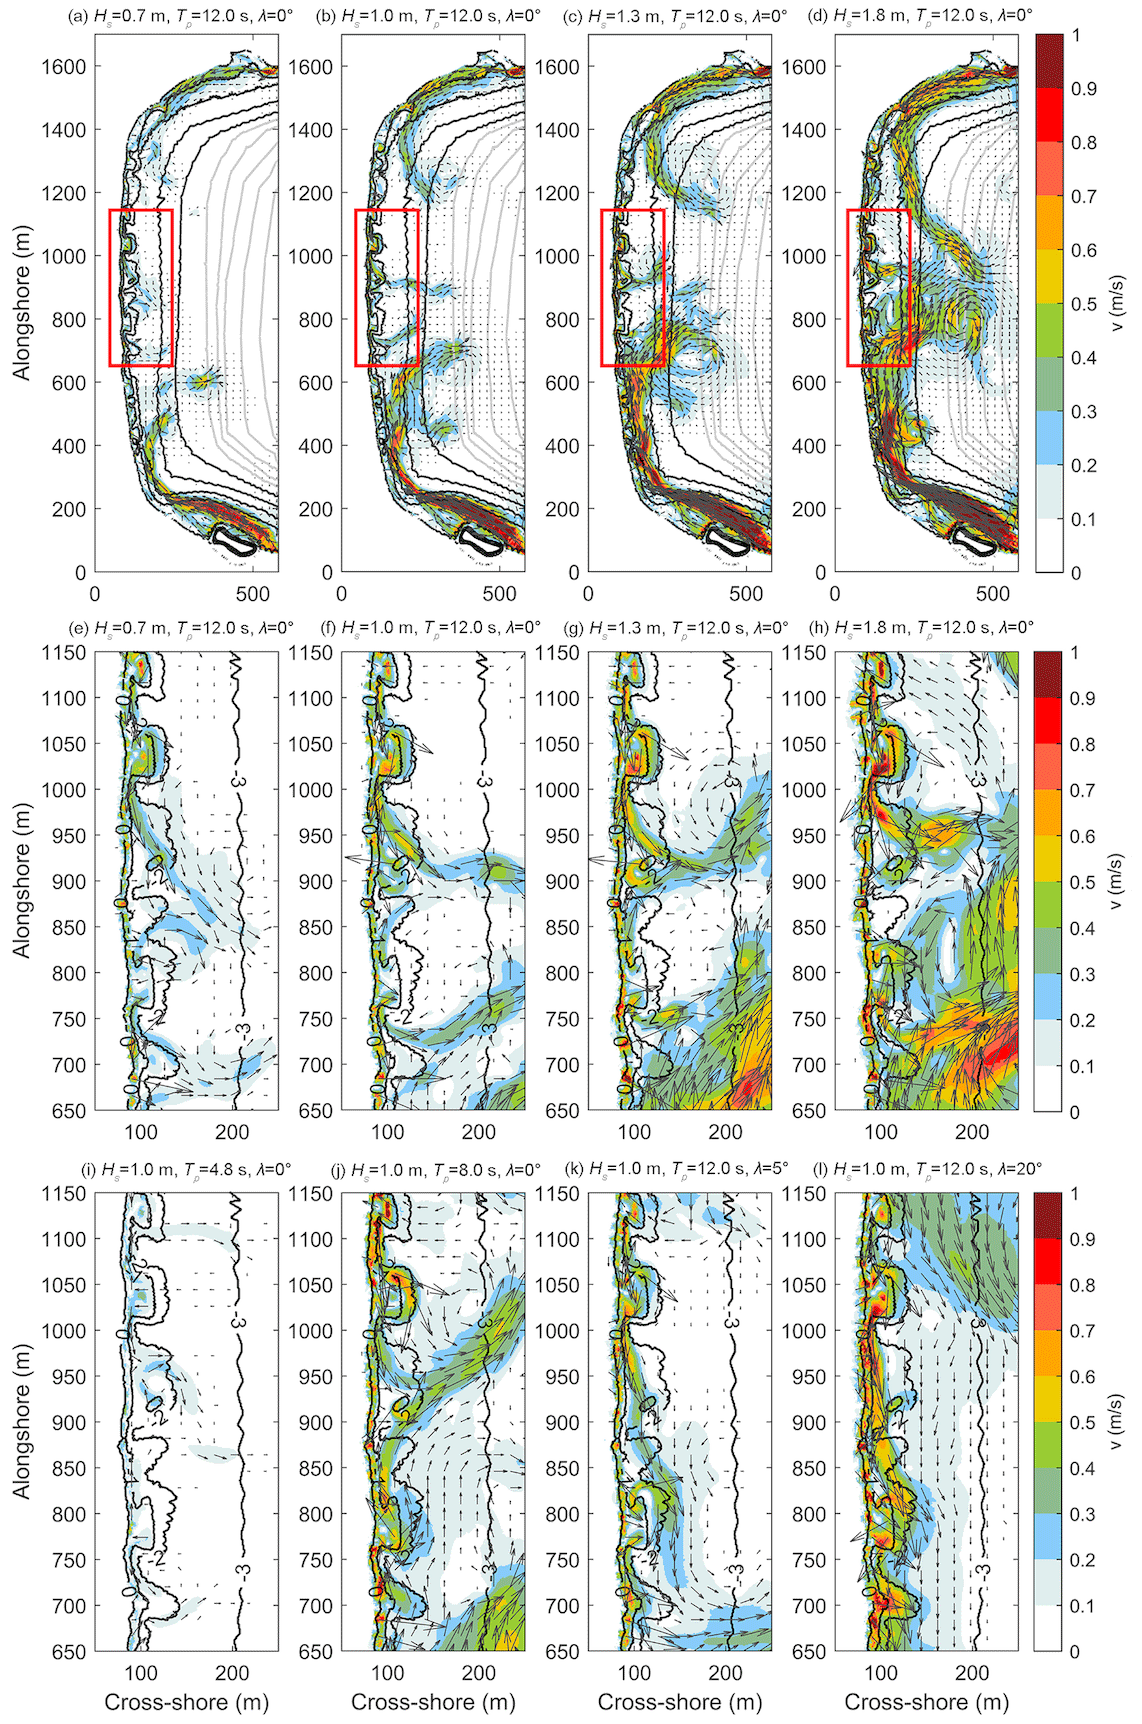
Figure 3Snapshot of the wave-driven velocity field in the embayed Dadonghai beach with different forcing wave conditions labeled at the top of each figure. Rip flows within the red rectangle in panels (a)–(d) are enlarged in (e)–(l). Bathymetry is acquired on 7 August 2018 (corresponding to Fig. 1b–c) and characterized by transverse bars incised by relatively deep rip channels. Depth contours are overlapped as thick black lines.
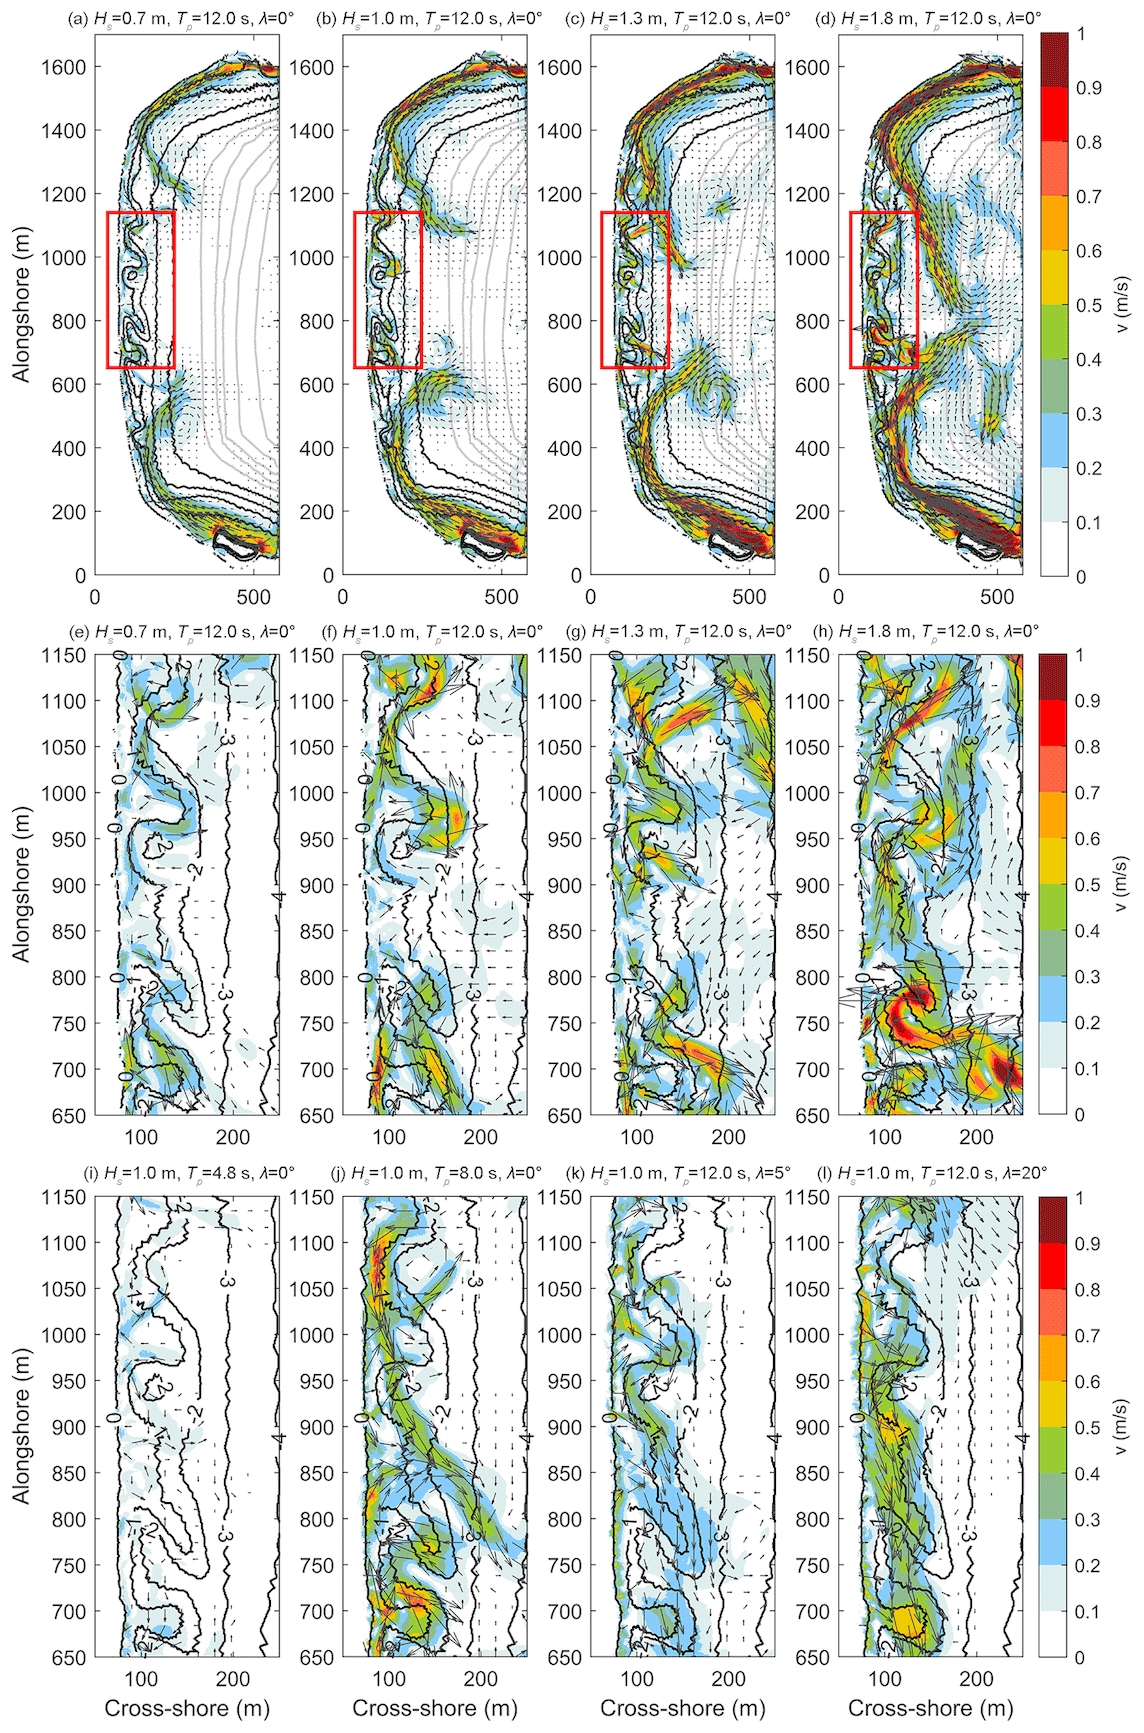
Figure 4Snapshot of the wave-driven velocity field in the embayed Dadonghai beach with different forcing wave conditions labeled at the top of each figure. Bathymetry is acquired on 26 December 2019 (corresponding to Fig. 1d–e) and characterized by crescentic outer bars with periodic shallow and wide troughs.
Nearshore circulation is weaker in terms of extent and strength for incident waves with shorter periods. Dadonghai beach faces the northern SCS. While the period of incoming waves is generally within 4–8 s, the long-period swells with a duration of 8–14 s occasionally propagate into the embayment during the typhoon season. On average, there are more than 13 tropical cyclones (TCs) across the northern SCS annually from early March to late November. Swells arrive days before the landing/passing of a TC and usually last for more than a week. Even subtle variation in incident directions can induce a considerable transition of the flow pattern. Offshore-directed flows are suppressed and rapidly deflected to a longshore direction.
The surf zone of sandy beaches usually shows a variety of complicated morphological patterns appearing alternatively with time. The beach morphology on 26 December 2019 exhibits a different beach stage. The satellite image (Fig. 1d–e) shows a nearly straight shore-parallel sandbar approximately 80–100 m seaward from the shoreline with periodic horn-shaped bars welded to the shore, causing the discontinuity of the alongshore trough between the shoreline and outer sandbar. This state is known as crescentic bar. Compared with the previous beach state in 2018 (Fig. 1c–d), there are no typical rip channels which are characterized by penetrating exit openings. The presence of relatively small bathymetric variations can have a profound effect on rip circulation. In this case, weaker exit flow is expected. As shown in Fig. 4a–h, the circulation is mainly confined within the surf zone, and no persistent and well-established exit flow is formed. The simulation also suggests rip flow patterns consist of semi-enclosed vortices developed within the wide channels, resulting in spatial and temporal variability in flow strength and direction. Although the Boussinesq model shows its superiority in studying fine-scale nearshore circulation and its variability in surf zones (Shi et al., 2012; Chen et al., 1999, 2003; Geiman et al., 2011; Feddersen, 2014; Zhang et al., 2022), further analysis on rip pulsation and variability in this study has not been included due to a lack of field observations at Dadonghai beach.
We use a rip current rose diagram to interpret the temporal distribution of rip current speed and direction over the entire simulation period. The time series of the rip current at Gauge A (x=730 m, y=120 m, Fig. 1f) is interpreted by the rose diagram in Fig. 5. The length of each colored spoke is a measure of the percentage of time that the rip current flows to that particular direction. For moderate wave energy with Hs= 1.0 m, the rip is nearly shore normal with a magnitude varying between 0.3–0.6 m s−1. The rip strength can exceed 0.6 m s−1 occasionally with Hs= 1.3 m. The wave-driven flow is weaker and shows considerable variability in direction when incoming waves have shorter periods. Tidal modulation of rip currents has long been confirmed by a number of observational and modeling studies (Dalrymple et al., 2011; Castelle et al., 2020). Generally rip strength is well correlated to tidal level, with maximum rip currents occurring at low tide. In Fig. 5f, by deepening the bathymetry with a constant of 0.6 m, rip current is replaced by a weak and meandering alongshore flow regime that is coupled to the underlying surf-zone morphology.
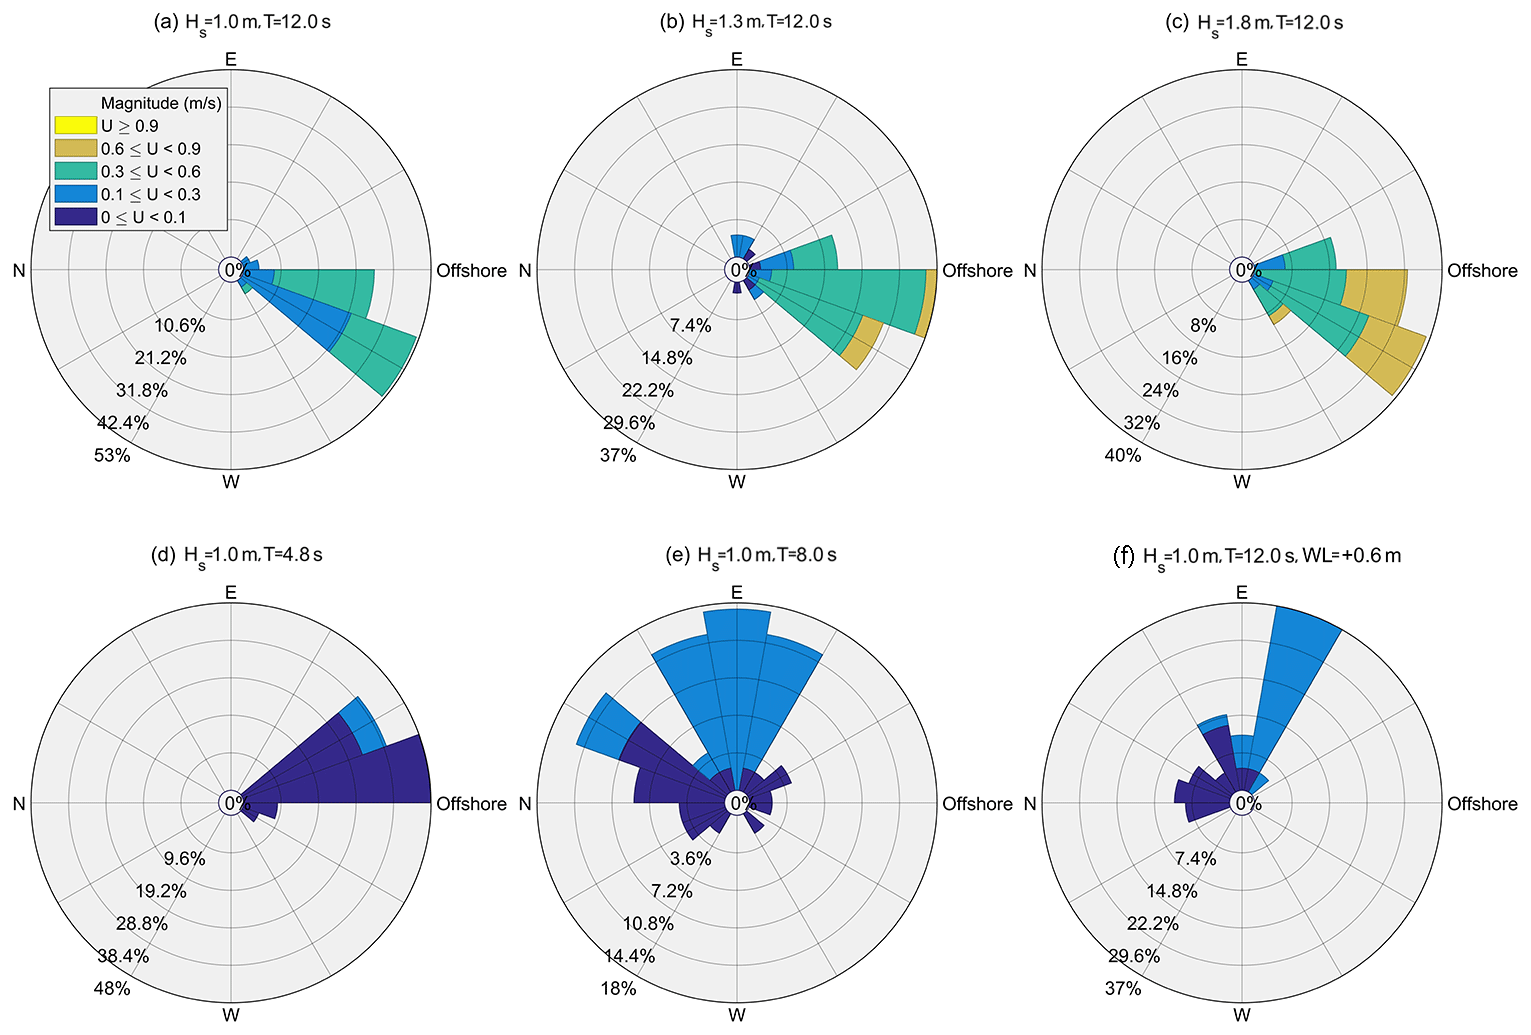
Figure 5Rip current rose diagrams of rip currents forced by different wave conditions and tidal levels at positions x= 730 m and y= 120 m marked as Gauge A in Fig. 1f. Each spoke denotes the direction that the current flows to. The offshore direction is labeled in each diagram. T1 and T7–T8 are not included.
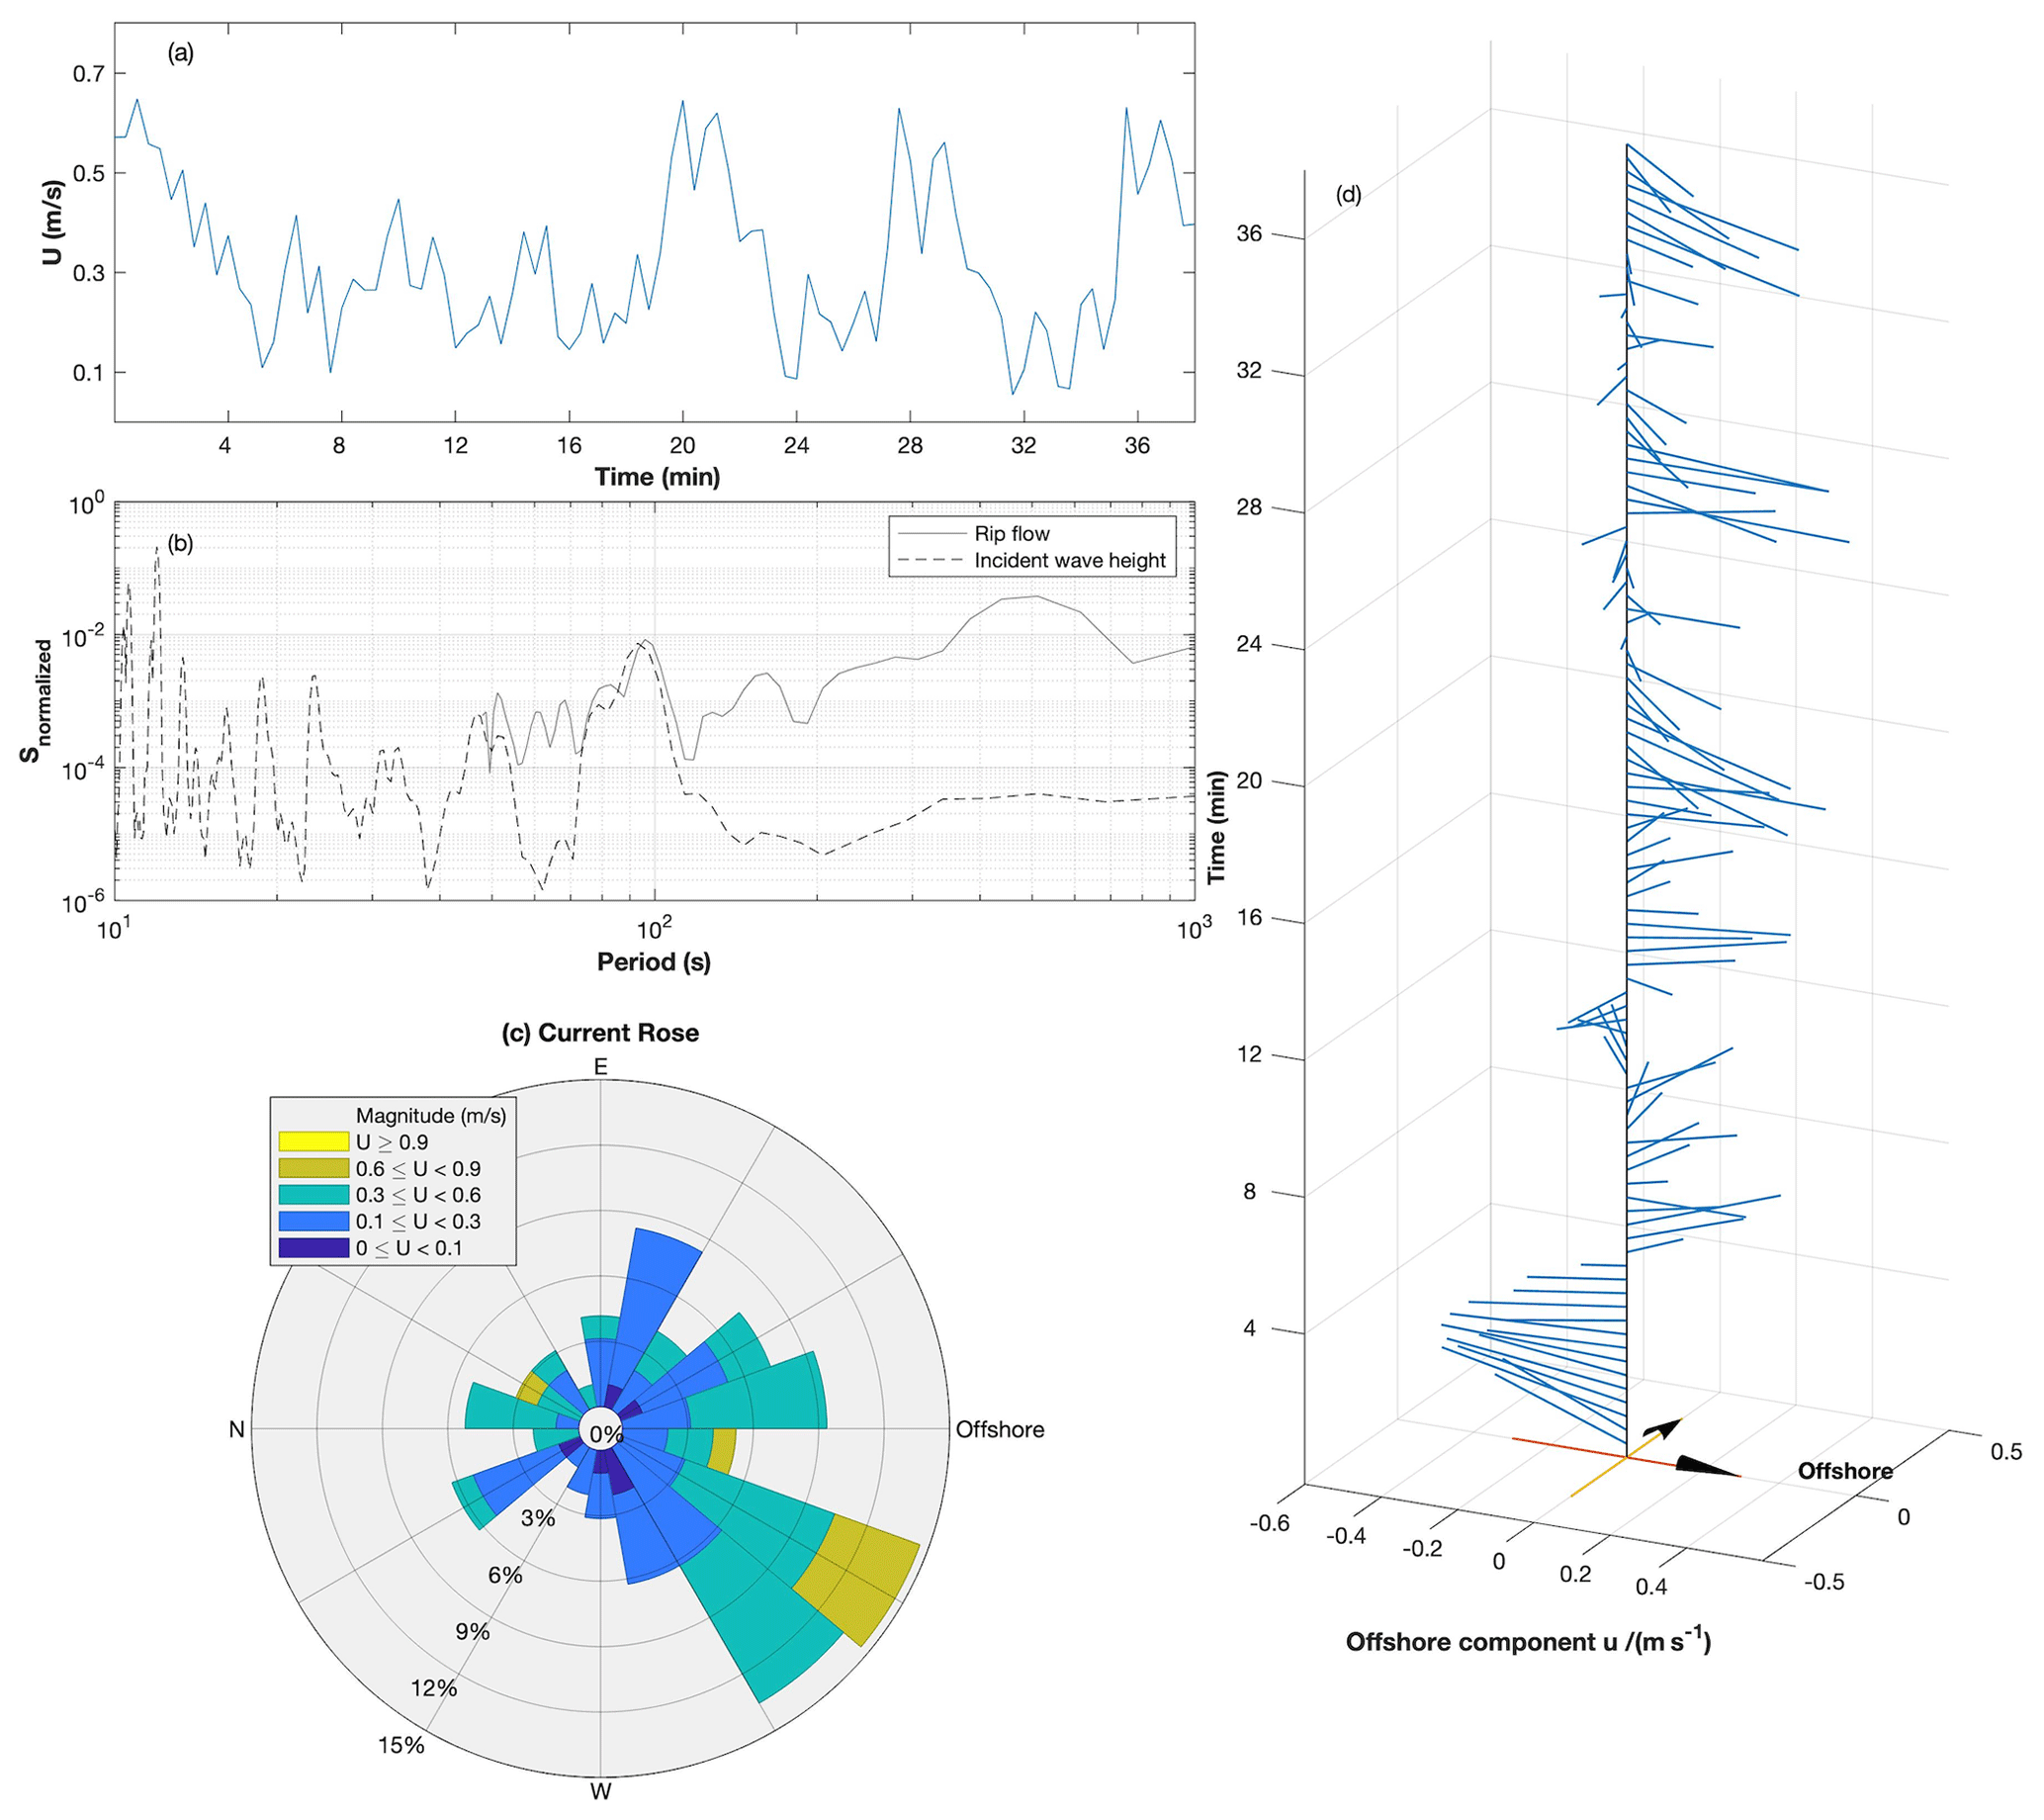
Temporal variation in rip currents is closely related to the forcing mechanisms and local bathymetry features (Reniers et al., 2010). We placed a group of gauges at well-formed sandbars and rip channels along the shore with an output interval of 2 s. The majority of gauges show periodic fluctuations in flow magnitude and direction at multiple temporal scales. Fig. 6 illustrates analysis on time series of Gauge B within a rip channel (x= 1060 m, y= 105 m of bathymetry on 7 August 2018). The rip flow exhibits an intermittent, periodic nature with the flow direction oscillating from side to side in the channel. Normalized power spectra of the modeled current (gray line) are plotted in panel (b). The spectra show a broad-banded feature, with two prominent peaks occurring at T= 80–100 s and 8–10 min, which correspond to period bands of infragravity pulsations and very-low-frequency (VLF) motions, respectively. The incident wave groups have been known as the main cause of rip fluctuations at the infragravity band (MacMahan et al., 2004a, b). The time series of incident wave height confirms the existence of the wave group effect, and its power spectrum (dashed line in Fig. 6b) shows an energy peak at 80–100 s. Within a wave group, the arrival of higher waves breaks and produces a greater wave setup over bars, which results in a stronger pressure gradient, and expels excess water offshore through an intensified rip flow. This effect contributes to a velocity variation of 0.1–0.2 m s−1 in Gauge B. The presence of VLF motions can not be explained by wave forcing due to the absence of a spectral peak at the corresponding period band. By observing the rose diagram and vector plot of rip flow in panels (c)–(d), the VLF motions are characterized by the periodic shift of the flow direction, which is usually related to the formation of vortex due to local morphology. Moreover, while infragravity wave group fluctuation is permanent for all gauges, VLF motions are only present in some of them. It is expected that swimmers in a weak rip current system at a specific time may be caught in strong flow soon afterwards due to the sporadic nature of rip currents.
4.2 Rip hazard maps
Using the rip hazard index table proposed in Sect. 3.3, rip hazard is interpreted quantitatively by an integration of rip strength and duration at each grid point. Therefore, rip hazard levels are representative of both offshore-directed flow velocity and its persistence. In Fig. 7, the spatial distribution of rip hazard levels is overlapped with the satellite images acquired on 7 August 2018 and 26 December 2019. Grid points with depth less than 0.8 m are masked.
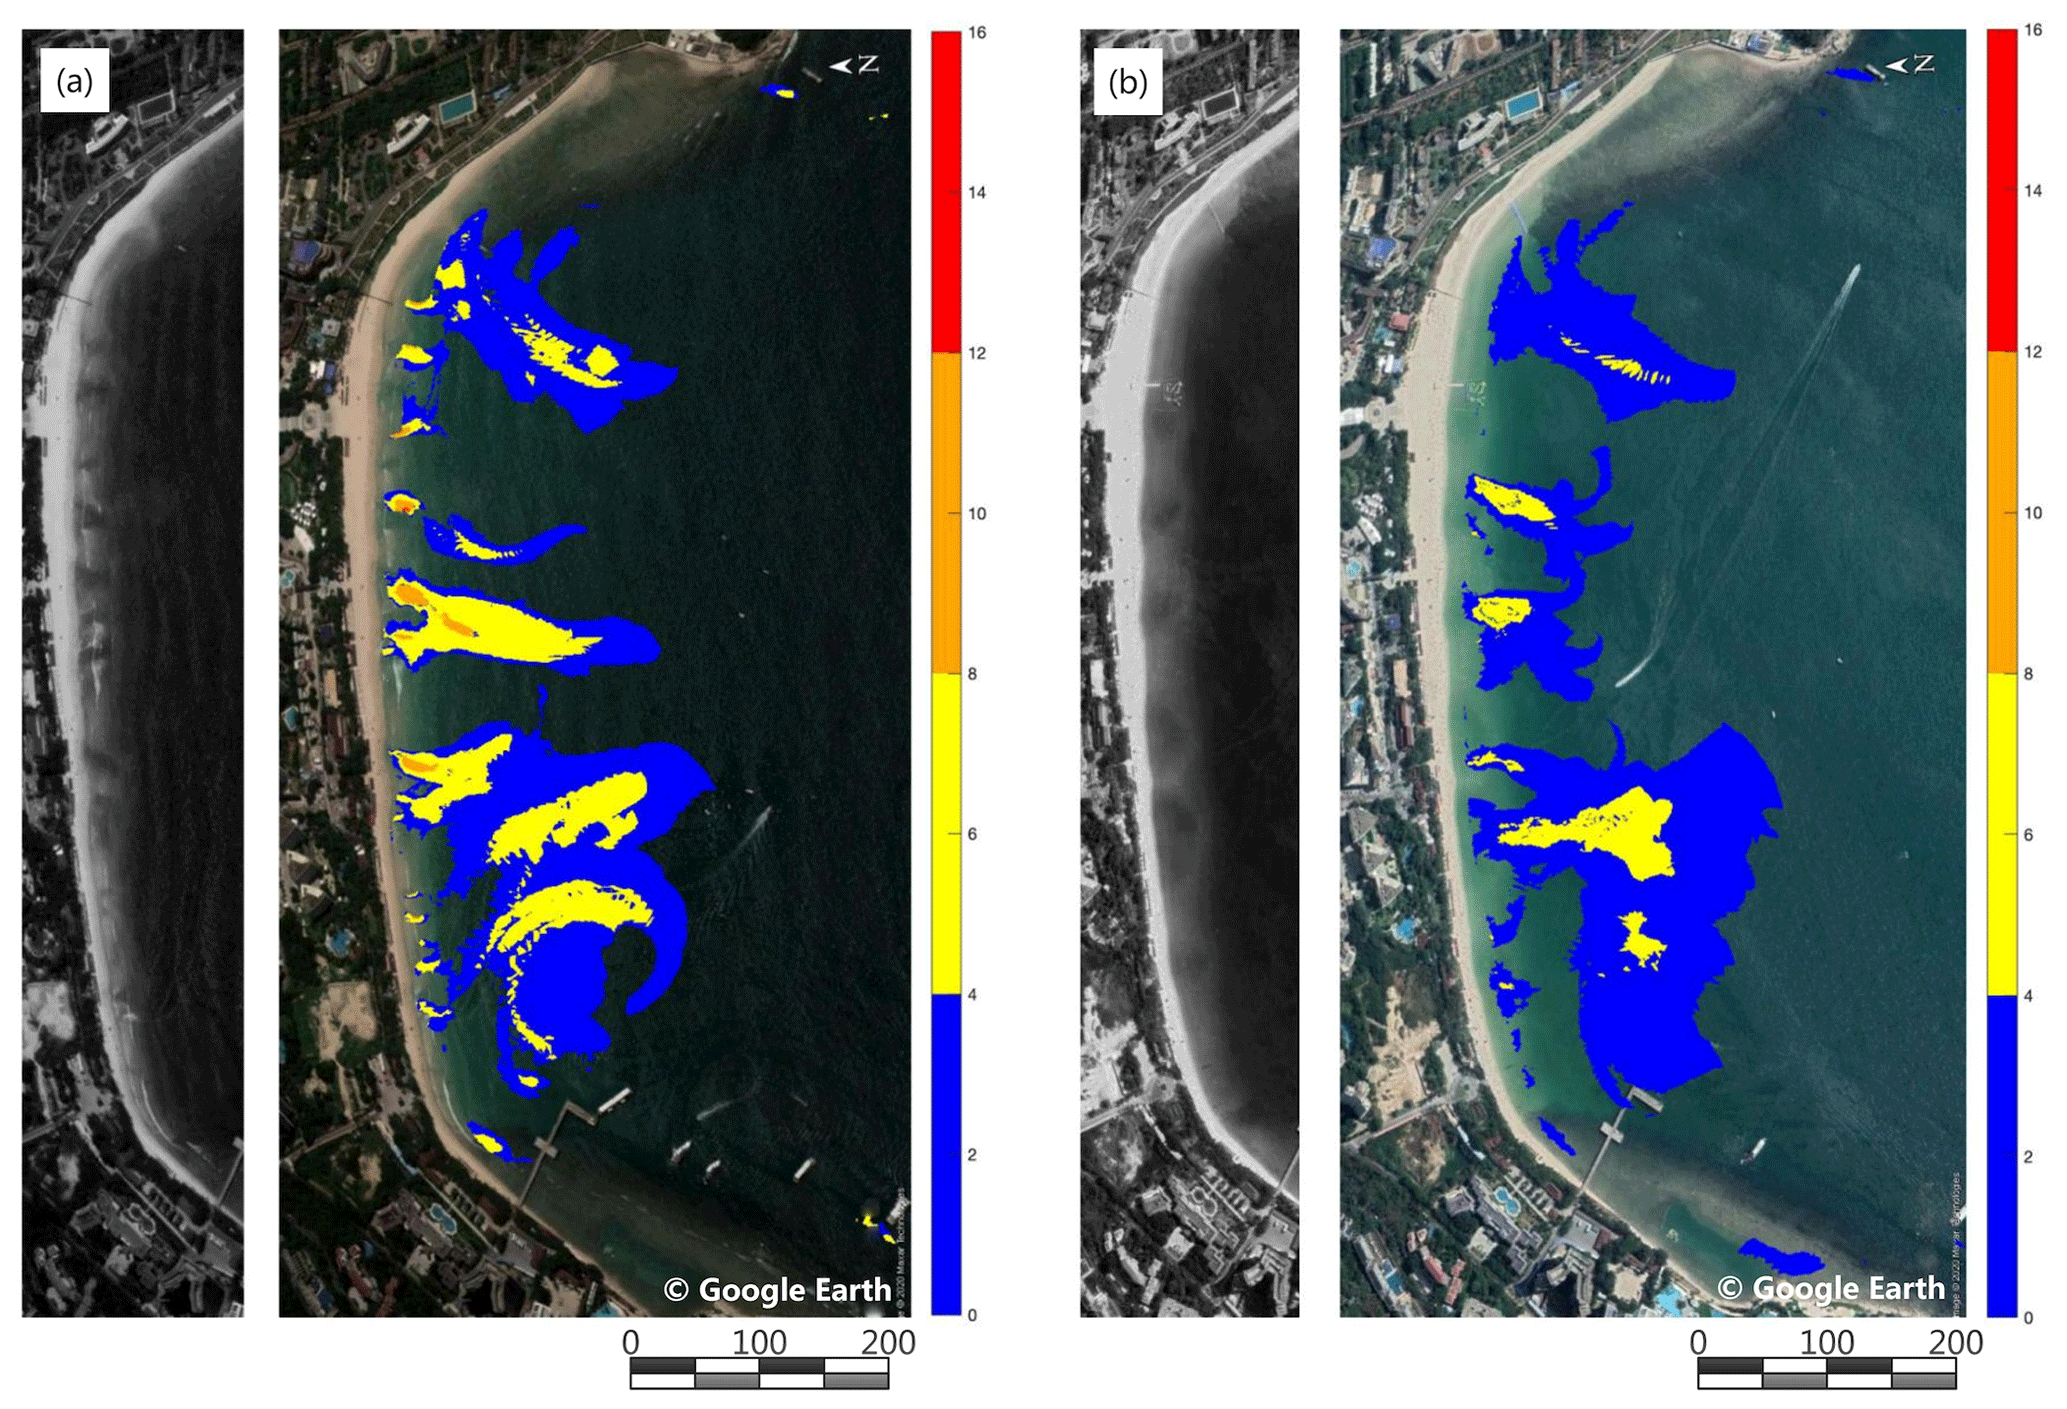
Figure 7Rip hazard maps for shore-normal incident waves of Hs= 1.0 m and Tp= 12 s (corresponding to T2 with mean tidal level) on Dadonghai beach, using bathymetry on 7 August 2018 (a) and 26 December 2019 (b).
Overall, as shown in Fig. 7, strong rip currents originate from the rip channels or troughs. A close examination of panel (a) finds that the area of white foam is staggered with rip necks. Rip hazard with transverse-bar morphology (panel a) can produce a higher hazard level of Grade II. Strong rips can potentially rapidly eject swimmers seaward with the maximum extent of 100–200 m. Due to the existence of a mega-rip that originated from the deflected longshore currents at both flanks of the embayment (x= 400 and 1400 m in Figs. 3–4), the area of the Grade-III rip hazard spreads more than 200 m seaward. Swimmers who are caught in the deflected longshore currents may exit the surf zone unawares.
In this study, by using the Nvidia A100 graphic card, a maximum speedup of 8–10 fold is achievable using FUNWAVE-GPU, compared with a 36-core Intel CPU node. A modeling of beach-scale wave propagation, breaking, and associated nearshore circulation can be completed within 10 min (Yuan et al., 2020). Recently the WAM6 spectral wave model (The Wamdi Group, 1988) has been modified and accelerated by OpenACC by the authors (WAM6-GPU; source code can be accessed upon request). The computation time for a 5 d ∘ wave modeling of the Chinese offshore regions (0–45∘ N, 95–135∘ E) on the Nvidia A100 card is dramatically reduced to approximately 5 min. By feeding the FUNWAVE-GPU with 2D directional spectrum data obtained from the basin-scale spectral wave modeling, or simply specifying peak wave parameters and tidal levels, it is possible to generate real-time rip hazard maps with fine resolution when nearshore bathymetry is available. It is helpful for beach safety practitioners to deploy rescues appropriately.
4.3 Swimmer escape simulations
Virtual swimmers seeded in Area 1 and Area 2 with different escape strategies are traced by an instantaneous, wave-resolving velocity with wave forcing conditions of Hs= 1.0 m and Tp= 12 s. The modeling results are shown in Figs. 9–12. Area 1 is a wide rip channel located between 860 and 1000 m of the longshore axis, as marked in Fig. 1f. The water depth is slightly shallower at the seaward exit of the channel. According to Fig. 4, Area 1 does not contain a typical underlying morphology to incubate strong rip currents. The flow magnitude and direction show a large degree of variability due to the formation of a strongly asymmetric counterclockwise eddy (CCE) within the channel during the simulation, which is supposed to retain swimmers within the surf zone for a longer time. Area 2 is characterized by several parallel longshore isobaths without obvious rip cells. Stable longshore currents exist in this area, which gradually deflect to the offshore direction at x= 500–600 m. Due to the fact that rip currents are unstable and oscillate on multiple timescales, a series of tracking simulations are conducted with virtual swimmers seeded at different model times with an interval of 150 s. As suggested by Fig. 8, the modeled trajectories of the virtual swimmers show considerable variability when choosing different seeding times, which accordingly results in variations in escape time tsafe histograms. Hereafter tsafe is the average of all simulations with different seeding times. Moreover, we also selected a typical rip channel for the modeling study of swimmers' escape. As the conclusion was similar to that of previous studies (McCarroll et al., 2015; Castelle et al., 2016a), the modeling result was not included in this paper.
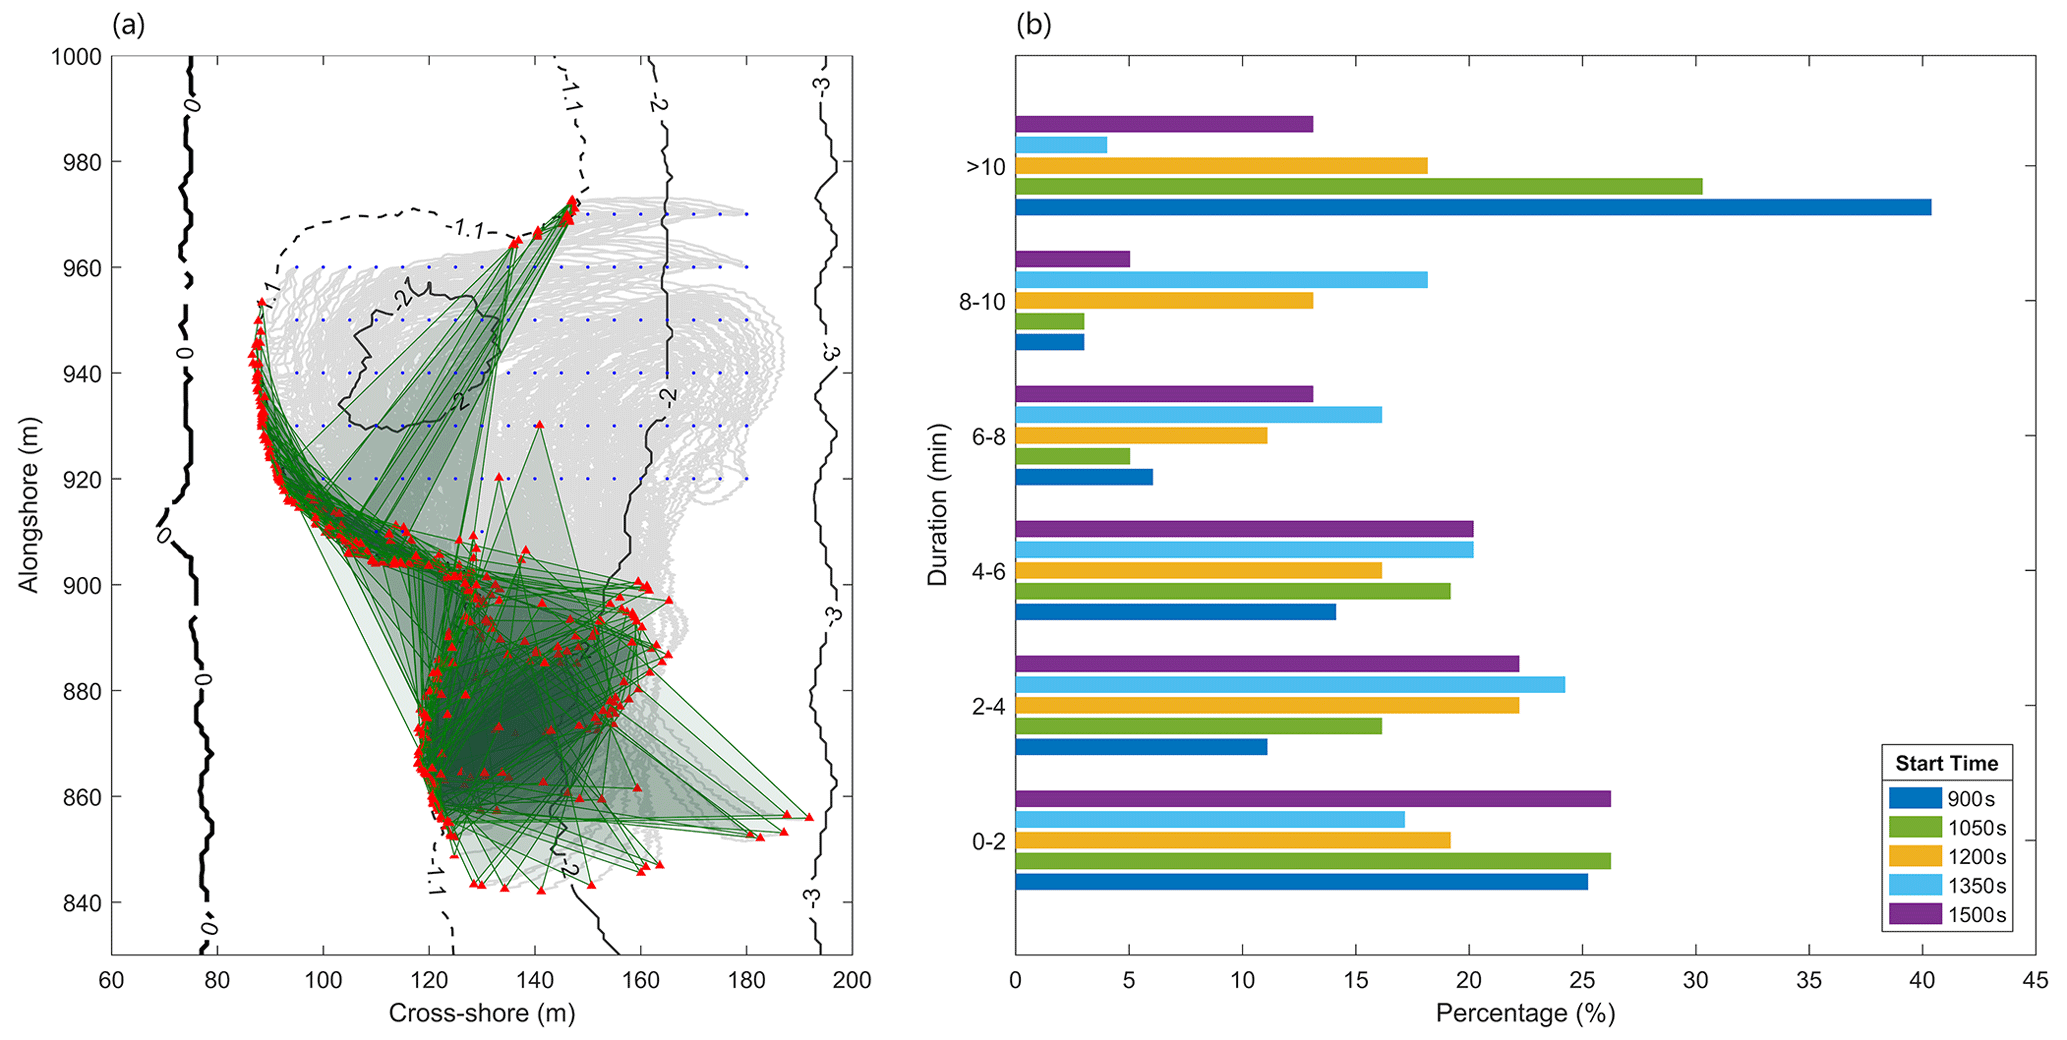
Figure 8Lagrangian tracking of the virtual swimmers seeded at five different modeling times (with an interval of 150 s from 900 to 1500 s) within Area 1 (a). Histograms of tsafe given in percentages of swimmers who have reached safety at each tsafe range are shown in panel (b). The initial seeding positions are marked by blue dots. At each position, the resulting five trajectories are plotted as light gray lines, with their ends (red triangles) connected by green lines. The shaded polygons are to highlight the variability in tracking outcomes. The surf-zone bathymetry is contoured with black lines.
4.3.1 Stay afloat
Swimmers adopting the stay afloat strategy are subject to an ambient current field (McCarroll et al., 2015; Castelle et al., 2016a). In Area 1, rip flow is relatively weak in strength and oscillates in direction due to the existence of a recirculating flow regime. The majority of floaters are trapped in the eddy, with their trajectories exhibiting complex vortical patterns. Most of them eventually exit the surf zone after 10 min floating. Only a few floaters are transported to the western sandbar within 10 min, where it is safe to stand and walk to shore for adults (Fig. 9a–b). In Area 2 where the intense longshore flow is dominant due to the presence of headland with submerged coral reefs, over 90 % of the floaters are swept eastward along the isobaths and eventually expelled offshore at x= 400–500 m (Fig. 9e–f). The swimmers who are not aware of these strong longshore jets may gradually and unconsciously be dragged away from the surf zone. Generally, adults have a slightly higher chance of survival than children.
Swimming and floating actions are two sides of the same coin when swimmers notice that they are caught in a rip. Swimming against the flow may result in muscular fatigue and cramps, especially for beginners, while adopting a floating strategy can save energy and increase the possibility of being rescued. For rhythmic bar–trough beaches, floating or swimming parallel is supposed to be a reasonable choice, which helps the swimmers escape from the rip jets and reach the proximate sandbars safely. However, according to the modeling study of Areas 1 and 2, using the stay afloat strategy alone is obviously an unwise action, suggested by the failure rate of over 90 %. The alongshore variability in underwater topography increases the complexity of the flow regime. There is no versatile escape strategy even on the same beach.
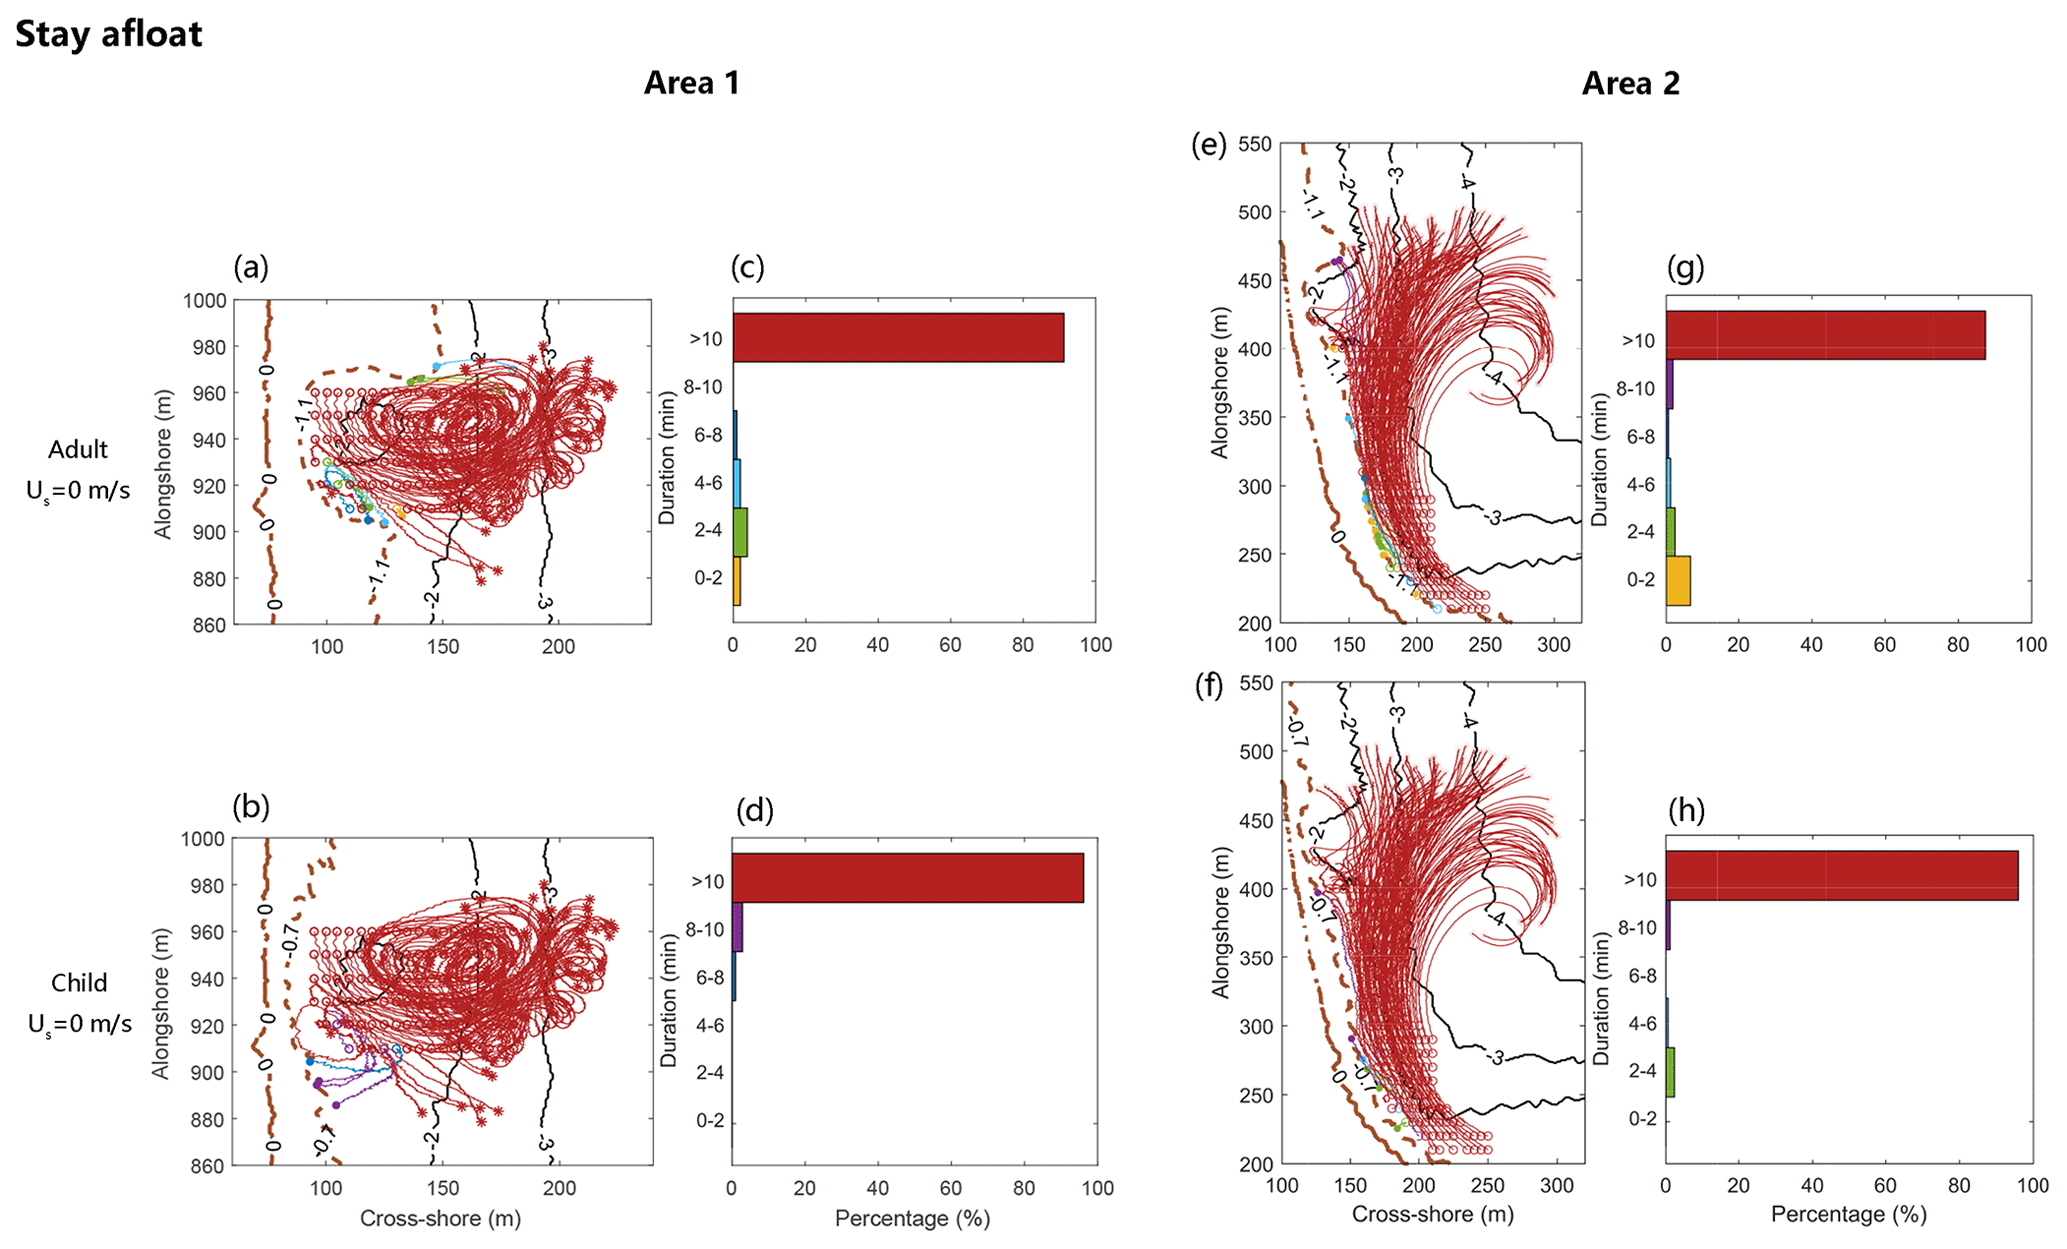
Figure 9Swimmer-tracking simulations for the stay afloat strategy within Area 1 (a, b) and Area 2 (e, f). Histograms of tsafe give the percentages of swimmers who have reached safety at each tsafe range. The trajectories of swimmers have colors corresponding to bins in each histogram. The surf-zone bathymetry is contoured with solid black lines and dashed brown lines (0, 0.7, and 1.1 contour lines).
4.3.2 Swim onshore
Swimming onshore is thought to be instinctual for survival from the rip currents for most swimmers. In Area 1, 100 % of skilled swimmers with onshore swimming velocity Us= 0.4 m s−1 can reach safety in less than 8 min (Fig. 10b, e). The tsafe value depends on the distance of the swimmer to a safe depth (dsafe= 1.1 m for adults), as well as their initial position within the surf zone. It takes longer for swimmers seeded between x= 920 and 940 m to reach the safe depth as they need to swim against the CCE inside the trough. Any hesitation or interrupted swimming may lower the chance of survival even for skilled swimmers. The recirculating flow is hazardous for children due to their weaker swimming ability and the longer distance to a safe depth (dsafe= 0.7 m). On average, the failure rate is over 50 %. Most failures occur at the rip neck and downdrift of the rip eddy. In Area 2, almost all the bathers with different swimming abilities can reach safety within a relatively short time. Obviously for bathers caught in a longshore current, swimming onshore is the best choice. Generally, adopting the swim onshore strategy seems quite successful. However, for swimmers caught in the offshore-directed jet of a typical rip flow system, a combination of actions of swimming parallel and onshore should be a more optimal strategy than swimming onshore alone.
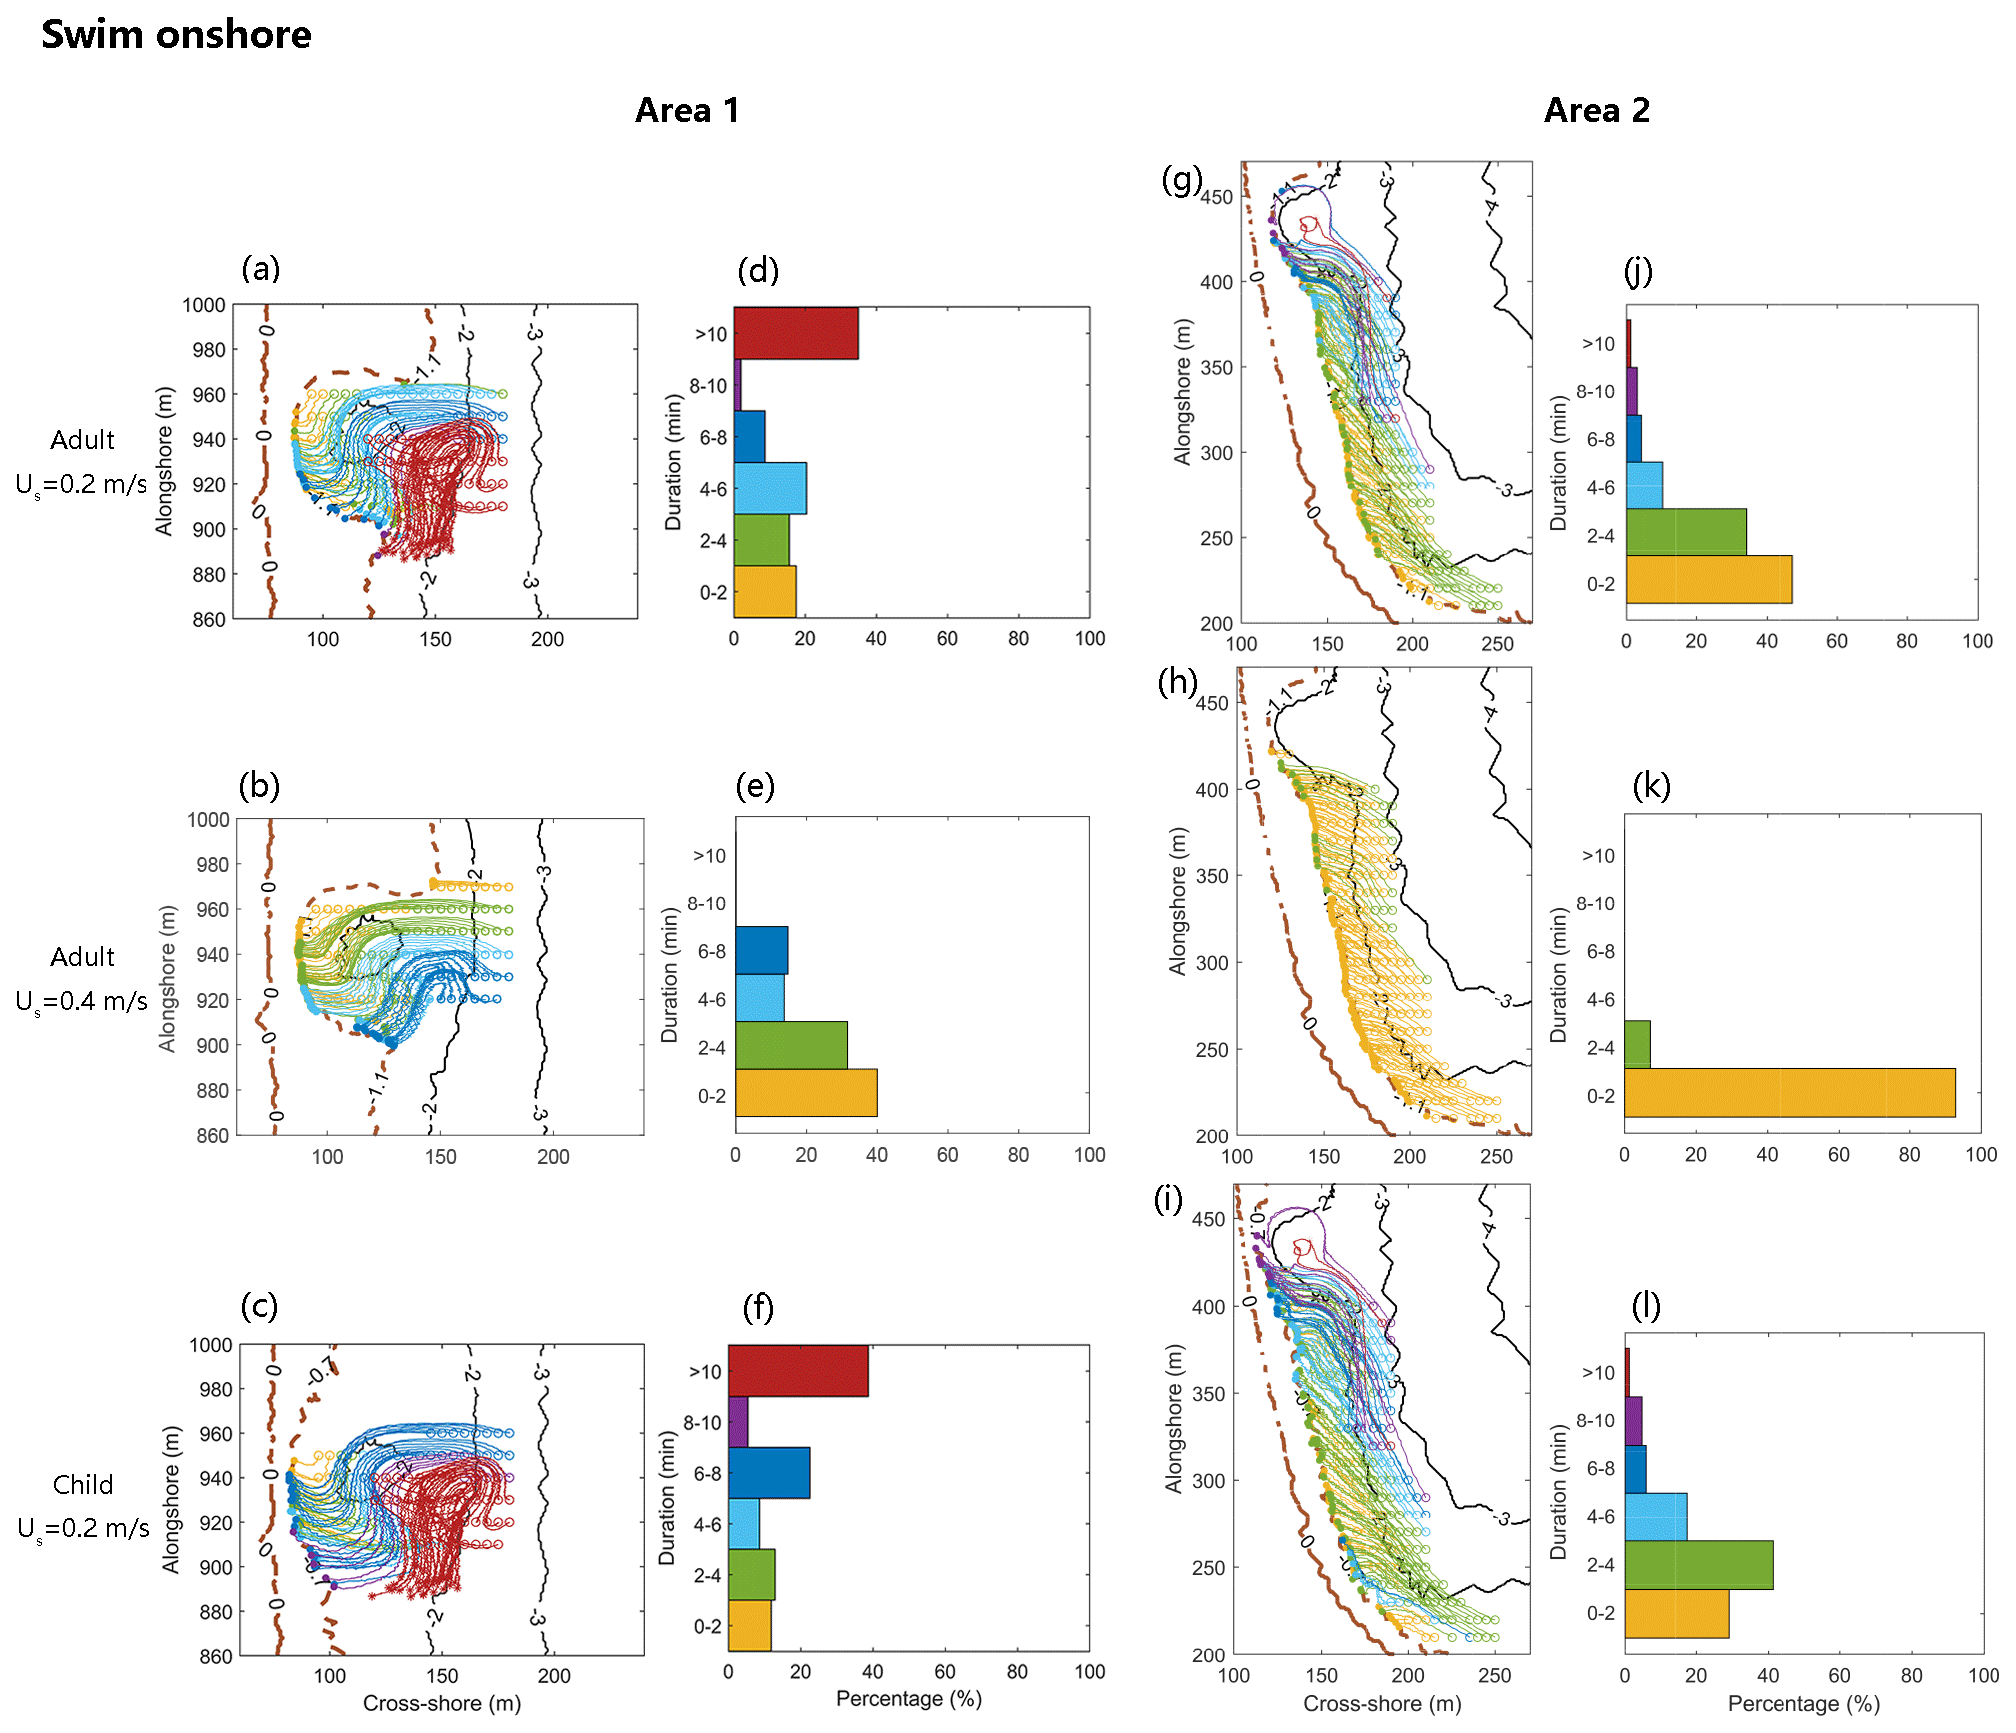
Figure 10Swimmer-tracking simulations for the swim onshore strategy within Area 1 (a–c) and Area 2 (g–i). Histograms of tsafe give the percentages of swimmers who have reached safety at each tsafe range. The trajectories of swimmers have colors corresponding to bins in each histogram. The surf-zone bathymetry is contoured with solid black lines and dashed brown lines (0, 0.7, and 1.1 contour lines).
4.3.3 Swim parallel to the shore
The success rate of swimming parallel to the shore is largely subject to the specific locations of bathers and their swimming direction relative to the current. As shown in Fig. 11, for bathers seeded in the CCE-dominated Area 1, only those within the inner surf zone can reach the downdrift sandbar and are able to stand firmly by themselves. However, some beginner bathers or children who swim westward across the CCE are swept slightly offshore by the meandering rip current and then fail to reach the western sandbar (Fig. 11a, c). When caught in the rip currents, the first priority is to escape from the jet as soon as possible. In Area 1, some beginner bathers who swim eastward against the flow are at greater risk of being stuck in the CCE, which is clearly observed by the circular trajectory in Fig. 12a. Though these bathers are seeded in the inner surf zone, they fail to reach safety within 10 min by choosing an inappropriate swimming direction. In Area 2 (Fig. 11g–i), the eastward longshore current is gradually intensified and deflected offshore from x = 200 m to 400 m. Over 60 % of bathers with above-average swimming ability can reach the safe depth by swimming against the flow. All the bathers that swim eastward are quickly carried away by the deflected current, and the result is not shown in Fig. 12. Employing the swim parallel to the shore strategy alone can not increase the rate of survival in the study. The odds are heavily against the bathers who choose a wrong direction.
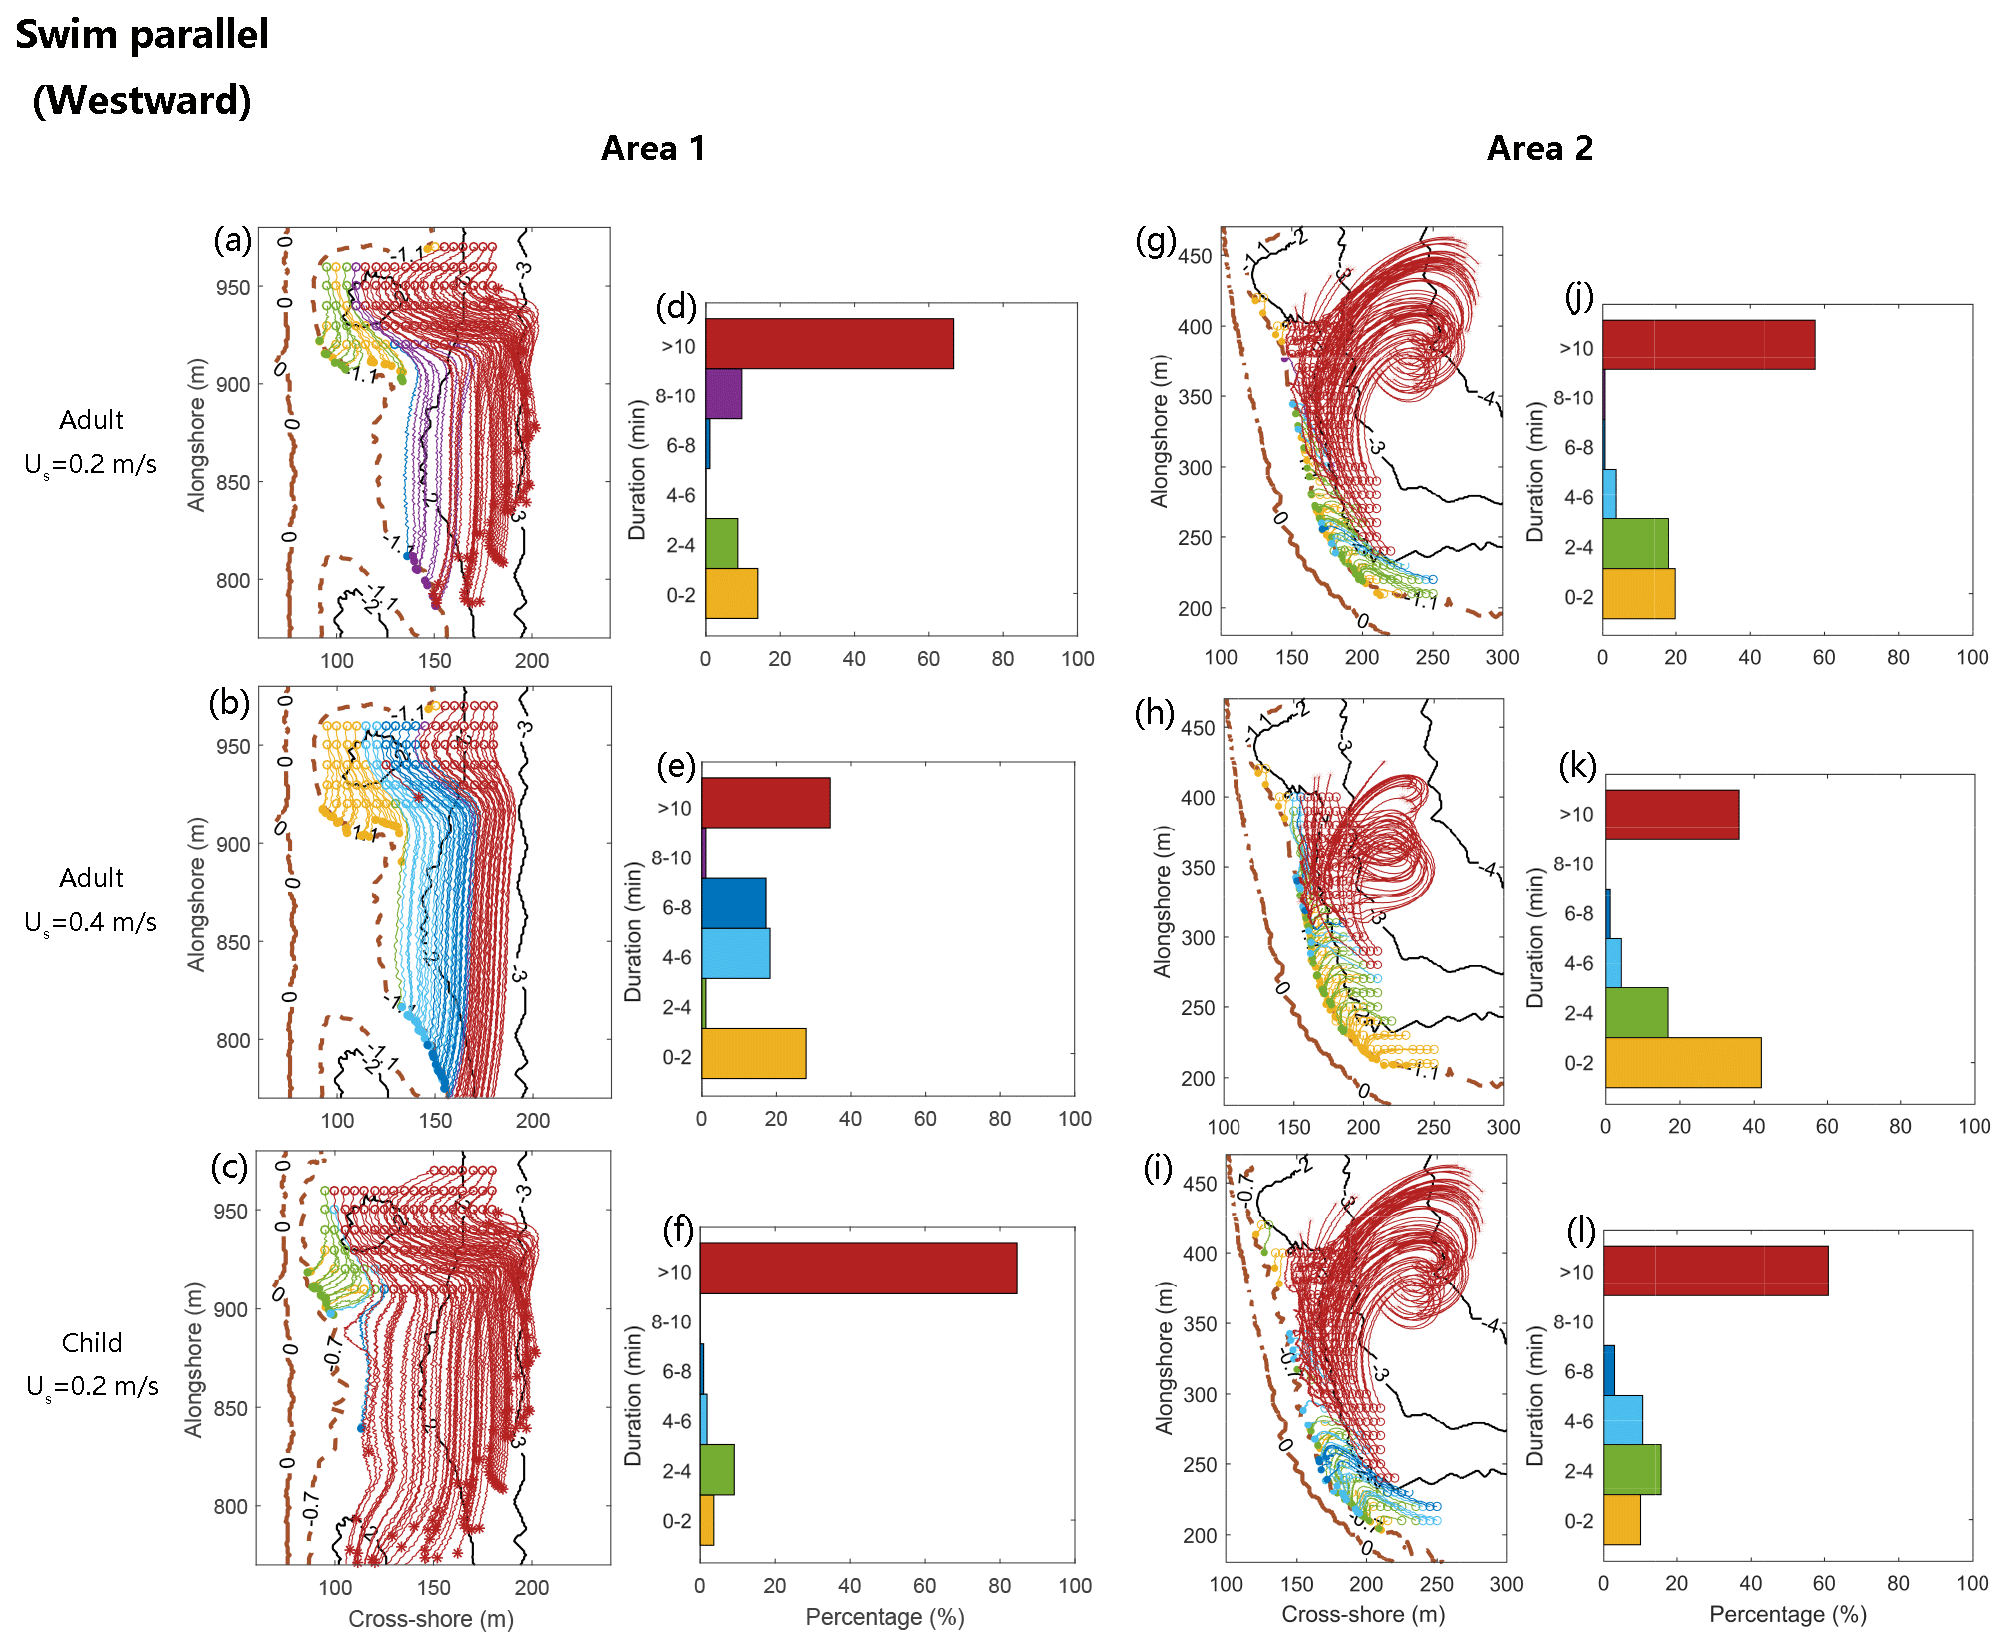
Figure 11Swimmer-tracking simulations for the swim westward parallel to the shore strategy within Area 1 (a–c) and Area 2 (g–i). Histograms of tsafe give the percentages of swimmers who have reached safety at each tsafe range. The trajectories of swimmers have colors corresponding to bins in each histogram. The surf-zone bathymetry is contoured with solid black lines and dashed brown lines (0, 0.7, and 1.1 contour lines).
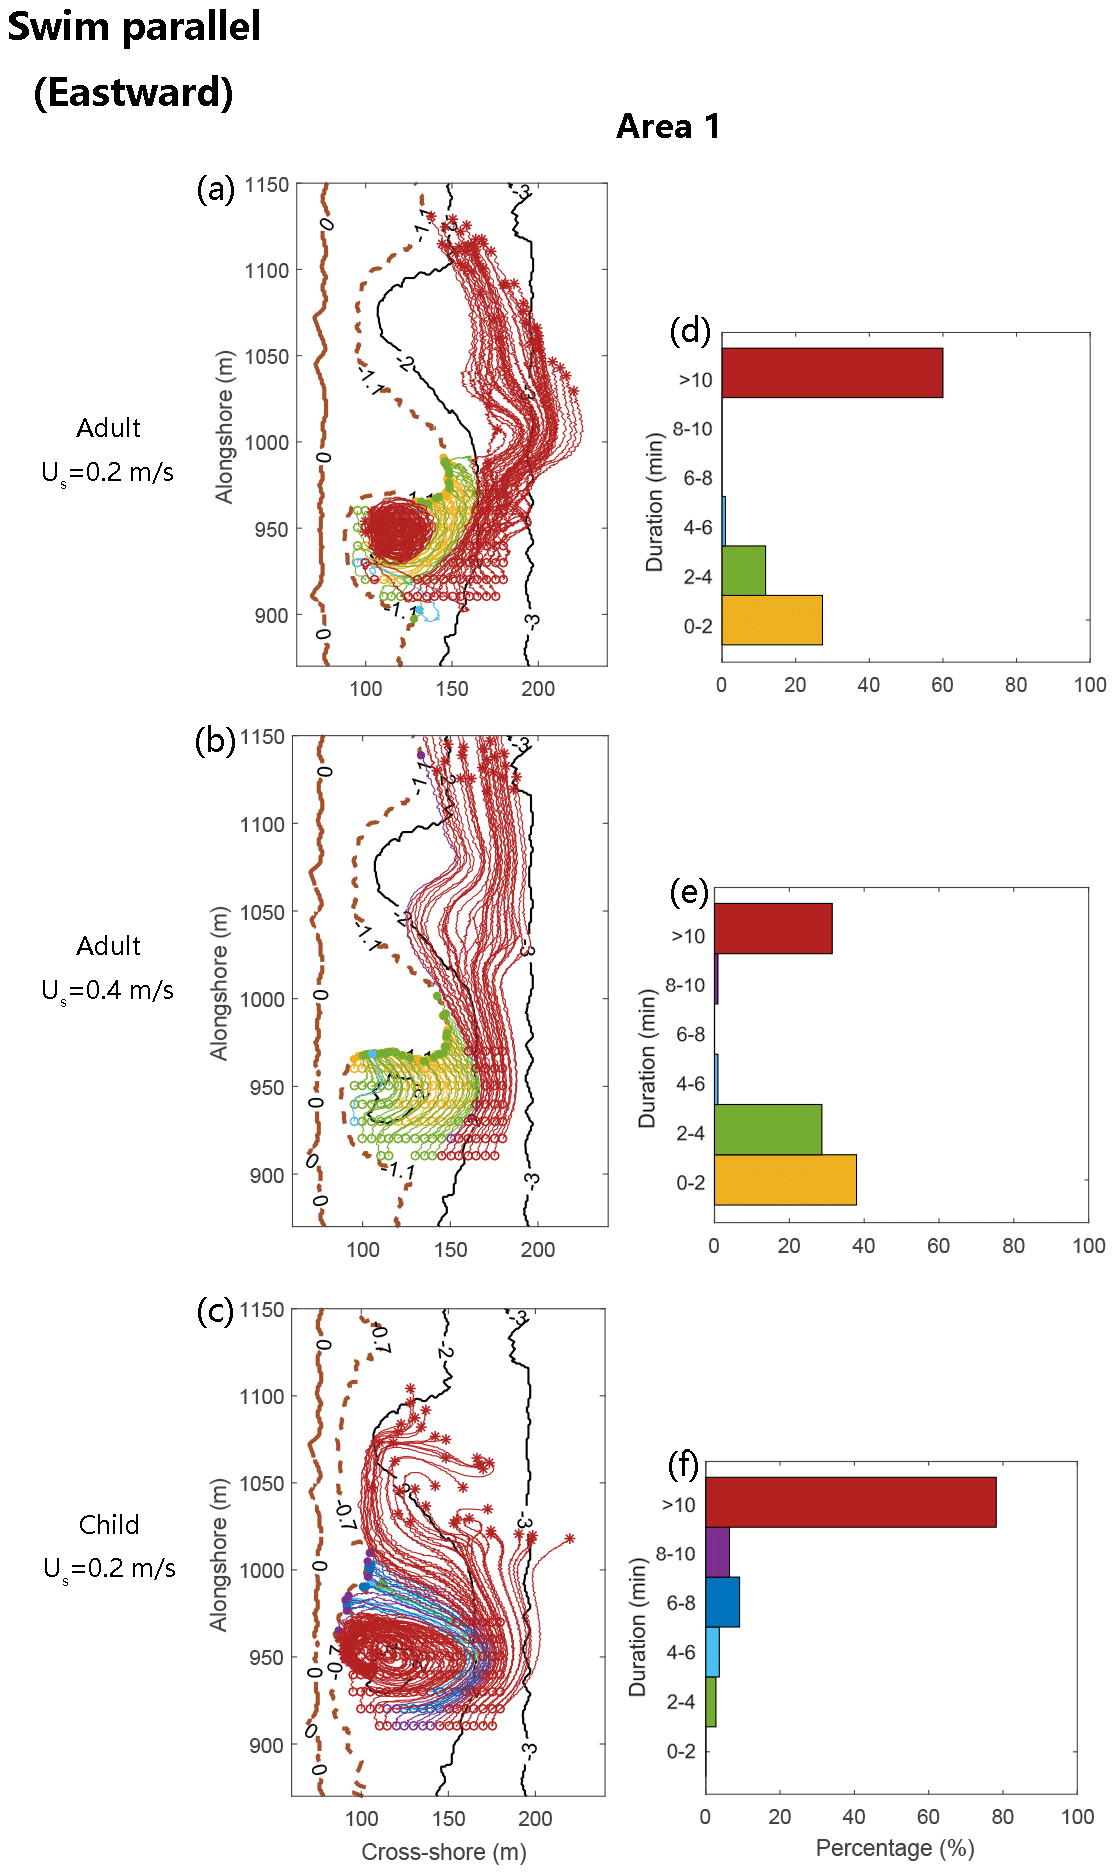
Figure 12Swimmer-tracking simulations for the swim eastward parallel to the shore strategy within Area 1. Histograms of tsafe give the percentages of swimmers who have reached safety at each tsafe range. The trajectories of swimmers have colors corresponding to bins in each histogram. The surf-zone bathymetry is contoured with solid black lines and dashed brown lines (0, 0.7, and 1.1 contour lines).
5.1 Escape strategy summary
The nearshore circulation along the 2 km long Dadonghai beach consists of steady longshore currents that originate from both headlands and multiple rip cells pulsating in strength at different timescales. Both types of flows can be hazardous. For swimmers within the inner surf zone, either swim onshore or swim parallel to the beach can be a wise strategy to escape from the rip flow, while the stay afloat action may carry the swimmer further away from the inner surf zone. Generally a typical rip current ranges from 10–30 m wide. Even a beginner swimmer can reach the neighboring sandbars within 2 min (Figs. 11–12). However, for swimmers located in the outer surf zone, the chance of survival decreases substantially by taking swim parallel actions alone. Although many rip hazard outreach activities advocate swim parallel to the beach as the primary escape strategy, swim onshore seems to be the most successful strategy across all the scenarios in this study. An average swimmer is capable of reaching the safe depth even from the outer surf zone by sustained strokes (Figs. 10). It should be noted that the rip strength is moderate (0.2–0.4 m s−1 on average) for the specified wave conditions in Area 1. In contrast, the modeling results of Castelle et al. (2016a) indicate that failures of the swim onshore strategy occur in the rip neck where swimmers are stuck in the channel due to strong offshore-directed jets.
The stay afloat action can be a viable and energy-saving strategy if the swimmers are within the surf zone with a lower exit rate. In this case, most of the swimmers can drift with the circulation cells and remain nearshore. MacMahan et al. (2010) reported that only 19 % of the wave drifters deployed in the rip currents exited the surf zone per hour. A 2 d observation conducted by Gallop et al. (2018) found that the exit rates, however, are highly variable from 6 % to 71 %, depending on the incoming wave breaking and pulsation of surf-zone currents. The results of this study indicate that the surf-zone exit rate is significantly higher in this embayed beach, and adopting the stay afloat action alone is not a wise strategy, with a high risk of being expelled to deeper water (Castelle and Coco, 2013).
Moreover, the pulsation of rip currents in wide rip channels can form swirls or eddies which can also be hazardous to beginner swimmers or children, especially for those swimming eastwards against the CCE in Area 1. Failure rates of 60 % and 78 % are observed for beginner swimmers (Us=0.2 m s−1) and children. This suggests that the space between sandbars is also an important factor to be considered. In the longshore current-dominated nearshore area, the swim onshore strategy is undoubtedly the optimal action. The mean duration to safety is only 1.2 min for an average swimmer.
5.2 Lagrangian tracking by wave-resolving and mean flow velocities
In FUNWAVE-TVD, the random directional wave field is generated by using an internal wavemaker. It is basically an interior source term which integrates wave components split by frequency and direction and with random phases (Wei et al., 1999). The input for the wavemaker can be either wave bulk parameters (i.e., peak wave height and period) or the TMA (Texel–Marsden–Arsloe) shallow-water spectrum. In this study, swimmers are tracked by instantaneous velocity at the time interval △t of 0.04 s, rather than the wave-averaged velocity (i.e., averaging phase-resolving velocity over 24 s). It results in jagged trajectories shown in Figs. 9–12. Due to the random nature of the wave field, the trajectory of each seeded swimmer is composed of a slow meander that exhibits a mean flow pattern and a much faster random oscillation at a wave timescale. One remaining question is whether wave-resolving and mean flow tracing of individual swimmers can reproduce consistent trajectories and whether the difference between the trajectories can be ignored so that it does not affect the conclusion of the escaping modeling in the study. In Fig. 13, a 10 min tracking of virtual swimmers by instantaneous and wave-averaged velocity is illustrated with two overlapped curves (light and dark gray lines). The ends of each pair of trajectories are connected by orange lines. Fig. 13a–b suggest that the resolving wave scale in the Lagrangian tracking produces comparable statistical results of escape time (tsafe) with those using the mean flow velocity in general (Fig. 13c–d). Nevertheless, the effect of wave randomness on individual trajectories can be observed, which results in different floating paths for a few virtual swimmers (denoted by long orange line segments).
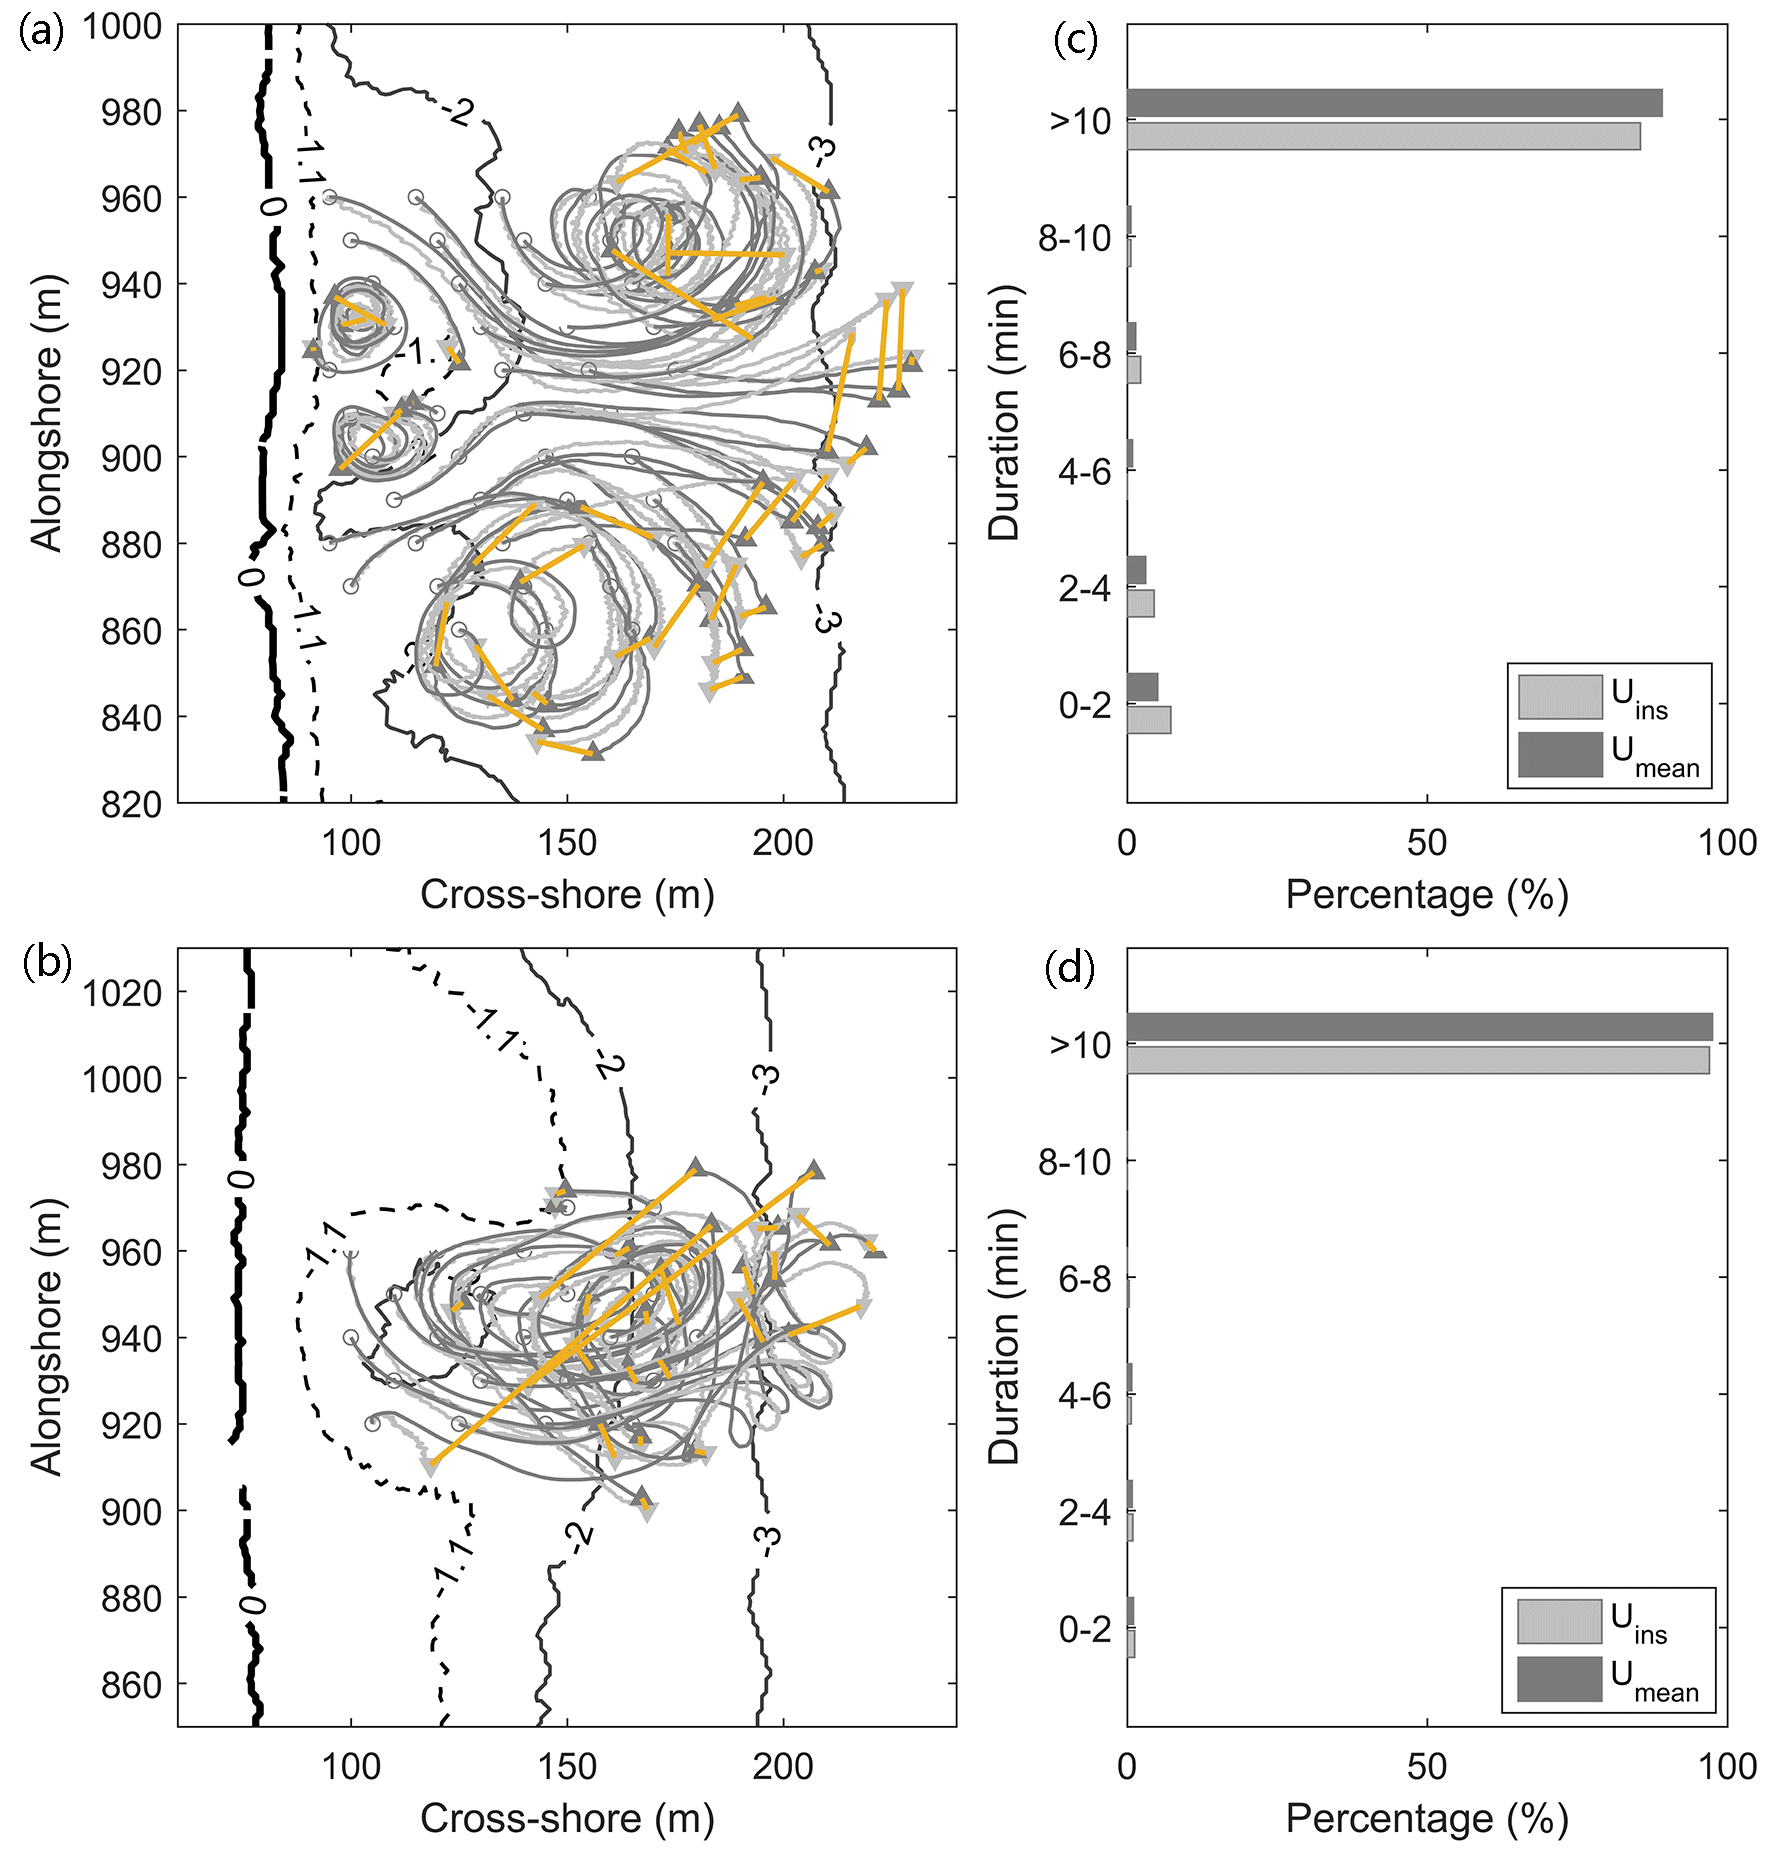
Figure 13The 10 min swimmer-tracking simulations by instantaneous velocity (light gray line with the start and end marked by open circles and solid triangles) and 24 s averaged mean velocity (dark gray line), respectively. The ends of each pair of trajectories are connected by orange lines to denote the difference in tracking. The surf-zone bathymetry obtained in 2018 (a) and 2019 (b) in Area 1 is used, which is overlapped by black contour lines. Histograms of tsafe (c, d) give the percentages of swimmers who have reached safety at each tsafe range. Uins and Umean denote the instantaneous and wave-averaged velocity, respectively.
5.3 Sensitivity analysis of the wave-following factor cf
In Eq. (1), a coefficient controlling how well a swimmer drifts with the ambient wave-induced flows is defined as the wave-following factor cf. A value of 0.8 is assigned following previous studies (McCarroll et al., 2015; Castelle et al., 2016a). However, this value has not been well calibrated by field research. A sensitivity study of the factor is carried out in this modeling study by varying its value from 0.4 to 1.0 with an interval of 0.2. Among these values, cf=1.0 denotes swimmers that float perfectly with the flow when swimming actively, while cf=0.4 means they are less influenced by the ambient flows. Swimmer-tracking simulations with varying cf values for the swim onshore strategy within Area 1 are conducted, and the modeling results are summarized in Fig. 14. A constant onshore swimming velocity of 0.2 m s−1 is adopted.
In Fig. 14, the prominent feature is that the number of swimmers who fail to reach safety decreases as the floating factor is assigned to smaller values (trajectories and bars in red in the figure). In the case of cf=0.4, almost all seeded swimmers can escape from the rip eddy and swim to safe areas in less than 10 min, even for those seeded at the rip neck and downdrift of the rip eddy. However, the failure rate can reach over 40 % if the floating factor of 1.0 is set in the tracking module. The results of this sensitivity analysis highlight the uncertainties in the tracking simulations. It is essential to calibrate this coefficient in future field studies.
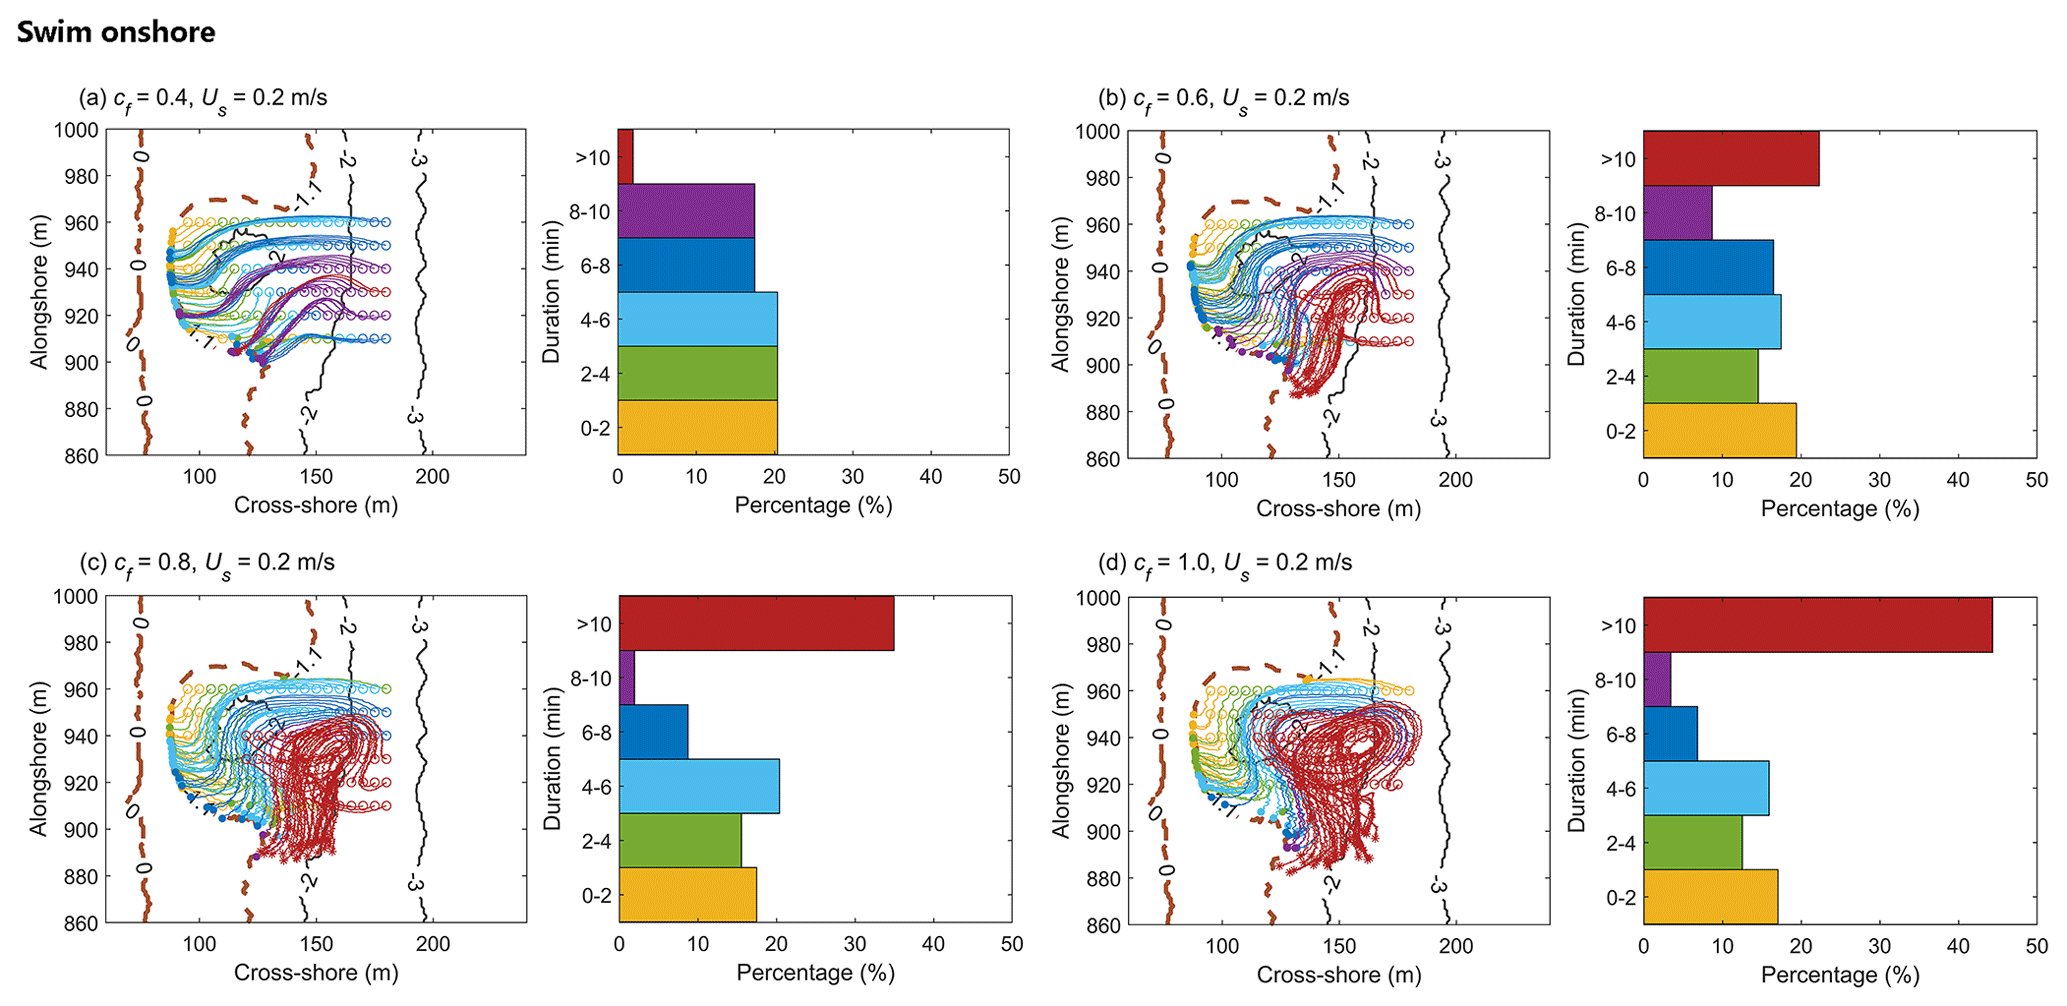
Figure 14Sensitivity study of the floating factor cf by varying its value from 0.4 to 1.0 with an interval of 0.2 (a–d). Swimmer-tracking simulations for the swim onshore strategy within Area 1 are listed on the left of each figure, and histograms of tsafe are on the right. Virtual swimmers have a constant onshore swimming velocity of 0.2 m s−1.
This paper presents the results of a Boussinesq modeling of rip hazards and escape strategies on an embayed recreational beach with a grid resolution of 1 m. Discussions have in particular focused on the variability in rip currents, how wave-resolving tracking of virtual swimmers differs from that using mean flow velocity, and the sensitivity of tracking results to the wave-following factor cf.
The beach stage plays an important role in the occurrence and strength of rip currents (Dalrymple et al., 2011). The surf-zone bathymetry obtained in 2018 and 2019 exhibits different beach stages. The modeling results show that shore-connected transverse bars with incised, narrow rip channels are favorable for strong rip cells, while the crescentic bars separated by rip troughs with shallow exits generate more complex yet slightly weaker nearshore circulations. A series of Boussinesq modeling indicates that rip current strength is closely related to several incoming wave properties, including wave height, peak period, and incident angles. Tidal level also exhibits a modulating effect on rip strength. The results agree with previous studies on variability in rip currents. Spectral analysis of the output time series shows that rip currents fluctuate on the orders of 1 and 10 min, which reflects the effects of wave group and VLF motions. The pulsation of rip currents affects beach safety.
Quantitatively estimated rip hazard has been enabled by the high-resolution modeling of nearshore circulation. In this study we defined a four-level rip hazard index based on a combination of rip flow strength and its duration. With the state-of-the-art GPU computation facility, operational forecasting of rip hazard level is now possible within 20 min based on the FUNWAVE-GPU embedded into the GPU-accelerated spectral wave model on a commercially available PC.
The outcomes of the modeling demonstrate that multiple factors contribute to the survival of swimmers caught in the rip currents, including surf-zone bathymetry, rip strength, flow patterns, the bather's position, and swimming ability. Considering the temporal and spatial variability in nearshore circulation, neither strategy is 100 % successful, and a combination of different actions is necessary for specific occasions. For weak-to-moderate rip currents and longshore currents, swim onshore consistently seems to be the most successful strategy across all the scenarios in this study. For swimmers within the inner surf zone, the success rate of employing either swim onshore or swim parallel to the beach strategies is satisfactory. To reduce risk at the shoreline, simply educating the public to stay inside the inner surf zone and enter the water with buoyancy is a basic rule. The stay afloat action can be a viable and energy-saving strategy if the swimmers are within the surf zone with a lower exit rate. However, floating generally resulted in longer swimming times to safety with higher variability compared to swimming parallel or onshore. The surf-zone exit rates are highly variable depending on individual beach stages and incoming wave conditions. Our results indicate that adopting the stay afloat action alone may lower the chance of escape, and swimmers suffer a high risk of being expelled to deeper water. Moreover, the pulsation of rip currents in wide rip channels can form swirls or eddies which can also be hazardous to swimmers with weak swimming ability. This suggests that the space between sandbars is also an important factor to be considered. Psychological factors also contribute to one's ability to escape a rip, which is not discussed in this study.
There are two primary types of models that are used to simulate surf-zone flows. While the majority of the rip current studies used shortwave-averaged models, in this study we used the Boussinesq model which required higher grid resolution to resolve wave crests. Wave-resolving Lagrangian tracking helps us understand the effect of wave randomness on surf-zone flows and bathers' trajectories. It should be noted that a lack of field observations largely limits our analysis of fine-scale rip current dynamics at Dadonghai beach. Moreover, a sensitivity study on the assignment of wave-following coefficients of virtual swimmers cf showcases large uncertainties in the Lagrangian tracking simulations in the study, which also urges a comprehensive field campaign on rip currents and associated hazards in the future in this rip-prone area.
The FUNWAVE-TVD with the modified Lagrangian tracking module used in this work is available at https://doi.org/10.5281/zenodo.8378792 (Yuan, 2023a). The FUNWAVE-GPU can be accessed at https://doi.org/10.5281/zenodo.3692120 (Yuan, 2020). For academic access to the GPU-accelerated third-generation spectral wave model WAM6-GPU, please contact Ye Yuan (yuanye@nmefc.cn).
The bathymetry data used for this study are available at https://doi.org/10.5281/zenodo.8378792 (Yuan, 2023b).
The paper was written by YY. FUNWAVE-TVD was GPU accelerated by YY while visiting the University of Delaware in 2019. The computation and visualization were carried out by HY. FY conceived the research. The surf-zone bathymetry was mapped by YG using satellite images obtained from Google Earth. BL and CX processed the wave analysis data.
The contact author has declared that none of the authors has any competing interests.
Publisher’s note: Copernicus Publications remains neutral with regard to jurisdictional claims made in the text, published maps, institutional affiliations, or any other geographical representation in this paper. While Copernicus Publications makes every effort to include appropriate place names, the final responsibility lies with the authors.
We sincerely thank the reviewers and editors for their contributions to the revision of this article. We also thank Zhiyu Liu of Xiamen University, China, for providing valuable advice during the preparation of the paper.
This work has been supported by the Innovative Youth Talents program, Ministry of Natural Resources of China, and the National Science and Technology Major Project of China (grant no. 2016YFC14015).
This paper was edited by Mauricio Gonzalez and reviewed by Camilo Jaramillo and one anonymous referee.
Arun Kumar, S. V. V. and Prasad, K. V. S. R.: Rip current-related fatalities in India: a new predictive risk scale for forecasting rip currents, Nat. Hazards, 70, 313–335, https://doi.org/10.1007/s11069-013-0812-x, 2014. a
Bowen, A. J.: Rip currents: 1. Theoretical investigations, J. Geophys. Res., 74, 5467–5478, https://doi.org/10.1029/JC074i023p05467, 1969. a
Brewster, B. C., Gould, R. E., and Brander, R. W.: Estimations of rip current rescues and drowning in the United States, Nat. Hazards Earth Syst. Sci., 19, 389–397, https://doi.org/10.5194/nhess-19-389-2019, 2019. a
Brighton, B., Sherker, S., Brander, R., Thompson, M., and Bradstreet, A.: Rip current related drowning deaths and rescues in Australia 2004–2011, Nat. Hazards Earth Syst. Sci., 13, 1069–1075, https://doi.org/10.5194/nhess-13-1069-2013, 2013. a
Castelle, B. and Coco, G.: Surf zone flushing on embayed beaches, Geophys. Res. Lett., 40, 2206–2210, https://doi.org/10.1002/grl.50485, 2013. a
Castelle, B., McCarroll, R. J., Brander, R. W., Scott, T., and Dubarbier, B.: Modelling the alongshore variability of optimum rip current escape strategies on a multiple rip-channelled beach, Nat. Hazards, 81, 663–686, https://doi.org/10.1007/s11069-015-2101-3, 2016a. a, b, c, d, e, f, g
Castelle, B., Scott, T., Brander, R., and McCarroll, R.: Rip current types, circulation and hazard, Earth-Sci. Rev., 163, 1–21, https://doi.org/10.1016/j.earscirev.2016.09.008, 2016b. a
Castelle, B., Scott, T., Brander, R., McCarroll, R. J., Tellier, E., de Korte, E., Tackuy, L., Robinet, A., Simonnet, B., and Salmi, L. R.: Wave and tide controls on rip current activity and drowning incidents in Southwest France, J. Coastal. Res., 95, 769–774, https://doi.org/10.2112/SI95-150.1, 2020. a, b, c
Chen, Q., Dalrymple, R. A., Kirby, J. T., Kennedy, A. B., and Haller, M. C.: Boussinesq modeling of a rip current system, J. Geophys. Res.-Oceans, 104, 20617–20637, https://doi.org/10.1029/1999jc900154, 1999. a, b
Chen, Q., Kirby, J. T., Dalrymple, R. A., Shi, F., and Thornton, E. B.: Boussinesq modeling of longshore currents, J. Geophys. Res.-Oceans, 108, 3362, https://doi.org/10.1029/2002JC001308, 2003. a, b
Dalrymple, R. A., MacMahan, J. H., Reniers, A. J., and Nelko, V.: Rip currents, Annu. Rev. Fluid Mech., 43, 551–581, https://doi.org/10.1146/annurev-fluid-122109-160733, 2011. a, b, c, d
Dusek, G. and Seim, H.: A probabilistic rip current forecast model, J. Coastal Res., 29, 909–925, https://doi.org/10.2112/JCOASTRES-D-12-00118.1, 2013. a
Engle, J., MacMahan, J., Thieke, R. J., Hanes, D. M., and Dean, R. G.: Formulation of a rip current predictive index using rescue data, Proc. 15th Annual Natl. Conf. on Beach Preservation Technology, Florida Shore and Beach Preservation Association, https://www.semanticscholar.org/paper/Formulation-of-a-Rip-Current-Predictive-Index-Using-Engle-MacMahan/73a788263e0f5ad97d3c996329e2fa35d08e7ecb (last access: 14 November 2023), 23–25 January, 2002. a
Eom, H., Yun, J. H., Jeong, C. K., Seo, J. W., and You, S. H.: Introduction to KMA operational forecasting system for rip current, J. Coastal Res., 72, 63–68, https://doi.org/10.2112/SI72-012.1, 2014. a
Feddersen, F.: The generation of surfzone eddies in a strong alongshore current, J. Phys. Oceanogr., 44, 600–617, https://doi.org/10.1175/JPO-D-13-051.1, 2014. a
Gallop, S., Bryan, K., Pitman, S., Ranasinghe, R., and Harrison, S.: Rip current circulation and surf zone retention on a double barred beach, Mar. Geol., 405, 12–22, https://doi.org/10.1016/j.margeo.2018.07.015, 2018. a
Geiman, J. D., Kirby, J. T., Reniers, A. J. H. M., and MacMahan, J. H.: Effects of wave averaging on estimates of fluid mixing in the surf zone, J. Geophys. Res.-Oceans, 116, C04006, https://doi.org/10.1029/2010JC006678, 2011. a, b
Kennedy, A. B., Chen, Q., Kirby, J. T., and Dalrymple, R. A.: Boussinesq modeling of wave transformation, breaking, and runup. I: 1D, J. Waterway Port Coast., 126, 39–47, https://doi.org/10.1061/(ASCE)0733-950X(2000)126:1(39), 2000. a
Kim, I., Lee, J., and Lee, J.: Verification of rip current simulation using a two-dimensional predictive model, HAECUM, J. Coastal Res., 65, 726–730, https://doi.org/10.2112/SI65-123.1, 2013. a
Kirby, J. T.: Boussinesq models and their application to coastal processes across a wide range of scales, J. Waterway Port Coast., 142, 03116005, https://doi.org/10.1061/(ASCE)WW.1943-5460.0000350, 2016. a
Li, Z.: Rip current hazards in South China headland beaches, Ocean Coast. Manage., 121, 23–32, https://doi.org/10.1016/j.ocecoaman.2015.12.005, 2016. a, b
Li, Z. and Zhu, S.: Why there are so many drowning accidents happened at Dadonghai Beach, Hainan, China: morphodynamic analysis, J. Coastal Res., 85, 741–745, https://doi.org/10.2112/SI85-149.1, 2018. a
MacMahan, J., Brown, J., Brown, J., Thornton, E., Reniers, A., Stanton, T., Henriquez, M., Gallagher, E., Morrison, J., Austin, M. J., Scott, T. M., and Senechal, N.: Mean Lagrangian flow behavior on an open coast rip-channeled beach: A new perspective, Mar. Geol., 268, 1–15, https://doi.org/10.1016/j.margeo.2009.09.011, 2010. a
MacMahan, J. H., Reniers, A. J. H. M., Thornton, E. B., and Stanton, T. P.: Infragravity rip current pulsations, J. Geophys. Res.-Oceans, 109, C01033, https://doi.org/10.1029/2003JC002068, 2004a. a
MacMahan, J. H., Reniers, A. J. H. M., Thornton, E. B., and Stanton, T. P.: Surf zone eddies coupled with rip current morphology, J. Geophys. Res.-Oceans, 109, C07004, https://doi.org/10.1029/2003JC002083, 2004b. a
MacMahan, J. H., Thornton, E. B., and Reniers, A. J.: Rip current review, Coast. Eng., 53, 191–208, https://doi.org/10.1016/j.coastaleng.2005.10.009, 2006. a, b
Masselink, G. and Short, A. D.: The effect of tide range on beach morphodynamics and morphology: a conceptual beach model, J. Coastal Res., 9, 785–800, 1993. a
McCarroll, R. J., Brander, R. W., MacMahan, J. H., Turner, I. L., Reniers, A. J., Brown, J. A., Bradstreet, A., and Sherker, S.: Evaluation of swimmer-based rip current escape strategies, Nat. Hazards, 71, 1821–1846, https://doi.org/10.1007/s11069-013-0979-1, 2014. a
McCarroll, R. J., Castelle, B., Brander, R., and Scott, T.: Modelling rip current flow and bather escape strategies across a transverse bar and rip channel morphology, Geomorphology, 246, 502–518, https://doi.org/10.1016/j.geomorph.2015.06.041, 2015. a, b, c, d, e, f, g, h
Radermacher, M., de Schipper, M., and Reniers, A.: Sensitivity of rip current forecasts to errors in remotely-sensed bathymetry, Coast. Eng., 135, 66–76, https://doi.org/10.1016/j.coastaleng.2018.01.007, 2018. a
Reniers, A. J. H. M., MacMahan, J. H., Beron-Vera, F. J., and Olascoaga, M. J.: Rip-current pulses tied to Lagrangian coherent structures, Geophys. Res. Lett., 37, L05605, https://doi.org/10.1029/2009GL041443, 2010. a, b
Shepard, F. P.: Undertow, Rip Tide or “Rip Current”, Science, 84, 181–182, https://doi.org/10.1126/science.84.2173.181, 1936. a
Shi, F., Kirby, J. T., Harris, J. C., Geiman, J. D., and Grilli, S. T.: A high-order adaptive time-stepping TVD solver for Boussinesq modeling of breaking waves and coastal inundation, Ocean Model., 43-44, 36–51, https://doi.org/10.1016/j.ocemod.2011.12.004, 2012. a, b, c
The Wamdi Group: The WAM model – a third generation ocean wave prediction model, J. Phys. Oceanogr., 18, 1775–1810, https://doi.org/10.1175/1520-0485(1988)018<1775:TWMTGO>2.0.CO;2, 1988. a
Tian, D., Zhang, H., Zhang, W., Zhou, F., Sun, X., Zhou, Y., and Ke, D.: Wave glider observations of surface waves during three tropical cyclones in the South China Sea, Water, 12, 1331, https://doi.org/10.3390/w12051331, 2020. a
Tonelli, M. and Petti, M.: Hybrid finite volume – finite difference scheme for 2DH improved Boussinesq equations, Coast. Eng., 56, 609–620, https://doi.org/10.1016/j.coastaleng.2009.01.001, 2009. a
Van Leeuwen, B. R., McCarroll, R. J., Brander, R. W., Turner, I. L., Power, H. E., and Bradstreet, A. J.: Examining rip current escape strategies in non-traditional beach morphologies, Nat. Hazards, 81, 145–165, https://doi.org/10.1007/s11069-015-2072-4, 2016. a
Wang, H., Zhu, S., Li, X., Zhang, W., and Nie, Y.: Numerical simulations of rip currents off arc-shaped coastlines, Acta Oceanol. Sin., 37, 21–30, https://doi.org/10.1007/s13131-018-1197-1, 2018. a
Wei, G., Kirby, J. T., and Sinha, A.: Generation of waves in Boussinesq models using a source function method, Coast. Eng., 36, 271–299, https://doi.org/10.1016/S0378-3839(99)00009-5, 1999. a
Wright, L. and Short, A.: Morphodynamic variability of surf zones and beaches: A synthesis, Mar. Geol., 56, 93–118, https://doi.org/10.1016/0025-3227(84)90008-2, 1984. a
Xu, Y., He, H., Song, J., Hou, Y., and Li, F.: Observations and modeling of typhoon waves in the South China Sea, J. Phys. Oceanogr., 47, 1307–1324, https://doi.org/10.1175/JPO-D-16-0174.1, 2017. a
Yuan, Y.: dryuanye/FUNWAVE-GPU: First release of FUNWAVE-GPU (v1.0), Zenodo [code], https://doi.org/10.5281/zenodo.3692120, 2020. a
Yuan, Y.: FUNWAVE-TVD source code with a modified Lagrangian tracking module to simulate swimmer escape strategies, Zenodo [code], https://doi.org/10.5281/zenodo.8378792, 2023a. a
Yuan, Y.: The bathymetry data of Dadonghai Bay, Zenodo [data], https://doi.org/10.5281/zenodo.8378792, 2023b. a
Yuan, Y., Shi, F., Kirby, J. T., and Yu, F.: FUNWAVE-GPU: Multiple-GPU Acceleration of a Boussinesq-Type Wave Model, J. Adv. Model. Earth Sy., 12, e2019MS001957, https://doi.org/10.1029/2019MS001957, 2020. a, b, c, d
Zhang, Y., Huang, W., Liu, X., Zhang, C., Xu, G., and Wang, B.: Rip current hazard at coastal recreational beaches in China, Ocean Coast. Manage., 210, 105734, https://doi.org/10.1016/j.ocecoaman.2021.105734, 2021. a
Zhang, Y., Shi, F., Kirby, J. T., and Feng, X.: Phase-resolved modeling of wave interference and its effects on nearshore circulation in a large ebb shoal-beach system, J. Geophys. Res.-Oceans, 127, e2022JC018623, https://doi.org/10.1029/2022JC018623, 2022. a, b