the Creative Commons Attribution 4.0 License.
the Creative Commons Attribution 4.0 License.
 | 27 Jan 2023
Assessing the relationship between weather conditions and rockfall using terrestrial laser scanning to improve risk management
Tom Birien
Francis Gauthier
Since 1987, more than 13 200 rockfalls have been inventoried by the ministère des Transports du Québec (MTQ) as having impacted the national road Route 132 in northern Gaspésie. This natural hazard represents a nearly permanent danger for road users. Traditional mitigation measures can be ineffective on poorly consolidated, deformed and highly fractured rockwalls such as those found in northern Gaspésie. To address this issue, implementing preventive risk management based on the factors that trigger rock instabilities could be the most effective method. Earthquake, rainfall and freeze–thaw cycles are commonly considered to be the main rockfall-triggering factors. This study aims to better understand the climatic conditions conducive to rockfalls in northern Gaspésie in order to provide knowledge to implement an appropriate risk management strategy. Three rockwalls were scanned with terrestrial laser scanning (TLS) instruments during specific pre-targeted weather conditions. Over a period of 18 months, 17 surveys have allowed us to identify 1287 rockfalls with a magnitude above 0.005 m3 on a scanned surface of 12 056 m2. In addition, meteorological instruments and a 550 cm thermistor string have been installed directly on a vertical rockwall. It appears that some weather conditions influence the occurrence, frequency and magnitude of rockfalls. In winter, rockfall frequency is 12 times higher during a superficial thaw than during a cold period in which temperature remains below 0 ∘C. In summer, rockfall frequency is 22 times higher during a heavy rainfall event than during a mainly dry period. Superficial freeze–thaw cycles (< 50 cm) cause mostly a high frequency of small-magnitude events, while deeper spring thaw (> 100 cm) results in a high frequency of large-magnitude events. The influence of weather conditions on rockfall frequency and magnitude is crucial in order to improve risk management, since large-magnitude events represent higher potential hazards. This study provides a classification of weather conditions based on their ability to trigger rockfalls of different magnitudes. This knowledge could be used to implement a risk management strategy.
- Article
(11733 KB) - Full-text XML
- BibTeX
- EndNote


Rockfall is hillslope movement in which blocks detach from the surface of rocky escarpments (Budetta, 2004; Michoud et al., 2012; Piteau and Peckover, 1978; Selby, 1993). Rock mass properties, such as lithology, degree of alteration, discontinuity network characteristics and slope, are predisposing factors in the occurrence, magnitude and failure mode (e.g. planar, wedge or toppling) of rock instabilities (e.g. Selby, 1993; Turner and Schustler, 1996). Although they are spontaneous, rockfalls result from the long-term interaction of a series of processes (Birien and Gauthier, 2022; Schovanec, 2020). They never result solely from the latest visible change (Draebing and Krautblatter, 2019; Gunzburger et al., 2005). Many factors can contribute to the development of rock instabilities, but two recur in the literature: precipitation and freeze–thaw cycles (e.g. Collins and Stock, 2016; Coutard and Francou, 1989; D'Amato et al., 2016; Hungr et al., 1999; Matsuoka and Sakai, 1999; Rapp, 1960; Wieczorek and Jäger, 1996).
While there is consensus in the literature on the influence of meteorological variables on rockfall, quantifying their respective roles is often difficult because they are challenging to differentiate (Schovanec, 2020). Studies of rockwall dynamics have long been complicated by the poor accessibility and dangerous nature of terrain (Abellán et al., 2014). The recent development of remote sensing techniques, particularly lidar (light detection and ranging), has considerably improved our ability to study rockwall dynamics (Abellán et al., 2014; Guerin et al., 2014; van Veen et al., 2017). Terrestrial laser scanning (TLS) makes it possible to carry out topographical surveys of vast areas with good accuracy and very high resolution (Abellán et al., 2014; Santana et al., 2012; Williams et al., 2018). By comparing the point clouds from several surveys, rock instabilities that occurred between the surveys (e.g. van Veen et al., 2017) and developing future instabilities (e.g. Kromer et al., 2018; Oppikofer et al., 2008, 2009; Royán et al., 2014) can be identified.
Given the unpredictability of rock instabilities, evasive action is near impossible when an event occurs (Volkwein et al., 2011). Rockfall is a daily occurrence in mountainous areas (Dorren, 2003; Laliberté et al., 2022). The literature describes many examples of the resulting infrastructure damage and human mortality (e.g. Badger and Lowell, 1992; Badoux et al., 2016; Bunce et al., 1997; Chau et al., 2003; Hilker et al., 2009; Porter and Orombelli, 1980). To reduce this risk to infrastructure and human life, a better understanding of this hazard is needed (Dorren, 2003; Erismann and Abele, 2001). TLS is a key tool in achieving that objective. It can help identify unstable rockwall portions that require monitoring (e.g. Kromer et al., 2018; Oppikofer et al., 2008; Royán et al., 2014) and improve our understanding of rockfall-triggering factors (e.g. Kromer et al., 2018; Oppikofer et al., 2008; Royán et al., 2014).
This study looks at the influence of weather conditions on the rockfall dynamics in Haute-Gaspésie (Quebec, Canada). Composed of Cloridorme Formation sedimentary rock (flysch) (Slivitzky et al., 1991), these rockwalls are poorly consolidated, deformed and highly fractured. Weidner and Walton (2021) showed that in similar geology in Colorado, mitigation activities including mechanical scaling, stabilization with reinforcement rock bolts, wire mesh installation and polyurethane resin injections could be ineffective. They even observed a higher frequency of rockfall after mitigation measures were implemented. Some measures, such as mechanical scaling, were unsuited to highly altered rockwalls. Following scaling operations, the newly exposed rockwall could be just as altered and unstable as the previously exposed surfaces. Traditional mitigation measures are ineffective on low- and moderate-magnitude (< 1 m3) instabilities, which correspond to the magnitude of instabilities caused by weather processes (Weidner and Walton, 2021; Wyllie and Mah, 2004). For highly altered rockwalls such as those found in Haute-Gaspésie, implementing hazard mitigation methods based on the factors that trigger rock instabilities could therefore be the most effective method of limiting hazards associated with rockfall (Laliberté et al., 2022).
Recent literature illustrates significant advances in our understanding of the impact of weather variables on rockfall (D'Amato et al., 2016; Delonca et al., 2014; Macciotta et al., 2015; Matsuoka, 2019; Pratt et al., 2019; Ravanel and Deline, 2011; Weidner and Walton, 2021). The primary objective of our study is to strengthen this knowledge for a geological context neglected by the literature and fill in its main gaps:
-
Lidar data make it possible to accurately quantify rock instabilities, but they are not always linked to suitable weather data. For example, freeze–thaw cycles are often derived from air temperature without consideration of the influence of solar radiation, even on south-facing rockwalls (e.g. Weidner and Walton, 2021). Furthermore, air temperature provides no insight into the freezing-front depth in the rock. This makes it difficult to relate spring thaw to the rockfalls that occur (e.g. Macciotta et al., 2015).
-
The relationship between rock instabilities and weather conditions is often studied at the monthly or seasonal scale (e.g. Kromer et al., 2018; Macciotta et al., 2017). While this temporality can reveal interesting trends, it cannot differentiate the respective impacts of different meteorological events on rockfall dynamics. For example, on a monthly scale, the respective roles of precipitation events and freeze–thaw cycles cannot be easily distinguished, since their occurrences can overlap. Consequently, this temporality is not useful in the preventive hazard management of rock instability triggers.
-
Many studies have highlight the strong relationship between rockfall frequency and magnitude (e.g. Guerin et al., 2014, 2020; Rosser et al., 2005; Santana et al., 2012; van Veen et al., 2017; Williams et al., 2018). However, studies into the influence of weather variables on rockwall dynamics focus almost exclusively on rockfall frequency. One exception is Matsuoka (2019), who investigated the relationship between weather conditions and rockfall magnitude. In order to mitigate the risk, the relationship between the magnitude of rock instabilities and their triggering factors is an essential area of study, since the damage caused by instabilities is proportional to their magnitude.
Our study therefore aims to link rockfall dynamics to specific adequately measured weather conditions. We use TLS to quantify the frequency and magnitude of rock instabilities for each targeted weather condition. We also propose a classification of weather conditions based on their level of concern for preventive hazard management.
In Haute-Gaspésie, Route 132 is the sole transportation corridor linking a number of villages to the rest of the region. For the local population, it is critical infrastructure for accessing essential services. The national road runs along the Gulf of Saint Lawrence shoreline and is subject to coastal flooding and erosion (e.g Drejza et al., 2019). The rockwalls that tower above the road expose it to other natural hazards: snow avalanches (Fortin et al., 2011; Hétu, 2007), falling ice blocks (Gauthier et al., 2015, 2017), debris flows (Fortin et al., 2015) and rockfall. Those same rockwalls make moving the roadway inland from the shore unfeasible. To limit risk to road users, the ministère des Transports du Québec (Ministry of Transport, MTQ) created a 24/7 patrol to monitor the 70 km of national road that runs along the rockwall of Gaspé's uplands. The patrol is also responsible for clearing the road when it is obstructed by rock, snow or ice from hillslope movements. Between 1987 and 2020, the patrol responded to 13 261 rockfall events along the 25 km where rockwalls overhang Route 132, or 16 rockfalls yr−1 km−1 (Ministère des Transports du Québec, 2021).
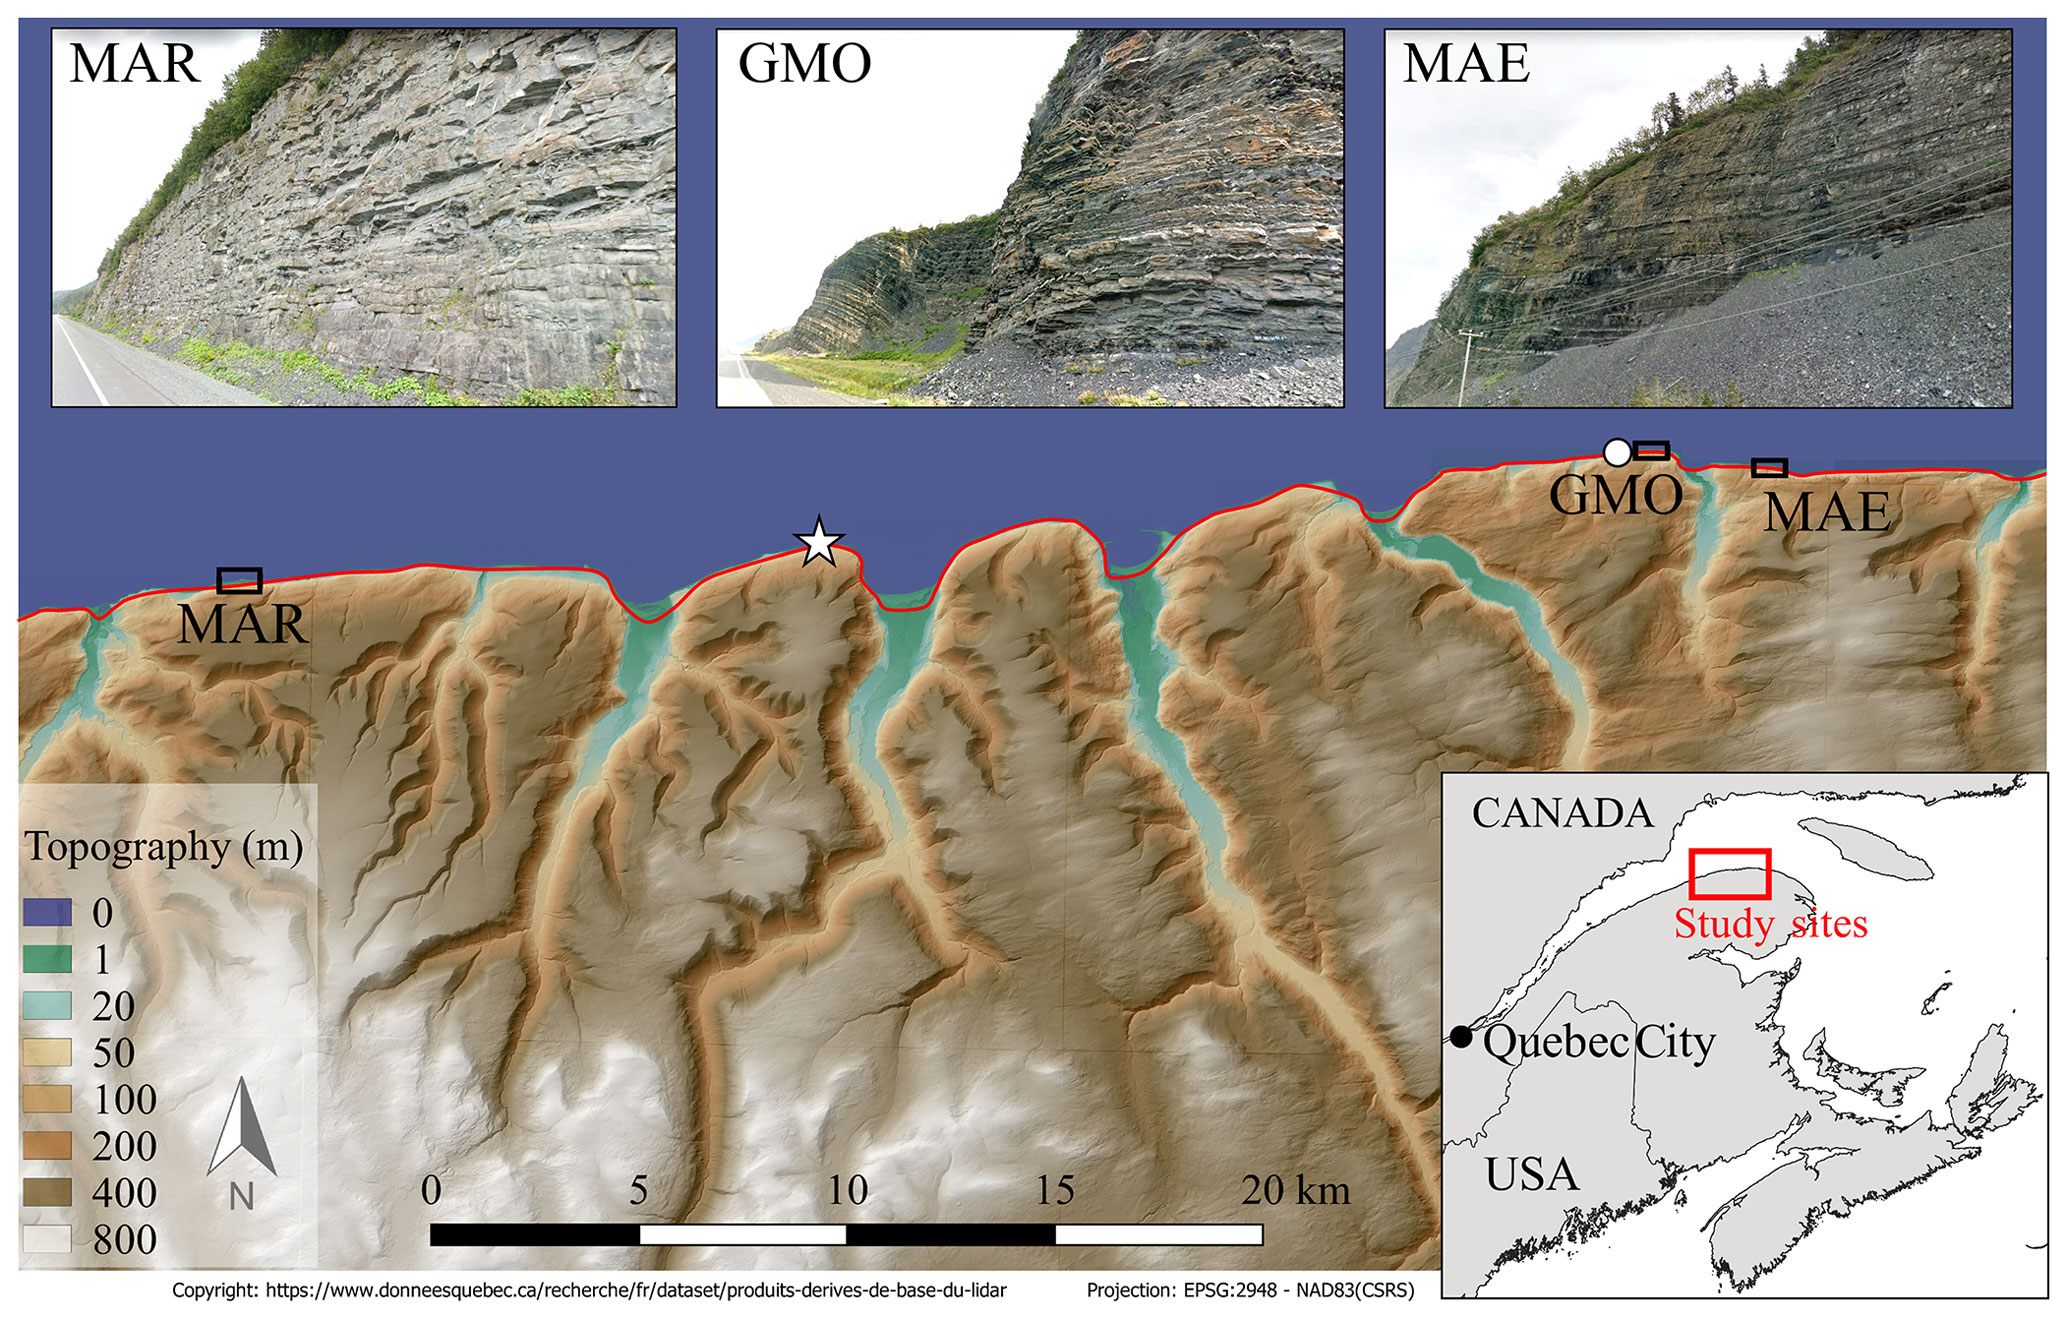
Figure 1Location of the three study sites (MAR, GMO, MAE), of the rain and snow gauge (white star), and of the thermistor strings that measured the temperature to a depth of 550 cm (white circle). The red line is for the exposed-to-rockfalls Route 132.
Lidar was used to monitor three rockwalls (Figs. 1, A1 and A2) that overhang Route 132 in Haute-Gaspésie. From east to west, the sites are near the villages of Manche-d'Épée (MAE), Gros-Morne (GMO) and Marsoui (MAR). The total area scanned was 12 056 m2. Rockwalls were selected using five criteria: (1) structural and lithologic characteristics representative of Haute-Gaspésie rockwalls, (2) frequent rockfall incursions onto the national road, (3) year-round accessibility, (4) general morphology (verticality, height) and microtopography (roughness) compatible with lidar acquisition from the national road, and (5) absence of vegetation (occlusion) and drainage (signal reflection). The three sites are sedimentary rockwalls (flysch) with horizontal or subhorizontal bedding planes. The easternmost study site, MAE, covers an area of 3154 m2. It has a vertical (> 80∘) natural rockwall that is 35 m high and is oriented north (350∘). It rises over an unvegetated 30 m long scree slope with an average gradient of 38∘. The rockwall is primarily composed of siltstone (50 %), shale (30 %) and greywacke (20 %). Rockfall of greywacke blocks is most likely to reach the national road, which runs about 10 m from the base of the scree slope. GMO is a rockwall with alternating spurs and re-entrants. On that site, three rock spurs with a total area of 5370 m2 were scanned, most of which were dynamited. The orientation of the spurs ranges from 330 to 20∘, and their gradients range between 70 and 90∘. Their bases do not have scree slopes, and rockfall regularly reaches the national road. Only the lower 25 m of the three spurs was scanned to limit occlusion as much as possible. The rock spurs are composed of greywacke (50 %), siltstone (40 %) and shale (10 %). Lastly, MAR is a vertical (90∘) dynamited rockwall composed primarily of sandstone (70 %), siltstone (20 %) and shale (10 %). The thickness of the siltstone strata tends to result in decimeter-sized instabilities. Since the national road runs right along the base of the rockwall (no scree slope is present), these instabilities regularly reach the roadway. However, its low height (< 30 m) and verticality limit the distance of rockfall travel from the rockwall.
Haute-Gaspésie has a humid continental climate with short cool summers, according to the Köppen climate classification system (Beck et al., 2018). During the period 1991–2020, it had an annual mean temperature of 3.9 ∘C. The mean temperatures of the warmest (July) and coldest (January) months were 16.3 and −9.2 ∘C, respectively. Over that same 30 years, average annual precipitation was 888 mm, 33 % of which fell as snow (Environment Canada, 2021).
3.1 Rockfall detection using TLS
Over the 554 d period from 14 June 2019 to 18 December 2020, 17 lidar surveys were performed. Two TLS instruments were used for data acquisition. The four first surveys used a Leica Geosystems ScanStation C10. A RIEGL VZ-400i was used for the 13 subsequent surveys. To obtain dense point clouds with the fewest possible occlusions, multiple surveys were conducted to adequately cover the scanned surfaces at each site (Fig. 2a and b). Depending on site morphology and surface area, four to twelve 360∘ surveys were needed. The resulting point clouds were processed in the Cyclone 2.5 software. For each date, all these point clouds have been assembled together by a visual alignment using the “2D Scan Thumbnails” tool. Then, the point clouds were optimized using the “point clouds autocorrelation” tool. This method allows us to minimize the number of occlusions and to produce point clouds with a centimeter-level density for each survey (Fig. 2c and d). The same strategy was used to align the point clouds corresponding to the different dates of acquisition. For each of these dates, we have measured the surface differences between the cloud points using the M3C2 plugin of the open-source free software CloudCompare v2.12.4 (Lague et al., 2013). The M3C2 algorithm operates directly on point clouds without meshing or gridding and computes the local distance between cloud points along the normal surface direction which tracks 3D variations in surface orientation. Because it considers the surface roughness, this algorithm is particularly accurate for measuring small surface changes, and so, it is suitable for comparing rockwall surfaces (Lague et al., 2013).
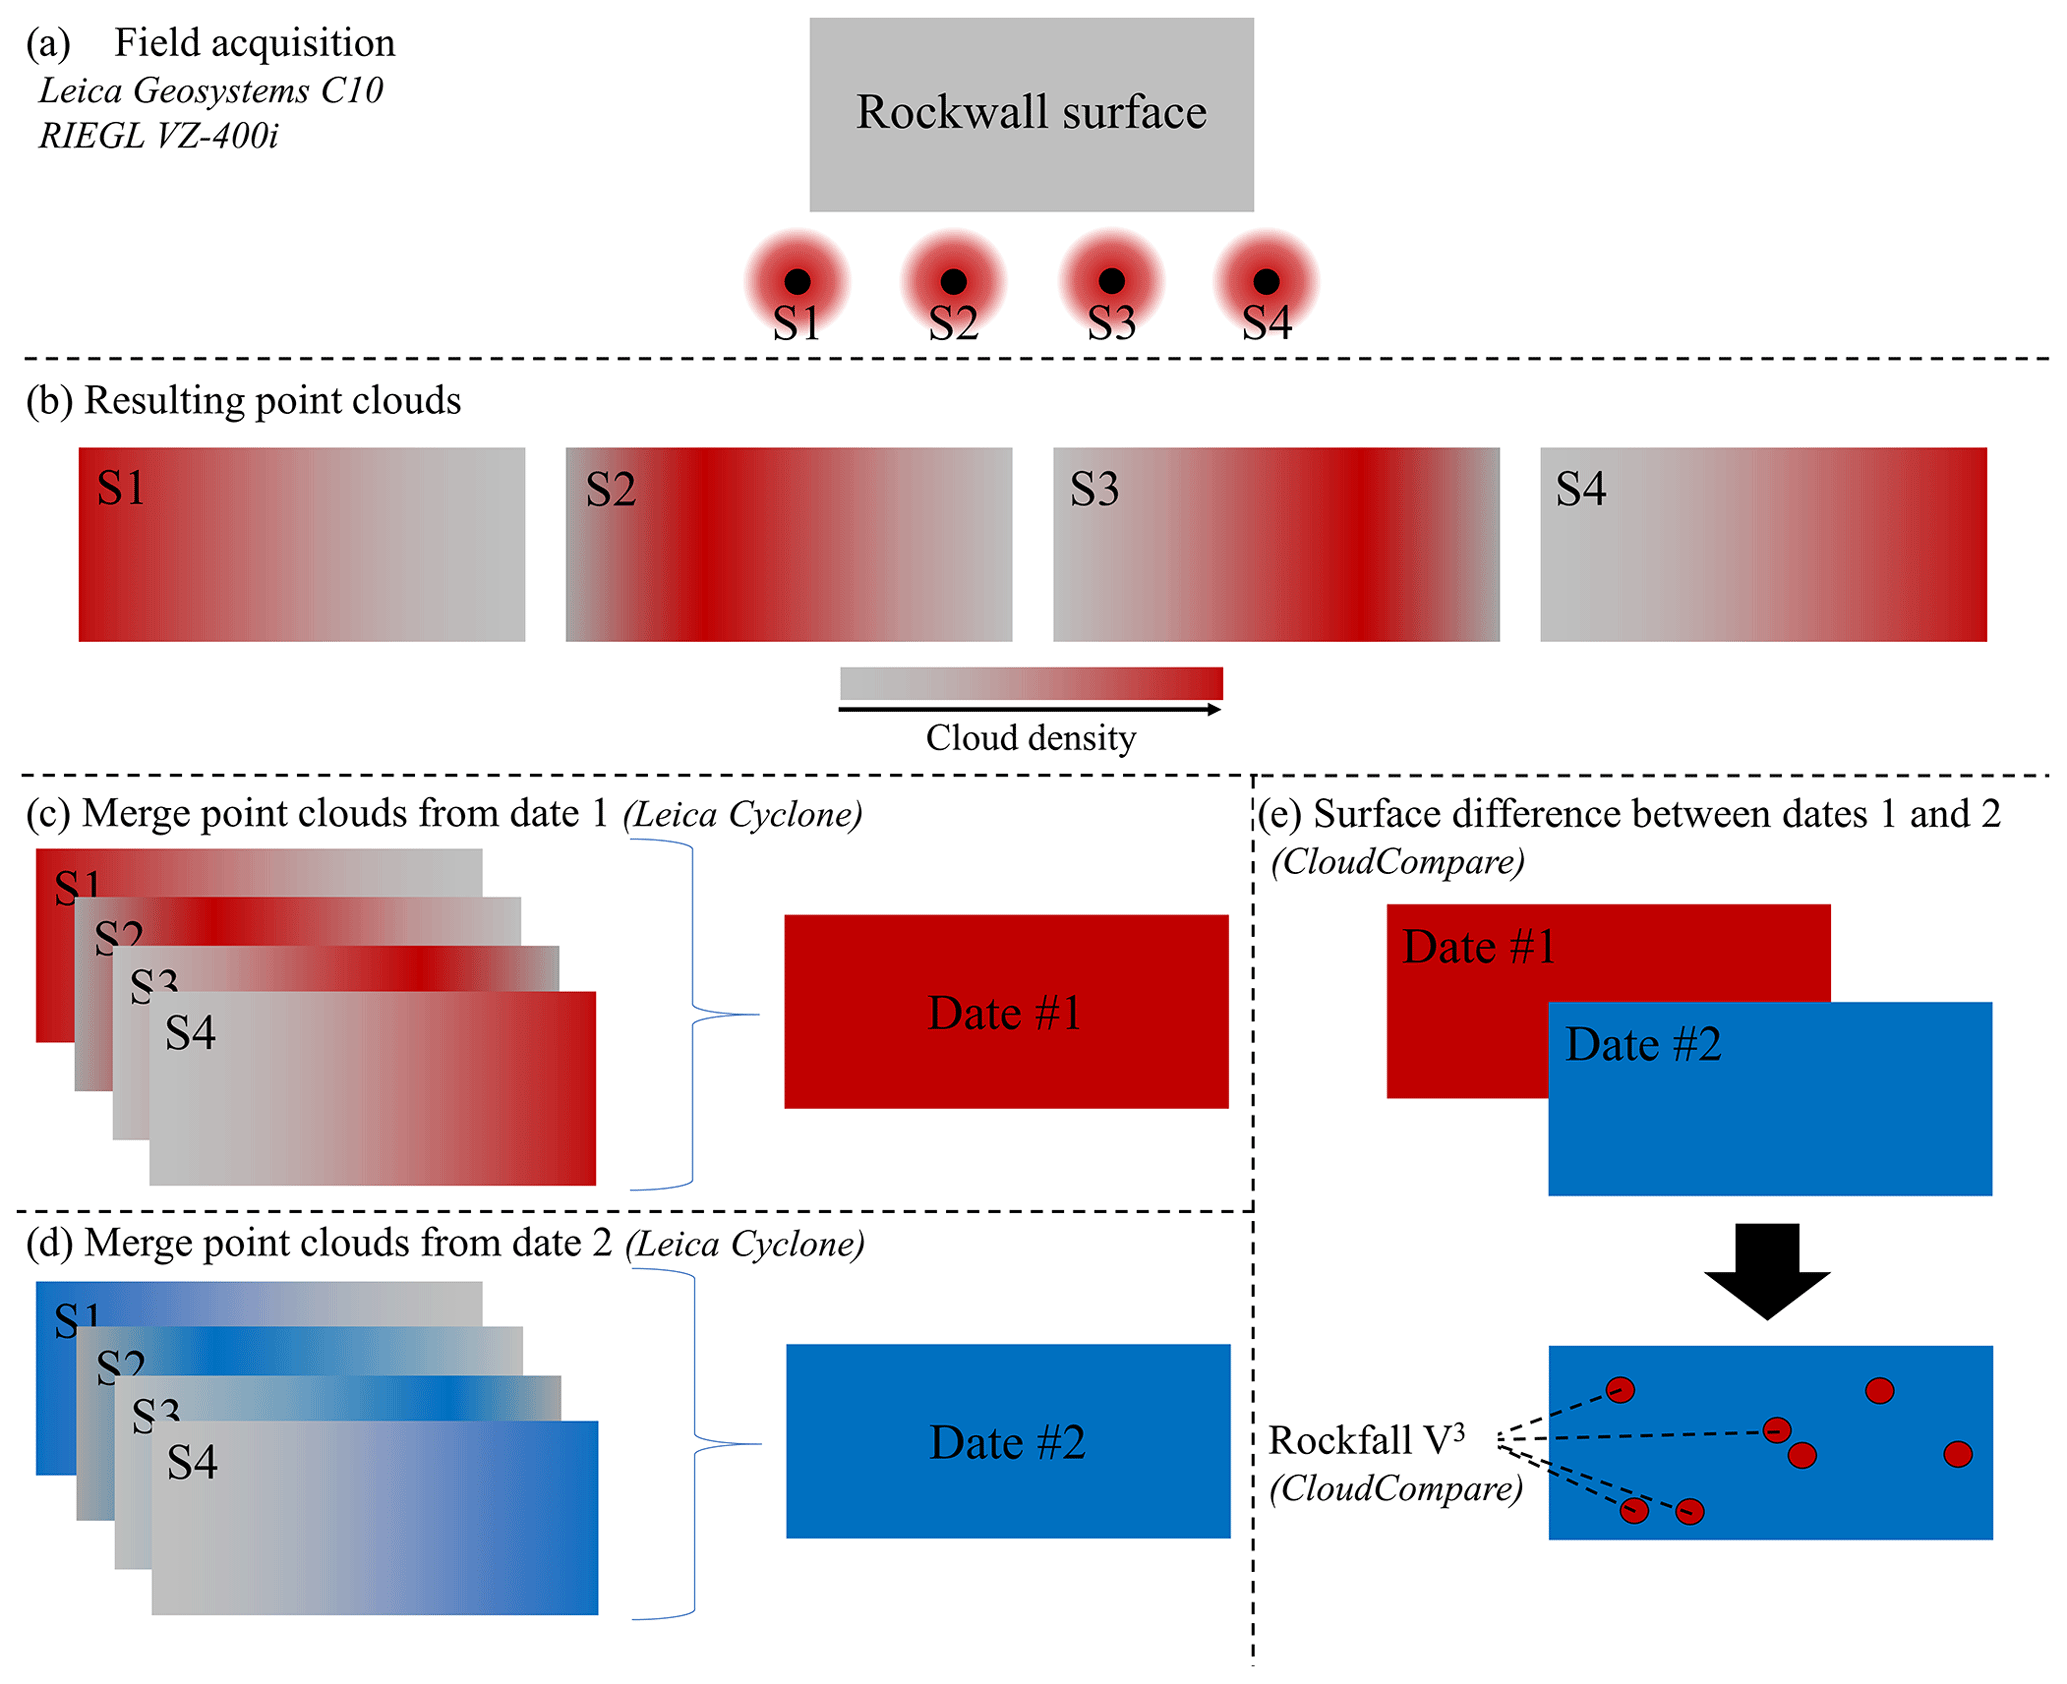
Once the surface differences between each survey had been calculated, we quantified the rockfall volumes between these periods (Fig. 2e). Each significative negative change was isolated from the whole point clouds and then, the 2.5D volume calculation method was applied to compute its volume. Štroner et al. (2019) have compared this method, also available in CloudCompare, with software solutions using point clouds capable of calculating volume (Atlas DMT, 3DReshaper, Leica Cyclone and Trimble RealWorks). They have proven than the 2.5D volume calculation method provides results identical to those computed by the best commercial solutions and has a much better time demand accuracy ratio (Štroner et al., 2019). Finally, to avoid misinterpretation of rockfall volumes with, for example, wind deflation of snow or the presence of vegetation, we have focused the analyses on vegetation-free cliff sections. A visual examination of the shape of each of the quantified volumes also helped to minimize interpretation errors (van Veen et al., 2017).
3.2 Protocol to monitor the influence of weather conditions on rockfalls
To study the influence of weather conditions on rockfall frequency and magnitude, sufficiently high spatial resolution is needed to identify all events at the lowest quantified magnitude (Abellán et al., 2014). Nevertheless, small-scale rockfalls can be difficult to distinguish from other processes such as wind deflation of snow over the rock slope surfaces. In order to avoid misinterpretation, a threshold of 10 cm for negative change has been determined and the scarce areas where vegetation is present were excluded from the studied areas. Ultimately, this method allows exhaustive detection of rockfalls larger than 0.005 m3.
Regarding the temporal resolution, Barlow et al. (2012) showed that a 19-month interval between surveys leads to an underestimation of small-scale events. With overly long intervals, several distinct but spatially overlapping events can be erroneously interpreted as a single larger-scale event. Williams et al. (2018) compared rockfall frequencies detected at temporal resolutions of 1 h and of 30 d. They found that the number of low-magnitude events (< 0.1 m3) detected was 3 orders of magnitude greater at a temporal resolution of 1 h. However, to achieve this high temporal resolution, a fixed scanner is required. This leads to other issues, such as greater occlusion on the rockwall surface and more limited scanned areas. Barlow et al. (2012) showed that while environmental factors influence rockfall, defining a constant frequency is not necessary for data acquisition. Lidar surveys must be more frequent during periods when a greater rock instability frequency is expected. Conversely, intervals between surveys can be longer during periods with a lower rockfall frequency. The protocol we implemented was designed to limit the scanning effort by targeting selected periods rather than performing regular scans. This resulted in an inconsistent survey frequency that is justified by the influence of weather conditions on rockfalls. The scanning periods were selected based on knowledge of the weather conditions that cause major rock surface deformations and are likely to result in rockfall (Birien and Gauthier, 2022). Target periods could run over several dozen days (dry period, rainy period, autumn period with near-daily freeze–thaw cycles and cold winter period) or monitor specific meteorological events (heavy and high-intensity rainfall; winter freeze–thaw cycles; and spring surface, 1 m deep and full rockwall thaws).
The periods to scan were determined over the course of the study using Environment Canada weather forecasts and then validated with local weather measurements. A Campbell TE525WS-L rain gauge was used to measure precipitation (mm). In winter, it was equipped with a CS705 adapter to measure the water equivalent of solid precipitation. A thermistor string (with a GeoPrecision data logger operating at 915 MHz) inserted into a horizontal borehole measured the temperature (∘C) every 30 cm to a depth of 550 cm. Using linear interpolation between the thermistors, we produced a temperature profile at different depths over time, quantified the number and depth of freeze–thaw cycles, and tracked the depth of the freezing front in winter and the thawing front in spring. All weather instruments took data readings every 15 min. The instrumented rockwall is located 200 m west of the study site GMO (49∘15′21.0′′ N, 65∘33′52.2′′ W), and the precipitation data come from a weather station located in a roadside rest area along the Gulf of the Saint Lawrence (49∘13′49.92′′ N, 65∘51′3.53′′ W) (Fig. 1).
Finally, the rockfall spatial distribution as well as its frequency and the rock slopes erosion rates is presented individually for the three study sites, but the influence of weather conditions is based on the whole rockfall database. This approach has proved necessary to avoid misinterpretation of the occurrence or non-occurrence of events during short microclimatic periods (e.g. heavy and high-intensity rainfall or winter freeze–thaw cycles). Monitoring over a longer period would make it possible to establish links between the meteorological conditions and the geological and structural context of each of the studied rock slopes.
3.3 Hazard assessment
Lidar surveys make it possible to quantify rockfall frequency and to calculate the individual volume of rockfalls. Based on these data, we can study the influence of different weather scenarios on rockfall magnitude. Because a high frequency of high-magnitude events does not have the same significance as a high frequency of low-magnitude events, the magnitude of rockfalls is a major issue for risk management. Following this precept, we have grouped and classified the nine main weather scenarios in a matrix according to their ability to trigger rockfalls of different magnitudes. This matrix is composed of three magnitude classes (“low”, “intermediate” and “high”) and five frequency classes from “low” to “extreme”. This table provides a classification of weather conditions based on their ability to trigger rockfalls of different magnitudes. This knowledge could be used to implement a risk management strategy based on triggering factors.
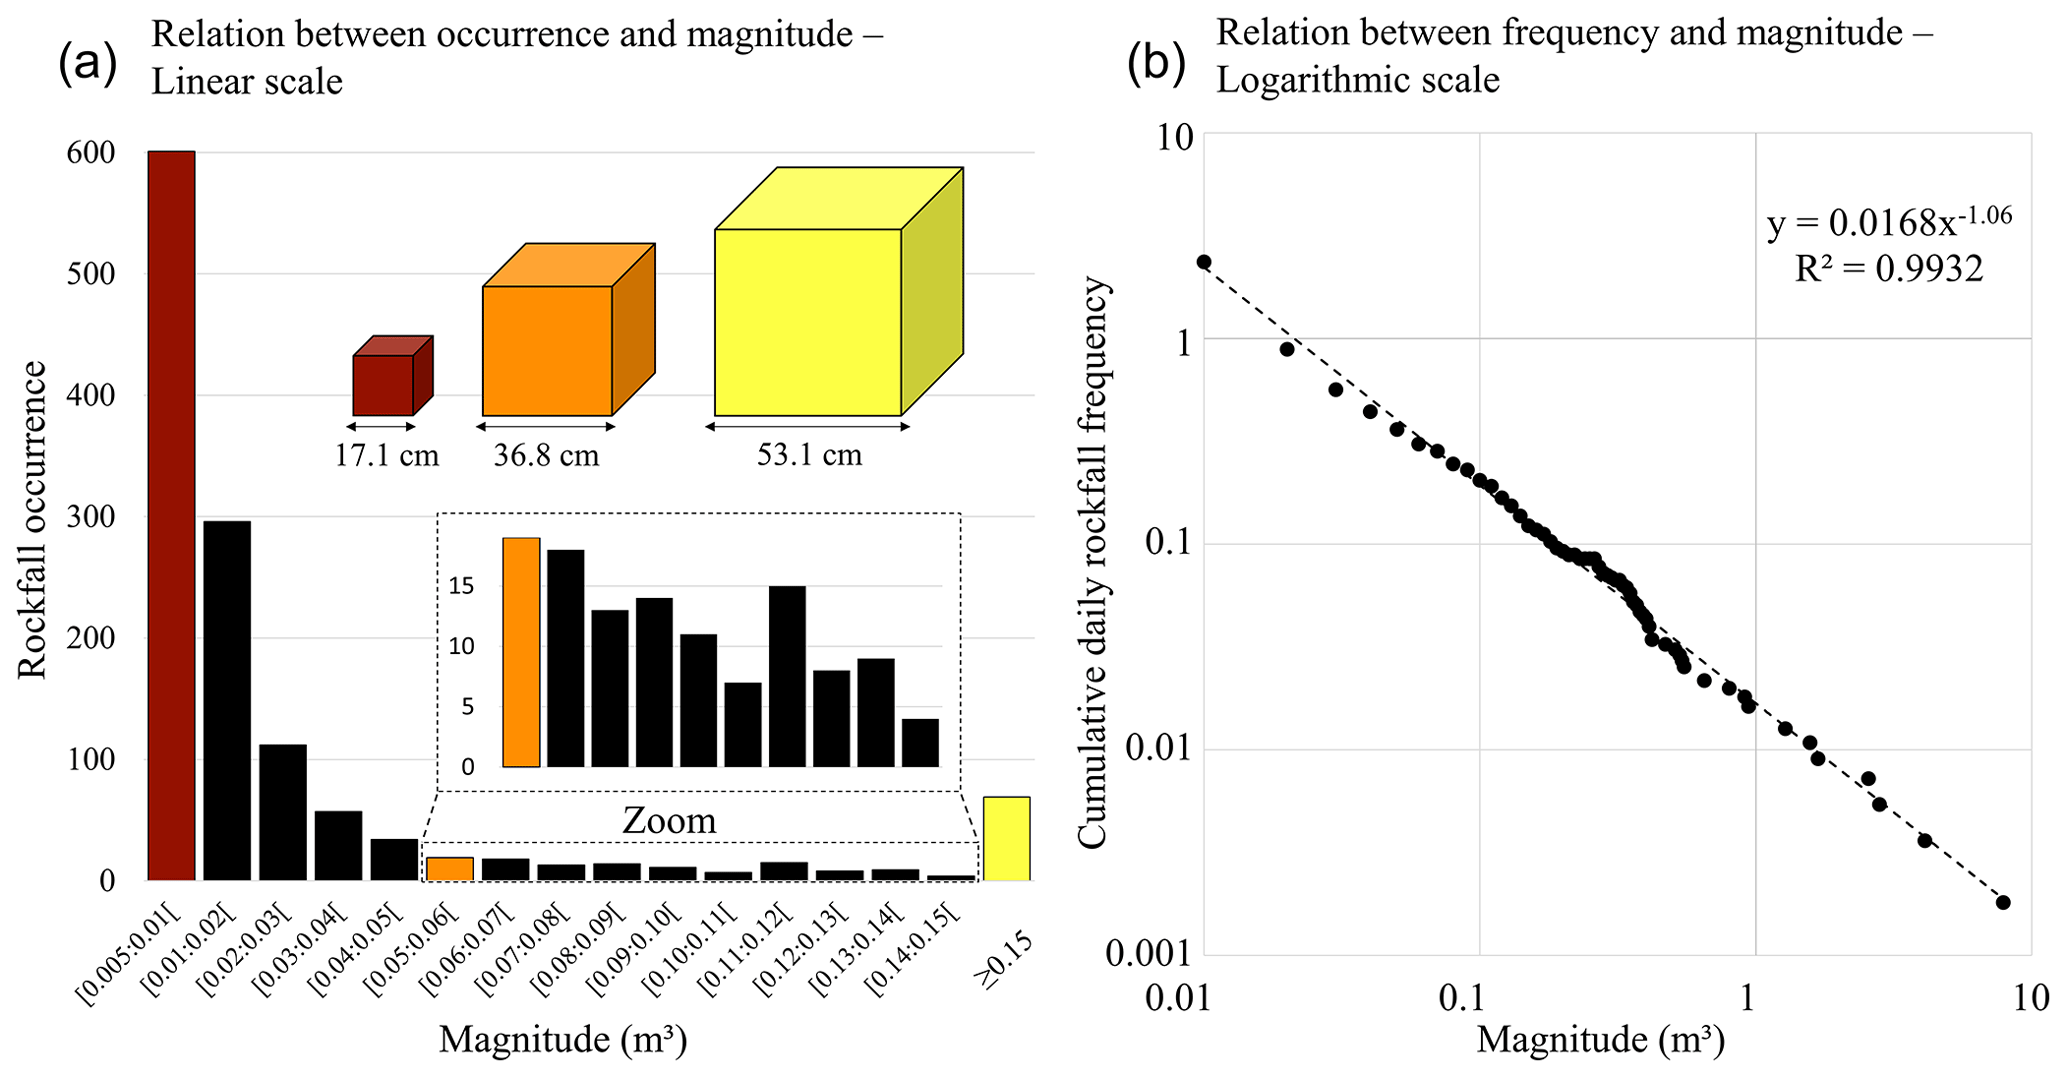
Figure 3Relationship between rockfall occurrence and magnitude (a) and between cumulative daily rockfall frequency and magnitude (b).
4.1 Frequency–magnitude
Over the study period, 1287 rockfalls over 0.005 m3 in volume were identified and their volumes measured. Rockfall frequency decreased rapidly with magnitude (Fig. 3a). The frequency–magnitude curves generally fit a power law (Guerin et al., 2014, 2020; Hungr et al., 1999; Rosser et al., 2005; Santana et al., 2012; van Veen et al., 2017; Williams et al., 2018). In this case, it can be defined as
where f(V) is the mean daily frequency of rockfalls with a volume greater than or equal to V over the entire study period for the 12 056 m2 of scanned rockwalls. This frequency is the equivalent of 2.2 rockfalls d−1 for events greater than or equal to 0.01 m3, 0.2 rockfalls d−1 for events greater than or equal to 0.1 m3, and 0.02 rockfalls d−1 for events greater than or equal to 1.0 m3. A total of 69 rockfalls have a volume higher than 0.15 m3 (i.e. 5.3 % of the total), of which 17 have a volume higher than 0.5 m3 (i.e. 1.3 % of the total) and 7 have a volume higher than 1 m3 (i.e. 0.5 % of the total) (Fig. 3). Where the frequency or spatial resolution of the lidar surveys is insufficient, low-magnitude instabilities are underrepresented (Barlow et al., 2012; Guerin et al., 2014; Malamud et al., 2004). The absence of a rollover in the logarithmic frequency–magnitude distribution obtained in this study makes it possible to validate whether a suitable instability detection threshold was chosen (Fig. 3b). This result confirms that the selected survey frequency and spatial resolution were appropriate for individually identifying the large majority of events with a volume exceeding 0.005 m3.
4.2 Global rockwall erosion rate
The annual rockwall erosion rates and the rockfall frequency were calculated using the entire 554 d time series of two summers and two autumns but only one winter and one spring series. The 1287 recorded rockfalls were distributed across the three study sites as follows: 363 at MAE, 486 at GMO and 438 at MAR. Figures 4, A1 and A2 show the surface differential at the three study sites between the first survey in June 2019 and the last survey in December 2020. In these figures, we have filtered out any change less than ±1 cm, green clusters of points correspond to positive change and red clusters of points correspond to negative changes. Over the 554 d period, many changes were visible on the rockwall surfaces. Most of the positive changes (in green) to the rockwall and scree slope are explained by low snow accumulation during the last lidar surveys on 18 December 2020. These positive changes can also be attributed to the development of rock instabilities large enough to be detected by lidar (Kromer et al., 2018; Oppikofer et al., 2008, 2009; Royán et al., 2014). For example, measurements taken at MAE show that between the months of June 2019 and December 2020, a rock mass measuring 3 m high separated from the rockwall by 4 to 5 cm at its top and 1 to 2 cm at its base (Fig. 4a). The increased rate of displacement at the top of the rock mass suggests a toppling failure. This type of pre-failure deformation was not considered in the rockfall volume calculation. Only rockfalls that produced a negative change of more than 0.005 m3 in the surface differential were considered in the erosion rate calculation. Because rockfalls of very small magnitude (< 0.005 m3) were not considered, the erosion rates are slightly underestimated. It is important to recall that what appears to be a high-magnitude event over the entire study period may correspond to several successive smaller-scale events (Fig. 4b) (Abellán et al., 2014; Barlow et al., 2012; van Veen et al., 2017; Williams et al., 2018). The change detection of ±1 cm applied in Figs. 4, A1 and A2 was only used to visualize the overall picture of the rock slope dynamic (e.g. snow accumulation, pre-failure deformation), but as described before, a filter of ±10 cm was applied to quantify rockfalls.
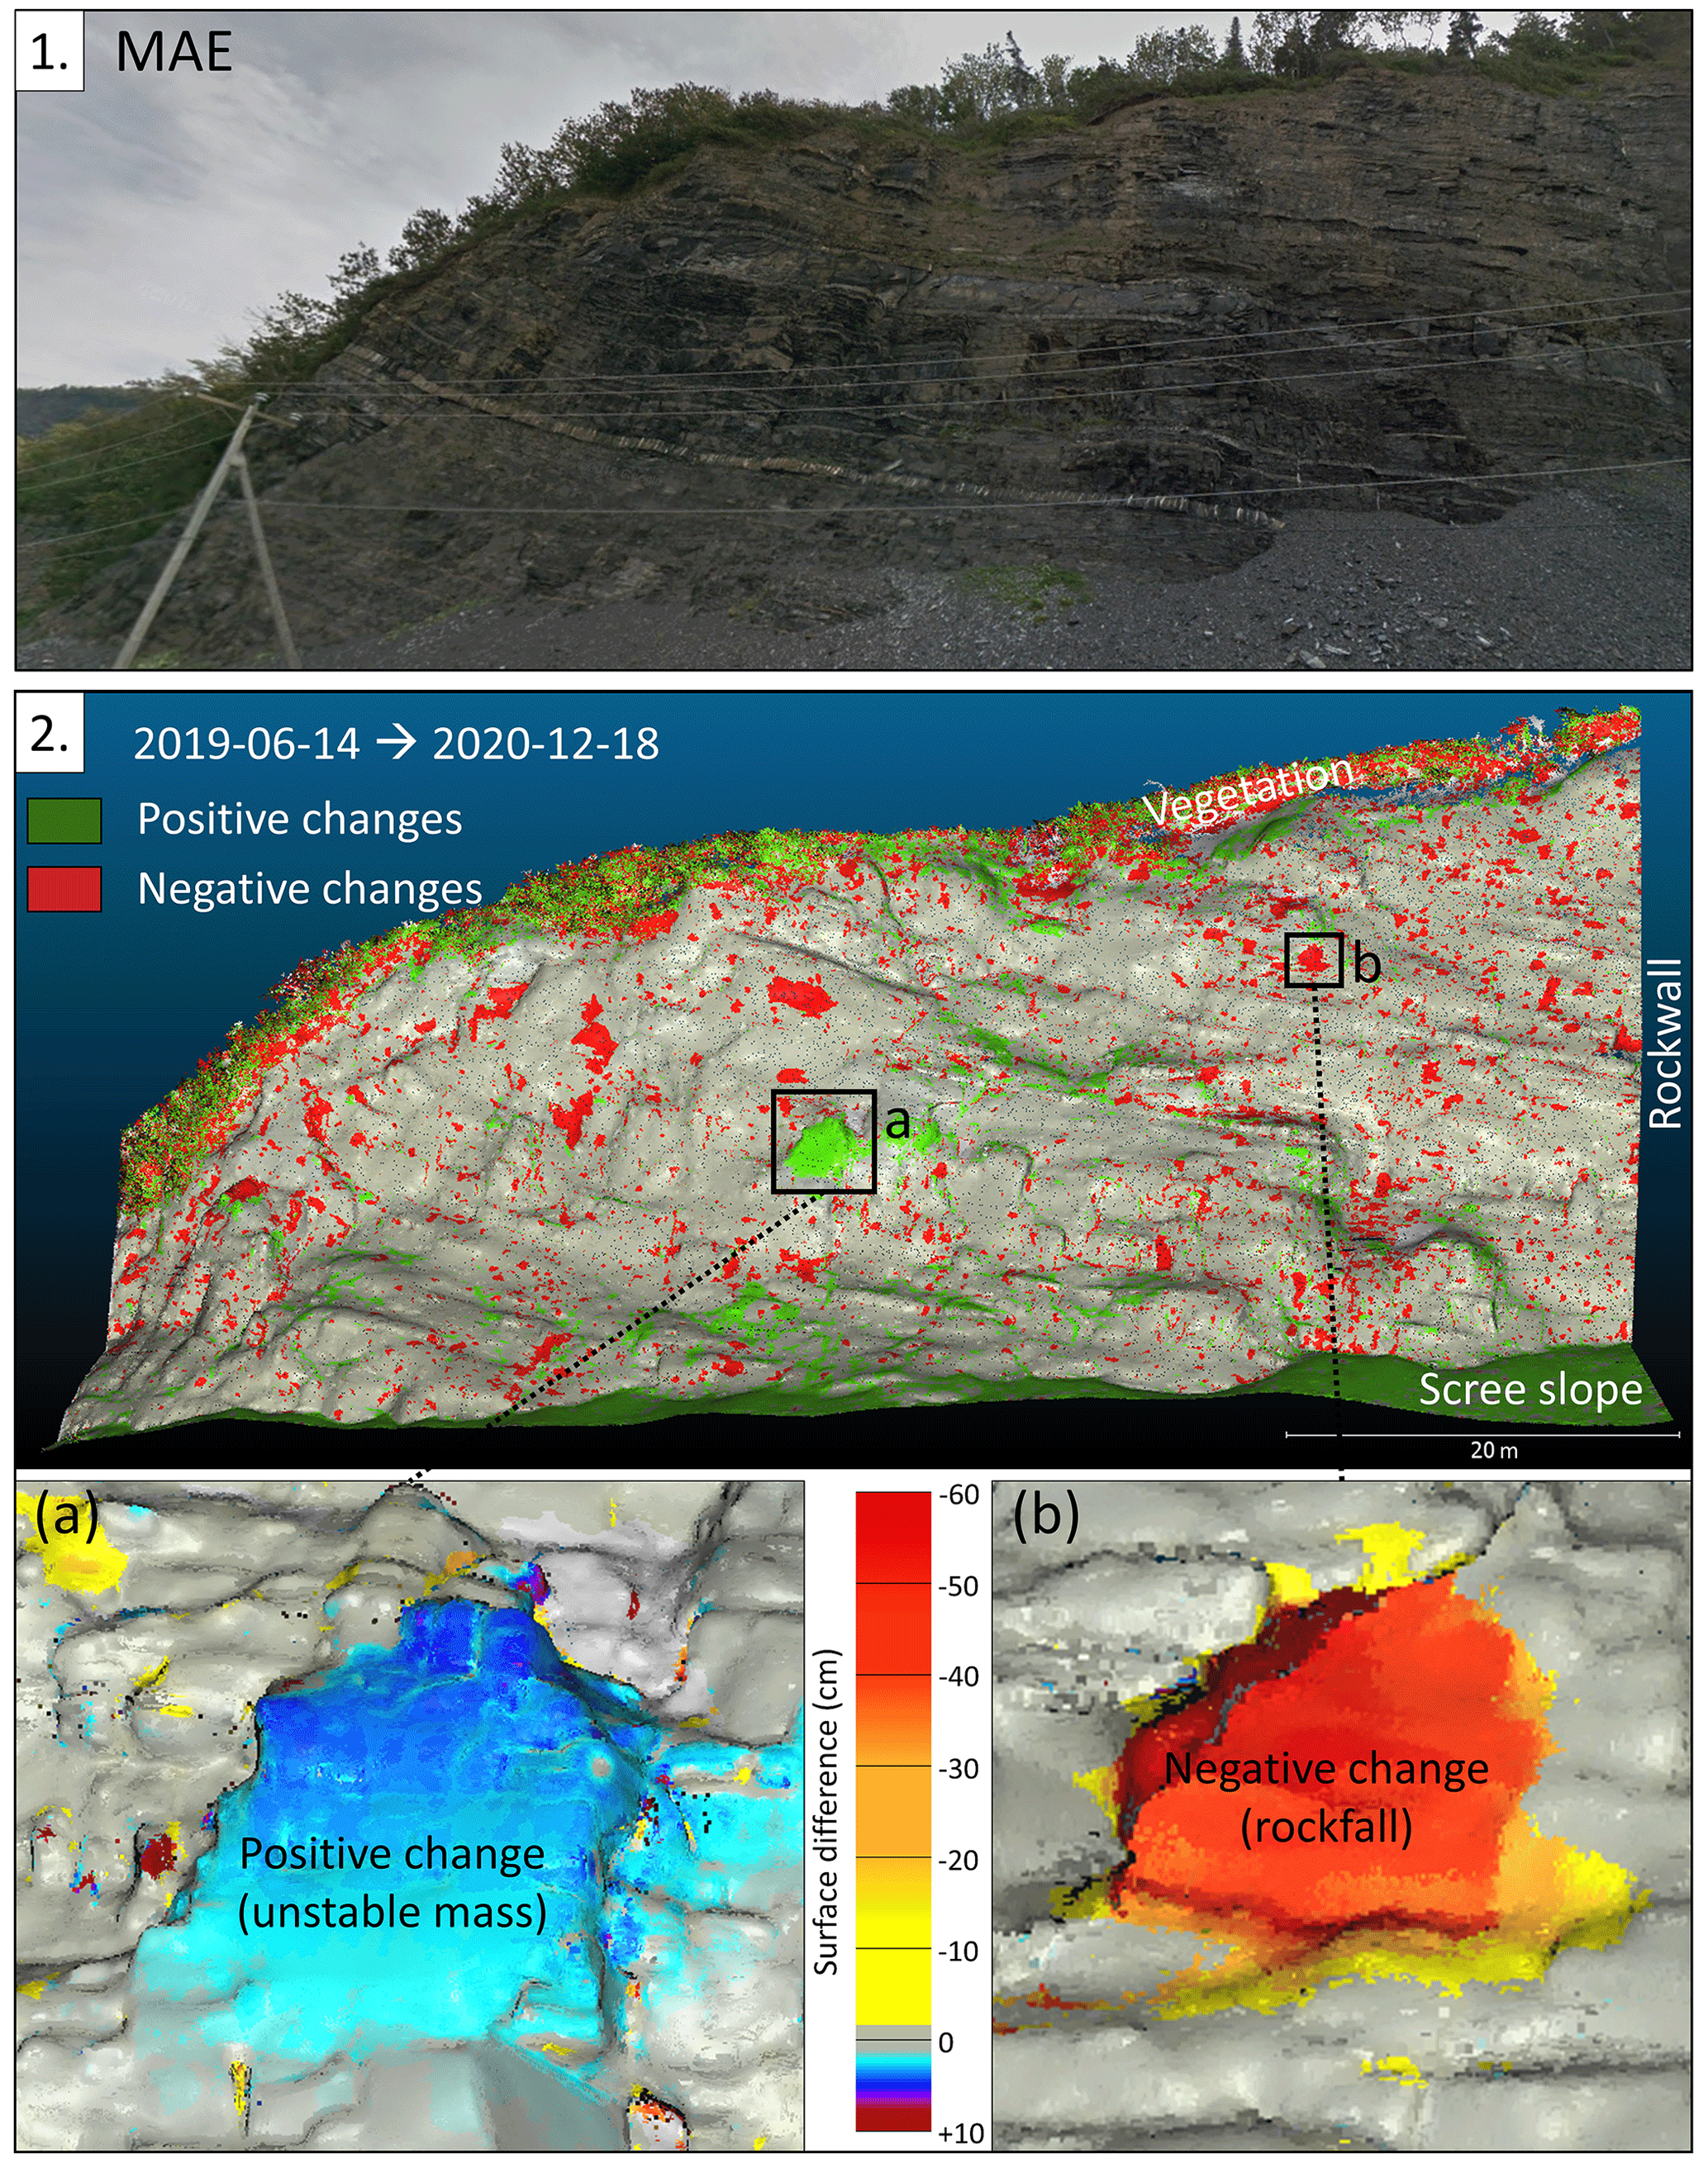
Figure 4Point clouds of main changes (MAE rockwall) between the first (14 June 2019) and last (18 December 2020) scan surveys. Positive changes are mainly relative to unstable rock mass (a), and negative changes highlight rockfall (b).

Figure 5Mean annual rockfall frequency (a), rockwall erosion rate (b) and total volume of rockfall for the overall studied period (c).
Considering the scanned surfaces separately, all three sites had fairly similar annual rockfall frequencies: 0.08 rockfalls m−2 for MAE and MAR, and 0.06 rockfalls m−2 for GMO (Fig. 5a). In contrast, the differences between the erosion rates of the three rockwalls were more pronounced. Over the study period, the erosion rate was higher for MAR (5.4 mm yr−1) than for MAE (3.0 mm yr−1) or GMO (2.8 mm yr−1) (Fig. 5b). Therefore, despite comparable rockfall frequencies, MAR had a higher erosion rate than the other sites. This distinction shows that on average, MAR experienced higher-magnitude events. This is borne out by the fact that in the entire time series, five of the seven recorded events with a volume of over 1 m3 occurred at MAR. These events account for 33 % of the total volume lost by the three rockwalls in the study period. At MAR, the 8 largest-magnitude events contributed as much to the erosion rate of the studied surface as the 430 lower-magnitude events. Meanwhile, at GMO and MAE, the 5 and 20 highest-magnitude events represented the volume of the 481 and 343 smallest events, respectively. Clearly, high-magnitude events affect more substantially the erosion rate of the rockwalls (Fig. 5c).
4.3 Weather conditions related to rockfalls
In this study, lidar surveys made it possible to quantify instabilities over 16 distinct periods (Fig. 6). Three of them totaling 104 d with a mean precipitation of 1.4 mm d−1 were defined as dry periods (DRY). Two periods totaling 100 d and a mean precipitation of 4.1 mm d−1 were defined as rainy periods (RAINY). Two periods totaling 93 d with a mean air temperature below the freezing point (−6.2 ∘C) and very low winter freeze–thaw frequency (0.02 thaws d−1) were defined as cold winter periods (WIN. < 0 ∘C). The autumn periods (AUT. FT) experienced the first freeze–thaw cycles after summer. Two autumn periods totaling 79 d were scanned. The specific meteorological events that were monitored included a heavy (54 mm) and high-intensity (4 mm h−1 for 12 h 45 min) rainfall event in September 2019 (HEAVY RF) and two winter freeze–thaw cycles (WIN. FT) in winter 2020. One of these two winter freeze–thaw cycles was accompanied by rainfall. Since this kind of liquid precipitation event is only possible because of the thaw occurrence, we made the choice to consider this period a WIN. FT. Four lidar surveys were used to segment the spring thaw (SPR. MELT) into three periods (Fig. 7). The first phase corresponds to the initiation of the thawing season including two freeze–thaw events reaching a depth of 50 cm from the rockwall surface (SPR.0–50). The second phase is characterized by a thaw that penetrates to a depth of 95 cm and by a thaw of 77 cm from depth (SPR.50–100). The third phase corresponds to the complete thaw of the rockwall (SPR.100–350) (Fig. 7). Lastly, the period between 25 May and 16 September 2020 experienced a range of weather conditions too varied for categorization (Fig. 6).
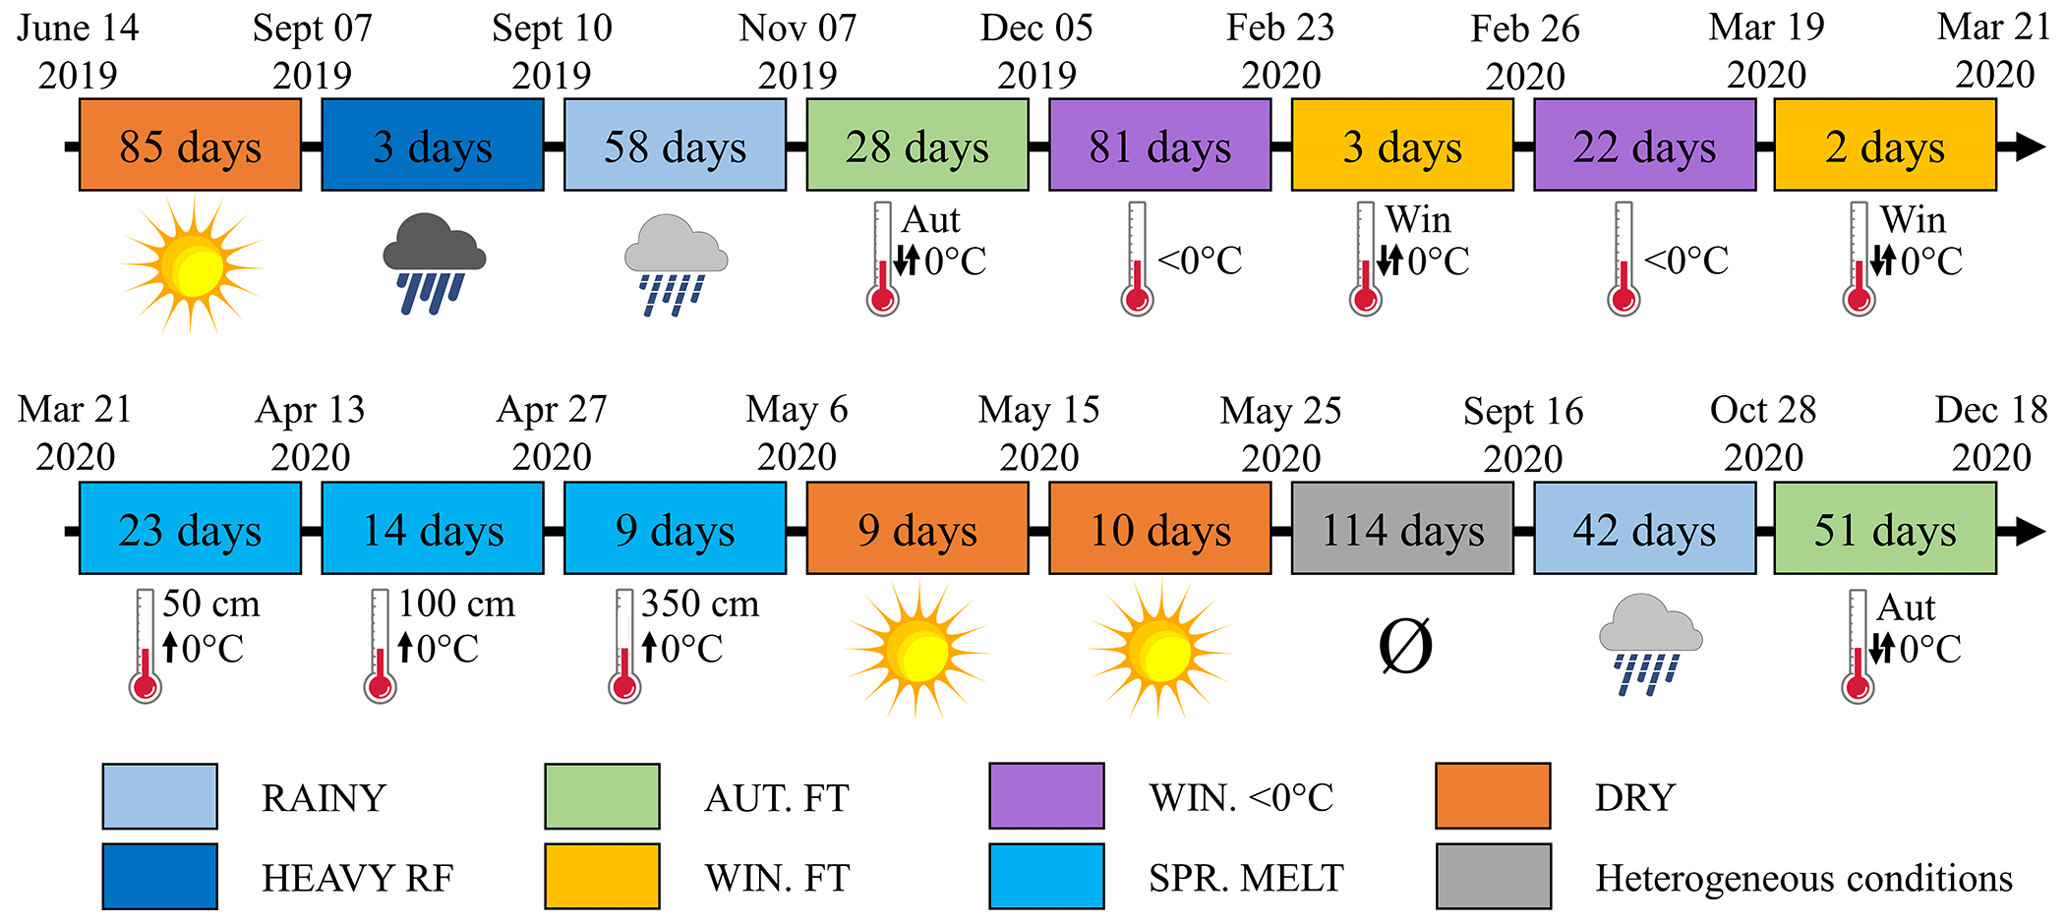
Figure 6Targeted weather conditions for each scan survey period, 14 June 2019–18 December 2020 (553 d).
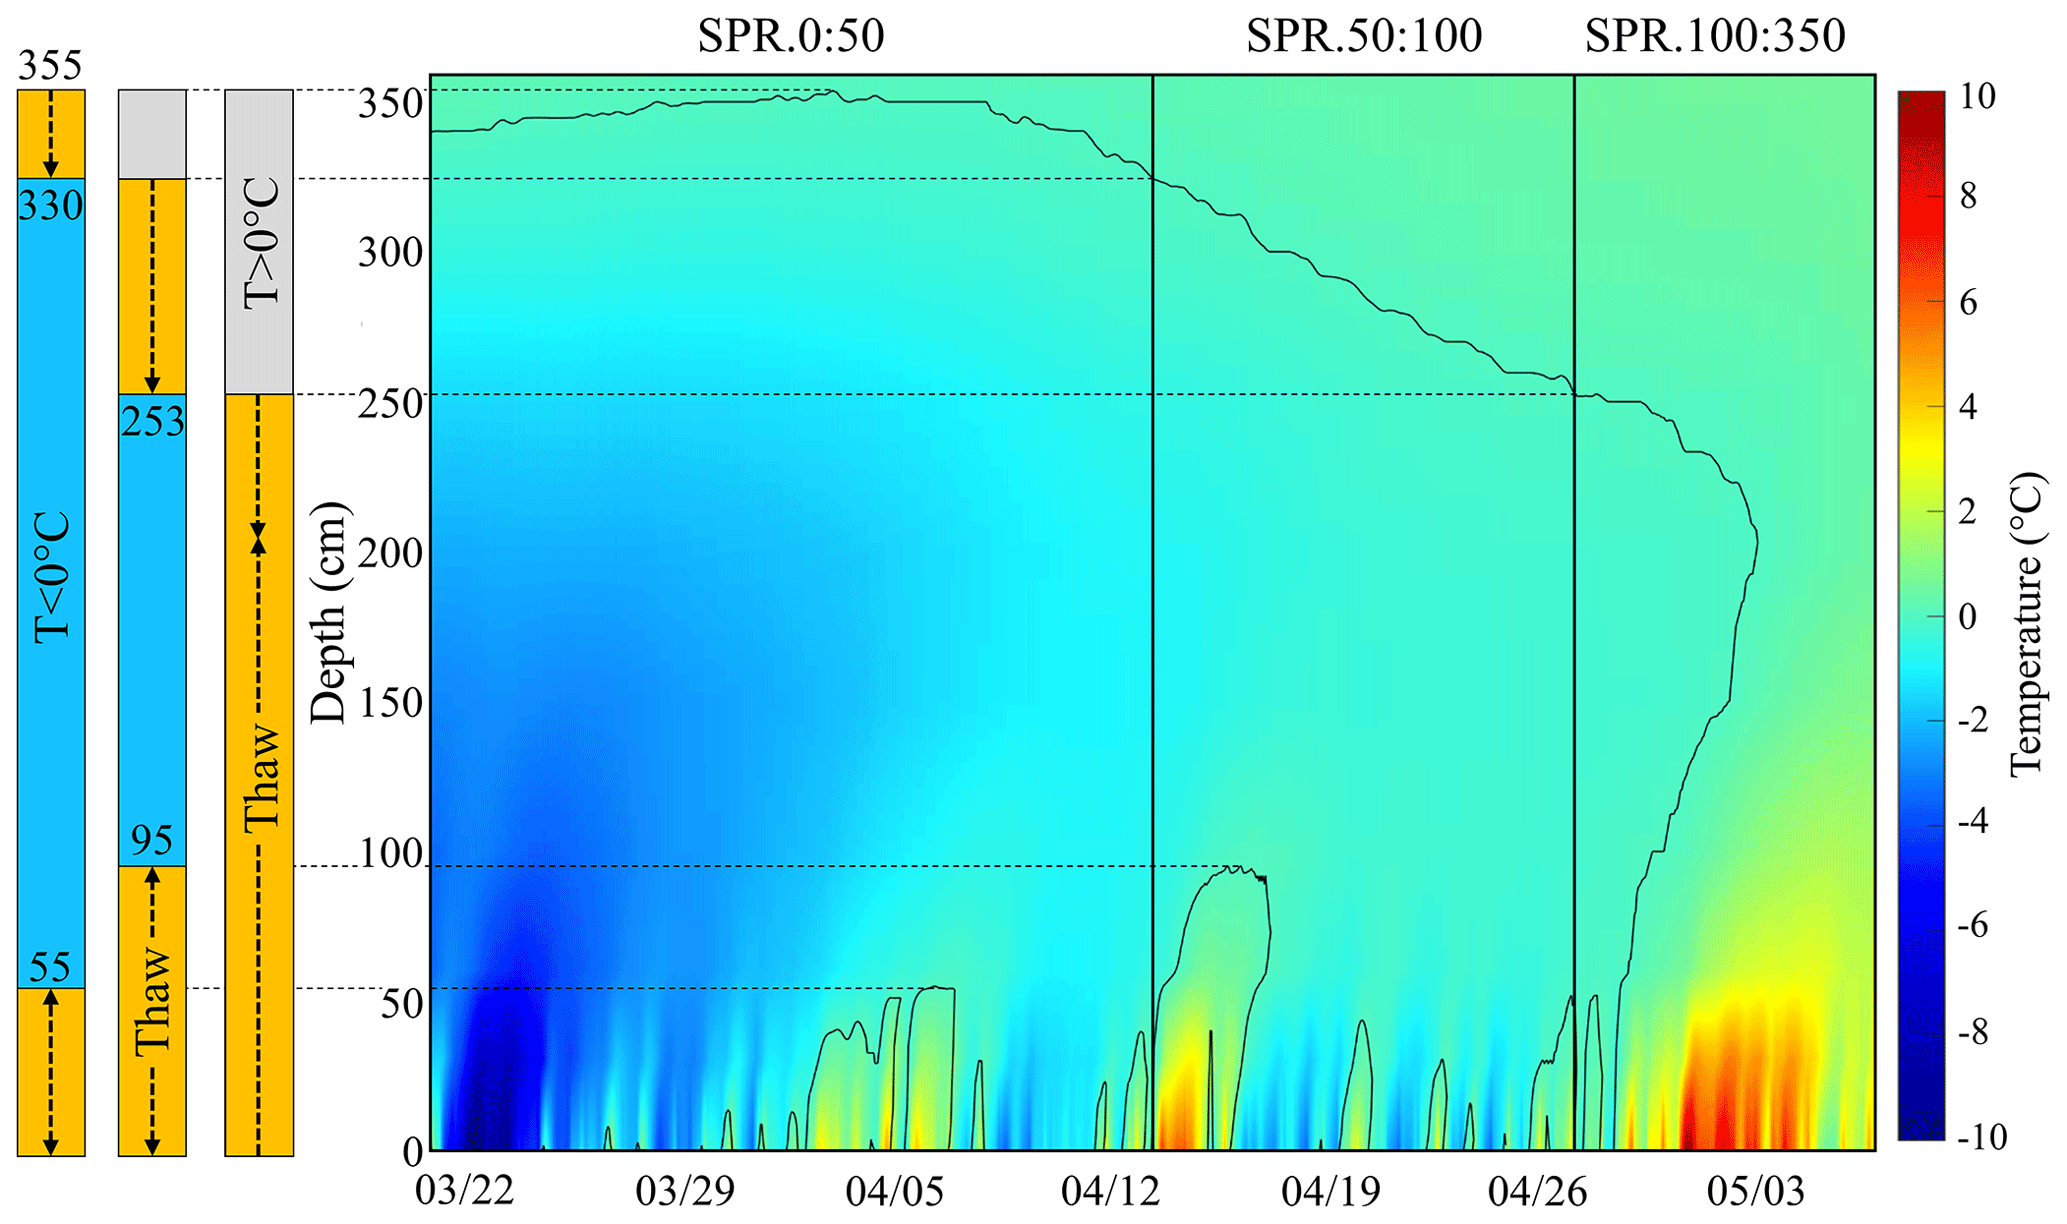
Figure 7Rock temperature evolution along a perpendicular profile from the surface to 360 cm depth, 21 March–6 May 2020. Dark time series are for freeze–thaw depth (0 ∘C). Vertical lines delimit scan periods.
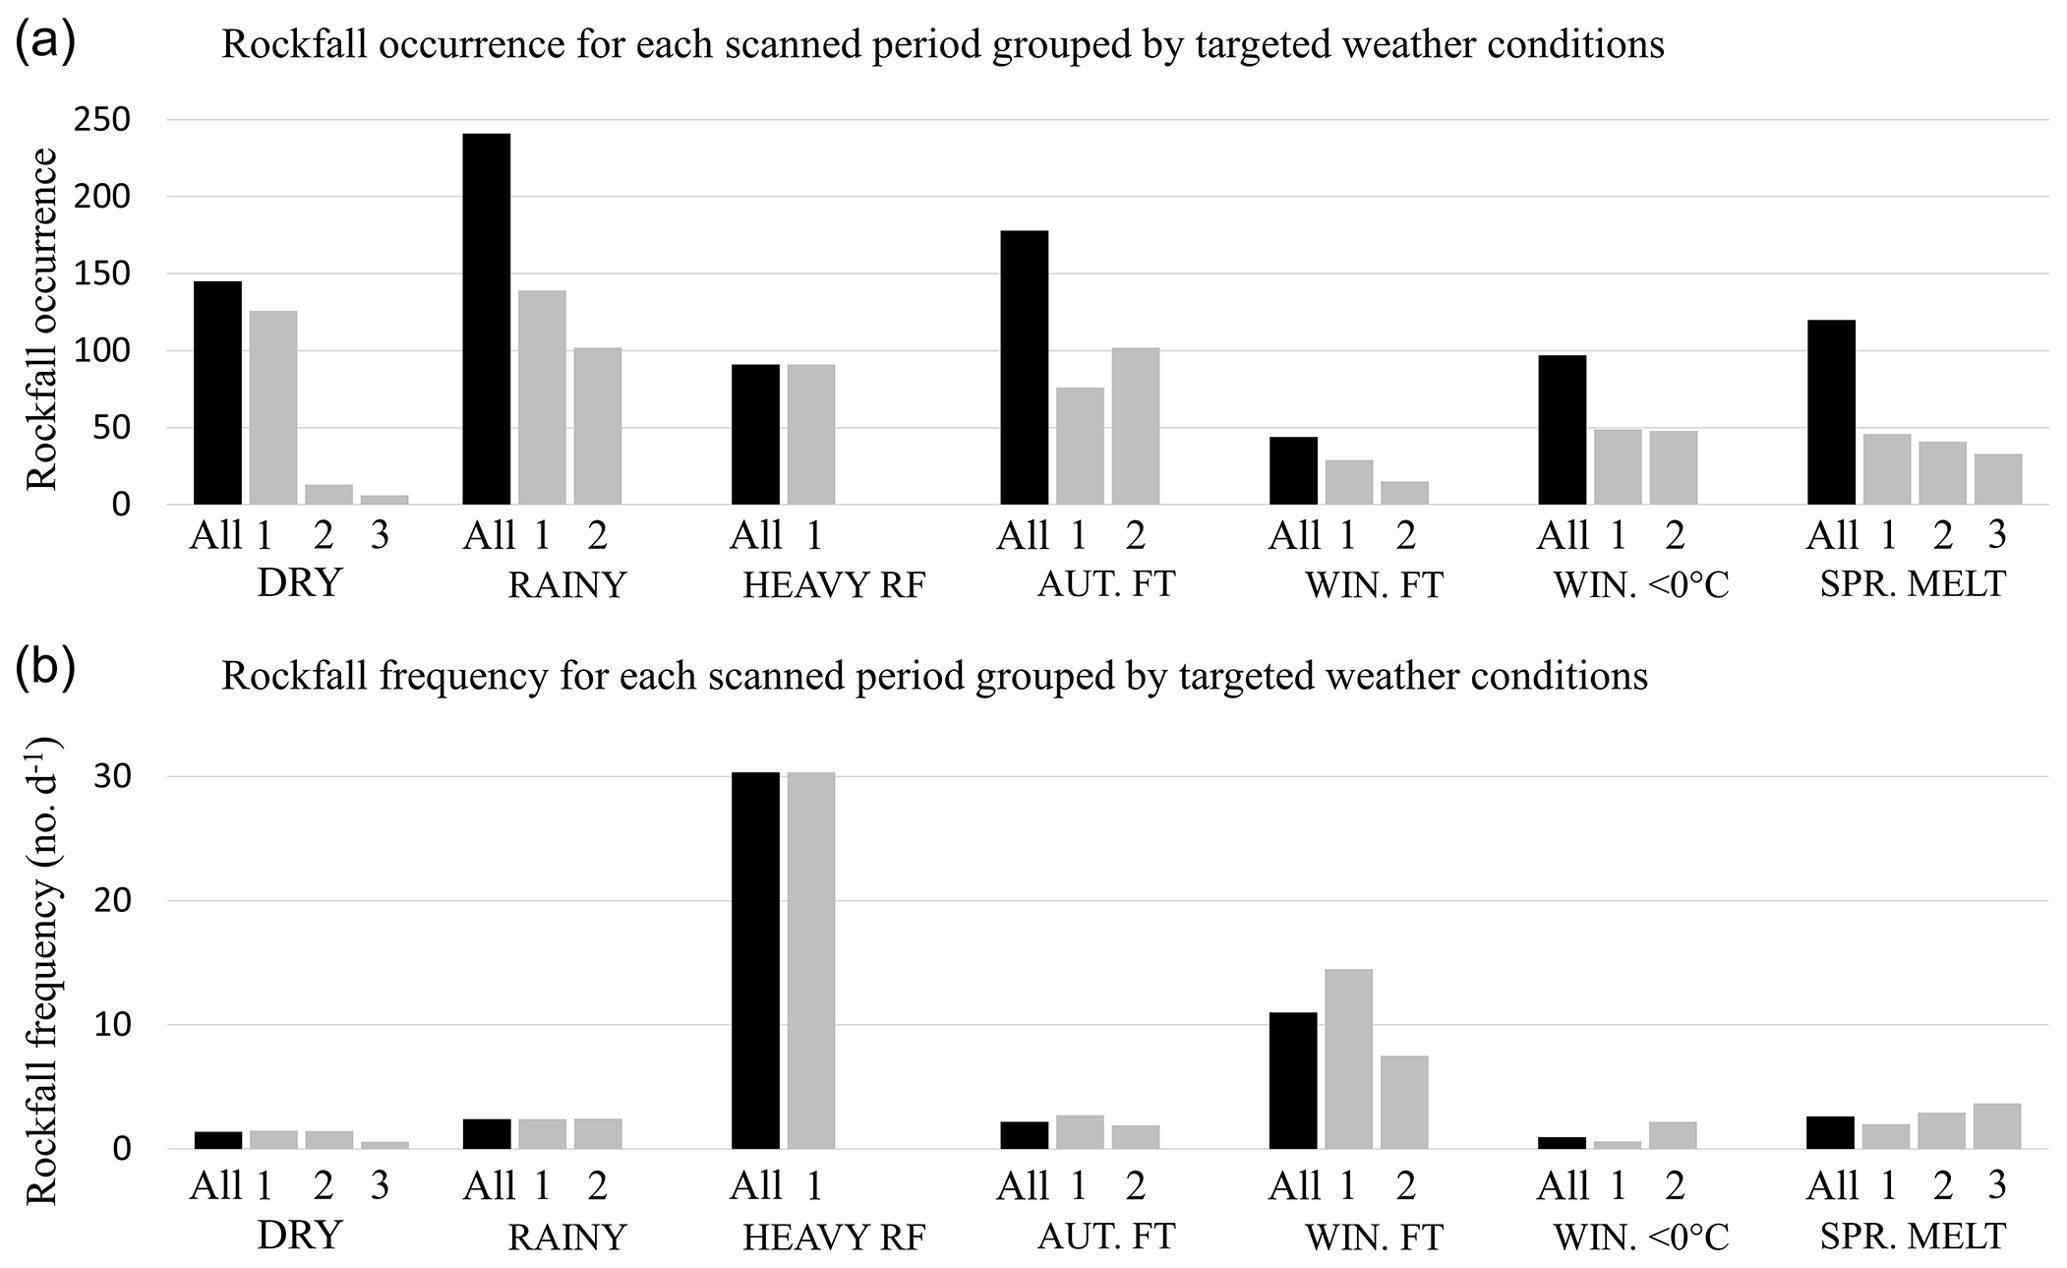
Figure 8Rockfall occurrence (a) and frequency (b) for each scanned survey period, grouped by targeted weather conditions for all sites.
In decreasing order, 241 rockfalls were associated with RAINY periods, 178 with AUT. FT periods, 145 with DRY periods, 120 with SPR. MELT periods, 97 with WIN. < 0 ∘C periods, 91 with the HEAVY RF period, and 44 with WIN. FT periods (Fig. 8a). However, rockfall occurrence under these meteorological conditions is not representative of the dynamics of rockwall instability, since some of those conditions occur over a much longer period than others. For example, DRY periods total 104 d, while WIN. FT periods total just 4 d. Considering rockfall frequency rather than occurrence revealed different meteorological conditions as triggering factors of instabilities. WIN. < 0 ∘C and DRY were associated with the lowest daily rockfall frequencies of 0.9 and 1.4 events d−1, respectively, across the full scanned surface area (12 056 m2). This frequency tended to double under AUT. FT (2.2 events d−1), RAINY (2.4 events d−1) and SPR. MELT (2.6 events d−1) conditions. Winter freeze–thaw cycles (WIN. FT) and heavy rainfall events (HEAVY RF) produced the highest rockfall frequencies. Frequencies for WIN. FT and HEAVY RF were 11.0 and 30.3 events d−1, respectively (Fig. 8b). Compared to a cold winter period (WIN. < 0 ∘C), rockfall frequency was multiplied by a factor of 1.5 during DRY periods, 2.3 in AUT. FT periods, 2.8 in SPR. MELT periods, 11.7 in WIN. FT periods and 32.3 in HEAVY RF periods.
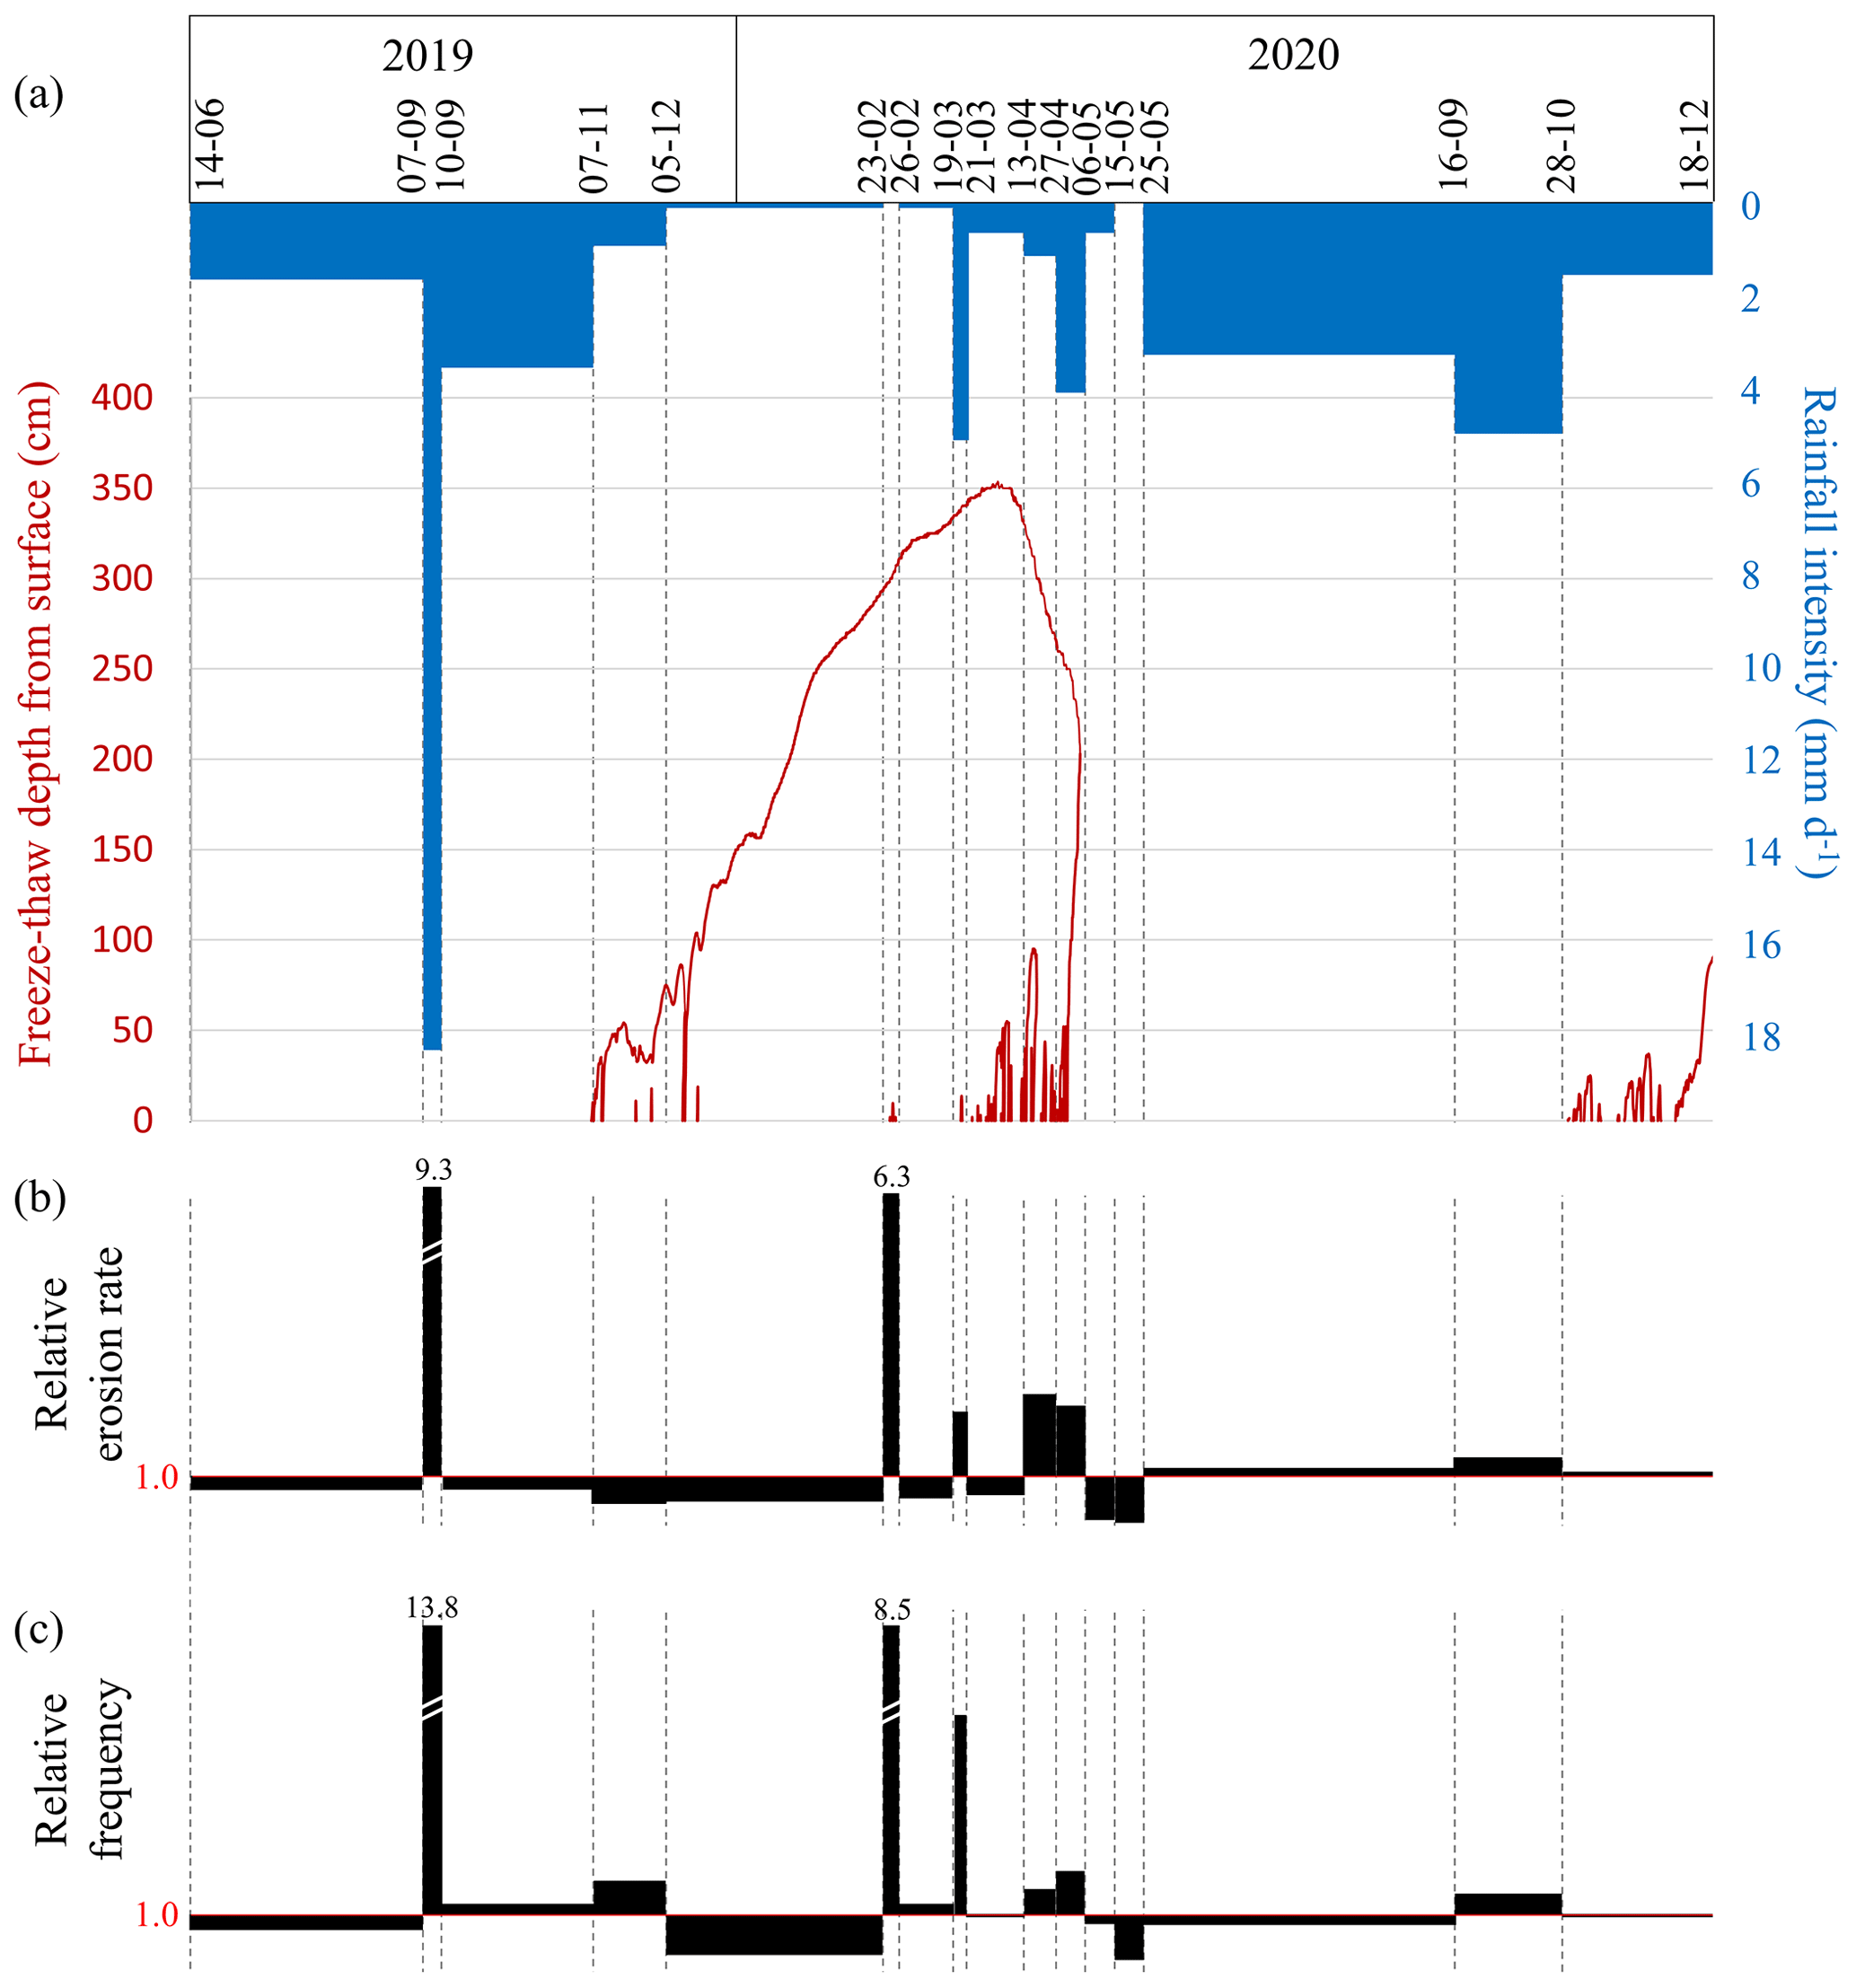
Figure 9Main weather conditions (a), erosion rates (b) and rockfall frequency (c) for each scanned survey period. Erosion rates and rockfall frequency are relative to mean erosion rates and mean rockfall frequency, respectively, between 14 June 2019 and 18 December 2020.
For each scanned survey period, precipitation intensity and freeze–thaw cycles were compared with rockwall erosion rates and rockfall frequency (Fig. 9). The erosion rate and frequency shown for each period are relative to their respective mean values over the entire time series (standard score). Where values for a period were under 1, the rockwall erosion rate and rockfall frequency were less than the time series mean. On 7 September 2019, Category-5 Hurricane Dorian arrived in the Gulf of Saint Lawrence as a post-tropical storm. It dropped 54 mm of heavy rain (4 mm h−1 for 12 h 45 min) on the study site. Between 1987 and 2021, only 16 precipitation events of over 50 mm were recorded in Haute-Gaspésie, which represents a return period of 776 d (Environment Canada, 2021). The heavy rain event resulted in a rockwall erosion rate and rockfall frequencies that were 9.3 and 13.8 times the mean, respectively (Fig. 9). Calculated for the full 72 h period between the two surveys (7 and 10 September 2019), those values would undoubtedly have been higher had they had been based solely on the actual duration of the event (14 h).
Between 23 and 26 February 2020, a series of three freeze–thaw cycles occurred (Fig. 9). They followed a long period (70 d) of below-freezing-point temperatures. During these three freeze–thaw cycles, the air temperature rose to 3.1, 8.3 and 2.1 ∘C, respectively, separated by 8 h periods around −2 ∘C. They resulted in a thaw of 10 cm depth from the rockwall surface. The rockwall erosion rate and rockfall frequency were 6.3 and 8.5 above the mean, respectively. The absence of rain during this period highlights the leading role of surface thaws in rockslide dynamics (Fig. 9). The air temperature remained below the freezing point until 20 March 2020 before rising above zero for 24 h, briefly reaching a high of 8.1 ∘C. This produced a surface thaw to a depth of 14 cm accompanied by rockwall retreat and rockfall frequency rates of 2.3 and 4.4 times the mean, respectively (Fig. 9). In the spring, the frequency and magnitude of freeze–thaw cycles increased (Figs. 7 and 9). Rockfall frequency remained fairly low and lower than during the last winter freeze–thaw event (1.7 times more than the mean). In contrast, erosion rates were higher than during the freeze–thaw event on 23 and 26 February and remained high for a period of 24 d (2.5 times more than the mean). This combination of a high erosion rate and fairly low rockfall frequency indicates an increased mean rockfall volume during the spring thaw.
Over the study period, the weather conditions that most contributed to rock instability dynamics were the winter freeze–thaw cycles, the spring thaw, and the heavy and high-intensity rainfall event (Fig. 9). In contrast, other weather conditions were associated with high stability in the studied rockwalls. In the period 5 December 2019–23 February 2020, both the rockwall erosion rate and the rockfall frequency were very low, 0.6 and 0.3 times less than the mean, respectively (Fig. 9). Temperatures remained below freezing point on all but 2 d of this 81 d period. The 19 d period 6–25 May 2020 had very low rockwall erosion rates and rockfall frequency (0.2 and 0.6 times less than the mean, respectively). During that period, rockwall temperature remained constantly below freezing and only 5.6 mm of rain was recorded. In the study period, the cold winter and dry summer periods experienced the weather conditions associated with the highest stability in the scanned rockwalls (Fig. 9).
4.4 Hazard assessment
Lidar surveys make it possible to quantify rockfall frequency and calculate the individual volume of each rockfall. Using these data, we can study the influence of different weather conditions on rockfall magnitude. Figure 10a presents a matrix of the weather conditions associated with different rockfall frequencies and magnitudes. We defined three classes of low, intermediate and high magnitudes. The first one includes 1100 low-magnitude (0.005–0.05 m3) events. The second class comprises 119 events of intermediate magnitude (0.05–0.15 m3), while the third includes 68 events of the highest magnitude (≥ 0.15 m3). We also defined five frequency classes for the matrix: low (< 75 % mean frequency for the study period), moderate (75 %–125 %), high (125 %–300 %), very high (300 %–500 %) and extreme (> 500 %).
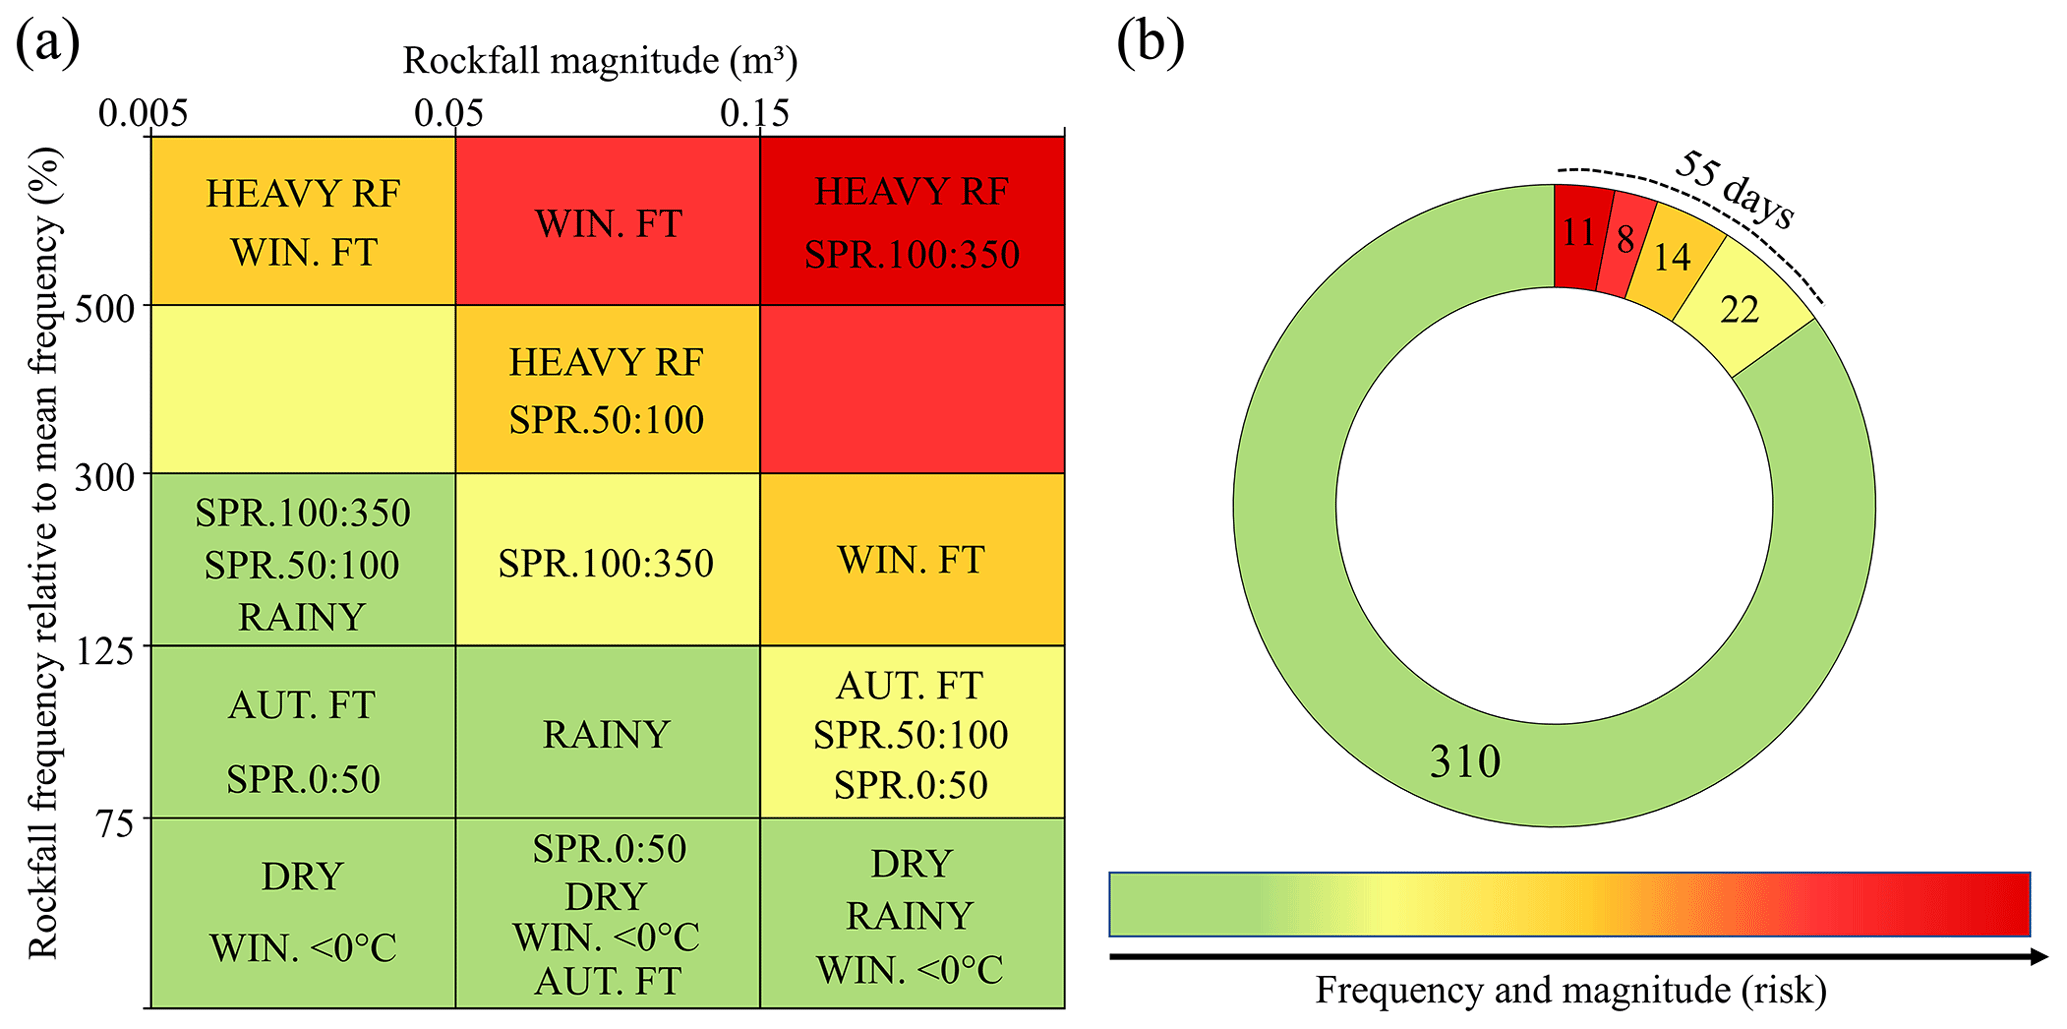
Figure 10Hazard assessment matrix showing the relationship between rockfall magnitude and frequency for specific weather conditions (a) and cumulative daily occurrence of those conditions during the first complete year of this study (14 June 2019 to 13 June 2020) (b).
The HEAVY RF weather condition coincides with extreme rockfall frequency of both low- and high-magnitude events. In contrast, DRY, WIN. < 0 ∘C, SPR.0–50 and AUT. FT conditions were associated with low-frequency rockfall, irrespective of magnitude. All of those weather conditions had an impact on rockfall frequency, resulting in either widespread instability (HEAVY RF) or, conversely, widespread stability (DRY, WIN. < 0 ∘C, SPR.0–50 and AUT. FT). However, while there is no clear relationship between those conditions and rock instability magnitude, the WIN. FT, SPR.50–100, SPR.100–350 and RAINY conditions led to rockfall frequencies that varied by magnitude. WIN. FT is associated with extreme frequencies of low- and moderate-magnitude instabilities but only high frequencies of large instabilities. Similarly, RAINY and SPR.50–100 are associated with high frequencies of low-magnitude events but moderate to low frequencies of high-magnitude events. The inverse relationship was observed during the thawing period in depth (SPR.100–350). This critical period was dominated by high-magnitude rockfalls that outnumbered low-magnitude ones (Fig. 10a).
The cumulative daily occurrence of targeted weather conditions draws only on data collected during the first year of the study (14 June 2019–13 June 2020) rather than the entire time series in order to give each season an equal weight (Fig. 10b). In that year, HEAVY RF and SPR.100–350 periods accounted for just 11 d. There was therefore a low occurrence of periods with weather conditions favorable to extreme-frequency high-magnitude events. The WIN. FT, SPR.0–50, SPR.50–100 and AUT. FT periods were also associated with high-frequency or high-magnitude rockfall and represent a cumulative occurrence of 44 d between 14 June 2019 and 13 June 2020 (Fig. 10b). Lastly, the DRY, WIN. < 0 ∘C and RAINY periods, which do not coincide with periods of high instability, accounted for 310 d, or 85 % of the year (Fig. 10b). Thus, on an annual scale, the weather conditions that resulted in high-frequency or high-magnitude rockfall are in a small minority.
5.1 Flysch rockwall erosion rate
The annual erosion rates measured over 554 d for the three flysch rockwalls in Haute-Gaspésie are very high (between 2.8 and 5.4 mm yr−1) compared to reported rates for various lithologies and climate patterns (e.g. André, 1997; Barsch, 1977; Beylich, 2000; Curry and Morris, 2004; Hinchliffe and Ballantyne, 1999; Höllerman, 1983; Humlum, 2000; Olyphant, 1983; Sass, 1998). They are nonetheless perfectly consistent with those reported by Hétu and Gray (2000) for a 40 m flysch rockwall in the same study area (3.2 mm yr−1). Those rates were measured by weighing the sediment accumulated on plastic tarps placed at the foot of rockwalls (Hétu and Gray, 2000). Direct measurements by TLS are extremely accurate, making it possible to quantify the erosion rates of rockwalls in their morphoclimatic environments with a greater degree of certainty. The agreement between the results from the two methods demonstrates that they are both valid. However, surveys over very short periods clearly tend to underestimate actual rates by limiting the likelihood of observing very high magnitude events that would have a significant influence on erosion rate (e.g. Korup and Clague, 2009; Krautblatter and Dikau, 2007). Continuing to survey these rockwalls would confirm the accuracy of the erosion rates presented here. TLS is a modern method that merits more widespread use in monitoring projects of this type and to build on our understanding of rockwall retreat and erosional feature dynamics (e.g. Ballantyne and Kirkbride, 1987; Duszyński et al., 2019; Higgins and Coates, 1990; Rapp, 1960).
5.2 Relationship between meteorological conditions and rockfall
Rockfall frequency during RAINY periods was 1.7 times higher than the mean relative to DRY periods. The highest-magnitude and strongest-intensity rain event (HEAVY RF) was associated with rockfall frequency 9.3 times higher than the study period mean or 21.6 times higher than during a dry period. Only RAINY conditions led to an increased frequency of low-magnitude instabilities, while HEAVY RF conditions resulted in a significant increase in the frequency of high-magnitude instabilities (Fig. 10). These results agree with those obtained in other geological and climatic contexts. For the limestone rockwalls of Isère, France, D'Amato et al. (2016) showed that rockfall frequency was 2.5 to 3 times higher during rain events than during the dry summer period, up to 7.5 higher during high-magnitude rain (> 30 mm) and 27 higher during high-intensity rain (> 5 mm h−1). For the rockwalls of the island of Réunion, Delonca et al. (2014) showed that high-magnitude rain (> 120 mm) resulted in an 8-fold increase in the probability of daily rockfall. The lack of a time lag between rain events and instabilities shows that this precipitation has a nearly immediate (< 24 h) triggering effect on rock instabilities. In the Japanese Alps, Matsuoka (2019) demonstrated the impact of liquid precipitation on increased water content and subsequent rockfall triggering. Certain high-intensity rain events were associated with instabilities of 1 m to multiple meters in size. These studies, like our own, clearly show that rain events are aggravating and triggering factors of rockfall. However, they do not detail the process by which rainwater contributes to the formation of instabilities or improve our understanding of how water moves through the highly fractured rock layer near rockwall surfaces (Magnin et al., 2021; Stoll et al., 2020). It is well known that an increase in hydrostatic pressure in discontinuities reduces shear strength (Selby, 1993; Wieczorek and Jäger, 1996; Wyllie and Mah, 2004). Groundwater recharge and hydrostatic pressure at depth have been put forward as kinematic factors in large rockslides (Cloutier et al., 2015; Crosta et al., 2013). However, how rainwater influences the development of superficial instabilities is less well documented. In clay-rich rock, it has been shown that water content variations at the rockwall surface lead to irreversible mechanical deformations (Birien and Gauthier, 2022) that could trigger rockfall. Rockwall surfaces can experience wide fluctuations in water content. Rain events result in subsurface runoff in the altered surface layer of rockwalls and represent a significant water input. This input can be amplified when wind spreads a layer of rainwater over rockwall surfaces (Sass, 2005). This type of subsurface runoff can clearly contribute to reducing shear strength and trigger rockfall during high-intensity rain events (Selby, 1993). Conversely, direct solar radiation on rockwall surfaces can lead to rapid and significant drying of the first decimeters of rock (Burnett et al., 2008). Limited access to rockwalls and the challenge of directly measuring water pressure limit our ability to measure moisture dynamics in this surface layer of rock and interpret its influence on the development of rock instabilities.
In this study, rockfall frequency was 11.7 times higher during winter freeze–thaw cycles (WIN. FT) than during cold periods when the temperature remains below the freezing point (WIN. < 0 ∘C). We therefore observe that high rockfall frequencies occur during thawing periods (WIN. FT), while rockwalls remain very stable during the phases of the freezing process (WIN. < 0 ∘C). The freezing phase can cause fractures to open (Coutard and Francou, 1989; Matsuoka, 2008; Matsuoka and Sakai, 1999). However, cohesion at the ice–rock interface is generally sufficient to hold newly unstable blocks of rock in place (Fiorio et al., 2002; Krautblatter et al., 2013). Consequently, rockfalls occur when the ice melts, such as during winter freeze–thaw cycles. This finding supports those of D'Amato et al. (2016), who showed that in limestone rockwalls in Isère, France, the frequency of rock instabilities is 7 times higher during freeze–thaw cycles. Similarly, Delonca et al. (2014) found that rockfall frequency was doubled on basalt and granite rockwalls in Auvergne, France, for freeze–thaw cycles with a minimum temperature of −5 ∘C. Our results also show that freeze–thaw cycles are associated with a very high frequency of low- and moderate-magnitude events but that their impact is limited when it comes to higher-magnitude events (Fig. 10a). This is consistent with the fact that winter freeze–thaw cycles influenced only the first 15 cm from the surface (Fig. 9a). Winter thaws can be accompanied by rainfall (Fig. 9), and a compounding effect of these conditions probably occurs when they are combined. Autumn freeze–thaw cycles (AUT. FT) do not appear to be as effective at developing rock instabilities as winter freeze–thaw cycles. Their associated frequency of rockfall is near the annual mean for both low- and high-magnitude instabilities (Fig. 10a). This is likely partly due to the fact that autumn freeze–thaw cycles were not studied individually. The two AUT. FT periods were 28 and 51 d long, respectively. They also coincided with weather conditions unmarked by high rockfall frequency that decreased the average frequency of rockfall specific to autumn freeze–thaw cycles. Matsuoka (2019) also notes that even if the temperature fluctuations around the freezing point penetrate to 40 cm in depth, the water in the pores and discontinuities does not necessarily freeze – or freeze completely – due to its high heat capacity. Lastly, the high-intensity autumn rain events that preceded the period of many autumn freeze–thaw cycles (AUT. FT) may have purged the rockwall surface of its most unstable rock, leaving very little rock in a nearly unbalanced state.
The superficial spring thawing phase (SPR.0–50) does not appear to be a particularly unstable period, even for low-magnitude events (Fig. 10a). However, the thaw in the first meter of rockwall (SPR.50–100) results in very high frequency of moderate-magnitude instabilities. When thawing at depth (SPR.100–350) occurs, the frequency of high-magnitude instabilities increases (Fig. 10a). This relationship between seasonal freezing depth and rockfall magnitude is widely recognized (e.g. Dramis et al., 1995; Matsuoka, 2019; Matsuoka and Murton, 2008), but for the first time, this study compares the magnitude of rock instabilities with measurements of the spring thawing front at depth. The winter freeze–thaw cycles (WIN. FT) that occurred before the first thawing phase (SPR.0–50) may have been responsible for purging the first decimeters of rockwall surfaces and explain why SPR.0–50 conditions are not associated with an unstable period. This surface thaw phase lasted 23 d. During that period, negative temperatures continued to dominate (conditions equivalent to WIN. < 0 ∘C) and probably tended to attenuate rockfall frequency throughout the period. At greater depth, the spring thaw is the only thaw of the year (Figs. 7 and 9). Consequently, the mechanical action of this high-amplitude freeze–thaw cycle has strong potential to destabilize rock portions (Dramis et al., 1995; Matsuoka, 2019; Matsuoka and Murton, 2008). The impact of the spring thaw on high-magnitude rockfall is amplified by water advection associated with snow cover melting, groundwater recharge, and ice melting in rock discontinuities and pores. As spring progresses, rain precipitation becomes predominant, further increasing water inputs (Hasler et al., 2011). Large-magnitude rockfall is likely to result from the reduced cohesion associated with ice melt and increases in hydrostatic and interstitial pressure in the altered layer of rockwall surfaces (Matsuoka, 2019; Schovanec, 2020; Wieczorek and Jäger, 1996).
Among the contributing factors to rock instability development, the roles of precipitation and freeze–thaw cycles are predominant (e.g. Collins and Stock, 2016; Coutard and Francou, 1989; D'Amato et al., 2016; Hungr et al., 1999; Matsuoka and Sakai, 1999; Rapp, 1960; Wieczorek and Jäger, 1996). To a lesser degree, other weather phenomena can trigger rockfall. Large temperature fluctuations cause expansion and contraction within rock masses that can eventually result in rockfall (Collins and Stock, 2016; Eppes et al., 2016; Matsuoka, 2019). The impact of thermal cycles on the rockfall dynamics of the highly altered north-facing rockwalls of Haute-Gaspésie was considered to be minor and was not quantified in this study.
5.3 Rockfall hazard management
The magnitude of rockfalls is a major issue in risk management. Large-dimension blocks tend to travel longer distances (e.g. Dorren, 2003). If they reach part of the natural or built environment that is exposed, they have a larger probability of causing damage. Therefore, in risk management, a high frequency of high-magnitude events does not have the same significance as a high frequency of low-magnitude events. The rockfall on 16 April 2019 that occurred 1.3 km west of the MAE site resulted in the temporary closure of Route 132 (Fig. 11). It took place 18 h after the first thaw to 60 cm in depth and coincided with the spring thaw (SPR.50–100). It also occurred immediately after a 20.1 mm rainfall event (HEAVY RF). In retrospect, the SPR.50–100 and HEAVY RF conditions meant that extremely high frequency high-magnitude rockfall was likely (Fig. 10). From a risk management standpoint, forecasting a major event such as the one on 16 April 2019 is possible using the risk assessment matrix developed in this study. High-intensity rain (HEAVY RF) and spring thaw SPR.100–350 were identified as the weather conditions of greatest concern for public safety, since they result in extreme-frequency high-magnitude events (Fig. 10a). In our first full year of data collection (14 June 2019–13 June 2020), these conditions only occurred on 11 d (Fig. 10b). The other weather conditions that lead to increased rockfall frequency and magnitude (WIN. FT, SPR.0–50, SPR.50–100 and AUT. FT) add 44 more days of concern. From the perspective of rockfall forecasting, it is noteworthy that potentially hazardous conditions are present on only 55 d annually for users of Route 132. In the year under study, heightened vigilance was needed on only 15 % of the days on an annual scale (Fig. 10b) that has wide seasonal disparities (Figs. 9 and 10). The ministère des Transports du Québec could implement different risk mitigation measures targeted for the weather conditions forecast by the weather models.
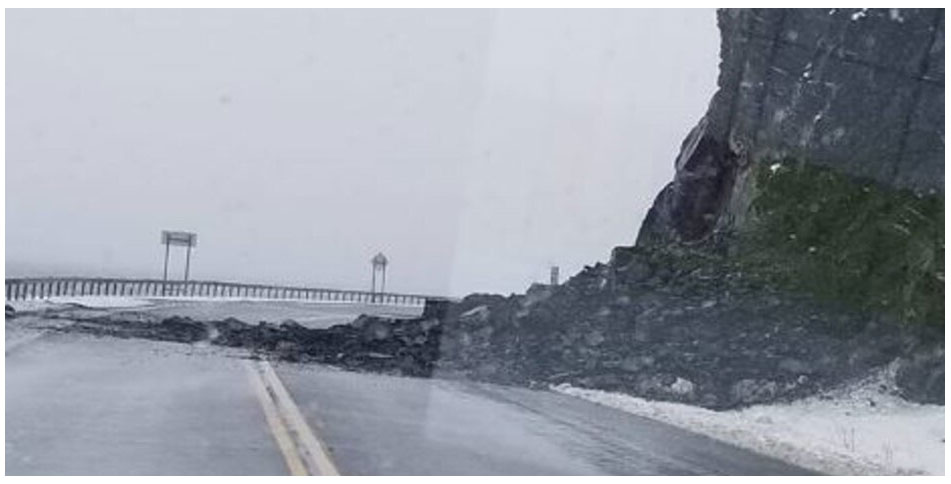
Figure 11Rockfall that occurred on 16 April 2019, obstructing Route 132. © Philippe Langlais, TVA Nouvelles.
While RAINY conditions do not stand out in this study for causing high-frequency and/or high-magnitude rock instabilities, rain events should be given special attention. Our methodology did not make it possible to clearly encompass all rain events on an annual scale. Given that HEAVY RF conditions are associated with extreme-frequency high-magnitude events, moderate-intensity rain events must also feed back into frequencies and magnitudes of concern for the safety of Route 132 users. The same reasoning applies to the AUT. FT period. Had it been possible to better monitor autumn freeze–thaw cycles, they would likely have shown a frequency of associated rock instabilities more similar to that of winter freeze–thaw cycles (WIN. FT).
This study highlights that rockfall dynamics are strongly controlled by the weather conditions and by the thermal regime of the rock slopes. Some of these conditions are associated with rockwall stability, while others significantly increase rockfall frequency and/or magnitude (Figs. 8, 9 and 10). Because of the inconsistency of weather conditions in terms of duration (e.g. a cold winter period versus a winter thaw), we propose to focus on an event-based monitoring approach rather than a period-based approach to survey rockfalls. This approach allows us to differentiate the respective impacts of different meteorological events that cannot be easily distinguished on a periodic scale, since their occurrences overlap. For an equivalent number of surveys and therefore for the same effort, this event-based monitoring approach is more relevant to identifying weather conditions conducive to rockfalls of different magnitudes.
The influence of weather conditions on the occurrence of rock instabilities is now widely recognized in the scientific community. This study proposed to quantify rockfall volumes using lidar during previously selected weather conditions rather than taking regular surveys (weekly, monthly, seasonal). For an equivalent number of surveys and therefore for the same effort, this protocol made it possible to efficiently monitor the influence of weather conditions on rockfall frequency and magnitude. Over 18 months, 17 surveys were carried out on three rockwalls with a total area of 12 056 m2. They made it possible to monitor a range of weather conditions and identify 1287 rockfalls. The rockwall erosion rate during that period was 2.8–5.4 mm yr−1, which is among the highest in the world but comparable to other observations in this type of lithology (e.g. André, 1997; Barsch, 1977; Beylich, 2000; Curry and Morris, 2004; Hinchliffe and Ballantyne, 1999; Höllerman, 1983; Humlum, 2000; Olyphant, 1983; Sass, 1998).
Some of the weather conditions are associated with periods of rockwall stability (dry summer and cold winter periods), while others significantly increase rockfall frequency and/or magnitude (winter freeze–thaw cycles, spring thaw, high-intensity rainfall). Winter freeze–thaw cycles and moderate rainfall lead to an increase in the frequency of low-magnitude rock instabilities. High-intensity rainfall and spring thaw coincide with a significant increase in the frequency of large-dimension rockfall. In the realm of rockfall prevention, this study showed the importance of quantifying rockfall magnitude, since the relationship between weather conditions and rockfall frequency is not necessarily applicable to rockfall magnitude. The results allow weather conditions to be categorized by their ability to trigger rock instabilities of varying magnitudes. Using this combined with current or forecast weather conditions, different risk mitigation measures to limit safety hazards can be implemented.
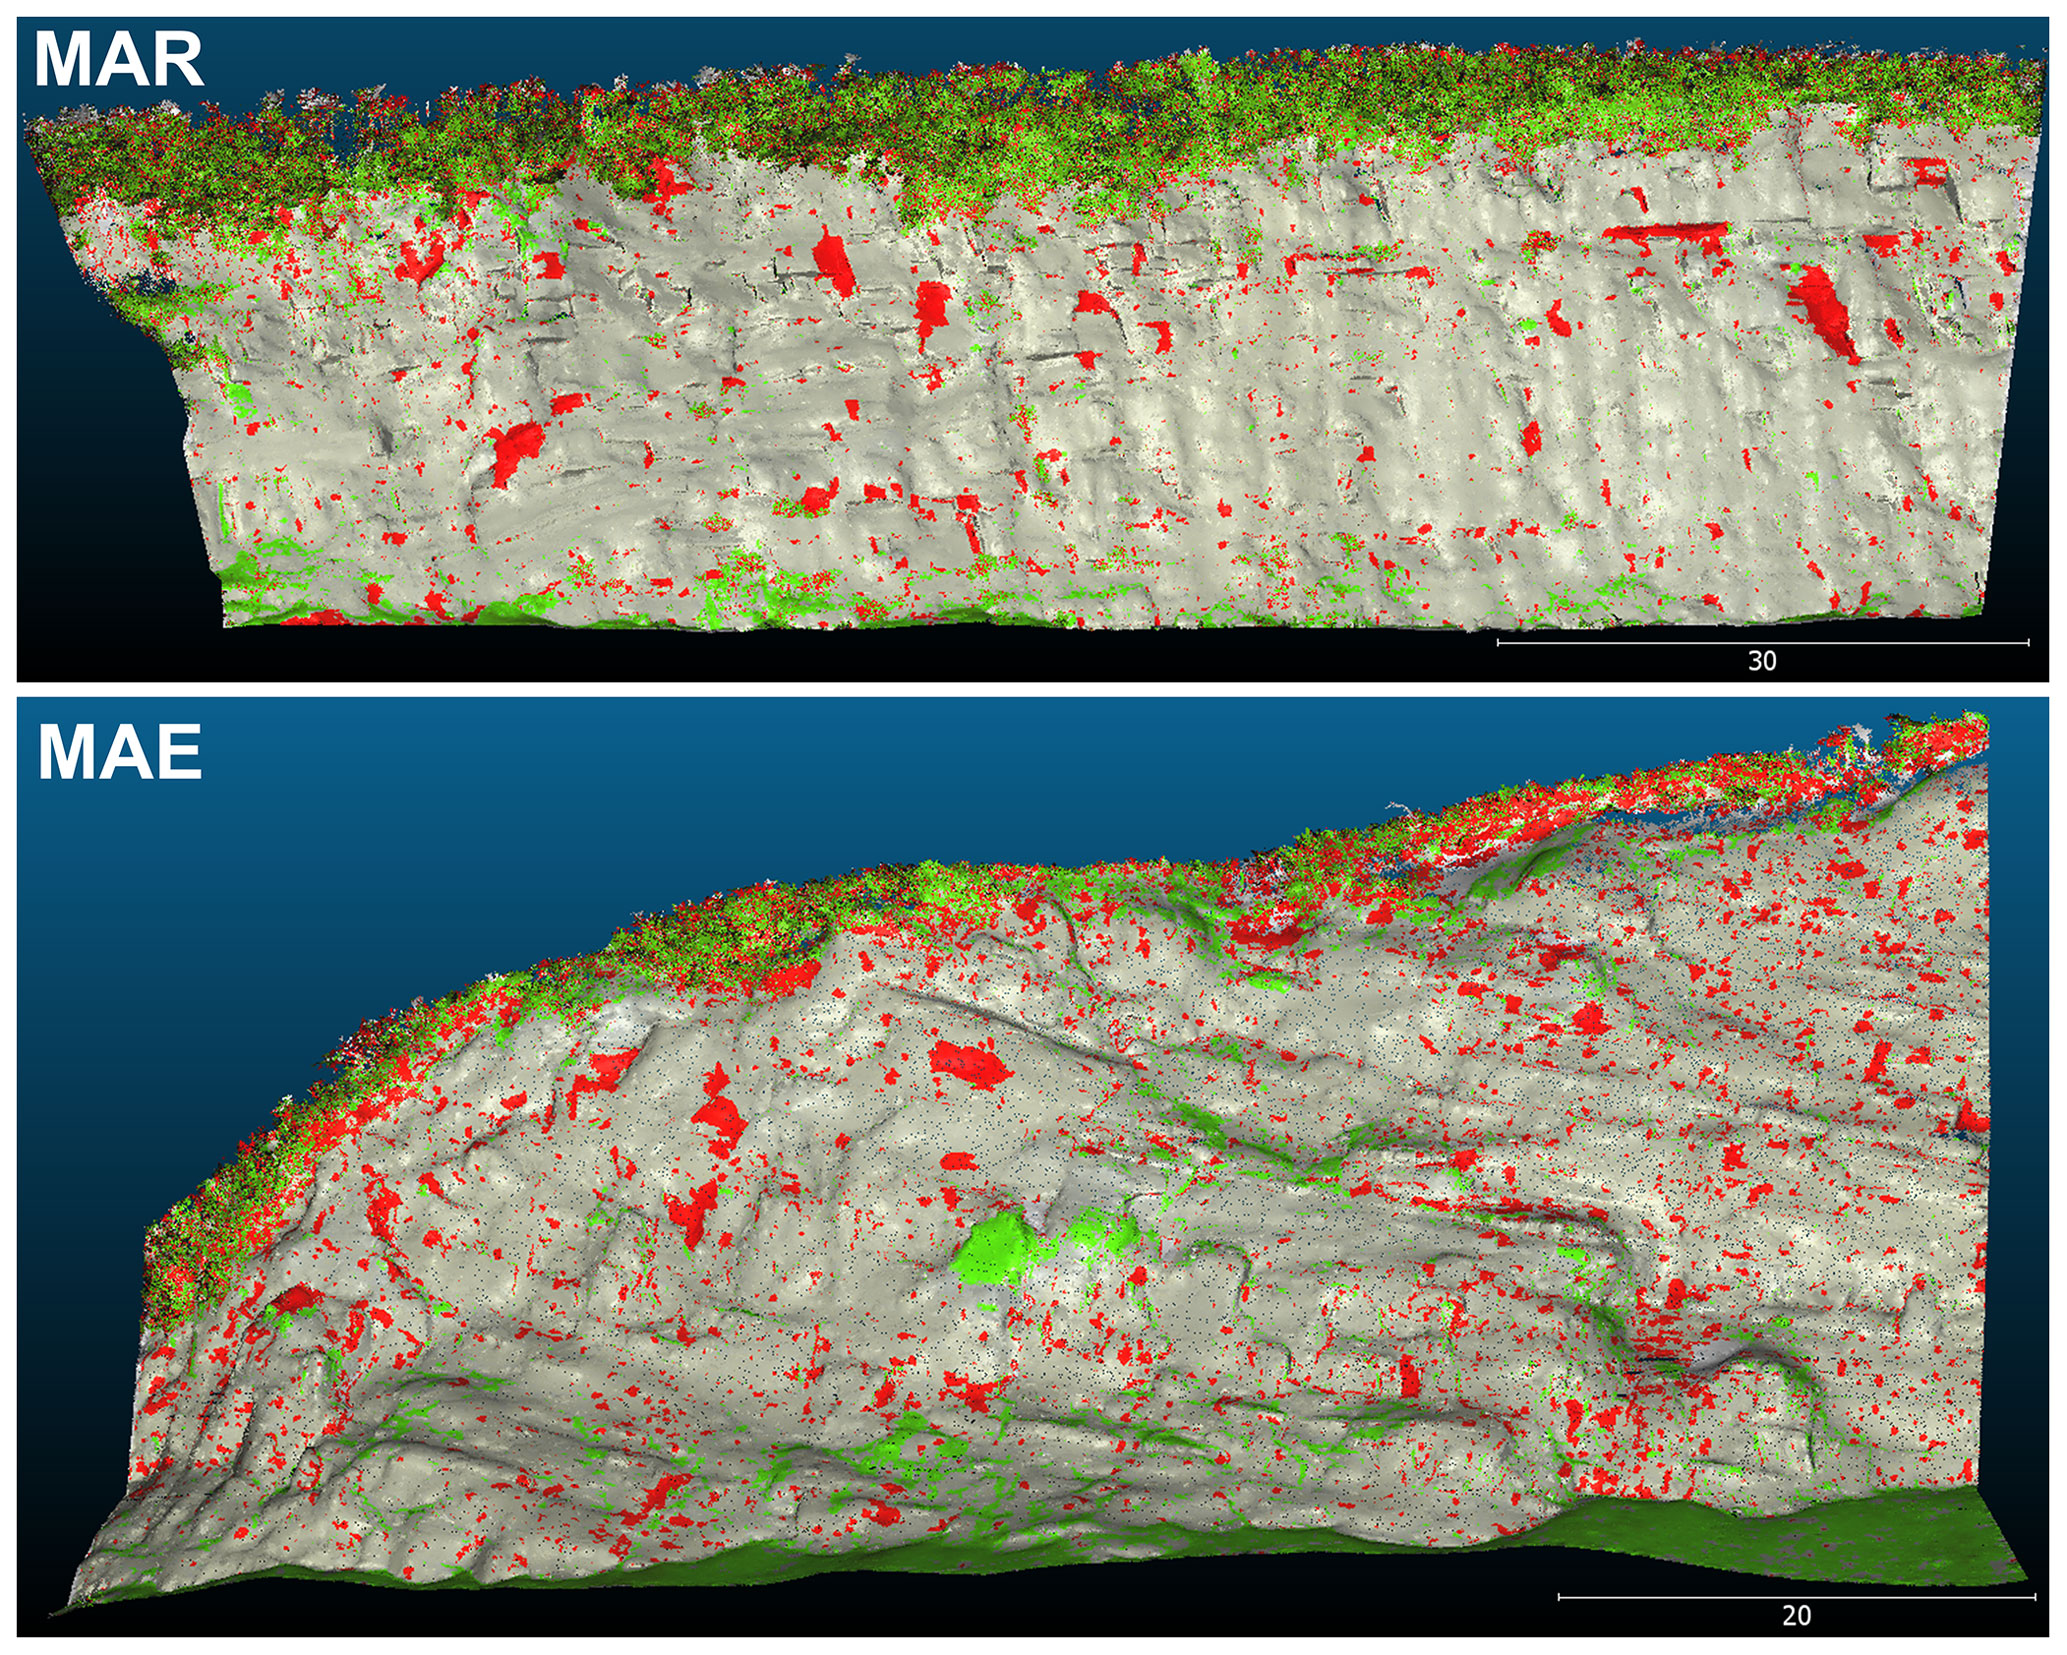
Figure A1Point cloud of main changes between the first (14 June 2019) and last (18 December 2020) scan surveys of MAR and MAE sites. Red points show negative changes; green points show positive changes.
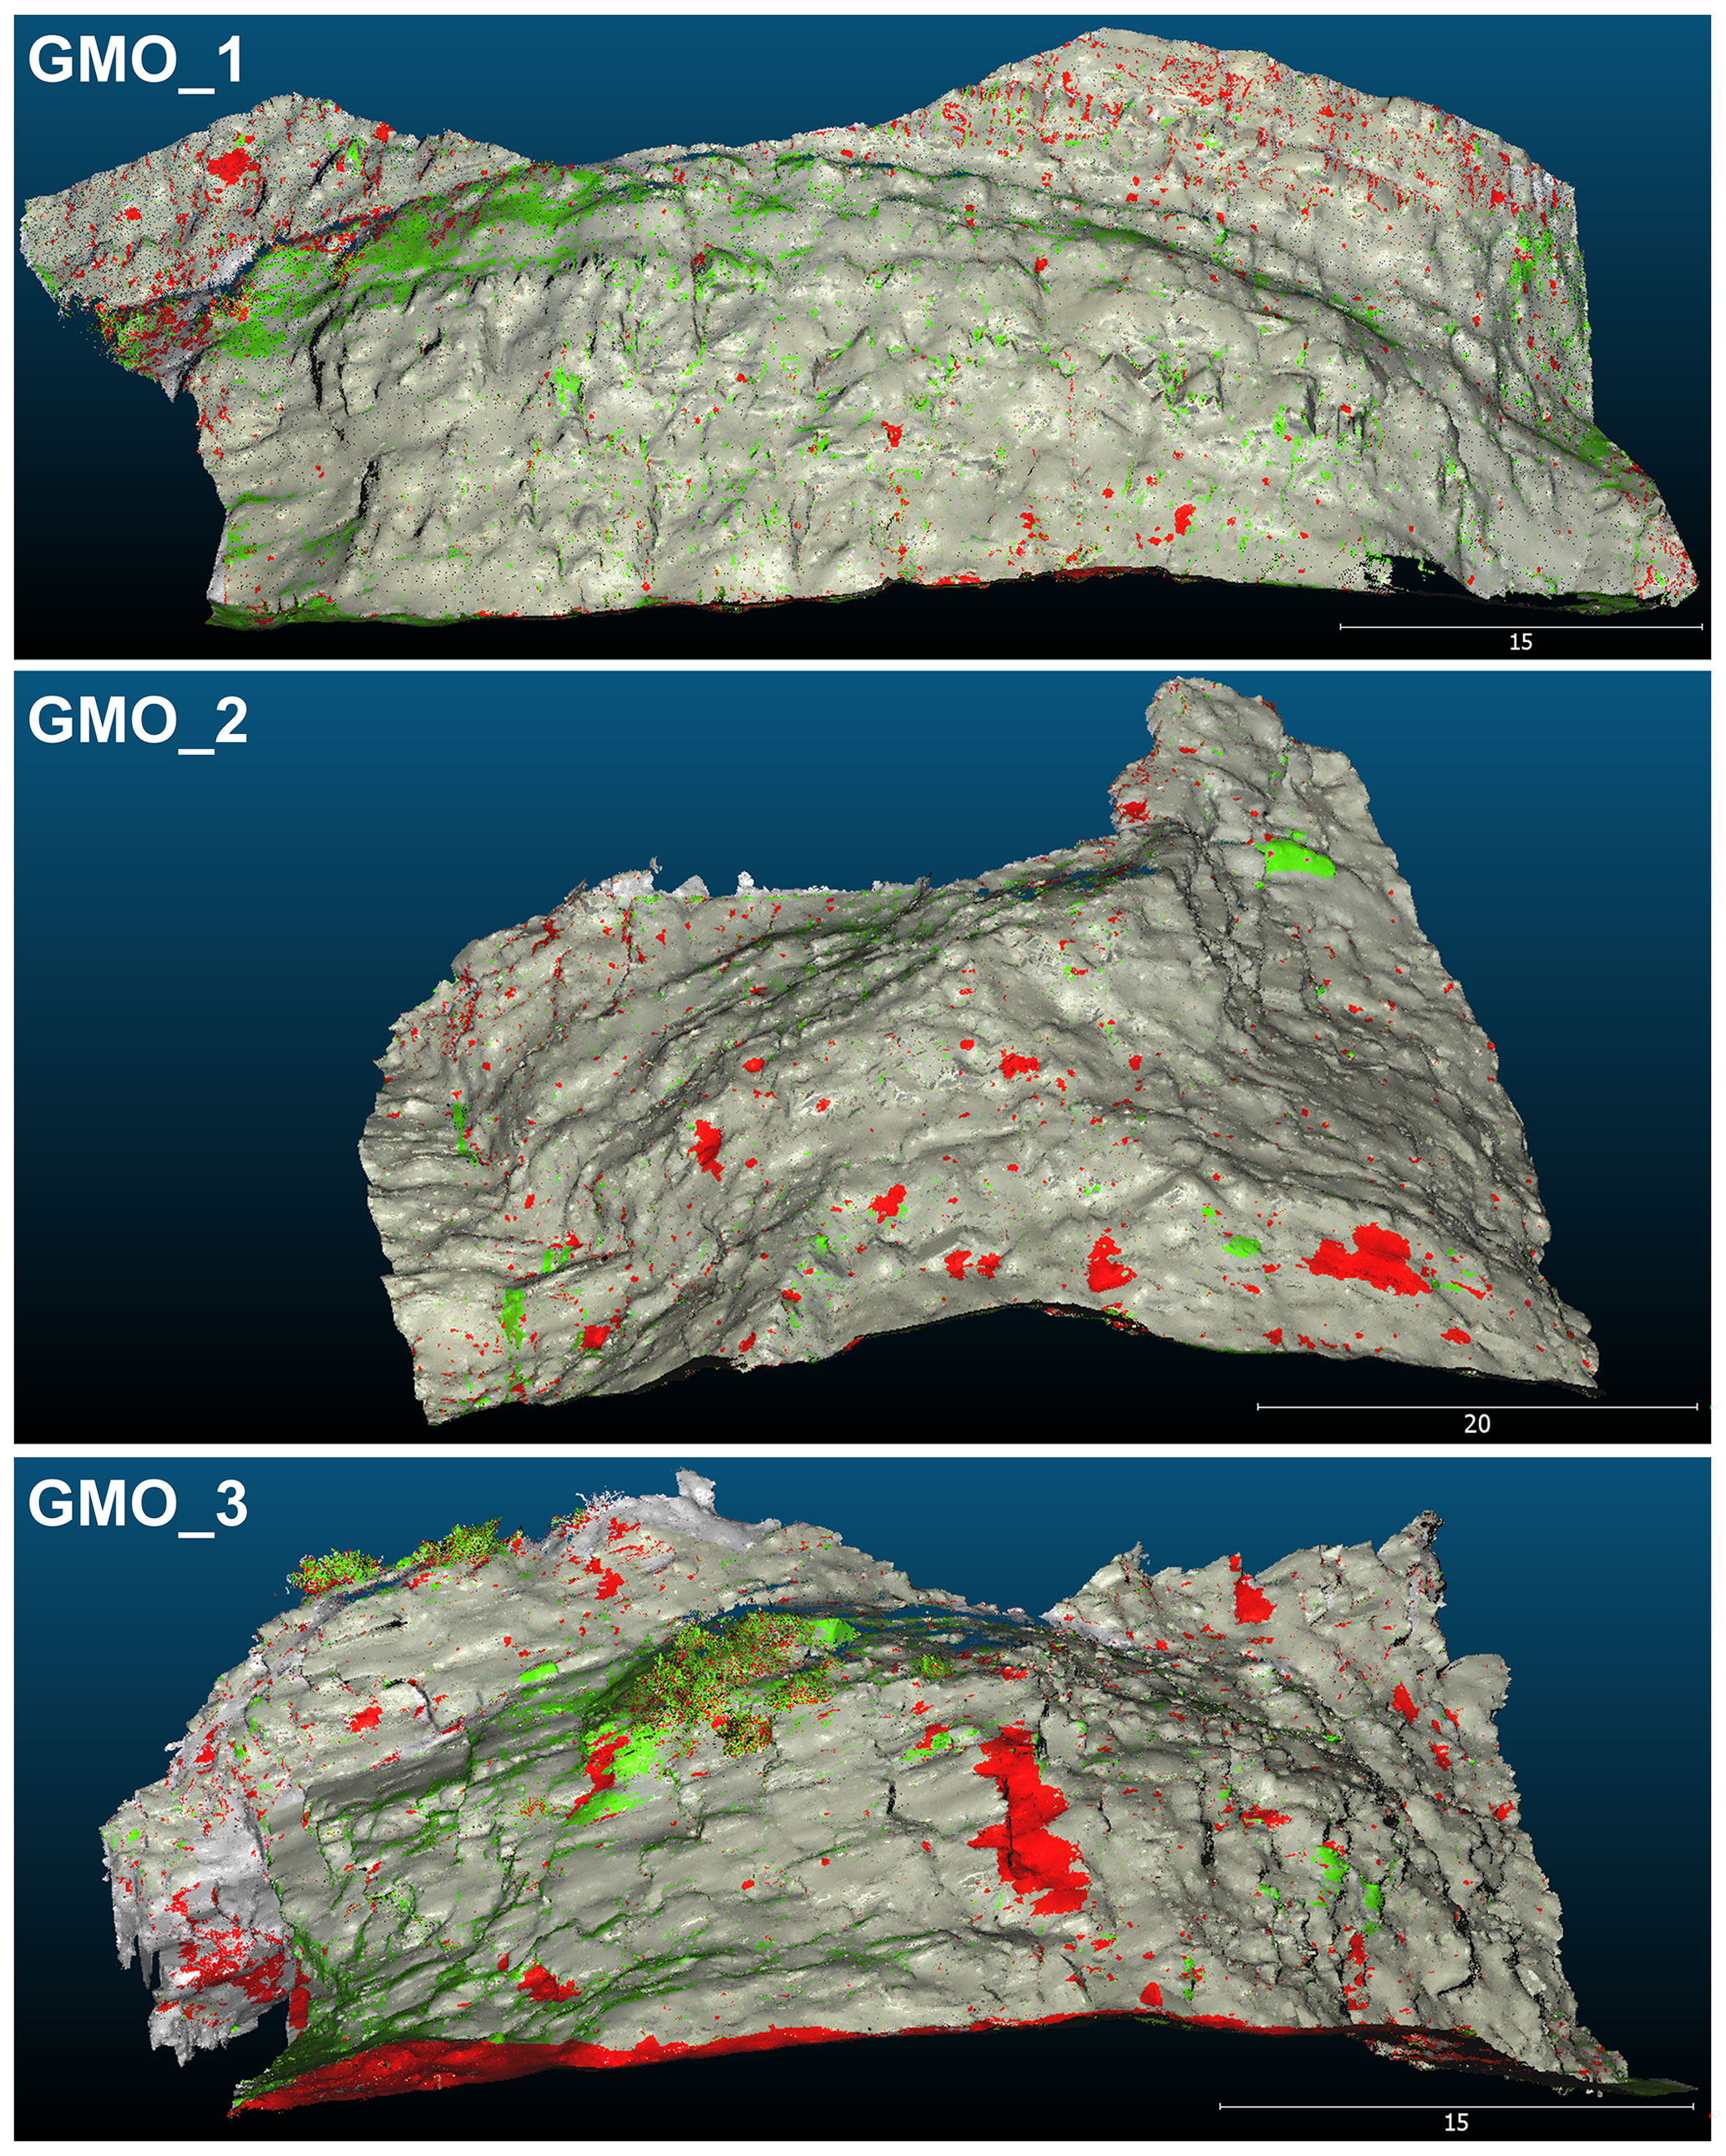
Figure A2Point cloud of main changes between the first (14 June 2019) and last (18 December 2020) scan surveys of three GMO sites. Red points show negative changes; green points show positive changes.
All the data collected during this study are available on request. Codes were only used to realize Fig. 7 and can also be sent on request.
TB carried out the fieldwork, developed the data processing, carried out the data analysis and wrote the manuscript. FGa helped to develop the initial idea and to prepare the manuscript.
The contact author has declared that neither of the authors has any competing interests.
Publisher's note: Copernicus Publications remains neutral with regard to jurisdictional claims in published maps and institutional affiliations.
This article is part of the special issue “Hydro-meteorological extremes and hazards: vulnerability, risk, impacts, and mitigation”. It is a result of the European Geosciences Union General Assembly 2022, Vienna, Austria, 23–27 May 2022.
We thank the ministère des Transports du Québec (MTQ) as well the Natural Sciences and Engineering Research Council of Canada (NSERC) for funding this research. We acknowledge the LGGRM members who helped us with the instrumentation process of the study sites, maintenance and data collection. We also would like to thank the two anonymous referees of Natural Hazards and Earth System Sciences whose valuable comments improved the quality of the paper.
This research has been supported by the service de la géotechnique et de la géologie of the ministère des Transports du Québec (MTQ) and by the Natural Sciences and Engineering Research Council of Canada (NSERC).
This paper was edited by Nadav Peleg and reviewed by two anonymous referees.
Abellán, A., Oppikofer, T., Jaboyedoff, M., Rosser, N. J., Lim, M., and Lato, M. J.: Terrestrial laser scanning of rock slope instabilities, Earth Surf. Proc. Land., 39, 80–97, https://doi.org/10.1002/esp.3493, 2014.
André, M. F.: Holocene rockwall retreat in Svalbard: a triple-rate evolution, Earth Surf. Proc. Land., 22, 423–440, https://doi.org/10.1002/(SICI)1096-9837(199705)22:5<423::AID-ESP706>3.0.CO;2-6, 1997.
Badger, T. C. and Lowell, S. M.: Rockfall Control in Washington State, rockfall prediction and control and landslide case histories, Transp. Res. Rec., 1343, 14–19, 1992.
Badoux, A., Andres, N., Techel, F., and Hegg, C.: Natural hazard fatalities in Switzerland from 1946 to 2015, Nat. Hazards Earth Syst. Sci., 16, 2747–2768, https://doi.org/10.5194/nhess-16-2747-2016, 2016.
Ballantyne, C. K. and Kirkbride, M. P.: Rockfall activity in upland Britain during the Loch Lomond Stadial, Geogr. J., 153, 86–92, https://doi.org/10.2307/634474, 1987.
Barlow, J., Lim, M., Rosser, N., Petley, D., Brain, M., Norman, E., and Geer, M.: Modeling cliff erosion using negative power law scaling of rockfalls, Geomorphology, 139–140, 416–424, https://doi.org/10.1016/j.geomorph.2011.11.006, 2012.
Barsch, D.: Eine Abschätzung von Schuttproduktion und Schutttransport im Bereich aktiver Blockgletscher in den Sch weitzer Alpen, Z. Geomorphol., Neue Folge, Supplement, 28, 148–160, https://doi.org/10.1007/978-3-642-80093-1_13, 1977.
Beck, H. E., Zimmermann, N. E., McVicar, T. R., Vergopolan, N., Berg, A., and Wood, E. F.: Present and future köppen-geiger climate classification maps at 1-km resolution, Sci. Data, 5, 1–12, https://doi.org/10.1038/sdata.2018.214, 2018.
Beylich, A. A.: Geomorphology, Sediment Budget, and Relief Development in Austdalur, Austfirðir, East Iceland, Arctic, Antarct. Alp. Res., 32, 466–477, https://doi.org/10.1080/15230430.2000.12003391, 2000.
Birien, T. and Gauthier, F.: Influence of climate-dependent variables on deformation and differential erosion of stratified sedimentary rocks, Geomorphology, 421, 108518, https://doi.org/10.2139/ssrn.4046480, 2022.
Budetta, P.: Assessment of rockfall risk along roads, Nat. Hazards Earth Syst. Sci., 4, 71–81, https://doi.org/10.5194/nhess-4-71-2004, 2004.
Bunce, C. M., Cruden, D. M., and Morgenstern, N. R.: Assessment of the hazard from rock fall on a highway, Can. Geotech. J., 34, 344–356, https://doi.org/10.1139/cgj-34-3-344, 1997.
Burnett, B. N., Meyer, G. A., and McFadden, L. D.: Aspect-related microclimatic influences on slope forms and processes northeastern Arizona, J. Geophys. Res.-Earth, 113, 1–18, https://doi.org/10.1029/2007JF000789, 2008.
Chau, K. T., Wong, R. H. C., Liu, J., and Lee, C. F.: Rockfall Hazard Analysis for Hong Kong Based on Rockfall Inventory, Rock Mech. Rock Eng., 36, 383–408, https://doi.org/10.1007/s00603-002-0035-z, 2003.
Cloutier, C., Locat, J., Charbonneau, F., and Couture, R.: Understanding the kinematic behavior of the active Gascons rockslide from in-situ and satellite monitoring data, Eng. Geol., 195, 1–15, https://doi.org/10.1016/j.enggeo.2015.05.017, 2015.
Collins, B. D. and Stock, G. M.: Rockfall triggering by cyclic thermal stressing of exfoliation fractures, Nat. Geosci., 9, 395–400, https://doi.org/10.1038/ngeo2686, 2016.
Coutard, J. P. and Francou, B.: Rock temperature measurements in two alpine environments: implications for frost shattering, Arct. Alp. Res., 21, 399–416, https://doi.org/10.2307/1551649, 1989.
Crosta, G. B., di Prisco, C., Frattini, P., Frigerio, G., Castellanza, R., and Agliardi, F.: Chasing a complete understanding of the triggering mechanisms of a large rapidly evolving rockslide, Landslides, 11, 747–764, https://doi.org/10.1007/s10346-013-0433-1, 2013.
Curry, A. M. and Morris, C. J.: Lateglacial and Holocene talus slope development and rockwall retreat on Mynydd Du, UK, Geomorphology, 58, 85–106, https://doi.org/10.1016/S0169-555X(03)00226-5, 2004.
D'Amato, J., Hantz, D., Guerin, A., Jaboyedoff, M., Baillet, L., and Mariscal, A.: Influence of meteorological factors on rockfall occurrence in a middle mountain limestone cliff, Nat. Hazards Earth Syst. Sci., 16, 719–735, https://doi.org/10.5194/nhess-16-719-2016, 2016.
Delonca, A., Gunzburger, Y., and Verdel, T.: Statistical correlation between meteorological and rockfall databases, Nat. Hazards Earth Syst. Sci., 14, 1953–1964, https://doi.org/10.5194/nhess-14-1953-2014, 2014.
Dorren, L. K. A.: A review of rockfall mechanics and modelling approaches, Prog. Phys. Geogr., 27, 69–87, https://doi.org/10.1191/0309133303pp359ra, 2003.
Draebing, D. and Krautblatter, M.: The Efficacy of Frost Weathering Processes in Alpine Rockwalls, Geophys. Res. Lett., 46, 6516–6524, https://doi.org/10.1029/2019GL081981, 2019.
Dramis, F., Govi, M., Guglielmin, M., and Mortara, G.: Mountain permafrost and slope instability in the Italian Alps: The Val Pola Landslide, Permafr. Periglac. Process., 6, 73–81, https://doi.org/10.1002/ppp.3430060108, 1995.
Drejza, S., Bernatchez, P., Marie, G. and Friesinger, S.: Quantifying road vulnerability to coastal hazards: Development of a synthetic index, Ocean Coast. Manage., 181, 104894, https://doi.org/10.1016/j.ocecoaman.2019.104894, 2019.
Duszyński, F., Migon, P., and Strzelecki, M. C.: Escarpment retreat in sedimentary tablelands and cuesta landscapes – Landforms, mechanisms and patterns, Earth-Sci. Rev., 196, 102890, https://doi.org/10.1016/j.earscirev.2019.102890, 2019.
Environnement Canada: Compilation des données historiques à la station météorologique de Cap-Madeleine, https://climat.meteo.gc.ca/historical_data/search_historic_data_f.html, last access: 22 November 2021.
Eppes, M. C., Magi, B., Hallet, B., Delmelle, E., Mackenzie-Helnwein, P., Warren, K., and Swami, S.: Deciphering the role of solar-induced thermal stresses in rock weathering, Bull. Geol. Soc. Am., 128, 1315–1338, https://doi.org/10.1130/B31422.1, 2016.
Erismann, T. and Abele, G.: Dynamics of rockslides and rockfalls, edited by Springer, Heidelberg New York, Berlin, ISBN 3-540-67198-6, 2001
Fiorio, B., Meyssonnier, J., and Boulon, M.: Experimental study of the friction of ice over concrete under simplified ice-structure interaction conditions, Can. J. Civ. Eng., 29, 347–359, https://doi.org/10.1139/l02-012, 2002.
Fortin, G., Hétu, B., and Germain, D.: Climat hivernal et régimes avalancheux dans les corridors routiers de La Gaspésie septentrionale (Québec, Canada), Climatologie, 8, 9–25, https://doi.org/10.4267/climatologie.202, 2011.
Fortin, G., Hétu, B., Gauthier, F., and Germain, D.: Extrêmes météorologiques et leurs impacts géomorphologiques: le cas de la Gaspésie, in: XXVIIIe Colloque de l'Association Internationale de Climatologie, Liège, Belgium, 469–474, 2015.
Gauthier, F., Hétu, B., and Allard, M.: Forecasting method of ice blocks fall using logistic model and melting degree–days calculation: a case study in northern Gaspésie, Québec, Canada, Nat. Hazards, 79, 855–880, https://doi.org/10.1007/s11069-015-1880-x, 2015.
Gauthier, F., Germain, D., and Hétu, B.: Logistic models as a forecasting tool for snow avalanches in a cold maritime climate: northern Gaspésie, Québec, Canada, Nat. Hazards, 89, 201–232, https://doi.org/10.1007/s11069-017-2959-3, 2017.
Guerin, A., Hantz, D., Rossetti, J.-P., and Jaboyedoff, M.: Brief communication”Estimating rockfall frequency in a mountain limestone cliff using terrestrial laser scanner”, Nat. Hazards Earth Syst. Sci. Discuss., 2, 123–135, https://doi.org/10.5194/nhessd-2-123-2014, 2014.
Guerin, A., Stock, G. M., Radue, M. J., Jaboyedoff, M., Collins, B. D., Matasci, B., Avdievitch, N., and Derron, M. H.: Quantifying 40 years of rockfall activity in Yosemite Valley with historical Structure-from-Motion photogrammetry and terrestrial laser scanning, Geomorphology, 356, 107069, https://doi.org/10.1016/j.geomorph.2020.107069, 2020.
Gunzburger, Y., Merrien-Soukatchoff, V., and Guglielmi, Y.: Influence of daily surface temperature fluctuations on rock slope stability: Case study of the Rochers de Valabres slope (France), Int. J. Rock Mech. Min. Sci., 42, 331–349, https://doi.org/10.1016/j.ijrmms.2004.11.003, 2005.
Hasler, A., Gruber, S., Font, M., and Dubois, A.: Advective heat transport in frozen rock clefts: Conceptual model, laboratory experiments and numerical simulation, Permafr. Periglac. Process., 22, 378–389, https://doi.org/10.1002/ppp.737, 2011.
Hétu, B.: Analysis of the weather conditions leading to avalanche activity along transportation roads in Northern Gaspésie, Canada, Géographie Phys. Quat., 61, 2–3, 165–180, https://doi.org/10.7202/038990ar, 2007.
Hétu, B. and Gray, J. T.: Effects of environmental change on scree slope development throughout the postglacial period in the Chic Choc Mountains in northern Gaspé Peninsula, Québec, Geomorphology, 32, 3–4, 335–355, https://doi.org/10.1016/S0169-555X(99)00103-8, 2000.
Higgins, C. G. and Coates, D. R.: Groundwater geomorphology: The role of subsurface water in Earth-surface processes and landforms, edited by: Geological Society of America, Special Paper 252, Boulder, Colorado, https://doi.org/10.1130/SPE252 1990.
Hilker, N., Badoux, A., and Hegg, C.: The Swiss flood and landslide damage database 1972–2007, Nat. Hazards Earth Syst. Sci., 9, 913–925, https://doi.org/10.5194/nhess-9-913-2009, 2009.
Hinchliffe, S. and Ballantyne, C. K.: Talus accumulation and Rockwall retreat, Trotternish, isle of Skye, Scotland Talus Accumulation and Rockwall Retreat, Scot. Geogr. J., 115, 53–70, https://doi.org/10.1080/00369229918737057, 1999.
Höllerman, P.: Blockgletscher als Mesoformen der Periglazialstufe, Bonner Geogr. Abhandlungen, 67, in: Bonner Geographische Abhandlungen, ISBN: 3-427-76171-1, 1983.
Humlum, O.: The geomorphic significance of rock glaciers: Estimates of rock glacier debris volumes and headwall recession rates in West Greenland, Geomorphology, 35, 41–67, https://doi.org/10.1016/S0169-555X(00)00022-2, 2000.
Hungr, O., Evans, S. G., and Hazzard, J.: Magnitude and frequency of rock falls and rock slides along the main transportation corridors of southwestern British Columbia, Can. Geotech. J., 36, 224–238, https://doi.org/10.1139/t98-106, 1999.
Korup, O. and Clague, J. J.: Natural hazards, extreme events, and mountain topography, Quat. Sci. Rev., 28, 977–990, https://doi.org/10.1016/j.quascirev.2009.02.021, 2009.
Krautblatter, M. and Dikau, R.: Towards a uniform concept for the comparison and extrapolation of rockwall retreat and rockfall supply, Geogr. Ann. Ser. A Phys. Geogr., 89, 21–40, https://doi.org/10.1111/j.1468-0459.2007.00305.x, 2007.
Krautblatter, M., Funk, D., and Günzel, F. K.: Why permafrost rocks become unstable: A rock-ice-mechanical model in time and space, Earth Surf. Proc. Land., 38, 876–887, https://doi.org/10.1002/esp.3374, 2013.
Kromer, R. A., Rowe, E., Hutchinson, J., Lato, M., and Abellán, A.: Rockfall risk management using a pre-failure deformation database, Landslides, 15, 847–858, https://doi.org/10.1007/s10346-017-0921-9, 2018.
Lague, D., Brodu, N., and Leroux, J.: Accurate 3D comparison of complex topography with terrestrial laser scanner: Application to the Rangitikei canyon (N-Z), ISPRS J. Photogramm. Remote Sens., 82, 10–26, https://doi.org/10.1016/j.isprsjprs.2013.04.009, 2013.
Laliberté, J., Gauthier, F., and Birien, T.: Dynamique des parois de flysch (partie 3): prévision des chutes de pierres, edited by: Cloutier, C., Turmel, D., Maghoul, P., and Locat, A.: Proceedings of the 8th Canadian Conference on Geotechnique and Natural Hazards: Innovative geoscience for tomorrow, Quebec City, 12–15 June 2022, 395–402, ISBN 978-2-9821051-0-2, 2022.
Macciotta, R., Martin, C. D., Edwards, T., Cruden, D. M., and Keegan, T.: Quantifying weather conditions for rock fall hazard management, Georisk, 9, 171–186, https://doi.org/10.1080/17499518.2015.1061673, 2015.
Macciotta, R., Hendry, M., Cruden, D. M., Blais-Stevens, A., and Edwards, T.: Quantifying rock fall probabilities and their temporal distribution associated with weather seasonality, Landslides, 14, 2025–2039, https://doi.org/10.1007/s10346-017-0834-7, 2017.
Magnin, F., Josnin, J., Legay, A., Ravanel, L., Deline, P., and Duvillard, P. A.: Recent advances in Rock wall Permafrost Modelling to Understand Bedrock Failures Periglacial rock slope failures are increasing and impact Alpine and Arctic communities, International Association of Geomorphologists Webminar, March, https://hal.science/hal-03260747 (last access: 15 October 2022), 2021.
Malamud, B. D., Turcotte, D. L., Guzzetti, F., and Reichenbach, P.: Landslides, earthquakes, and erosion, Earth Planet. Sci. Lett., 229, 45–59, https://doi.org/10.1016/j.epsl.2004.10.018, 2004.
Matsuoka, N.: Frost weathering and rockwall erosion in the southeastern Swiss Alps: Long-term (1994–2006) observations, Geomorphology, 99, 353–368, https://doi.org/10.1016/j.geomorph.2007.11.013, 2008.
Matsuoka, N.: A multi-method monitoring of timing, magnitude and origin of rockfall activity in the Japanese Alps, Geomorphology, 336, 65–76, https://doi.org/10.1016/j.geomorph.2019.03.023, 2019.
Matsuoka, N. and Murton, J.: Frost Weathering: Recent Advances and Future Directions, Permafr. Periglac. Process., 19, 195–210, https://doi.org/10.1002/ppp.620, 2008.
Matsuoka, N. and Sakai, H.: Rockfall activity from an alpine cliff during thawing periods, Geomorphology, 28, 309–328, https://doi.org/10.1016/S0169-555X(98)00116-0, 1999.
Michoud, C., Derron, M.-H., Horton, P., Jaboyedoff, M., Baillifard, F.-J., Loye, A., Nicolet, P., Pedrazzini, A., and Queyrel, A.: Rockfall hazard and risk assessments along roads at a regional scale: example in Swiss Alps, Nat. Hazards Earth Syst. Sci., 12, 615–629, https://doi.org/10.5194/nhess-12-615-2012, 2012.
Ministère des Transports du Québec: Base de données événementielle des chutes de pierres entre 1987 et 2021, 2021.
Olyphant, G. A.: Analysis of the factors controlling cliff burial by talus within Blanca Massif, southern Colorado, USA., Arct. Alp. Res., 15, 65–75, https://doi.org/10.2307/1550982, 1983.
Oppikofer, T., Jaboyedoff, M., and Keusen, H. R.: Collapse at the eastern Eiger flank in the Swiss Alps, Nat. Geosci., 1, 531–535, https://doi.org/10.1038/ngeo258, 2008.
Oppikofer, T., Jaboyedoff, M., Blikra, L., Derron, M., and Metzger, R.: Lebensphasenspezifische Gesundheit von Kindern und Jugendlichen in Deutschland. Ergebnisse des Nationalen Kinder- und Jugendgesundheitssurveys, Bundesgesundheitsblatt. Gesundheitsforschung. Gesundheitsschutz, 52, 238, https://doi.org/10.1007/s00103-009-0785-9, 2009.
Piteau, D. R. and Peckover, F. L.: Engineering of Rock Slopes, in Landslides, Analysis and Control, Transportation Research Board, in: Special Report 176, edited by: Schuster, R. L. and Krizek, R. J., Washington, DC, National Academy of Sciences, Washington DC., 192–228, ISBN: 0-309-02804-3, 1978.
Porter, S. C. and Orombelli, G.: Catastrophic rockfall of September 12, 1717 on the Italian flank of the Mont Blanc massif, Z. Geomorphol., 24, 200–218, https://doi.org/10.1127/zfg/24/1984/200, 1980.
Pratt, C., Macciotta, R., and Hendry, M.: Quantitative relationship between weather seasonality and rock fall occurrences north of Hope, BC, Canada, Bull. Eng. Geol. Environ., 78, 3239–3251, https://doi.org/10.1007/s10064-018-1358-7, 2019.
Rapp, A.: Recent Development of Mountain Slopes in Kärkevagge and Surroundings, Northern Scandinavia, Geogr. Ann., 42, 65–200, https://doi.org/10.1080/20014422.1960.11880942, 1960.
Ravanel, L. and Deline, P.: Climate influence on rockfalls in high-alpine steep rockwalls: The north side of the aiguilles de chamonix (mont blanc massif) since the end of the “Little Ice Age”, Holocene, 21, 357–365, https://doi.org/10.1177/0959683610374887, 2011.
Rosser, N. J., Petley, D. N., Lim, M., Dunning, S. A., and Allison, R. J.: Terrestrial laser scanning for monitoring the process of hard rock coastal cliff erosion, Q. J. Eng. Geol. Hydrogeol., 38, 363–375, https://doi.org/10.1144/1470-9236/05-008, 2005.
Royán, M. J., Abellán, A., Jaboyedoff, M., Vilaplana, J. M., and Calvet, J.: Spatio-temporal analysis of rockfall pre-failure deformation using Terrestrial LiDAR, Landslides, 11, 697–709, https://doi.org/10.1007/s10346-013-0442-0, 2014.
Santana, D., Corominas, J., Mavrouli, O., and Garcia-Sellés, D.: Magnitude-frequency relation for rockfall scars using a Terrestrial Laser Scanner, Eng. Geol., 144–145, 50–64, https://doi.org/10.1016/j.enggeo.2012.07.001, 2012.
Sass, O.: Die Steuerung von Steinschlagmenge durch Mikroklima, Gesteinsfeuchte und Gesteinseigenschaften im westlichen Karwendelgebirge, Münchner Geogr. Abhandlungen R. B, 29, 347–359, 1998.
Sass, O.: Rock moisture measurements: Techniques, results, and implications for weathering, Earth Surf. Proc. Land., 30, 359–374, https://doi.org/10.1002/esp.1214, 2005.
Schovanec, H. E.: Development of semi-automated lidar processing algorithms to correlate climate variables to rockfall patterns for a slope near Glendwood Springs, Colorado, Colorado School of Mines: Golden, CO, USA, MSc Thesis, https://hdl.handle.net/11124/176292 (last access: 15 October 2022), 2020.
Selby, M.: Hillslope materials and processes, 2nd Edn., Oxford, ISBN 9780198741831, 480 pp., 1993.
Slivitzky, A., St-Julien, P., and Lachambre, G.: Synthèse géologique du Cambro-Ordovicien du nord de la Gaspésie, Ministère de l’Énergie et Des Ressources du Québec, ET 88-14, 70 p., ISBN 2-551-12091-8, 1991.
Stoll, V., Scandroglio, R., and Krautblatter, M.: Modelling rock walls destabilization caused by hydrostatic pressure in frozen/unfrozen bedrock (Hochvogel & Zugspitze, Germany), Presented at the EGU General Assembly, Vienna, Austria, 22nd EGU General Assembly, 4–8 May, 2020, id.14338, https://doi.org/10.5194/egusphere-egu2020-14338, 2020.
Štroner, M., Křemen, T., Braun, J., Urban, R., Blistan, P., and Kovanič, L.: Comparison of 2.5d volume calculation methods and software solutions using point clouds scanned before and after mining, Acta Montan. Slovaca, 24, 296–306, 2019.
Turner, A. K. and Schustler, R. L.: Landslides: investigation and mitigation, Special report/Transportation Research Board, National Research Council, 247, 1996 + 678 pp., ISBN 0-309-06151-2, ISBN 0-309-06208-X, 1996.
van Veen, M., Hutchinson, D. J., Kromer, R., Lato, M., and Edwards, T.: Effects of sampling interval on the frequency – magnitude relationship of rockfalls detected from terrestrial laser scanning using semi-automated methods, Landslides, 14, 1579–1592, https://doi.org/10.1007/s10346-017-0801-3, 2017.
Volkwein, A., Schellenberg, K., Labiouse, V., Agliardi, F., Berger, F., Bourrier, F., Dorren, L. K. A., Gerber, W., and Jaboyedoff, M.: Rockfall characterisation and structural protection – a review, Nat. Hazards Earth Syst. Sci., 11, 2617–2651, https://doi.org/10.5194/nhess-11-2617-2011, 2011.
Weidner, L. and Walton, G.: Monitoring the effects of slope hazard mitigation and weather on rockfall along a colorado highway using terrestrial laser scanning, Remote Sens., 13, 25, https://doi.org/10.3390/rs13224584, 2021.
Wieczorek, G. F. and Jäger, S.: Triggering mechanisms and depositional rates of postglacial slope-movement processes in the Yosemite Valley, California, Geomorphology, 15, 17–31, https://doi.org/10.1016/0169-555X(95)00112-I, 1996.
Williams, J. G., Rosser, N. J., Hardy, R. J., Brain, M. J., and Afana, A. A.: Optimising 4-D surface change detection: an approach for capturing rockfall magnitude–frequency, Earth Surf. Dynam., 6, 101–119, https://doi.org/10.5194/esurf-6-101-2018, 2018.
Wyllie, D. C. and Mah, C.: Rock Slope Engineering, 4th edn., CRC Press, Boca Raton, FL, USA, ISBN-10: 0-415-28001-X, ISBN-13 978-0415280013, 456 pp., 2004.