the Creative Commons Attribution 4.0 License.
the Creative Commons Attribution 4.0 License.
 | 09 Nov 2023
A new analytical method for stability analysis of rock blocks with basal erosion in sub-horizontal strata by considering the eccentricity effect
Xushan Shi
Bo Chai
Juan Du
Wei Wang
Bo Liu
The basal cavity of a rock block formed due to differential weathering is an important predisposing factor for rockfall in hard–soft interbedded rocks, which induces an eccentricity situation at the base of the rock block. Rock block falling due to the non-uniform distribution with the failure modes of toppling or sliding is defined as biased rockfall in this study. Taking into account the non-uniform stress distribution due to the eccentricity effect, a new analytical method is proposed for three-dimensional stability analysis of biased rockfall. The development of non-uniform stress distribution stress calculated by this analytical method was verified by numerical simulation. The biased rockfall progresses from partial damage of the soft underlying layer, caused by non-uniform distributed stress, to toppling and sliding of overhanging hard rock block due to overall unbalanced force. Therefore, a set of factors of safety (Fos's) against partial damage (compressive and tensile damage of the soft underlying layer) and overall failure (toppling and sliding of the hard rock block) are used to determine the rockfall susceptibility level. The analytical method is applied and validated using biased rockfalls on the northeastern edge of the Sichuan Basin in southwest China, where a significant number of rockfalls consisting of overhanging thick sandstone and underlying mudstone occur. The evolution process of biased rockfalls is divided into four stages, initial state, basal cavity formation, partially unstable and failure. The proposed method is validated by calculating Fos's of the typical unstable rock blocks in the study area. As the cavity continues to grow, the continuous retreat of mudstone causes stress redistribution between the hard and soft rock layers. This results in damage to the underlying soft rock layer due to the development of the non-uniform distribution, ultimately leading to the failure of the hard rock block. The critical retreat ratio is determined to be 0.33, which is used to classify the low and moderate rockfall susceptibility in the eastern Sichuan Basin. The proposed analytical method provides insights into the evolution of biased rockfall and a means for early identification and susceptibility assessment of rockfall.
- Article
(12070 KB) - Full-text XML
- BibTeX
- EndNote


Rockfall is defined as the detachment of a rock block from a steep slope along a surface, on which little or no shear displacement takes place (Cruden and Varnes, 1996). Rockfalls frequently occur in mountainous ranges, on cut slopes and on coastal cliffs, and they may cause significant facility damage and casualties in residential areas and transport corridors (Chau et al., 2003; Volkwein et al., 2011; Corominas et al., 2018). Stability analysis of rock blocks is crucial for risk management and early warning of rockfall (Kromer et al., 2017).
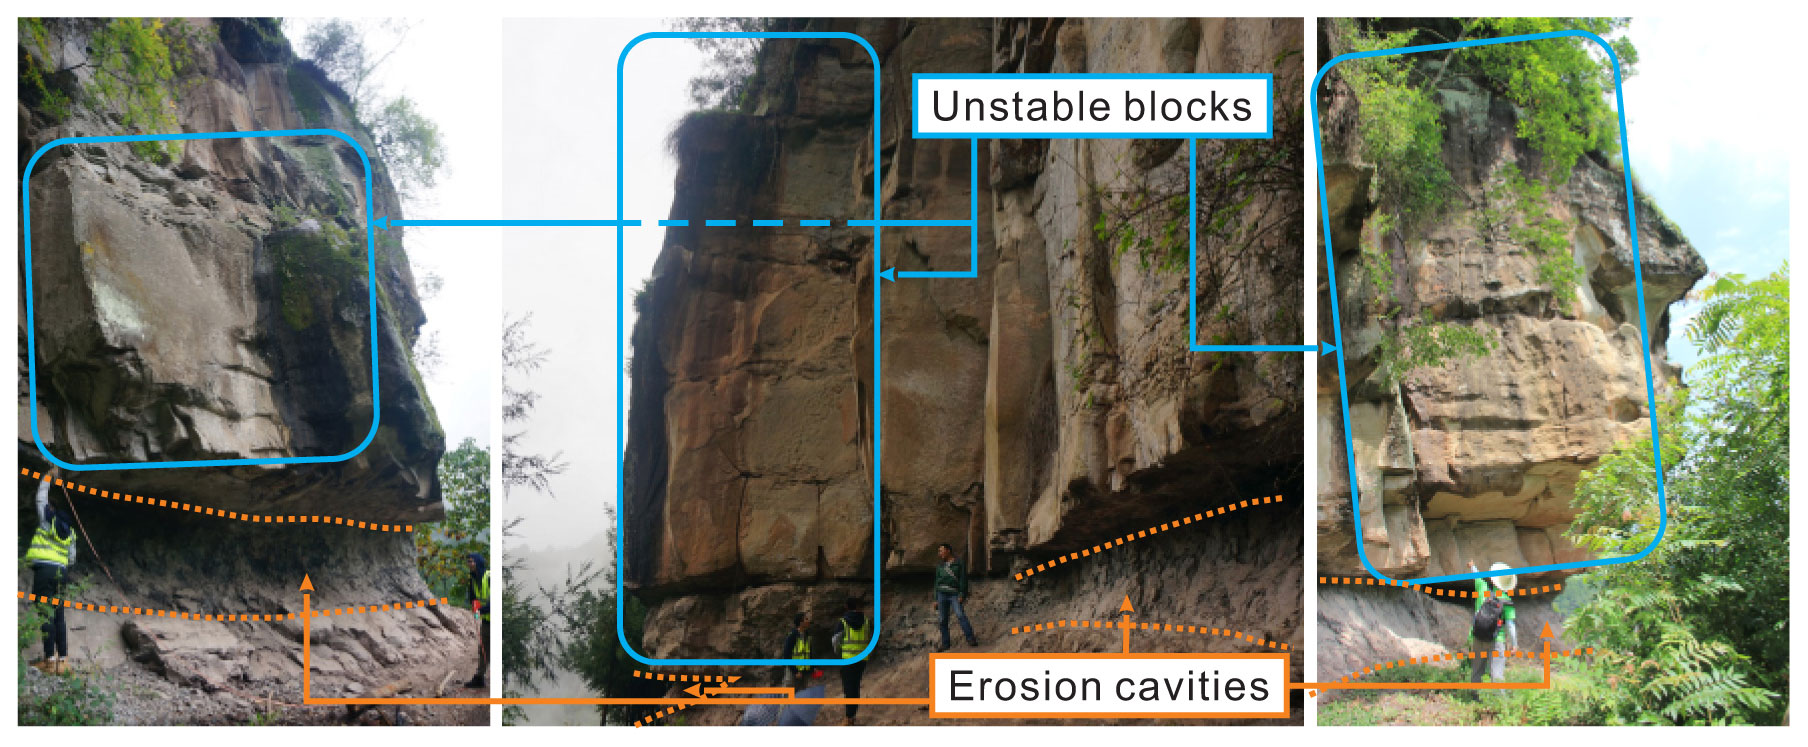
Rockfalls are prone to occur in soft–hard rock formations, and the non-uniform stress distribution caused by differential weathering of rock formations is the main reason for the failure of rockfall. In the eastern Sichuan Basin, southwest China, rockfall is widespread and poses a high risk (Chen et al., 2008; Chen and Tang, 2010; Zhang et al., 2016; Zhou et al., 2017, 2018). The rockfall in this area is attributed to the tectonic setting of Jura-type folds and the stratum sequence, which is characterized by the interbedding of hard and soft layers. An alternation of thick sandstone and thin mudstone layers is formed in the wide and gentle-angle synclines (Zhang et al., 2015; Wu et al., 2018). Weathering is known to be one of the main predisposing factors in rockfall (Jaboyedoff et al., 2021; Zhan et al., 2022). The cliff comprised of hard sandstone is the source of rockfall, and the underlying mudstone is more susceptible to weathering. Along with the retreat of basal cavities in the mudstone layer, the gravity centre of the overhanging sandstone block moves outward relative to the mudstone. In this case, the stress distribution in the contact surface of sandstone and mudstone is non-uniform. The mudstone on the outer side bears higher compressive stress than that on the inner side. This phenomenon can be defined as an eccentricity effect, which leads to mudstone damage and failure of the overhanging sandstone by toppling or sliding. This type of rockfall is defined as biased rockfall in this study (Fig. 1). Similar rockfall patterns have been widely reported in other regions, such as Joss Bay in England (Hutchinson, 1972), Okinawa Island in Japan (Kogure et al., 2006) and the Colorado Plateau of the southwestern United States (Ward et al., 2011). Retreat of the basal cavity is a main cause for the failure of the overhanging block. Therefore, it is necessary to establish an analytical method, considering the development of the basal cavity, to analyse the stress distribution and stability of rock blocks, which is fundamental to the susceptibility assessment and risk control of biased rockfall.
Rockfall stability analysis methods include statistical analysis (Frattini et al., 2008; Santi et al., 2009), empirical rating systems (Pierson et al., 1990; Ferrari et al., 2016) and mechanical analysis (Lin and Fairhurst, 1988; Jaboyedoff et al., 2004; Derron et al., 2005; Matasci et al., 2018). The statistical analysis and empirical rating systems are suitable for rockfall hazard assessment at a regional scale. The accuracy of statistical analysis depends on the completeness of rockfall inventories (Chau et al., 2003; Guzzetti et al., 2003; D'Amato et al., 2016). However, its application to rockfall hazards is limited due to the lack of complete inventory data (Budetta and Nappi, 2013; Malamud et al., 2004). Empirical and semi-empirical rating systems are used where site-specific rockfall inventories are either unavailable or unreliable. Therefore, rockfall susceptibility can be assessed by heuristic ranking of selected predisposing factors (Frattini et al., 2008; Budetta, 2004). Mechanical analysis based on static equilibrium theory is the main method to analyse the stability of site-specific rockfall using the factor of safety (Fos). Ashby (1971) conducted stability analysis with a parallelepiped block resting on an inclined plane (Fig. 2a), and the solution was subsequently modified by Bray and Goodman (1981) and Sagaseta (1986). Kogure et al. (2006) utilized a cantilever beam model to determine the critical state of limestone cliffs. Frayssines and Hantz (2009) proposed the limit equilibrium method (LEM) to predict block stability against sliding and toppling in steep limestone cliffs (Fig. 2c). Chen and Tang (2010) established a stability analysis method of three types of unstable rocks in the Three Gorges Reservoir area with the LEM. Alejano et al. (2015) studied the influence of rounding of block corners on the block stability. Zhang et al. (2016) defined Fos based on fracture mechanics and studied the progressive failure process by analysing crack propagation. Alejano et al. (2010) and Pérez-Rey et al. (2021) deduced a formula for the Fos of blocks with more complex geometry.
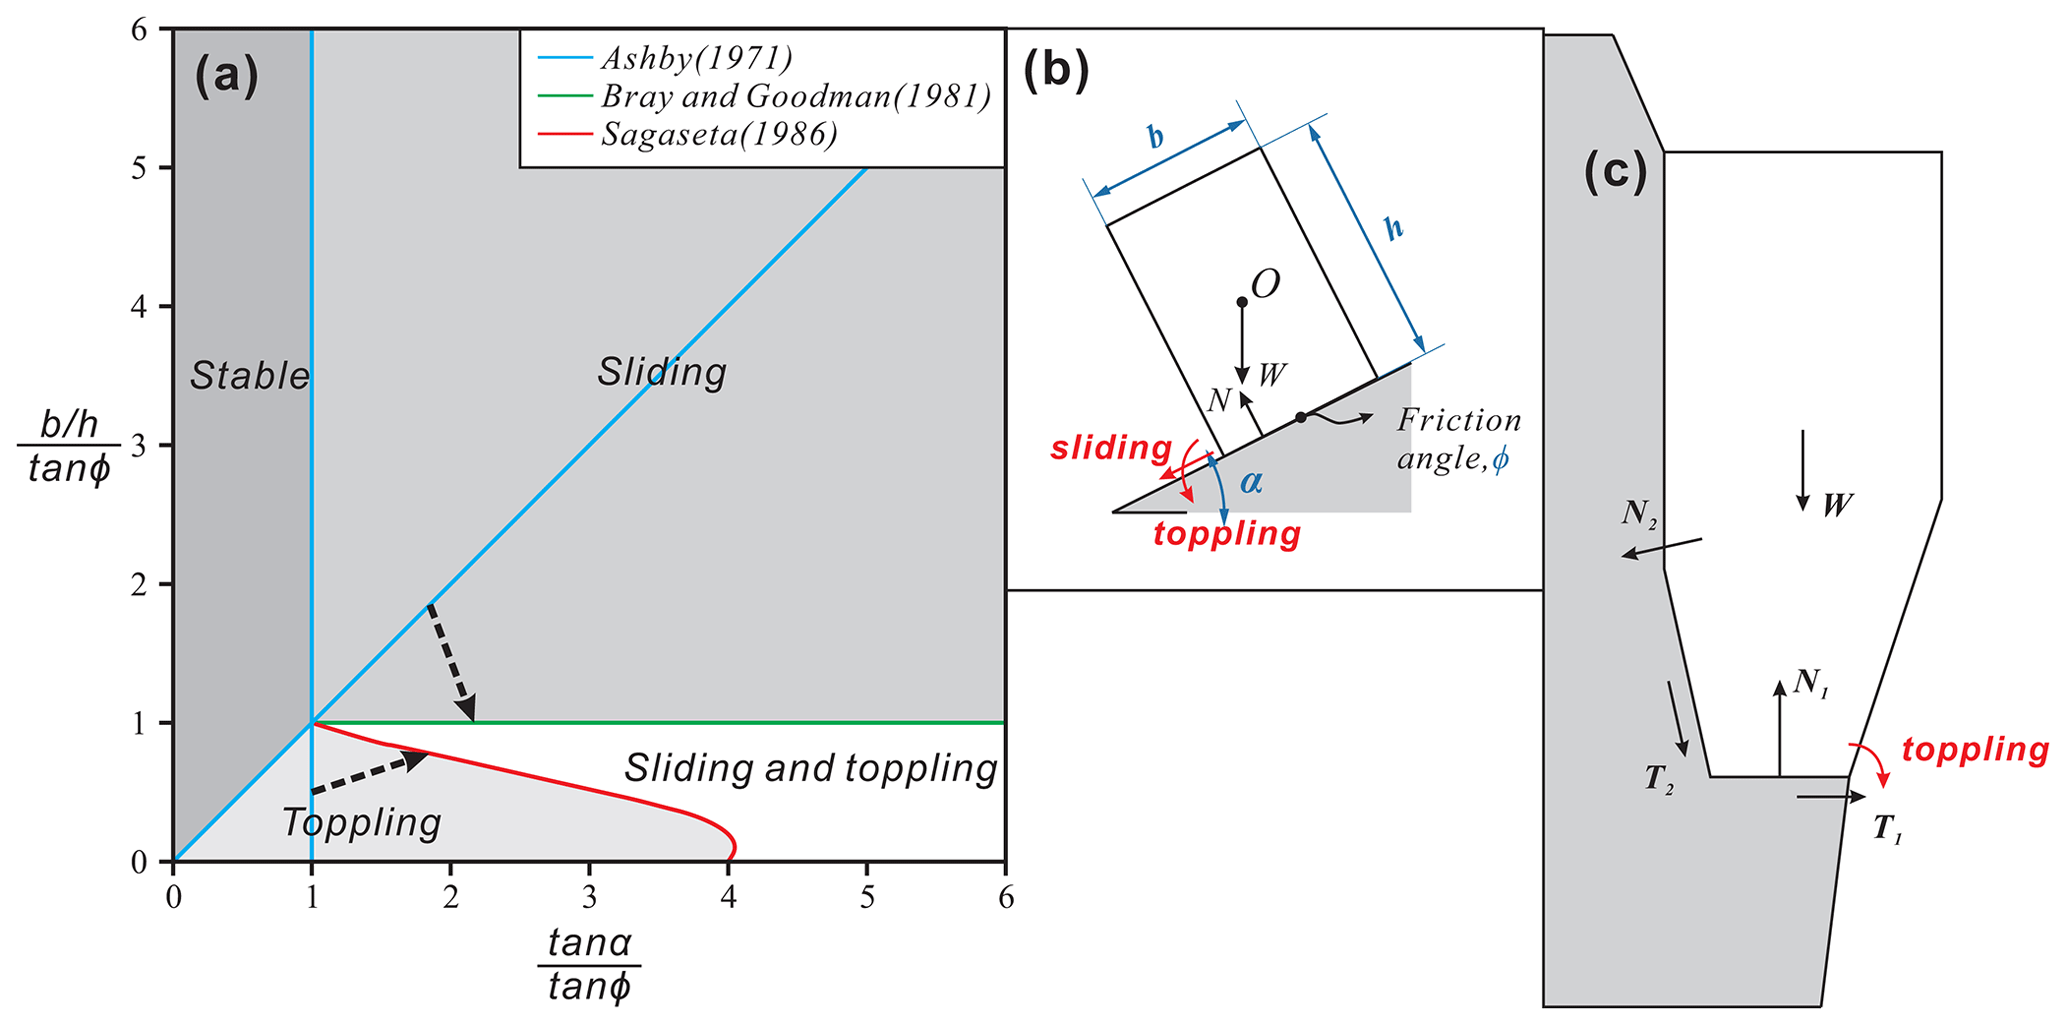
Figure 2Traditional force analysis diagrams of the rock block. Panels (a) and (b) are stability analysis diagrams of rock blocks under dynamic conditions, resting on an inclined plane with a dip angle of α. The rock block is generalized as a cuboid with dimensions b×h and weight W (as modified from Ashby, 1971; Bray and Goodman, 1981; and Sagaseta, 1986). (c) Force description of the toppling model proposed by Frayssines and Hantz (2009). In the above assumptions, N, T and W are regarded as forces applied at a point.
The supporting force on the contact surface is assumed to be applied at a point in the current LEMs (i.e. N in Fig. 2b and c). However, the supporting force is actually a distributed force. The external erosion generates an eccentricity situation on the overhanging rock block and results in a non-uniform distribution of the supporting force on the contact surface, which is not considered in the traditional LEM. The presence of non-uniform stress distribution plays a critical role in inducing localized damage within a rock mass. Damage is frequently considered an indicator or a threshold for the onset of accelerated failure in rock masses (Zhang et al., 2016). Therefore, it is imperative to consider the non-uniform stress distribution for the rockfall stability analysis. Furthermore, most studies simplified the three-dimensional geometry of the rock block using one cross-section to represent the critical features of the slope structure. Nevertheless, for natural blocks with basal cavities, the cavities usually present different depths along different directions (Pérez-Rey et al., 2021). Therefore, a three-dimensional model is necessary to accurately calculate the stability. In addition, when a block has multiple free faces and a complex structure, its potential failure is dominated by different modes, including rock mass damage and overall block failure. Therefore, the probable failure modes should be determined prior to the calculation of Fos.
Based on rockfall investigation in the eastern Sichuan Basin, China, the main objective of this study was to propose a new three-dimensional method for the determination of failure modes and the Fos of biased rockfall, considering the non-uniform force distribution on the contact surfaces. Compared with the traditional LEM, this study takes into account the partial damage of the underlying soft rock and the overall instability of the overhanging hard rock blocks and can evaluate the stability of biased rockfall more comprehensively. Fos's of the typical unstable rock blocks in the study area are calculated to validate the proposed method. In addition, the critical mudstone retreat ratio in this area is analysed. This study is an extension of the basic LEM for rockfall, which can promote the accuracy of rockfall stability analysis and facilitate rockfall prevention and risk mitigation.
2.1 Geological setting
The study area is located on the northeastern edge of the Sichuan Basin, China (Fig. 3a). Continuous erosion processes generate moderate–low mountain and valley landforms (Yu et al., 2021). The tectonic structure of this area is characterized by a series of ENE anticlines and synclines (Fig. 3b and c). In the anticline area, the rock layers dip relatively steeply, where translational rockslides are the main mode of slope failure. The syncline area is dominated by gently dipping strata and is prone to rockfall (Zhou et al., 2018). The study area is located in the core of the Matouchang syncline, where the rock layers are sub-horizontal (Fig. 3d and e). In this valley, due to the long-standing fluvial incision, the relative relief is approximately 500 m and the valley flanks are extremely steep (Fig. 3e). In addition, the toes of the hillslopes are reshaped because of the construction of the G318 national road, which is the main traffic line and is always threatened by rockfalls from steep rock slopes (shown in Fig. 3d and Table 1).
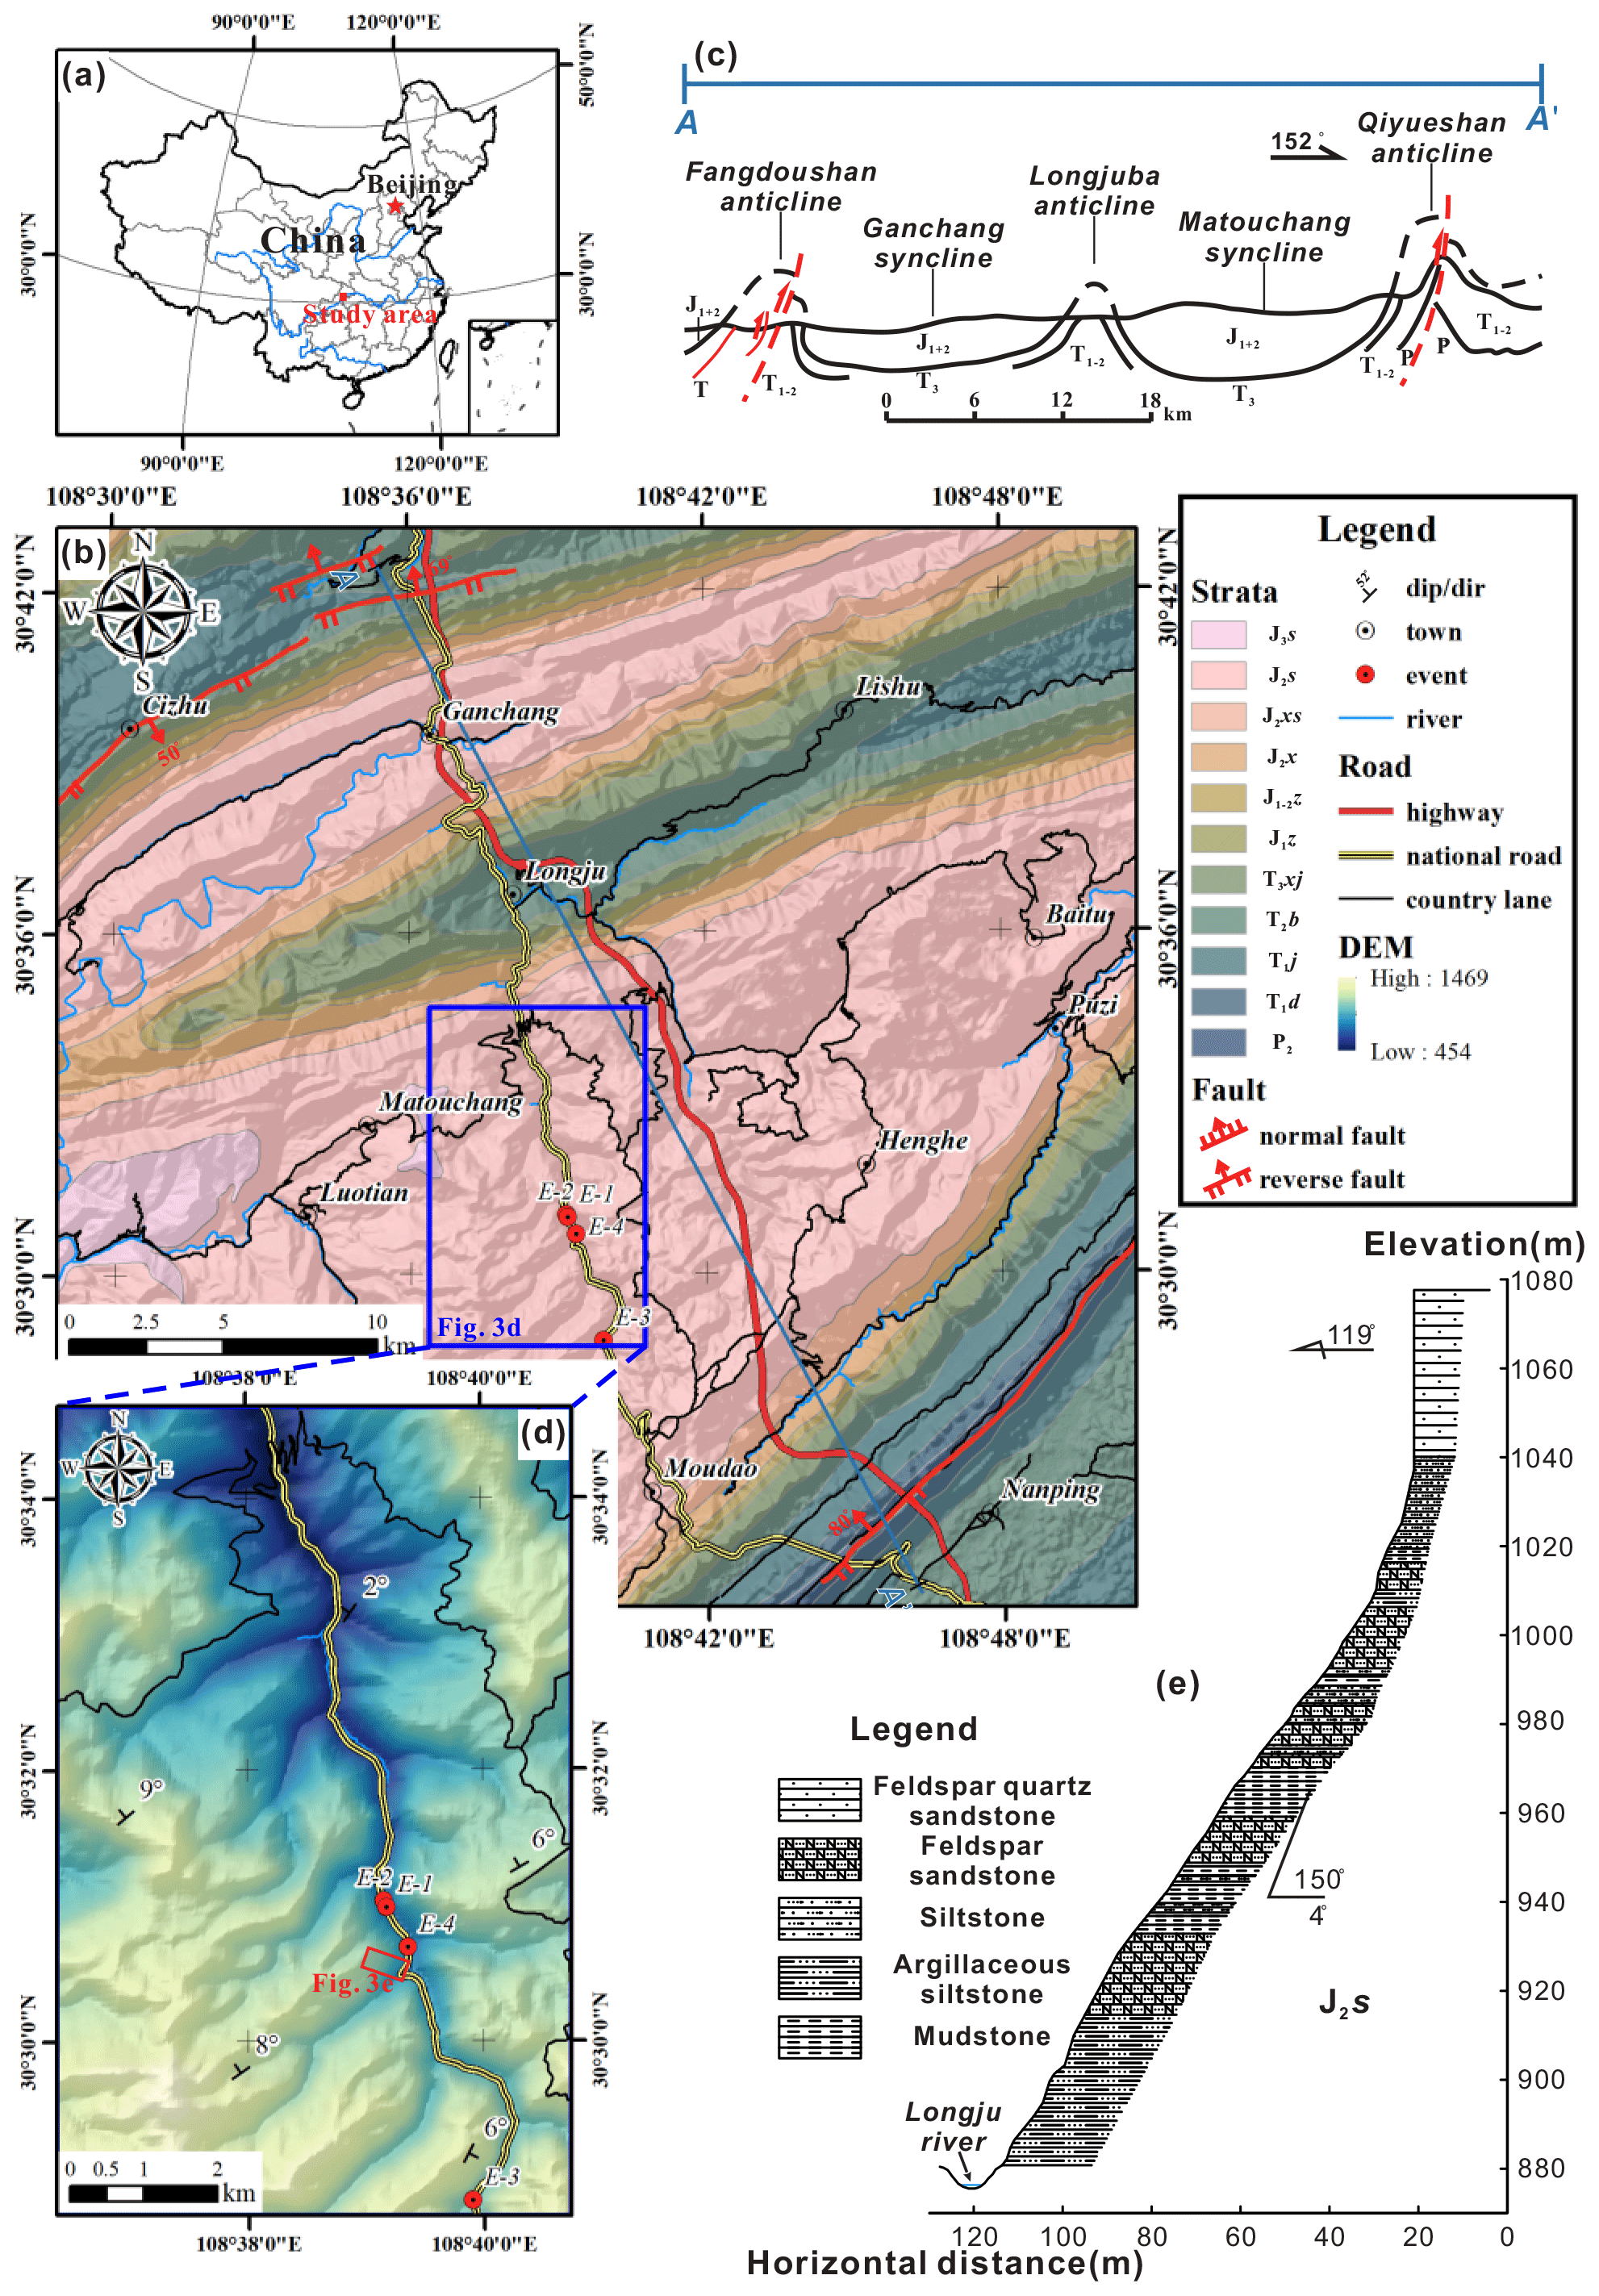
Figure 3(a) Location of the study area in China; (b) geological map of the study area; (c) tectonic sketch profile of A–A′, whose location is shown in (b); (d) rockfall-prone segment and key investigation areas. The red dots are the positions of historical rockfall events, corresponding to the numbers in Table 1. (e) Geological cross-section of the hillslope in the Jitougou section of G318 national road, which is marked by a red rectangle in (d). Publisher's remark: please note that the above figure contains disputed territories.
Table 1Historical rockfall events along the G318 national road in the study area.
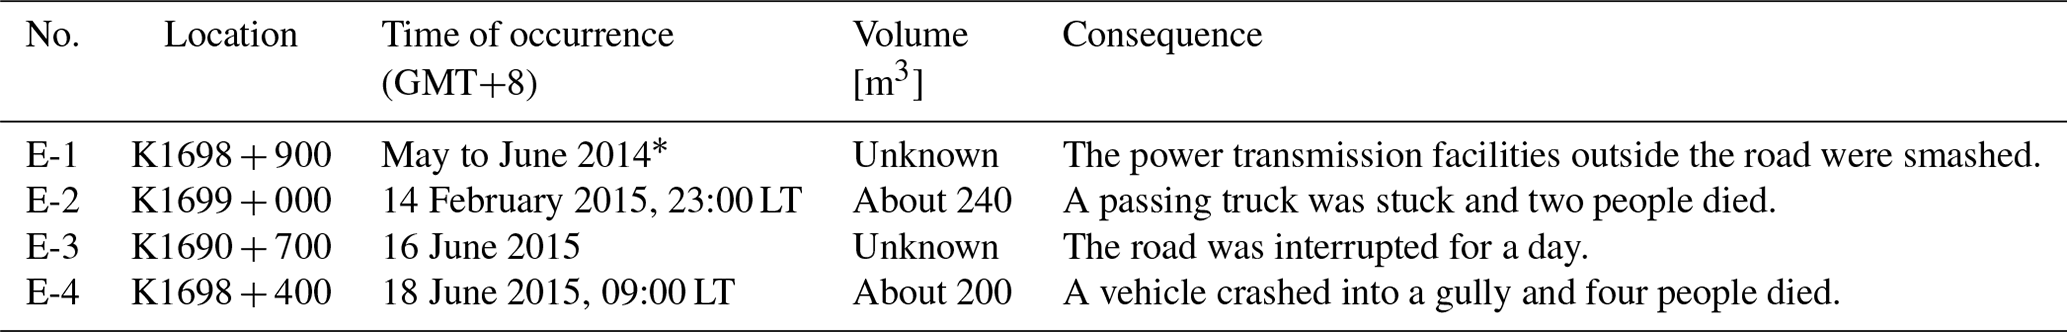
* Note: the exact time is unknown.
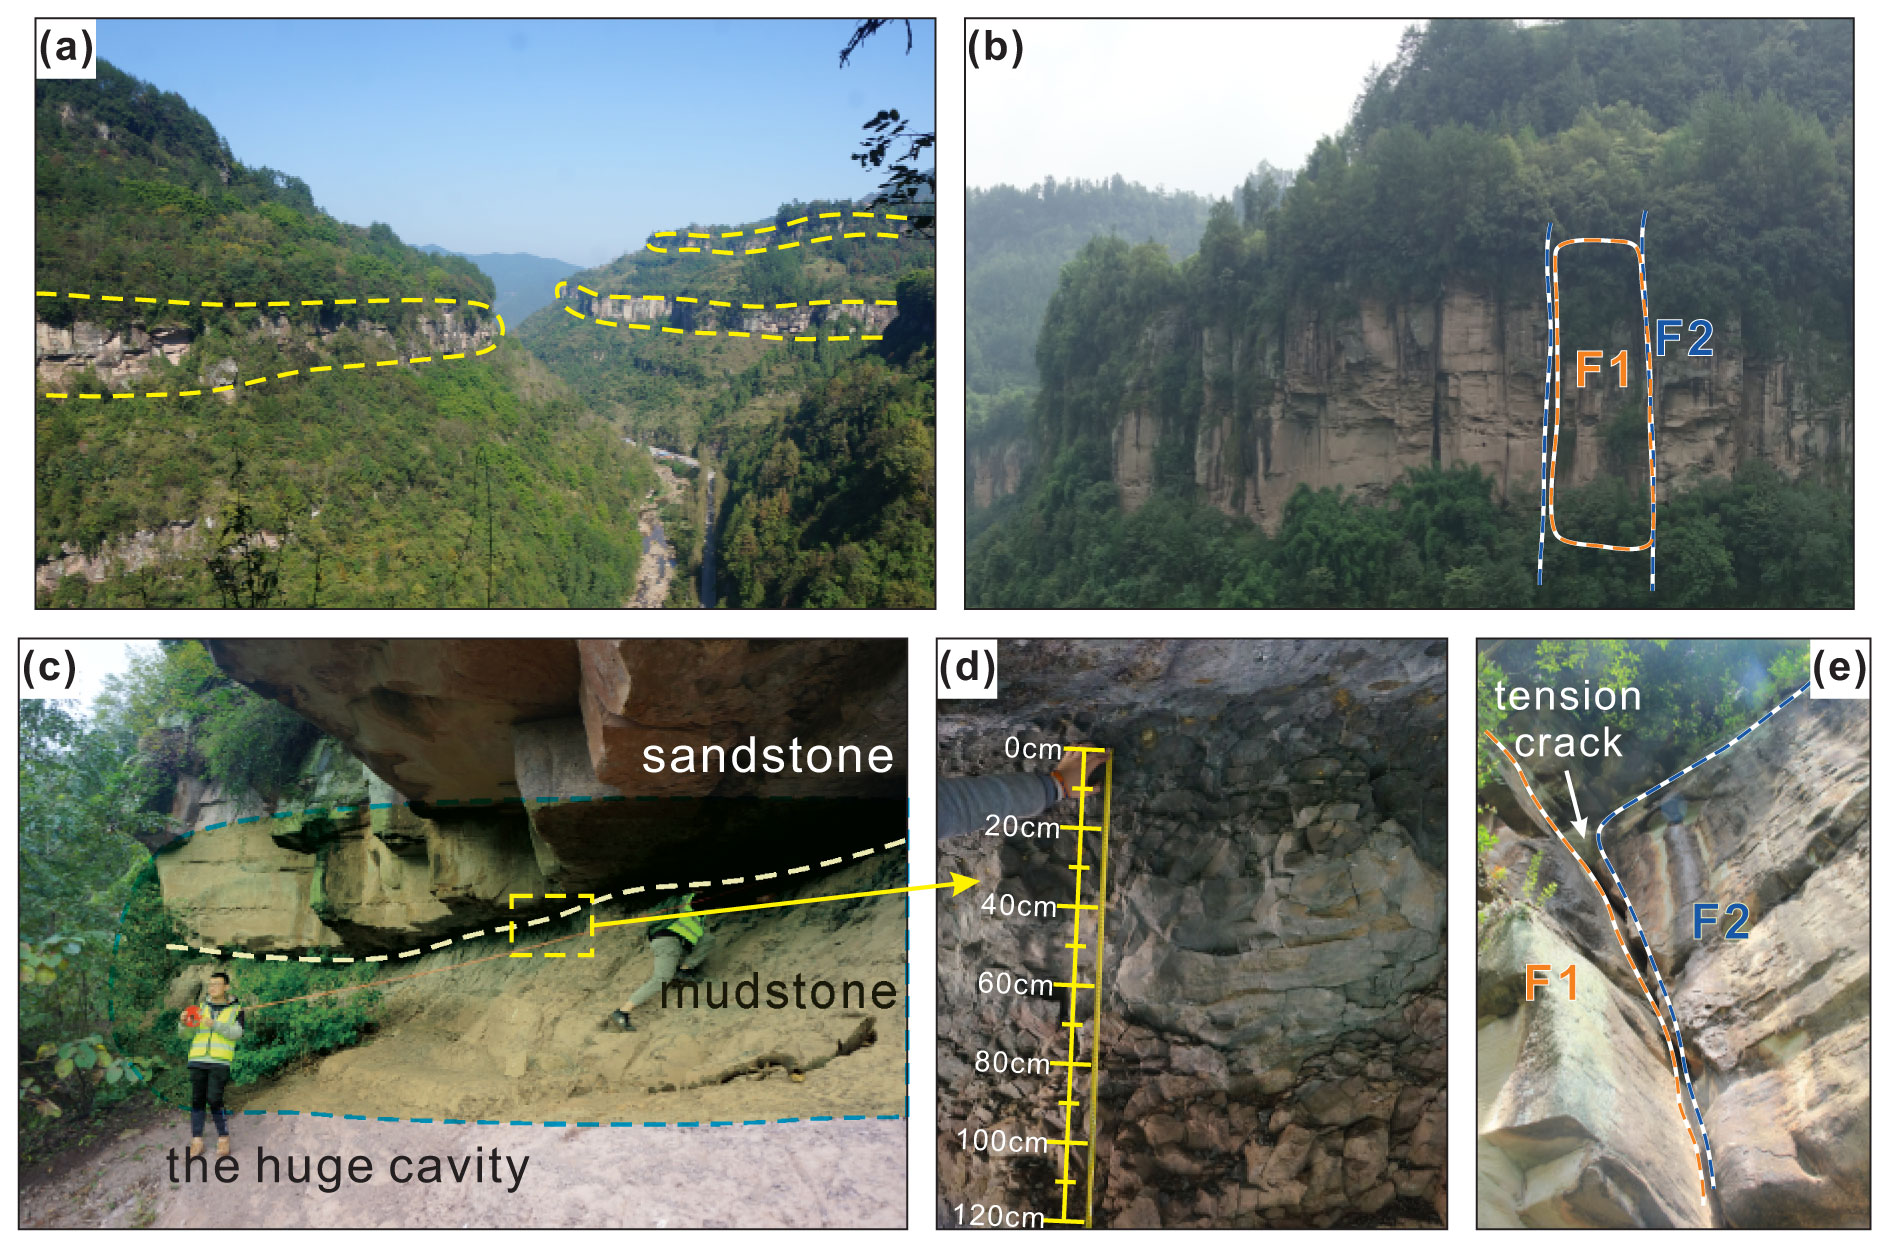
Figure 4Characteristics of biased rockfalls in the study area. (a) Multiple layers of rockfall sources, which is consist of thick sandstone. (b) Two sets of sub-vertical joints (F1 and F2) recognized by the UAV photos. (c) Large basal cavity developed in the underlying mudstone. (d) Dense fractures on the mudstone surface generated by weathering and compression. (e) Vertical tension crack in the rear of the block, through which precipitation can infiltrate.
2.2 Rockfall characteristics
The slopes in the study area consist of a sub-horizontally interbedded sandstone and mudstone layer. Therefore, there are multiple layers of potentially unstable rock blocks in the hillslopes (Fig. 4a). The thick sandstone has two sets of sub-vertical joints (Fig. 5), which cut the rock mass into blocks as the potential rockfall source (Fig. 4b). Basal cavities have formed in the underlying mudstone layer (Fig. 4c and d). Joints and bedding planes (BPs) constitute the detachment surfaces between the blocks and steep slope (Fig. 4e). The eccentricity effect produced by the mudstone external erosion plays an important role in the evolution process of rockfall. When the basal mudstone cannot provide adequate supporting force, the blocks detach from the steep slope, and biased rockfall occurs. Sliding and toppling are two possible failure modes of biased rockfall.
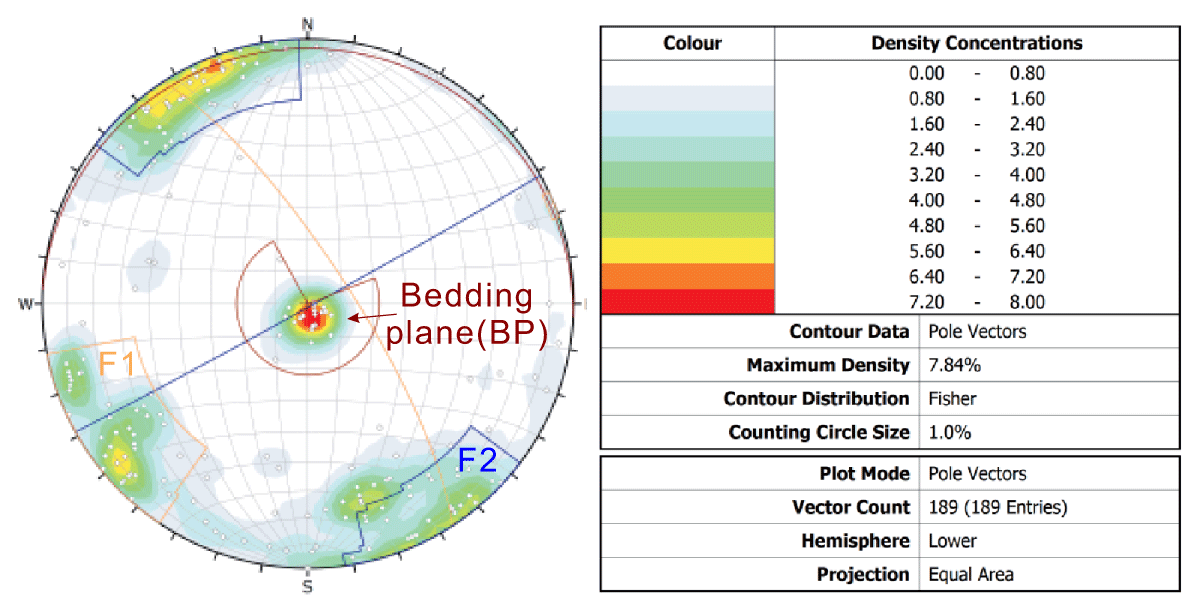
Figure 5Stereonet produced using compass-clinometer survey data, showing the densities and orientations of five clusters. The data were collected in the rockfall-prone area shown in Fig. 3d.
According to the historical rockfall events in this area, precipitation is considered a triggering factor of rock instability. The precipitation mainly infiltrates along the sub-vertical joints or cracks of the sandstone (Fig. 4e). However, the drainage of fissure water is hysteretic due to the obstruction of basal mudstone. Therefore, transient steady flow exists in vertical cracks during heavy rainfall, and the hydrostatic pressure triggers the detachment of rock blocks. Thus, typical scenarios (such as rainfall intensity and earthquake) need to be considered in the stability analysis model.
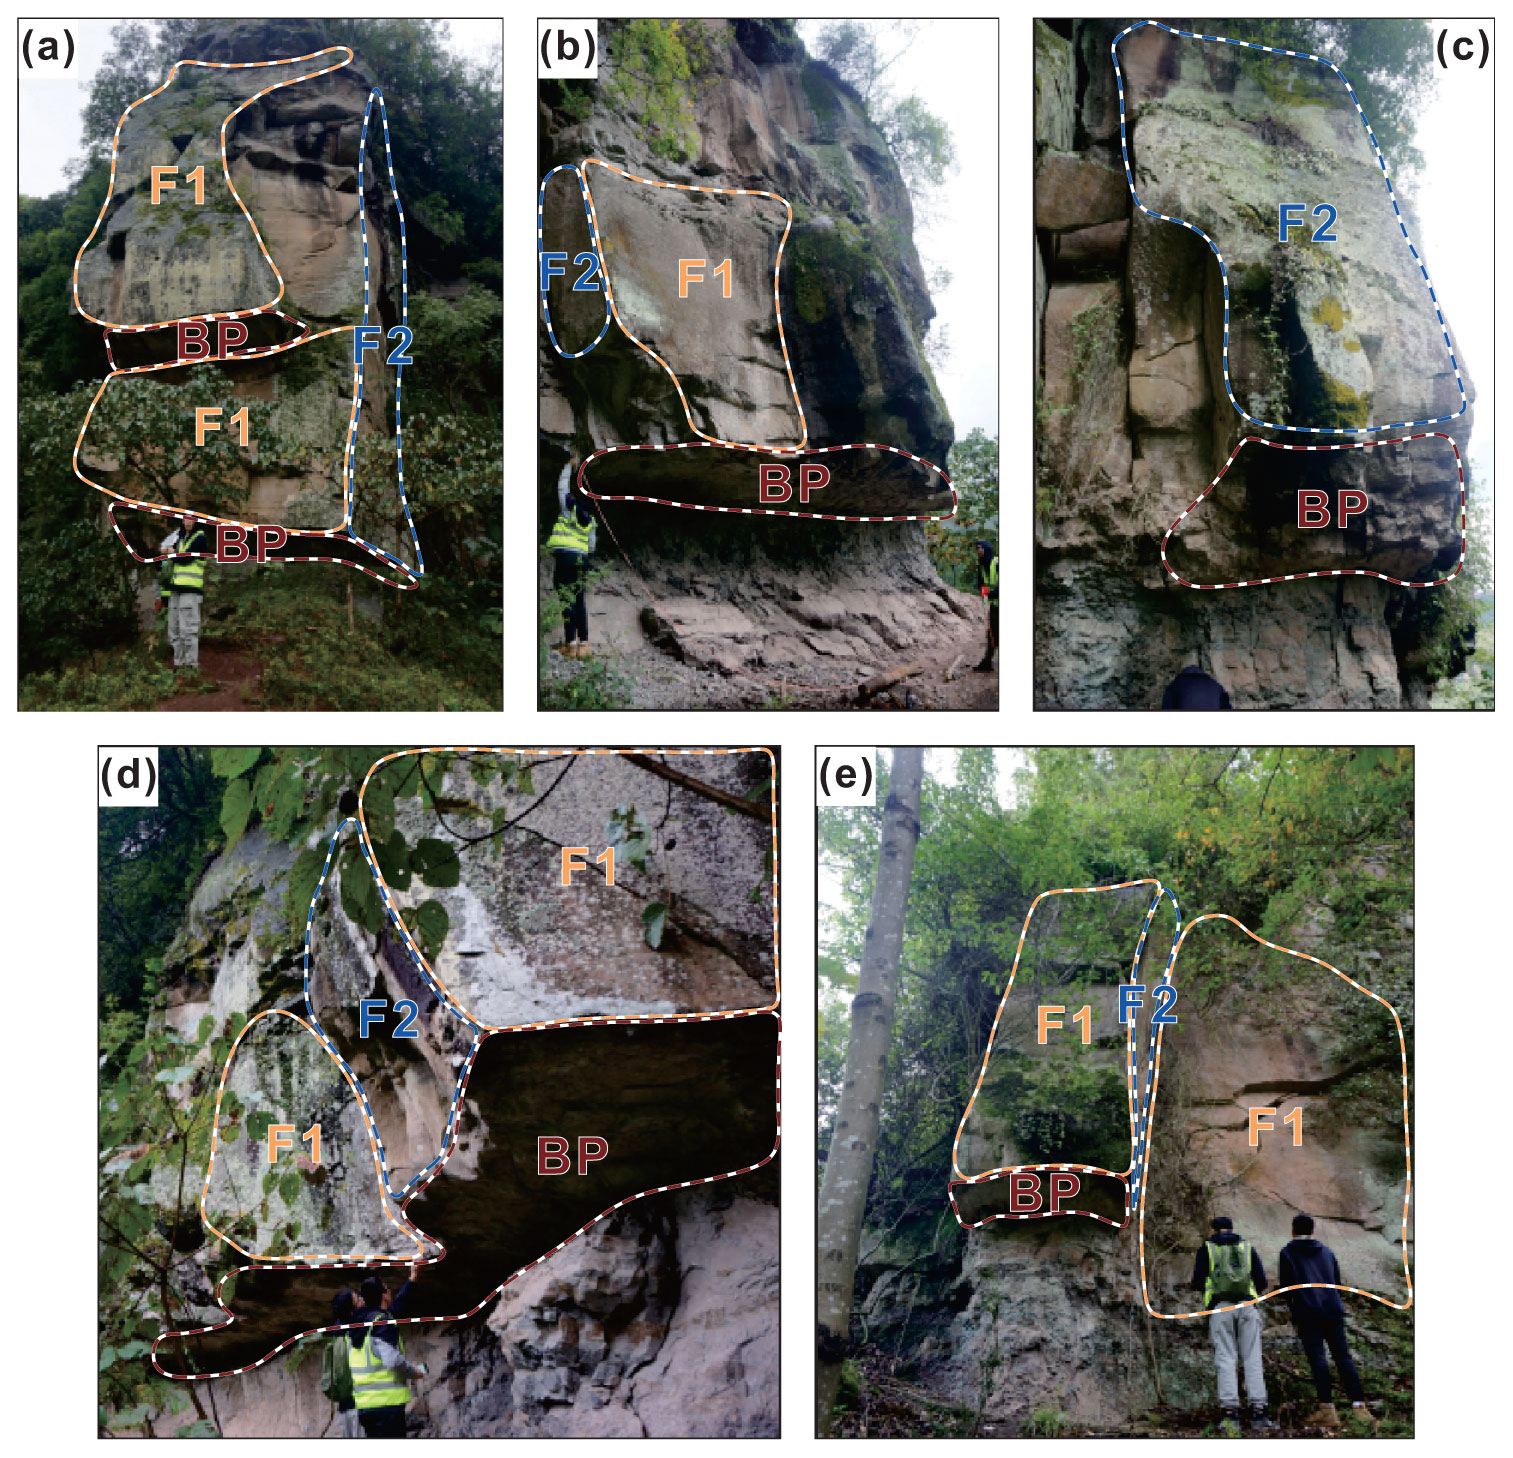
Figure 6The unstable blocks were labelled W02, W08, W18, W04 and W21, which are detached by the dominating discontinuities in Fig. 5. Basal cavities can be identified under the bedding planes of sandstone.
3.1 Geological models and assumptions
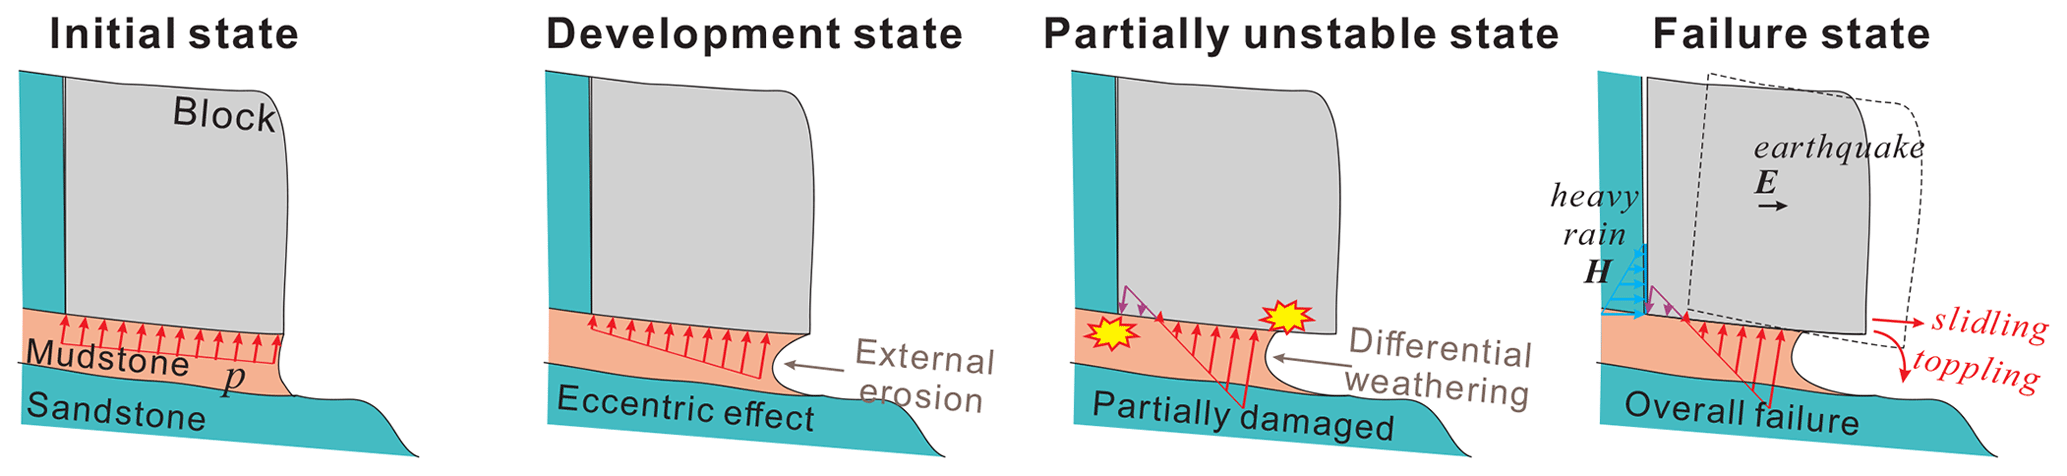
A detailed geological investigation of unstable rock blocks was carried out in the study area (Fig. 6). The geological model of the rock block is mainly composed of the overhanging sandstone and the underlying mudstone. The sandstone block is assumed to be a rigid body, which is divided by two sets of orthogonal vertical smooth joints without friction resistance. According to the relatively persistent sub-vertical fractures observed in the field, the vertical joints are assumed to be fully persistent in the geological model. The sandstone block is assumed to be a complete body without persistent discontinuity, and it will not disintegrate before it falls. Due to the basal cavity in mudstone, the contact surface between sandstone and mudstone exhibits an eccentricity situation where non-uniform stresses are distributed at different positions. Mudstone is mainly loaded by compressive stress and tensile stress. When the compressive stress of mudstone exceeds its strength on the outer side, some initial damage appears. The effective contact surface between mudstone and sandstone is reduced, which aggravates the non-uniform distribution of stress. In this way, the ability of mudstone to resist the sliding and toppling of overhanging sandstone is reduced. In the field, compression deformation of mudstone can be observed, which usually manifests as micro-fractures and cleavages (Fig. 4d). The deformation is very slight and slow in the short term. In addition, the LEM is essentially a force and stress approach that does not take into account the deformation. Therefore, in this study, it is assumed that the mudstone is not subjected to deformation. The rock block remains in the state of static equilibrium prior to the final overall failure. Figure 7 displays the four evolutionary stages of biased rockfall. In the initial stage, the base cavity has not yet formed, and the normal force acting on the contact surface is uniform in different positions. The eccentricity effect leads to a non-uniform supporting force as the basal cavity grows, and partial damage gradually develops when the non-uniform stress exceeds the compressive or tensile strength of the mudstone. Under the triggering effects of rainfall or earthquakes, the rock blocks are separated by sliding or toppling.
Figure 8 represents the mechanical model of the force equilibrium analysis of a rock block with two or three free faces. The rock block (the overhanging sandstone) is generalized as a parallelepiped block. The underlying mudstone is impermeable, so rainfall can fill the joints and transmit horizontal hydrostatic pressure. The shear strength of the underlying mudstone is assumed to obey the Mohr–Coulomb criterion. Rainfall and earthquakes decrease Fos by generating hydrostatic pressure H in the vertical crack and horizontal seismic force E on the block.
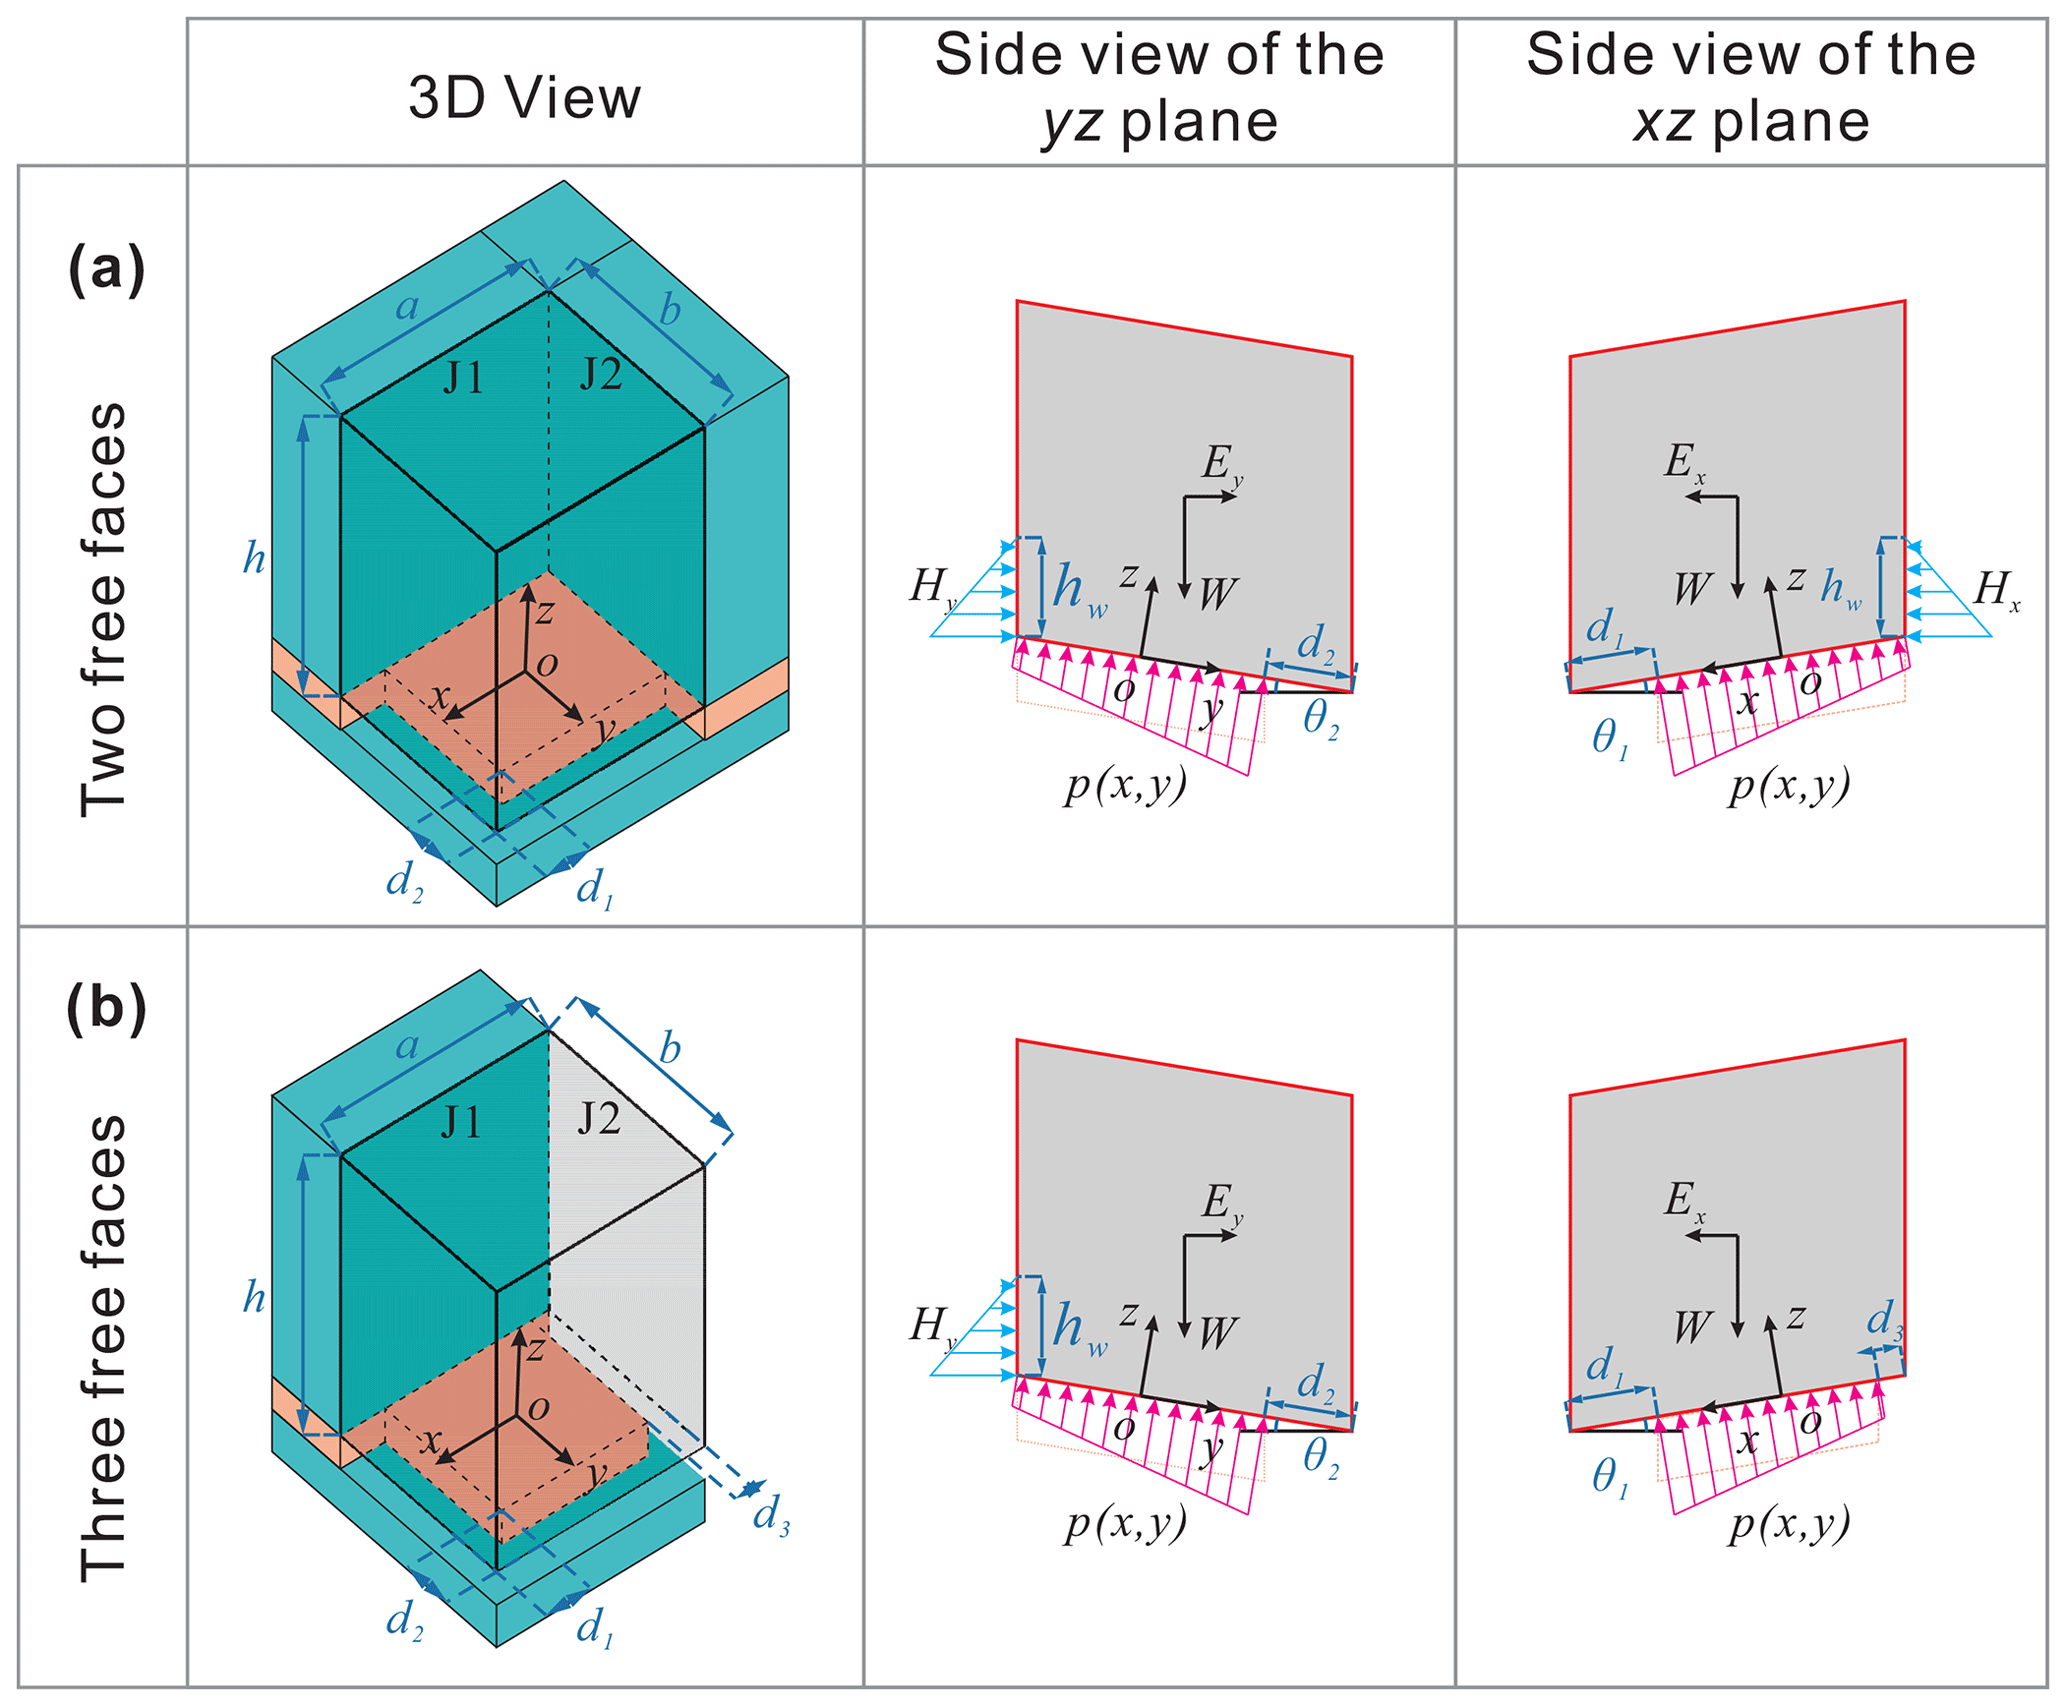
Figure 8Diagram of the force equilibrium analysis of the rock block model. Panels (a) and (b) represent the case of unstable rock blocks with two or three free vertical surfaces, respectively.
A Cartesian coordinate system is established in three-dimensional space for the force analysis. The origin O is located at the centre of the contact surface between sandstone and mudstone. For the case with two free surfaces, the orientation of the free surfaces is set to be the positive direction of the x axis and y axis. For the case with three free surfaces, the negative direction of the x axis is also a free surface. Joint J2 is perpendicular to the x axis, and joint J1 is perpendicular to the y axis.
3.2 Calculation processes
3.2.1 Stress distribution at the block base
The following formulas are used to calculate the apparent dip of α (θ1 and θ2):
where ω1 and ω2 are the angles between the trend of the contact surface and the x direction or y direction, respectively.
As shown in Fig. 8b, with respect to the x axis, gravity, seismic forces and hydrostatic pressure create a non-symmetrical stress distribution on the foundation. The bending moment of gravity with respect to the x axis () is
Assuming that the height of the water in the fracture is hw, the hydrostatic pressure along the x direction (Hx) and its bending moment () are, respectively, expressed as
The horizontal seismic force along the x direction (Ex) and its bending moment () are, respectively, expressed as
The total applied vertical load (Nz) and the total bending moments along the x direction () can be derived as
where k1, k2 and k3 are the coefficients set to make Eqs. (8) and (9) compatible with different calculation scenarios. Therefore, Eqs. (8) and (9) and the following formulas can be expressed in a unified form. In the natural scenario, k1 and k2 are both equal to 0. In the rainfall scenario, k1=1. In the earthquake scenario, k2=1. For the case of two free faces, k3=1. For the case of three free surfaces, k3=0.
Based on bending theory (Adrian, 2010), the eccentricity distance along the x direction (ex) can be expressed as
The same method can be used to obtain ey:
According to the stress distribution of a rectangular-shaped foundation (Adrian, 2010), the stress in the (x, y) coordinates, p(x,y), is
with the formulas
By substituting Eqs. (13)–(15) into Eq. (12), p(x,y) can be derived as
pmax and pmin can be derived from Eq. (16) as
The mudstone foundation has both compressive strength and tensile strength, so the value of p(x,y) is modified to obtain the two piecewise functions
Here, pp(x,y) provides support force for the overhanging sandstone, and pn(x,y) provides tension force.
3.2.2 Calculation of factors of safety
According to the Mohr–Coulomb criterion, the ultimate shear strength τmax is
Therefore, Fos against sliding, Fossl, can be defined as
When the block can slide freely, αs=α and ωs=0; when the block is constrained to slide along a joint plane (e.g. J1), αs=θ1 or θ2 and ωs=ω1 or ω2. For the case of an anaclinal slope, the sliding direction is opposite to the free surface. Therefore, the rock block does not slide, and Fossl is not considered in the model.
With regard to stability against toppling, along the x direction, the part of the block above the mudstone base provides the stabilizing moment , and the part of the block above the basal cavity provides the overturning moment . When tension exists, there is an additional stabilizing moment. , and can be derived as
and and can be derived as
Therefore, the Fos against toppling along the x direction, Fos, results in
Similarly, Fos can be obtained as
The smaller value is selected as the Fos of the toppling failure mode Fosto:
When the stress on mudstone exceeds its strength, it causes partial damage and decreases the stability of the rock block.
Therefore, Fos with the consideration of compressive strength (Fosco) and tensional strength (Foste) can be derived as
Fosco and Foste represent the current damage degree of mudstone due to compressive stress and tensile stress, respectively. When the stress exceeds the ultimate strength, the strength of the mudstone is reduced to the residual value, and the initial deformation appears. The ability of mudstone to provide resistance to the sliding and toppling of sandstone blocks is thus reduced, and Fossl and Fosto subsequently decline. The smaller the value of Fosco and Foste, the greater the damage to the underlying mudstone. The effective contact area between sandstone and mudstone becomes smaller as compressive and tension damage develop, which significantly affects the stability of the overhanging sandstone block.
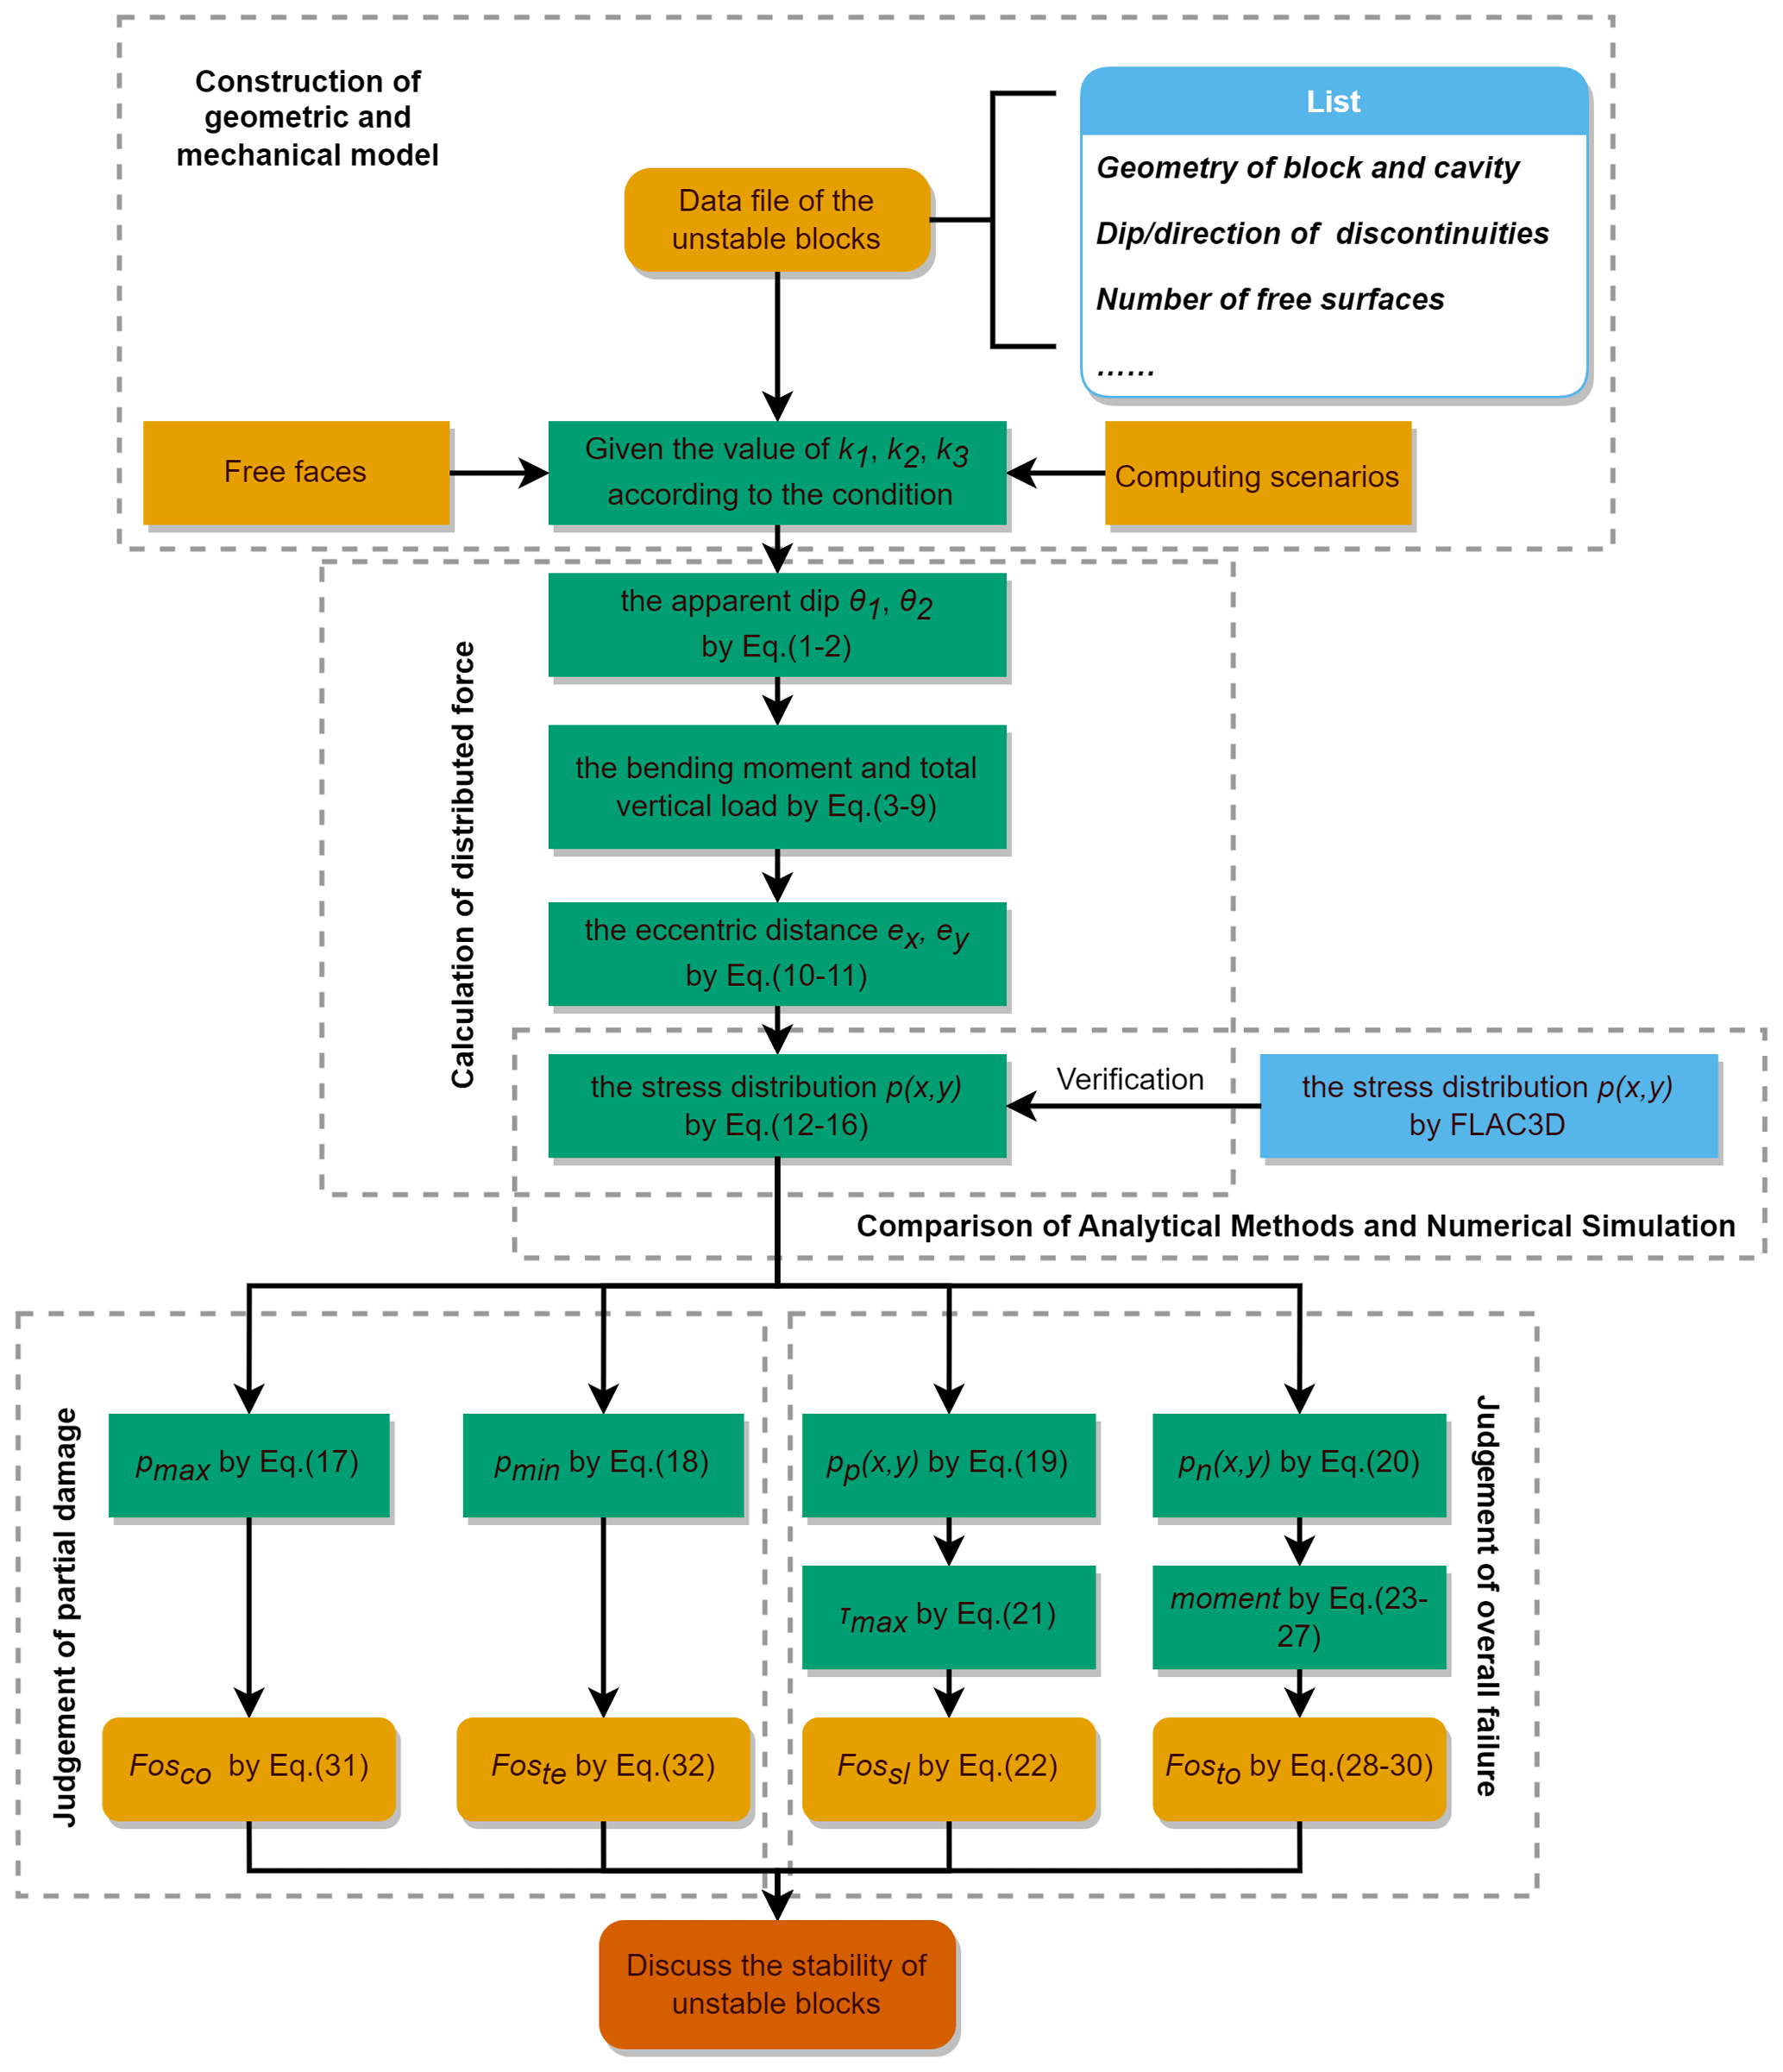
Summarizing, four Fos types of unstable rock block are obtained. Fossl and Fosto are routine indicators directly representing the stability of sandstone blocks. Fosco and Foste are two indicators proposed in this study for the stability analysis of biased rockfall, which describe the damage state of the underlying mudstone base. It is necessary to simultaneously consider four Fos types to evaluate the stability of unstable biased rockfall. The entire calculation process is shown in Fig. 9.
The damage mechanisms at the base of the rock block play an important role in the rockfall evolution process. However, the stress distribution on the contact surface calculated by the proposed analytical methods is difficult to validate with the field data. Therefore, numerical simulation of a biased rockfall was conducted in this study to determine the stress distribution on the contact surface between overhanging sandstone and underlying mudstone. Numerical simulations can take into account material deformation, unlike the analytical methods. FLAC3D, professional software that utilizes the finite-difference method (FDM) for three-dimensional analysis of rocks, soils and other materials, was employed for the 3D numerical simulation. Based on the geological models, a 3D numerical simulation model was conducted with FLAC3D 6.00 to analyse the stress distribution on the contact surface (Fig. 10).
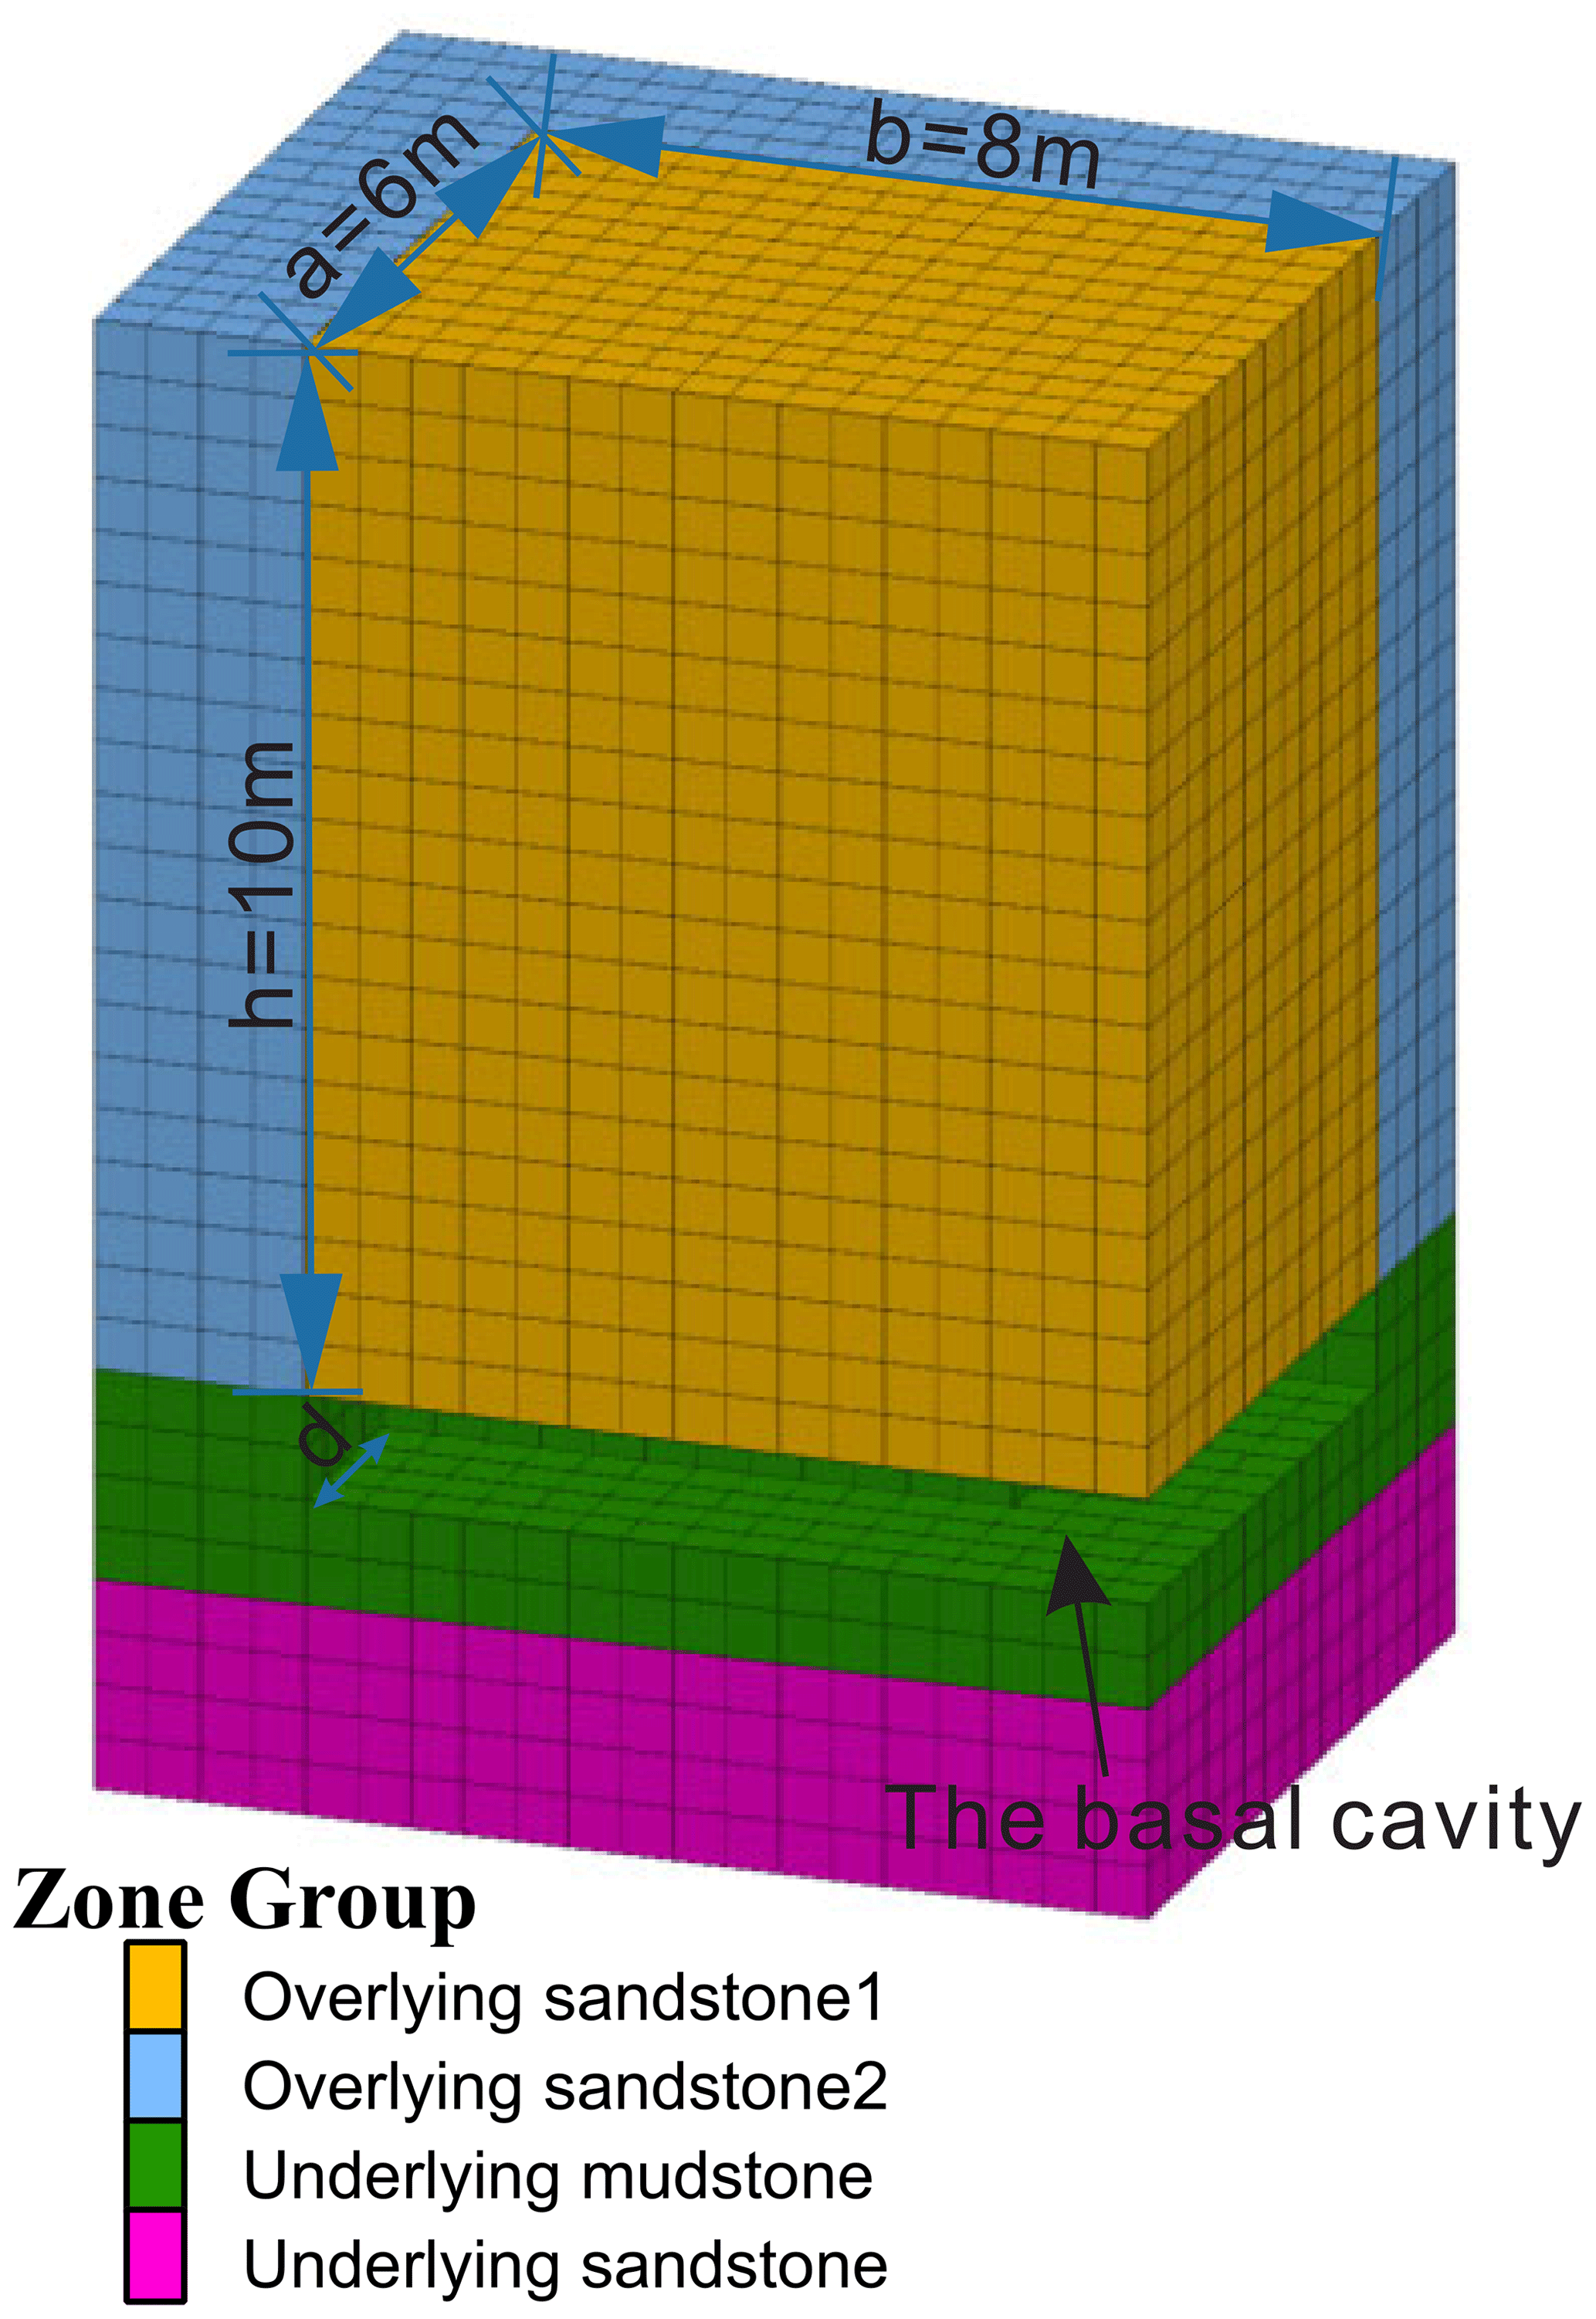
The model is mainly composed of sandstone and mudstone, where “Overhanging sandstone 1” represents an unstable rock block (dimensions are 6, 8 and 10 m, respectively), and the weathering process of the mudstone is represented by excavating in stages in the underlying mudstone. Considering the deformation of the materials, sandstone was considered an elastic model and mudstone was assigned as a Mohr–Coulomb model. Material properties were determined by referring to published literature and investigation reports in the study area. The sandstone has a unit weight (γs) of 25 kN m−3, an elastic modulus of 4530 MPa and a Poisson's ratio of 0.183 (Tang et al., 2010), and the mudstone has a unit weight of 22.54 kN m−3, an elastic modulus of 587 MPa and a Poisson's ratio of 0.232. The friction angle of the contact surface (φ) is set to 25∘, and the cohesion (c) is set to 70 kPa (Zhang et al., 2016). Because of the strength degradation of mudstone foundations due to intense weathering, the maximum compressive stress of mudstone (σcmax) is replaced by the bearing capacity of mudstone foundations (2300 kPa), which is obtained through plate load tests in adjacent areas (Zhang et al., 2021). In addition, the maximum tensile stress of mudstone (σtmax) is valued as of σcmax. The west, north and bottom boundaries of the model are constrained by roller boundary conditions. The cohesion and internal friction angle of the interface between “Overhanging sandstone 1” and “Overhanging sandstone 2” are set to 0. After reaching the initial force–equilibrium state, the mudstone was excavated to simulate the weathering process, and the vertical stress distribution on the sand–mudstone interface at different basal cavity depths was obtained, as shown in Fig. 11.
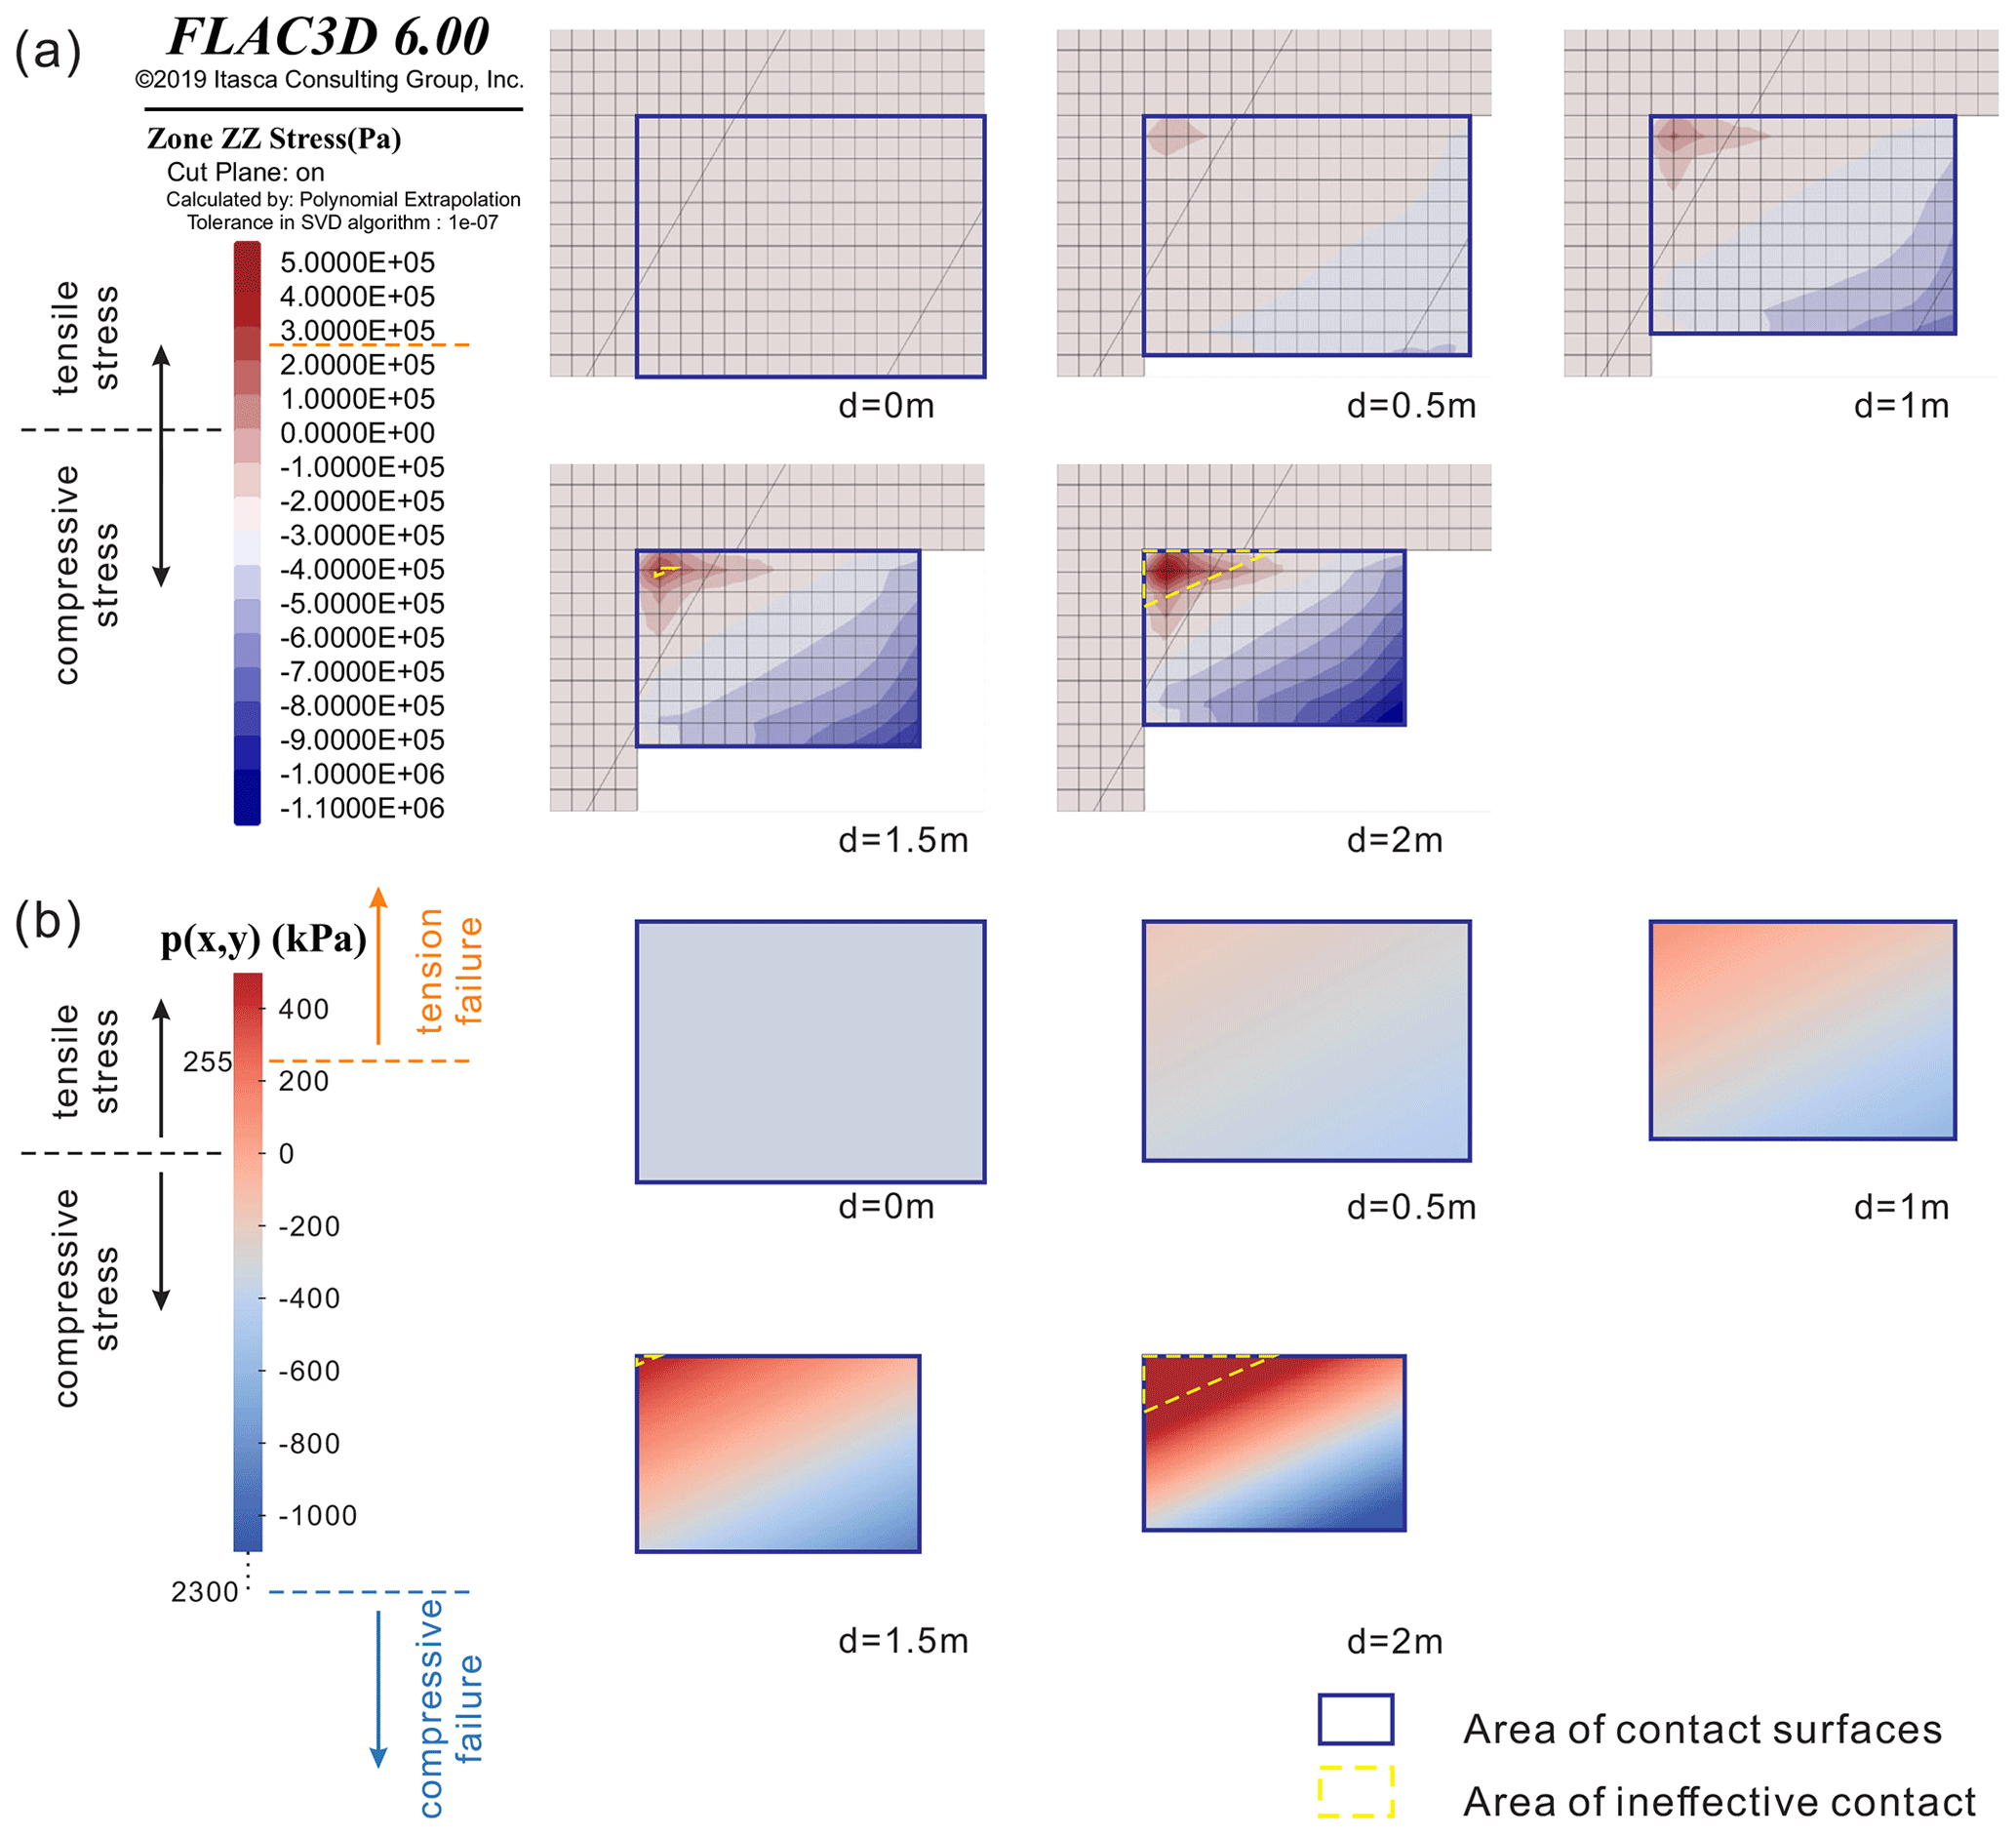
Figure 11Diagram of stress distribution in the vertical direction on the contact interface through different methods: (a) the results of numerical simulation by FLAC3D and (b) the results of the proposed analytical method. SVD stands for singular value decomposition.
When there is no cavity present, represented by d=0 m, the stress distribution is uniform compressive stress (according to the FLAC3D software, compressive stresses are negative). At d=0.5 m, the stress remains entirely compressive, but non-uniform stress distribution occurs on the contact surfaces. At d=1 m, the vertical stress value in the upper-left corner of the contact interface surpasses 0 (Fig. 11), indicating the presence of tensile stress. As d increases to 1.5 or 2 m, the tensile stress in the upper-left corner gradually intensifies, exacerbating the non-uniform stress distribution. The results obtained from the numerical simulation align with those from the analytical method, confirming the existence of tensile stress at the contact interface in the biased rockfall due to external erosion development (Fig. 11). Tensile stress commonly emerges within the contact surface, making it challenging to observe directly in the field.
In the context of the limit equilibrium method, the contact area plays a vital role in stability analysis, as shown in Eqs. (21)–(30) in Sect. 3. The numerical simulation process provides an intuitive understanding of the influence of non-uniform stress distribution on the contact surfaces on the stability of rock blocks. Whether subjected to tension or compression, the rock layer has an ultimate strength. In Fig. 11, when d=1.5 or 2 m, the tensile stress exceeds the ultimate tensile strength, leading to tension failure in the upper-left corner of the stress distribution diagram. The region enclosed by a dashed yellow line represents ineffective contact, where no anti-slip force or overturning moment can be generated due to tension failure at the contact surface. Therefore, this area needs to be subtracted from the total contact area when calculating Fossl and Fosto. Similar situations occur when the compressive stress exceeds the ultimate compressive strength. The current maximum compressive stress has not reached the ultimate compressive strength in Fig. 11. However, as d continues to increase, the area of compression failure will appear in the lower-right corner of diagram in Fig. 11. This occurrence diminishes the area capable of providing anti-slip force or overturning moment, thereby reducing the stability of the rock blocks.
The traditional LEM does not account for distributed forces and fails to consider changes in the contact surface. The method proposed in this study addresses this issue and is applied to the calculation of Fossl and Fosto as presented in Eqs. (21), (25) and (26).
A detailed field investigation was carried out in the source area of rockfall (Fig. 3d). The size of the blocks was determined by on-site measurement with tape and a laser rangefinder. The external erosion in mudstone was measured with a steel ruler, and the morphological characteristics of mudstone foundation were mainly described with the average erosion depth of the basal cavity. The attitude of discontinuities was measured by compass. The mechanical parameters are given in Sect. 4. The height of the water level (hw) is set to be of h, and an earthquake contribution coefficient ke of 0.05 is considered in stability calculations. The data obtained from the field survey were organized according to the coordinate system of the geological model in Sect. 3.1, and Fos was calculated according to the calculation steps in Sect. 3.2. The calculated geometric parameters and Fos results are shown in Table 2.
Table 2Geometric parameters of rock blocks in the study area and Fos results.
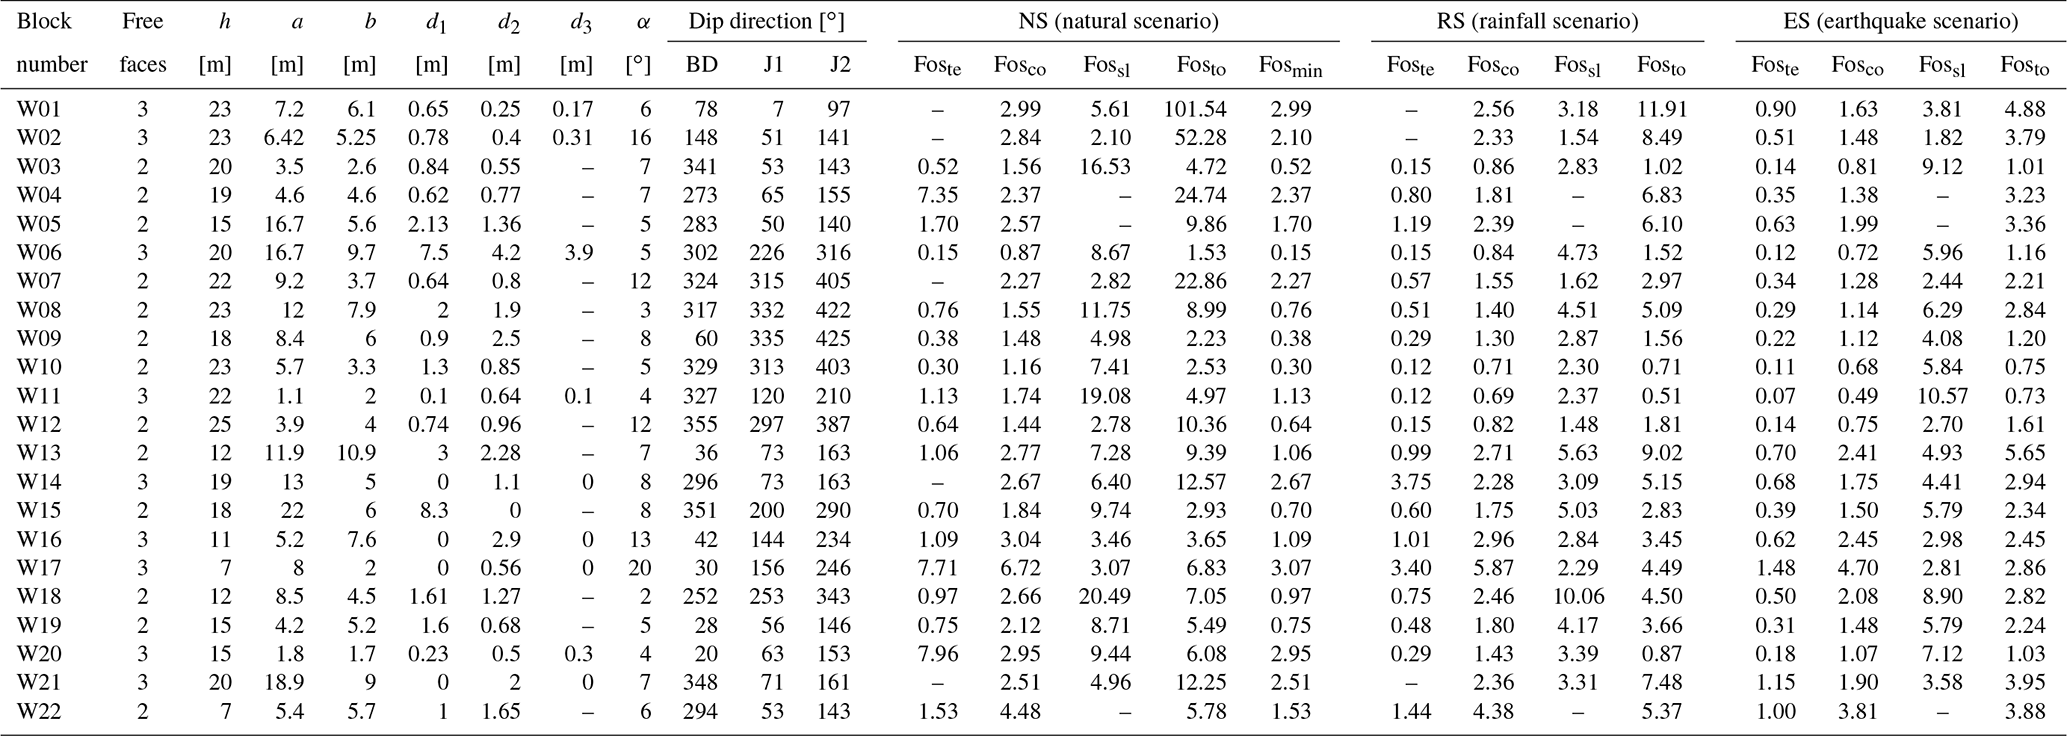
Note: when there is no tensile stress in the mudstone foundation, Foste has no value. For the case of an anaclinal slope, blocks do not slide and Fossl has no value. Both parameters are replaced by “–”.
6.1 Characteristics of rock block stability
There are up to 12 results of Fos per potentially unstable block with the consideration of three scenarios and four failure modes (i.e. partial damage and overall failure). Most Foste values are less than 1 in all scenarios (yellow points in Fig. 12), except for two blocks (i.e. W17 and W20), whose Foste values are also close to 1 under rainfall or earthquake scenarios. Although most of the Fosco values (green points in Fig. 12) are greater than 1, they are closer to the critical state of Fos=1 than Fossl and Fosto (represented by blue and orange points in Fig. 12, respectively). The compression damage of the exposed mudstone can be investigated in the field survey (Fig. 4d). However, it is difficult to observe the phenomenon of tensile damage inside the mudstone base. In the case of weak tensile strength, the mudstone base suffers from tension failure, and compression failure usually occurs before tension failure. According to the results, the Foste and Fosco of these blocks are less than 1 or close to 1, which means that the underlying mudstone has been partially damaged due to slight compressive or tension failure, and the blocks are potentially unstable with the current depth of the basal cavity. However, most of the blocks do not exhibit overall failure, and they still exist on the slope. Moreover, their Fossl and Fosto values are greater than 1 in different scenarios, which is consistent with this actuality. The results indicate that most of the blocks are close to a critical state, in which they are partially damaged but the whole block is still stable.
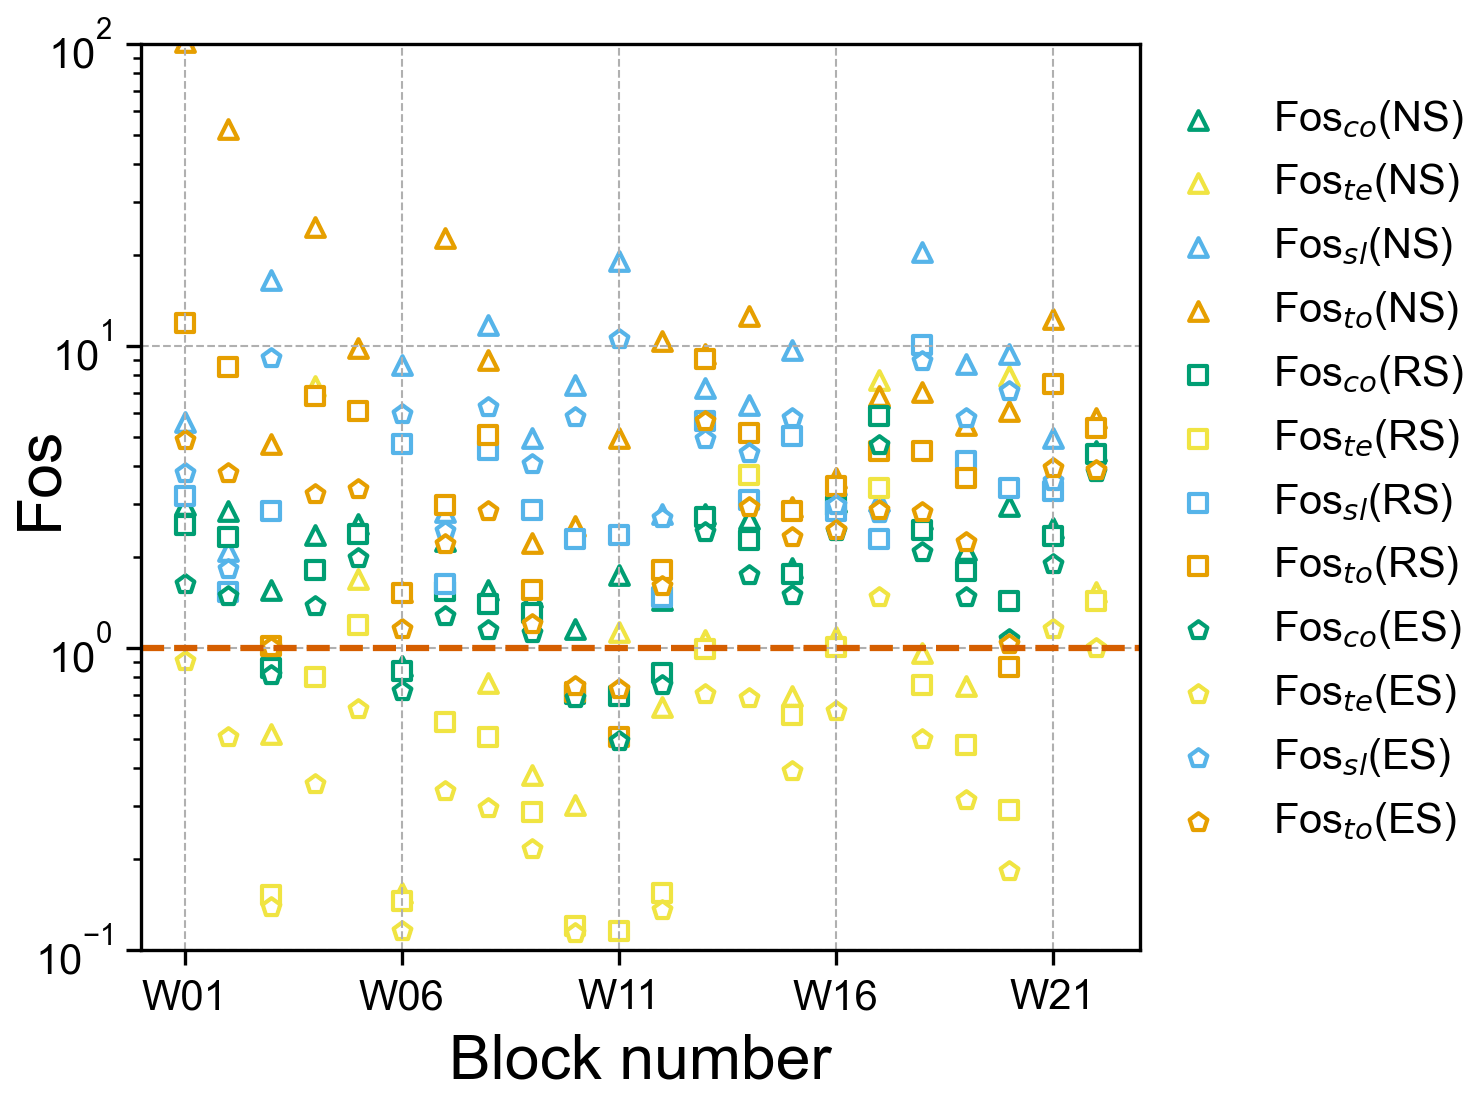
Figure 12Distribution of Fos values in different scenarios. Shapes represent different scenarios, and colours represent different failure modes.
6.2 Relationship between Fos and geometric parameters
Figure 13 presents the relationship between Fosmin and two main geometric parameters, the dip of the contact surface and the retreat ratio. In general, the dip angle of the contact surface (α) is the key factor influencing the sliding failure mode. The horizontal axis in Fig. 13a is α between the rock blocks and underlying mudstone. Most of the points in Fig. 13a are in the interval [0, 8∘], which is consistent with the features of sub-horizontal strata in the study area. The shade of the points does not change significantly in the x-axis direction, as Fig. 13a shows. Therefore, compared with the maximum retreat ratio (rmax), the dip of the contact surface has less influence on rockfall stability in the study area. There was a significant positive correlation between the retreat ratio (rmax) and Fosmin. In Fig. 13b, as the retreat ratios increase in the positive direction of the x axis and y axis, the rock blocks show a notable tendency to be unstable.
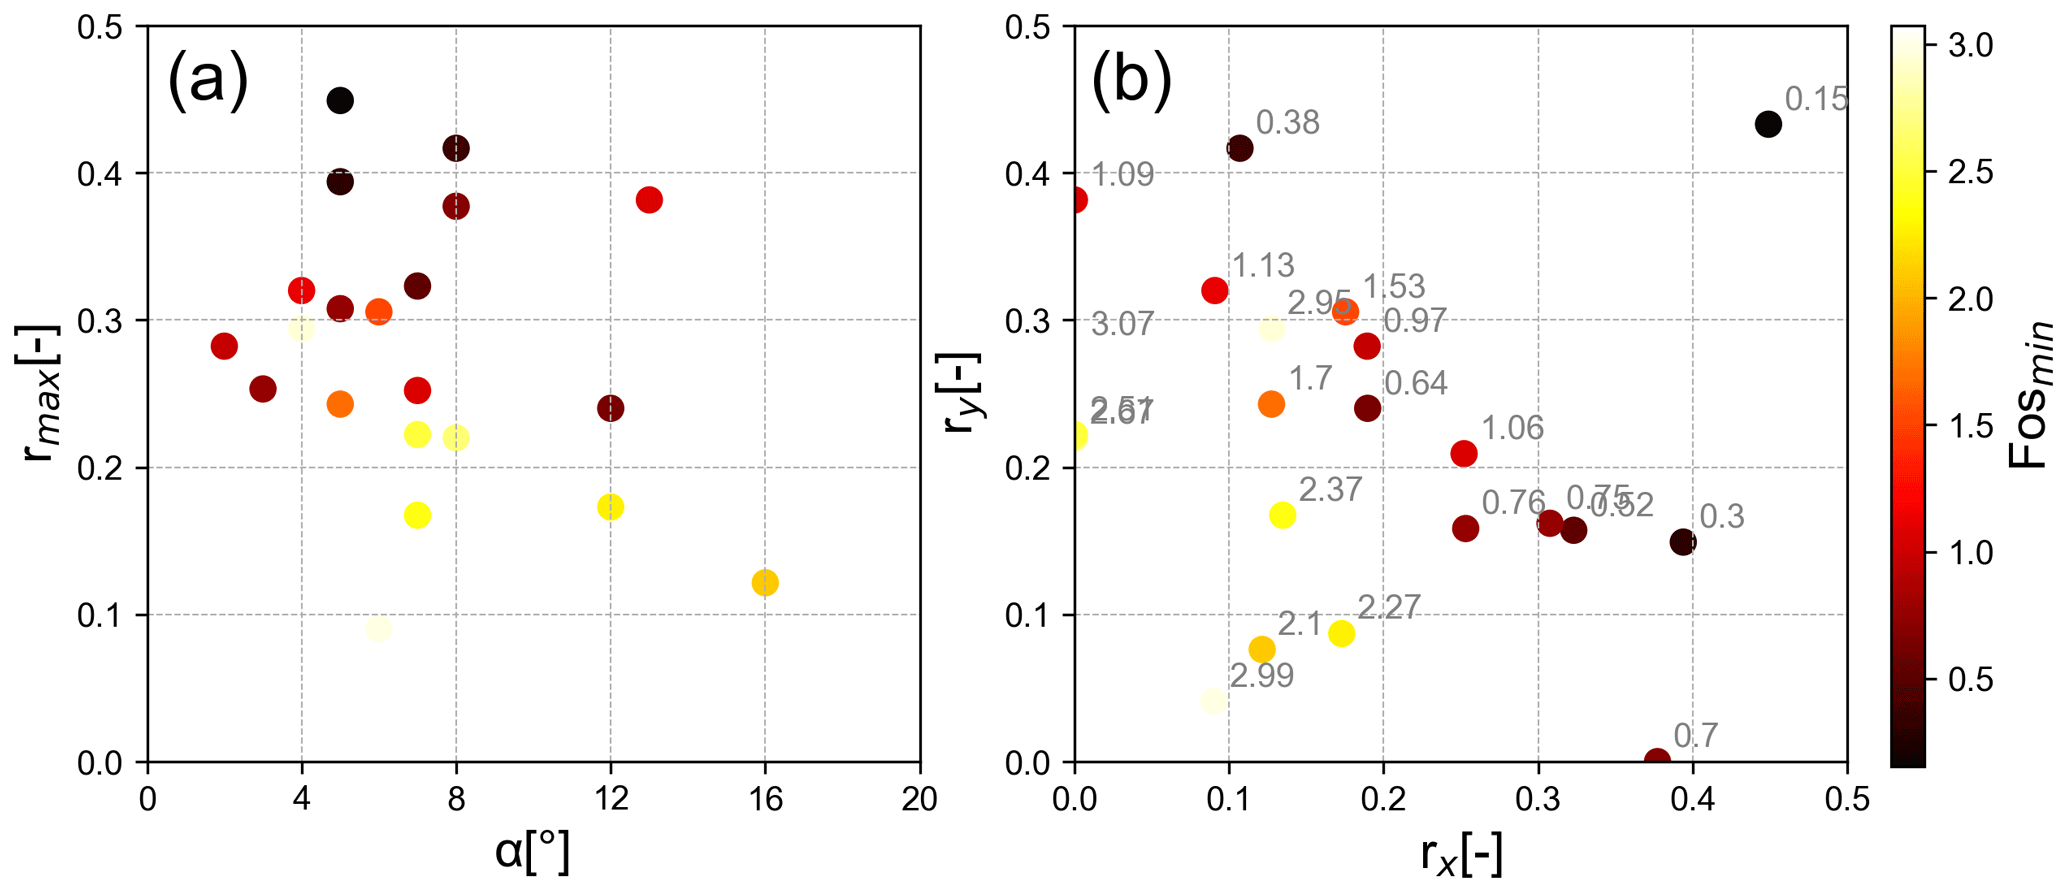
Figure 13Correlation between Fos values and the dip of contact surface and retreat ratio. Here, α is the dip angle of the contact surface between the rock block and underlaying mudstone; rx and ry are the retreat ratio along the x direction and y direction, respectively, equal to and ; and rmax is the larger of rx and ry.
6.3 Definition of rockfall susceptibility
To explore the variation in Fos values with the progressive erosion process of the mudstone on the blocks, the mudstone retreat velocities in different directions are assumed to be equal (5 mm yr−1; Zhang et al., 2016). Figure 14 shows the variations in Fos values of two specific blocks during the evolution process of the basal erosion in the mudstone. In the initial stage, the basal cavity is small, and the overhanging block is stable; all Fos values are greater than 1.0. The basal cavity expands over time as the mudstone weathers; then, the contact area decreases, and non-uniform distributed stress arises. When the stress exceeds the ultimate strength of mudstone in a partial area, Fosco and Foste decrease significantly, as shown in Fig. 14. The instability of the blocks starts from the failure (or damage) of the foundation. Foste and Fosco reach the critical state much earlier than Fossl and Fosto. For these two specific blocks, when rmax increases to 0.4, Fossl and Fosto are still higher than 1.0. This means that the rock blocks can remain globally stable in this condition.
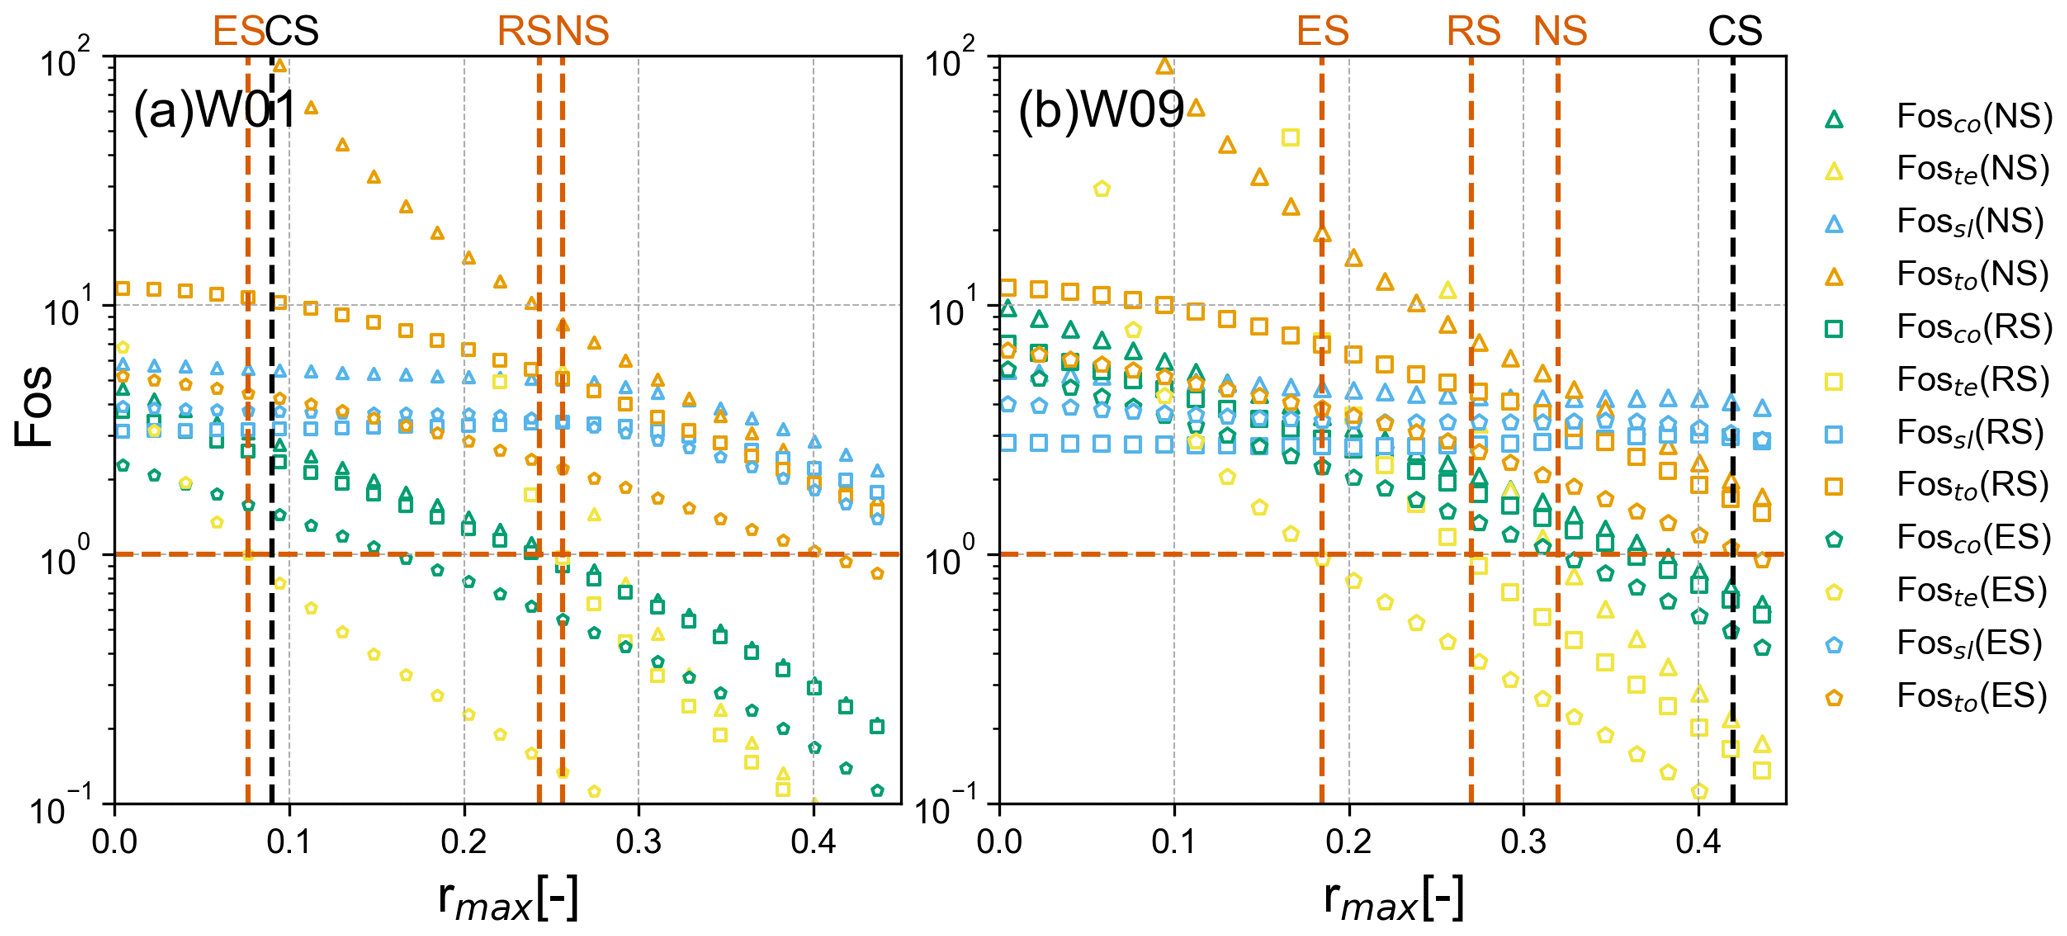
Figure 14Variation in Fos values with rmax. Panel (a) and (b) are the results for W01 and W09, respectively, which represent the situation of the blocks with two and three free faces. The dashed black line (CS) approximately represents the current state of the unstable blocks. The dashed red lines correspond to the critical values of r in different scenarios.
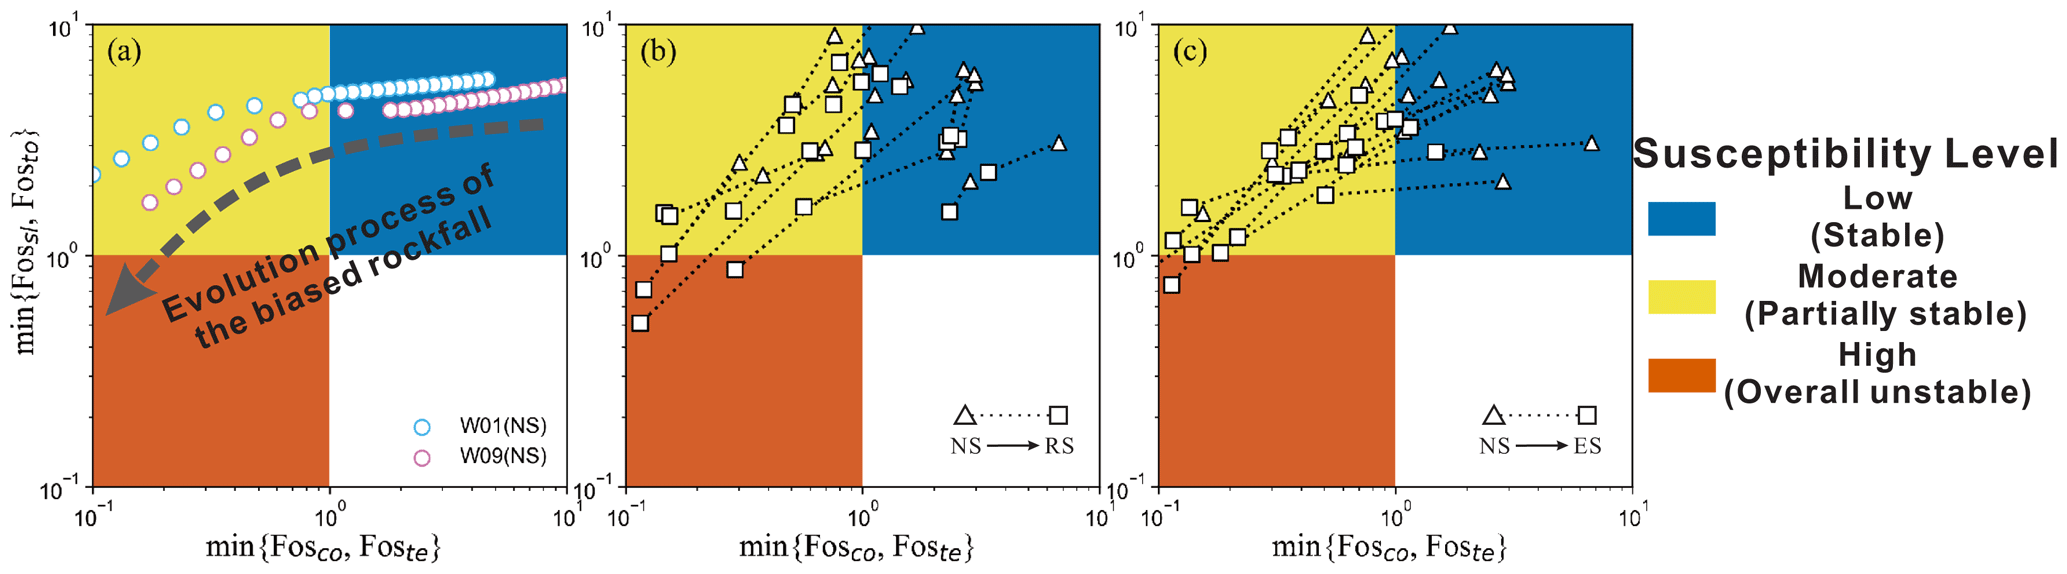
Figure 15Rockfall susceptibility based on the combination of four Fos types. The susceptibility is defined in three levels, represented by red, yellow and blue. Panel (a) shows the progressive failure process of the rock block changing from low susceptibility to moderate susceptibility as the mudstone retreat ratio increases (illustrated by W01 and W09 in the natural scenario. Panels (b) and (c) show the change in susceptibility of biased rock blocks, when the scenario changes from natural conditions to rainfall and earthquake conditions.
These results further elucidate the stability analysis model proposed in this study. Fosco and Foste introduced in this model present the damage state of basal mudstone caused by compressive and tensile stresses, which do not provide global instability of the overhanging block as sliding and toppling. However, Fosco and Foste are important preliminary signs of subsequent global failure of the rock block, as presented through the numerical simulation in Sect. 4. The damage in the basal mudstone can significantly accelerate weathering and prompt expansion of the basal erosion, which will lead to global failure. The lower Fosco and Foste are, the lower the safety margin of the blocks. Therefore, the four Fos types used in this study can provide a more comprehensive quantification of rockfall stability.
This result is consistent with Fig. 12, in which 63.7 % of the yellow and green points (Foste and Fosco) are located between Fos=0.7 and Fos=2.0. This result can be validated by the field phenomena. In the study area, rock damage (e.g. micro-fractures and cleavages) can be observed in the underlying mudstone. However, most overhanging rock blocks are stable at the present time. This means that even if Fossl or Fosto is higher than 1, its foundation has begun to be damaged. In the case of heavy rain or earthquakes, Fossl and Fosto may be reduced to less than 1, and the rockfall occurs.
Based on the meaning of four Fos types, rockfall susceptibility can be divided into three levels. When both Fosco and Foste are greater than 1, the overall rock block is stable and the mudstone base is not damaged, which is defined as “low susceptibility” and represented by the blue area in Fig. 15. With the development of basal erosion, when Fosco or Foste is less than 1 and Fossl and Fosto are higher than 1, the base undergoes damage and the overhanging sandstone blocks remain relatively stable. This state is defined as “moderate susceptibility” and is represented by the yellow area. When Fossl or Fosto is less than 1 in some scenarios, the rock blocks are in a state of “high susceptibility”, which means that rockfalls are highly likely to occur. Figure 15a indicates that along with the increase in the mudstone retreat ratio, the susceptibility of W01 and W09 changes from low susceptibility to moderate susceptibility in the natural scenario. As Fig. 15b and c show, when rainfall or earthquake occurs, the Fossl or Fosto of some blocks is less than 1, which means that some blocks have evolved to the state of high susceptibility and the overall sandstone blocks are unstable.
6.4 Critical retreat ratio in the study area
The basal erosion in the mudstone plays an important role in the progressive failure process of biased rockfall. To analyse the effect of the retreat ratio on the stability of rock blocks, all blocks in the study area were selected to calculate their Fos values and susceptibility level with the increasing r, whose retreat velocities in different directions are assumed to be equal. Figure 16 shows that along with the increase in the retreat ratio, the susceptibility level of rock blocks changes from low to moderate susceptibility. Corresponding to the critical state of of all blocks, the minimum retreat ratio is 0.26, and the maximum retreat ratio is 0.41, as marked by the vertical dashed black line in Fig. 16. According to the statistical analysis of critical retreat ratios, both the mean and the median are 0.33. Therefore, the critical retreat ratio of the rock blocks in the study area can be determined as 0.33, which is marked by the vertical dashed red line in Fig. 16. The critical retreat ratio calculated by this method can be used for the preliminary identification of potentially unstable rock blocks in a specific area, which can help concentrate limited risk treatment resources on these priorities. It should be emphasized that the mechanical parameters and analysis scenarios significantly affect the critical value. Therefore, the elaborative risk control of a given rockfall should be arranged based on its specific parameters and analysis scenarios.
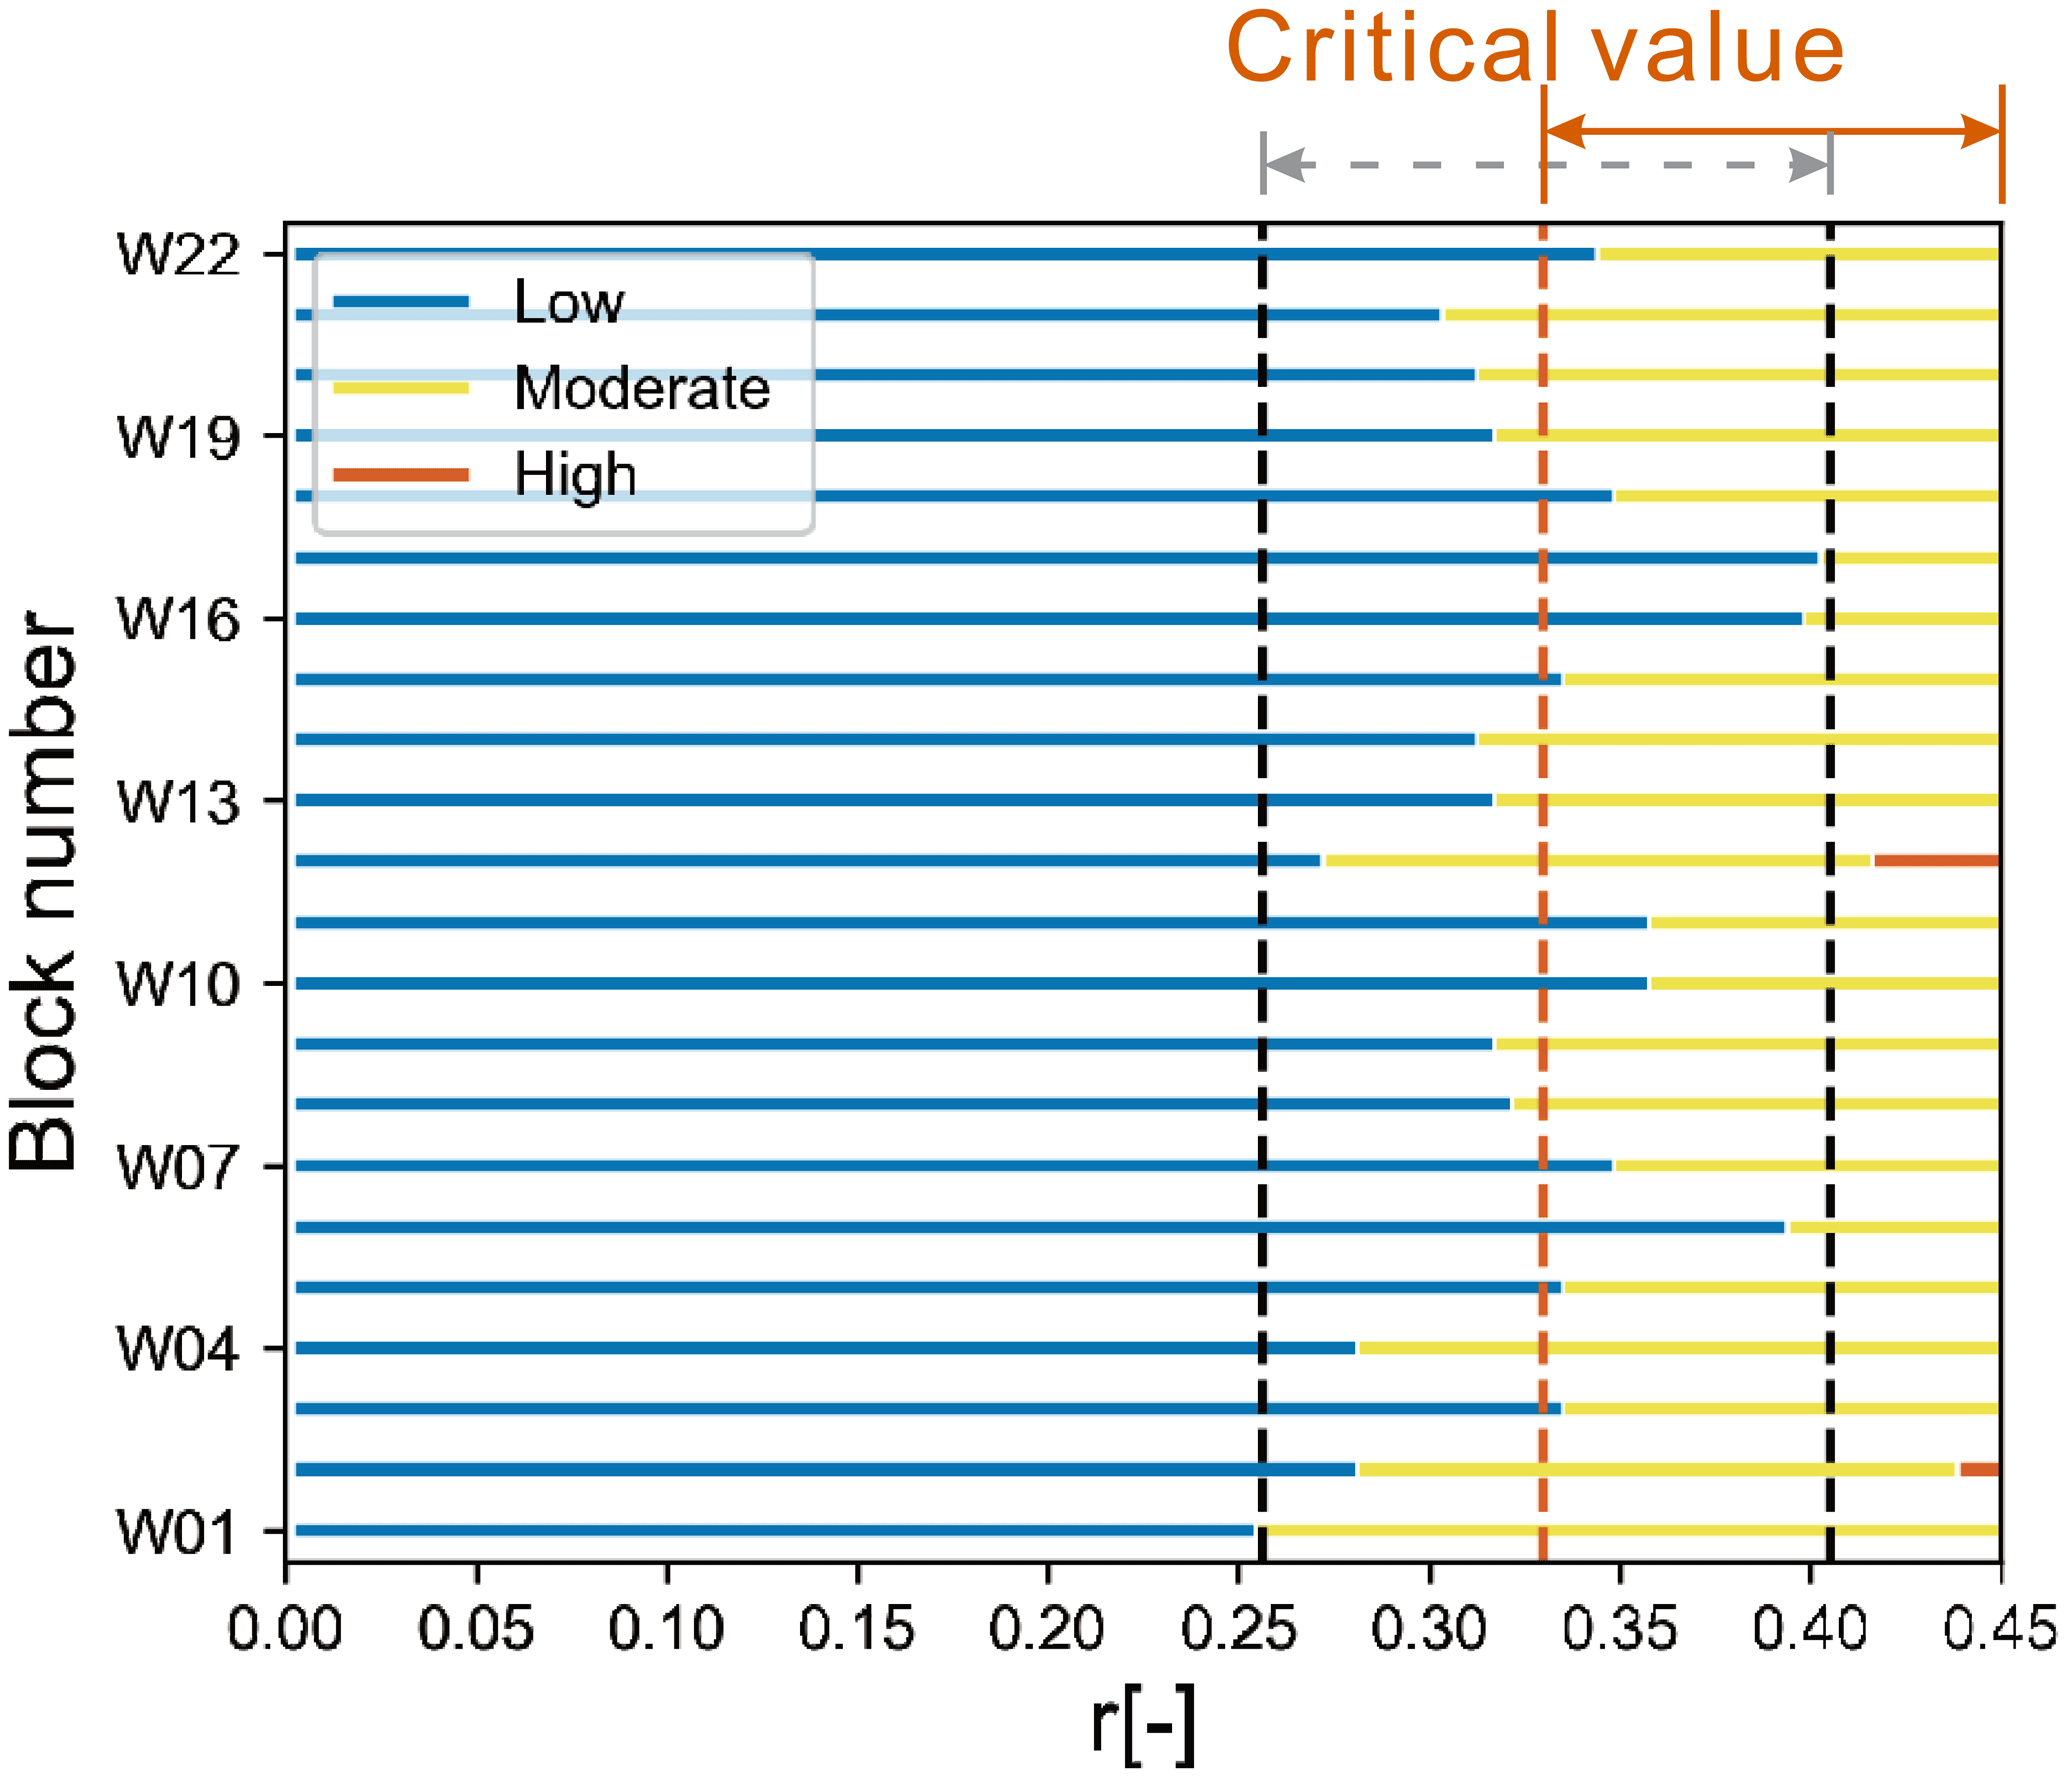
Figure 16Effect of the retreat ratio (r) on the Fos of the rock block, which is illustrated by all blocks in the study area.
6.5 Limitations
This study involves the development of an analytical model for the three-dimensional stability of biased rockfall, combining the basic LEM and the consideration of the non-uniform distribution. Due to the complexity of rock structure and force analysis, it is necessary to highlight the limitations of this model.
First, this study uses a three-dimensional coordinate system and bending theory. It is difficult to consider diverse shapes of rock blocks, and the rock block was simplified as a prismatic column. The assumption of fully persistent discontinuities may underestimate the stability of rock blocks and ignores the stress transmission in joints or rock bridges. Then, following the basic framework of the general LEM, this study assumed that the rock is not subjected to deformations. The complete stress–strain behaviour, such as the deformation in the mudstone layer, is not considered in this study. The mode of tension failure is very difficult to observe in the field, and it is currently verified by means of numerical simulation. Furthermore, the block stability is strongly influenced by the uncertainty in mechanical parameters. However, because of the difficulties in sampling strongly weathered mudstone, it is difficult to obtain adequate parameter values for uncertainty statistics. These limitations will be important considerations in future studies.
Due to differential weathering in sub-horizontally interbedded hard rock and soft rock, multi-layer biased rockfalls develop on steep slopes. In mountainous ranges, cut slopes and coastal cliffs, rockfall may cause significant facility damage and casualties in residential areas and transport corridors. The aim of this study was to present a new three-dimensional analytical method for the stability of rock blocks with basal cavities. In this method, a non-uniform distributed stress due to the eccentricity effect is applied at the contact surface instead of a point force. The development of non-uniform distributed stress calculated by the proposed analytical methods was validated by numerical simulation, which presents the evolution process of biased rockfall from partial damage of the soft underlying layer, caused by non-uniform distributed stress, to toppling and sliding of overhanging hard rock block due to overall unbalanced force. The method considers four failure modes according to the rockfall evolution process, including partial damage of the soft foundation (Fosco and Foste) and overall failure of the rock block (Fossl and Fosto).
Taking the northeastern edge of the Sichuan Basin in southwest China as the study area, the proposed method is used to calculate the Fos of biased unstable rock blocks. The results show that in the natural scenario, the underlying mudstone of some rock blocks has been partially damaged, and compression failure of the mudstone has been observed in the field. Some rock blocks are expected to fail as a whole in rainfall or earthquake scenarios. The statistical analysis indicates that the retreat ratio is the crucial factor influencing the Fos of biased rockfall. On the basis of different combinations of four Fos types, rockfall susceptibility was classified into three levels. As the retreat rate increases, the rock blocks undergo an evolution process from stability to partial instability and then overall instability. Based on the current mechanical parameters of the eastern Sichuan Basin, the critical retreat ratio from low to moderate rockfall susceptibility is 0.33.
The proposed method improves the three-dimensional mechanical model of a rock block with the basal erosion by considering non-uniform distributed stress at the contact surface, which could promote the accuracy of rockfall stability analysis. Due to the assumptions adopted and the complexity of the failure mechanism of biased rockfall, there are some limitations in this method, mainly including the simplification of boundary conditions and rock deformation. These limitations will be important considerations in future studies.
| a | length of the block along the x direction |
| A | area of contact surfaces |
| b | width of the block along the y direction |
| c | cohesive force of the mudstone |
| di | width of the basal cavity in a certain direction |
| ex | eccentric distance along the x direction |
| ey | eccentric distance along the y direction |
| Ex | horizontal seismic force along the x direction |
| Fos | factor of safety |
| h | height of the block |
| hw | height of the water in the fracture |
| Hx | water pressure along the x direction |
| Ix | moment of inertia with respect to the x axis |
| Iy | moment of inertia with respect to the y axis |
| ke | earthquake contribution coefficient |
| k1 | rainfall coefficient, taking 1 in the rainfall |
| scenario and 0 in the non-rainfall scenario | |
| k2 | earthquake coefficient, taking 1 in the seismic |
| scenario and 0 in the non-seismic scenario | |
| k3 | free-surface coefficient, taking 1 for two free |
| surfaces and 0 for three free surfaces | |
| total bending moments with respect to the | |
| x axis on the mudstone foundation | |
| total bending moments with respect to the | |
| y axis on the mudstone foundation | |
| bending moment of Ex with respect to the | |
| x axis on the mudstone foundation | |
| bending moment of Hx with respect to the | |
| x axis on the mudstone foundation | |
| bending moment of W with respect to the | |
| x axis on the mudstone foundation | |
| overturning moment provided by Ex | |
| along the x direction | |
| overturning moment provided by Hx along | |
| the x direction | |
| stabilizing moment of pn along the | |
| x direction | |
| stabilizing moment provided by W along | |
| the x direction | |
| overturning moment provided by W along | |
| the x direction | |
| Nz | total applied vertical load on the |
| mudstone base | |
| O | origin of the (x, y) coordinates |
| p(x,y) | pressure magnitude at point (x, y) |
| ri | the basal mudstone retreat ratio equal to |
| the ratio of the basal cavity width to the block | |
| width in a certain direction | |
| W | weight of the block |
| x | distance to O along the x axis |
| y | distance to O along the y axis |
| α | true dip of the contact surface |
| γs | unit weight of sandstone |
| γw | unit weight of water |
| θ1 | apparent dip of α on plane J1 |
| θ2 | apparent dip of α on plane J2 |
| σcmax | ultimate compressive strength of the |
| mudstone | |
| σtmax | ultimate tensile strength of the |
| mudstone | |
| τmax | ultimate shear strength of the |
| mudstone | |
| φ | friction angle of the mudstone |
| ω1 | angle between the trend of the contact |
| surface and the x direction | |
| ω2 | angle between the trend of the contact |
| surface and the y direction |
All raw data can be provided by the corresponding authors upon request.
XS, BC and JD planned the campaign; XS and BC performed the field measurements; XS, BC, WW and BL designed and developed the methodology. XS, BC and JD analysed the data; XS and BC wrote the manuscript draft; JD and WW reviewed and edited the manuscript.
The contact author has declared that none of the authors has any competing interests.
Publisher's note: Copernicus Publications remains neutral with regard to jurisdictional claims made in the text, published maps, institutional affiliations, or any other geographical representation in this paper. While Copernicus Publications makes every effort to include appropriate place names, the final responsibility lies with the authors.
This research is funded by the National Natural Science Foundation of China (nos. 42172318 and 42177159). The first author thanks Chengjie Luo and Yu Wang for data collection in the field. We also appreciate the assistance of the Research Center for Geohazards Monitoring and Warning in Three Gorges Reservoir, China. We also thank the reviewers for their suggestions that improved the quality of this paper.
This research has been supported by the National Natural Science Foundation of China (grant nos. 42172318 and 42177159).
This paper was edited by Daniele Giordan and reviewed by two anonymous referees.
Adrian, I.: Pressures distribution for eccentrically loaded rect15 angular footings on elastic soils, in: Proceedings of the 2010 international conference on Mathematical models for engineering science, 30 November–2 December 2010, Tenerife, Spain, 213–216, ISBN 978-960-474-252-3, 2010.
Alejano, L. R., Ordóñez, C., Armesto, J., and Rivas, T.: Assessment of the instability hazard of a granite boulder, Nat. Hazards, 53, 77–95, https://doi.org/10.1007/s11069-009-9413-0, 2010.
Alejano, L. R., Carranza-Torres, C., Giani, G. P., and Arzua, J.: Study of the stability against toppling of rock blocks with rounded edges based on analytical and experimental approaches, Eng. Geol., 195, 172–184, https://doi.org/10.1016/j.enggeo.2015.05.030, 2015.
Ashby, J.: Sliding and toppling modes of failure in models and jointed rock slopes, MS thesis, Imperial College London University, London, 1971.
Bray, J. W. and Goodman, R. E.: The theory of base friction models, Int. J. Rock Mech. Min. Sci. Geomech. Abstr., 18, 453–468, https://doi.org/10.1016/0148-9062(81)90510-6, 1981.
Budetta, P.: Assessment of rockfall risk along roads, Nat. Hazards Earth Syst. Sci., 4, 71–81, https://doi.org/10.5194/nhess-4-71-2004, 2004.
Budetta, P. and Nappi, M.: Comparison between qualitative rockfall risk rating systems for a road affected by high traffic intensity, Nat. Hazards Earth Syst. Sci., 13, 1643–1653, https://doi.org/10.5194/nhess-13-1643-2013, 2013.
Chau, K. T., Wong, R. H. C., Liu, J., and Lee, C. F.: Rockfall hazard analysis for Hong Kong based on rockfall inventory, Rock Mech. Rock Eng., 36, 383–408, https://doi.org/10.1007/s00603-002-0035-z, 2003.
Chen, H. K. and Tang, H. M.: Stability analysis method of perilous rock in source of avalanche, J. Geol. Min. Res., 2, 60–67, 2010.
Chen, H. K., Xian, X. F., Tang, H. M., and Feng, Q. H.: A massive development mechanism and countermeasures for perilous rocks in the Three Gorges Reservoir area of PR China: The example of the Taibaiyan cliff at Wanzhou, J. Chongqing Univers., 31, 1178–1184, https://doi.org/10.11835/j.issn.1000-582X.2008.10.019, 2008.
Corominas, J., Mavrouli, O., and Ruiz-Carulla, R.: Magnitude and frequency relations: are there geological constraints to the rockfall size?, Landslides, 15, 829–845, https://doi.org/10.1007/s10346-017-0910-z, 2018.
Cruden, D. M. and Varnes, J. D.: Landslide types and processes. Landslides: investigation and mitigation, transportation research board (National Research Council), National Academy Press, Washington, DC, ISBN 030906208X, 1996.
D'Amato, J., Hantz, D., Guerin, A., Jaboyedoff, M., Baillet, L., and Mariscal, A.: Influence of meteorological factors on rockfall occurrence in a middle mountain limestone cliff, Nat. Hazards Earth Syst. Sci., 16, 719–735, https://doi.org/10.5194/nhess-16-719-2016, 2016.
Derron, M. H., Jaboyedoff, M., and Blikra, L. H.: Preliminary assessment of rockslide and rockfall hazards using a DEM (Oppstadhornet, Norway), Nat. Hazards Earth Syst. Sci., 5, 285–292, https://doi.org/10.5194/nhess-5-285-2005, 2005.
Ferrari, F., Giacomini, A., and Thoeni, K.: Qualitative Rockfall Hazard Assessment: A Comprehensive Review of Current Practices, Rock Mech. Rock Eng., 49, 2865–2922, https://doi.org/10.1007/s00603-016-0918-z, 2016.
Frattini, P., Crosta, G., Carrara, A., and Agliardi, F.: Assessment of rockfall susceptibility by integrating statistical and physically-based approaches, Geomorphology, 94, 419–437, https://doi.org/10.1016/j.geomorph.2006.10.037, 2008.
Frayssines, M. and Hantz, D.: Modelling and back-analysing failures in steep limestone cliffs, Int. J. Rock Mech. Min. Sci., 46, 1115–1123, https://doi.org/10.1016/j.ijrmms.2009.06.003, 2009.
Guzzetti, F., Reichenbach, P., and Wieczorek, G. F.: Rockfall hazard and risk assessment in the Yosemite Valley, California, USA, Nat. Hazards Earth Syst. Sci., 3, 491–503, https://doi.org/10.5194/nhess-3-491-2003, 2003.
Hutchinson, J. N.: Field and laboratory studies of a fall in Upper Chalk cliffs at Joss Bay, Isle of Thanet, in: Stress-Strain Behaviour of Soils, Proceedings of the Roscoe Memorial Symposium, 29–31 March 1971, Oxfordshire, 692–706, ISBN 0854291211, 1972.
Jaboyedoff, M., Baillifard, F., Philippossian, F., and Rouiller, J. D.: Assessing fracture occurrence using “weighted fracturing density”: a step towards estimating rock instability hazard, Nat. Hazards Earth Syst. Sci., 4, 83–93, https://doi.org/10.5194/nhess-4-83-2004, 2004.
Jaboyedoff, M., Ben Hammouda, M., Derron, M.-H., Guérin, A., Hantz, D., and Noel, F.: The Rockfall Failure Hazard Assessment: Summary and New Advances, in: Understanding and Reducing Landslide Disaster Risk: Volume 1 Sendai Landslide Partnerships and Kyoto Landslide Commitment, edited by: Sassa, K., Mikoš, M., Sassa, S., Bobrowsky, P. T., Takara, K., and Dang, K., Springer International Publishing, Cham, 55–83, https://doi.org/10.1007/978-3-030-60196-6_3, 2021.
Kogure, T., Aoki, H., Maekado, A., Hirose, T., and Matsukura, Y.: Effect of the development of notches and tension cracks on instability of limestone coastal cliffs in the Ryukyus, Japan, Geomorphology, 80, 236–244, https://doi.org/10.1016/j.geomorph.2006.02.012, 2006.
Kromer, R., Lato, M., Hutchinson, D. J., Gauthier, D., and Edwards, T.: Managing rockfall risk through baseline monitoring of precursors using a terrestrial laser scanner, Can. Geotech. J., 54, 953–967, https://doi.org/10.1139/cgj-2016-0178, 2017.
Lin, D. and Fairhurst, C.: Static analysis of the stability of three-dimensional blocky systems around excavations in rock, Int. J. Rock Mech. Min. Sci. Geomech. Abstr., 25, 139–147, https://doi.org/10.1016/0148-9062(88)92296-6, 1988.
Malamud, B. D., Turcotte, D. L., Guzzetti, F., and Reichenbach, P.: Landslide inventories and their statistical properties, Earth Surf. Proc. Land., 29, 687–711, https://doi.org/10.1002/esp.1064, 2004.
Matasci, B., Stock, G. M., Jaboyedoff, M., Carrea, D., Collins, B. D., Guerin, A., Matasci, G., and Ravanel, L.: Assessing rockfall susceptibility in steep and overhanging slopes using three-dimensional analysis of failure mechanisms, Landslides, 15, 859–878, https://doi.org/10.1007/s10346-017-0911-y, 2018.
Pérez-Rey, I., Muñiz-Menéndez, M., González, J., Vagnon, F., Walton, G., and Alejano, L. R.: Laboratory physical modelling of block toppling instability by means of tilt tests, Eng. Geol., 282, 105994, https://doi.org/10.1016/j.enggeo.2021.105994, 2021.
Pierson, L. A., Davis, S. A., and Van Vickle, R.: Rockfall hazard rating system–implementation manual, Federal Highway Administration (FHWA), Report FHWA–OR-EG-90-01, FHWA, US Department of Transportation, 80 pp., https://www.fhwa.dot.gov/engineering/geotech/pubs/009767.pdf (last access: 5 November 2023), 1990.
Sagaseta, C.: On the Modes of Instability of a Rigid Block on an Inclined Plane, Rock Mech. Rock Eng., 19, 261–266, https://doi.org/10.1007/Bf01039998, 1986.
Santi, P. M., Russell, C. P., Higgins, J. D., and Spriet, J. I.: Modification and statistical analysis of the Colorado Rockfall Hazard Rating System, Eng. Geol., 104, 55–65, https://doi.org/10.1016/j.enggeo.2008.08.009, 2009.
Tang, H. M., Wang, L. F., Chen, H. K., and Xian, X. F.: Collapse sequence of perilous rock on cliffs with soft foundation, Chin. J. Geotech. Eng., 32, 205–210, 2010.
Volkwein, A., Schellenberg, K., Labiouse, V., Agliardi, F., Berger, F., Bourrier, F., Dorren, L. K. A., Gerber, W., and Jaboyedoff, M.: Rockfall characterisation and structural protection – a review, Nat. Hazards Earth Syst. Sci., 11, 2617–2651, https://doi.org/10.5194/nhess-11-2617-2011, 2011.
Ward, D. J., Berlin, M. M., and Anderson, R. S.: Sediment dynamics below retreating cliffs, Earth Surf. Proc. Land., 36, 1023–1043, https://doi.org/10.1002/esp.2129, 2011.
Wu, L. Z., Zhang, L. M., Zhou, Y., Xu, Q., Yu, B., Liu, G. G., and Bai, L. Y.: Theoretical analysis and model test for rainfall-induced shallow landslides in the red-bed area of Sichuan, Bull. Eng. Geol. Environ., 77, 1343–1353, https://doi.org/10.1007/s10064-017-1126-0, 2018.
Yu, B., Ma, E., Cai, J., Xu, Q., Li, W., and Zheng, G.: A prediction model for rock planar slides with large displacement triggered by heavy rainfall in the Red bed area, Southwest, China, Landslides, 18, 773–783, https://doi.org/10.1007/s10346-020-01528-x, 2021.
Zhan, J., Yu, Z., Lv, Y., Peng, J., Song, S., and Yao, Z.: Rockfall Hazard Assessment in the Taihang Grand Canyon Scenic Area Integrating Regional-Scale Identification of Potential Rockfall Sources, Remote Sens., 14, 3021, https://doi.org/10.3390/rs14133021, 2022.
Zhang, K., Tan, P., Ma, G. W., and Cao, P.: Modeling of the progressive failure of an overhang slope subject to differential weathering in Three Gorges Reservoir, China, Landslides, 13, 1303–1313, https://doi.org/10.1007/s10346-015-0672-4, 2016.
Zhang, K., Tan, P., Ma, G. W., and Cao, P.: Modeling of the progressive failure of an overhang slope subject to differential weathering in Three Gorges Reservoir, China, Landslides, 13, 1303–1313, https://doi.org/10.1007/s10346-015-0672-4, 2021.
Zhang, M., Yin, Y. P., and Huang, B. L.: Mechanisms of rainfall-induced landslides in gently inclined red beds in the eastern Sichuan Basin, SW China, Landslides, 12, 973–983, https://doi.org/10.1007/s10346-015-0611-4, 2015.
Zhou, C., Yin, K. L., Cao, Y., Ahmed, B., Li, Y. Y., Catani, F., and Pourghasemi, H. R.: Landslide susceptibility modeling applying machine learning methods: A case study from Longju in the Three Gorges Reservoir area, China, Comput. Geosci., 112, 23–37, https://doi.org/10.1016/j.cageo.2017.11.019, 2018.
Zhou, Y., Shi, S., Zhang, Y., Cai, Q., Liang, J., and Cheng, Y.: Stability of unstable rock in nearly-horizontal sandstone-mudstone stratum due to enlarged rock-cell, J. Eng. Geol., 25, 1220–1229, https://doi.org/10.13544/j.cnki.jeg.2017.05.006, 2017.
- Abstract
- Introduction
- Study area
- Calculation method
- Validation of analytical methods by numerical simulation
- Results
- Discussion
- Conclusions
- Appendix A: List of symbols
- Data availability
- Author contributions
- Competing interests
- Disclaimer
- Acknowledgements
- Financial support
- Review statement
- References