the Creative Commons Attribution 4.0 License.
the Creative Commons Attribution 4.0 License.
 | 01 Nov 2023
The impact of global navigation satellite system (GNSS) zenith total delay data assimilation on the short-term precipitable water vapor and precipitation forecast over Italy using the Weather Research and Forecasting (WRF) model
Rosa Claudia Torcasio
Alessandra Mascitelli
Eugenio Realini
Stefano Barindelli
Giulio Tagliaferro
Silvia Puca
Stefano Dietrich
The impact of assimilating GNSS-ZTD (global navigation satellite system–zenith total delay) on the precipitable water vapor and precipitation forecast over Italy is studied for the month of October 2019, which was characterized by several moderate to intense precipitation events, especially over northwestern Italy. The WRF (Weather Research and Forecasting) model, version 4.1.3, is used with its 3D-Var data assimilation system to assimilate ZTD observations from 388 GNSS receivers distributed over the country. The dataset was built collecting data from all the major national and regional GNSS permanent networks, achieving dense coverage over the whole area. The water vapor forecast is verified for the forecast hours of 1–6 h after the last data assimilation time. Results show that WRF underestimates the atmospheric water vapor content for the period, and GNSS-ZTD data assimilation improves this underestimation. The precipitation forecast is verified in the phases of 0–3 and 3–6 h after the last data assimilation time using more than 3000 rain gauges spread over Italy. The application of GNSS-ZTD data assimilation to a case study improved the precipitation forecast by increasing the rainfall maximum and by better focusing the precipitation pattern over northeastern Italy, with the main drawback being the prediction of false alarms. Considering the study over the whole period, GNSS-ZTD data assimilation had a positive impact on rainfall forecast, with an improvement in the performance up to 6 h and with statistically significant results for moderate to intense rainfall thresholds (25–30 mm (3 h)−1).
- Article
(7973 KB) - Full-text XML
-
Supplement
(3548 KB) - BibTeX
- EndNote


The Mediterranean area is often struck by severe weather and deep convective events because of the presence of the warm sea, the complex orography of the area and the specific synoptic-scale environment. This scenario is worsened by climate change, which is affecting many weather and climate extremes, and the frequency and intensity of heavy-precipitation events have increased in most of the world (IPCC, 2023). Numerical weather prediction (NWP) models are useful tools to predict adverse weather conditions and to guide responsive actions for mitigating the impact of severe weather. Over the past years, the use of NWP models, along with an increasing availability of computing power, has led to an improvement in the forecast accuracy. However, NWPs have well-known difficulties in representing the physical processes at small spatial and temporal scales, which are involved in convective or severe weather events (Stensrud et al., 2009).
One of the common problems of NWP-based nowcasting and short-term forecasting is the spin-up time because the model needs a few hours to balance the inconsistencies between the initial and boundary conditions to properly reproduce the small-scale dynamic (Lagasio et al., 2019). Data assimilation of local observations in NWP has been reported as a key factor in reducing this issue and improving the prediction of high-impact weather events (Federico et al., 2021). Among local observations, water vapor plays a key role because of its importance in humid and energetic exchanges in the atmosphere. Therefore, good knowledge of water vapor distribution in space and time is a fundamental requirement for improving NWP forecasts of convective and severe weather events.
Global navigation satellite system (GNSS – a collective term used to address all global and regional satellite navigation systems, including the Global Positioning System (GPS), Galileo, GLONASS and BeiDou) routine observation processing for geodetic and geophysical purposes can provide estimates of the tropospheric delays (generally ZTD – zenith total delay), directly connected to the water vapor content in the atmosphere, which can be very useful to improve NWP forecasts. Relevant, albeit non-exhaustive, experiences are shortly summarized hereafter:
-
Vedel and Huang (2004) assimilated GNSS-ZTD into the High Resolution Limited Area Model using three-dimensional variational data assimilation (3D-Var) and found improvements for the forecast of geopotential height and high precipitation levels.
-
Poli et al. (2007), assimilated GNSS-ZTD using four-dimensional variational data assimilation (4D-Var) and the ARPEGE (Action de Researche Petite Echelle Grande Echelle) global model. Results show the positive impact of the GNSS-ZTD data assimilation on the forecast of synoptic-scale circulations and precipitation in spring and summer. Other studies followed in France (Boniface et al., 2009; Yan et al., 2009) and found a positive impact of GNSS-ZTD data assimilation on the NWP forecast.
-
Bennitt and Jupp (2012) assimilated GNSS-ZTD observations by both 3D-Var and 4D-Var using the Met Office North Atlantic and European model. The assimilation of GNSS-ZTD resulted in an improvement of the cloud forecast.
-
Lindskog et al. (2017) performed GNSS-ZTD data assimilation, assimilating data into the HARMONIE-AROME model at 2.5 km horizontal resolution. The assimilation was performed by 3D-Var and improved the forecast by up to 1.5 d.
-
Rohm et al. (2019) assimilated GNSS (both ZTD and precipitable water) in the Weather Research and Forecasting (WRF) model at 4 km horizontal resolution over Poland for 2 months. They found an improvement in predicting both water vapor and precipitation. In the same direction, Trzcina et al. (2020) showed the positive impact of assimilating the GNSS tomography wet refractivity field on temperature and precipitation forecasting at the short range (0–6 h) over Poland.
-
Giannaros et al. (2020) showed the positive impact of GNSS-ZTD data assimilation on both precipitation and water vapor forecast over Greece, and Caldas-Alvarez and Khodayar (2020) showed similar results with the climatic setting of the COSMO model over a large portion of the Mediterranean and central Europe.
-
Risanto et al. (2021) assessed the impact of GPS precipitable water vapor (PWV) data assimilation on short-range North American monsoon precipitation forecasts over northwest Mexico. They showed that GPS-PWV data assimilation created more favorable conditions for nocturnal convection organization, leading to a better precipitation forecast.
-
Singh et al. (2019) studied the impact of GNSS-ZTD data assimilation over the Indian region with the WRF model. They showed a positive impact on the precipitation forecast and on the lower- to middle-tropospheric moisture, upper-air temperature, and middle- and upper-tropospheric wind.
-
Yang et al. (2020) assimilated both radar reflectivity and GNSS-ZTD for a heavy-rainfall event over Taiwan. They showed the complementary role of both observations in improving the precipitation forecast.
The assimilation of GNSS data is also used in an operational context. The Rapid Refresh model over the USA assimilates GPS-derived integrated water vapor (IWV) every hour from 300 stations across the USA (Benjamin et al., 2016). The study shows that there is a clear benefit in using GNSS observations in rapid refresh weather forecasting.
Considering the GNSS data assimilation over Italy, Faccani et al. (2005), using the Mesoscale Model 5 (MM5) at 9 km horizontal resolution and 3D-Var to assimilate GNSS-ZTD over Italy, found improvements in the precipitation forecast during the transition from winter to spring.
By assimilating a wide range of Sentinel-1 and GNSS-ZTD observations over Italy into the WRF model, Lagasio et al. (2019) found that the forecasts benefit the most when the model is provided with information on the wind field and/or the water vapor content. Mascitelli et al. (2019, 2021) reported two successful experiments of GNSS-ZTD and PWV data assimilation with the RAMS@ISAC model in Italy. The 3D-Var system was used to assimilate GNSS-ZTD, while nudging was used to assimilate the PWV. In both cases the assimilation showed a significant improvement in the short-term prediction of water vapor with smaller impact on the precipitation forecast.
This paper enriches the numerical experiments made over Italy to improve the precipitation and water vapor forecast through GNSS-ZTD data assimilation because it refers to a different period compared to previous studies (October 2019) and uses the data of 388 GNSS receivers widely spread over the country for the whole period, giving a robust assessment of the impact that GNSS-ZTD data assimilation can have on forecasting at the local scale. In addition, it considers two issues that are important in the operational context: the optimal spacing of GNSS receivers for data assimilation and bias removal. The first experiment estimates the observation-error decorrelation length scale and applies it to optimize the GNSS-ZTD data assimilation by data thinning, while the second experiment quantifies the impact of the bias removal on the forecast performance because the bias cannot be completely removed in an operational context.
It is also noted that a similar configuration of the WRF model used in this paper is already operational at the National Research Council of Italy, Institute of Atmospheric Sciences and Climate (CNR-ISAC), in the framework of the agreement between the Civil Protection Department (DPC) and CNR-ISAC to improve the NWP forecast in different time ranges. So the results of this paper are of practical importance as GNSS-ZTD data could also be assimilated in the near future in the operational run.
This paper is organized as follows: Sect. 2 shows the data and methods used, including the model setting, the GNSS-ZTD dataset and the statistics for the verification. Section 3 discusses the results, showing the impact of GNSS-ZTD data assimilation on the WRF analyses (both ZTD and PWV), on the precipitation forecast for a case study, and on the PWV and precipitation forecast for the whole period. Conclusions are given is Sect. 4. Finally, more details on the statistics used in the paper as well as the resampling test are reported in the Appendix.
2.1 WRF model configuration and assimilation method
The model used in this study is the Weather Research and Forecasting model with advanced WRF dynamics (WRF-ARW, Version 4.1.3; Skamarock et al., 2019). The model was run over one domain covering the whole Italian territory and central Europe (Fig. 1) with a spatial horizontal resolution of 3 km. The model grid has 635 × 635 grid points and 50 vertical levels, with the model top at 50 hPa. The main physical parameterizations used are the following: the Thompson scheme (Thompson et al., 2008) for microphysics; the Mellor–Yamada–Janjić (Eta) turbulent kinetic energy (TKE) scheme for the boundary layer (Janjic, 1994); and the Dudhia scheme (Dudhia, 1989) and the Rapid Radiative Transfer Model (RRTM; Mlawer et al., 1997) for shortwave and longwave radiation, respectively.
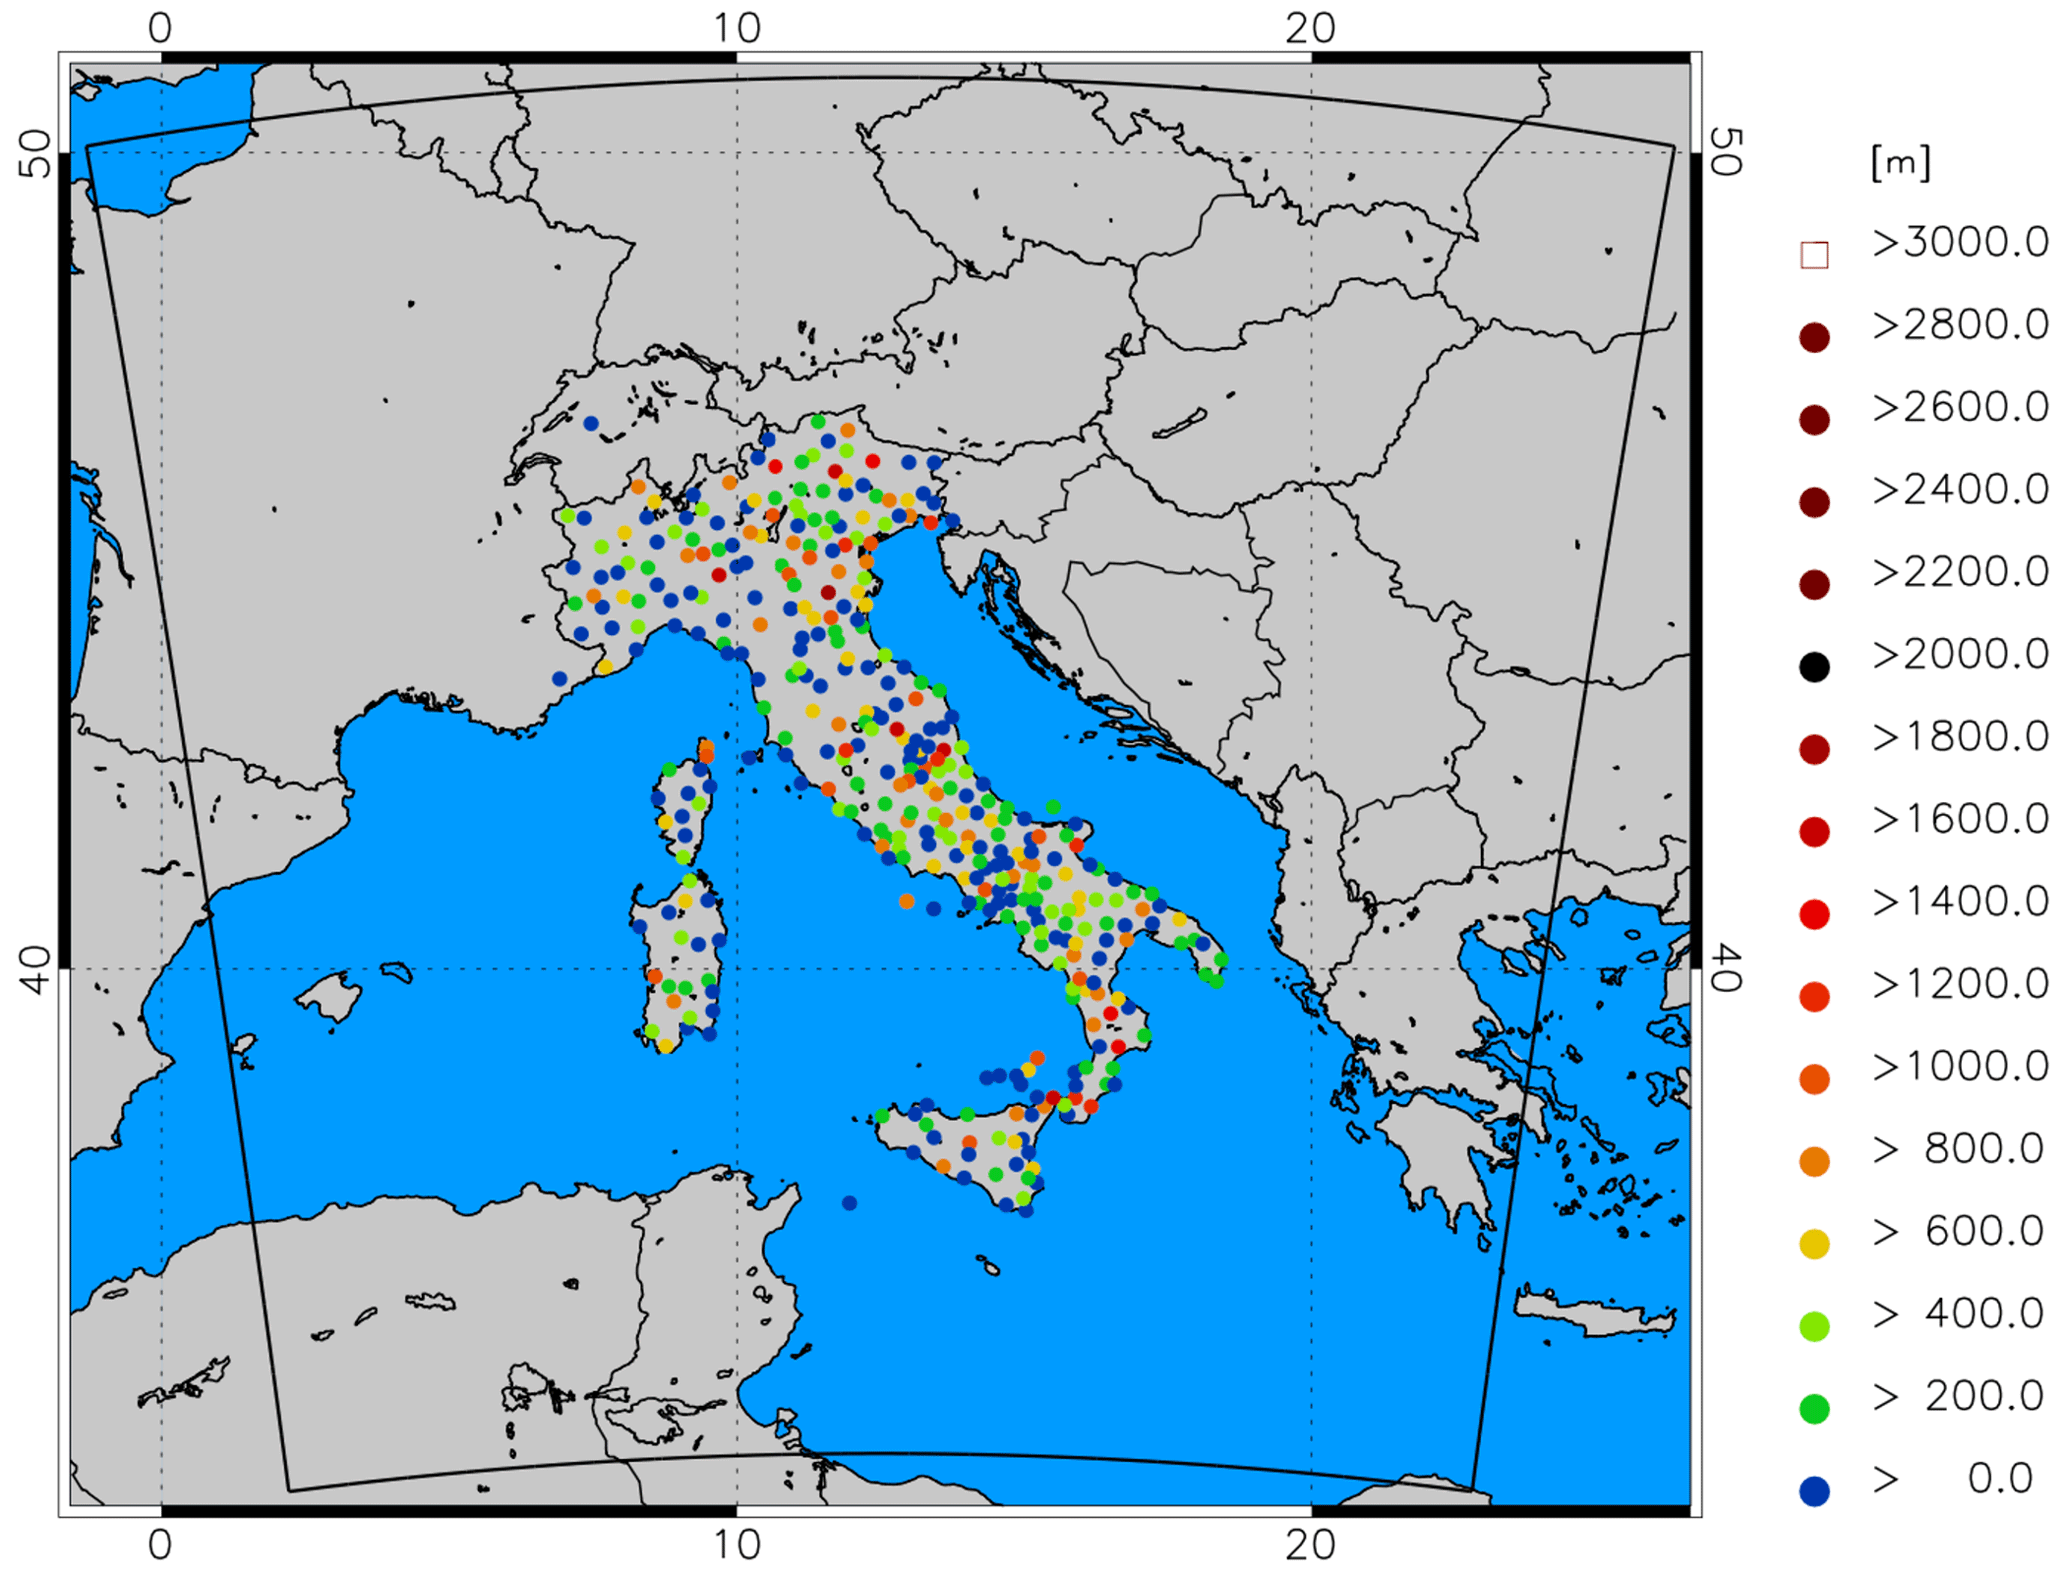
Figure 1WRF model domain and GNSS receivers' height [m] above sea level.
The experiment aims at evaluating the impact of GNSS-ZTD data assimilation on the precipitation prediction in the short term (up to 6 h in this paper). For this purpose, we considered a 1-month period, from 2 to 31 October 2019. The choice of the period is due to two main reasons: on the one hand, this month was characterized by both widespread and localized precipitation events over Italy; on the other hand, a dense network of GNSS receivers (about 500) is available for the country. It is important to note that the number of receivers actually used for data assimilation was reduced to 388 by applying data thinning as discussed in Sect. 2.2.
GNSS-ZTD data assimilation was performed using the 3D-Var tool distributed with the WRF model, which is one of the components of the WRF Data Assimilation (WRFDA) system and also includes 4D-Var and ensemble data assimilation systems (Barker et al., 2004, 2012; Huang et al., 2009).
We consider two kinds of simulations: control simulations, without GNSS-ZTD data assimilation, hereafter also CTRL, and simulations assimilating GNSS-ZTD, hereafter also GNSS. The European Centre for Medium-Range Weather Forecasts (ECMWF) Integrated Forecasting System (IFS) 3-hourly operational analysis–forecast cycle at 0.25∘ starting at 12:00 UTC on the day before the actual day to forecast is used for initial and boundary conditions to simulate a real forecasting context. The temporal scheme used for the simulations uses a very short-term forecast (VSF) approach, with a 6 h update (Fig. 2).
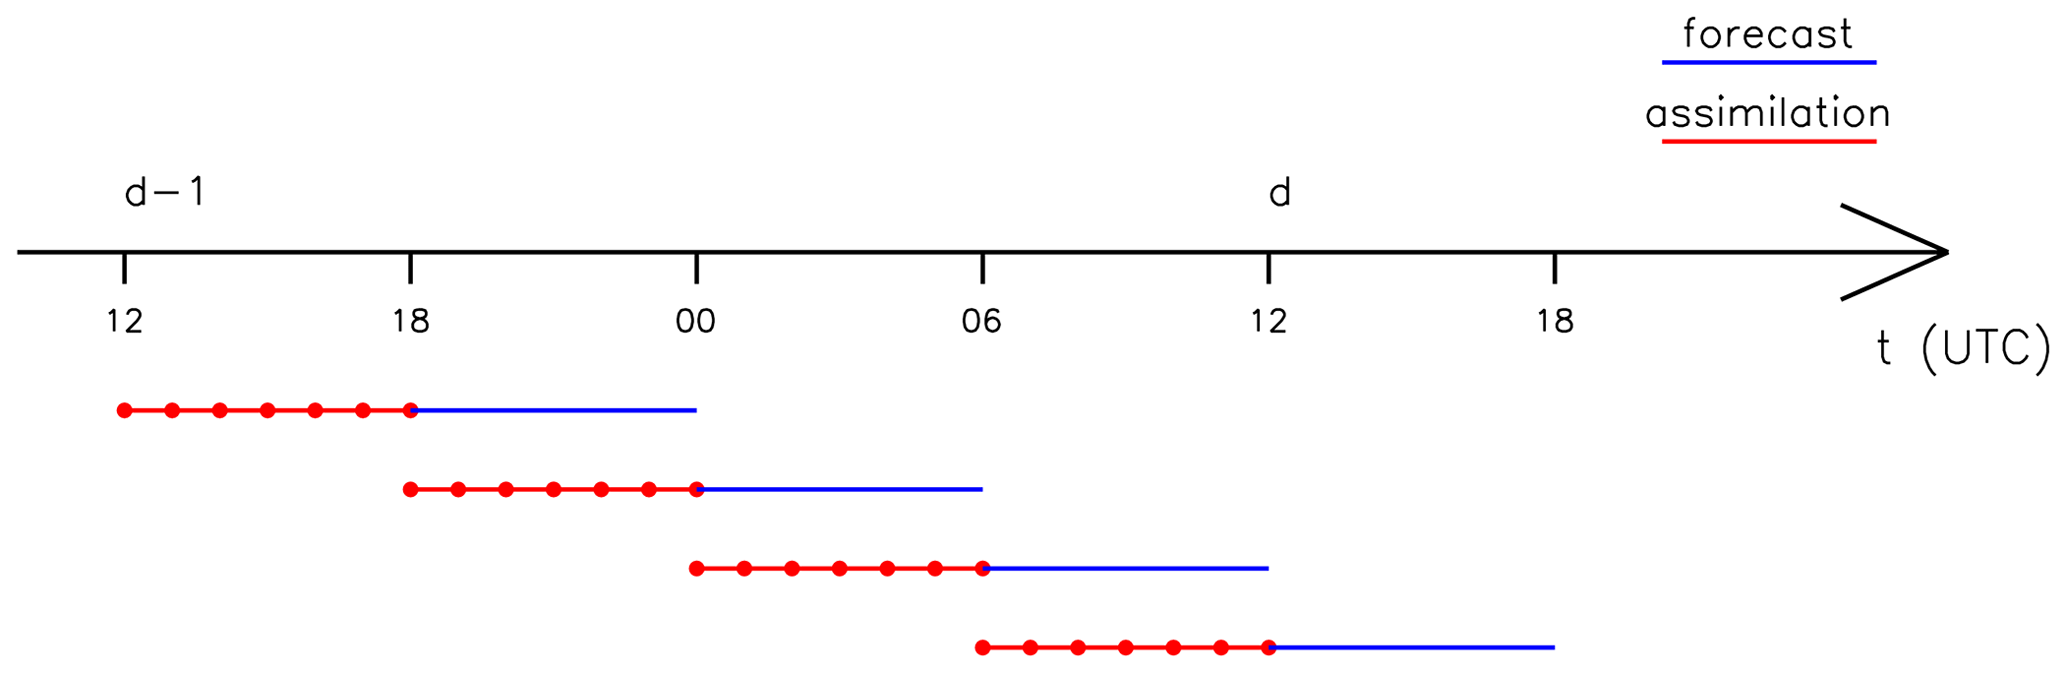
In this scheme, for each day, we run four simulations starting from a cold start. Each simulation lasts 12 h. The first 6 h of each run is used for the model spin-up and for data assimilation in GNSS simulations, while the last 6 h is used as forecast. Therefore, four runs are necessary to cover a whole day. For GNSS simulations, in the assimilation phase, we considered an analysis every 1 h (red points of Fig. 2), starting from the beginning of the simulation and reaching the sixth hour, so a total of seven analyses are performed for each run. For CTRL simulations we use only initial and boundary conditions from ECMWF IFS and no other data are assimilated.
GNSS-ZTD observations are assimilated by 3D-Var, which is a variational approach involving the calculation of the analysis that minimizes a cost function by measuring its distances from the background and observations. The cost function is given by
where x is the state vector; xb is the background field; H is the forward observational operator which transforms the x vector in the observational space; yo is the observation vector; and B and R are the error covariance matrices, respectively, for the background and observations.
The R matrix is given by the sum of instrumental and representation errors. To prepare observational data for 3D-Var, the obsproc tool was employed for GNSS-ZTD observations. Data for each analysis were considered on a 1 h time range, centered at the hour of the analysis. The R matrix is diagonal, which requires data thinning (see next section), and the ZTD error is set to 5 mm. Different regional networks are considered to reach the considerable number of GNSS-ZTD receivers used in this paper; however, we used a constant value for the errors in all receivers because the software and the processing method are the same for all the receivers. Also, the GNSS-ZTD time series were visually checked, and no specific differences among networks arose. The value of 5 mm was not specifically computed for this experiment but comes from previous comparisons that, in any case, do not extend to the whole of Italy (Tagliaferro, 2021; Krietemeyer et al., 2018; Mascitelli et al., 2019, 2021). In these works, the GNSS-ZTD retrieved with the method used in our paper was compared with other methods and with radiosoundings. In general, comparison with radiosondes shows differences in the range of 1.0–1.5 cm (i.e., larger than the error used in this paper), while comparison with other methods shows differences between 0.1 and 0.8 mm. Now, the comparison with radiosondes is less representative of the GNSS-ZTD error because radiosondes can move far from the GNSS receiver, and the 0.5 cm used in this paper comes from the comparison with other methods to estimate ZTD. However, future experiments considering different errors for different networks should be done to assess this point in more detail.
As regards the B matrix, the calculation for this study is performed via the GEN_BE tool, employing the National Meteorological Center (NMC) method (Parrish and Derber, 1992) for the month of October and the option CV5, which accounts for five control variables.
The GNSS-ZTD observations are considered to have unbiased errors compared to the WRF model. To achieve this goal, a statistical bias correction was applied to the ZTD data for the whole period. First the raw GNSS data are assimilated into 3D-Var to calculate the corrections that come from the background. The difference between the observation and the background is saved for each receiver and for each time giving the quantity , where k is the receiver index and t is the time. The quantity takes into account the difference between the model orography and receiver height that, in our case, is never larger than 300 m. For each receiver we compute the background bias by averaging over all times:
where N is the total number of times (i.e., observations) available for each GNSS receiver. Then we use the corrected observation in 3D-Var:
This method is like that applied in many papers including some cited in the Introduction.
2.2 Observational datasets and verification procedure
2.2.1 GNSS data
To achieve a good spatial density of the ZTD measurements, the GNSS data have been collected from all major Italian national and regional GNSS networks. To derive ZTDs, GPS L1 and L2 pseudorange and phase measurements were adjusted in precise point positioning (PPP) mode (Bevis et al., 1992; Zumberge et al., 1997) by using the GNSS data processing suite Breva, which is a proprietary, closed-source version of the free and open-source goGPS software (Herrera et al., 2016). Both Breva and goGPS are developed by GReD.
Several of the used stations tracked only GPS satellites; thus we decided to process only GPS observations, disregarding data from other GNSS constellations. Table 1 describes the corrections applied to the observations, as well as the stochastic model.
Table 1Corrections applied to the observations and stochastic model.
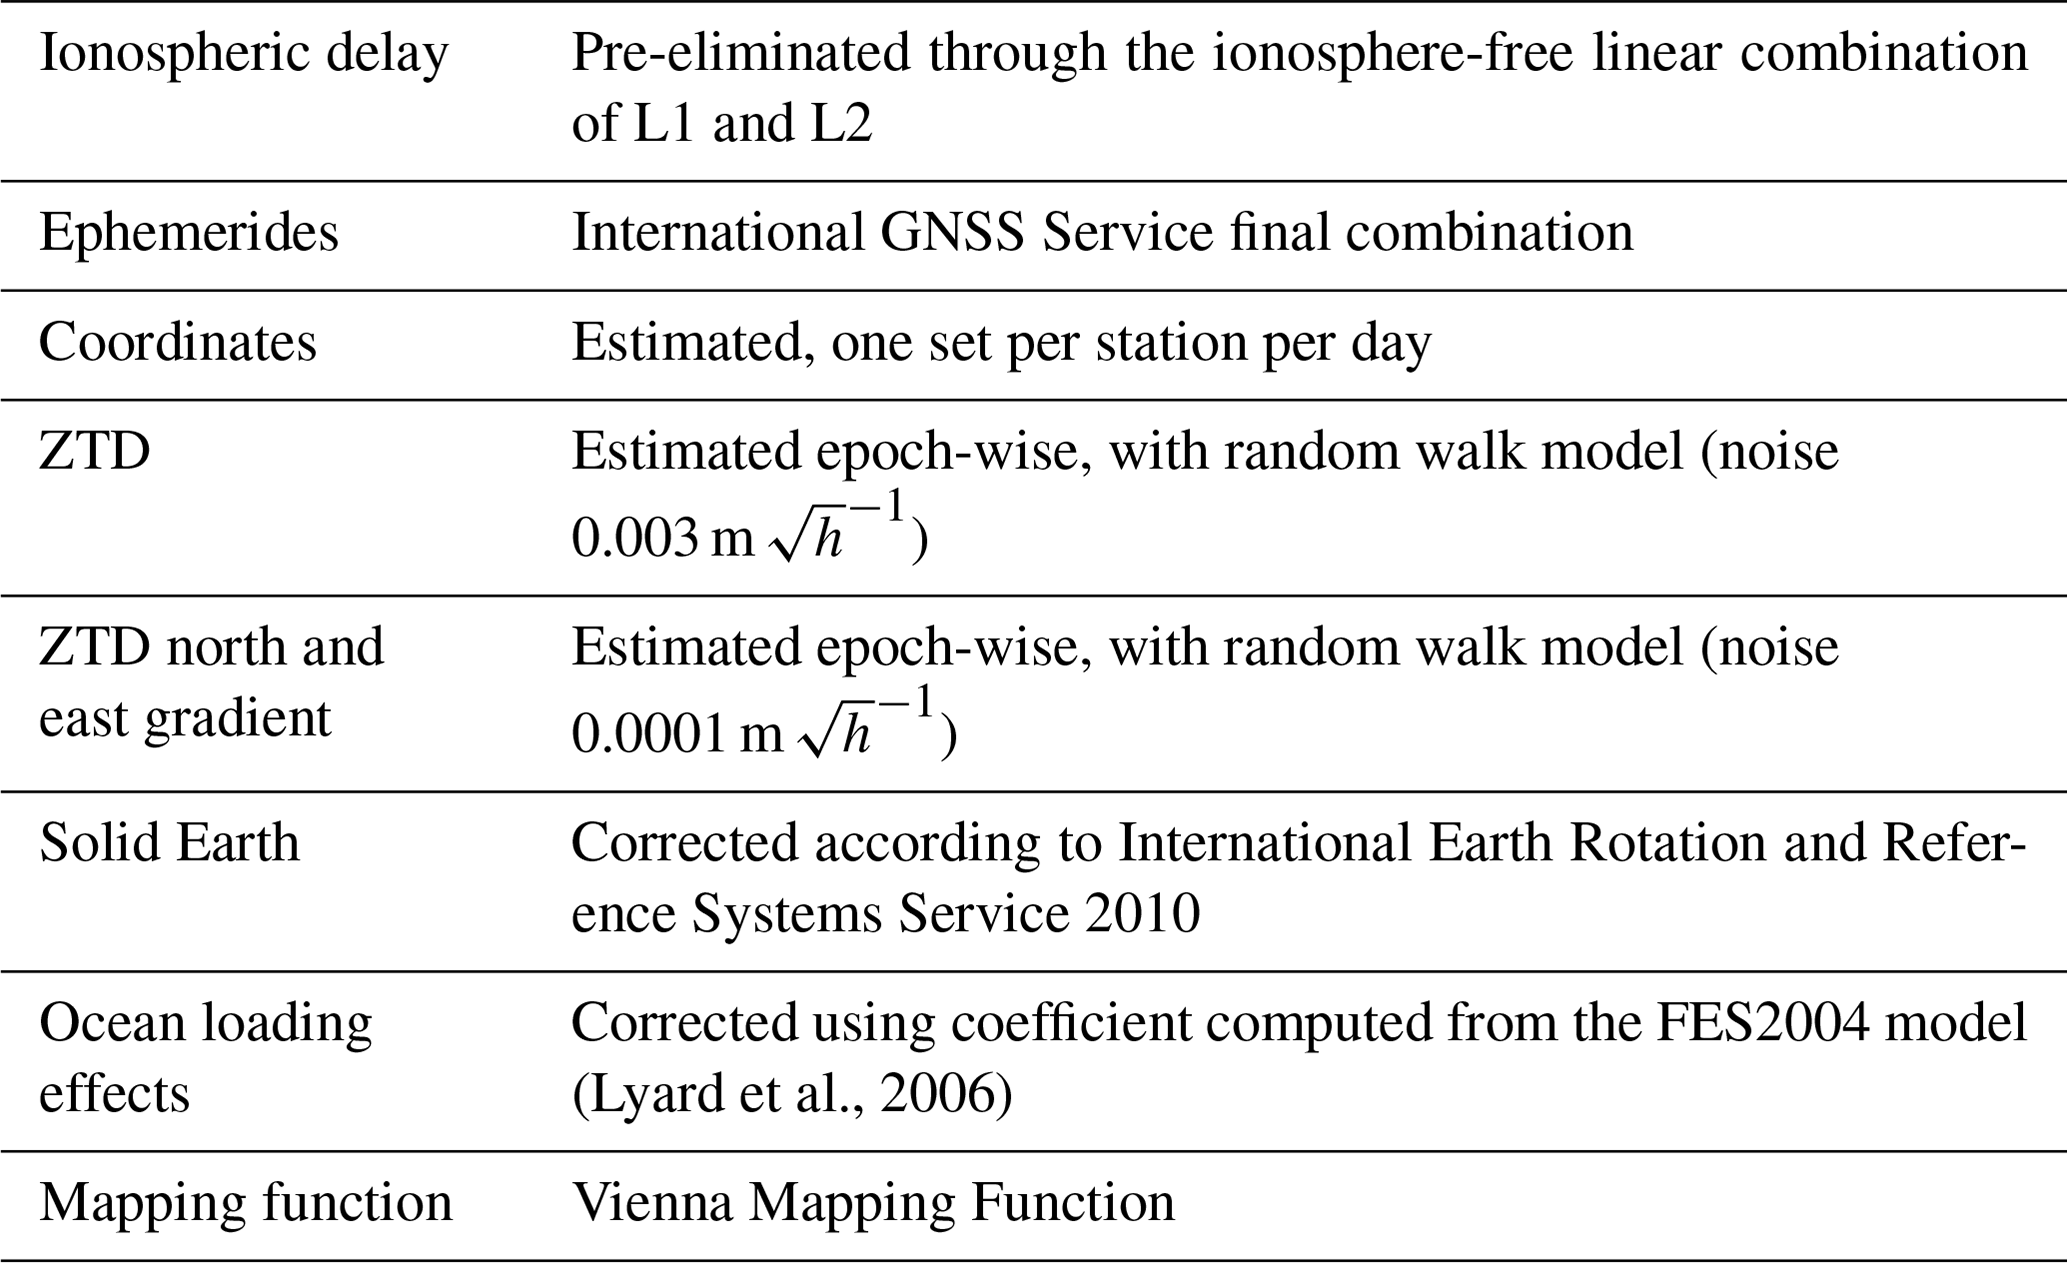
Figure 1 presents the locations and the heights of the 388 GNSS stations used over the Italian Peninsula and its surroundings after a reduction in their number. Although the initial number of GNSS receivers was about 500, more than 100 GNSS receivers were discarded considering the following two requirements: (a) the difference between the receiver and WRF model height at the closest grid point to the GNSS receiver must be less than 300 m (similarly to Bennitt and Jupp, 2012; Rohm et al., 2019; and Mascitelli et al., 2019) and (b) in the case that two or more receivers fell in the same WRF grid cell, the one whose height was closer to the model orographic height was retained. At the end of the process, 388 GNSS receivers were used for data assimilation and the closest distance between any two receivers was larger than 10 km. No further data thinning was applied.
2.2.2 Forecast verification
As regards the evaluation of the precipitation forecast performances, five precipitation scores are calculated, i.e., the frequency bias (FBIAS), probability of detection (POD), threat score (TS), equitable threat score (ETS) and false alarm rate (FAR). A detailed description of these scores is provided in Appendix A.
In the following, we will show the results of the scores, summarizing them through a performance diagram (Roebber, 2009), with the exception of the ETS. In this diagram the perfect score is the one that reaches the upper-right corner of the diagram. The x axis represents the success ratio (SR), which is defined as 1 − FAR, while the POD is on the y axis. The straight lines from the origin represent the FBIAS, while the hyperboles branches are the TS.
We considered the forecast for both types of run, CTRL and GNSS, taking into account two main periods after the last analysis time in order to evaluate the impact of GNSS-ZTD data assimilation on the precipitation forecast at different ranges: the first 3 h (from the 6th to the 9th hour of run) and the second 3 h of forecast (from the 9th to the 12th hour of run). The model forecast in correspondence to a given rain gauge is computed using the nearest-neighbor method. By this method, we consider all WRF precipitation values at grid points in a radius of from the rain gauge, with Δx being the WRF model grid spacing, and we select the grid point with the rainfall value closest to the rain gauge observation.
Precipitation data come from the Italian rain gauge network, with more than 4000 rain gauges over Italy. This network belongs to the Italian regional administrations, and data are collected nationwide by the Civil Protection Department (Davolio et al., 2015).
Furthermore, a test to assess the statistical significance of the differences between CTRL and GNSS precipitation forecasts is performed. The resampling test of Hamill (1999) is used (see Appendix B for details).
For precipitable water vapor verification, we focused on both the assimilation and forecast phases. Verification is made calculating two main scores.
The first is BIAS, which measures the mean differences between forecast (F) and observation (O):
The second is root mean square error (RMSE), which measures the mean of the squared differences between forecast and observation:
with N number of forecast–observation pairs considered in the statistics.
3.1 ZTD and precipitable water vapor results for the analysis phase
In this section we consider the differences between the first guess (FG) and the observations and between the analyses (ANL) and the observations. Statistics are presented considering all simulations (30 × 4). For each simulation, six times are considered for the first guess and analysis, one for each time (red dots of Fig. 2), except for the analysis at the initial time of each simulation because it is coincident with the last analysis time of the previous simulation, the latter being considered in the results.
Two types of statistics are shown. In the first statistics we present the time series of the bias and RMSEs aggregating all receivers together for each analysis time; in this case, referring to Eqs. (1) and (2), N is the number of GNSS receivers considered at the analysis time. In the second statistics, we show the PWV BIAS and RMSE computed for each receiver; in this case, referring to Eqs. (1) and (2), N is the number of analyses performed for the whole period (30 × 4 × 6 = 720 first guess and analysis pairs).
Figure 3 shows the time series for ZTD BIAS (Fig. 3a) and ZTD RMSE (Fig. 3b) calculated for the whole period. From Fig. 3a it is apparent that the ANL BIAS (blue curve) has lower absolute values compared to that of FG (red curve) for all times considered. The better results obtained by ANL is confirmed also by the BIAS values calculated over all times together, shown in the upper-right part of the figure, which is halved after the analysis (BIAS_A, −0.1 cm) compared to the first guess (BIAS_F, −0.2 cm). Interestingly, the WRF first-guess bias is mainly negative, showing an underestimation of the water vapor content in the atmosphere. This underestimation is reduced by GNSS-ZTD data assimilation that increases the water vapor in the model. The positive impact of the GNSS-ZTD data assimilations is confirmed by the RMSE calculation (Fig. 3b). The RMSE for the whole period for the analyses (RMSE_A) is 0.7 cm, compared to the value of 1.3 cm for the first guess (RMSE_F).
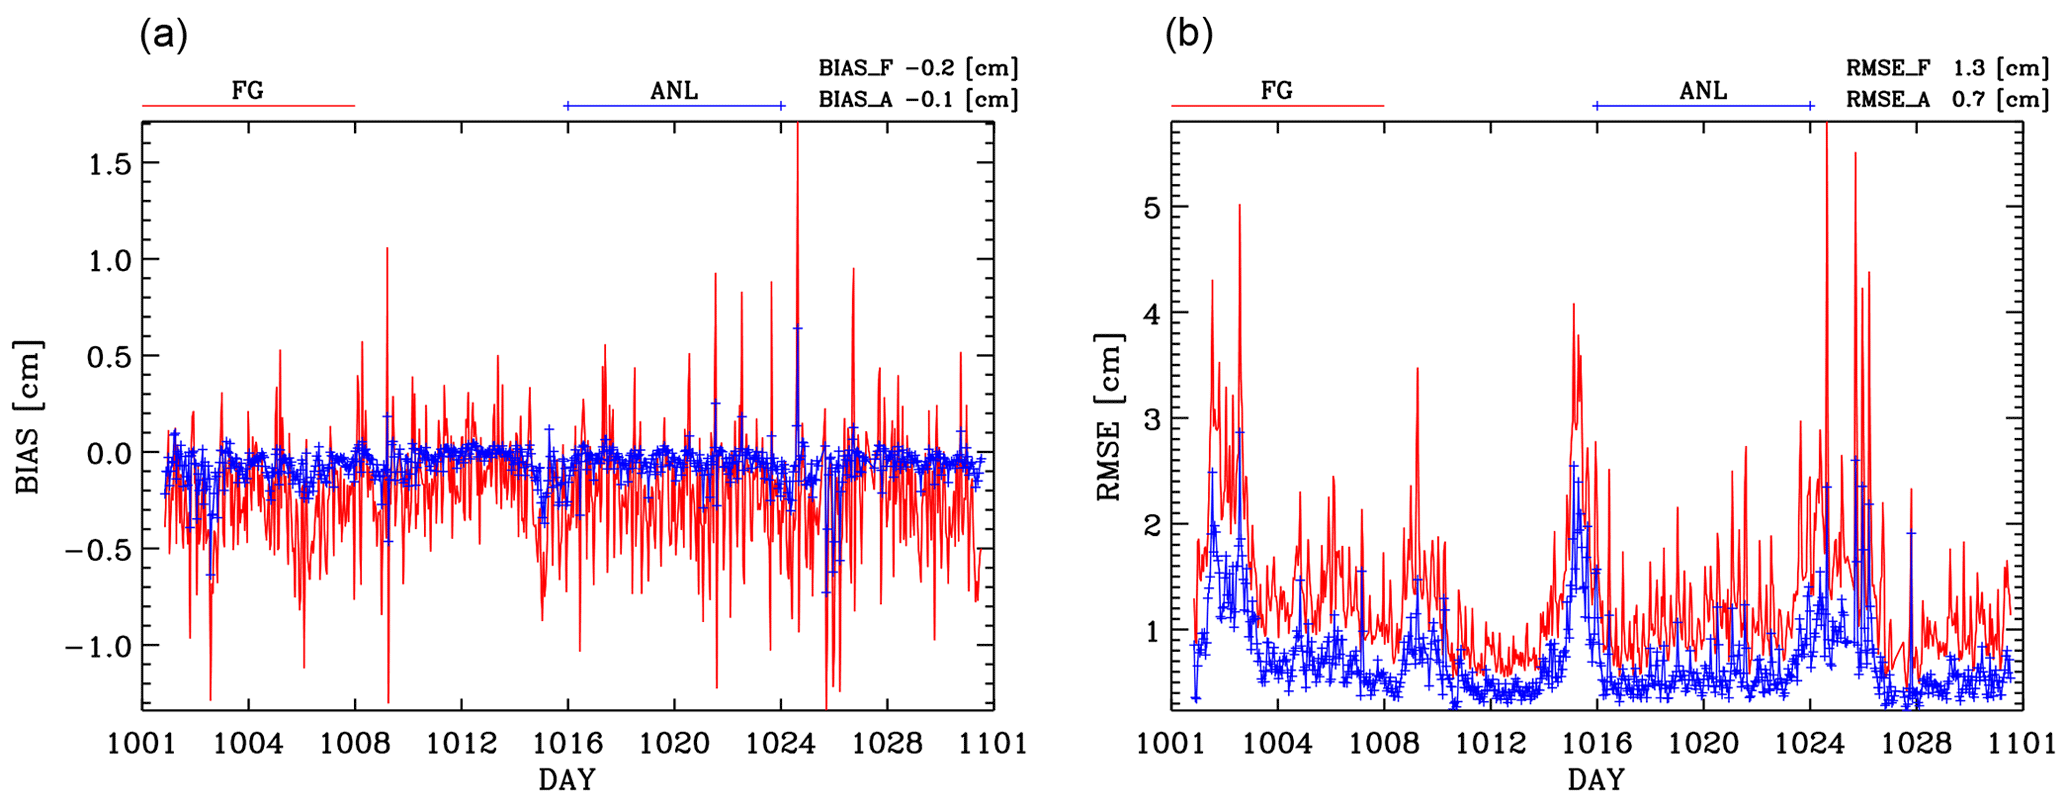
Figure 3Time series of ZTD BIAS (a) and of ZTD RMSE (b) calculated for all sensors together for first guess (red curve) and analysis (blue curve) during the analysis phase. Dates are shown along the x axis.
It is important to discuss the impact of GNSS-ZTD data assimilation over the Italian territory. This is shown considering the PWV estimated by the ZTD. The PWV in millimeters is given by
where ZHDWRF is the hydrostatic delay calculated using the Saastamoinen (1972) equation given the WRF surface pressure (psfc), latitude (φ) and height (h):
Similarly to other studies (for example, Rohm et al., 2019), we estimate the ZHD from the WRF surface pressure because no pressure observations were available in correspondence to the GNSS-ZTD receivers.
The proportionality factor Q is computed as follows:
where Rw= 461 J (kg K)−1 is the gas constant for water vapor, 22.9726 and k3= 375 463 K hPa−1 are the refractivity constants from Rueger (2002), and Tm is the mean temperature given by
where TWRF is the WRF surface temperature.
Figure 4 shows the PWV RMSE (panels a and b for first guess and analysis, respectively) and the BIAS (panels c and d for first guess and analysis, respectively) for the whole period at each GNSS receiver. Both statistics are improved by data assimilation. The impact of GNSS-ZTD data assimilation on PWV RMSE is apparent as most of the green–orange–red colors (RMSE between 1.0 and 2.5 mm, Fig. 4a) are reduced to dark-green–green colors (RMSE between 0.5 and 1.5 cm, Fig. 4b). For the BIAS the improvement is less apparent, but it is clearly shown by the increase in the orange, red and yellow dots in panel (d) compared to panel (c) of Fig. 4.
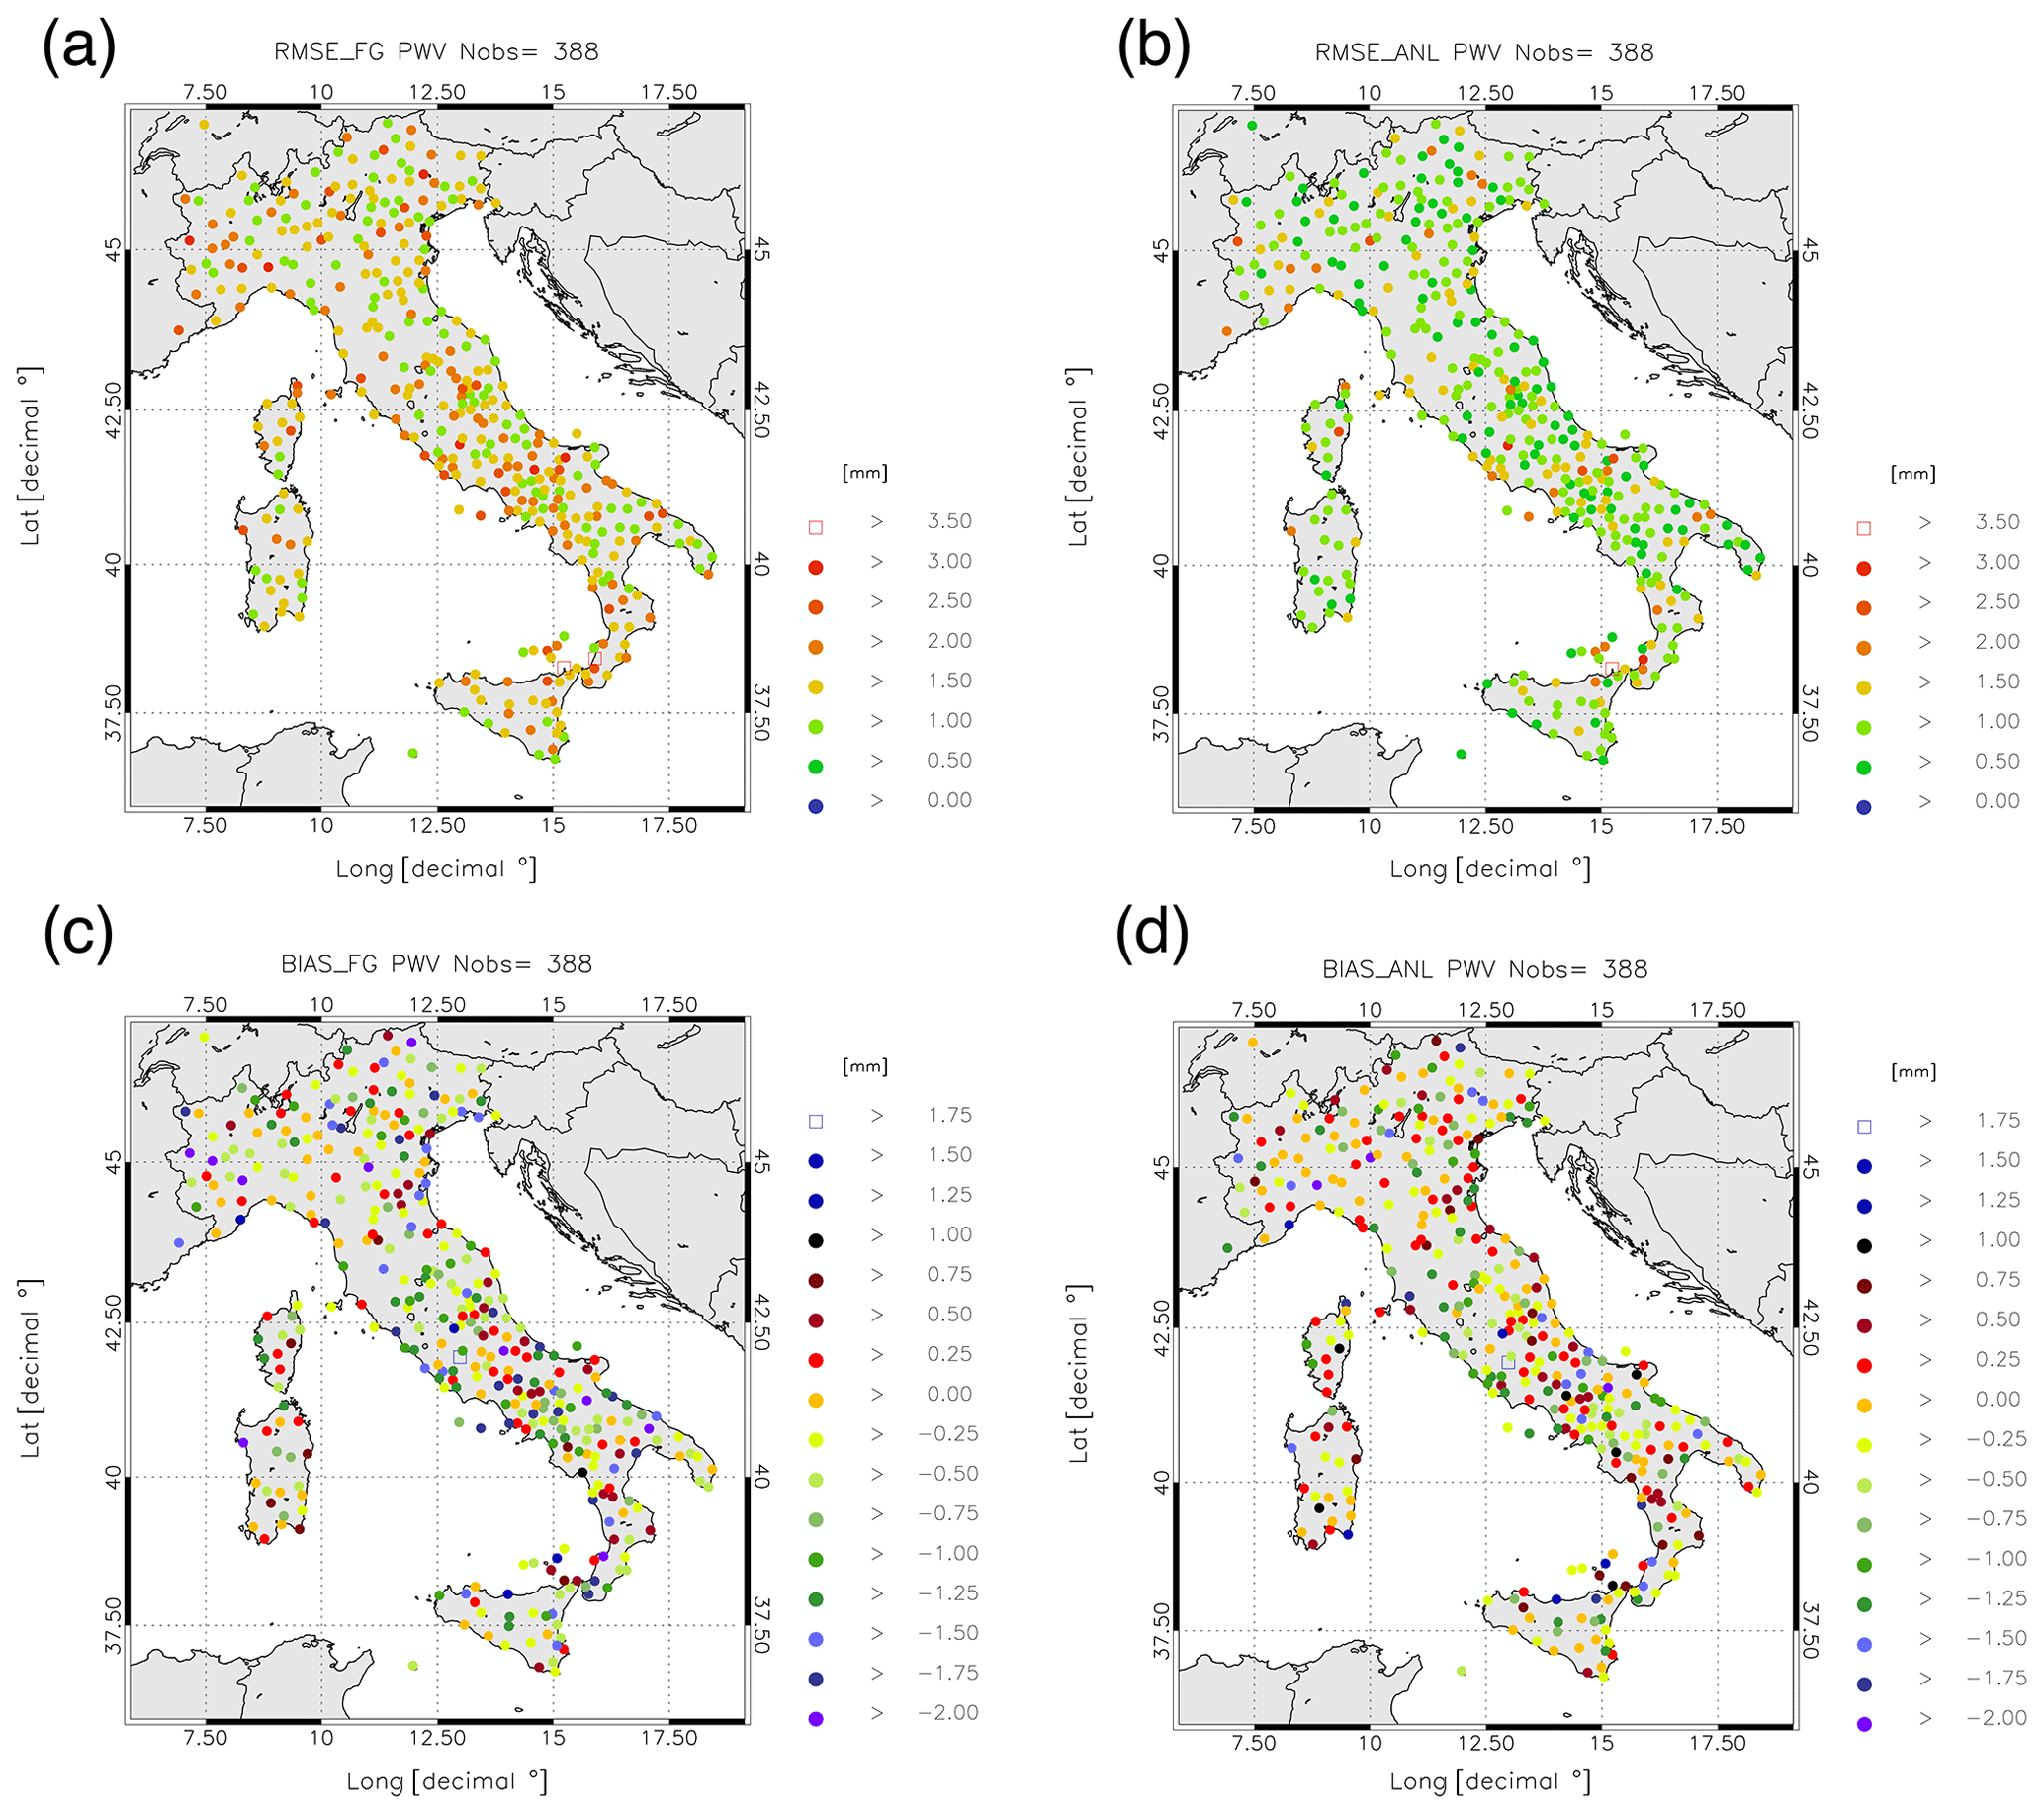
Figure 4PWV RMSE for FG (a) and ANL (b) and PWV BIAS for FG (c) and ANL (d) calculated for each sensor over all times of analysis.
All in all, the results of this section show a positive impact of GNSS-ZTD data assimilation on the ZTD and PWV over the period, and the net result is the increase in the model water vapor content over the area, because the first-guess underestimation of the ZTD (and PWV) is reduced by data assimilation.
3.2 Rainfall forecast for a case study
The selected date is the 15 October 2019, in the 3 h between 18 and 21:00 UTC. This phase was selected because it is representative of the improvement that the assimilation of GNSS-ZTD had for several cases on the 3 h precipitation forecast. During this time period, three main thunderstorms developed: the first two over the northeast and northwest of Italy, respectively, with a precipitation maximum between 60 and 70 mm (3 h)−1, and the third in southern Italy, with precipitation ranging between 40 and 50 mm (3 h)−1. We start examining the innovations, i.e., the analysis minus first-guess fields, at 18:00 UTC on 15 October (Fig. 5a), which is the last analysis before the 3 h forecast considered in this section and has an important role in the 3 h rainfall forecast. Indeed, as shown below, the precipitation between 18:00 and 21:00 UTC has several correspondences with the innovations at 18:00 UTC.
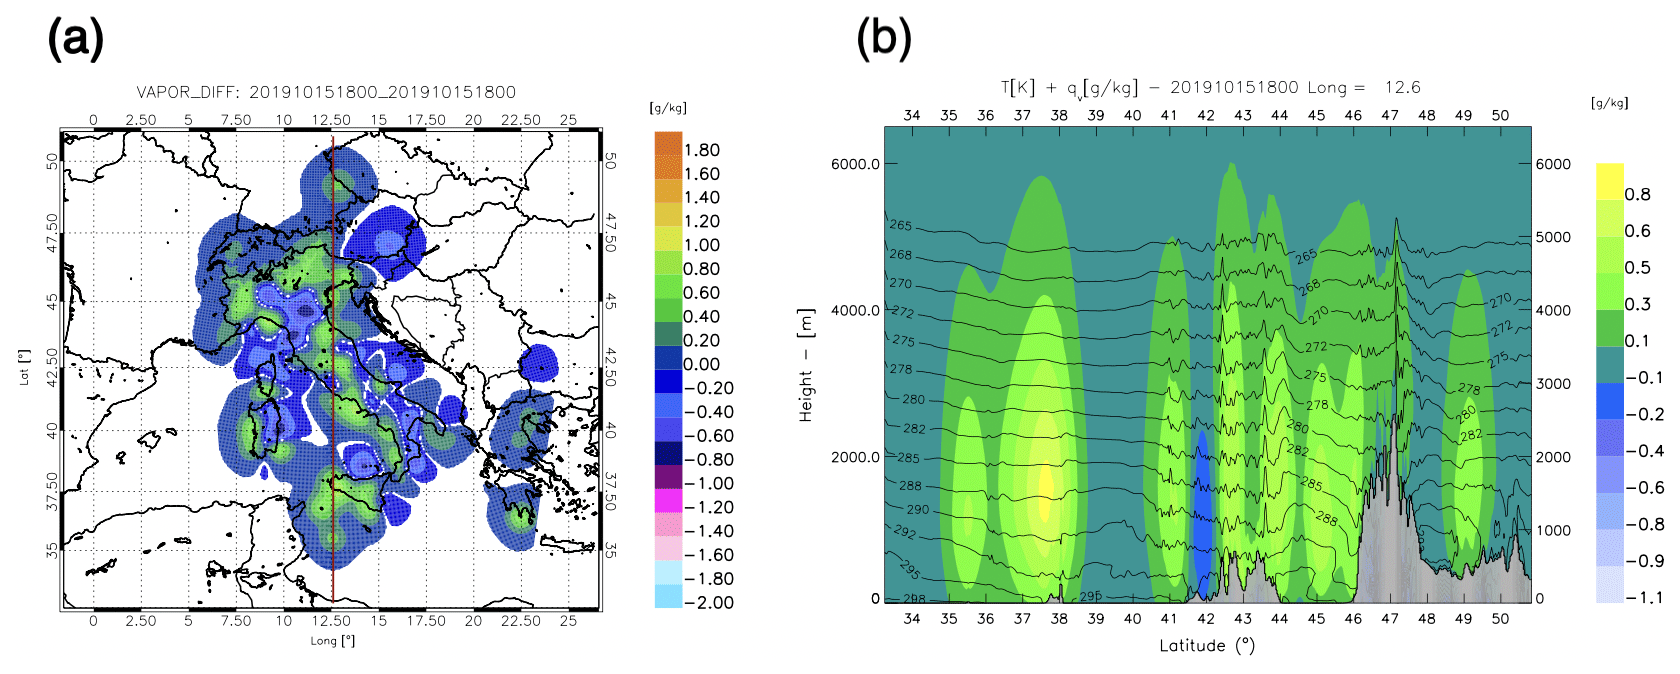
Figure 5Innovations of water vapor at 18:00 UTC on 15 October 2019; (a) horizontal map around 1800 m above the surface. Cross section of (b) is taken along the red line; (b) latitude–height cross section of water vapor innovations with the first-guess temperature (black contours).
Figure 5a shows the innovations at 18:00 UTC on 15 October 2019 at about 1800 m above the ground surface. A complex pattern of positive and negative innovations is shown thanks to the many observations available, which add information on the water vapor field at the subregional scale (the distance between two closest maxima or minima of Fig. 5a can be roughly estimated in 50–70 km).
Figure 5b shows the latitude–height cross section of the innovations at the same time of Fig. 5a. The cross section is for the longitude 12.6∘ E. Water vapor values in the range 0.4–1.0 g kg−1 are shown in several parts of the cross section at about 1600 m height a.g.l. in western Sicily (37.5∘ N) revealing a considerable impact of GNSS-ZTD data assimilation (> 10 % of the first-guess value) on the water vapor field.
Between 18:00 and 21:00 UTC, moderate to intense precipitation are shown in NE and NW of Italy by rain gauge observations, with maximum intensities larger than 60 mm (3 h)−1 (Fig. 6a). Some areas of moderate precipitation are apparent in central and southern Italy with maxima between 20 and 50 mm (3 h)−1.
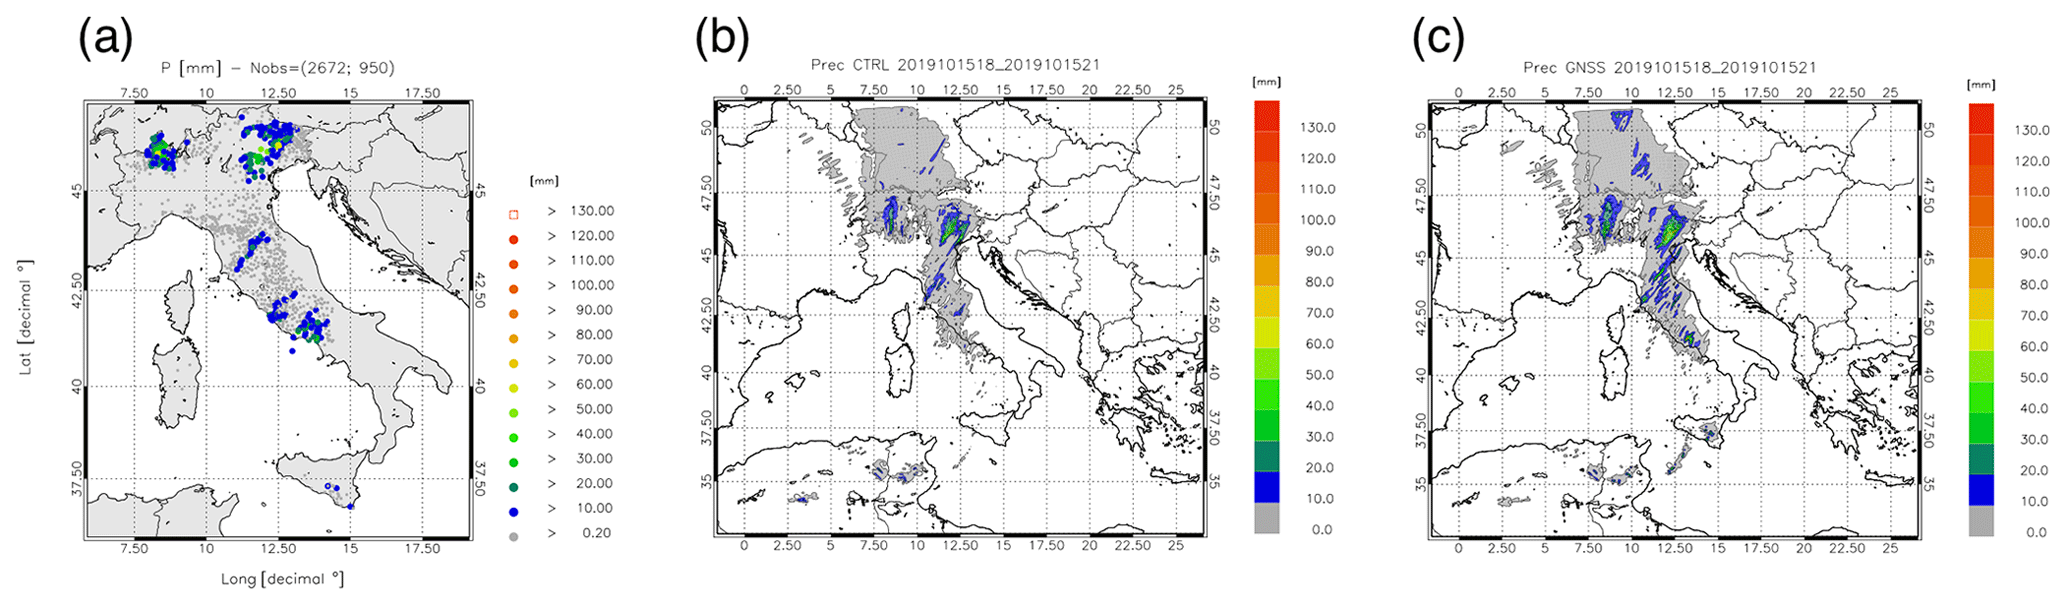
Figure 6Precipitation between 18:00 and 21:00 UTC on 15 October 2019: (a) rain gauge observations; (b) CTRL forecast; (c) GNSS forecast.
The CTRL, Fig. 6b, has a good forecast because it represents the two main precipitation areas over NW and NE of Italy. There are, however, less satisfactory points in the CTRL rainfall forecast: first, the maximum over NE of Italy is composed by two branches and one of them is displaced close to the sea, starting from Venice and going toward NE. This branch is a false alarm, at least in its southernmost part. Second, the maximum over central Italy, starting from Tuscany and displaced in the SW–NE direction is displaced to the north, compared to observations. Third, the precipitation over southern Italy is missed.
The assimilation of GNSS-ZTD improves the precipitation forecast. The pattern of the precipitation over NE is more in agreement with observations because precipitation does not appear separated in two branches as in the CTRL and the precipitation amount for GNSS simulations is higher, better catching the observation maximum. This agrees with the increase in the water vapor over NE of Italy given by the last assimilation (Fig. 5a). A similar improvement is apparent in the south of Italy, where the precipitation was missed by CTRL. In this case the observed precipitation is well forecast by GNSS and the increase in precipitation is determined by the increase in water vapor over the area (Fig. 5a). The maximum over central Italy is not much improved by the assimilation of GNSS-ZTD because, even if there is better superposition with observations compared to the control forecast, there are more false alarms in the GNSS forecast.
Section S3 of the Supplement shows the rainfall scores for CTRL and GNSS for this case study. GNSS forecast has a better performance compared to CTRL, especially for thresholds larger than 40 mm (3 h)−1.
3.3 Results for the water vapor forecast for the whole period
In this section we show the impact of GNSS-ZTD data assimilation on the PWV forecast. Three different statistics are considered: the time series of the differences between the PWV RMSE of CTRL and GNSS simulations for different forecasting times; the time series of the difference between the PWV absolute value of the BIAS of CTRL and GNSS simulations for different forecasting times; the RMSE maps of PWV for CTRL and GNSS on two different forecasting times. The PWV is computed as shown in Sect. 3.1, replacing ZTDGNSS with ZTDWRF
The first two statistics are shown in Fig. 7 for the first (red curve), third (blue curve) and sixth hour of forecast (green curve). Considering the differences between CTRL and GNSS PWV RMSE, positive values show better performance of the forecasts assimilating GNSS-ZTD, and, from Fig. 7a, it is apparent that the GNSS-ZTD data assimilation improves the PWV forecast at different forecast ranges, with the exceptions of a few cases. The RMSE of the GNSS simulations can have an RMSE lower than CTRL simulations up to 2.5 mm, and, from Fig. 7a, a decrease in the improvement of GNSS-ZTD data assimilation for longer forecasting times is also notable as the red curve shows, with some exceptions, larger values than the blue curve, which, in turn, has larger values that the green curve. However, it is important to note that the positive impact of GNSS-ZTD data assimilation on the PWV forecast is still apparent after 6 h of forecast.
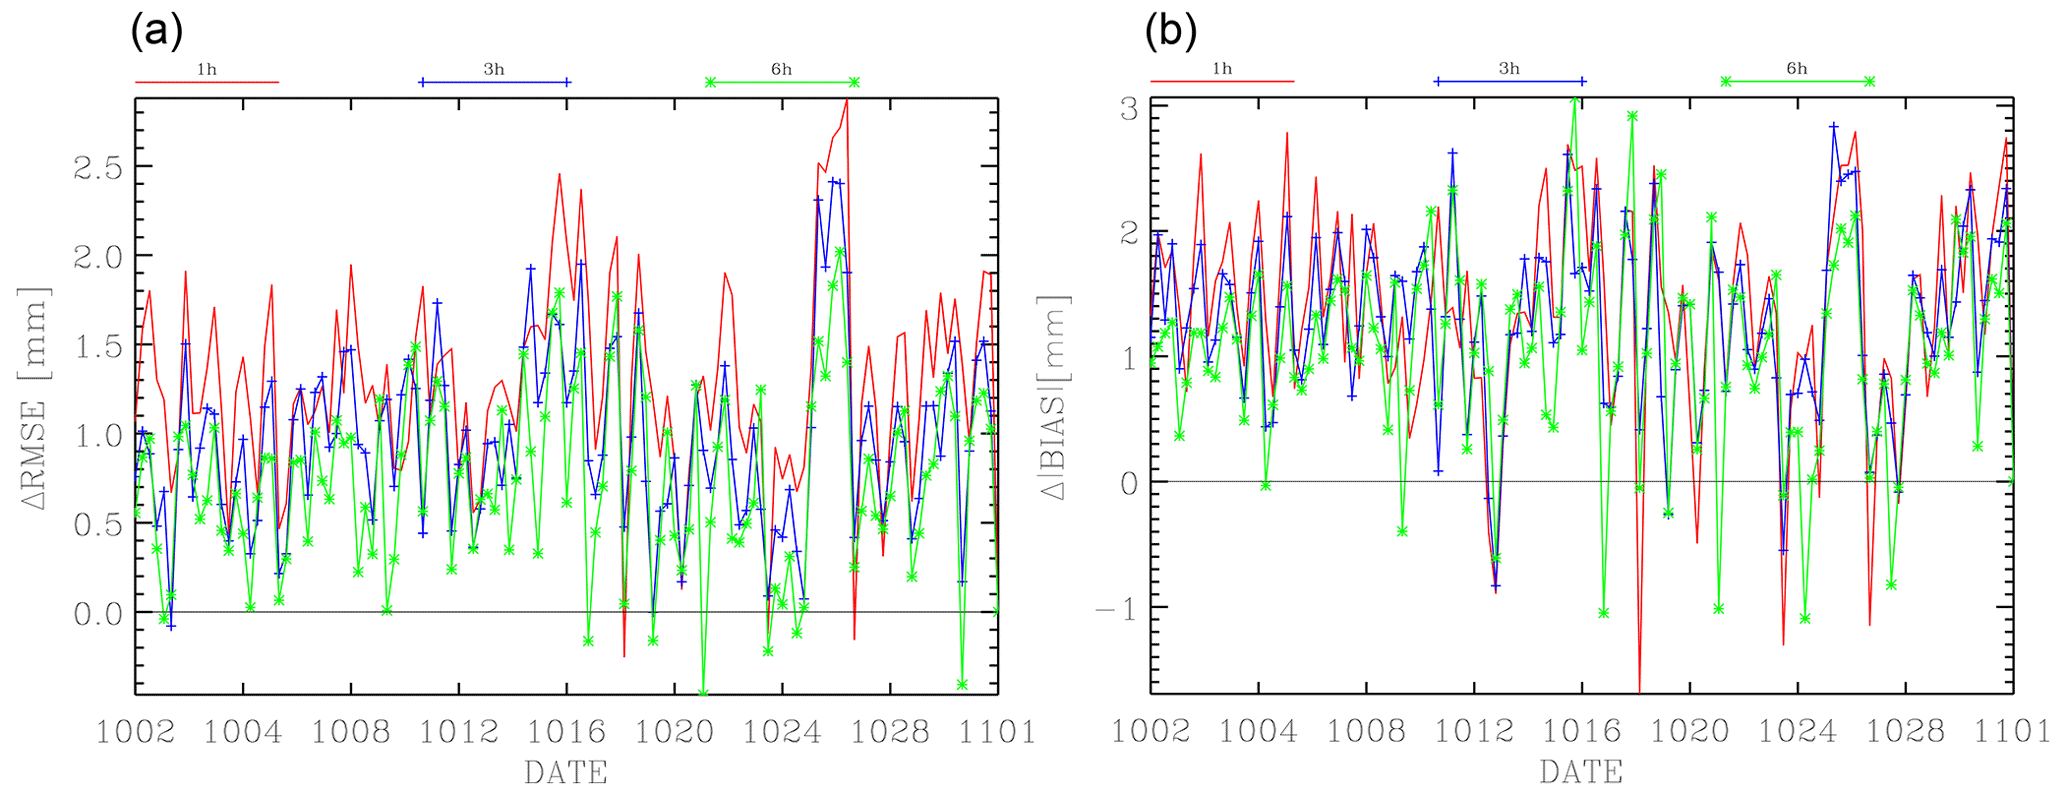
Figure 7Time series of the differences between PWV-RMSE for CTRL and GNSS (a) and of the difference in the absolute value of the BIAS for the CTRL and GNSS simulations (b). The red curve is for the first forecast hour, the blue curve is for the third forecast hour and the green curve is for the sixth forecast hour. The date format is the month followed by the day.
The bias is also improved by the GNSS-ZTD data assimilation as the difference in the absolute value of the bias for CTRL and GNSS simulations shows positive values. As for RMSE, the bias improvement decreases with forecasting time.
It is interesting to evaluate the spatial distribution of the improvement of GNSS-ZTD data assimilation on the PWV forecast over Italy. This is shown in Fig. 8 for the first hour of forecast (panels a and b for CTRL and GNSS, respectively) and for the sixth hour of forecast (panels c and d for CTRL and GNSS, respectively). Figure 8 shows that the improvement of RMSE is not limited to a specific area, thanks to the good coverage of the GNSS receivers used in this work, but it is widespread with RMSE more than halved in correspondence to most receivers.
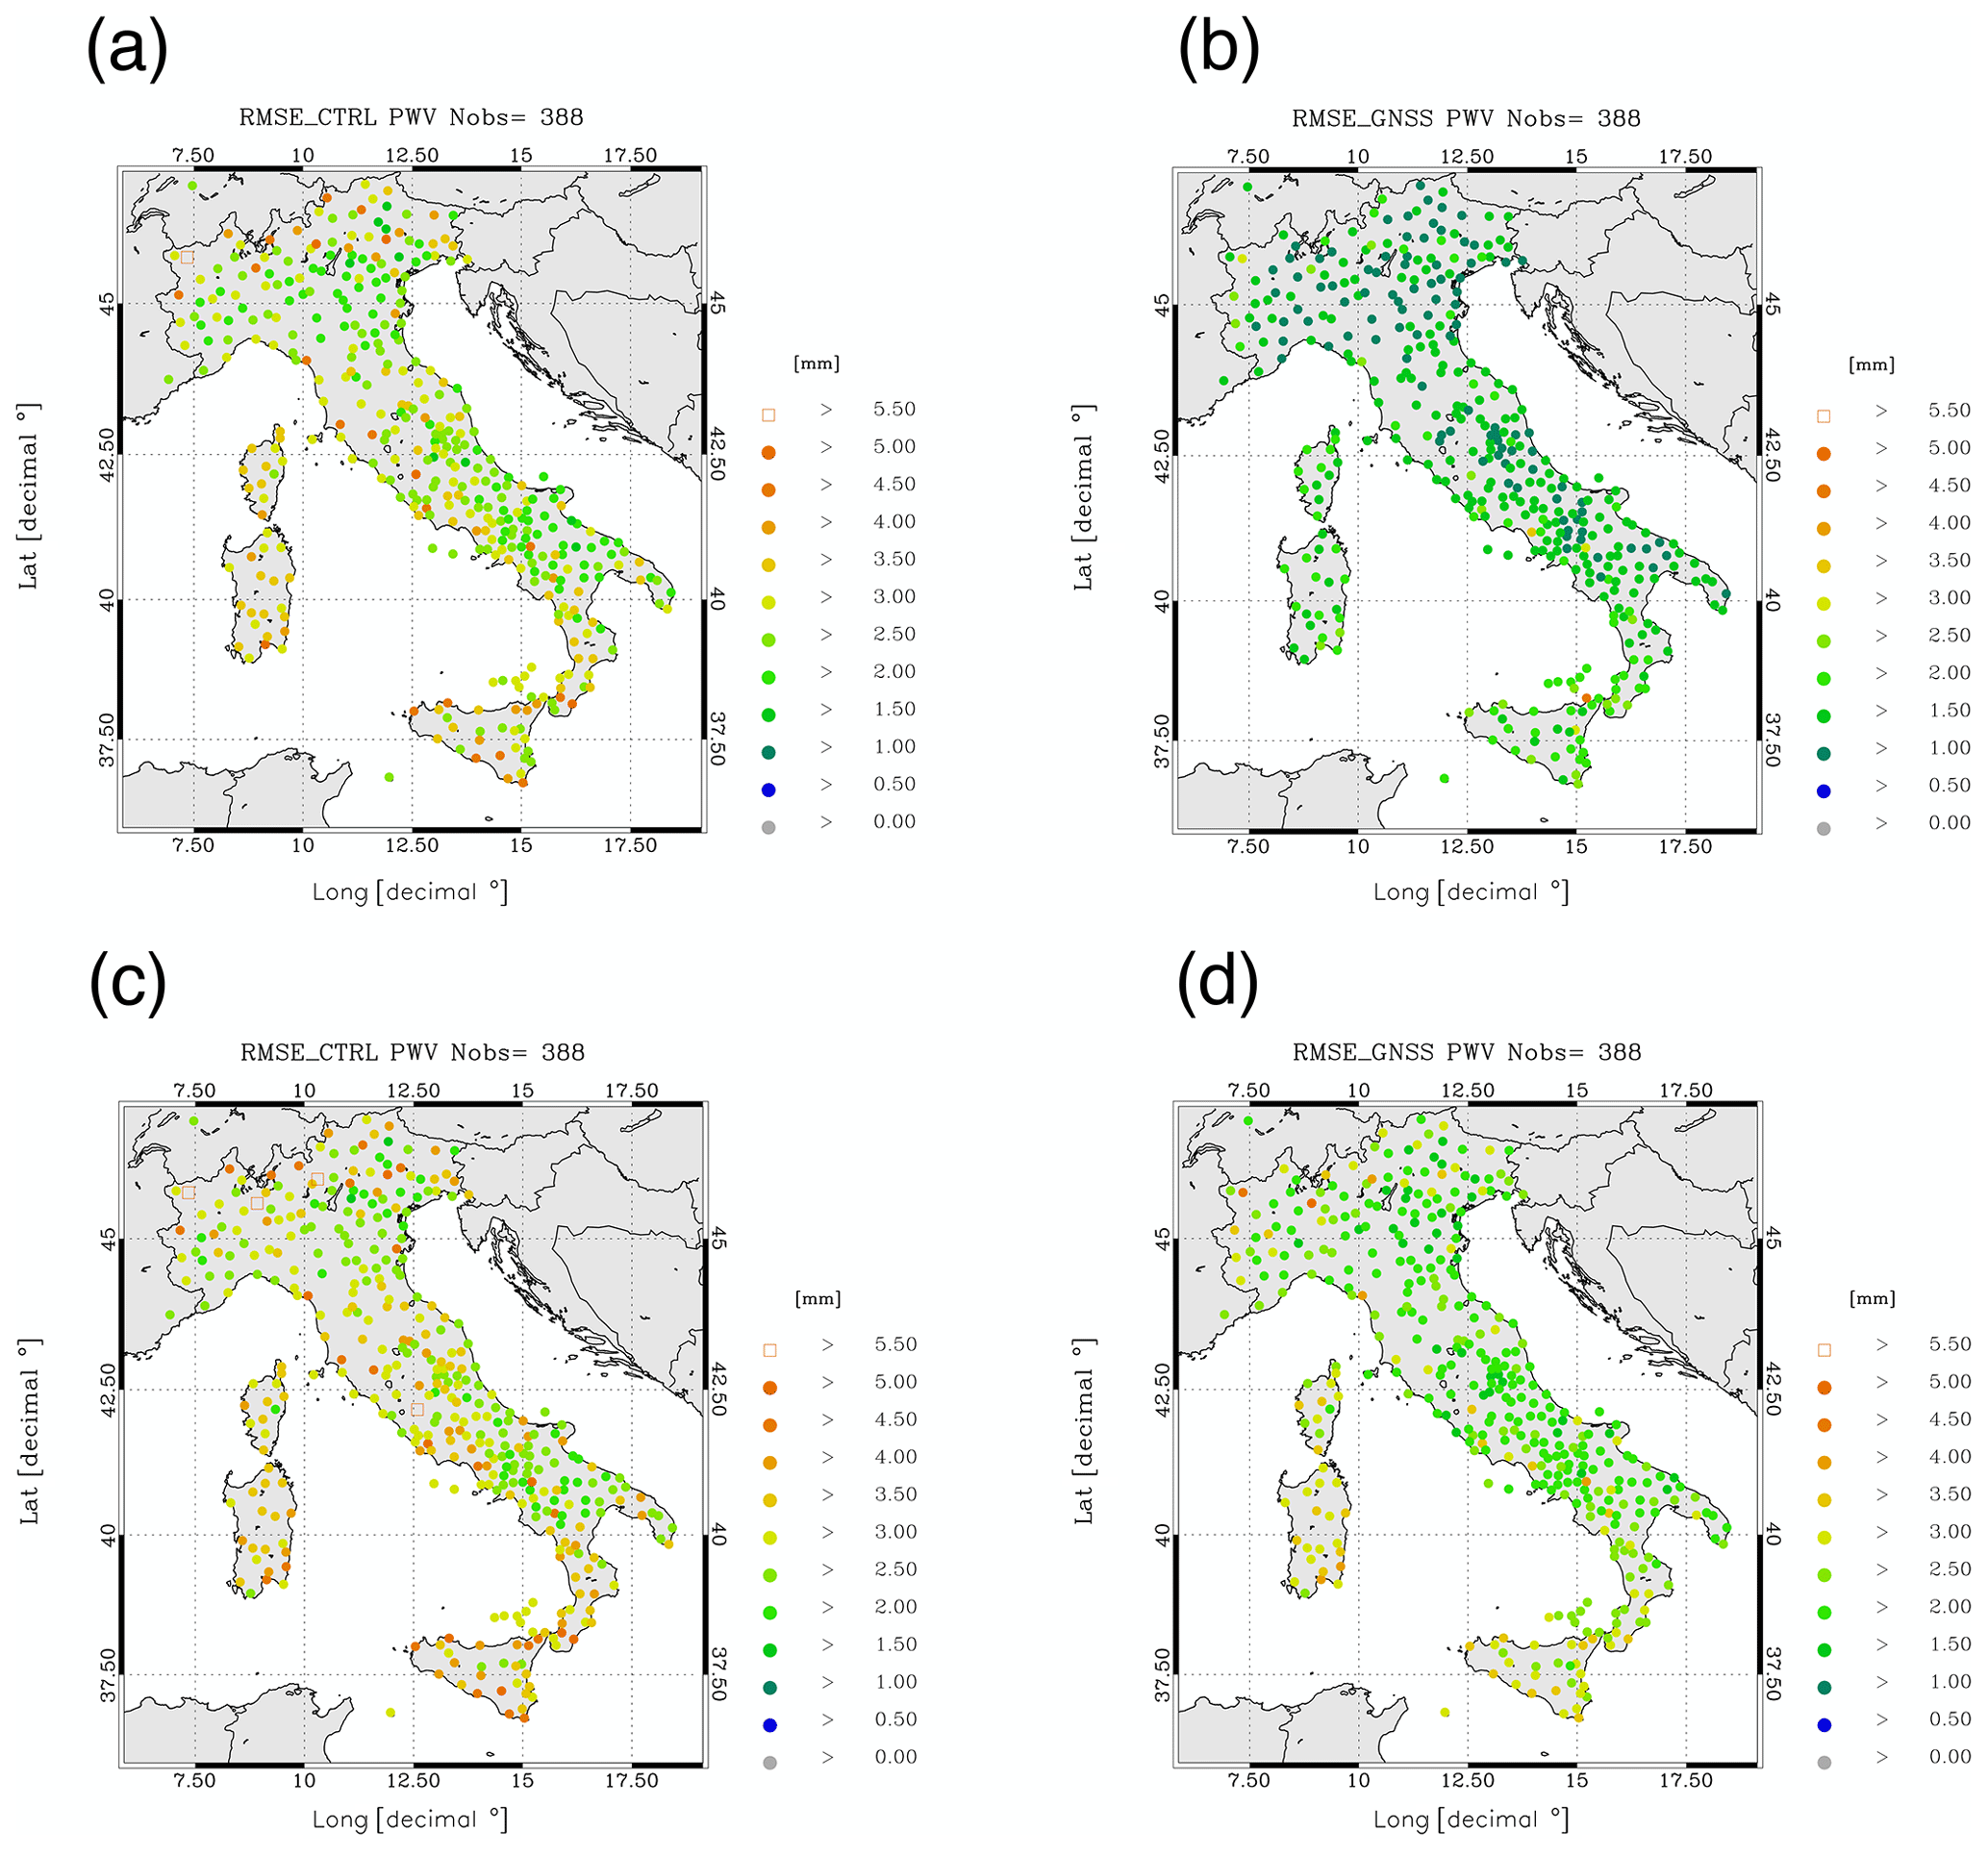
Figure 8Maps of the PWV RMSE for the first (a, b) and sixth (c, d) forecasting hour. Panels (a) and (c) are for CTRL simulations; panels (b) and (d) are for GNSS simulations.
The RMSE for the sixth forecast hour increases for both CTRL and GNSS simulations compared to the first forecast hour, as expected because the forecast error increases with forecasting time. However, the increase in the RMSE is larger for the GNSS simulations (comparison between panels b and d) than for the CTRL simulation (panels a and c), and the impact of GNSS-ZTD data assimilation decreases with the forecasting time over the whole Italian territory.
3.4 Results for the precipitation forecast over the whole period
In this section we show the impact of GNSS-ZTD data assimilation on the precipitation forecast statistics for the whole period (2–31 October 2019). Two precipitation phases are considered: the first 3 h of each simulation after the last assimilation time (also 0–3 h) and the following 3 h, i.e., from the third to the sixth hour of each simulation after the last assimilation time (hereafter 3–6 h), to evaluate for how long the GNSS-ZTD data assimilation impacts the precipitation forecast.
Performance diagrams are shown in Fig. 9 for both CTRL and GNSS and for three different precipitation thresholds, namely 1, 10 and 30 mm (3 h)−1. Starting from the analysis of the 0–3 h forecast, the following four points can be noticed: (a) the GNSS-ZTD assimilation improves the precipitation forecast for all precipitation thresholds as the GNSS symbols are always closer to the upper-right corner compared to the CTRL; (b) the FBIAS of the CTRL is underestimated for all precipitation thresholds; (c) the FBIAS, POD, FAR and TS of the GNSS are always larger than the corresponding CTRL; (d) the performance of both GNSS and CTRL decreases with the increasing precipitation thresholds. Point (a) shows that the precipitation forecast is improved by GNSS-ZTD data assimilation; points (b) and (c) show that the assimilation of GNSS-ZTD improves the CTRL underestimation of the precipitation events for all thresholds. Point (c) shows that, while the performance of GNSS is improved compared to CTRL, the added value of GNSS-ZTD data assimilation is reduced by the FAR increase. This point will be confirmed by the results of the statistical test shown later in this section. Point (d) shows the well-known difficulties of correctly predicting the correct number, location and timing of precipitation events as their intensity increases.
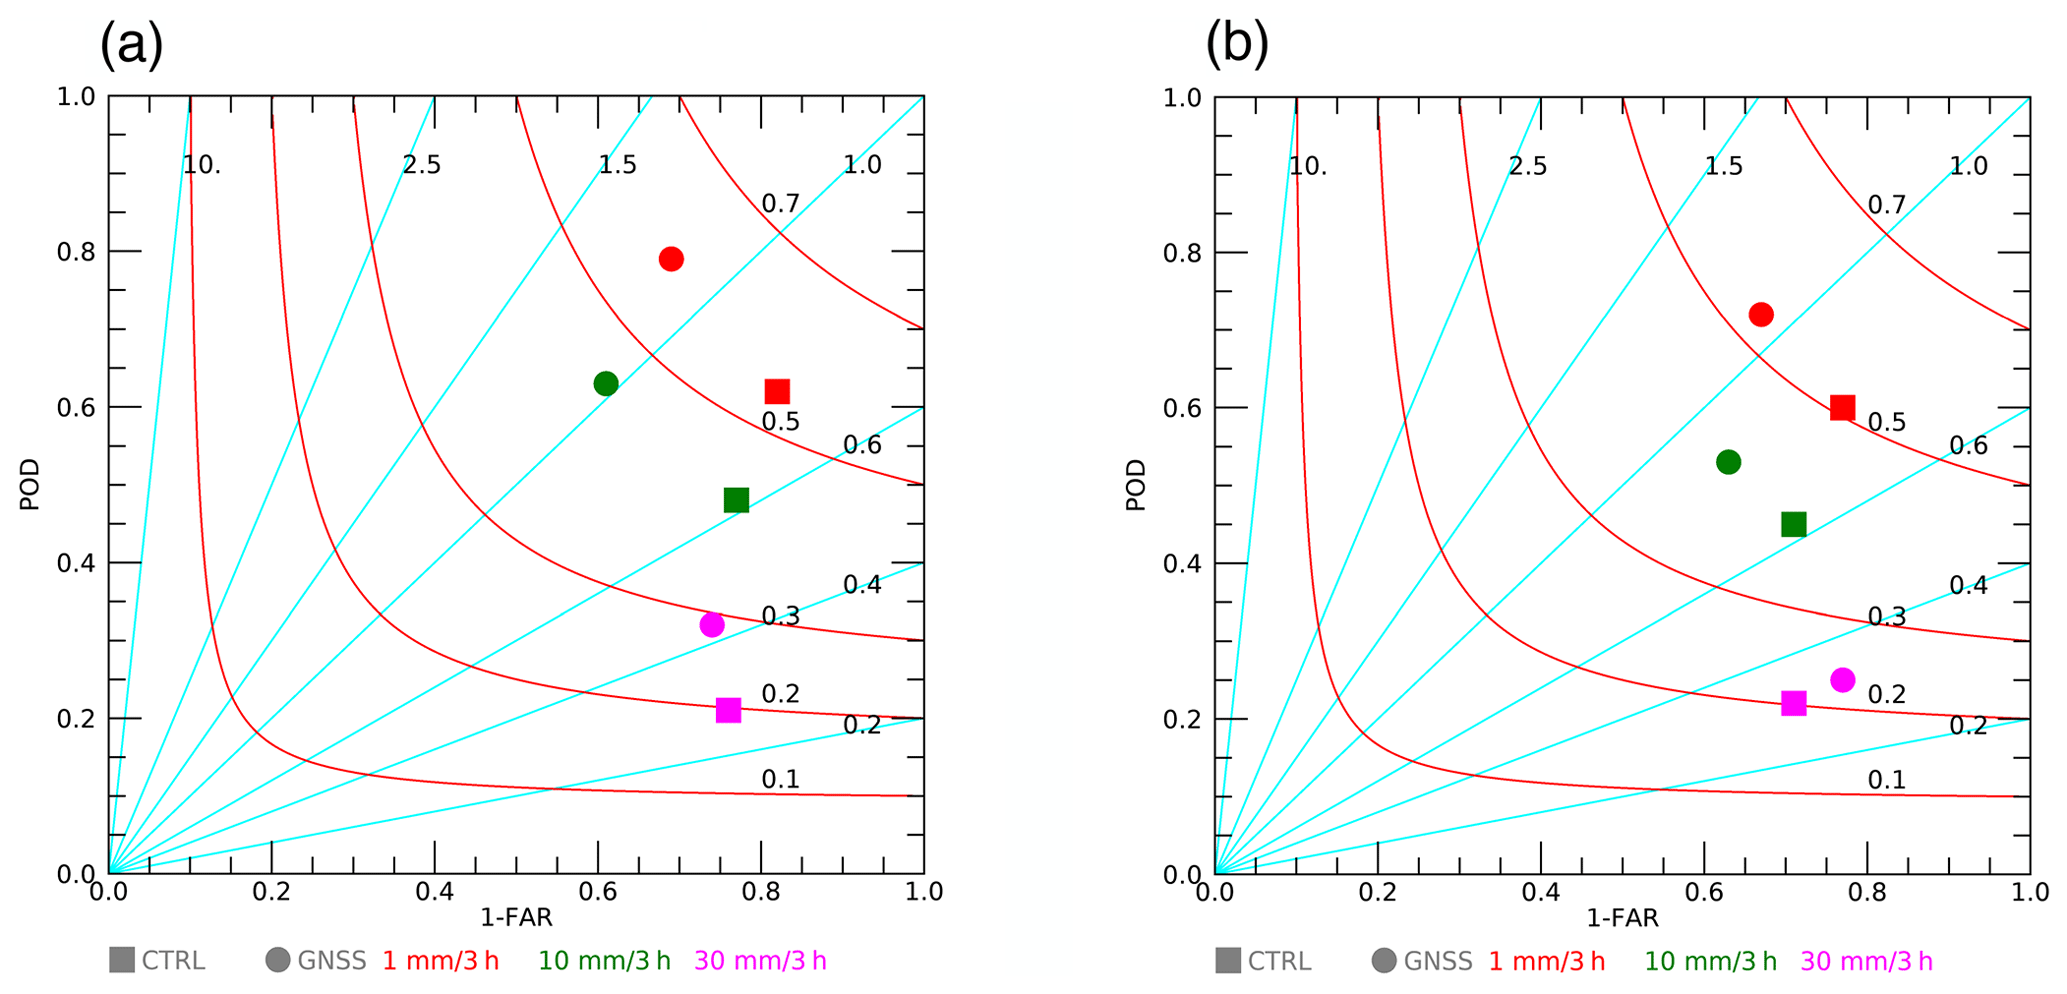
Figure 9Performance diagram showing precipitation scores over the whole period for CTRL (squares) and GNSS (circles) for the 0–3 h period (a) and for the 3–6 h period (b) after the assimilation phase for three different precipitation thresholds: 1 mm (3 h)−1 (in red), 10 mm (3 h)−1 (in green) and 30 mm (3 h)−1 (in magenta).
Results for the 3–6 h phase are like those of the 0–3 h period, highlighted in the four points above, with the exception that the FAR for the 30 mm (3 h)−1 threshold is reduced by GNSS-ZTD data assimilation. In addition, the comparison of Fig. 9a and b shows that the improvement of the model performance decreases with increasing forecasting time because the GNSS and CTRL symbols are closer for the 3–6 h phase compared to the 0–3 h forecast. This is in agreement with the analysis of the PWV presented in the previous section.
All in all, there are two important points to remark upon for the 0–3 and 3–6 h performance diagrams: (a) the performance of CTRL is improved by GNSS-ZTD data assimilation; (b) the impact of assimilating GNSS-ZTD on the precipitation forecast lasts at least 6 h.
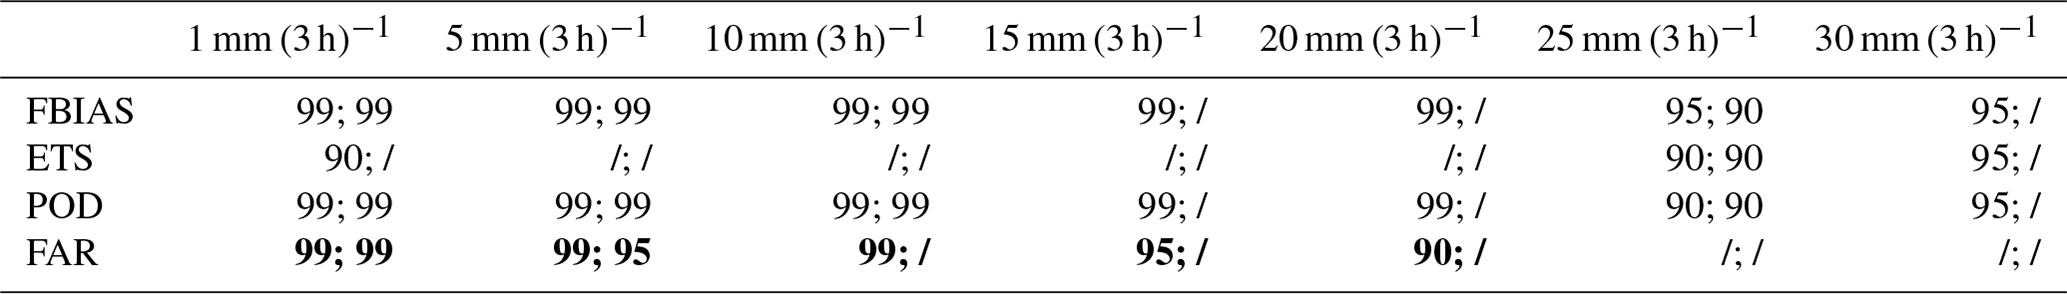
To better examine the difference in the statistical scores of the CTRL and GNSS forecasts shown in Fig. 9, the results of a bootstrap statistical test (see Appendix B for details) are shown in Table 2 for the 0–3 and 3–6 h forecast phases. The level of statistical significance is shown in plain text (90 %, 95 %, 99 %) if the GNSS simulations perform better than CTRL and in bold for the opposite case. The statistical test was computed for 1 and 5 mm (3 h)−1 and then every 5 mm (3 h)−1 up to 50 mm (3 h)−1 thresholds. Results are shown up to 30 mm (3 h)−1 thresholds because differences were not statistically significant for larger precipitation events. From Table 2, it is apparent that the assimilation of GNSS-ZTD has a good and significant impact on the precipitation forecast because the FBIAS and POD are improved for several thresholds. The FAR is worsened by the data assimilation because of the larger number of false alarms predicted by GNSS compared to CTRL. This limits the improvement of the ETS, which accounts for both hits and false alarms; however, the ETS has statistically significant improvements at 25 and 30 mm (3 h)−1, showing a significant and positive impact of GNSS-ZTD data assimilation for moderate–intense precipitation forecast. Finally the improvement of the FBIAS, POD and ETS scores for both the 0–3 and the 3–6 h phases is noted, showing that the impact of GNSS-ZTD data assimilation lasts at least 6 h into the forecast.
Table 2Results of the resampling statistical test. Statistical significance of 90 %, 95 % and 99 % is shown in plain-text when GNSS-ZTD data assimilation improves the statistics, while it is shown in bold when the GNSS-ZTD data assimilation has a negative impact on the statistics. Significant values less than 90 % are not shown. The first number in each cell refers to the first 3 h of forecast (0–3 h), while the second number refers to the second 3 h of forecasts (3–6 h). Significant values less than 90 % are represented by the forward slash symbol.
4.1 Data-thinning experiment
As discussed in Sect. 2, the ZTD observation-error covariances are assumed to be uncorrelated in space and the R matrix is diagonal. However, the ZTD observation errors are correlated to some degree and the assimilation of GNSS-ZTD data from receivers that are too close is sub-optimal. To consider in more detail this issue, we performed a sensitivity test for 16 d of October 2019 and data thinning. The days selected are those from 14 to 23 October that, as better discussed in the Supplement of this paper, were characterized by heavy and widespread rainfall, especially in the NW of Italy, and those from 5 to 10 October, which were also characterized by moderate to intense rainfall. In this experiment (THIN), we first derive a distance where the observation errors become uncorrelated (d) and then GNSS-ZTD observations are assimilated only if their distance is larger than the d value. To estimate this distance, we use the method of Desroziers et al. (2005; see also Bennit et al., 2017).
In this method, observation minus background (innovation) and analysis minus observations (residual) statistics are used. To compute the observation-error decorrelation distance, GNSS receivers are binned every 12.5 km and the covariance is computed as a function of the distance:
where mi is the number of GNSS receivers that fall into a specific bin at a certain distance from the ith receiver, n is the number of GNSS receivers and Hi is the observation operator. By Eq. (3) the errors covariance is computed as a function of the distance. Another parameter needed to assess the observation-error correlation distance d is the observation standard error variance, which is the covariance for the zero distance. It is computed as
Figure 10a shows the behavior of the error covariance as a function of the distance (6.25 km, which is the central distance of the first bin; 18.75 km, which is the distance of the second bin; etc.). The values of covariances have been normalized by the variance s2 (Eq. 4). In statistics, correlation values below 0.2 are usually assumed to be negligible, and, from Fig. 10a, the 20 km distance can be reasonably assumed to be the distance for observation-error decorrelation. The assimilation of two receivers whose distance is less than 20 km is considered sub-optimal and is avoided in the THIN experiment.
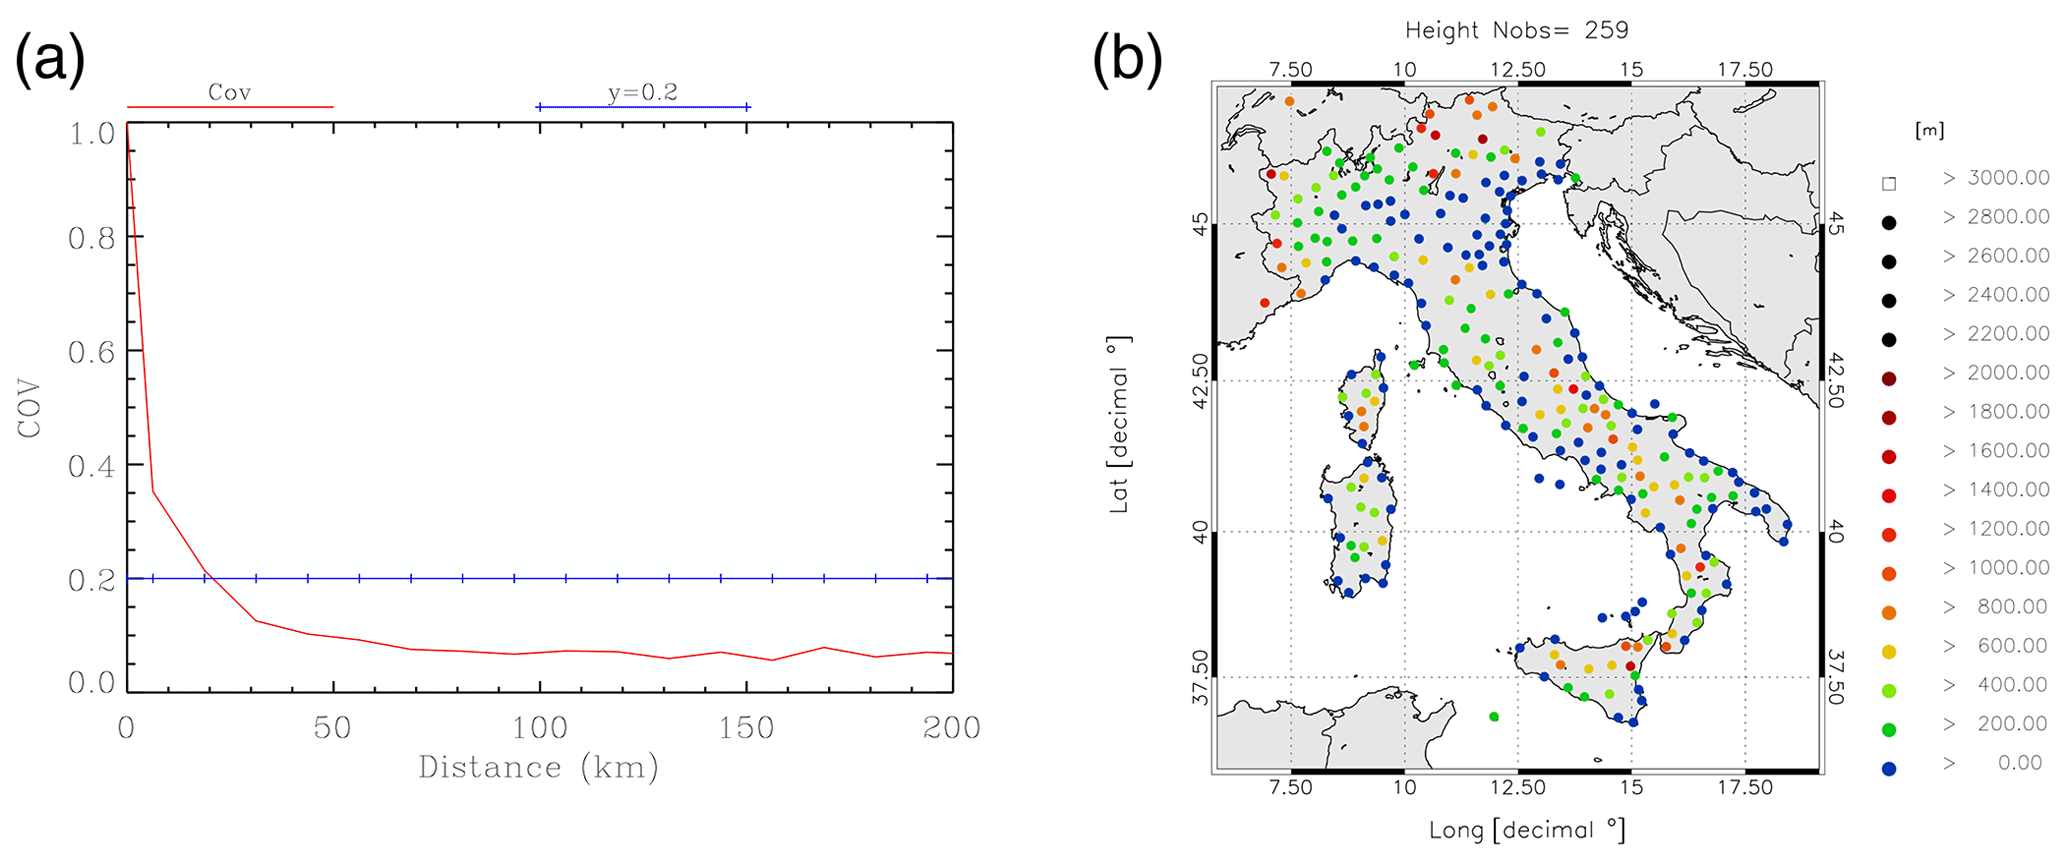
Figure 10(a) Error covariance as a function of the distance (red curve). Covariances are normalized with the variance s2. The y= 0.2 curve is plotted for reference. (b) GPS receivers used for the forecast verification; (c) GPS receivers used for data assimilation.
To obtain GNSS receivers with about 20 km spacing, we divided the domain (35–50∘ N and 5–20∘ E) with a regular latitude–longitude lattice with 0.25∘ spacing and we selected one GNSS receiver for each grid box. If more receivers are present in the grid box, the one with the lowest topographical difference from the WRF model is selected. The number of GNSS receivers used in the data-thinning experiment is 259 (Fig. 10b).
Figure 11 shows the FBIAS, ETS, POD and FAR for the CTRL, GNSS, and THIN and BIAS experiments (the last is considered in the following section) for the 0–3 h forecast phase. Here we limit the discussion to this phase as the differences between THIN and BIAS are lower for the 3–6 h phase. Considering the four scores, it is apparent that the difference between THIN and GNSS is small, especially for precipitation thresholds larger than 40 mm (3 h)−1. For lower rainfall thresholds, the THIN experiment is slightly worse. All in all, these results do not show an improvement for the data-thinning experiment. This could be related to several factors, and three of them seem more relevant: (a) the limited period considered, (b) the importance of the local scale in water vapor distribution and (c) the fact that the Desroziers method is an estimate of the optimal distance between two receivers to be assimilated. So, considering the results of the data-thinning experiment, further research must be done to obtain a definitive answer.
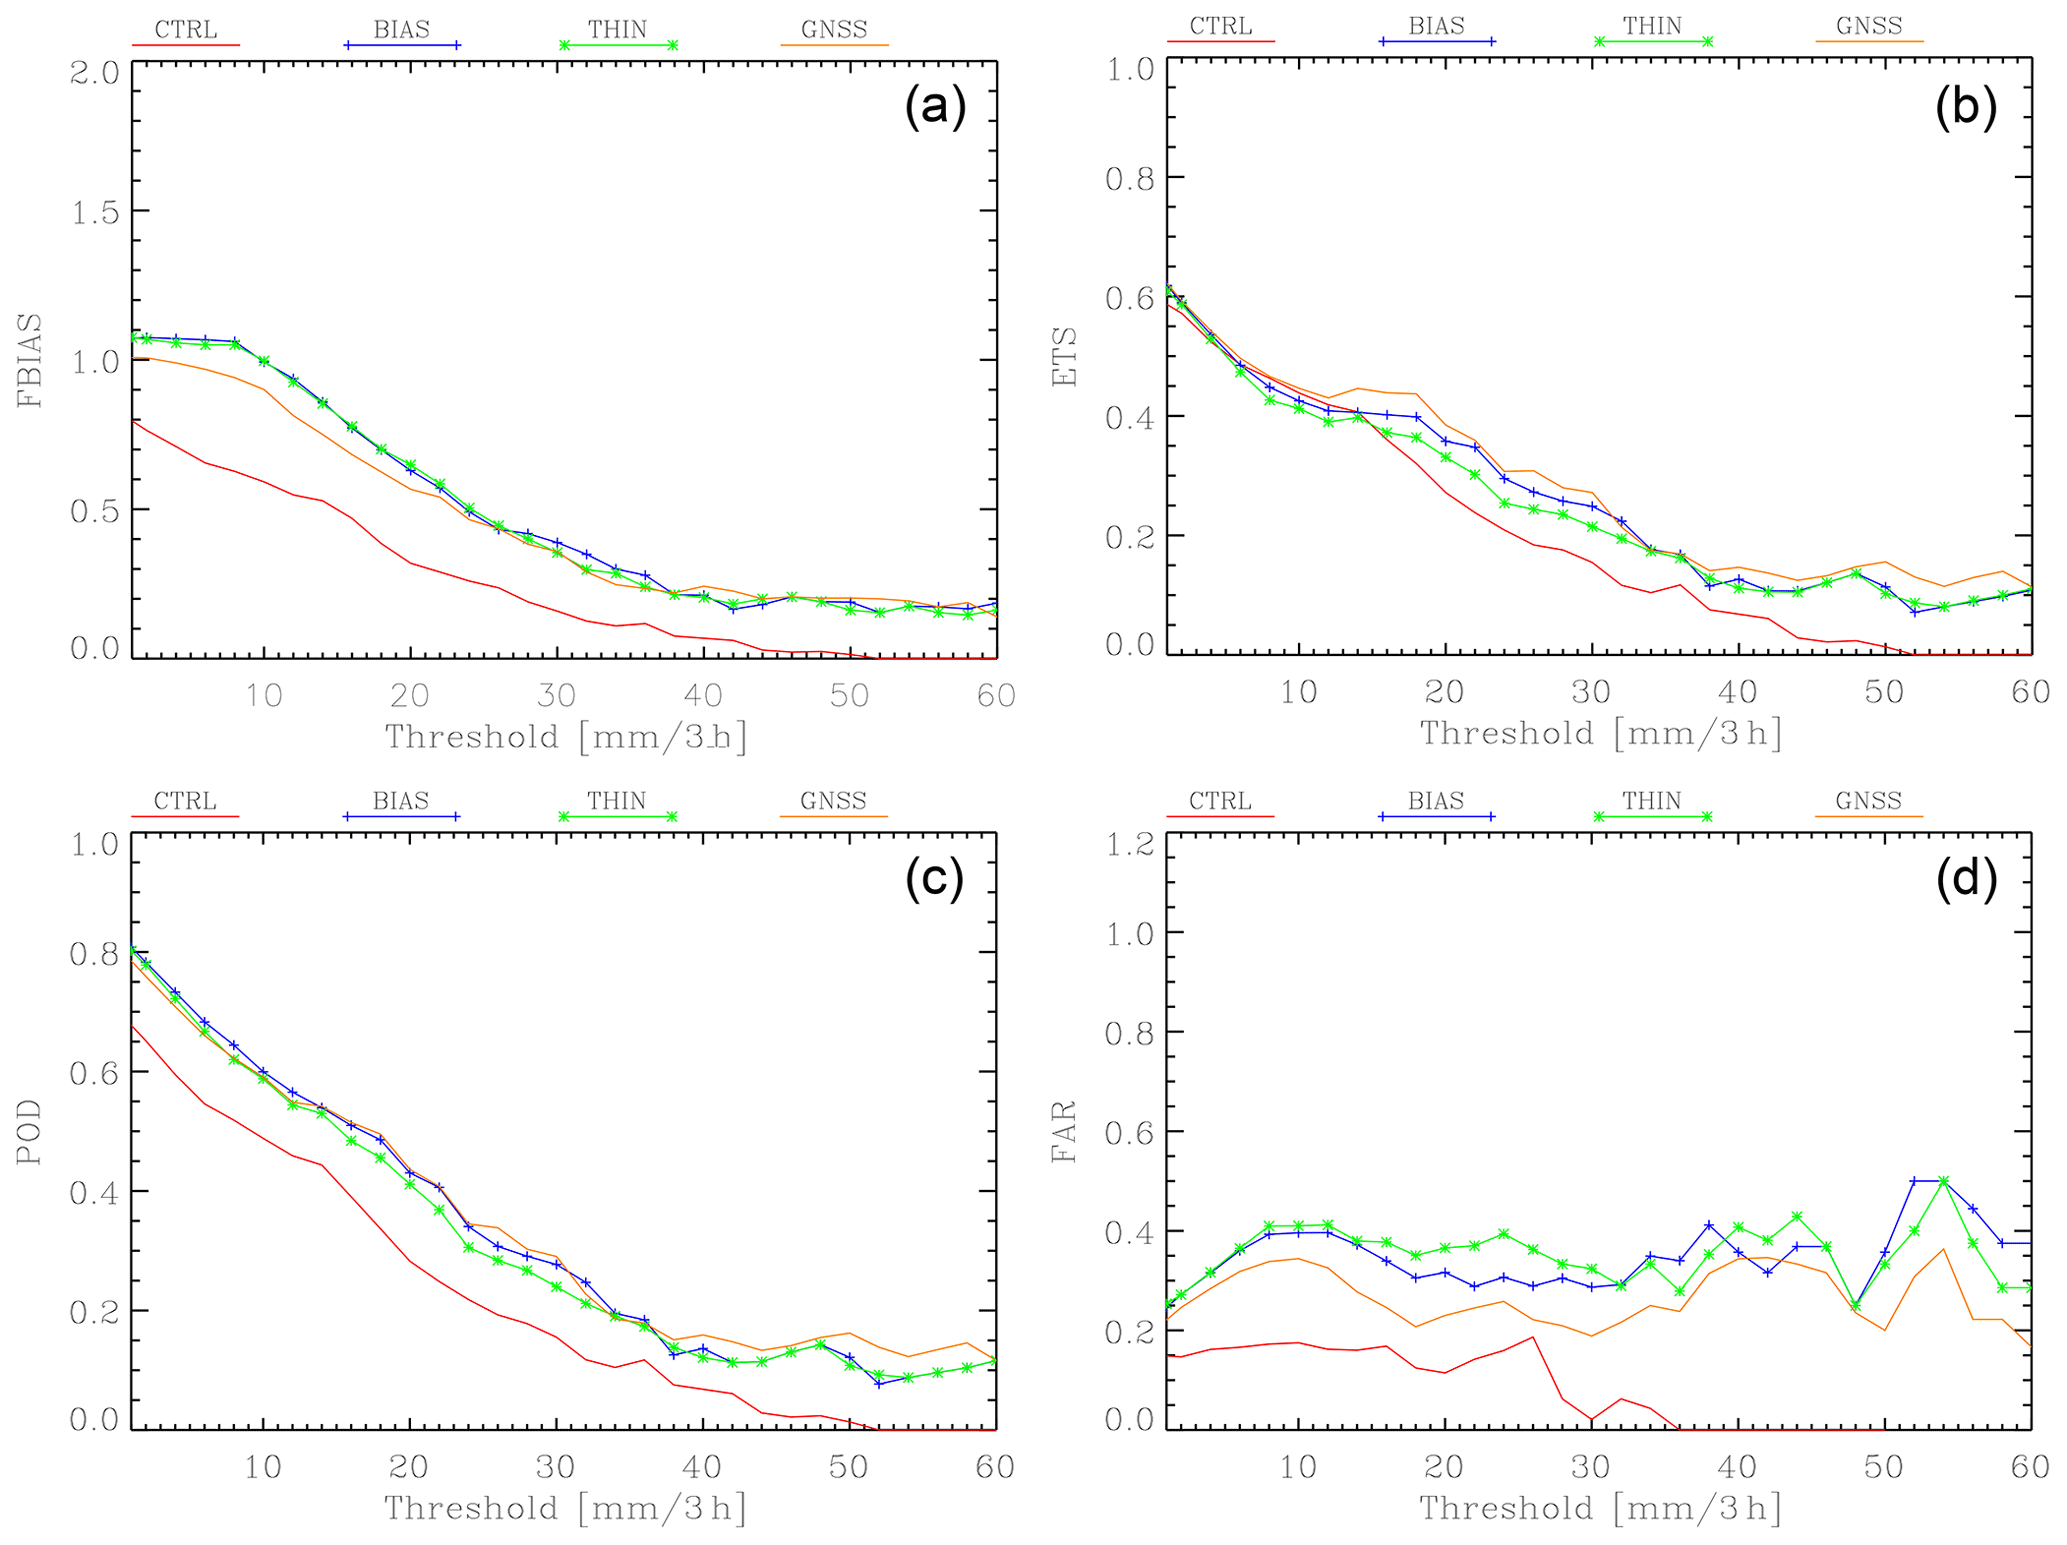
Figure 11(a) The FBIAS for the CTRL, GNSS, THIN and BIAS experiments; (b) as in (a) for the ETS; (c) as in (a) for the POD; (d) as in (a) for the FAR. Scores are computed for the 1 mm (3 h)−1 threshold and every 2 mm (3 h)−1 from 2 to 60 mm (3 h)−1. Scores are computed for the 10 d between 14 and 23 October 2019.
4.2 Impact of the bias removal
It is interesting to study the impact of the bias removal on the precipitation forecast. The 3D-Var system assumes that observations are unbiased with respect to the WRF model, and the bias was removed before data assimilation as discussed in Sect. 2.1. This approach assumes that we know the observations for the forecasted period, which is not possible in an operational context. While other methods are possible (Bennit and Jupp, 2017; Giannaros et al., 2020; Benjamin et al., 2016, among others), it is expected that in our case the impact of the bias removal is small because we limited the data assimilation to GNSS receivers with a maximum height difference from the model orography of 300 m and because WRFDA takes into account the difference between the GNSS receiver and model height. To better assess this point, we compared the results of simulations with or without bias removal for the 10 d between 14 and 23 October 2019. The experiment without bias removal is named BIAS (Fig. 11). As expected, results show small differences between BIAS and GNSS experiments with the latter performing slightly better.
In this paper we studied the impact of GNSS-ZTD data assimilation on the short-term (up to 6 h) forecast over Italy for the month of October 2019, using the WRF model. A dense dataset of 388 GNSS receivers was used.
The comparison between first guess and ZTD observations showed that the forecast without data assimilation underestimates the water vapor content for the period. The GNSS-ZTD data assimilation partially compensates for this underestimation, increasing the water vapor content in the atmosphere. The data assimilation roughly halves both the BIAS and the RMSE statistics for the ZTD. The analysis over the Italian territory shows a general reduction in BIAS and RMSE of the PWV thanks to the rather homogeneous and widespread coverage of GNSS receivers.
A case study on 15 October 2019 was chosen to show the impact of assimilating GNSS-ZTD on the precipitation forecast. The analysis at 18:00 UTC shows that 3D-Var spreads the water vapor innovations both horizontally and vertically, and the improvement of the short-term precipitation forecast is notable, the main drawback being the increase in false alarms over central Italy.
Considering the statistics over the whole period, the analysis of the PWV forecast shows a clear improvement for the simulations with data assimilation. This improvement is widespread over the Italian territory. The PWV RMSE is almost halved for the first forecasting time. As expected, the improvement of the PWV RMSE decreases with forecasting time as the effects caused by data assimilation are partially advected out of Italy.
Assimilating GNSS-ZTD increases the precipitation of the short-term forecast compared to CTRL, which shows a systematic underestimation of the FBIAS. Two 3 h periods were considered after the last analysis time: 0–3 and 3–6 h. For both periods, the FBIAS and the POD are increased by data assimilation and the control forecast is improved. As a drawback, the number of false alarms was increased by GNSS-ZTD data assimilation. The ETS is also improved by data assimilation, even if the increase in the number of false alarms limits the impact of data assimilation on this score.
The results of the resampling statistical test show that the improvement for the FBIAS and POD is statistically significant for several thresholds up to 30 mm (3 h)−1. The FAR increase is statistically significant up to 20 mm (3 h)−1, while the ETS has significant improvements for 1, 25 and 30 mm (3 h)−1.
We started to evaluate the impact of data thinning and of the bias removal in this work. The impact of bias removal is expected to be small because we assimilated data of the GNSS receiver whose height difference from the model does not exceed 300 m. This was confirmed by the results of a numerical experiment spanning 10 heavy-precipitation days. Also the data-thinning experiment did not show consistent differences between the GNSS and THIN experiments. We believe that a longer numerical experiment must be considered to better assess this point.
All in all, the statistical analysis reveals a positive impact of GNSS-ZTD and the improvement is apparent up to 6 h.
While the results of this paper are encouraging, there are several points that need future studies. First, the Mediterranean climate has important seasonal variability and the impact of assimilating GNSS-ZTD must be studied in different seasons. Second, this study refers to only 1 month: longer periods must be considered to give a more robust assessment of the impact of GNSS-ZTD data assimilation on the forecast over Italy. Third, other techniques to assimilate GNSS data, such as assimilating the precipitable water vapor (PWV), and the sensitivity of the results to the background error matrix should be considered in future studies. Fourth, assimilating GNSS-ZTD in real time over Italy and assimilating the ZTD gradients are two subjects that deserve detailed future research.
Scores are computed starting from contingency tables (Table A1) for dichotomous events, i.e., events that can have only two values. In this case the two values are “yes” or “no” and the event is “precipitation is above or equal to a certain threshold”.
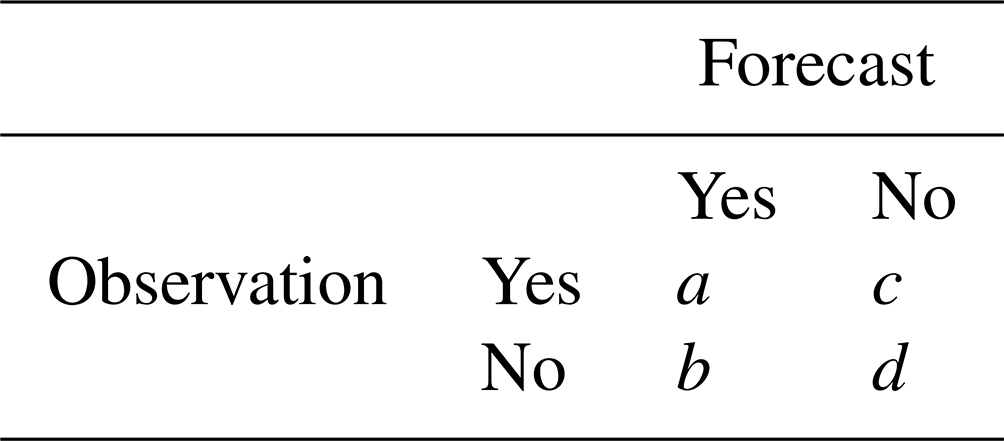
In Table A1, and d have the following meaning:
-
a represents the hits. A hit occurs when both the precipitation forecast and the corresponding rain gauge observation are above or equal to a rainfall threshold.
-
b represents the false alarms. A false alarm occurs when the precipitation forecast is above or equal to a rainfall threshold, while the corresponding rain gauge observation is below the same threshold.
-
c represents the misses, i.e., when the precipitation forecast is below a rainfall threshold, while the corresponding rain gauge observation is above or equal to the same threshold.
-
d represents the correct no forecasts, i.e., when both the precipitation forecast and the corresponding observation are below a rainfall threshold.
The rain gauges used for computing the elements of the contingency tables are shown in Fig. A1. Not all rain gauges report data for each 3 h time interval considered, and the average number of reports is 2700.
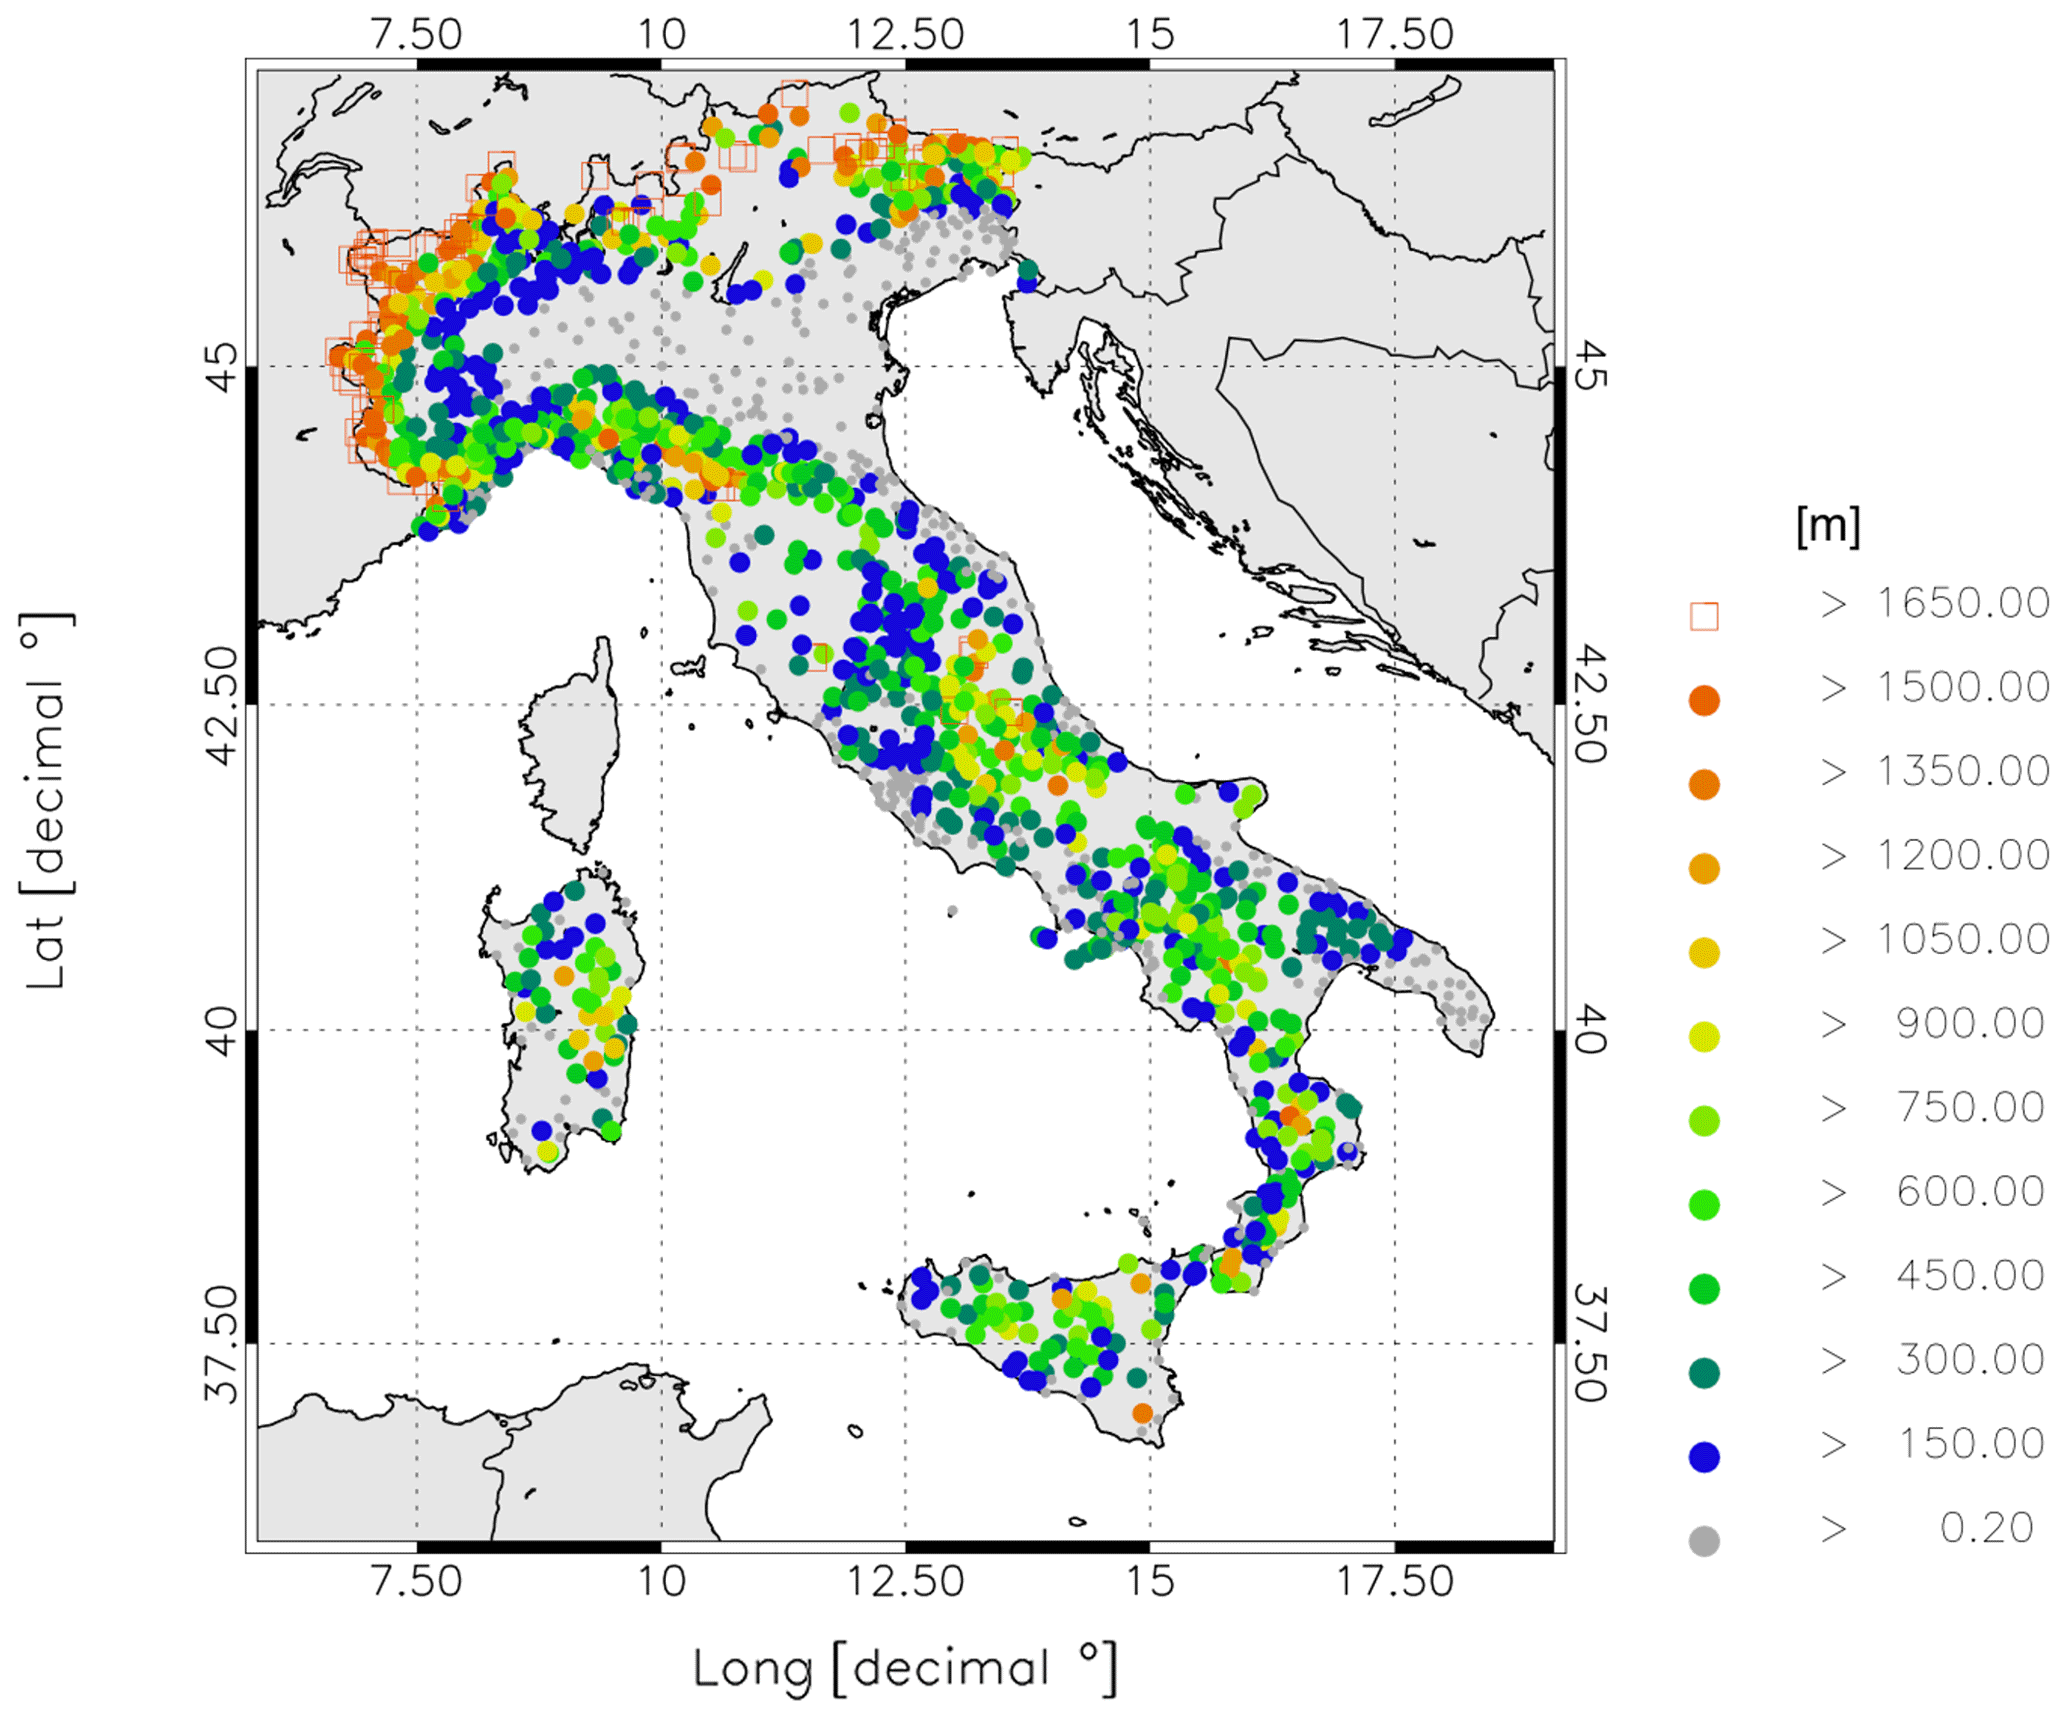
Figure A1Rain gauge elevations [m].
Starting from the values in Table A1, the following scores can be defined:
-
Frequency bias (FBIAS).
which represents the frequency of the predicted events above a rainfall threshold with respect to observed events and can assume values between 0 and ∞, with 1 being the best value possible.
-
Probability of detection (POD).
which is the ratio between the number of correctly predicted events and the number of observed events and can assume values between 0 and 1, with 1 being the best value possible.
-
Threat score (TS).
which is given by the ratio between the number of events correctly predicted and the sum of observed and predicted events. The TS assumes values between 0 and 1, and 1 is the best value that can be obtained.
-
Equitable threat score (ETS).
The ETS is similar to the TS but takes into account the possibility of correctly forecasting an event by chance. It varies in the range between and 1, with 1 being the best value. A value of zero represents a useless forecast in which the probability of correctly predicting an event is random.
-
False alarm rate (FAR).
which is the ratio between false alarms and the number of predicted events and can assume values between 0 and 1. In this case the best value possible is 0. Scores were computed after summing contingency table elements for each model over all simulations (4 × 30 = 120 times in this paper, for both the 0–3 and the 3–6 h forecast intervals).
The resampling method from Hamill (1999) is used for assessing if score differences are statistically significant in a confidence interval. For this purpose, a hypothesis test is performed. The null hypothesis is that the scores of the considered models do not differ.
In our case, the null hypothesis is that the differences between the two model scores, i.e., CTRL and GNSS, are zero. Let S1 and S2 be a generic score, namely the FBIAS, ETS, POD and FAR (see Appendix A for details), for the two model types, CTRL and GNSS, respectively. The null hypothesis can be then written as
The test statistic is calculated after summing contingency table elements for each model over all simulations (4 × 30 = 120 times in this paper, for both the 0–3 and the 3–6 h forecast intervals). The contingency tables can be written as a vector:
where i is the model type (CTRL or GNSS) and j= 1, …, 120 is the contingency table for each time interval.
The contingency table elements are then summed over all times for both model forecasts CTRL and GNSS,
and the test statistic is given by the difference between S1 and S2.
Resampled sums can be calculated after randomly choosing either one or the other model for each time. Let Ij be a random number which can assume values of 1 and 2 for CTRL and GNSS, respectively, with j= 1, …, 120. We can then sum the shuffled vectors over all times,
and sum separately data not selected for the first sum, given by the index (3 – Ij):
Each sample is produced to be consistent with a null distribution; i.e., score differences ( ) are zero.
This random sampling is performed many times (10 000).
We consider the significance levels of α= 0.01, α= 0.05 and α= 0.1, and we test the null hypothesis H0 with the percentiles. Let tL be the percentile of S1−S2 distribution and tU be the percentile of S1−S2 distribution; the null hypothesis H0 is rejected at the level of 90 % (α= 0.1), 95 % (α= 0.05) or 99 % (α= 0.01) if
or
where S1 and S2 are the non-resampled scores.
The code for post-processing the WRF model output can be requested from the first author (rc.torcasio@isac.cnr.it) or from the corresponding author, and it is freely available. For the code of the GNSS data processing, refer to Eugenio Realini (eugenio.realini@g-red.eu). The goGPS software can be found at https://doi.org/10.5281/zenodo.10053746 (Gatti et al., 2023).
The data used to make all the figures of the paper and of its Supplement can be requested from the first author or from the corresponding author. WRF model output is stored for a period of 2 months after the publication of the paper and can be requested from the first author during this period.
The supplement related to this article is available online at: https://doi.org/10.5194/nhess-23-3319-2023-supplement.
RCT: formal analysis, data curation, methodology, software and writing (original draft preparation, review and editing). AM: data curation and writing (original draft preparation, review and editing). ER: conceptualization, data curation, software and writing (original draft preparation, review and editing). SB: software, data curation and writing (original draft preparation, review and editing). GT: software, data curation and writing (original draft preparation, review and editing). SP: conceptualization and writing (review and editing). SD: conceptualization and writing (review and editing). SF: formal analysis, conceptualization, data curation, methodology, software, writing (original draft preparation, review and editing) and funding acquisition.
The contact author has declared that none of the authors has any competing interests.
Publisher’s note: Copernicus Publications remains neutral with regard to jurisdictional claims made in the text, published maps, institutional affiliations, or any other geographical representation in this paper. While Copernicus Publications makes every effort to include appropriate place names, the final responsibility lies with the authors.
This work was realized in the project AEROMET (AEROspatial data assimilation for METeorological weather prediction) funded by the Regione Lazio – FESR Fondo Europeo di Sviluppo Regionale Programma Operativo regionale del Lazio. ECMWF is acknowledged for providing the computational resources for this work.
This research has been supported by the Regione Lazio (grant no. A0375-2020-36588).
This paper was edited by Vassiliki Kotroni and reviewed by three anonymous referees.
Barker, D. M., Huang, W., Guo, Y. R., and Xiao, Q. N.: A Three-Dimensional (3DVAR) Data Assimilation System For Use With MM5: Implementation and Initial Results, Mon. Weather Rev., 132, 897–914, https://doi.org/10.1175/1520-0493(2004)132<0897:ATVDAS>2.0.CO;2, 2004.
Barker, D., Huang, X.-Y., Liu, Z., Auligné, T. , Zhang, X., Rugg, S., Ajjaji, R., Bourgeois, A., Bray, J., Chen, Y., Demirtas, M., Guo, Y.-R., Henderson, T., Huang, W., Lin, H.-C., Michalakes, J., Rizvi, S., and Zhang, X.: The Weather Research and Forecasting Model's Community Variational/Ensemble Data Assimilation System: WRFDA, B. Am. Meteorol. Soc., 93, 831–843, https://doi.org/10.1175/BAMS-D-11-00167.1, 2012.
Benjamin, S. G., Weygandt, S. S., Brown, J. M., Hu, M., Alexander, C. R., Smirnova, T. G., Olson, J. B., James, E. P., Dowell, D. C., Grell, G. A., Lin, H., Peckham, S. E., Smith, T. L., Moninger, W. R., Kenyon, J. S., and Manikin, G. S.: A North American Hourly Assimilation and Model Forecast Cycle: The Rapid Refresh, Mon. Weather Rev., 144, 1669–1694, https://doi.org/10.1175/MWR-D-15-0242.1, 2016.
Bennitt, G. V. and Jupp, A.: Operational Assimilation of GPS Zenith Total Delay Observations into the Met Office Numerical Weather Prediction Models, Mon. Weather Rev., 140, 2706– 2719, https://doi.org/10.1175/MWR-D-11-00156.1, 2012.
Bennitt, G. V., Johnson, H. R., Weston, P. P., Jones, J., and Pottiaux, E.: An assessment of ground-based GNSS Zenith Total Delay observation errors and their correlations using the Met Office UKV model, Q. J. Roy. Meteor. Soc., 143, 2436–2447, https://doi.org/10.1002/qj.3097, 2017.
Bevis, M., Businger, S., Herring, T. A., Rocken, C., Anthes, R. A., and Ware, R. H.: GPS meteorology: Remote sensing of atmospheric water vapor using the global positioning system, J. Geophys. Res.-Atmos., 97, 15787–15801, https://doi.org/10.1029/92JD01517, 1992.
Boniface, K., Ducrocq, V., Jaubert, G., Yan, X., Brousseau, P., Masson, F., Champollion, C., Chéry, J., and Doerflinger, E.: Impact of high-resolution data assimilation of GPS zenith delay on Mediterranean heavy rainfall forecasting, Ann. Geophys., 27, 2739–2753, https://doi.org/10.5194/angeo-27-2739-2009, 2009.
Caldas-Alvarez, A. and Khodayar, S.: Assessing atmospheric moisture effects on heavy precipitation during HyMeX IOP16 using GPS nudging and dynamical downscaling, Nat. Hazards Earth Syst. Sci., 20, 2753–2776, https://doi.org/10.5194/nhess-20-2753-2020, 2020.
Davolio, S., Ferretti, R., Baldini, L., Casaioli, M., Cimini, D., Ferrario, M. E., Gentile, S., Loglisci, N., Maiello, I., Manzato, A., Mariani, S., Marsigli, C., Marzano, F. S., Miglietta, M. M., Montani, A., Panegrossi, G., Pasi, F., Pichelli, E., Pucillo, A., and Zinzi, A.: The role of the Italian scientific community in the first HyMeX SOP: an outstanding multidisciplinary experience, Meteorol. Z., 24, 261–267, https://doi.org/10.1127/metz/2015/0624, 2015.
Desroziers, G., Berre, L., Chapnik, B., and Poli, P: Diagnosis of observation, background, and analysis error statistics in observation space, Q. J. Roy Meteor. Soc., 131, 3385–3396, 2005.
Dudhia, J.: Numerical study of convection observed during the Winter Monsoon Experiment using a mesoscale two-dimensional model, J. Atmos. Sci., 46, 3077–3107, https://doi.org/10.1175/1520-0469(1989)046<3077:NSOCOD>2.0.CO;2,1989.
Faccani, C., Ferretti, R., Pacione, R., Paolucci, T., Vespe, F., and Cucurull, L.: Impact of a high density GPS network on the operational forecast, Adv. Geosci., 2, 73–79, https://doi.org/10.5194/adgeo-2-73-2005, 2005.
Federico, S., Torcasio, R. C., Puca, S., Vulpiani, G., Comellas Prat, A., Dietrich, S., and Avolio, E.: Impact of Radar Reflectivity and Lightning Data Assimilation on the Rainfall Forecast and Predictability of a Summer Convective Thunderstorm in Southern Italy, Atmosphere-Basel, 12, 958, https://doi.org/10.3390/atmos12080958, 2021.
Gatti, A., Tagliaferro, G., Realini, E., and Barindelli, S.: goGPS-Project/goGPS_MATLAB: goGPS NHESS article 2023, Zenodo [code], https://doi.org/10.5281/zenodo.10053746, 2023.
Giannaros, C., Kotroni, V., Lagouvardos, K., Giannaros, T. M., and Pikridas, C.: Assessing the Impact of GNSS ZTD Data Assimilation into the WRF Modeling System during High-Impact Rainfall Events over Greece, Remote Sens.-Basel, 12, 383, https://doi.org/10.3390/rs12030383, 2020.
Hamill, T. M.: Hypothesis tests for evaluating numerical precipitation forecasts, Weather Forecast., 14, 155-167, https://doi.org/10.1175/1520-0434(1999)014<0155:HTFENP>2.0.CO;2,1999.
Herrera, A. M., Suhandri, H. F., Realini, E., Reguzzoni, M., and de Lacy, M. C. J. G. S.: goGPS: open-source MATLAB software, GPS Solut., 20, 595–603, https://doi.org/10.1007/s10291-015-0469-x, 2016.
Huang, X. Y., Xiao, Q., Barker, D. M., Zhang, X., Michalakes, J., Huang, W., Henderson, T., Bray, J., Chen, Y., Ma, Z., Dudhia, J., Guo, Y., Zhang, X., Won, D. J., Lin, H. C., and Kuo, Y. H.: Four-Dimensional Variational Data Assimilation for WRF: Formulation and Preliminary Results, Mon. Weather Rev., 137, 299–314, https://doi.org/10.1175/2008MWR2577.1, 2009.
Janjic, Z. I.: The step-mountain eta coordinate model: Further developments of the convection, viscous sublayer, and turbulence closure schemes, Mon. Weather Rev., 122, 927–945, https://doi.org/10.1175/1520-0493(1994)122<0927:TSMECM>2.0.CO;2,1994.
Krietemeyer, A., Ten Veldhuis, M.-C., Van der Marel, H., Realini, E., and Van de Giesen, N.: Potential of Cost-Efficient Single Frequency GNSS Receivers for Water Vapor Monitoring, Remote Sens.-Basel, 10, 1493, https://doi.org/10.3390/rs10091493, 2018.
Lagasio, M., Parodi, A., Pulvirenti, L., Meroni, A. N., Boni, G., Pierdicca, N., Marzano, F. S., Luini, L., Venuti, G., Realini, E., Gatti, A., Tagliaferro, G., Barindelli, S., Monti Guarnieri, A., Goga, K., Terzo, O., Rucci, A., Passera, E., Kranzlmueller, D., and Rommen, B.: A Synergistic Use of a High-Resolution Numerical Weather Prediction Model and High-Resolution Earth Observation Products to Improve Precipitation Forecast, Remote Sens.-Basel, 11, 2387, https://doi.org/10.3390/rs11202387, 2019.
Lindskog, M., Ridal, M., Thorsteinsson, S., and Ning, T.: Data assimilation of GNSS zenith total delays from a Nordic processing centre, Atmos. Chem. Phys., 17, 13983–13998, https://doi.org/10.5194/acp-17-13983-2017, 2017.
Lyard, F., Lefevre, F., Letellier, T., and Francis, O.: Modelling the global ocean tides: modern insights from FES2004, Ocean Dynam., 56, 394–415, 2006.
Mascitelli, A., Federico, S., Fortunato, M., Avolio, E., Torcasio, R. C., Realini, E., Mazzoni, A., Transerici, C., Crespi, M., and Dietrich, S.: Data assimilation of GNSS-ZTD into the RAMS model through 3D-Var: preliminary results at the regional scale, Meas. Sci. Technol., 30, 055801, https://doi.org/10.1088/1361-6501/ab0b87, 2019.
Mascitelli, A., Federico, S., Torcasio, R. C., and Dietrich, S.: Assimilation of GPS Zenith Total Delay estimates in RAMS NWP model: Impact studies over central Italy, Adv. Space Res., 68, 4783–4793, https://doi.org/10.1016/j.asr.2020.08.031, 2021.
IPCC: Climate Change 2021 – The Physical Science Basis: Working Group I Contribution to the Sixth Assessment Report of the Intergovernmental Panel on Climate Change, edited by: Masson-Delmotte, V., Zhai, P., Pirani, A., Connors, S. L., Péan, C., Berger, S., Caud, N., Chen, Y., Goldfarb, L., Gomis, M. I., Huang, M., Leitzell, K., Lonnoy, E., Matthews, J. B. R., Maycock, T. K., Waterfield, T., Yelekçi, O., Yu, R., and Zhou, B., Cambridge, Cambridge University Press, https://doi.org/10.1017/9781009157896, 2023.
Mlawer, E. J., Taubman, S. J., Brown, P. D., Iacono, M. J., and Clough, S. A.: Radiative transfer for inhomogeneous atmospheres: RRTM, a validated correlated-k model for the longwave, J. Geophys. Res.-Space, 102, 16663–16682, https://doi.org/10.1029/97JD00237, 1997.
Parrish, D. F. and Derber, J. C.: The National Meteorological Center's Spectral Statistical Interpolation analysis system, Mon. Weather Rev., 120, 1747–1763, https://doi.org/10.1175/1520-0493(1992)120<1747:TNMCSS>2.0.CO;2, 1992.
Poli, P., Moll, P., Rabier, F., Desrozier, G., Chapnik, B., Berre, L., Healy, S. B., Andersson, E., and El Guelai, F. Z.: Forecast impact studies of zenith total delay data from European near real-time GPS stations in Météo France 4DVAR, J. Geophys. Res.-Atmos., 112, 1–16, https://doi.org/10.1029/2006JD007430, 2007.
Risanto, C. B., Castro, C. L., Arellano Jr., A. F., Moker Jr., J. M., and Adams, D. K.: The impact of assimilating GPS precipitable water vapor in convective-permitting WRF-ARW on North American Monsoon precipitation forecasts over Northwest Mexico, Mon. Weather Rev., 149, 3013–3035, https://doi.org/10.1175/MWR-D-20-0394.1,2021.
Roebber, P. J.: Visualizing multiple measures of forecast quality, Weather Forecast., 24, 601–608, https://doi.org/10.1175/2008WAF2222159.1,2009.
Rohm, W., Guzikowski, J., Wilgan, K., and Kryza, M.: 4DVAR assimilation of GNSS zenith path delays and precipitable water into a numerical weather prediction model WRF, Atmos. Meas. Tech., 12, 345–361, https://doi.org/10.5194/amt-12-345-2019, 2019.
Rueger, J.: Refractive indices of light, infrared and radio waves in the atmosphere, U. of New South Wales, Sydney, NSW, Unisurv S-68, 104 pp., https://www.sage.unsw.edu.au/sites/sage/files/SAGE_collection/SpecialSeries/s68.pdf (last access: 27 October 2023), 2002.
Saastamoinen, J.: Contributions to the theory of atmospheric refraction, B. Geod., 105, 279–298, https://doi.org/10.1007/BF02521844, 1972.
Singh, R., Ojha, S. P., Puviarasan, N., and Singh, V.: Impact of GNSS signal delay assimilation on short range weather forecasts over the Indian region, J. Geophys. Res.-Atmos., 124, 9855–9873, https://doi.org/10.1029/2019JD030866, 2019.
Skamarock, W. C., Klemp, J. B., Dudhia, J., Gill, D. O., Liu, Z., Berner, J., Wang, W., Powers, J. G., Duda, M. G., Barker, D. M., and Huang, X.-Y.: A Description of the Advanced Research WRF Version 4; No. NCAR/TN-556+STR, NCAR Technical Note; National Center for Atmospheric Research, Boulder, CO, USA, 145 pp., https://doi.org/10.5065/1dfh-6p97, 2019.
Stensrud, D. J., Xue, M., Wicker, L. J., Kelleher, K. E., Foster, M. P., Schaefer, J. T., Schneider, R. S., Benjamin, S. G., Weygandt, S. S., Ferree, J. T., and Tuell, J. P.: Convective-scale Warn-On-Forecast system: A vision for 2020, B. Am. Meteorol. Soc., 90, 1487–1499, https://doi.org/10.1175/2009BAMS2795.1, 2009.
Tagliaferro, G.: On the Development of a General Undifferenced Uncombined Adjustment for GNSS, PhD thesis, Politecnico di Milano, Department of Civil and Environmental Engineering, https://www.politesi.polimi.it/bitstream/10589/170932/1/Tesi_tagliaferro.pdf (last access: 27 October 2023), 2021.
Trzcina, E., Hanna, N., Kryza, M., and Rohm, W.: TOMOREF operator for assimilation of GNSS tomography wet refractivity fields in WRF DA system, J. Geophys. Res.-Atmos., 125, e2020JD032451, https://doi.org/10.1029/2020JD032451, 2020.
Thompson, G., Field, P. R., Rasmussen, R. M., and Hall, W. D.: Explicit Forecasts of Winter Precipitation Using an Improved Bulk Microphysics Scheme. Part II: Implementation of a New Snow Parameterization, Mon. Weather Rev., 136, 5095–5115, https://doi.org/10.1175/2008MWR2387.1, 2008.
Vedel, H. and Huang, X.-Y.: Impact of Ground Based GPS Data on Numerical Weather Prediction, J. Meteorol. Soc. Jpn., 82, 459–472, https://doi.org/10.2151/jmsj.2004.459, 2004.
Yan, X., Ducrocq, V., Poli, P., Hakam, M., Jaubert, G., and Walpersdorf, A.: Impact of GPS Zenith delay assimilation on convective-scale prediction of Mediterranean heavy rainfall, J. Geophys. Res.-Atmos., 114, D03104, https://doi.org/10.1029/2008JD011036, 2009.
Yang, S.-C., Huang, Z.-M., Huang, C.-Y., Tsai, C.-C., and Yeh, T.-K.: A case study on the impact of ensemble data assimilation with GNSS-zenith total delay and radar data on heavy rainfall prediction, Mon. Weather Rev. 148, 1075–1098, https://doi.org/10.1175/MWR-D-18-0418.1, 2020.
Zumberge, J. F., Heflin, M. B., Jefferson, D. C., Watkins, M. M., and Webb, F. H.: Precise point positioning for the efficient and robust analysis of GPS data from large networks, J. Geophys. Res.-Sol. Ea., 102, 5005–5017, https://doi.org/10.1029/96JB03860, 1997.
- Abstract
- Introduction
- Data and methods
- Results and discussion
- Sensitivity tests
- Conclusions
- Appendix A: Precipitation scores
- Appendix B: The resampling method
- Code availability
- Data availability
- Author contributions
- Competing interests
- Disclaimer
- Acknowledgements
- Financial support
- Review statement
- References
- Supplement