the Creative Commons Attribution 4.0 License.
the Creative Commons Attribution 4.0 License.
 | 23 Oct 2023
Sentinel-1-based analysis of the severe flood over Pakistan 2022
Florian Roth
Bernhard Bauer-Marschallinger
Mark Edwin Tupas
Christoph Reimer
Peter Salamon
Wolfgang Wagner
In August and September 2022, Pakistan was hit by a severe flood, and millions of people were impacted. The Sentinel-1-based flood mapping algorithm developed by Technische Universität Wien (TU Wien) for the Copernicus Emergency Management Service (CEMS) global flood monitoring (GFM) component was used to document the propagation of the flood from 10 August to 23 September 2022. The results were evaluated using the flood maps from the CEMS rapid mapping component. Overall, the algorithm performs reasonably well with a critical success index of up to 80 %, while the detected differences can be primarily attributed to the time difference of the algorithm's results and the corresponding reference. Over the 6-week time span, an area of 30 492 km2 was observed to be flooded at least once, and the maximum extent was found to be present on 30 August. The study demonstrates the ability of the TU Wien flood mapping algorithm to fully automatically produce large-scale results and how key data of an event can be derived from these results.
- Article
(15479 KB) - Full-text XML
- BibTeX
- EndNote


Pakistan is a flood-prone country. The local climate shows a distinct wet and dry season, causing floods mostly happening between July and September. Heavy rainfall caused by the monsoon and the snowmelt from the upstream Himalayan region during these months supply copious amounts of water to local rivers. The Indus River collects and carries the large volumes to the south to flood-prone regions that are densely populated (Qasim et al., 2015). Besides the climate- and topographic-related flood causes, human-made transformations aggravate the situation, as deforestation reduces the natural retention capacity of the land, and the lack of artificial flood plain regulations increases the exposure to intense floods (Khan, 2013). Today, agriculture makes up one-fifth of the country's GDP (The Editors of Encyclopaedia, 2023b). Due to the proximity of the majority of the crops to the Indus River, the sector is specifically endangered by flooding. Because of these reasons, floods in Pakistan often result in enormous harm to human life and the local economy. One event happened in 2010 and affected about 14 million people (Gaurav et al., 2011). Only 12 years later, starting from mid-June 2022, Pakistan was hit by the country's worst flooding in a decade, and tens of thousands of square kilometres were inundated (NASA Earth Observatory, 2022). Besides the mentioned monsoon conditions, Otto et al. (2023) identified intensified rainfall due to climate change as one of the major contributors to the catastrophic magnitude of the event.
As the 2022 flood destroyed many roads and other infrastructure and the extent of the inundated area covered an extremely large area, satellite data were the only way of providing large-scale information of the affected area to local authorities. Among other space programmes, the Copernicus Earth Observation programme gives access to systematic observations of the Earth's surface, providing crucial information on natural disasters. Especially the C-band synthetic aperture radar (SAR) mission of Sentinel-1 provides cloud-independent all-day imagery with unprecedented spatio-temporal sampling, enabling the mapping of flooded areas. To retrieve the flooded areas from the satellite data, the Copernicus Emergency Management Service (CEMS) offers two components: the rapid mapping service and the global flood monitoring (GFM) (Salamon et al., 2021) service. While the rapid mapping service works on demand of an authorised user and makes use of many different satellite missions, the GFM service relies exclusively on Sentinel-1 observations and provides results fully automatic in near-real-time (NRT) for each incoming scene. The service utilises three independent flood mapping algorithms and provides an ensemble result. One of the algorithms has been developed by Technische Universität Wien (TU Wien) (Bauer-Marschallinger et al., 2022), and its results for the flood in Pakistan 2022 are shown and evaluated in this study.
The flood extent data generated by the TU Wien algorithm can be used in multiple different applications. One established application is in emergency response, where the data are made available to local authorities for disaster management (Schumann et al., 2018). To support the time-critical decisions arising in this process, the data need to be made available very quickly after sensing by the satellite. Hereby, the fully automatic and unsupervised approach allows for fast (NRT) delivery times, while false classifications are not removed during manual interactions by experts (Westerhoff et al., 2013). Since the algorithm can systematically deliver consistent results, the frequency of flood detections can be used to estimate flood risk (Pelich et al., 2017). As stated by Thomas et al. (2023), an adequate data validation would even strengthen satellite-based flood mapping that can drive flood index insurance applications. Further, the data can be used for data assimilation and validation of hydrological model outputs used in flood forecasting systems (Hostache et al., 2018; Dasgupta et al., 2021; Schumann et al., 2023).
In this study, the NRT results of the TU Wien algorithm were collected in a dedicated dataset of flood extent maps in Pakistan from 10 August to 23 September 2022. Based on this dataset, we present our estimation of the affected area and the progress of the flood. To evaluate the quality of the presented dataset, it is compared to results of the CEMS rapid mapping service. The study aims to give a timely estimate on the flood's impact and to support further studies by sharing our results and insights with the scientific community.
The provided dataset deals with the most affected parts of Pakistan covering the southern provinces of Punjab, Sindh, and Balochistan (details can be seen in Fig. 1). In the selected time frame (10 August to 23 September 2022) the area was captured by 14 Sentinel-1 overpasses and was observed from five different relative orbits (see Fig. 2 for more details). The flood extent of all of these Sentinel-1 observations is retrieved by our TU Wien flood mapping algorithm.
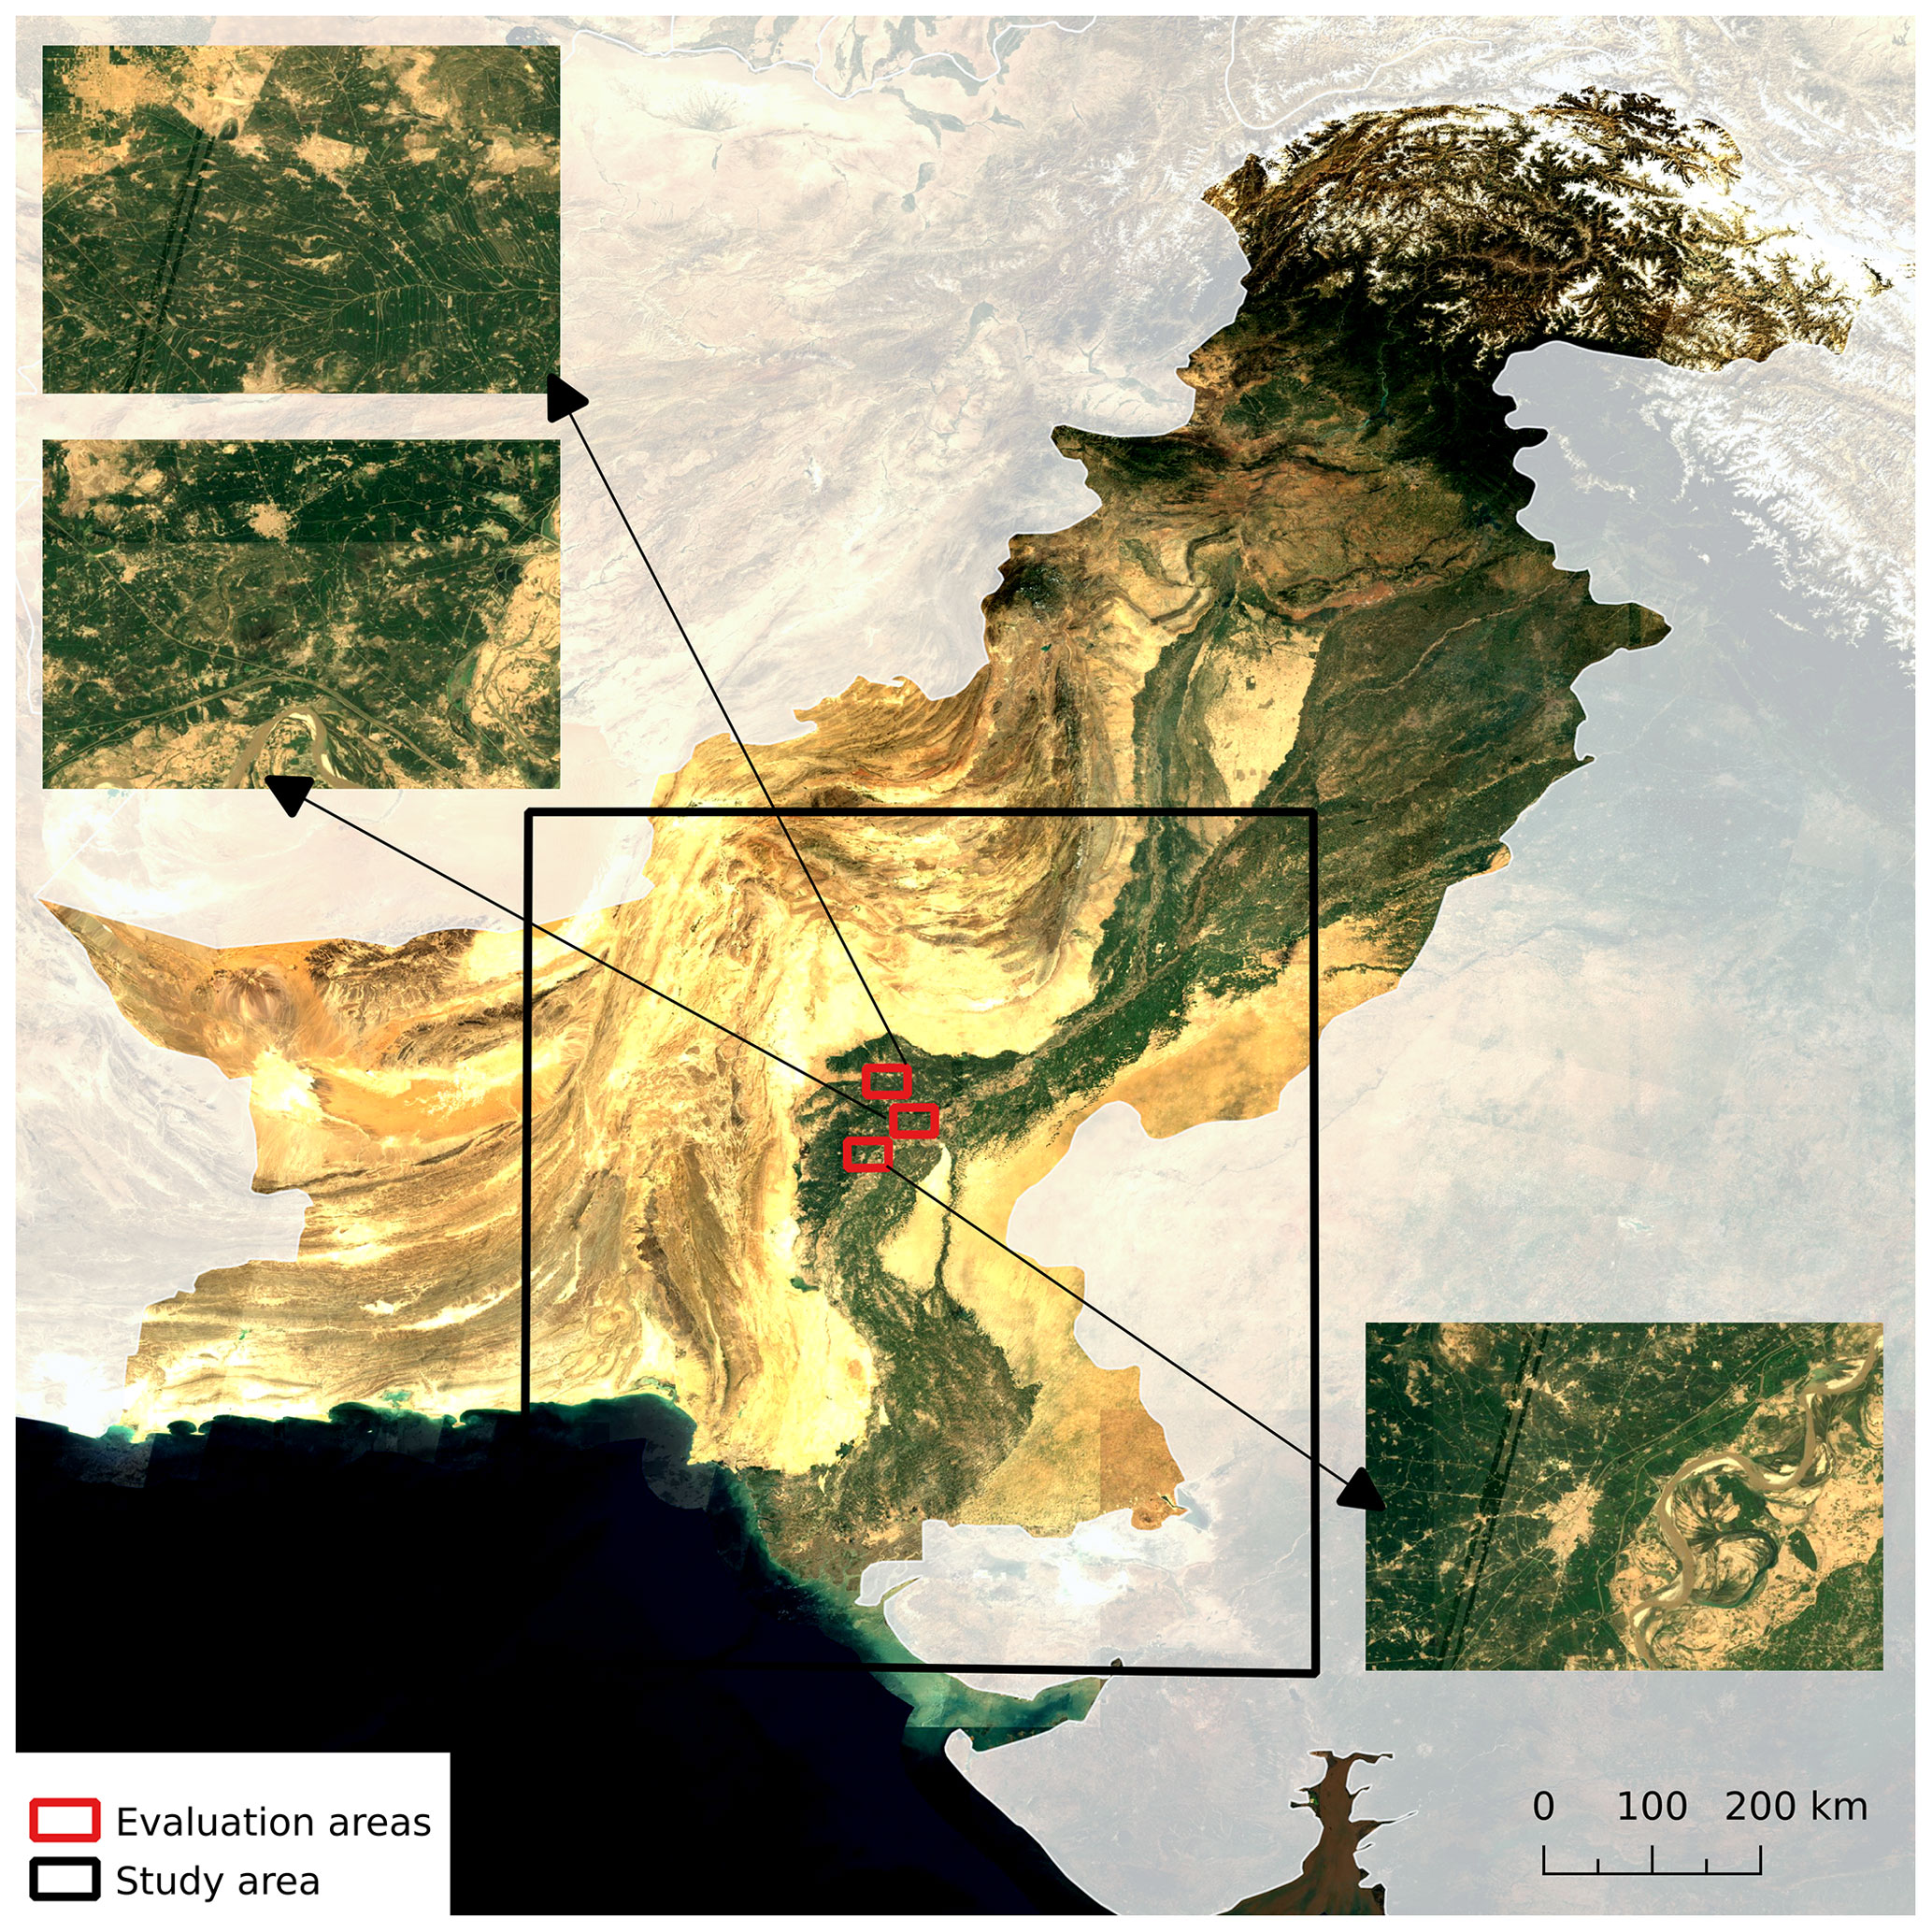
Figure 1Study area (black box) and extents of the evaluation areas as provided by the CEMS rapid mapping module (red boxes) over Pakistan. Background: (https://s2maps.eu, last access: 7 October 2022) Sentinel-2 cloudless 2021 by EOX IT Services GmbH is licensed under a Creative Commons Attribution-NonCommercial-ShareAlike 4.0 International License.
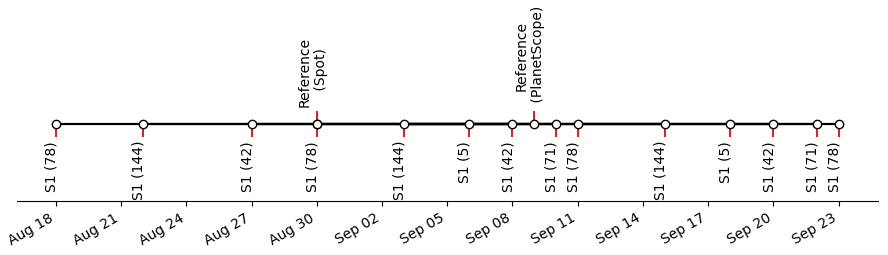
Figure 2Timeline of Sentinel-1 overpasses in August/September 2022 over study area and their respective relative orbits in parentheses. Additionally, the figure shows the dates of overpasses used of available reference data (not covering the exact same area as Sentinel-1).
Calm open water surfaces appear flat when being hit by C-band SAR radiation, and the radiation is scattered away from the satellite's sensor. Consequently, the received energy (measured as backscatter) is low and shows high contrast to general land surfaces. Generally, the underlying principle of the SAR-based flood mapping methods is to identify low-backscatter measurements where land is expected under normal conditions. For this purpose, the TU Wien flood mapping algorithm (Bauer-Marschallinger et al., 2022) utilises backscatter signatures for flooded and non-flooded conditions retrieved from historic Sentinel-1 measurements. The former is retrieved from a global linear water backscatter model, representing the relationship of the backscatter over water and the corresponding incidence angle of the radiation. The latter relies on a local harmonic model representing the backscatter's seasonality (with limited impact of extreme events) and is derived a priori from a representative backscatter time series of that pixel. Based on the per-pixel incidence angles and acquisition time of an incoming Sentinel-1 observation, we perform a parametrisation of the backscatter signatures of both conditions. Next, the Sentinel-1 observation is compared to both signatures on a pixel basis, and the most probable class is selected using the Bayes decision rule. As the general intention of the algorithm is the use in NRT applications, we model the class signatures defined by a manageable number of predefined parameters, and all input and intermediate data are stored in a dedicated data cube structure (Wagner et al., 2021). This setup allows for efficient access to multiple years of backscatter characteristics, but one needs to take into account the limitations of the applied models, too. A well-informed decision requires two distinct class signatures and the Sentinel-1 observation being clearly allocatable to one of those classes. In general, this requirement is not fulfilled in the case of permanent or seasonal waterbodies or typical water look-alikes like tarmac surfaces or very dry land. To remove pixels where no informed Bayes decision is possible, our algorithm relies on (internal) masking by applying manually defined thresholds to intermediate parameters, e.g. the classification uncertainty, details of which can be perused in Bauer-Marschallinger et al. (2022).
Flood mapping based on SAR data suffers from certain limitations, and the GFM service deals with these by applying a dedicated exclusion mask onto the flood mapping result (details are given in Global Flood Monitoring, 2022). The mask takes into account areas where Sentinel-1 has no sensitivity (e.g. dense vegetation, urban areas), areas of permanent low backscatter (e.g. tarmac surfaces, deserts), areas of topographic distortions (e.g. mountains), and radar shadows. Following this approach, the GFM exclusion mask is applied to the TU Wien results as well.
Finally, the flood classification of an incoming Sentinel-1 observation can be represented by a binary map, showing detected flooded areas. Pixels masked by the algorithm or the exclusion mask are set to no data. The impact and progress of the flood is estimated by exploiting the resulting time series of binary flood extent maps. Flood frequency, as used in the Earth observation (EO) domain, is estimated as the ratio of flood detections and number of observations per pixel (Pekel et al., 2016; Pelich et al., 2017). This statistical value allows for estimating the area flooded at least once during a time period and is often used to show the flood impact of a certain event (Wang, 2004; Hoque et al., 2011). Additionally, pixels can be identified which are flooded during the whole time of the study. The progress of the flood is derived by analysing the results of one relative orbit covering the study area best. To present the flood's progress based on multiple orbits, the time of the first flood detection of each pixel is shown in a dedicated layer.
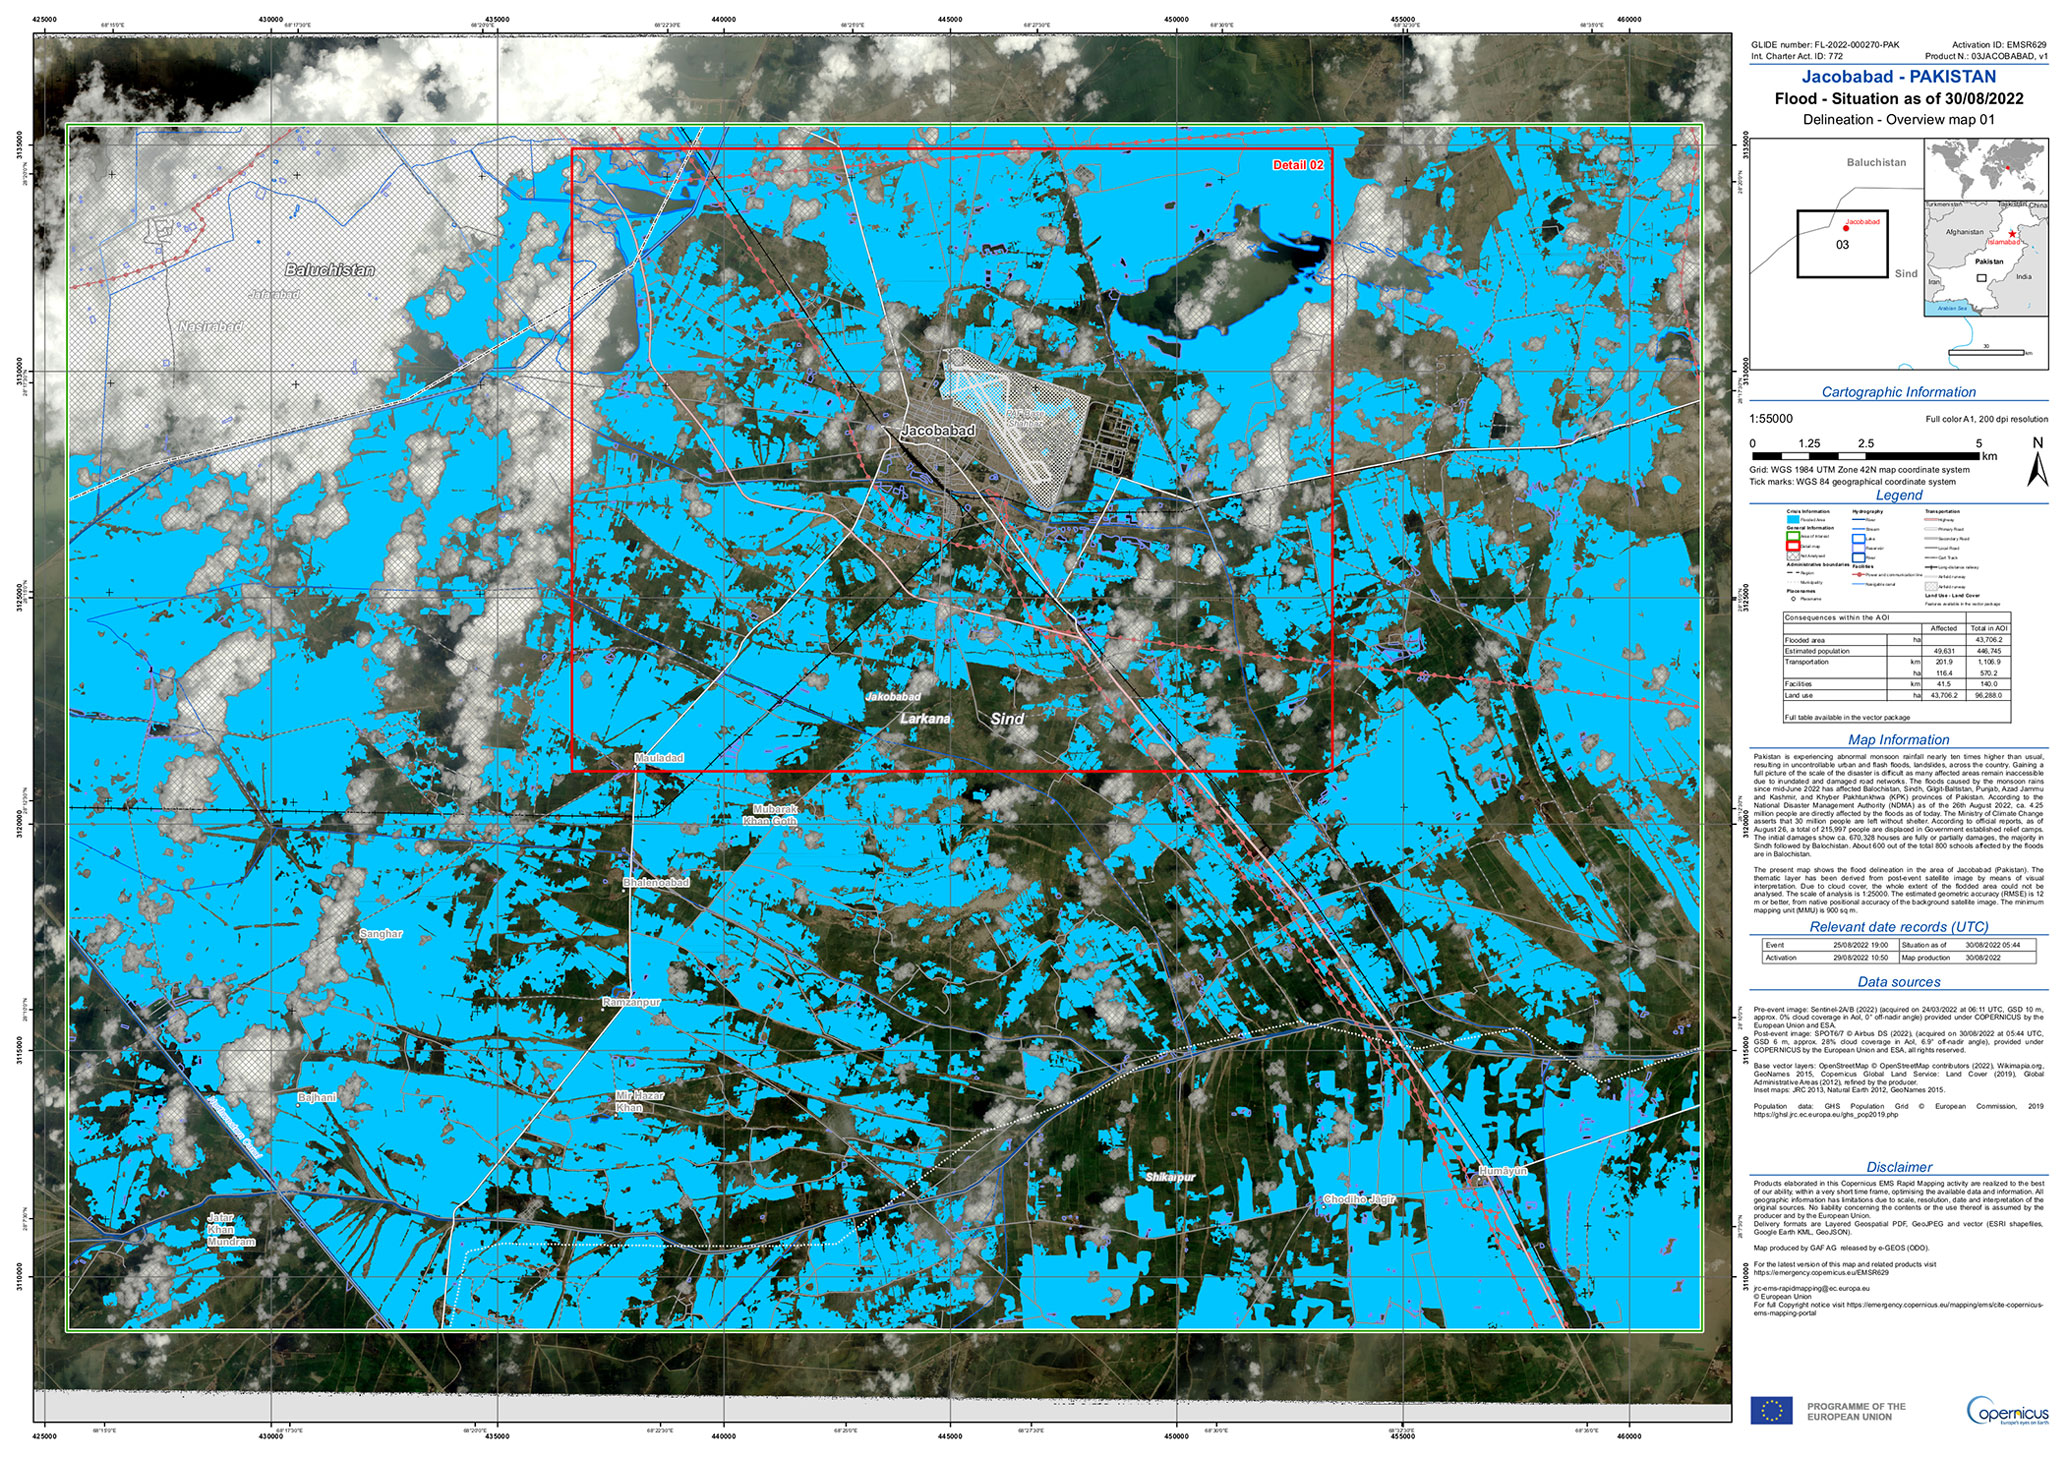
Figure 3Exemplary CEMS rapid mapping service delineation product for Jacobabad. Copernicus Emergency Management Service (https://emergency.copernicus.eu/mapping/, last access: 27 September 2022), [EMSR629] Jacobabad: Delineation Map, version 2.
To evaluate the performance of the TU Wien flood mapping algorithm, its results are compared to the results of the CEMS rapid mapping component. As described by Wania et al. (2021), the CEMS rapid mapping service provides crisis information on-demand and handles map requests, production, and dissemination. In the context of flood mapping, the delineation products (example given in Fig. 3) are of particular interest as they include the observed flood extent of a given time. The inundated areas are classified by using a semi-automatic approach, which includes manual expertise and automatic classification. The vector-based delineation products are converted to raster format to allow a pixel-based comparison to the TU Wien results. Furthermore, permanent waterbodies and cloud-covered areas are retrieved from the delineation products and excluded from the validation, as well as areas masked by the TU Wien algorithm. Differences found from TU Wien results against reference data are summarised in confusion maps and tables where the common validation metrics are presented. These include the user's and producer's accuracy (UA and PA), as well as the critical success index (CSI).
Table 1Available reference datasets and the temporally closest overlapping Sentinel-1 acquisition times.
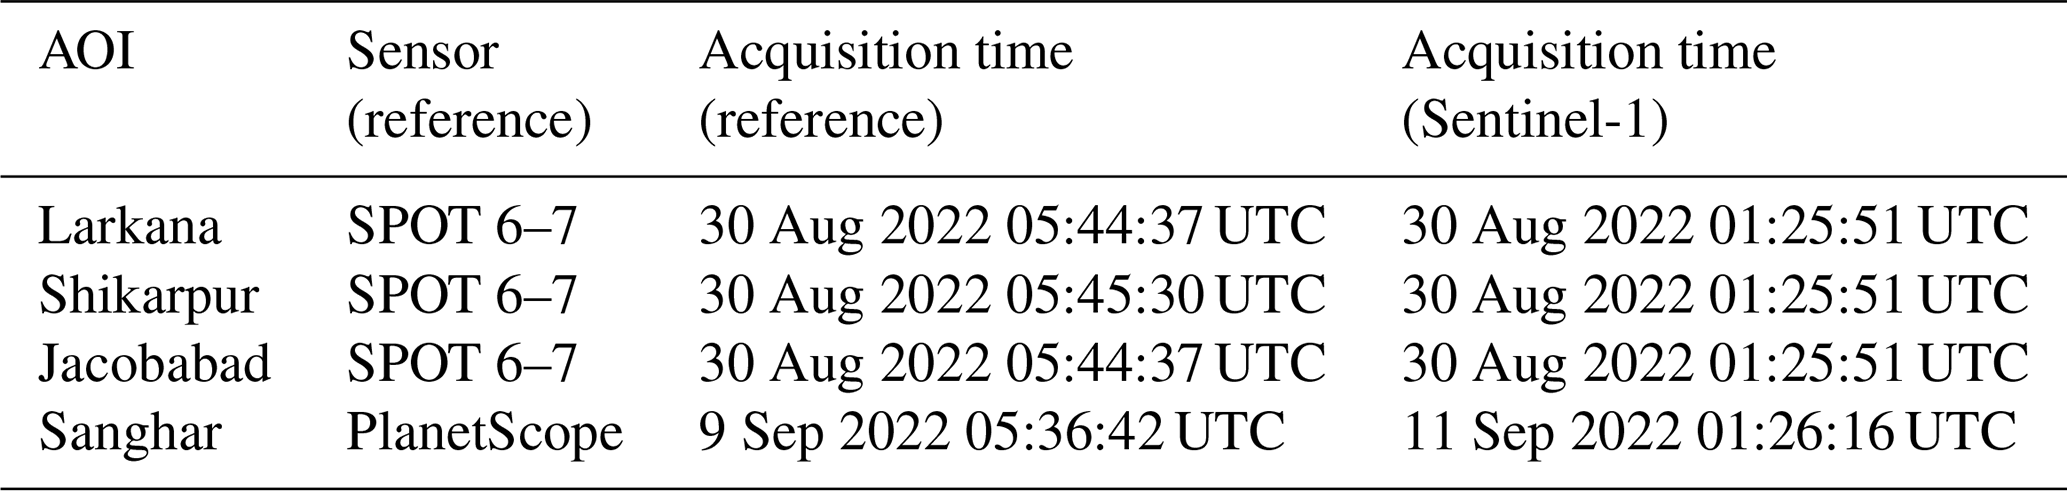
The CEMS rapid mapping service recorded two activations related to the 2022 flood in Pakistan (EMSR629, https://emergency.copernicus.eu/mapping/list-of-components/EMSR629, last access: 7 October 2022 and EMSR631, https://emergency.copernicus.eu/mapping/list-of-components/EMSR631, last access: 7 October 2022), which included four areas of interest (AOIs): Jacobabad, Larkana, Shikarpur, and Sanghar. For the first three AOIs, the satellite system SPOT was used to detect flooded areas, and the acquisitions were within hours of the closest Sentinel-1 acquisition. The high-resolution sensor from SPOT 6–7 features a spatial resolution of 6 m, which is significantly better than the 20 m of the Sentinel-1 input. Moreover, due to its (passive) measurements in the optical wavelength range, the observations are often limited by cloud coverage. The Sentinel-1 C-band SAR sensor performs active measurements in the microwave domain where clouds are generally transparent and hence allows all-weather observations. While some smaller flood areas might only be seen by SPOT due to its better spatial resolution, other areas might only be seen by Sentinel-1 due to its ability to penetrate clouds. Consequently, the comparison of TU Wien and the rapid mapping service results are influenced not only by the difference in methodology but also by the sensor. Last but not least, the different timings of the individual missions' acquisitions have an impact on the observed flood extent.
Since the satellite acquisition of only three AOIs are on the same day as a Sentinel-1 acquisition of the same region (see Table 1), only these are incorporated in the evaluation of this study. It can be seen that the AOI covers only small fractions of the whole study area. As the CEMS rapid mapping service activations generally focus on areas where people have been directly affected by a flood, the given AOIs are located close to cities. The study area contains many other land cover types like desert areas and shrubland. The performance of the algorithm within those areas can not be detected by the evaluation. Since we compare two datasets based on EO data to each other, general limitations of EO cannot be detected by the applied evaluation. To test the results on these limitations (e.g. discrete measurements, limited sensitivity over vegetation or build-up areas), one would need access to, for example, ground-truth data from a local inspection or hydrological measurement stations. Although not the whole study area (shown in Fig. 1) is covered by the reference data, the evaluation is considered meaningful for the performance of the algorithm if the mentioned limitations of the evaluation are taken into account.
4.1 Evaluation results
The result of the evaluation is shown in Table 2. Generally, the algorithm performed reasonably well taking into account the differences in the sensor and acquisition time. Based on the CSI, the best performance of the algorithm can be seen in Larkana, while the performance in Jacobabad and Shikarpur is lower but in a reasonable range. Figures 4 to 6 show more details about the detected differences by presenting areas of over- and underestimation, as well as areas of agreement. Additionally, the figures contain the backscatter under normal conditions as expected from the non-flood statistical model utilised by the TU Wien algorithm, the investigated Sentinel-1 observation showing the flood extent during the acquisition time, and the excluded areas from the evaluation. The latter includes cloud-covered areas and permanent waterbodies based on the reference data and the internal masking of our algorithm as described in Sect. 2.
Table 2Validation measures for each AOI of the CEMS rapid mapping service.
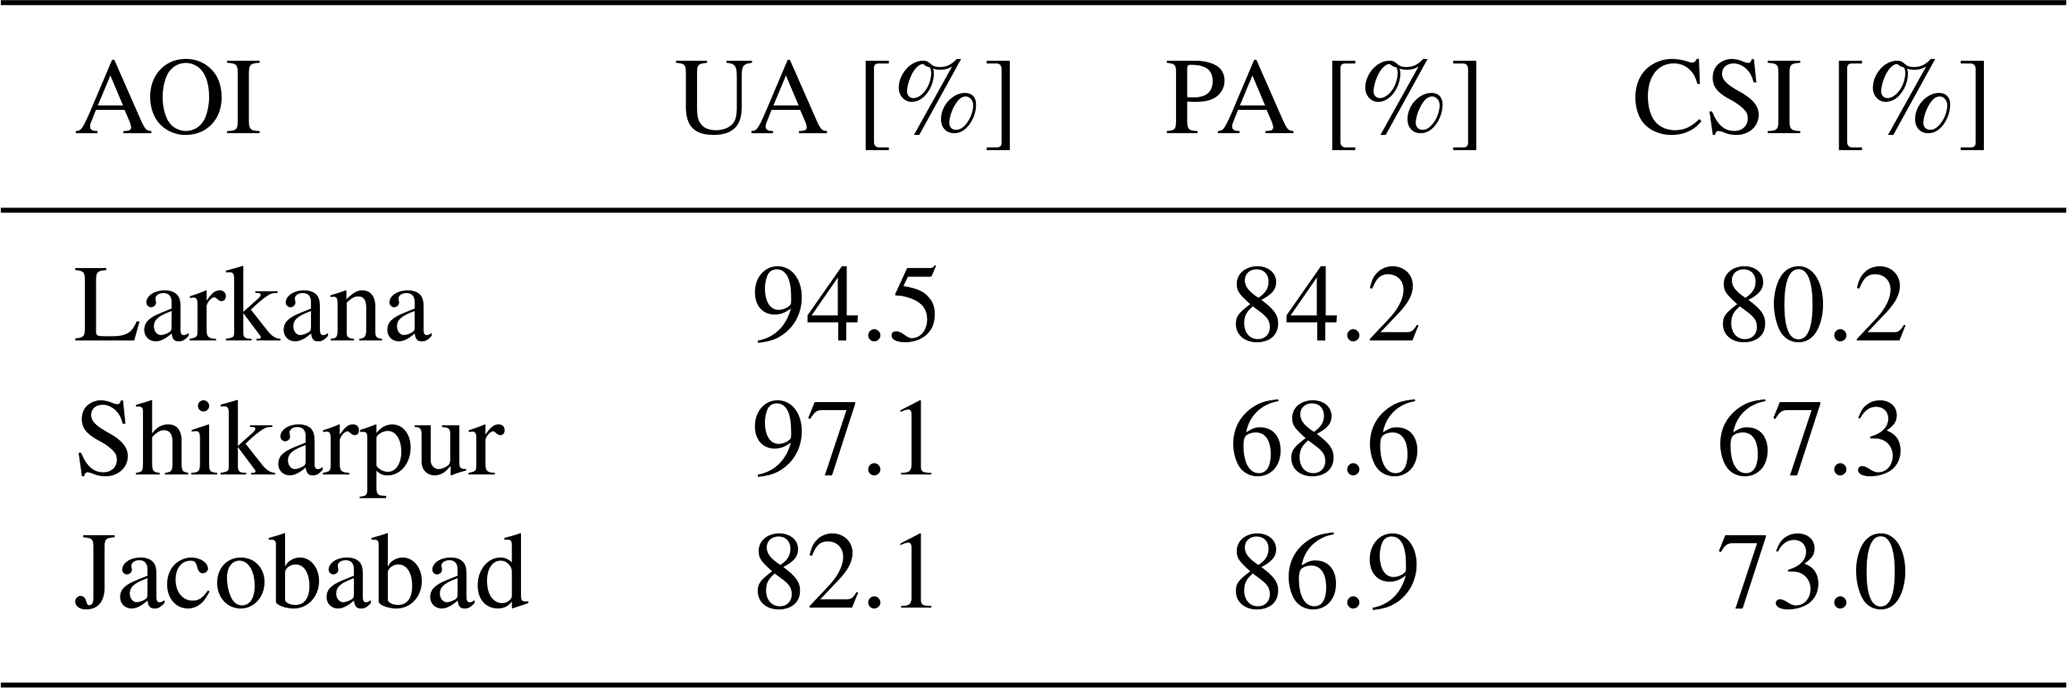
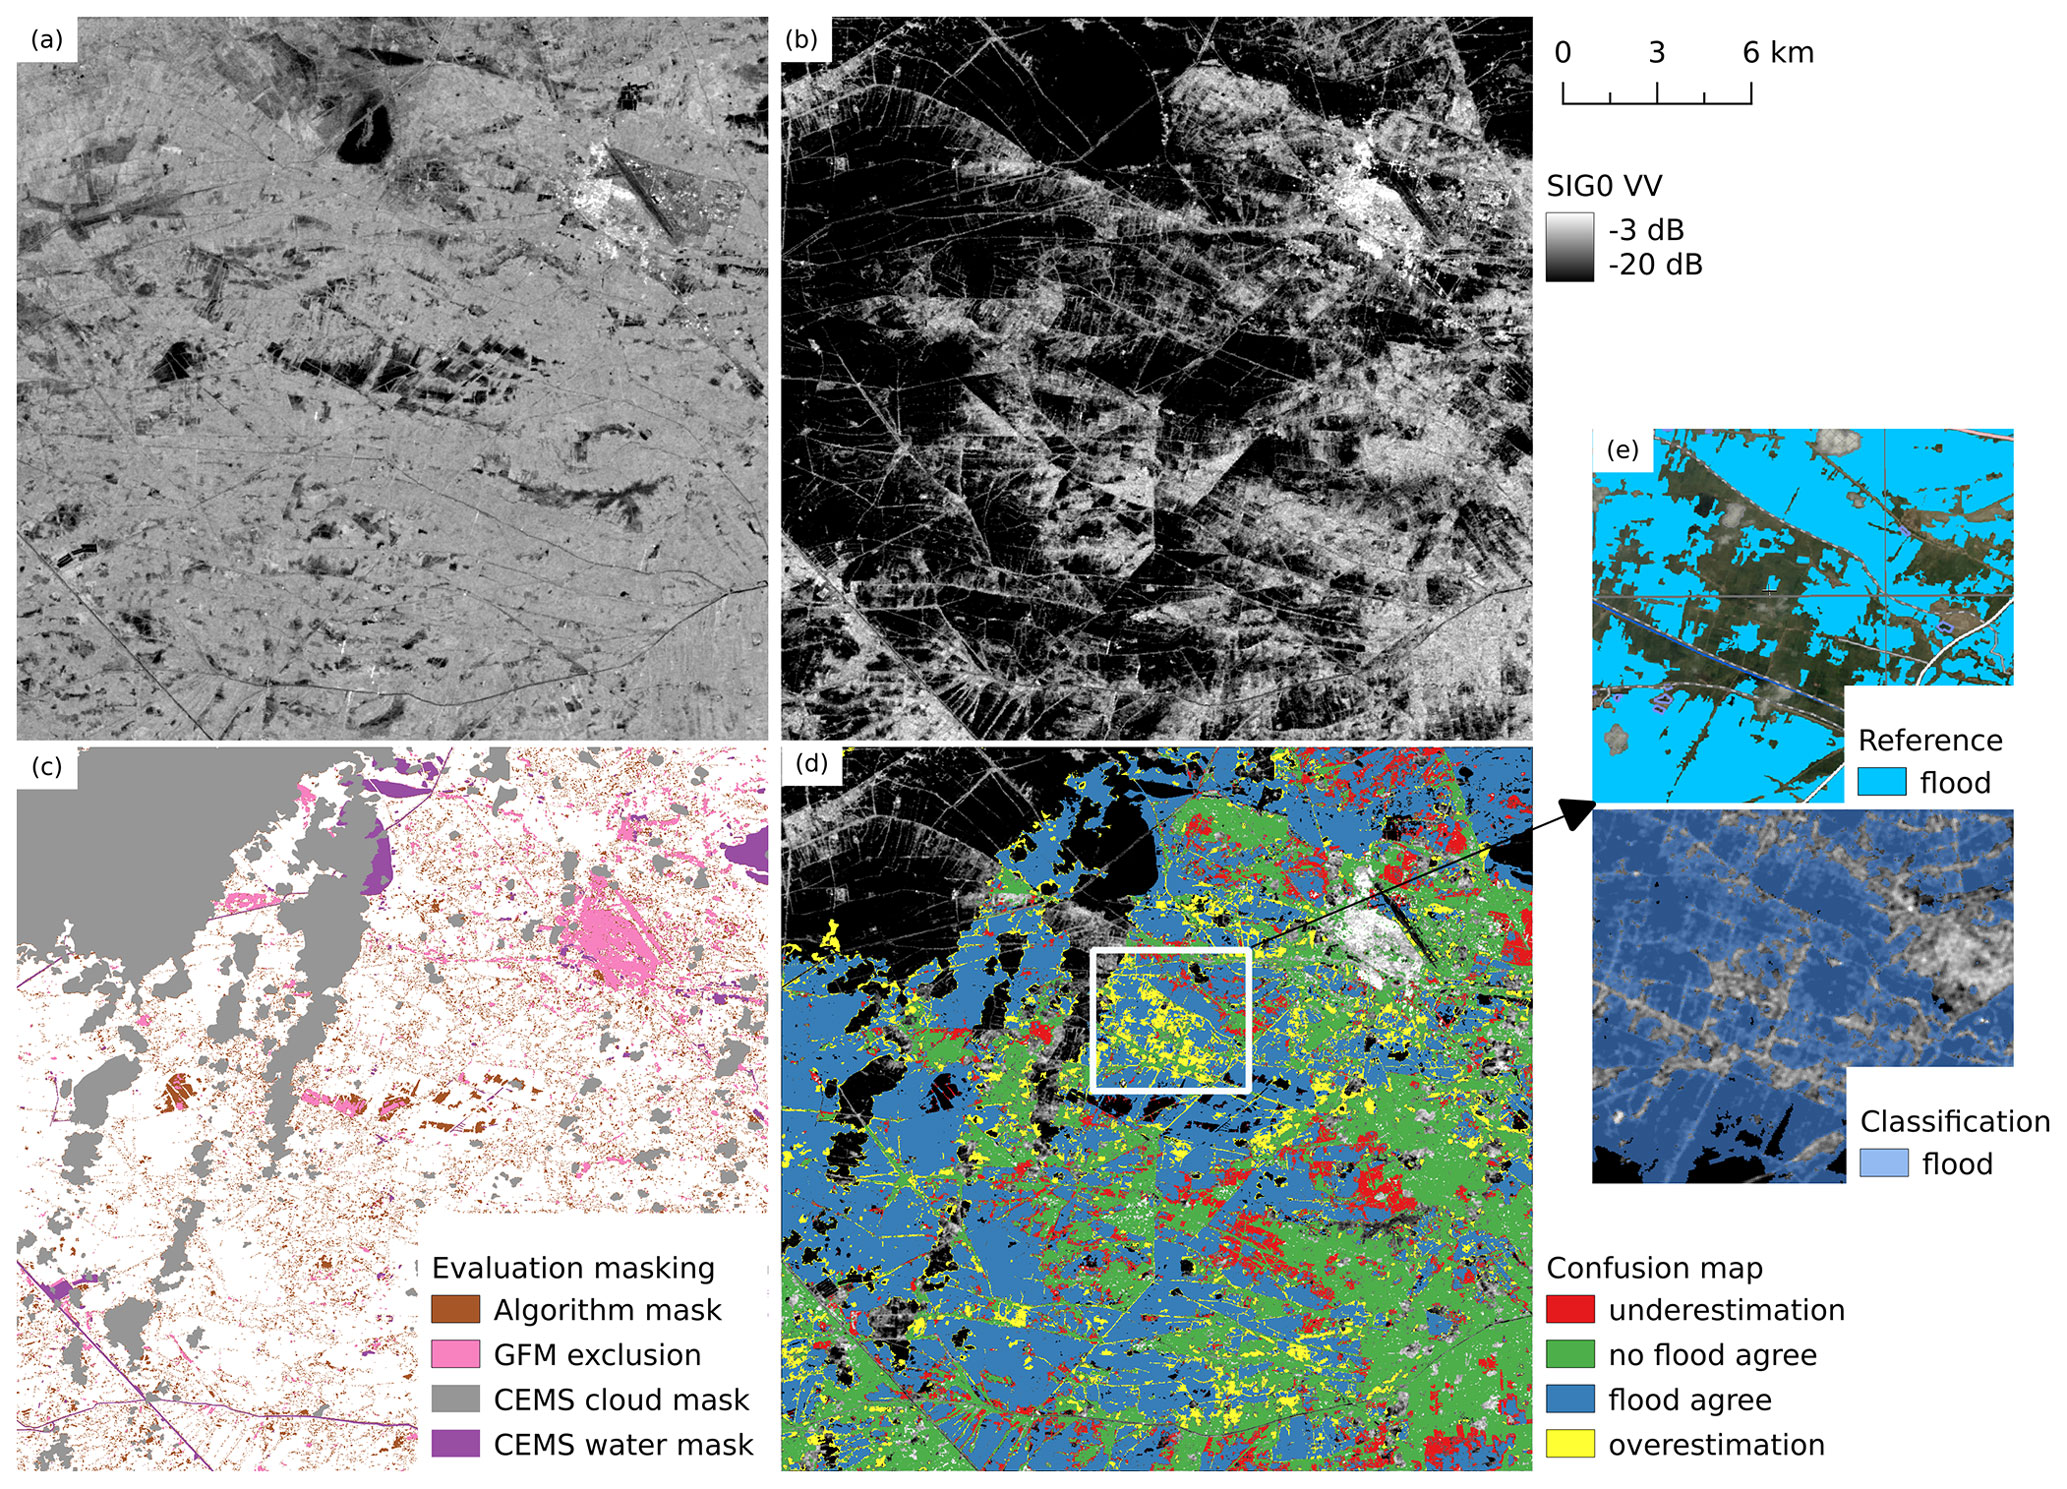
Figure 4Evaluation for AOI Jacobabad (reference: Copernicus Emergency Management Service (https://emergency.copernicus.eu/mapping/, last access: 27 September 2022), [EMSR629] Jacobabad: Delineation Map, version 1). (a) Expected backscatter from the harmonic model. (b) SIG0 VV observation from 30 August 2022. (c) Masked areas in evaluation. (d) Confusion map. (e) Comparison of reference (subset of Fig. 3) and algorithm result.
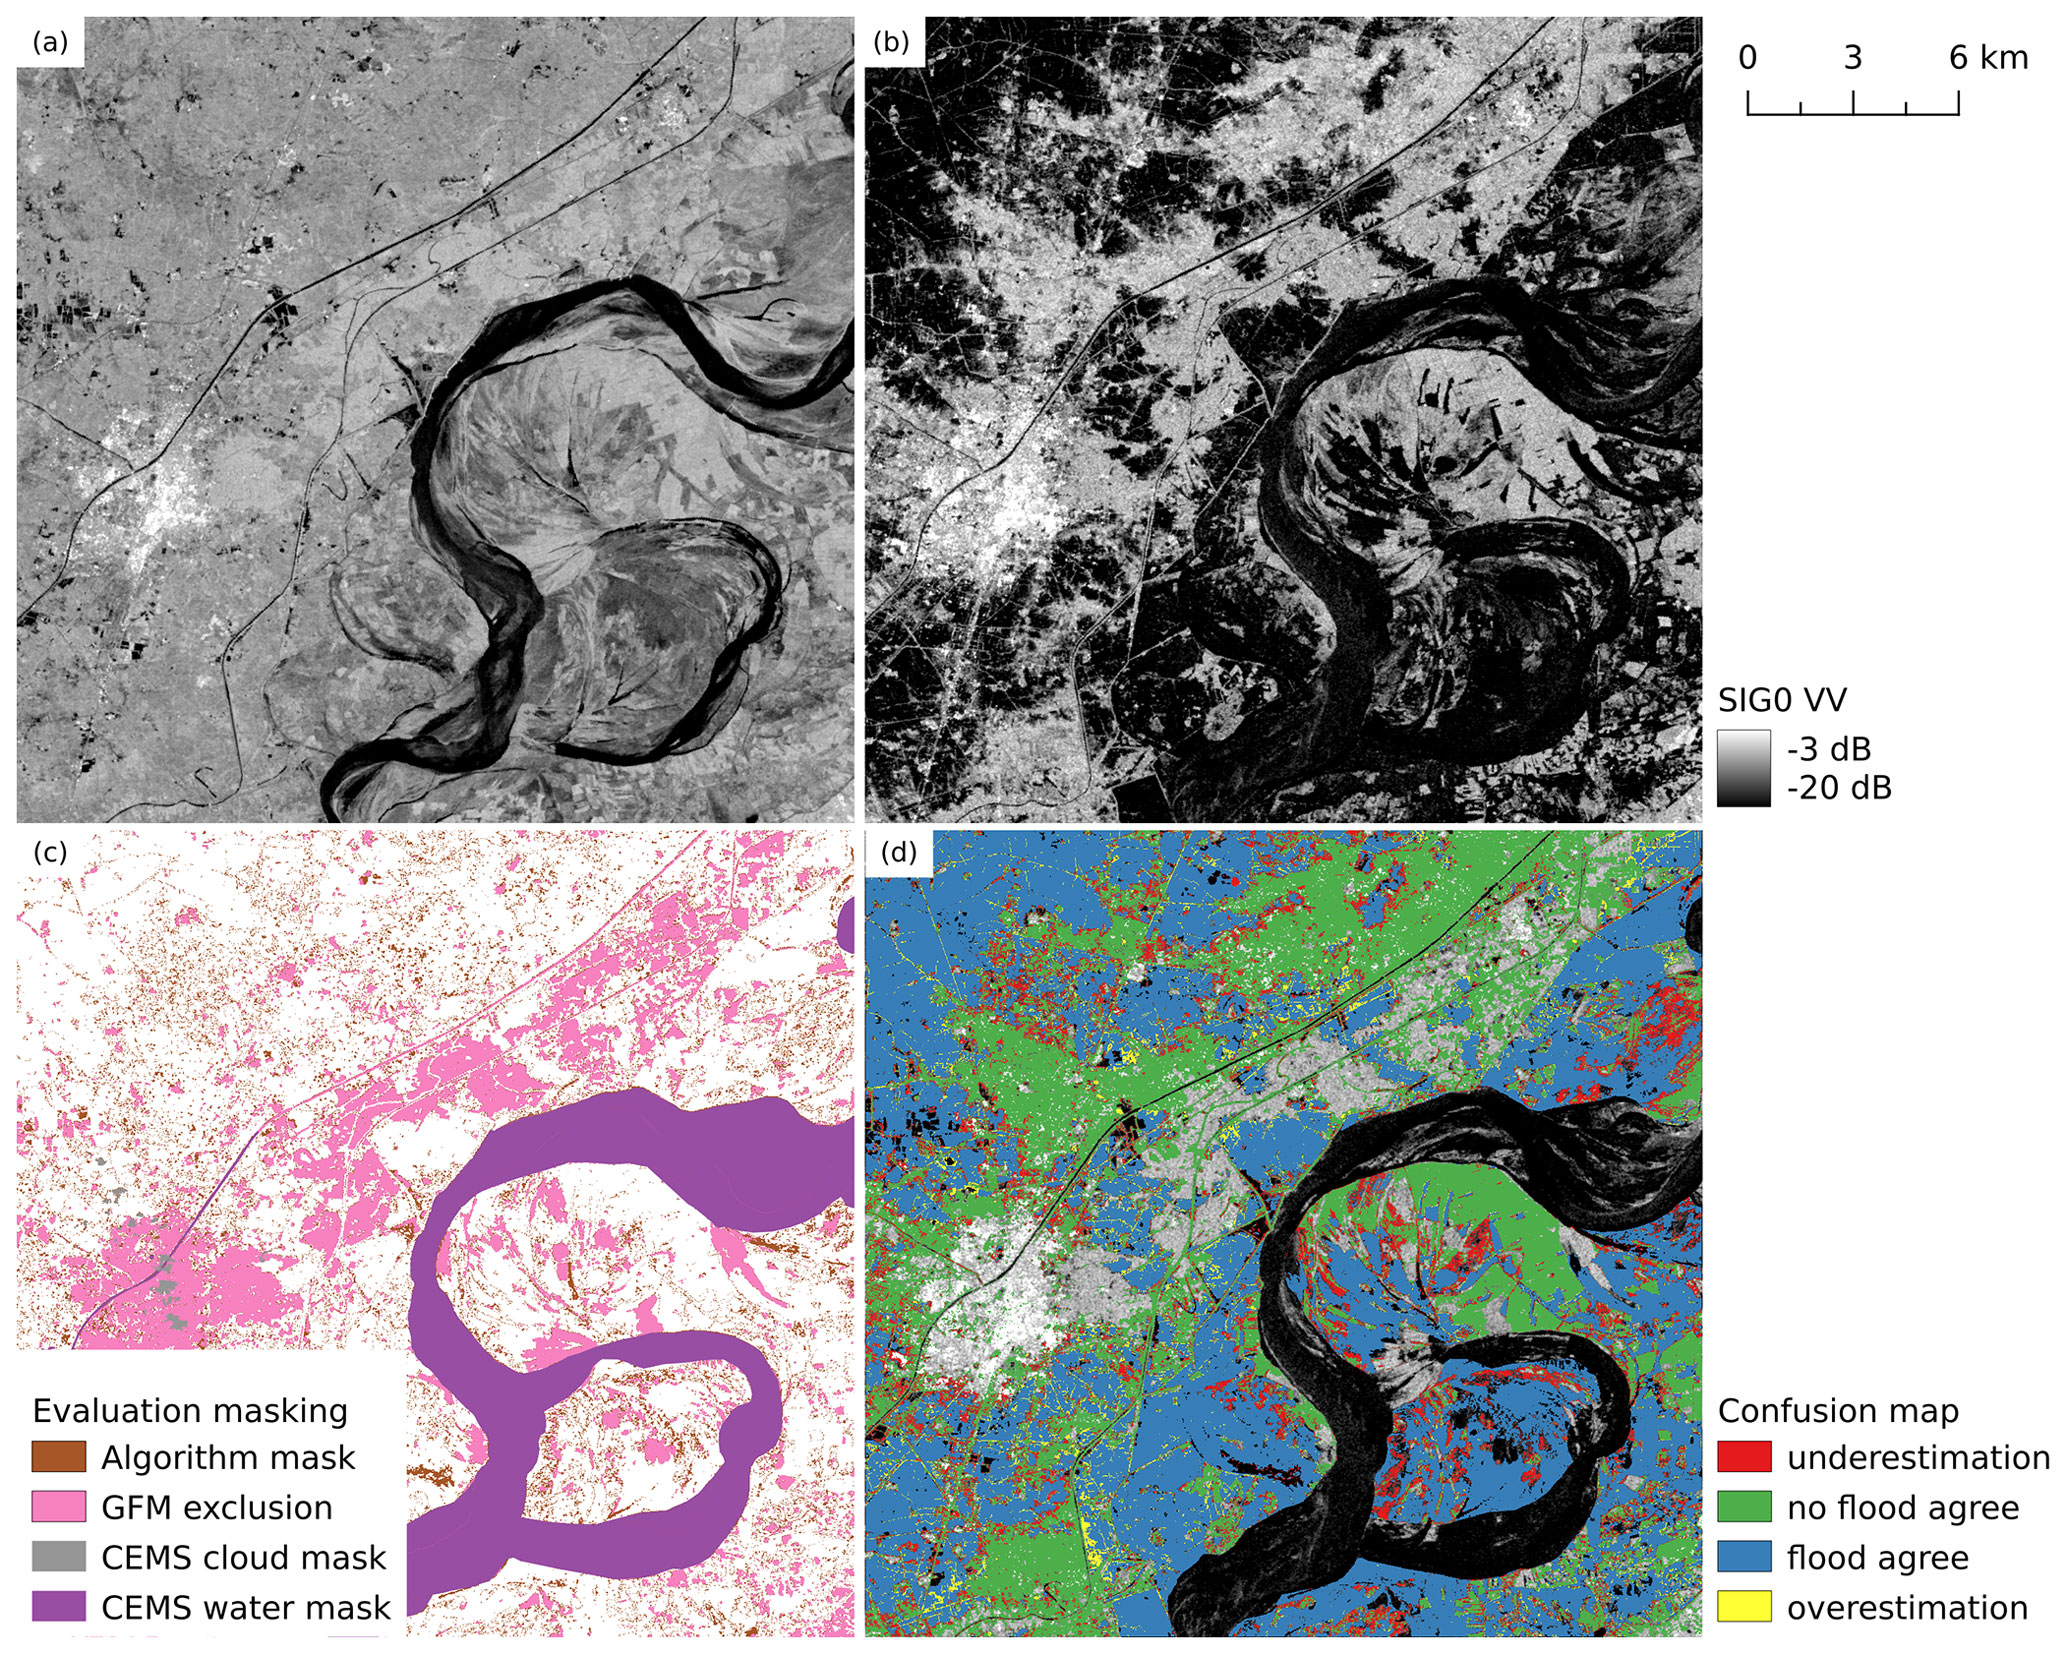
Figure 5Evaluation for AOI Larkana (reference: Copernicus Emergency Management Service (https://emergency.copernicus.eu/mapping/, last access: 27 September 2022), [EMSR629] Larkana: Delineation Map, version 2). (a) Expected backscatter from the harmonic model. (b) SIG0 VV observation from 30 August 2022. (c) Masked areas in evaluation. (d) Confusion map.
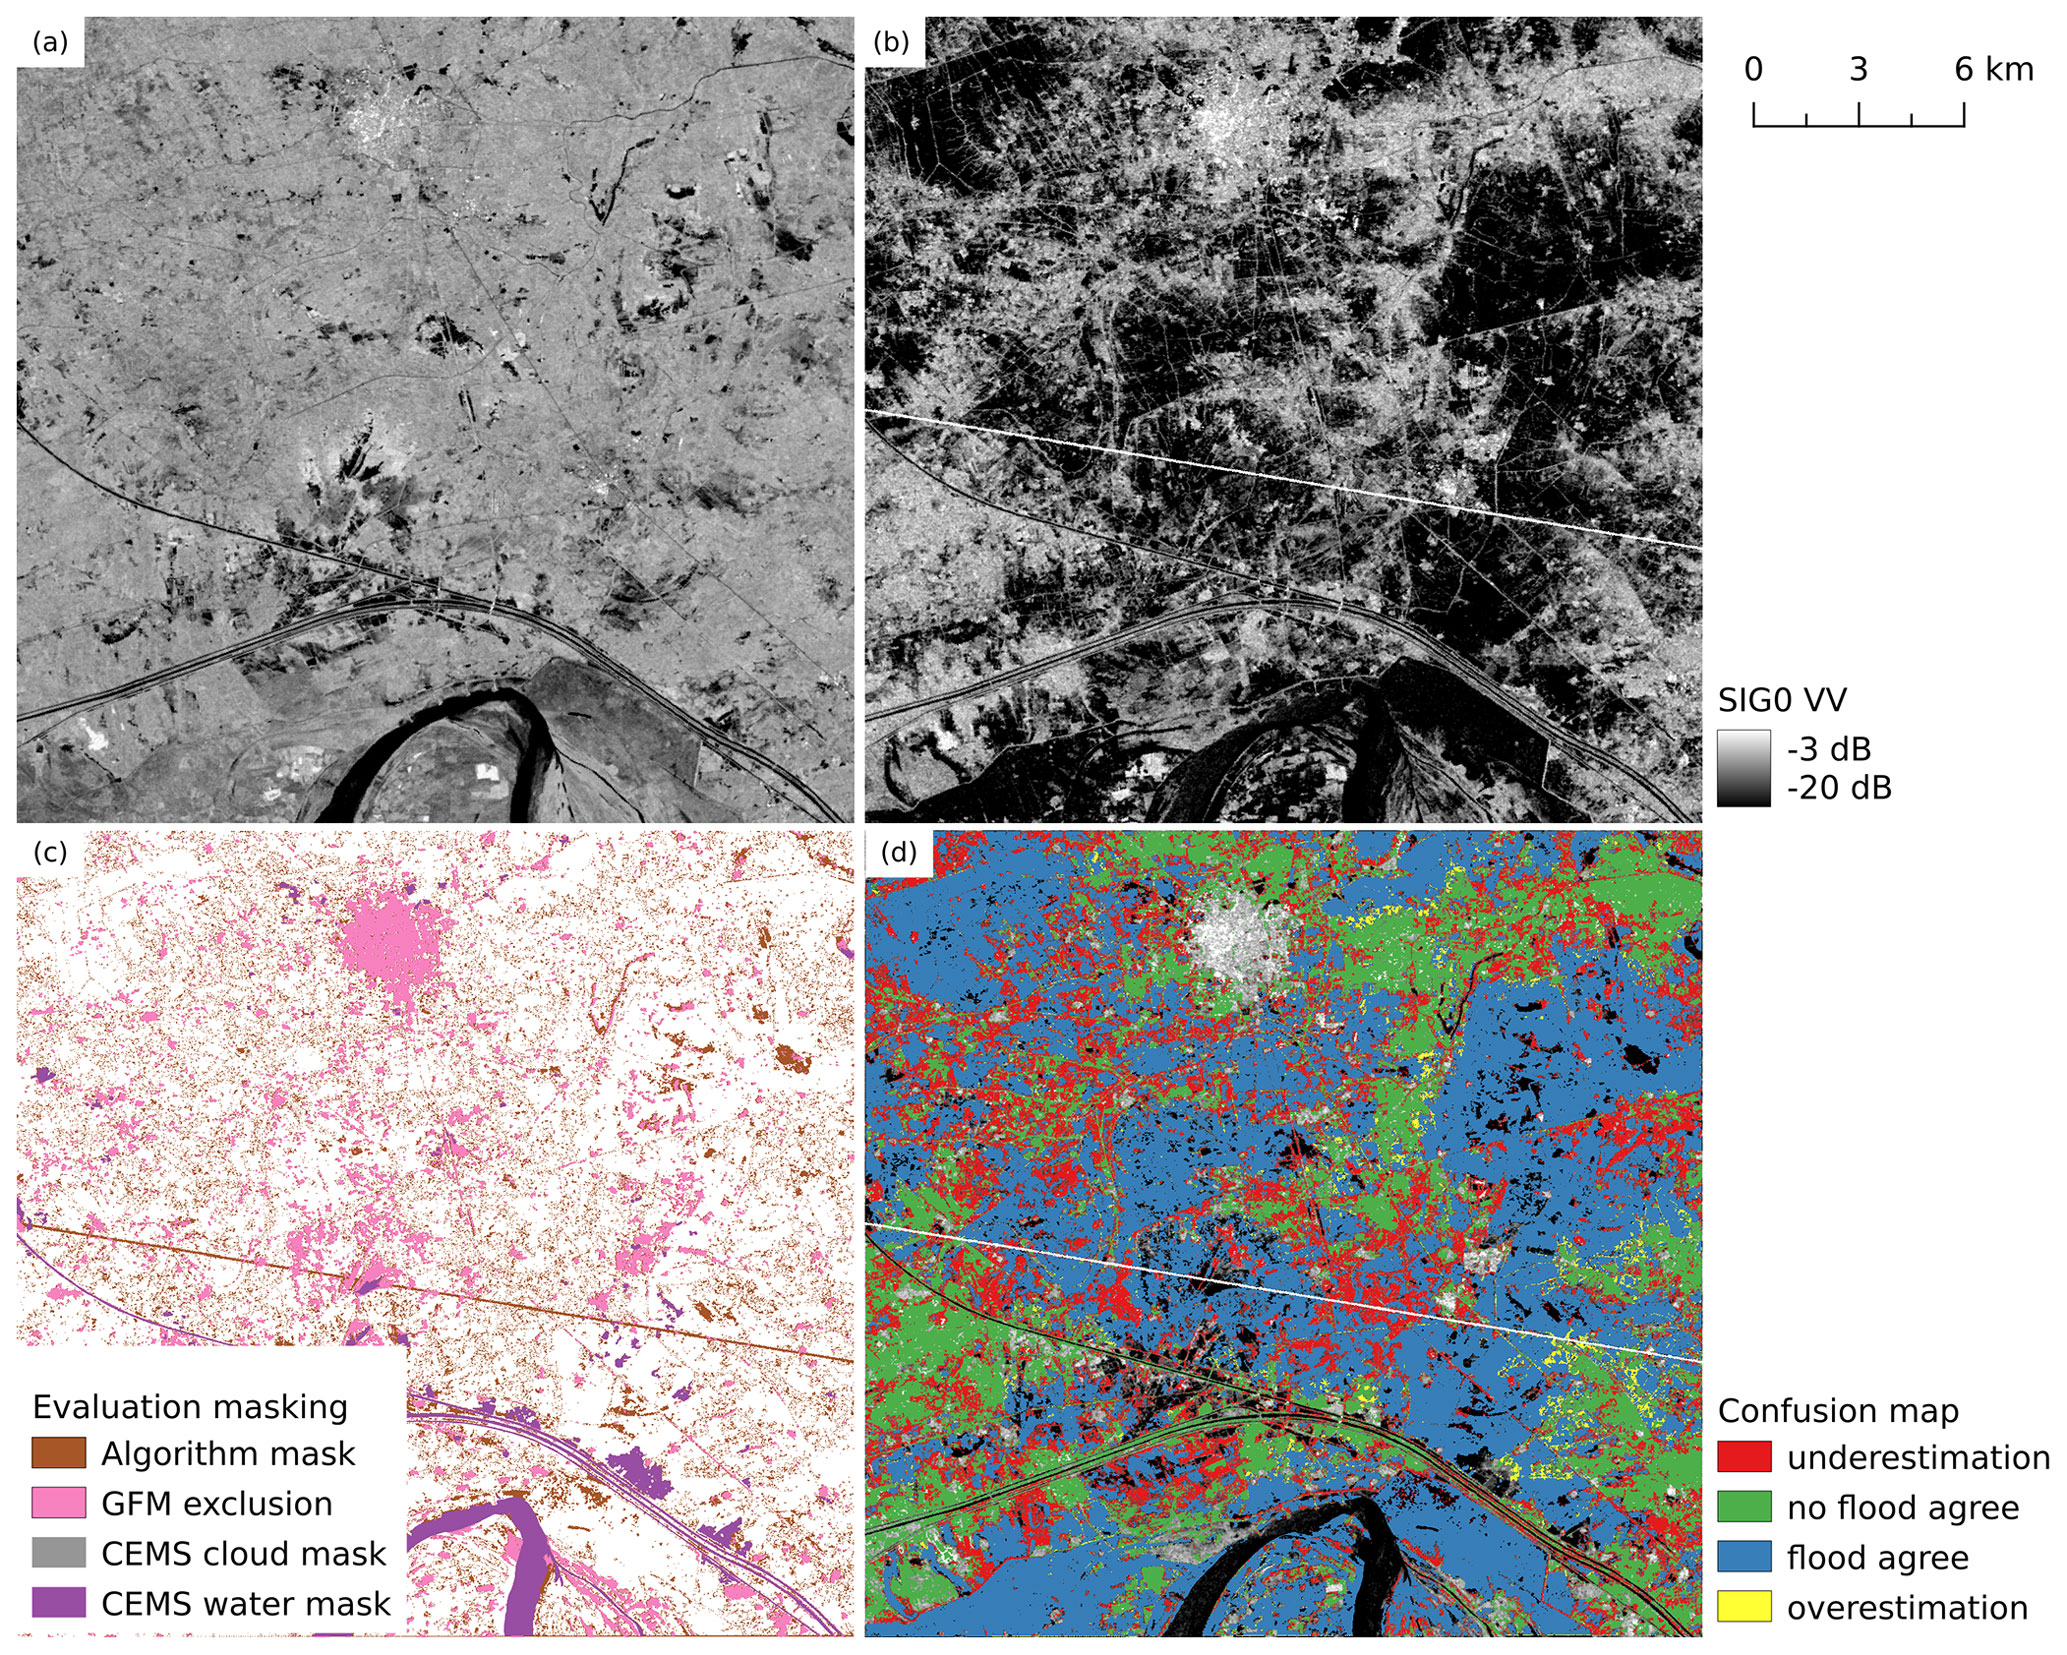
Figure 6Evaluation for AOI Shikarpur (reference: Copernicus Emergency Management Service (https://emergency.copernicus.eu/mapping/, last access: 27 September 2022), [EMSR629] Shikarpur: Delineation Map, version 1). (a) Expected backscatter from the harmonic model. (b) SIG0 VV observation from 30 August 2022. (c) Masked areas in evaluation. (d) Confusion map.
Underestimation of the flood surface can be seen in all three AOIs. This systematic difference between our algorithm's result and the reference can be explained by the time difference between the Sentinel-1 and SPOT observations. As the flooded area was still growing at this point in time, the later observation from SPOT is expected to show a larger extent. As a consequence, an underestimation is detected in the Sentinel-1 flood mapping result.
While the detected differences in Larkana (Fig. 5) and Shikarpur (Fig. 6) mostly correspond to the mentioned underestimation, the confusion map of AOI Jacobabad (Fig. 4d and e) additionally shows some areas of overestimation. In that area, the corresponding Sentinel-1 observation (Fig. 4b) shows low backscatter and closely matches the flood signature. So it is either a false classification of the SPOT image or an unforeseen land cover change being confused with flooding. The city of Jacobabad is located in Pakistan's province of Sindh, where the economy is based on agriculture (cotton, wheat, rice, and sugarcane), as well as on cement production (The Editors of Encyclopaedia, 2023a). Such economic activities can result in fast land cover changes. An example can be seen in Fig. 4a, where the expected backscatter of the no-flood signature includes some box-shaped low-backscatter areas. These areas could be related to rice cultivation. We can also speculate that the flood surface changed between the two satellite observations as a result of the manipulation of local dams in reaction to the flood threat.
In the northwestern part of the AOI Jacobabad (Fig. 4d) low backscatter is detected but is not analysed within the evaluation due to cloud coverage. While the SAR-based approach provides details on the flood extent of this area, the optical map needs to be masked due to cloud coverage (see Fig. 3). The cloud mask and other applied masks are shown in Fig. 4c.
4.2 Statistical layers
Overall, the area observed by Sentinel-1 and not masked by the algorithm accounts for 205 287 km2. The flood mapping results of 14 timestamps are summarised into specific statistical layers showing the flood occurrence and progress.
High-resolution remote sensing sensors observe the ground typically from low-Earth orbit, scanning the surface in stripes along the orbital movement. Hence, they monitor at one time a comparatively large but delimited area, and large areas are not simultaneously scanned as a whole but scanned within multiple orbit overpasses. A large flood might not be in the scope of one single satellite overpass, and the individual scans capture the flood at different times of its progression. In the case of the Pakistan flood, the descending relative orbit 78 of Sentinel-1 covers the majority of the study area at a single overpass. Consequently, this (12 d repeating) relative orbit is well suited for analysing the temporal progress of the flood event. The results of the four overpasses during the study's time period are shown in Fig. 7. Starting from 18 August the flood surface increased until it reached its maximum on 30 August. The next observation of this relative orbit on 11 August shows a decrease in the flood surface in the north, while the flood grew in the south next to the river. On 23 August, the flood retreated in the north and the south. Due to the snapshot type of information provided by satellite data, the maximum of the flood can not be determined precisely, but a well-informed estimate can be given.
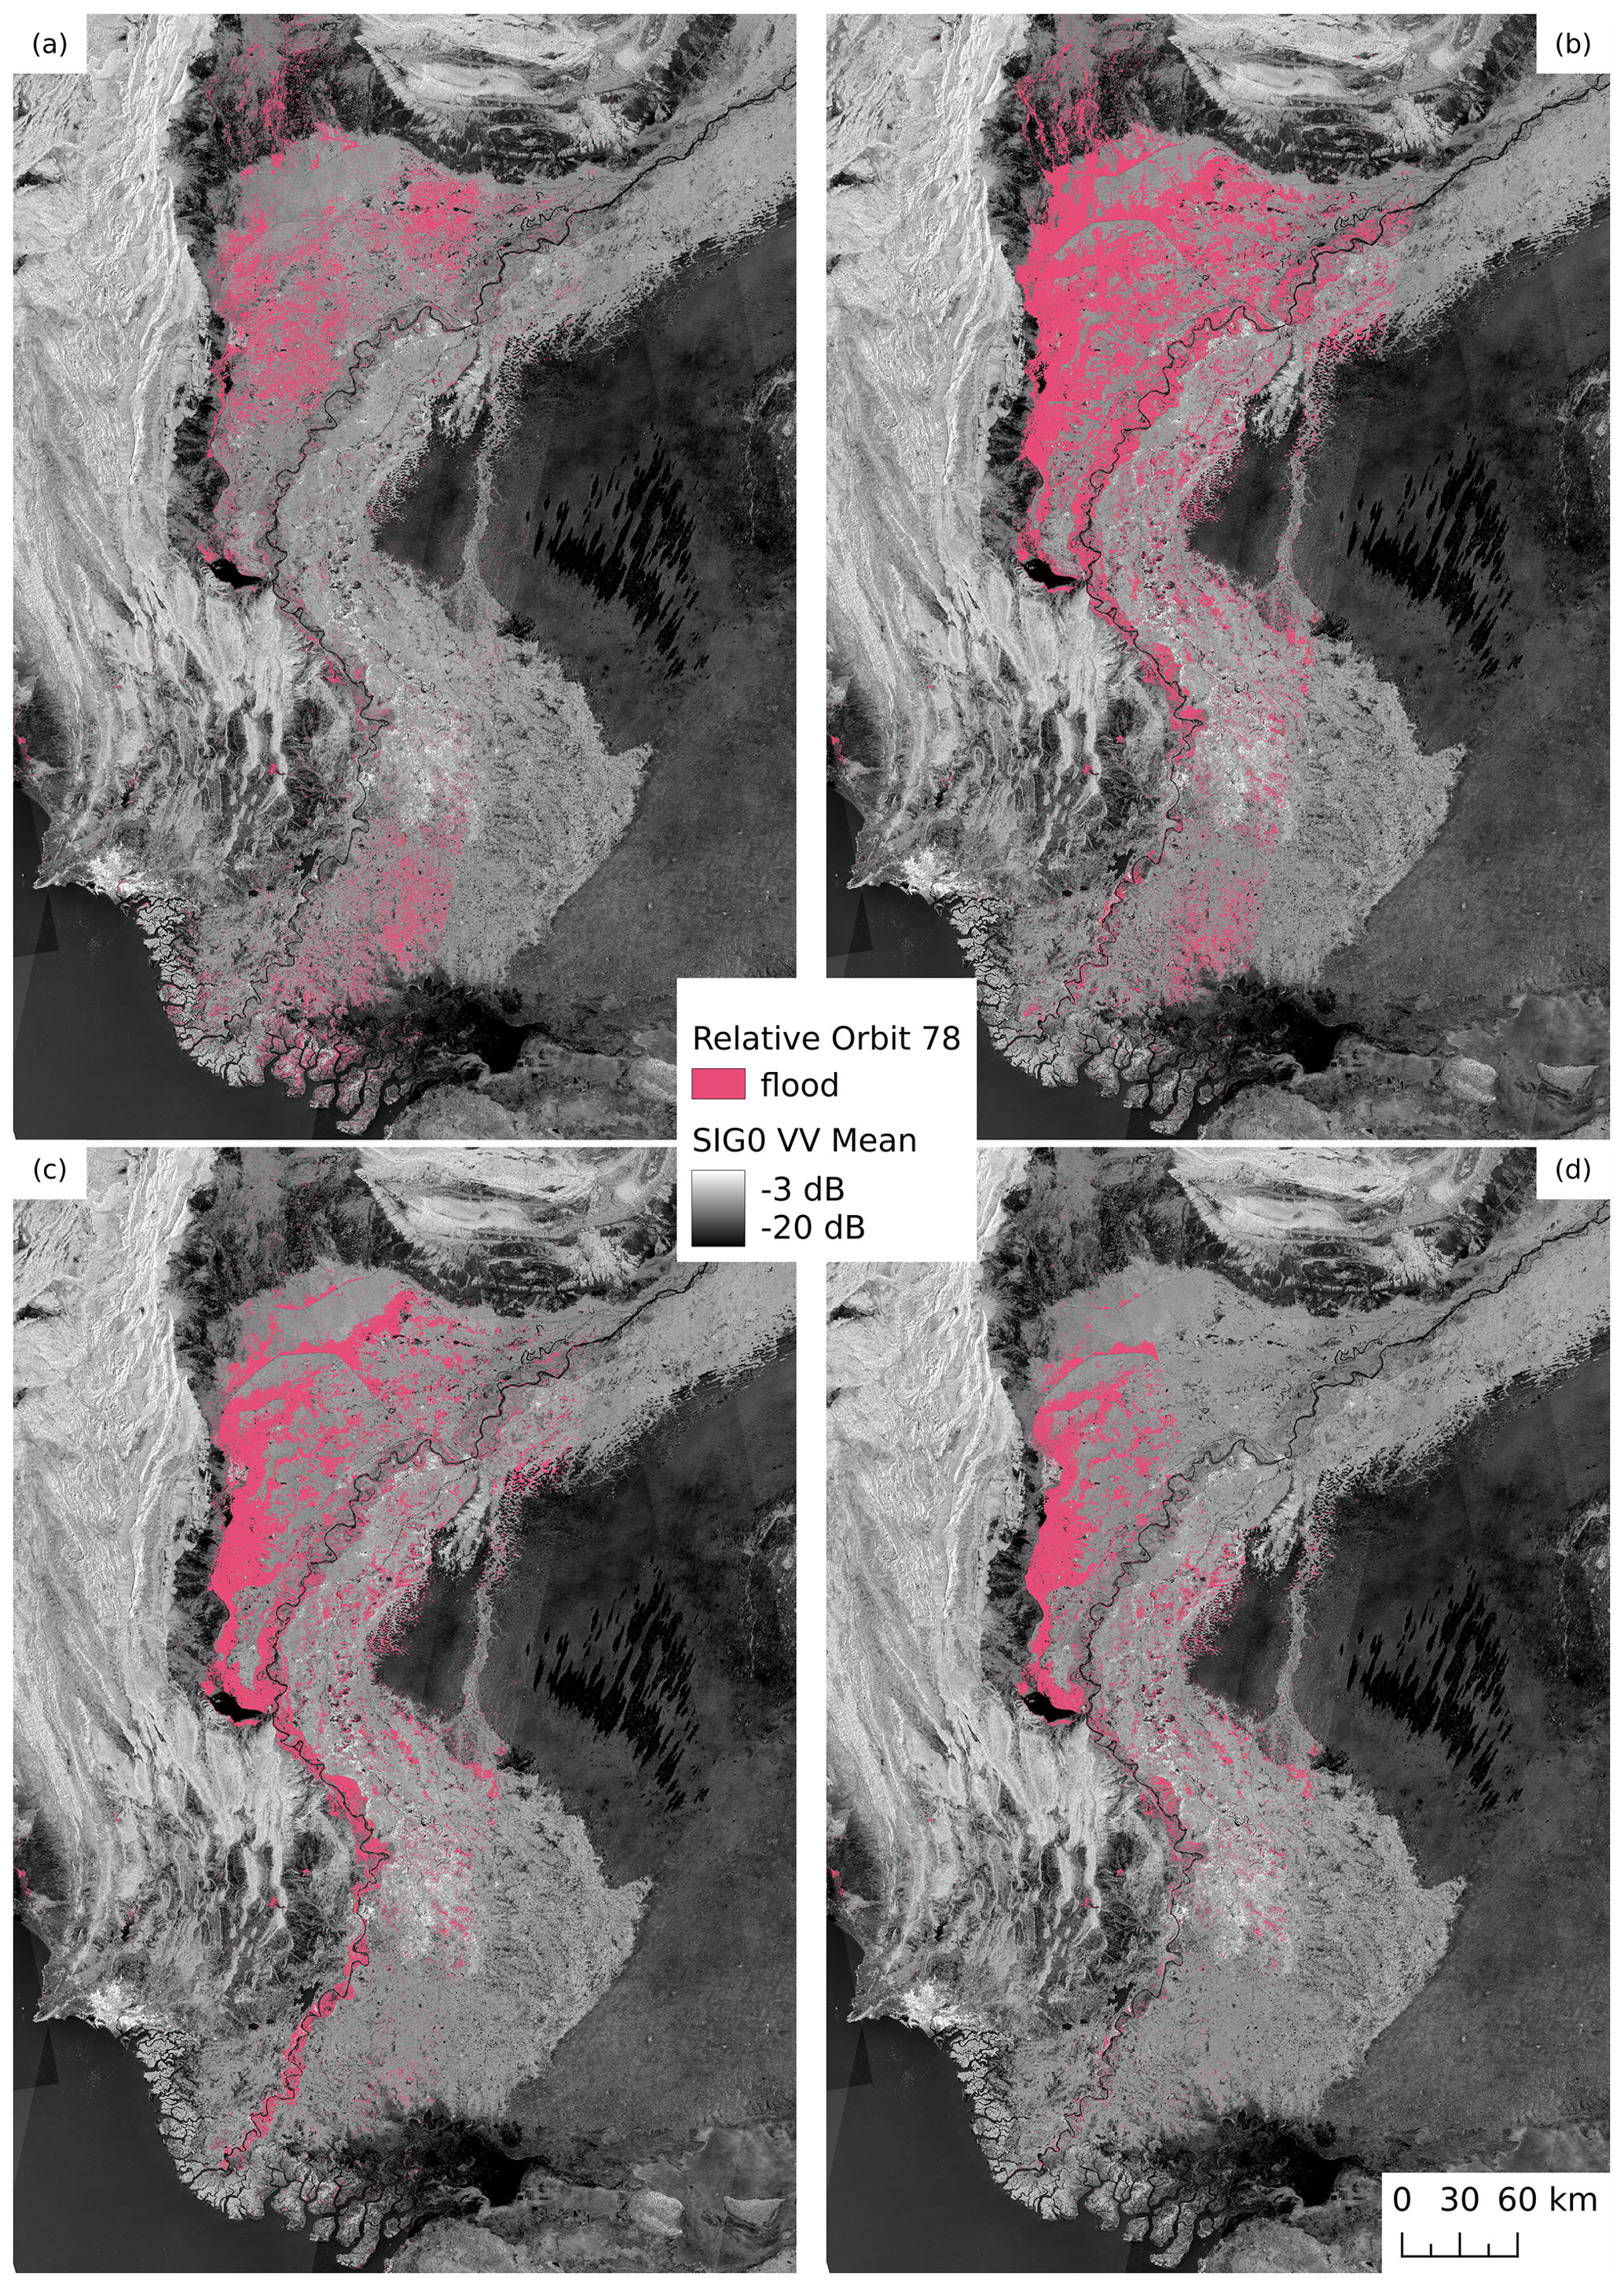
Figure 7Progress of the flood as seen from Sentinel-1 relative orbit 78 on top of the Sentinel-1 SIG0 VV mean image (2019–2020). (a) 18 August 2022 with a flooded area of 8448 km2. (b) 30 August 2022 with a flooded area of 18 047 km2. (c) 11 September 2022 with a flooded area of 12 013 km2. (d) 23 September 2022 with a flooded area of 6331 km2.
A similar progress can be observed in Fig. 8, which presents the time of a pixel being first flooded as the day of year (DOY). A unique feature of satellite-derived products is the possibility to perform this kind of spatio-temporal analysis and to gather large-scale information about an emergency situation. The flood started in the blue areas mainly in the northern part and continued towards the south, where more orange areas are visible. Here, all available relative orbits are combined, which allows for an analysis comprising data from more timestamps. However, some artefacts related to the multi-orbit approach can be seen in the figure. Since the whole area is not always covered by one overpass, Fig. 8 shows some discontinuous patterns in the flood aggregation. This issue can be seen in the northeast, where the flood coloured in green is captured earlier than the close-by orange area, resulting in a linear cut.
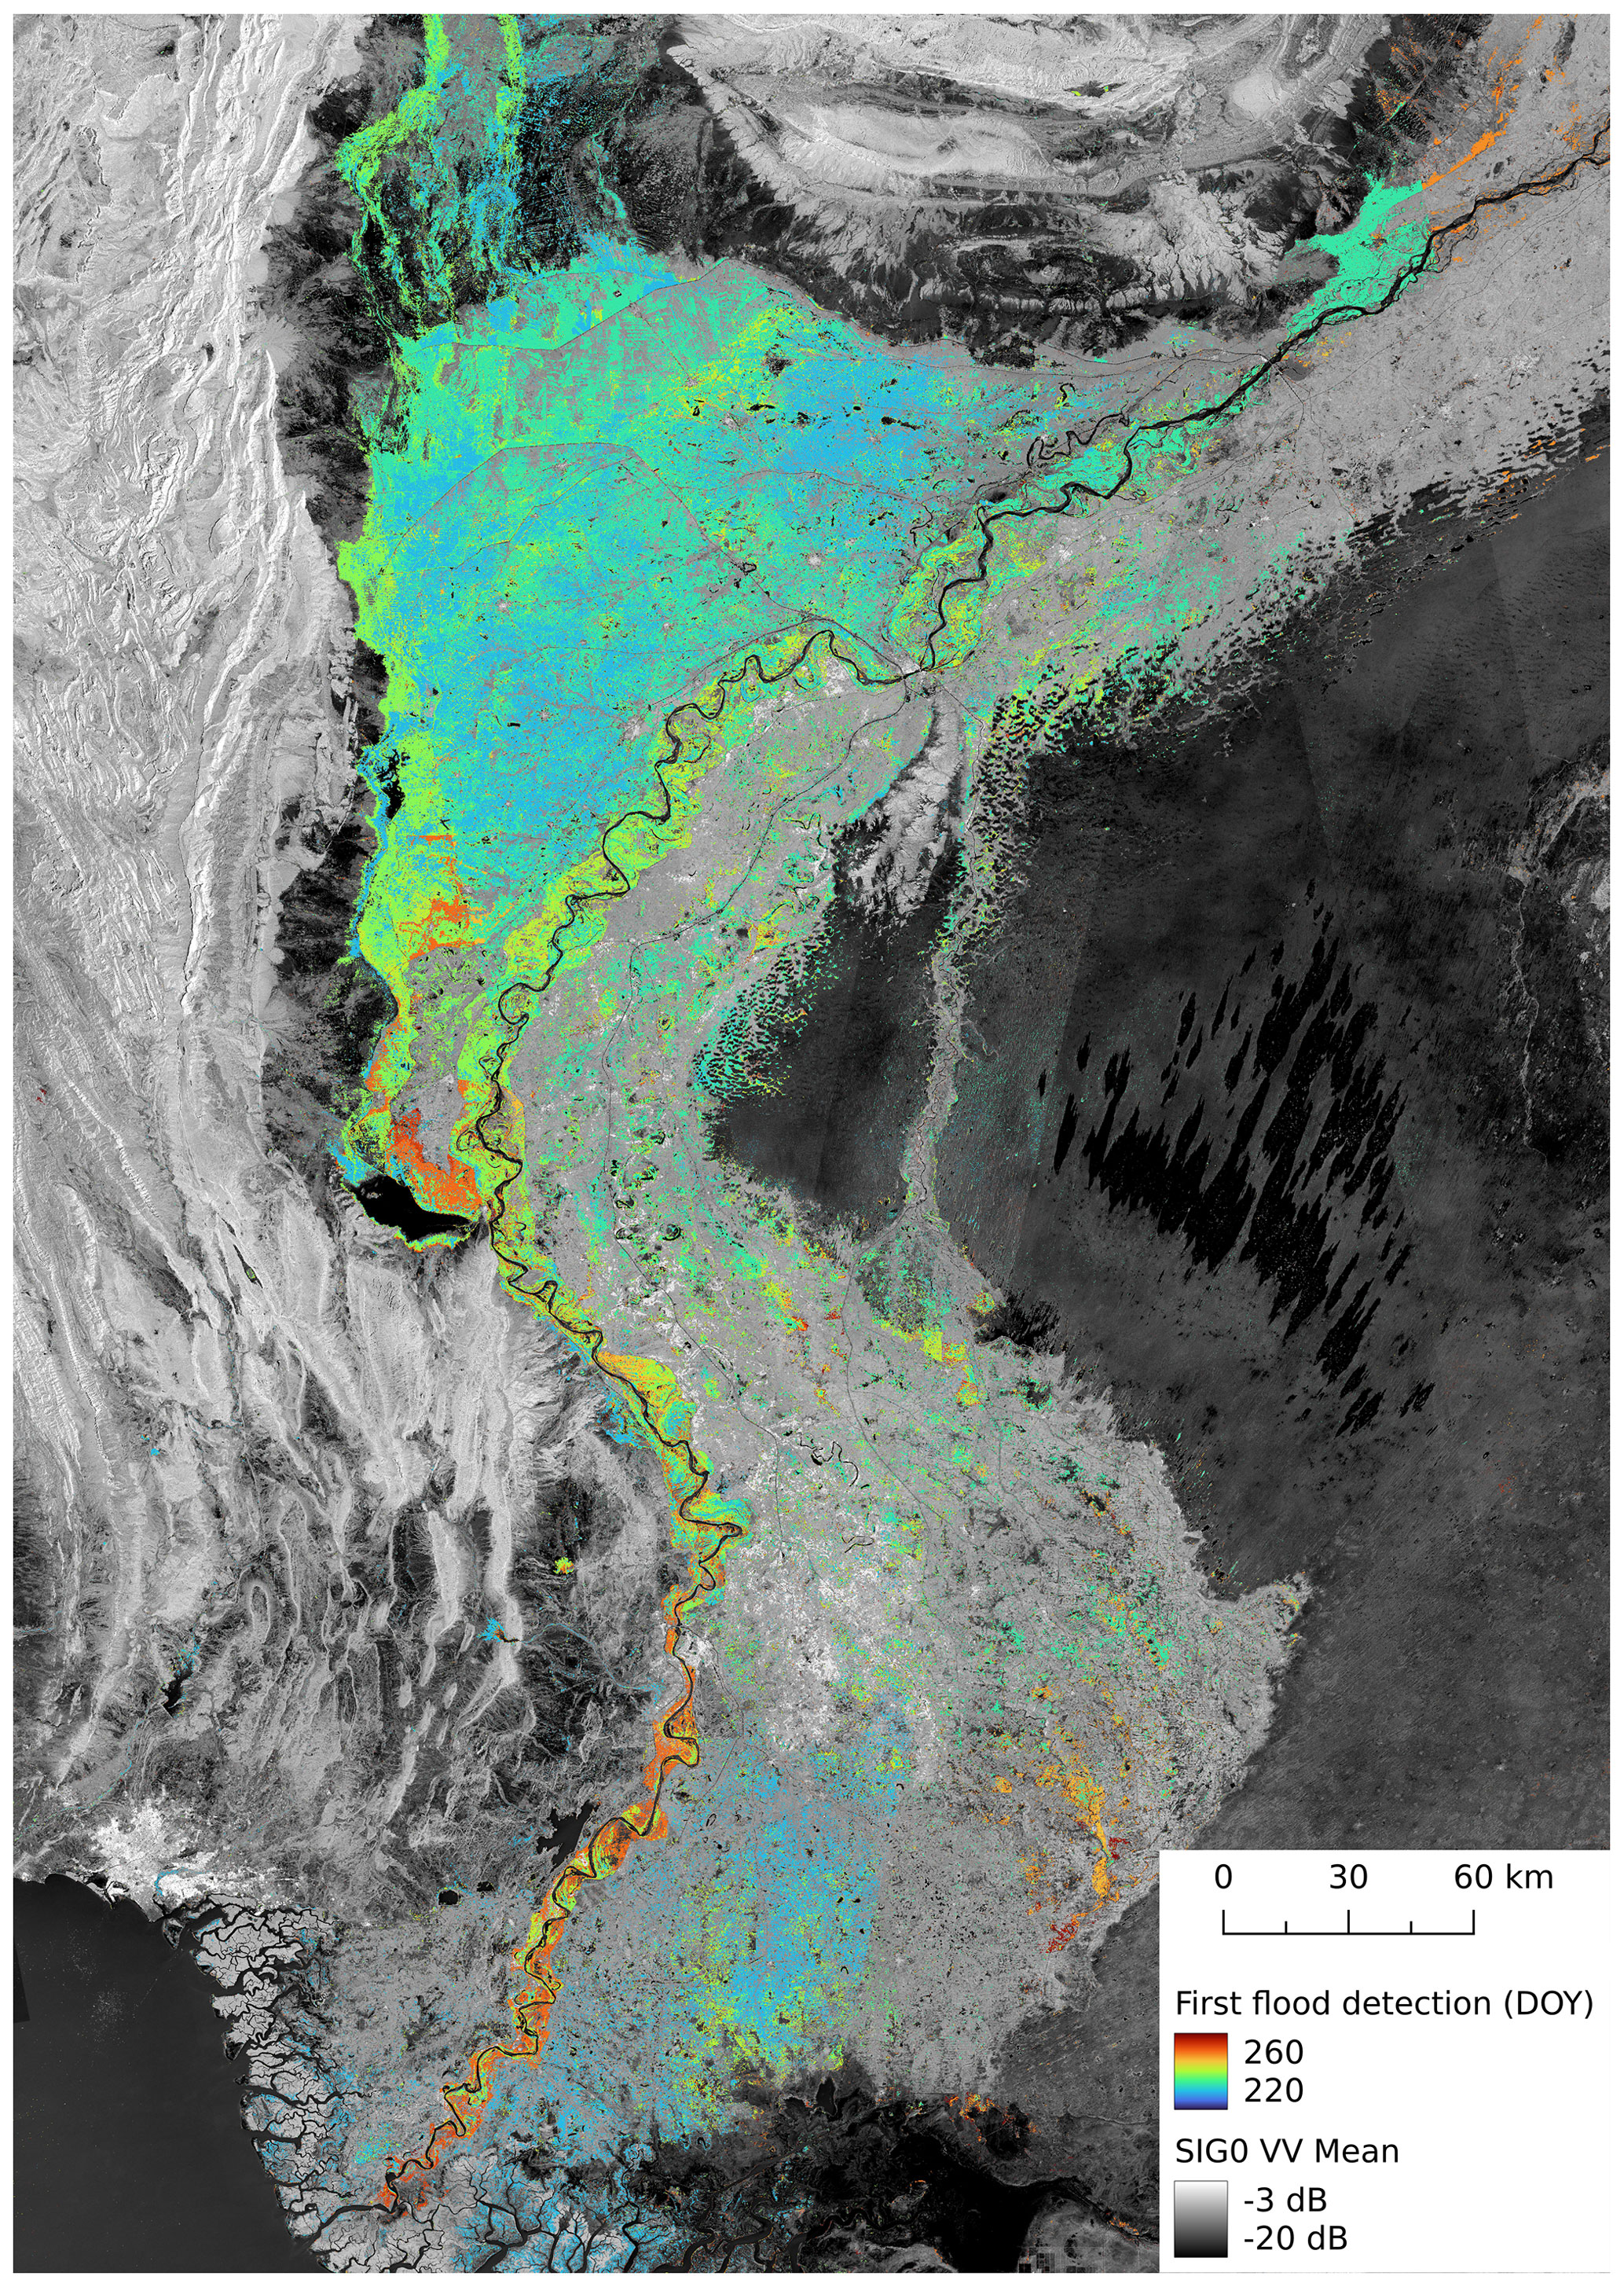
Figure 8Flood-affected area colour-coded with the time of the first flood detection as day of year (DOY) on top of the Sentinel-1 SIG0 VV mean image (2019–2020).
Figure 9 shows the flood frequency for the study's time period (10 August to 23 September 2022) as percentage values. Since the flood frequency is represented as the percentage of flood detections from the number of observations, the number of orbits over an area has a limited impact and the orbit effects of Fig. 8 are not visible. The area, which is continuously flooded during the study's time period (= 100 %), corresponds to 5479 km2. Analysing the pixels classified as flood at least once during the time period (>0 %) results in an overall affected area of 30 492 km2, which is close to the total area of Belgium. The vast majority of the flooded area is located close to the Indus River. This matches reports of previous flood events in Pakistan (Gaurav et al., 2011), where the extreme run-off caused the flood in the southern parts of the country. Furthermore, our evaluation (see Sect. 4.1) is performed within close distance to the river as well and confirms the estimated flood extent. In the background of Fig. 9 the average backscatter of the years 2019 and 2020 is presented. The area next to the Indus River is dominated by cropland but includes tree cover and built-up areas as well. Considered together, this area shows a higher backscatter in the mean image. In the east of the map, the desert Thar is visible, which to a great part features a general low water-like backscatter. While the exclusion mask removes the majority of low-backscatter areas, yearly rotating crop types or varying growing seasons challenge the flood mapping over agricultural areas. Especially the small individual flood areas need to be treated cautiously when being used in further studies.
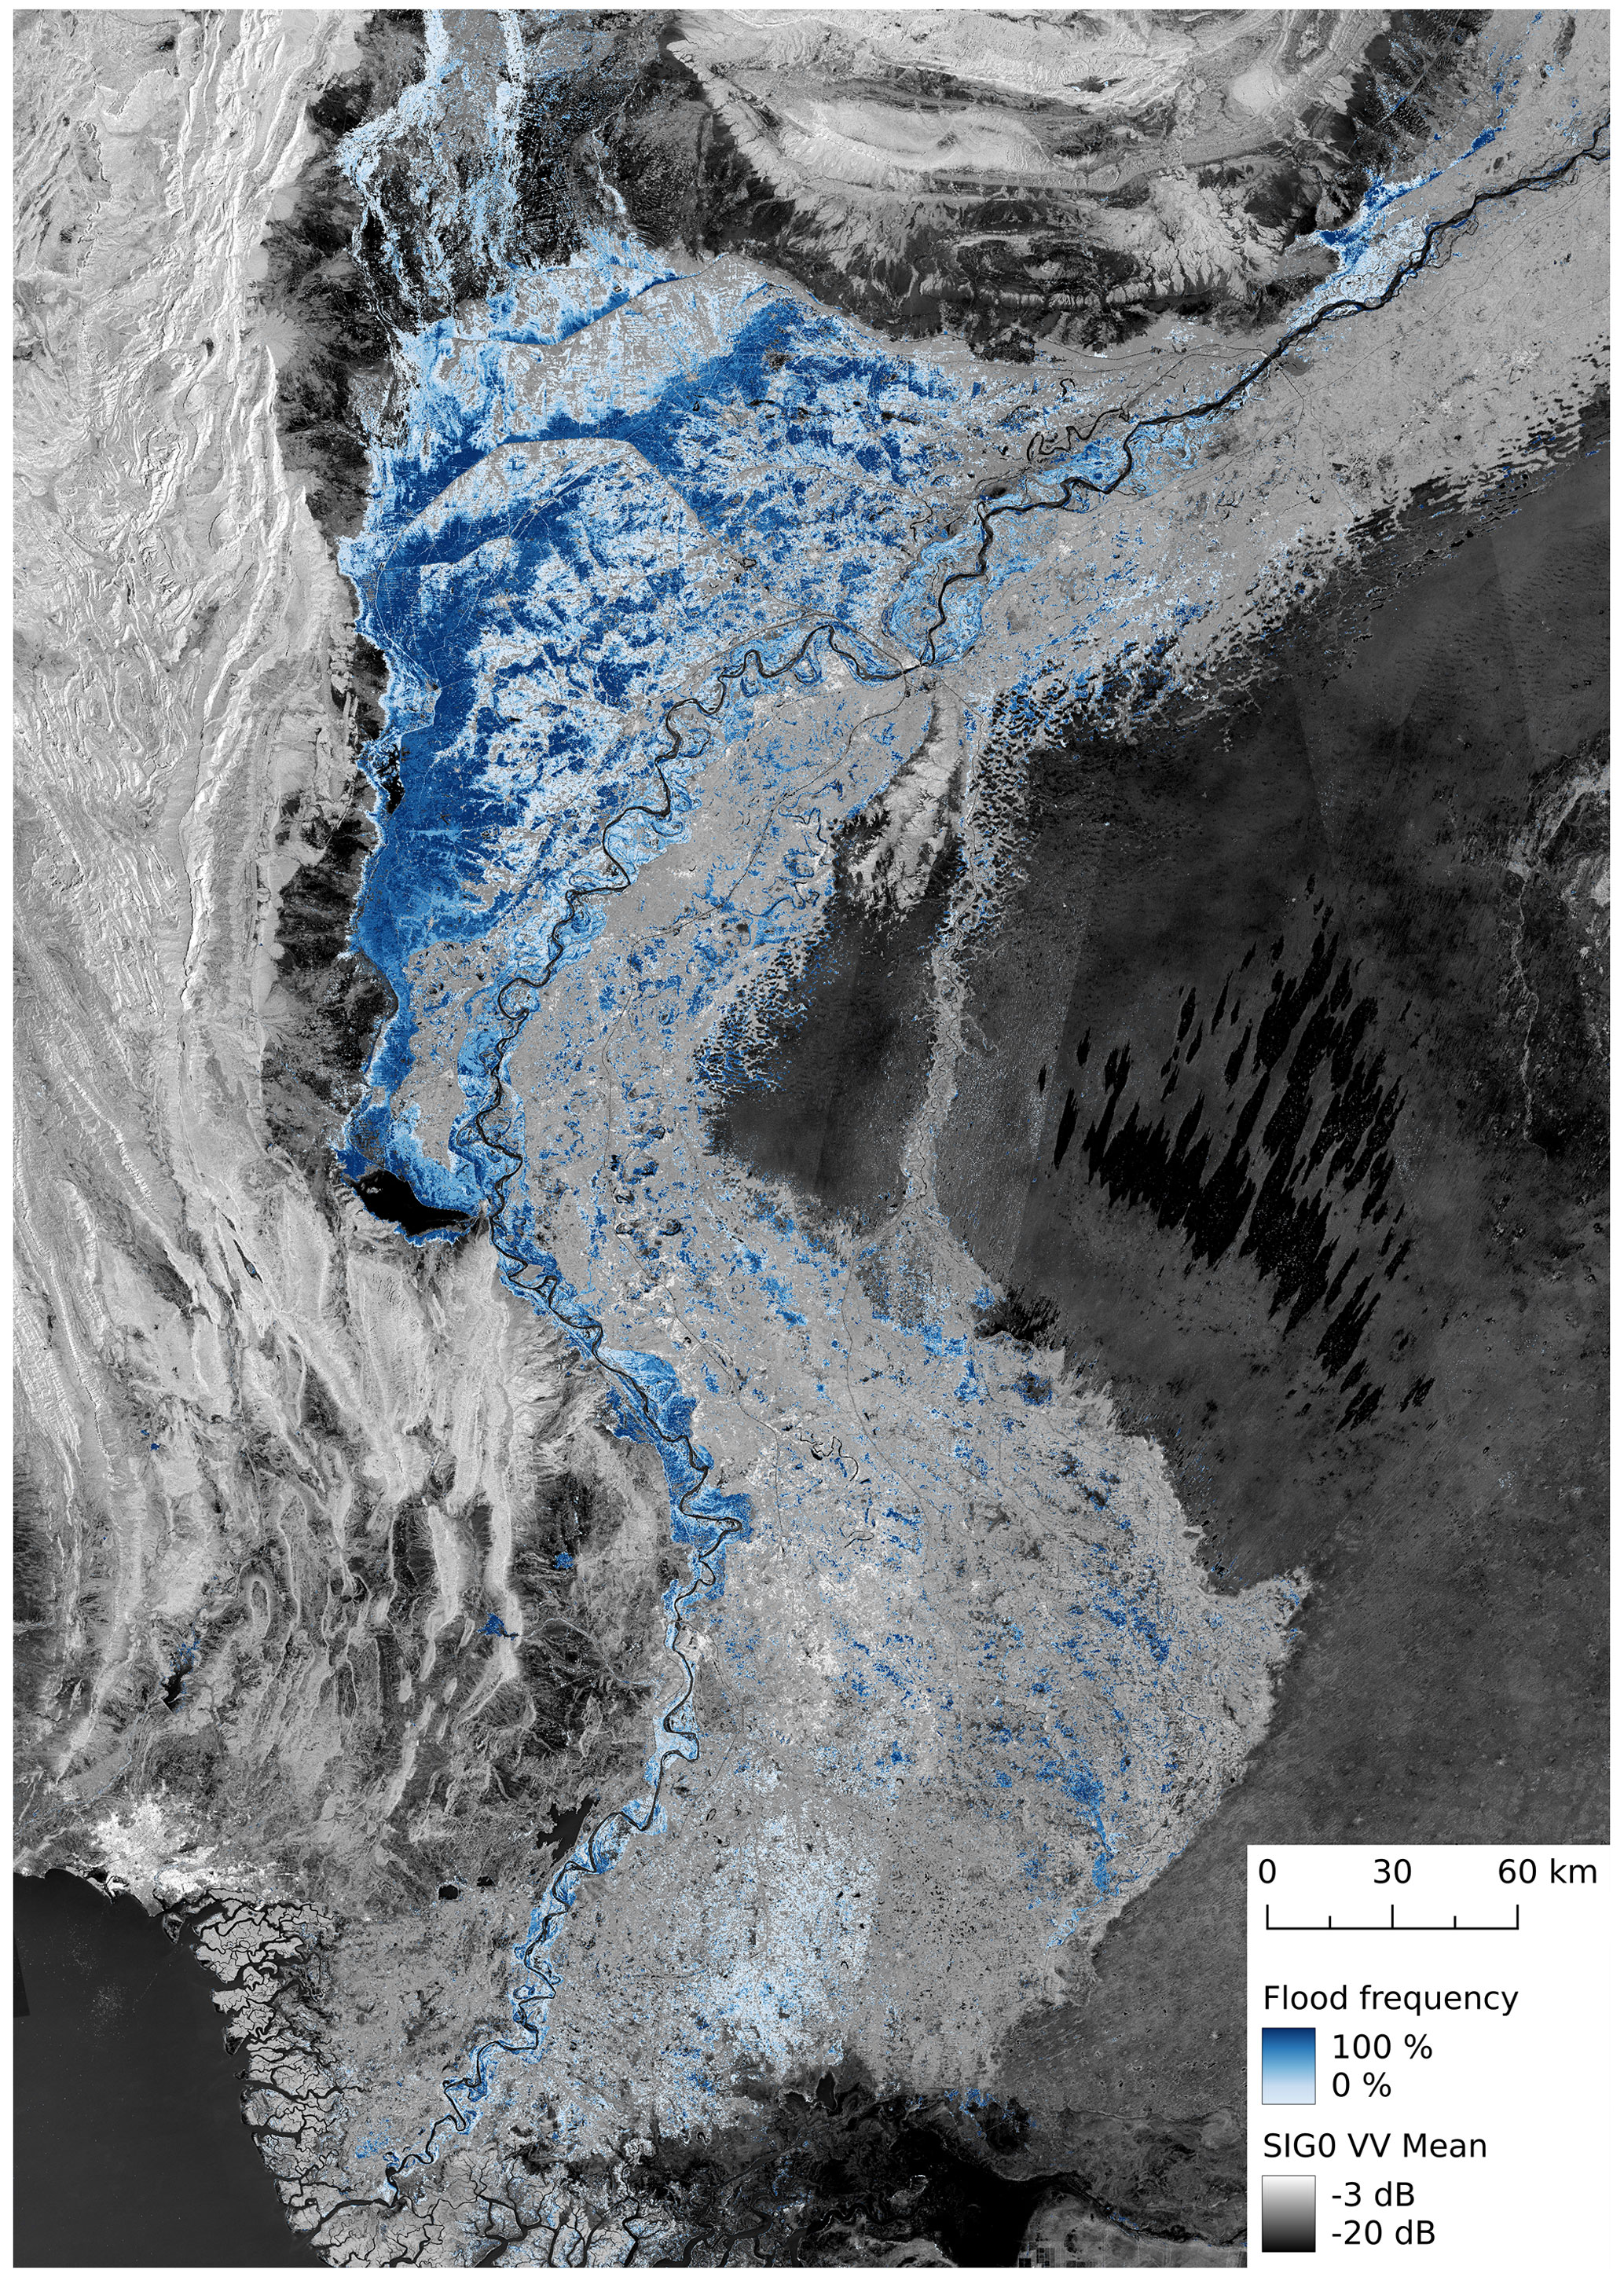
Figure 9Flood frequency of the study's time period (10 August to 23 September 2022) on top of Sentinel-1 SIG0 VV mean image (2019–2020).
This study shows the potential of providing information in near-real-time (NRT) on flood events at large scale, and the retrieved data allow for an estimate of the affected area and the progress of the event. This kind of information is especially valuable to authorities and rescue units, supporting time-critical decisions in situations where ground-based methods are unavailable due to the destruction of infrastructure. Overall, an area of 30 492 km2 has been observed to be affected by the catastrophic Pakistan flood of 2022, which corresponds to about 15 % of the observed area in this study. The flood extent increased from the beginning of the time span on 18 August, grew further until 30 August, and decreased afterwards. The flood extent observed from Sentinel-1's relative orbit 78 on 30 August reached 18 047 km2, while at the end of the time period on 23 September, there is still 6331 km2 flooded.
The above-mentioned statistics were retrieved based on the results of the TU Wien flood mapping algorithm, which utilises Sentinel-1 data to identify flooding on a per-pixel basis. To quantify the performance of the algorithm, an evaluation based on three areas of interest (AOIs) was executed and analysed. The resulting differences between the TU Wien results and the reference data are found to be mostly related to the difference in acquisition times of the satellites used for producing the flood extent maps. As the applied approach of the algorithm can be used globally for any covered location and the automatically generated results are kept unchanged (with no human interaction), the achieved performance in the evaluation is considered satisfying. Due to the lack of large-scale reference data, the evaluation is limited to three relatively small areas in comparison to the large study area. Consequently, the performance over some land cover types like desert or types of vegetation that are not covered can not be evaluated in this study.
Sentinel-1 has proven to provide reasonable coverage over the Pakistan study area, although the mission's highest coverage density is over Europe. It is noteworthy that the obtained results were retrieved after the failure of Sentinel-1B in late 2021, which left a single satellite (Sentinel-1A) in orbit and doubled the revisit time. Based on the evaluated single-date flood maps, we demonstrated how this reasonable coverage allows one to retrieve multi-temporal statistical layers summarising the occurrence or progress of the flood. Further, these layers can be used to estimate some key data of the event, e.g. date of maximum observed flood extent and area affected by the event. However, the accuracy of this multi-temporal data was not evaluated in this study due to the lack of suitable reference data.
Future work will focus on the evaluation of the algorithm in more detail by analysing 18 globally distributed events. This will allow for getting a better understanding of the robustness of the method, including the performance over different land cover types, soil moisture conditions, or spatial scales. Following this broader evaluation, it aimed for a refinement of the algorithm to tackle detected issues. Furthermore, upcoming studies will use additional reference data to evaluate the accuracy of the statistical layers and investigate the suitability of the Sentinel-1 constellation for the multi-temporal flood mapping in areas of lower satellite coverage. The upcoming launch of Sentinel-1C will restore the two-satellite constellation of the Sentinel-1 mission and will directly enhance the abilities of the GFM service.
The dataset of this study is available in Roth et al. (2022) (https://doi.org/10.48436/zvvmh-nan78) at the TU Wien Research Data Repository. Generally, flood products to which the TU Wien flood mapping algorithm contributes are available as part of the Global Flood Monitoring Service (https://www.globalfloods.eu/, Global Flood Monitoring Service, 2023).
Conceptualisation: WW, BBM, and FR; project supervision: PS; statistics and validation: FR; software: MET and FR; near-real-time processing: CR; investigation: FR; writing – original draft preparation: FR; writing – review and editing: all; visualisation: BBM and FR; supervision: BBM and WW. All authors have read and agreed to the published version of the manuscript.
The contact author has declared that none of the authors has any competing interests.
Publisher's note: Copernicus Publications remains neutral with regard to jurisdictional claims made in the text, published maps, institutional affiliations, or any other geographical representation in this paper. While Copernicus Publications makes every effort to include appropriate place names, the final responsibility lies with the authors.
The computational results presented have been achieved using i.a. the Vienna Scientific Cluster (VSC). We would like to thank the whole GFM consortium for their work on building a global flood mapping service. The authors acknowledge TU Wien Bibliothek for financial support through its Open Access Funding Program.
This study was funded by TU Wien, with co-funding from the project “Provision of an Automated, Global, Satellite-based Flood Monitoring Product for the Copernicus Emergency Management Service” (GFM), contract no. 939866-IPR-2020 for the European Commission's Joint Research Centre (EC-JRC).
This paper was edited by Paolo Tarolli and reviewed by two anonymous referees.
Bauer-Marschallinger, B., Cao, S., Tupas, M. E., Roth, F., Navacchi, C., Melzer, T., Freeman, V., and Wagner, W.: Satellite-Based Flood Mapping through Bayesian Inference from a Sentinel-1 SAR Datacube, Remote Sens., 14, 3673, https://doi.org/10.3390/rs14153673, 2022. a, b, c
Dasgupta, A., Hostache, R., Ramsankaran, R., Grimaldi, S., Matgen, P., Chini, M., Pauwels, V. R., and Walker, J. P.: Earth observation and hydraulic data assimilation for improved flood inundation forecasting, in: Earth observation for flood applications, Elsevier, 255–294, https://doi.org/10.1016/B978-0-12-819412-6.00012-2, 2021. a
Gaurav, K., Sinha, R., and Panda, P.: The Indus flood of 2010 in Pakistan: a perspective analysis using remote sensing data, Nat. Hazards, 59, 1815–1826, 2011. a, b
Global Flood Monitoring: GFM Product Definition Document, https://extwiki.eodc.eu/GFM/PDD/GFMoutputLayers#output-layer-exclusion-mask (last access: 23 September 2022), 2022. a
Global Flood Monitoring Service: Global Flood Awareness System, https://www.globalfloods.eu/ (last access: 20 October 2023), 2023. a
Hoque, R., Nakayama, D., Matsuyama, H., and Matsumoto, J.: Flood monitoring, mapping and assessing capabilities using RADARSAT remote sensing, GIS and ground data for Bangladesh, Nat. Hazards, 57, 525–548, 2011. a
Hostache, R., Chini, M., Giustarini, L., Neal, J., Kavetski, D., Wood, M., Corato, G., Pelich, R.-M., and Matgen, P.: Near-real-time assimilation of SAR-derived flood maps for improving flood forecasts, Water Resour. Res., 54, 5516–5535, 2018. a
Khan, A. N.: Analysis of 2010-flood causes, nature and magnitude in the Khyber Pakhtunkhwa, Pakistan, Nat. Hazards, 66, 887–904, 2013. a
NASA Earth Observatory: Devastating Floods in Pakistan, https://earthobservatory.nasa.gov/images/150279/devastating-floods-in-pakistan (last access: 23 September 2022), 2022. a
Otto, F. E., Zachariah, M., Saeed, F., Siddiqi, A., Kamil, S., Mushtaq, H., Arulalan, T., AchutaRao, K., Chaithra, S., Barnes, C., Philip, S., Kew, S., Vautard, R., Koren, G., Pinto, I., Wolski, P., Vahlberg, M., Singh, R., Arrighi, J., van Aalst, M., Thalheimer, L., Raju, E., Li, S., Yang, W., Harrington, L. J., and Clarke, B.: Climate change increased extreme monsoon rainfall, flooding highly vulnerable communities in Pakistan, Environ. Res.: Climate, 2, 025001, https://doi.org/10.1088/2752-5295/acbfd5, 2023. a
Pekel, J.-F., Cottam, A., Gorelick, N., and Belward, A. S.: High-resolution mapping of global surface water and its long-term changes, Nature, 540, 418–422, 2016. a
Pelich, R., Chini, M., Hostache, R., Matgen, P., Delgado, J. M., and Sabatino, G.: Towards a global flood frequency map from SAR data, in: 2017 IEEE International Geoscience and Remote Sensing Symposium (IGARSS), 23–28 July 2017, Fort Worth, TX, USA, 4024–4027, 2017. a, b
Qasim, S., Khan, A. N., Shrestha, R. P., and Qasim, M.: Risk perception of the people in the flood prone Khyber Pukhthunkhwa province of Pakistan, Int. J. Disast. Risk Reduct., 14, 373–378, 2015. a
Roth, F., Bauer-Marschallinger, B., Tupas, M. E., Reimer, C., Salamon, P., and Wagner, W.: Sentinel-1 based analysis of the Pakistan Flood in 2022, TU Wien [data set], https://doi.org/10.48436/zvvmh-nan78, 2022. a
Salamon, P., Mctlormick, N., Reimer, C., Clarke, T., Bauer-Marschallinger, B., Wagner, W., Martinis, S., Chow, C., Böhnke, C., Matgen, P., Chini, M., Hostache, R., Molini, L., Fiori, E., and Walli, A.: The new, systematic global flood monitoring product of the copernicus emergency management service, in: 2021 IEEE International Geoscience and Remote Sensing Symposium IGARSS, 11–16 July 2021, Brussels, Belgium, 1053–1056, 2021. a
Schumann, G., Giustarini, L., Tarpanelli, A., Jarihani, B., and Martinis, S.: Flood Modeling and Prediction Using Earth Observation Data, Surv. Geophys., 44, 1553–1578, 2023. a
Schumann, G. J., Brakenridge, G. R., Kettner, A. J., Kashif, R., and Niebuhr, E.: Assisting flood disaster response with earth observation data and products: A critical assessment, Remote Sens., 10, 1230, https://doi.org/10.3390/rs10081230, 2018. a
The Editors of Encyclopaedia: Sindh, https://www.britannica.com/place/Sindh-province-Pakistan (last access: 10 March 2023), 2023a. a
The Editors of Encyclopaedia: Pakistan, https://www.britannica.com/place/Pakistan/Economy (last access: 5 June 2023), 2023b. a
Thomas, M., Tellman, E., Osgood, D. E., DeVries, B., Islam, A. S., Steckler, M. S., Goodman, M., and Billah, M.: A framework to assess remote sensing algorithms for satellite-based flood index insurance, IEEE J. Select. Top. Appl. Earth Obs. Remote Sens., 16, 2589–2604, 2023. a
Wagner, W., Bauer-Marschallinger, B., Navacchi, C., Reuß, F., Cao, S., Reimer, C., Schramm, M., and Briese, C.: A Sentinel-1 backscatter datacube for global land monitoring applications, Remote Sens., 13, 4622, https://doi.org/10.3390/rs13224622, 2021. a
Wang, Y.: Using Landsat 7 TM data acquired days after a flood event to delineate the maximum flood extent on a coastal floodplain, Int. J. Remote Sens., 25, 959–974, 2004. a
Wania, A., Joubert-Boitat, I., Dottori, F., Kalas, M., and Salamon, P.: Increasing timeliness of satellite-based flood mapping using early warning systems in the Copernicus Emergency Management Service, Remote Sens., 13, 2114, https://doi.org/10.3390/rs13112114, 2021. a
Westerhoff, R. S., Kleuskens, M. P. H., Winsemius, H. C., Huizinga, H. J., Brakenridge, G. R., and Bishop, C.: Automated global water mapping based on wide-swath orbital synthetic-aperture radar, Hydrol. Earth Syst. Sci., 17, 651–663, https://doi.org/10.5194/hess-17-651-2013, 2013. a