the Creative Commons Attribution 4.0 License.
the Creative Commons Attribution 4.0 License.
 | 18 Oct 2023
Landslide initiation thresholds in data-sparse regions: application to landslide early warning criteria in Sitka, Alaska, USA
Annette I. Patton
Joshua J. Roering
Aaron Jacobs
Oliver Korup
Benjamin B. Mirus
Probabilistic models to inform landslide early warning systems often rely on rainfall totals observed during past events with landslides. However, these models are generally developed for broad regions using large catalogs, with dozens, hundreds, or even thousands of landslide occurrences. This study evaluates strategies for training landslide forecasting models with a scanty record of landslide-triggering events, which is a typical limitation in remote, sparsely populated regions. We evaluate 136 statistical models trained on a precipitation dataset with five landslide-triggering precipitation events recorded near Sitka, Alaska, USA, as well as > 6000 d of non-triggering rainfall (2002–2020). We also conduct extensive statistical evaluation for three primary purposes: (1) to select the best-fitting models, (2) to evaluate performance of the preferred models, and (3) to select and evaluate warning thresholds. We use Akaike, Bayesian, and leave-one-out information criteria to compare the 136 models, which are trained on different cumulative precipitation variables at time intervals ranging from 1 h to 2 weeks, using both frequentist and Bayesian methods to estimate the daily probability and intensity of potential landslide occurrence (logistic regression and Poisson regression). We evaluate the best-fit models using leave-one-out validation as well as by testing a subset of the data. Despite this sparse landslide inventory, we find that probabilistic models can effectively distinguish days with landslides from days without slide activity. Our statistical analyses show that 3 h precipitation totals are the best predictor of elevated landslide hazard, and adding antecedent precipitation (days to weeks) did not improve model performance. This relatively short timescale of precipitation combined with the limited role of antecedent conditions likely reflects the rapid draining of porous colluvial soils on the very steep hillslopes around Sitka. Although frequentist and Bayesian inferences produce similar estimates of landslide hazard, they do have different implications for use and interpretation: frequentist models are familiar and easy to implement, but Bayesian models capture the rare-events problem more explicitly and allow for better understanding of parameter uncertainty given the available data. We use the resulting estimates of daily landslide probability to establish two decision boundaries that define three levels of warning. With these decision boundaries, the frequentist logistic regression model incorporates National Weather Service quantitative precipitation forecasts into a real-time landslide early warning “dashboard” system (https://sitkalandslide.org/, last access: 9 October 2023). This dashboard provides accessible and data-driven situational awareness for community members and emergency managers.
- Article
(9153 KB) - Full-text XML
-
Supplement
(931 KB) - BibTeX
- EndNote


On 18 August 2015, an extreme rain event initiated more than 40 landslides on the islands near Sitka, Alaska, USA, including a debris flow that resulted in three fatalities (Busch et al., 2021). Over a 6 h period, the Sitka area received 64–83 mm (2.5–3.25 in.) of rain, and the 3 h storm totals had an estimated 45-year return period. Following this event, the community convened the GeoTask Force to identify priority questions related to landslide risk and hazard (Busch et al., 2016). Community leaders and technical experts determined the need for a landslide early warning system. This study results from the actions of the community to seek support to reduce landslide risks.
Landslide early warning has the potential to save lives by providing actionable information in advance of an imminent landslide event (e.g., Guzzetti et al., 2020). Landslide early warning systems consist of a prediction (“nowcast” or “forecast”) of landslide occurrence, one or more thresholds for action, and a method for disseminating warning information. In this paper, we use the term “landslide prediction” to refer to estimates of elevated landslide hazard in the future based on forecasted precipitation and “landslide early warning system” to refer to the warning level dissemination. Notably, the landslide early warning system described in this work is a public-facing web dashboard that operates automatically and does not send notifications or operationalize decision-making about emergency response.
Decades of investigation around the world have demonstrated the value of using precipitation and hydrologic conditions to predict landslides (e.g., Chae et al., 2017; Guzzetti et al., 2020), but prediction strategies vary. Most studies determine decision thresholds that aim to separate periods when landslides are likely from periods when they are not. These thresholds may be based on precipitation intensity and duration, consider cumulative precipitation over different time periods (Guzzetti et al., 2008; Mirus et al., 2018a; Bogaard and Greco, 2018), and/or incorporate in situ hydrologic data or estimates of antecedent hillslope hydrological conditions (Thomas et al., 2018; Marino et al., 2020; Mirus et al., 2018b; Wicki et al., 2020). Thresholds may indicate the minimum accumulation of precipitation needed to initiate landslides or attempt to optimally separate triggering from non-triggering precipitation events (Segoni et al., 2018).
Accurately predicting rare events like landslides remains challenging because the complex and spatially heterogeneous processes that drive landslide initiation are difficult to characterize at sufficiently high resolution across broad regions (Stanley and Kirschbaum, 2017; Reichenbach et al., 2018; Guzzetti, 2021, etc.). In this study, instead of trying to predict the spatial occurrence, we focus on predicting the temporal occurrence of landslides (when and how many failures) within a given study area.
Both empirically and physically based hazard assessments and warning systems require sufficient in situ data to be developed, calibrated, and validated. For example, lack of high-resolution imagery and in situ measurements of parameters such as soil bulk density, thickness, and hydraulic properties hinders the development of physically based models. Detailed precipitation and hydrologic records with high temporal resolution (hourly or finer) rarely cover long timescales (years to decades). Additionally, remote, sparsely populated areas typically lack inventories of landslide occurrence. These limited datasets of landslide occurrence and associated triggering conditions make it challenging to develop empirical models for landslide initiation, which may have large uncertainties, are often difficult to validate, and cause detrimental false positives in early warning systems. Yet, vulnerability to landslides is often high in remote and data-sparse regions due to limited infrastructure and access to external aid (Cutter and Finch, 2008). Improving prediction of landslide hazards in remote regions is a critical step to supporting resilient communities.
In this study, we developed a landslide early warning system for the remote community of Sitka, Alaska, USA (Fig. 1), which had a population of 8382 in 2022 (US Census Bureau, 2022). We trained statistical models with limited landslide inventory data to estimate landslide probability and the number of landslides in the study area based on observed and forecasted precipitation, and then we used these models to establish thresholds for landslide early warning. Our approach continuously estimates landslide risk based on National Weather Service forecasts and disseminates this information using a public-facing dashboard that was designed with extensive community input. In this sense, our research highlights the importance of linking the key aspects of statistical analyses with readily digestible thresholds to inform communities.
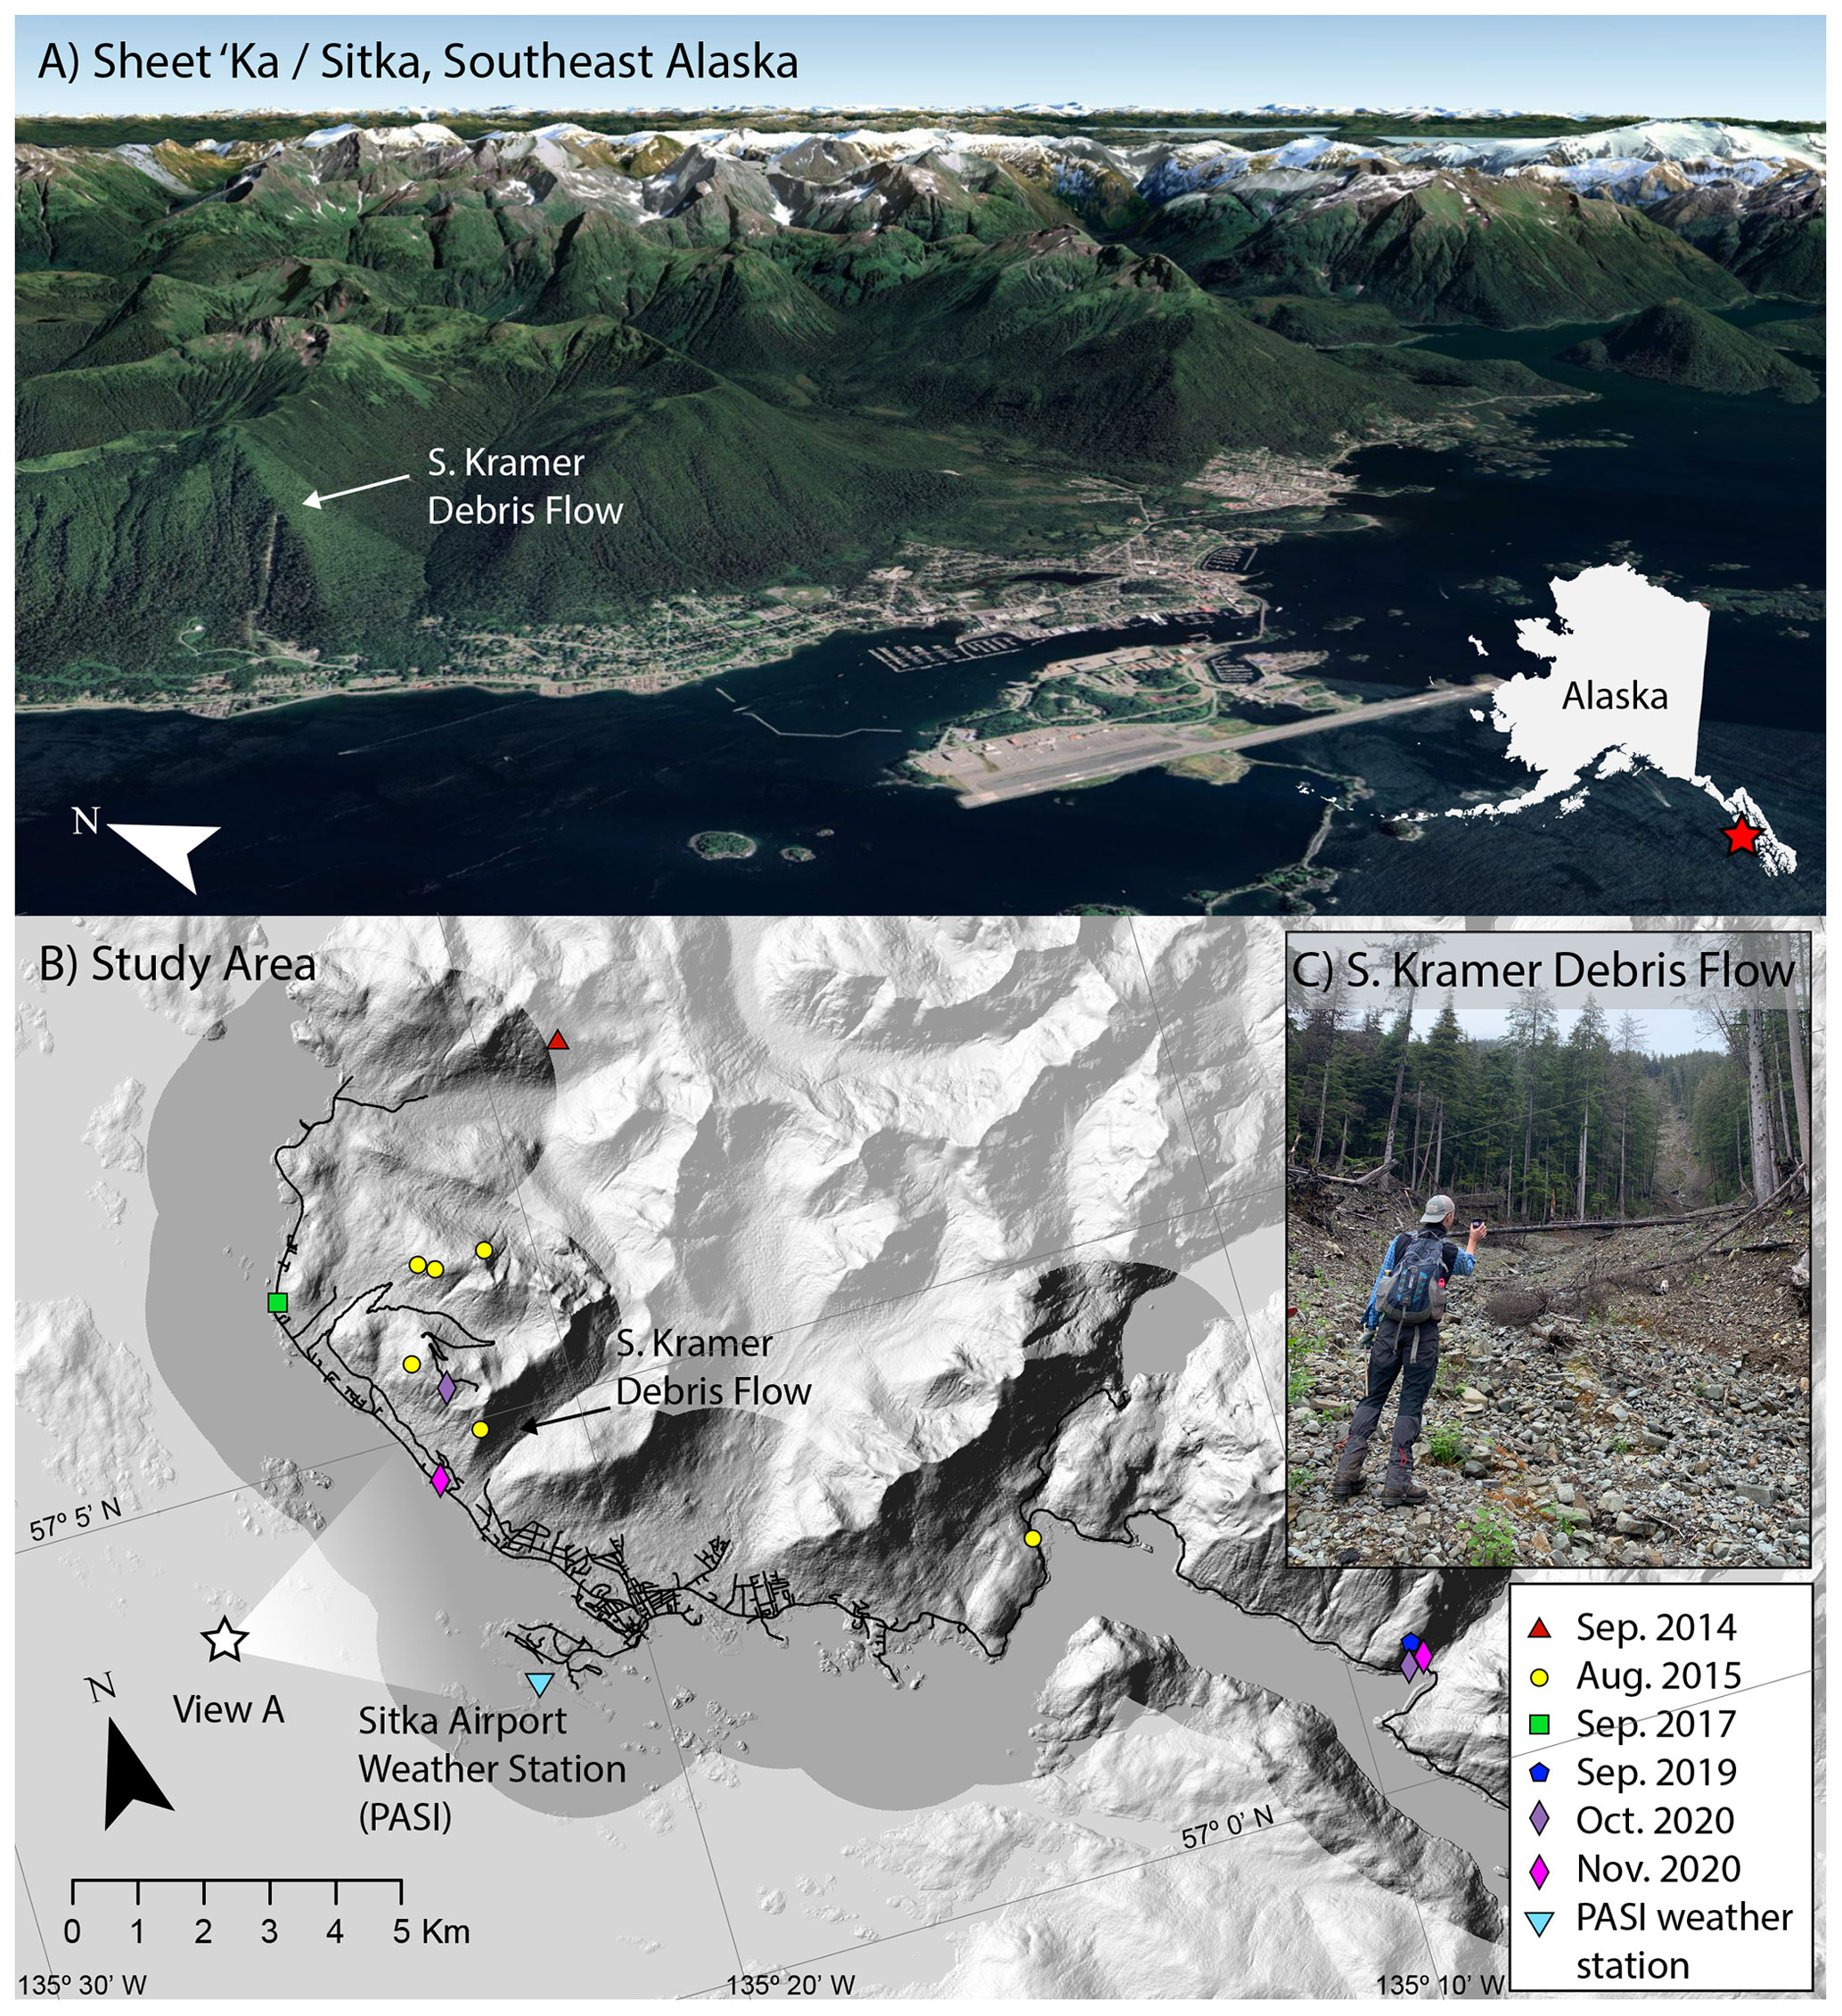
Figure 1Study area. (a) Google Earth image of Sitka (Sheet'ka), Alaska (© Google Earth, 2021). The town lies below over-steepened postglacial hillslopes susceptible to landslides. Some of the existing residential and municipal areas are built in landslide initiation or runout zones. (b) Map of recent rain-triggered landslides evaluated in this study shown on a shaded relief map from the US Geological Survey 5 m digital data, 2014. Higher contrast delineates areas within 2 km of the Sitka road network (dark lines). (c) Photo of the South Kramer Debris Flow, which was initiated on 18 August 2015 and resulted in three fatalities. Photograph courtesy of the authors.
1.1 Study area: Sitka, southeast Alaska
Landslides in southeast Alaska pose persistent hazards to the small, isolated communities that are on the flanks of hillslopes over-steepened by glaciers. The majority of failures are debris flows initiated by shallow landslides (Swanston and Marion, 1991; Johnson et al., 2000). Steep hillslopes with thin volcanic soils overlying till are especially susceptible to shallow-seated landslides (Sidle and Swanston, 1981; Swanston, 1970; Patton et al., 2022). Following the fatal debris flow event in Sitka on 18 August 2015 (Busch et al., 2021), community organizers identified the need to better understand both where and when landslides are likely to occur in Sitka.
The landscape surrounding Sitka (Fig. 1) is geomorphically complex (Patton et al., 2022), having been sculpted by tectonic activity (White et al., 2016; Elliott and Freymueller, 2020), Pleistocene glaciation (Mann, 1986; Hamilton, 1986), volcanic eruptions (Riehle et al., 1992b, a), and a long history of human settlement (Lesnek et al., 2018; Sandberg, 2013).
The mid-latitude maritime climate in Sitka is characterized by high annual precipitation. During the last climatic normal (1981–2010), mean annual precipitation at sea level was 2205 mm (Wendler et al., 2016), but steep orographic gradients and complex topography result in spatially heterogenous climate and weather patterns. Mean monthly temperatures stay above freezing all year. Variable snowpacks accumulate in winter months, particularly at high elevations, but most precipitation occurs as non-freezing rain in coastal and low-elevation areas. Rainfall occurs year-round in southeast Alaska, but August–November are the wettest months.
In particular, atmospheric rivers (ARs) account for 90 % of extreme precipitation in southeast Alaska, where “extreme” precipitation was statistically defined using the block maxima approach by identifying one extreme event per year and per season (Sharma and Déry, 2019, 2020). The AR contribution to extreme precipitation is particularly high (> 90 %) from September to December. Across southeast Alaska, as well as much of western North America, ARs initiate the vast majority of shallow precipitation-related landslides, although a minority of those ARs actually trigger widespread landsliding (Oakley et al., 2017; Cordeira et al., 2019; Jacobs et al., 2016).
Given this geographic setting, the community of Sitka is exposed to persistent, although largely unquantified, landslide hazards (Miller, 2019; Busch et al., 2021; Patton et al., 2022). Although it is difficult or impossible to reduce landslide hazards across broad hillslopes, landslide early warning systems can greatly reduce landslide risk to life and safety in these areas. With sufficient warning, residents can voluntarily evacuate high-hazard neighborhoods.
1.2 Developing precipitation thresholds for landslide warning
Landslide hazard estimates and precipitation thresholds exist at the global (Guzzetti et al., 2008; Khan et al., 2021; Kirschbaum and Stanley, 2018), regional (Piciullo et al., 2018; Segoni et al., 2018; Staley et al., 2017), and local scales (e.g., Mirus et al., 2018a) and even for individual landslides (Kristensen et al., 2021). Developing and applying new thresholds for landslide warning requires determining the most relevant variables and timescales to model landslide hazard in a particular region, considering data availability and taking the risk tolerance of the targeted community into account. Almost every investigation of antecedent-triggering precipitation thresholds uses different observation timescales. These differences reflect different landslide types of interest (shallow versus deep-seated), hydrogeomorphic controls, climate, and the type and length of records available.
Hydrometeorological thresholds for landslide initiation have been proposed for nearby remote areas of British Columbia (Jakob et al., 2006) and suburban Vancouver (Jakob et al., 2012) in Canada, but no systematic landslide warning threshold currently exists at either local scales for towns within southeast Alaska or the regional scale for southeast Alaska as a whole, despite its high susceptibility to slope failures (e.g., Darrow et al., 2022; Patton et al., 2022). Generations of knowledge in southeast Alaska and close observation of the natural environment provide rich understanding of landslides and other natural processes, but southeast Alaska lacks extensive written records of landslide occurrence with daily timestamps and sub-daily, spatially distributed precipitation records. This contrasts with many well-established landslide prediction models developed in the European Alps, Japan, and other data-rich regions that can draw on tens to thousands of observations of landslide-triggering precipitation and gridded precipitation datasets with high spatial and temporal resolution (e.g., Osanai et al., 2010; Saito et al., 2010; Berti et al., 2012; Lee et al., 2015; Leonarduzzi et al., 2017; Piciullo et al., 2017). Although previous estimates of rainfall thresholds have included only precipitation events that triggered landslides (Peruccacci et al., 2017), recent research has shown that including records of precipitation that did not trigger landslides can help sparse landslide datasets perform well (Peres and Cancelliere, 2021). Warning systems developed from hundreds to thousands of observed landslides are generally considered more trustworthy than those with few landslide-inducing events.
In southeast Alaska, the United States National Weather Service (NWS) forecasting products provide the best available warning information through weather and hydrologic watches, warnings, and advisories, but both communities and NWS forecasters have expressed a need for systematic analysis of landslide potential under different storm conditions (Busch et al., 2021). Recent investigations in Sitka, Alaska (Chu et al., 2021; Booth et al., 2020; Vascik et al., 2021), and the community's desire for real-time landslide hazard assessments make this an ideal region to identify new precipitation thresholds and expand on established landslide prediction techniques for use in data-sparse regions. Our research objective is to provide the community of Sitka with a landslide early warning system that provides real-time and forecasted assessments of landslide hazard to support individual and community-wide decision-making. We estimate two metrics of daily landslide hazard in Sitka using statistical models trained with landslide inventory data and precipitation records. As described in detail in the “Methods and data” section, our approach relies on models developed using hourly precipitation data from both landslide-triggering days (5) and all non-triggering days (> 6000) within the period of record between 2002 and 2020.
To develop daily estimates of landslide hazard, we trained and evaluated probabilistic models for landslide prediction with precipitation data as the predictor. Due to limited landslide observations during the period with precipitation records (only five landslide events in the recent record), training and validating these models is inherently difficult. We therefore used several evaluation strategies after training the models to build a thorough understanding of model strengths and weaknesses. These evaluation approaches serve three primary purposes: to select models, to evaluate performance of the preferred models, and to select and evaluate thresholds (Steps 3–5 below). In summary, our workflow included the following steps:
-
Data. We compiled information about landslide occurrences with known timing near Sitka, Alaska, and weather-station precipitation data for a period of record with hourly precipitation data (2002–2020). Timing of each landslide was known within 12 h or at finer resolution.
-
Model training. We trained frequentist and Bayesian models (136 total) with historical records of precipitation and landslides to predict the daily probability of landslides (logistic regression) and the number of landslides (Poisson regression) that could occur based on cumulative precipitation. Logistic regression and Poisson regression are generalized linear models that can incorporate any number of predictor variables, including precipitation at different timescales and groundwater or hydrologic data.
-
Model selection. We compared the 136 models (Table 1) using a range of cumulative precipitation timescales to select the most appropriate model for the warning system. We considered models with a single predictor (cumulative “triggering” precipitation) and models with two predictors (cumulative “antecedent” precipitation and cumulative “triggering” precipitation).
-
Model evaluation. We checked the most appropriate model's sensitivity (and thus robustness) by removing individual landslide events (leave-one-out/jackknife validation). We evaluated its skill against historical daily landslide frequency.
-
Threshold selection. Using input from Sitka community members, we established heuristic decision thresholds for multiple landslide warning levels based on the estimated probability of landsliding and expert judgment.
-
Threshold evaluation. We assessed how well a model trained on an earlier section of the time series was able to predict landslides in a later portion of the time series based on these thresholds and evaluated how often landslide warnings would have been issued in the past.
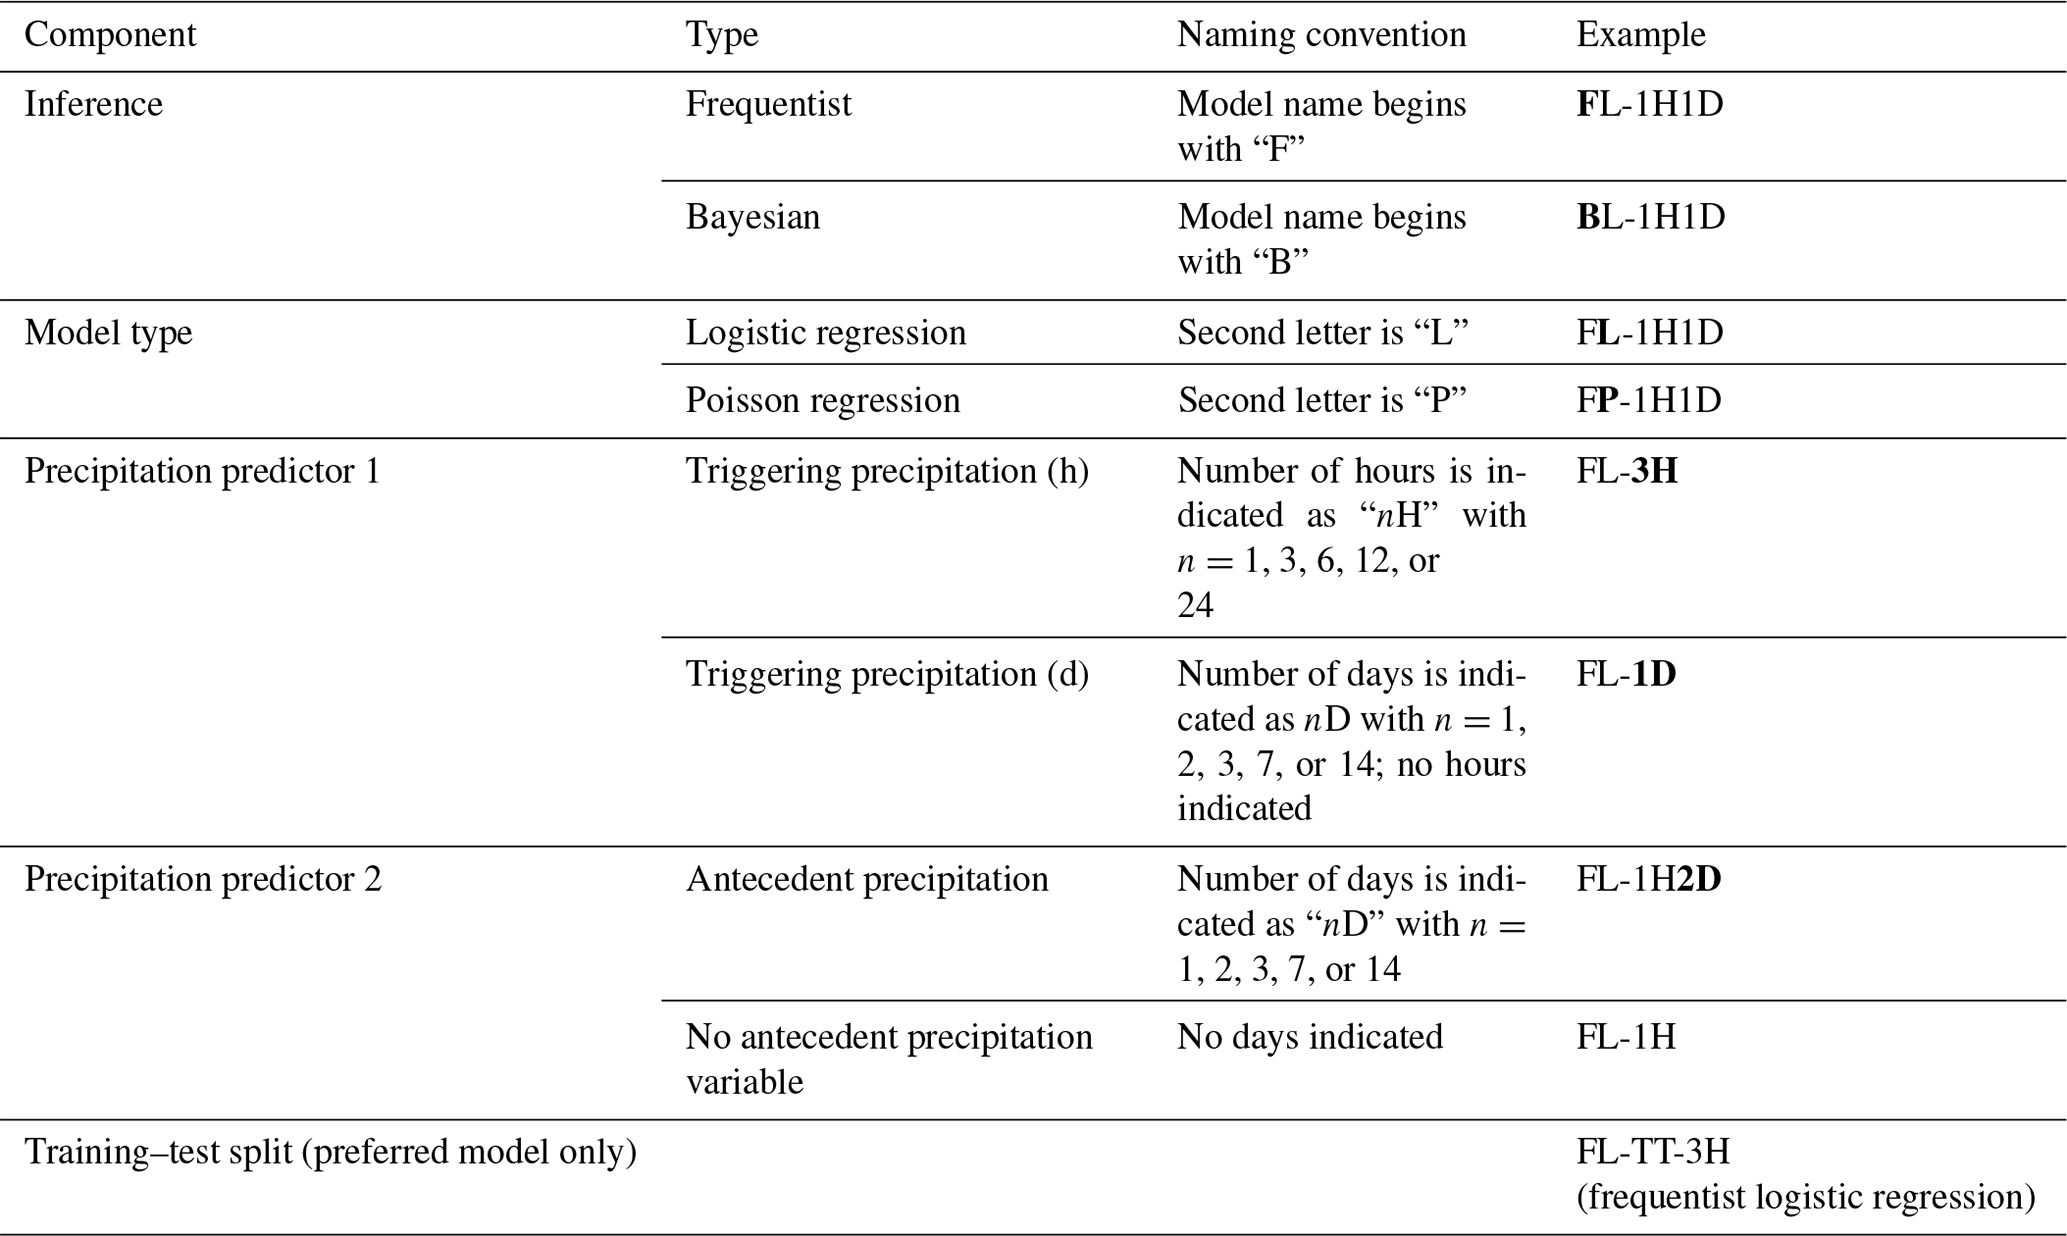
The naming scheme we used for all models (frequentist versus Bayesian, logistic regression versus Poisson regression, precipitation timescales) is summarized in Table 1.
Table 1Model naming system. We evaluated 136 models fit to the complete landslide inventory data and precipitation records. We also evaluated one frequentist logistic regression model fit to a subset of these data, reserving some data for validation (training–test), and one simpler alternative model based on historical landslide frequency. Bold letters in the “Example” column show the described component.
2.1 Data sources
To investigate landslide conditions in Sitka, we used existing hourly precipitation records from the nearby weather station (NWS station code PASI) operated by the Federal Aviation Administration (FAA) at Sitka Rocky Gutierrez Airport (University of Utah, Department of Atmospheric Sciences, 2023). Climate records in Sitka go back to the early 19th century (Wendler et al., 2016), and hourly precipitation data (or sub-hourly) have been recorded at the airport weather station since 2002; we included all days with observations between 12 November 2002 and 13 December 2020. A nearby US Climate Reference Network (USCRN) meteorological station (NWS station code SIKA2) has also documented sub-hourly precipitation since 2005 (Diamond et al., 2013). Some variation in precipitation is observed at these two locations, but for the purposes of simplicity we train the statistical models using a single precipitation gauge, the PASI gauge at Sitka Rocky Gutierrez Airport.
Through a combination of air photo interpretation and field mapping, the US Forest Service has curated an inventory of more than 12 000 landslides in southeast Alaska, with records dating back to the early 20th century, known as the Tongass National Forest Landslide Areas inventory (US Forest Service, 2019). To focus only on landslides likely to impact human safety and infrastructure, we create a subset of the Tongass inventory of landslides within 2 km of the road network in Sitka, thus obtaining 5 d with recorded landslides out of 6606 d with reported precipitation. We collected and synthesized information about the landslides near Sitka, including their timing and impacts.
2.2 Logistic and Poisson regression for estimating landslide hazard
Many previous works have used probabilistic techniques to predict landslide hazard (Berti et al., 2012; Brunetti et al., 2010; Tufano et al., 2019). In keeping with this practice, we used logistic regression to estimate the daily probability of landsliding as a function of precipitation. We also used Poisson regression to estimate intensity (number of landslides per day in the study region) as a proxy for the magnitude of the event. The outputs of logistic and Poisson regressions are useful because they provide a nuanced understanding of relative landslide hazard that allows practitioners to identify multiple working thresholds that lead to different levels of community response.
Logistic and Poisson regression are generalized linear models that can include any number of predictor variables (McCullagh and Nelder, 1989). To determine the most effective precipitation timescale for estimating daily landslide hazard in Sitka, we tested a series of models with predictors at a range of timescales that include (a) triggering or (b) triggering with antecedent precipitation. We considered two model setups: the first (trigger-only) estimates daily landslide hazard (probability or intensity on day d) as a function of cumulative precipitation during a specified time period t, which is either a sub-daily interval of day d or a time period leading up to and including day d. We investigated time periods t of 1, 3, 6, 12, and 24 h and 2, 3, 7, and 14 d. The second model setup (trigger-antecedent) introduces an additional predictor to describe cumulative precipitation during an antecedent time period a preceding day d and uses only sub-daily time periods for t. We considered antecedent periods of 1, 2, 3, 7, and 14 d.
For each day of recorded precipitation between 2002 and 2020 d (6606 d), we used a series of moving windows to extract the maximum cumulative precipitation in each sub-daily time period t on that day and cumulative precipitation for all other time periods t and a leading up to and including that day. This applies for both days with landslides and days without. For example, on a day with a landslide, 3 h triggering precipitation (Pt) represents the highest cumulative 3 h period between midnight and 23:59 local time. A 1 d antecedent precipitation (Pa) period is the 24 h period before midnight on the day of the landslide. The precipitation timescales we considered are designed to integrate with existing NWS precipitation forecasting products, which provide precipitation estimates for 3 h intervals for the upcoming ∼ 48 and 6 h intervals for the following ∼ 48 h. This method relies on the assumption that triggering rainfall is well represented by daily peak rainfall totals.
The logistic regression models have the following form:
where yd is a binary indicator of whether a landslide was observed on day d, pd is the probability of having a landslide on day d, and ∼ indicates that yd is modeled as a Bernoulli distributed random variable. β0 is the intercept of the generalized linear model; β1 is the coefficient of cumulative precipitation (Pt) during time period t; and β2 is the coefficient of antecedent precipitation (Pa) during time period a, which is excluded in the single-predictor models. Logistic regression models are indicated with an L in their name (Table 1).
The Poisson regression models have a similar form:
where zd is the number of landslides observed on day d; λd is the average intensity of landsliding (landslides per day per area) on day d; α0 is the intercept; α1 is the coefficient of cumulative precipitation; and α2 is the coefficient of antecedent precipitation, again excluded in the single-predictor models. Poisson regression models are indicated with a P in their name (Table 1).
We applied both frequentist (F, Table 1) and Bayesian (B, Table 1) approaches to fitting the logistic and Poisson regressions. Frequentist inference assumes that there is a true, unknown set of parameters and that the observed data result from an infinitely repeatable sampling experiment. Frequentist 95 % confidence intervals around the point estimate for a parameter have a 95 % probability of including the true parameter value if the experiment is repeated a large number of times. Bayesian inference, in contrast, provides posterior parameter estimates, which are probability distributions of all possible parameter estimates that are compatible with the observed landslide data and our prior knowledge, which is specified in the form of a probability distribution. This is a useful property for estimating hazard from landslide inventories with few reported landslides because the posterior probability distribution quantifies how certain we can be of the parameter estimates, given few data points, and incorporates previous knowledge of landslide processes. A Bayesian 95 % credibility interval contains 95 % of the posterior probability, providing an arguably more intuitive estimate of uncertainty than frequentist confidence intervals.
Both frequentist and Bayesian approaches have been applied in landslide research (e.g., Berti et al., 2012; Segoni et al., 2018). Frequentist approaches may be familiar to a wider range of users and are typically easy to apply out of the box in popular programming languages. Bayesian approaches offer potential advantages for small datasets, particularly because they quantify parameter uncertainty given the available data but are less commonly known and require sufficient expertise to select prior distributions. Here, we explore both inferences and compare their output and application.
For the Bayesian regressions, we chose weakly informative Student-t prior distributions that reflect our expectations about landslide activity in Sitka, specifically that (1) landslide probability and the number of landslides should increase with increasing precipitation, (2) the probability of landsliding should be less than 50 % at the mean precipitation in Sitka, and (3) the average number of landslides should be below 1 at the mean precipitation. Weakly informative Student-t priors are recommended defaults for Bayesian logistic regression (Gelman et al., 2008) that encode prior knowledge without overly influencing regression results. Additionally, when faced with an imbalanced dataset, as is the case here, such priors have been shown to produce stable regression coefficients, even in the case where there is near-perfect separation between landslide and non-landslide days (Gelman et al., 2008). Specifically, we chose the following:
In the Bayesian regressions, precipitation values were standardized by subtracting the mean across all days and dividing by the standard deviation, also known as a z score. These priors refer to standardized data, where the intercepts β0 and α0 indicate the expected values for probability and intensity at the mean precipitation value.
We fit the frequentist models using the R glm software package, which relies on iterative weighted least squares to estimate parameters (R Core Team, 2019). We fit the Bayesian models using the R brms software package version 2.17.0 (Bürkner, 2017), which uses Hamiltonian Monte Carlo to estimate posterior parameter distributions as implemented in the Stan programming language (Stan Development Team, 2022). We ran four Markov chains for 2000 iterations, discarding the first 500 draws as warm-up. We checked the chains visually for convergence of parameter estimates; Gelman–Rubin convergence diagnostic () values were in all cases 1, indicating convergence.
2.3 Model comparison and evaluation
We used several information criteria to compare models with different timescales of precipitation (1 h to 14 d) to identify the best-performing model for use in a warning system. For the frequentist models, we calculated the Akaike information criterion (AIC) and Bayesian information criterion (BIC), which estimate out-of-sample prediction error (Akaike, 1992; Schwarz, 1978; Kuha, 2004). For the Bayesian models, we used approximate leave-one-out cross-validation as implemented in the R package loo version 2.5.1 (Vehtari et al., 2017) to estimate out-of-sample predictive accuracy (leave-one-out information criterion, LOOIC). We then chose the respective logistic regression and Poisson regression models with the lowest prediction error for further validation:
-
FL-3H (frequentist, logistic regression, 3 h model),
-
BL-3H (Bayesian, logistic regression, 3 h model),
-
FP-3H (frequentist, Poisson, 3 h model), and
-
BP-3H (Bayesian, Poisson, 3 h model).
Because the number of days with reported landslides is small compared to the number of days with no reported landslides, we evaluated the sensitivity of these four selected models (FL-3H, BL-3H, FP-3H, and BP-3H) to individual landslide events using leave-one-out cross-validation. We removed each landslide event from the dataset and fit the models to the remaining data. We then evaluated the difference in parameter estimates between the complete dataset and the leave-one-out dataset.
Next, we assessed the predictive skill of the best-fit frequentist and Bayesian logistic regression models (FL-3H, BL-3H) by using the Brier skill score (BSS) to compare their predicted probabilities to historical daily landslide frequency over the period of record. This approach is analogous to a common strategy for evaluating weather forecasting models, in which the forecast's skill is compared to climatology: average weather conditions over long time periods (e.g., Wilks, 2011). It also indicates whether the model is more skillful than randomly guessing the outcome based on historical frequency. The Brier score (BS) is the mean squared error of the predicted probabilities compared to the actual outcome and is calculated as
where lower scores (closer to zero) indicate better skill (Brier, 1950).
The BSS then compares the logistic regression model (BSlogistic) to historical frequency, which serves as a reference model in which pd is approximated by the number of days with reported landslides divided by the number of days without between 2002 and 2020 (BSHF):
A BSS of 0 indicates that the models have the same skill, a BSS > 0 indicates that the logistic regression model outperforms the reference historical daily frequency model (better than random), and a BSS < 0 indicates that the logistic regression model performs worse than historical daily frequency (worse than random).
2.4 Selecting and evaluating multiple decision thresholds for different hazard levels
Although landslide probability and intensity can be estimated for any precipitation over a specified period using the fitted logistic and Poisson regression models, decision thresholds must be chosen to specify when to issue warnings. Extensive conversations with emergency responders and community leaders revealed a variety of perspectives and priorities for Sitka's landslide warning system and different levels of risk tolerance (Busch et al., 2021). For example, emergency responders who are concerned about the considerable cost of false alarms preferred a higher hazard threshold in favor of fewer false alarms. Other citizens were comfortable with some false alarms, preferring to be alerted whenever there was an elevated chance of landslides. These previous findings informed our selection of multiple warning levels because each threshold must compromise between missed and false alarms, and dual thresholds can inform different types of decision-making with different alert levels (e.g., Mirus et al., 2018b).
We used confusion matrices and metrics derived from them to select thresholds. A confusion matrix illustrates the trade-off between missed alarms and false alarms. A confusion matrix for a single threshold is a 2×2 matrix that shows the number of true alarms, false alarms, missed alarms, and true no alarms by comparing the predicted outcome based on the probabilistic model and threshold with the true outcome. Metrics calculated from the confusion matrix can reveal optimal thresholds based on the user's tolerance for false alarms or missed alarms. In imbalanced datasets with few landslide days and many no-landslide days, typically applied metrics for logistic regression thresholding like accuracy are less informative because they over-emphasize the importance of true no alarms while masking the threshold's performance for true alarms and false alarms. For rare events, considering precision (ability to issue true alarms while avoiding false alarms) and recall (ability to issue true alarms while avoiding missed alarms) is preferable (Saito and Rehmsmeier, 2015).
Precision is defined as
Recall is defined as
To satisfy varying levels of risk tolerance within the community, we set two warning thresholds based on landslide probability estimated by the best-performing frequentist logistic regression model (FL-3H). The lower threshold is set such that the system would have missed no landslide in the past (recall = 1), and the upper threshold is set such that every day with a landslide probability above the threshold has been associated with landslides in the past (precision = 1). Given the limited number of landslide days, a range of thresholds can achieve these results, calling for a heuristic approach in choosing final warning thresholds. We built a confusion matrix to illustrate how often warnings based on these thresholds would have been issued in the past and document the outcome of the event.
To assess how well these thresholds can be expected to correctly predict days with and without landslides in the future, we split the precipitation time series into a training and testing dataset. The training dataset is composed of the precipitation and landslide records from November 2002–November 2019. The test dataset is from December 2019–November 2020. We trained the logistic regression model on the training data and then predicted the probability of landslides for all days between December 2019–November 2020 based on observed precipitation data. We also used a confusion matrix to evaluate the number of warnings at each level that would have been issued between December 2019 and 2020 using the model. Although this “testing” window represents a relatively small portion of total days in the dataset, it does include 365 d and 2 of 5 (40 %) landslide days. To test the sensitivity of our results of the length of the training and test periods, we also flipped the training and test periods (i.e., trained on the year 2020 and tested on the previous 17 years) and performed a similar evaluation.
Ideal practice would include models tested with historical precipitation forecasts (rather than observed precipitation), but archived forecast data are not readily available. Instead, we set preliminary thresholds using observed precipitation totals and necessarily assume that forecasts are accurate. This introduces additional uncertainty into the landslide warning system, which relies on weather forecasts. Detailed analysis of the uncertainty in precipitation forecasts is beyond the scope of this paper, but validation and evaluation of the warning system could be used to refine warning thresholds.
3.1 Landslide events
Over the 18 years with hourly precipitation records, five rain events in Sitka resulted in one or more landslides (Fig. 2; Table 2). In most cases, landslide timing is known within the hour or can be estimated based on eyewitness constraints and the precipitation record. More detailed timing information is provided in the Supplement, Table S2. This precise timing information is useful for qualitative evaluation of the association of landslide initiation with peak rainfall (Fig. 2) but is not necessary for training the statistical models, which use maximum daily rainfall metrics. All five landslide events were characterized by a few hours of intense precipitation (Fig. 2).
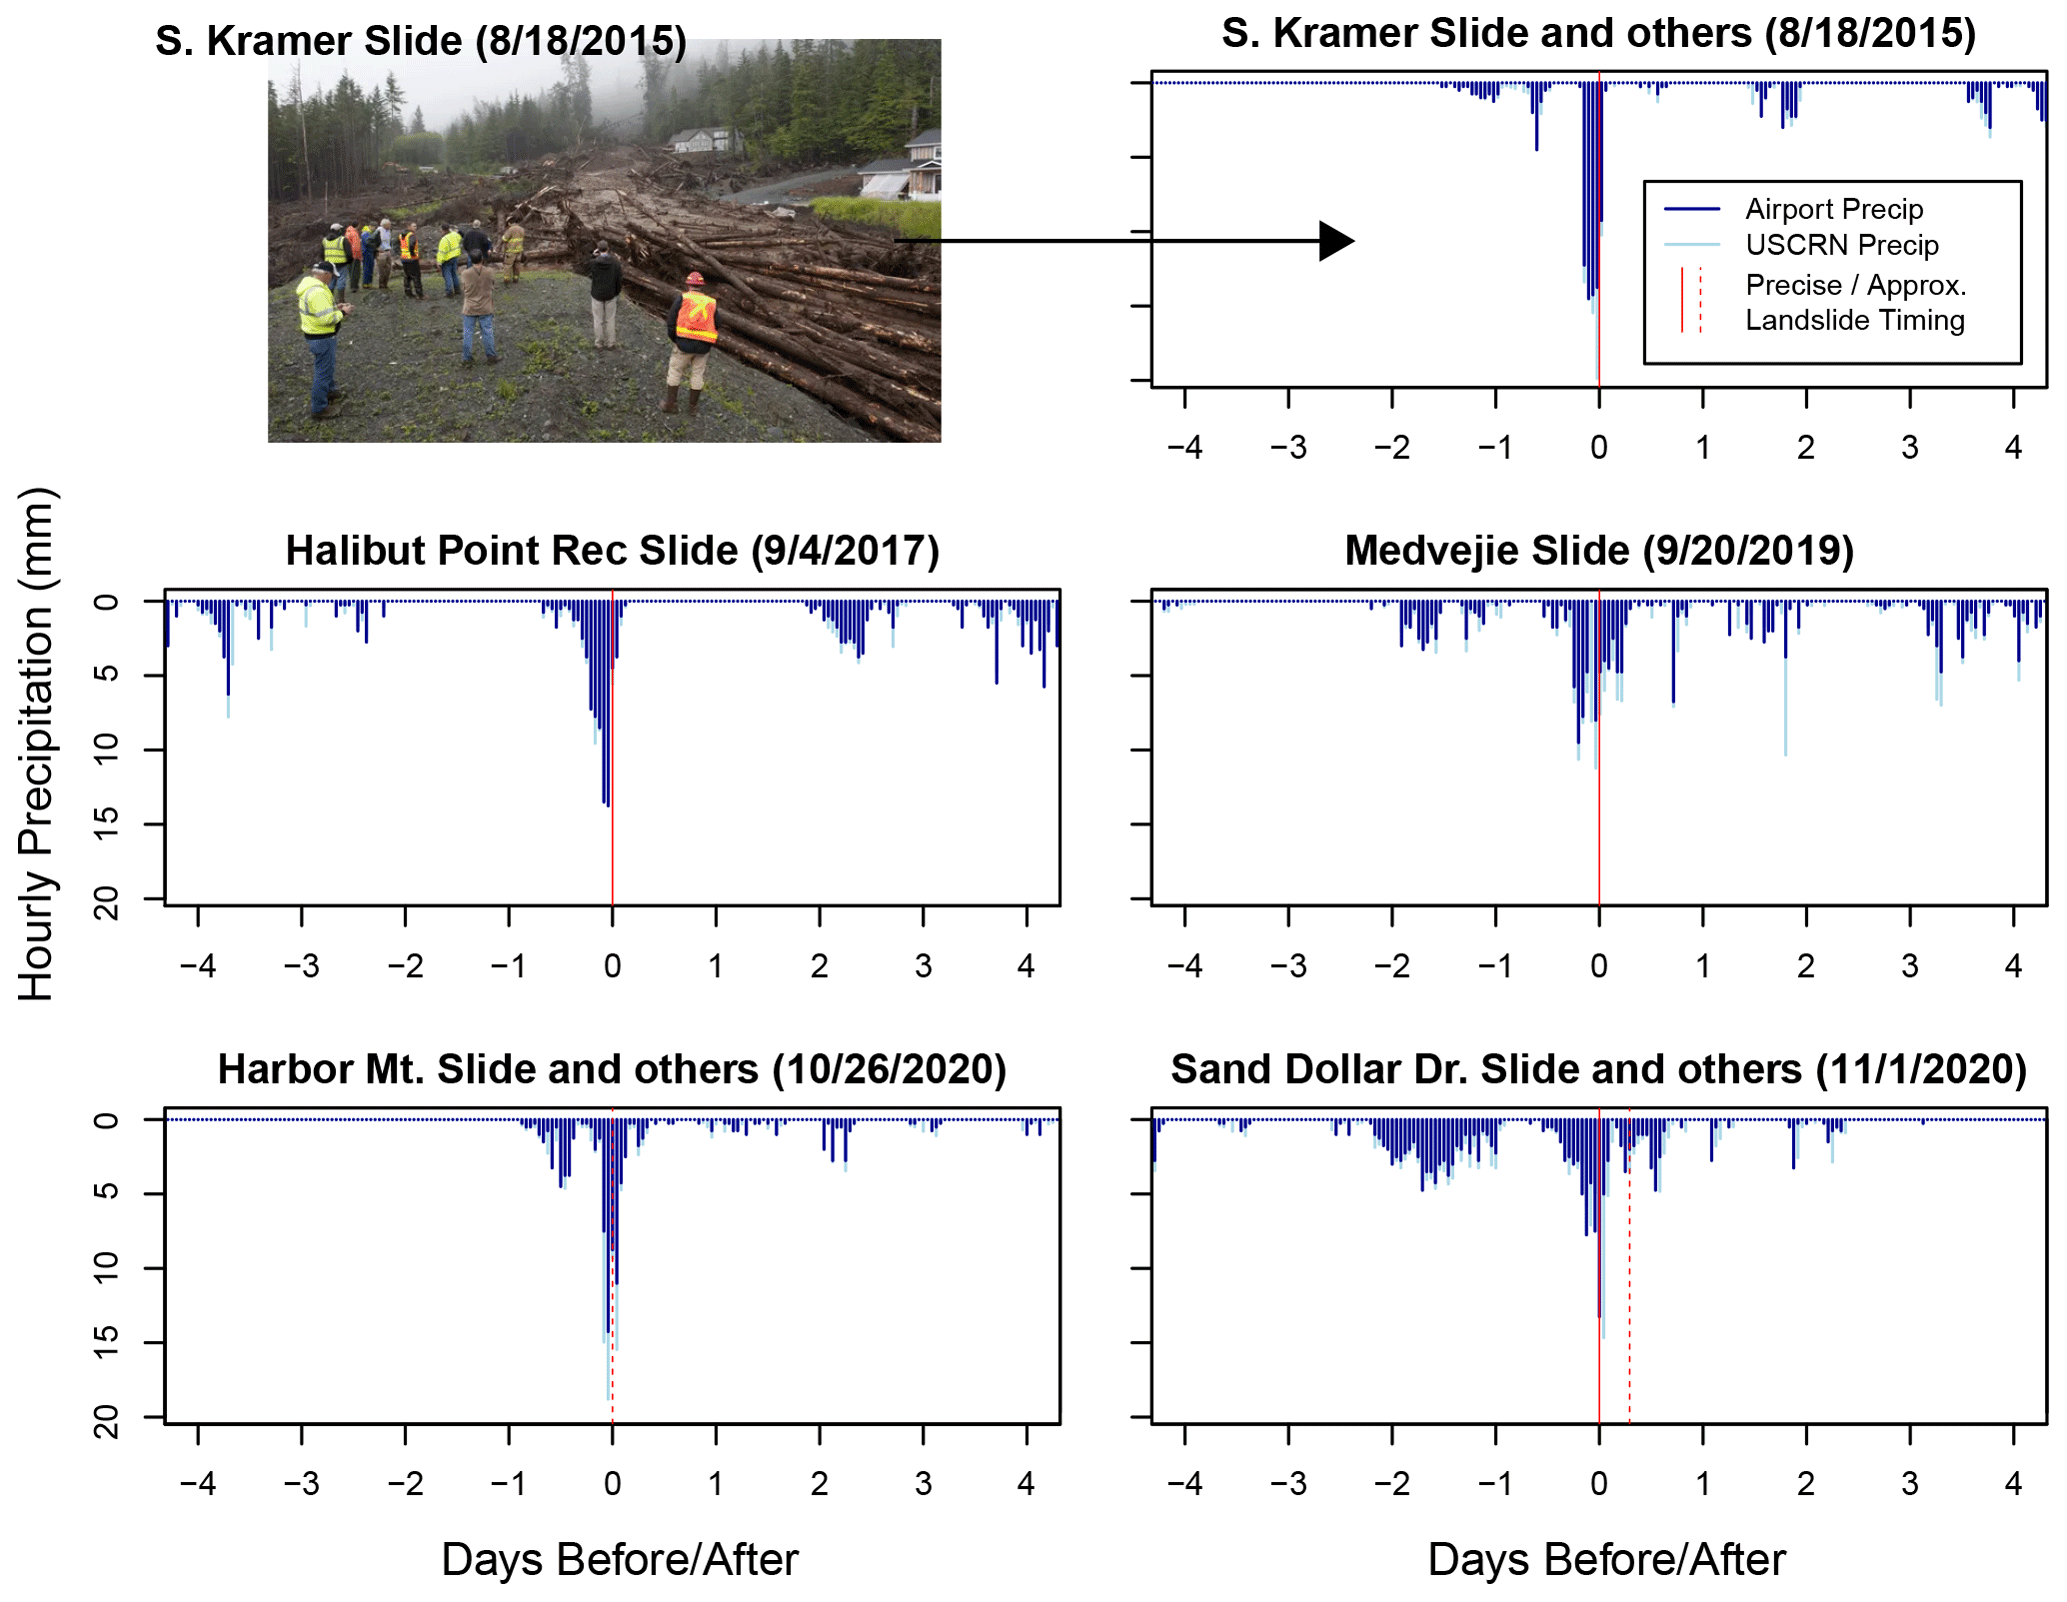
Figure 2Hourly precipitation before, during, and after landslide-initiating storms in Sitka. Landslide prediction models in this paper were trained on the longer record of hourly precipitation at the weather station at Sitka Rocky Gutierrez Airport (darker-blue bars). Recorded precipitation from a nearby weather station at the US Climate Reference Network (USCRN) site in Sitka is also displayed for comparison. Landslide timing is indicated by a solid red line for events where timing is constrained to ∼ 30 min and a dashed line where timing is constrained within ∼ 12 h. Photo courtesy of James Poulson, Daily Sitka Sentinel. The date format is month/day/year.
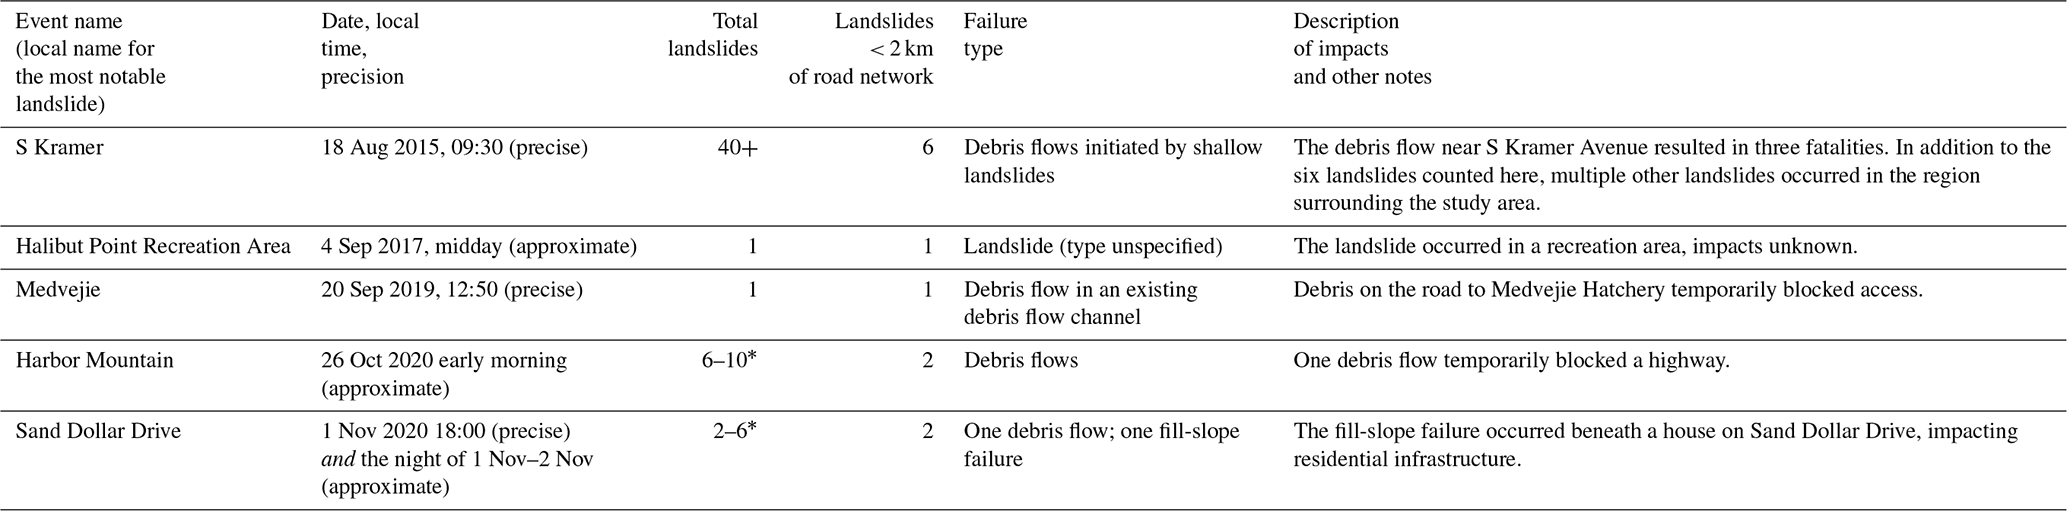
Table 2Summary statistics of recent landslide occurrences near Sitka. Timing is listed as “precise” when the landslide timing is known within 30 min and “approximate” when landslide timing is known in a broader window (∼ 12 h) on the date of initiation. * Four landslides that occurred in fall 2020 are attributed to either the 26 October or the 1 November storms, but it is not known which storm. The landslides that initiated < 2 km of the road network occurred on known dates.
Other landslides have occurred near Sitka but are > 2 km from the road network and sensitive infrastructure. For example, the Starrigavan Landslide occurred several kilometers from town in 2014 and impacted a popular recreation area. Local accounts indicate that precipitation at the initiation site was much higher than precipitation observed at Sitka Rocky Gutierrez Airport. Pronounced spatial heterogeneity in precipitation and weather is typical of southeast Alaska (Hennon et al., 2010; Shanley et al., 2015; Roth et al., 2018), which emphasizes the value of considering only very local (< 2 km from the road network) landslides for training prediction models using station-based precipitation data.
While antecedent precipitation conditions varied during these landslide events, the short-term (several hour) precipitation totals were high. For example, four of the events had peak 1 h precipitation with > 2-year return intervals as calculated by the NWS (Perica et al., 2012). Peak 3 h precipitation during landslide events had between 2- and 25-year return intervals. Precise timing from eyewitness accounts and news records is available for the S Kramer, Halibut Point, Medvejie, and Sand Dollar Drive landslides, which all occurred within a few hours of peak precipitation recorded at Sitka Rocky Gutierrez Airport.
When compared to the record of all precipitation that did not initiate landslides over the last 18 years, the events that produce landslides occur at the extreme high end of the distribution of cumulative precipitation (Fig. 3).
3.2 Landslide hazard prediction
We present results from both frequentist and Bayesian logistic regression and Poisson regression that predict landslide hazard (probability or intensity) based on precipitation totals over timescales ranging from 1 h to 14 d (Figs. 3–6). Differences in model performance indicated by information criteria (Sect. 3.3) show which timescales of precipitation provide the most useful prediction tools. For example, logistic regression based on 2-week precipitation totals is ineffective at separating landslide days from no-landslide days. Logistic regression based on 3 h precipitation, however, does separate landslide days with some overlap (Figs. 3, 4).
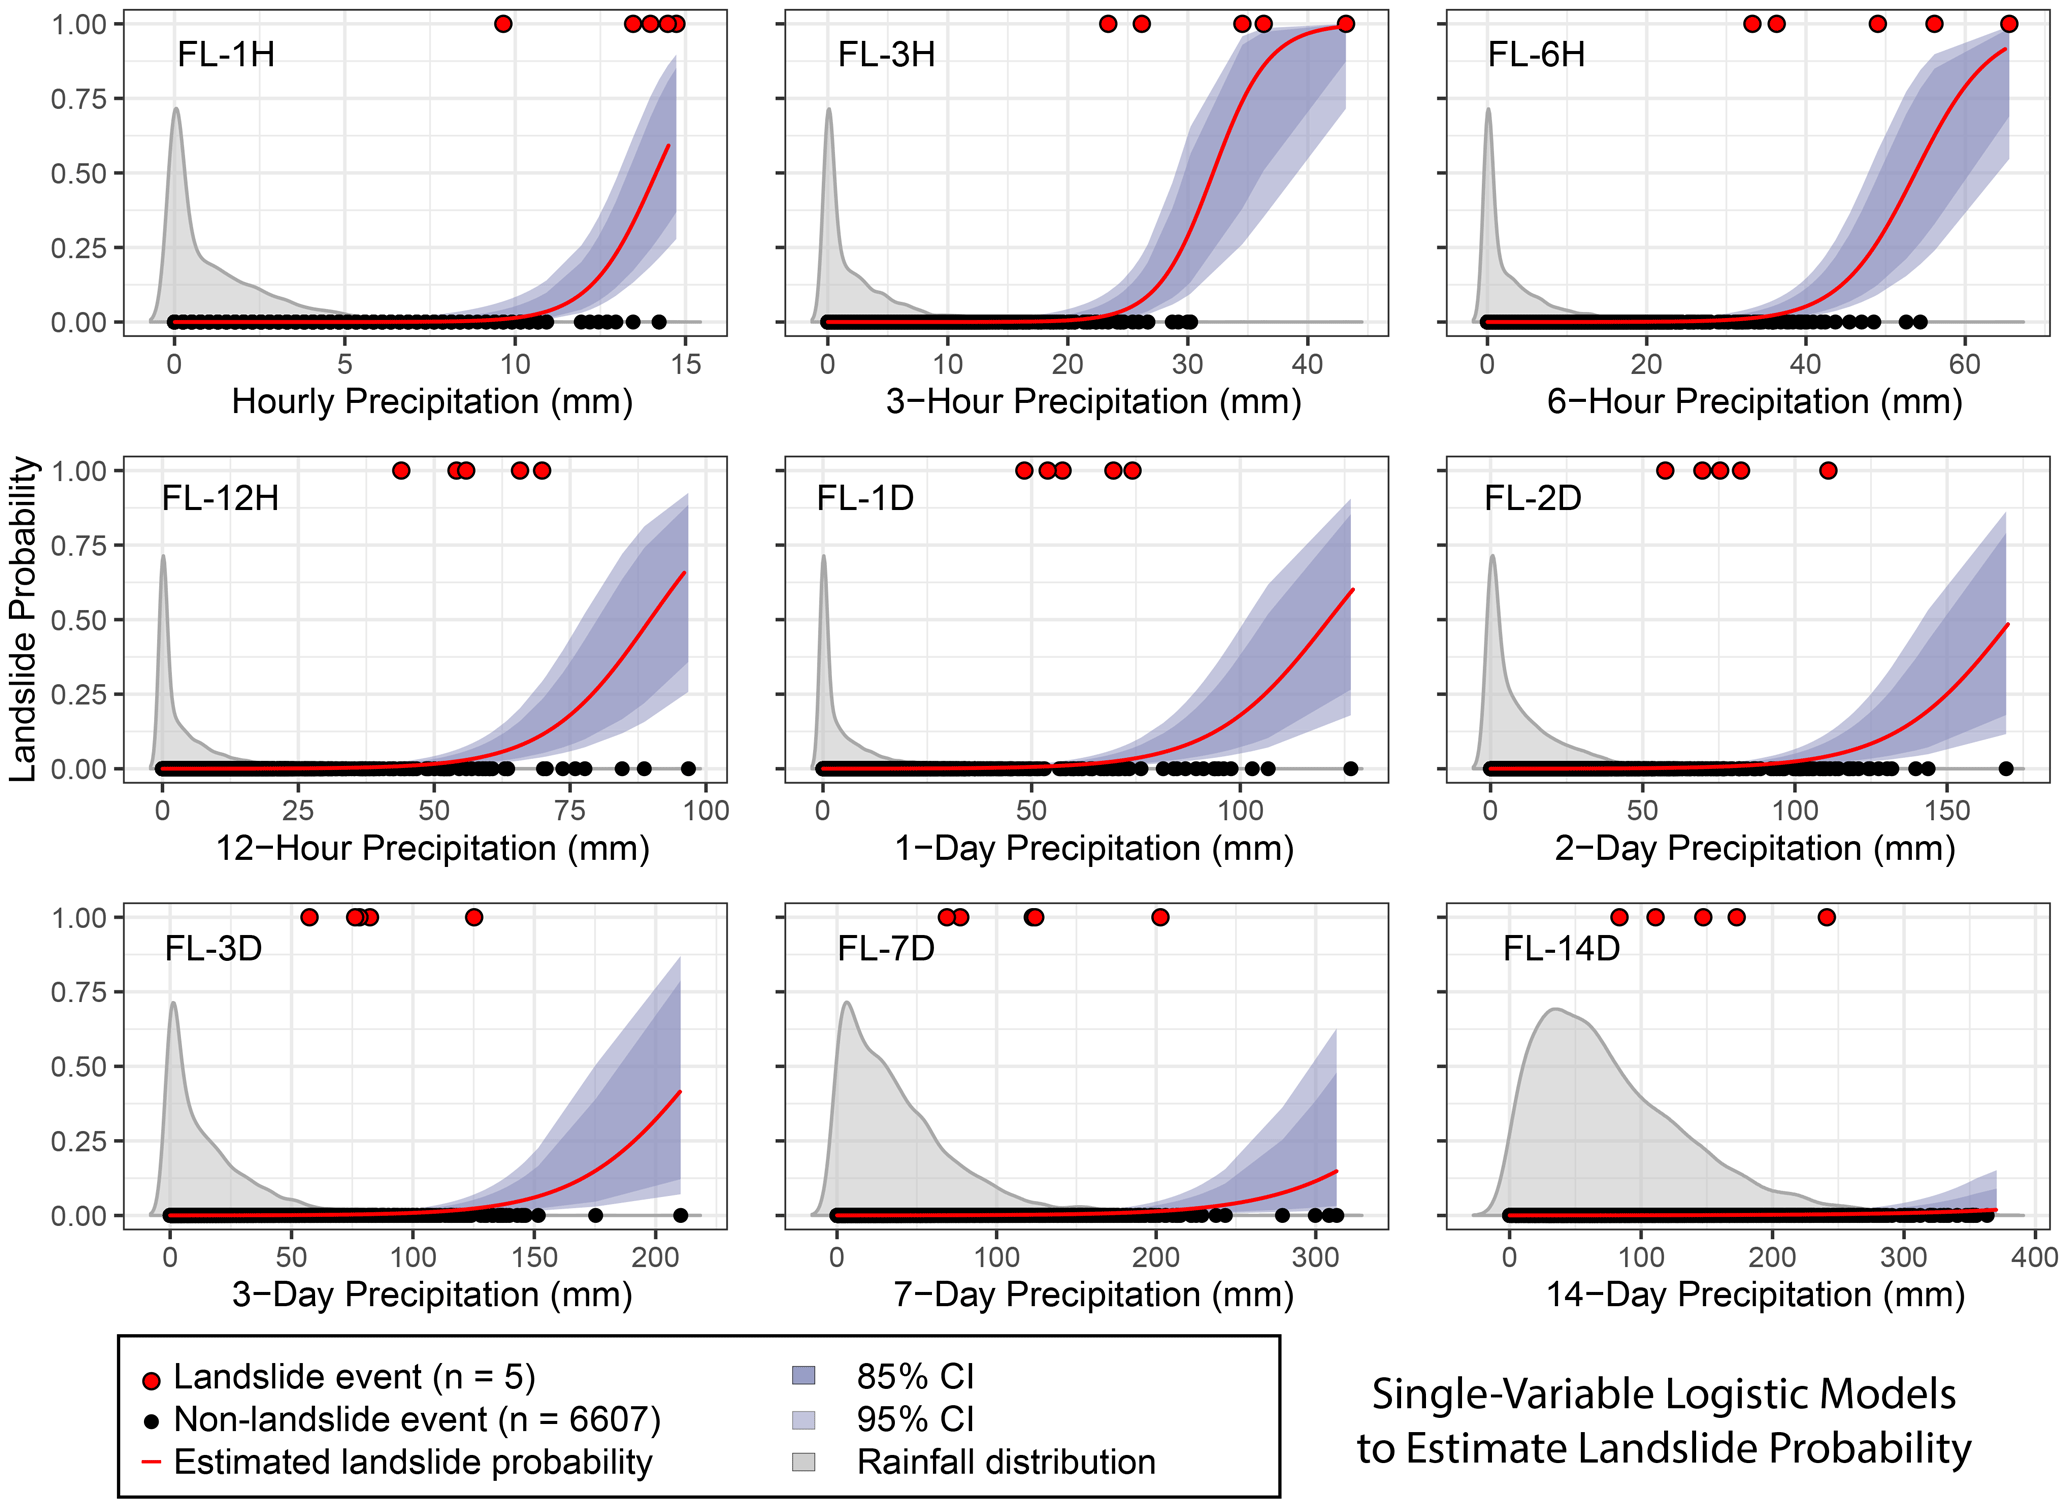
Figure 3Estimated daily landslide probability pd (red curve) from frequentist logistic regression based on different durations of precipitation from 1 h to 2 weeks. Confidence intervals (CIs) were estimated based on standard error. Event outcomes (red circles) of 1 indicate at least one landslide occurred, while 0 indicates no landslide occurred. The 3 h precipitation produces the model with the best fit (lowest estimated out-of-sample prediction error based on Akaike information criterion (AIC) and Bayesian information criterion (BIC) fit parameters; Fig. 7). Kernel density distribution of all observed precipitation values are shown in gray, scaled for visual clarity.
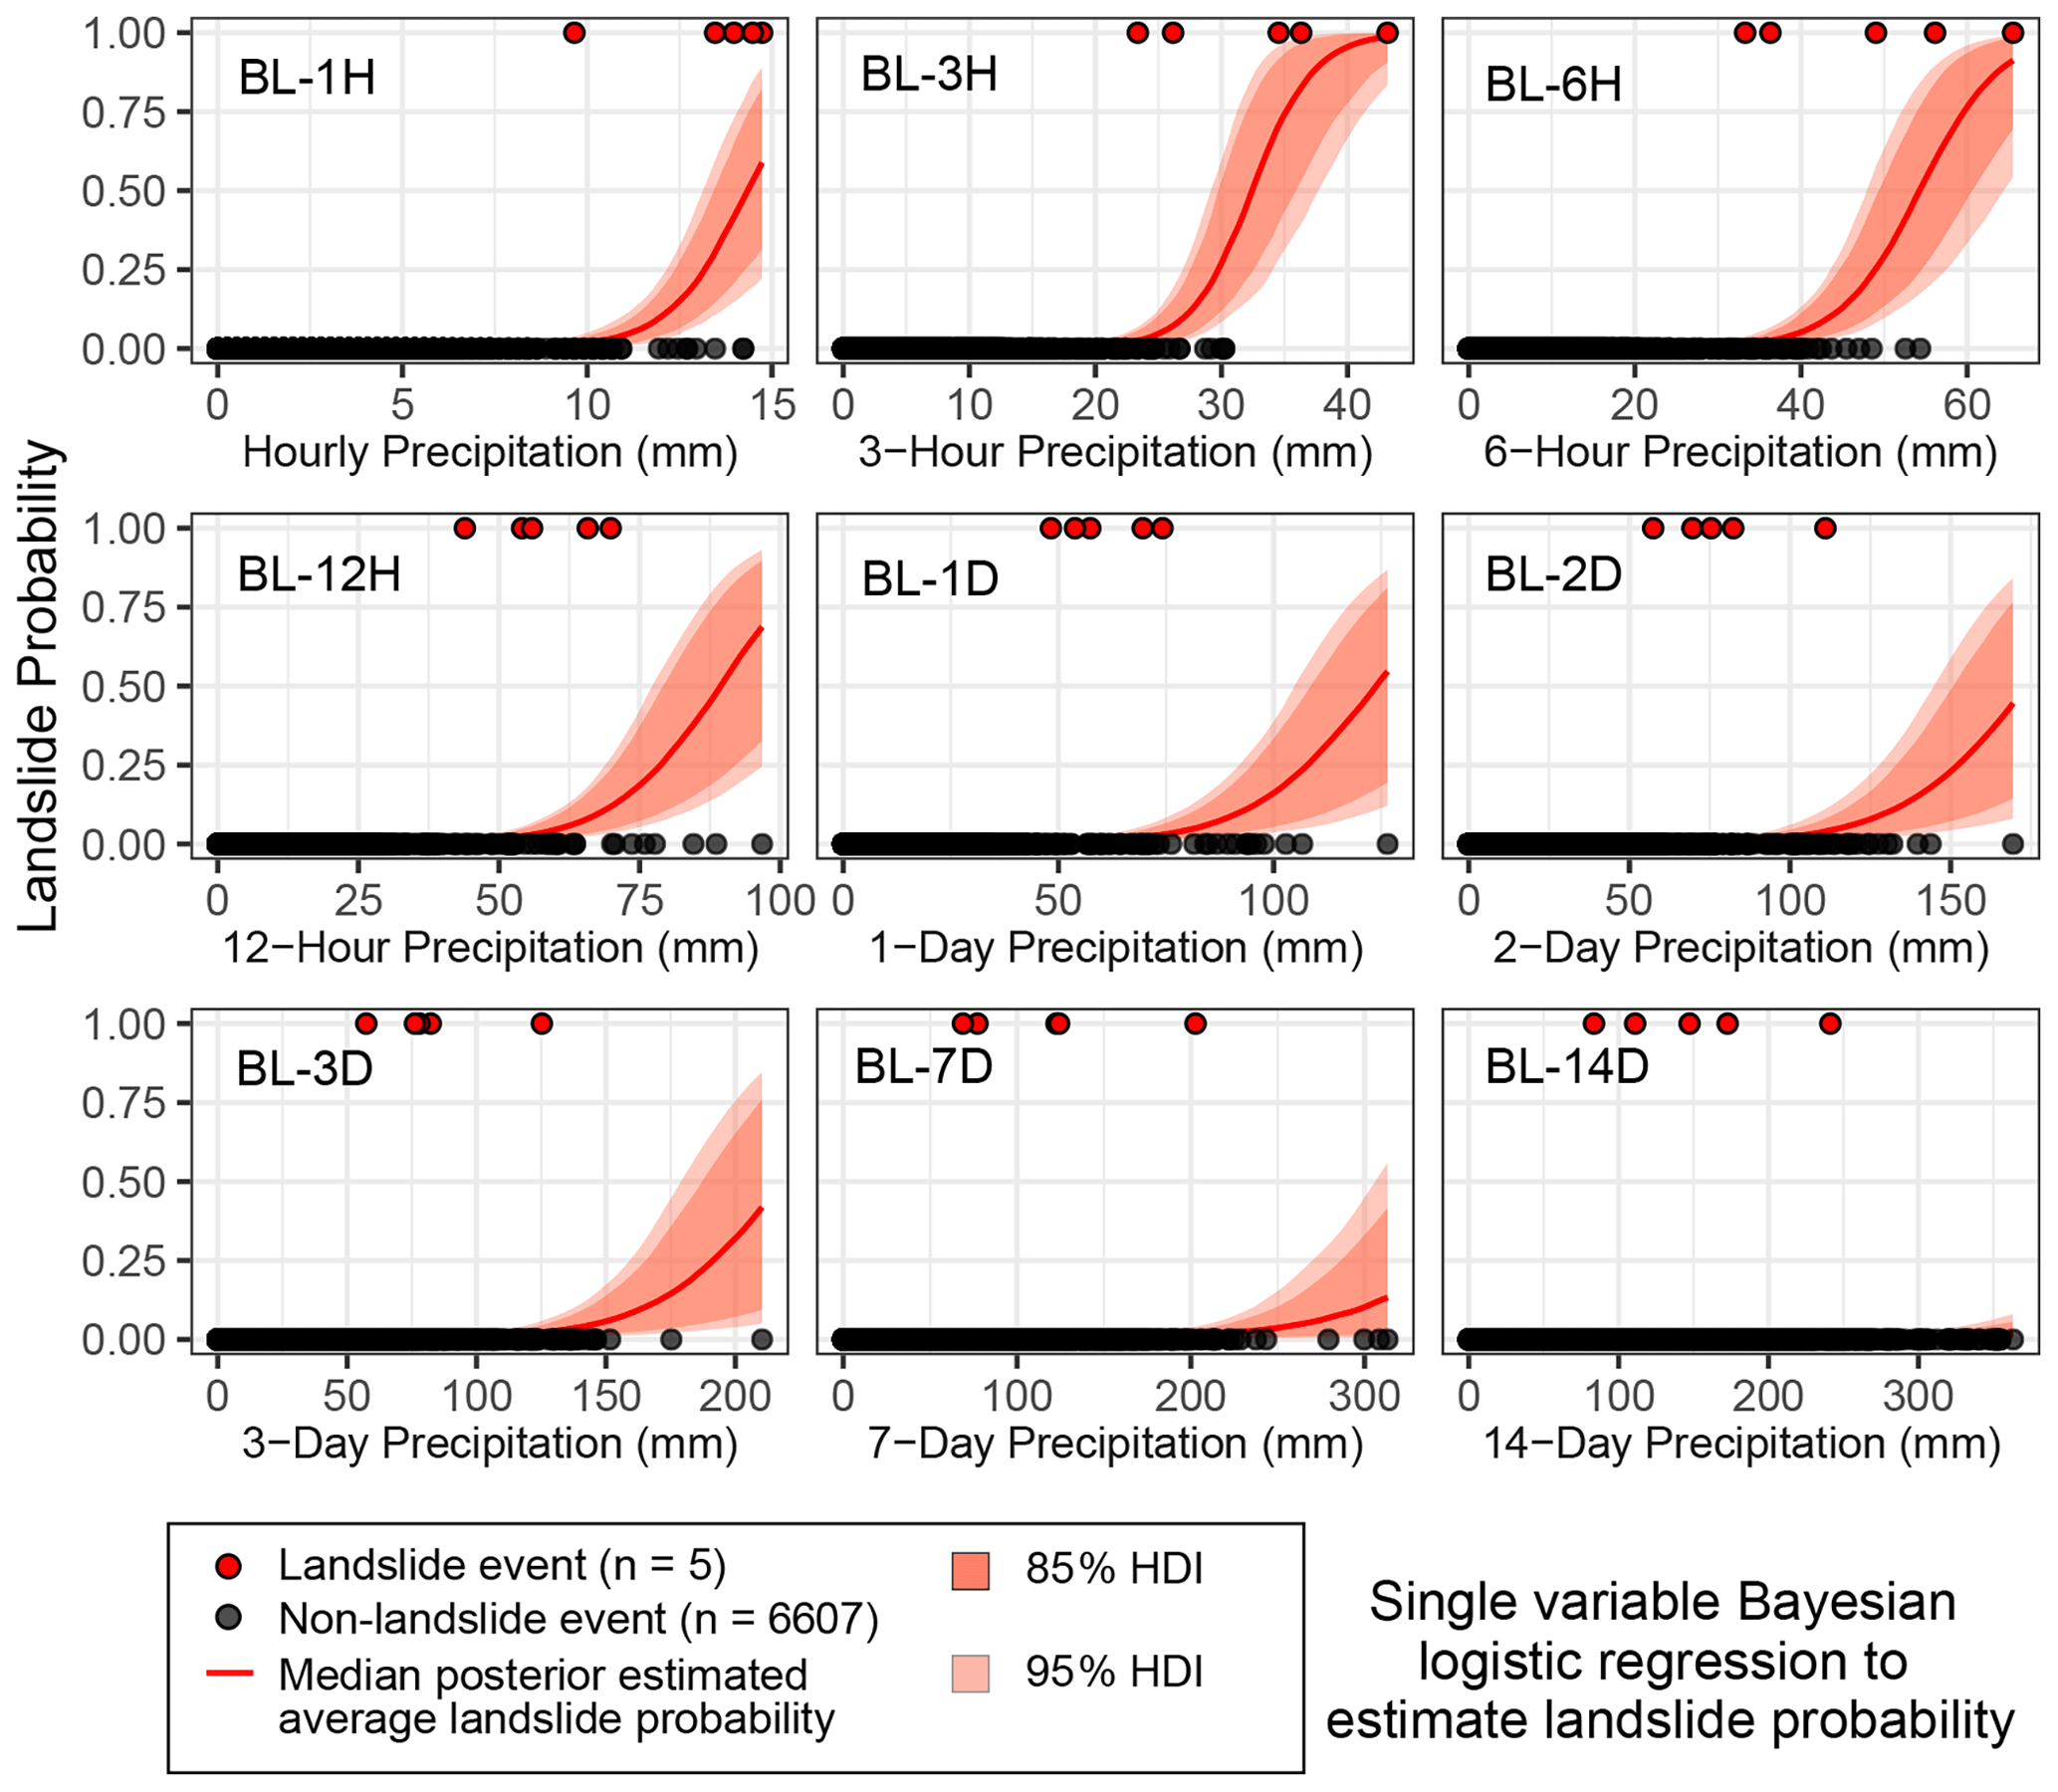
Figure 4Estimated daily landslide probability pd from Bayesian logistic regression, showing the posterior median (red curve) with 85 % (darker orange) and 95 % (lighter orange) highest density intervals (HDIs). The 95 % HDI is the posterior estimate of parameter uncertainty and contains 95 % of the distribution of all parameter values compatible with the data and our prior knowledge. At a single precipitation value, the 95 % HDI contains the true landslide probability with 95 % probability, conditional on the data, the model, and our prior knowledge. The 3 h precipitation gives the best out-of-sample predictive accuracy as measured by the leave-one-out information criterion (LOOIC) (Fig. 8).
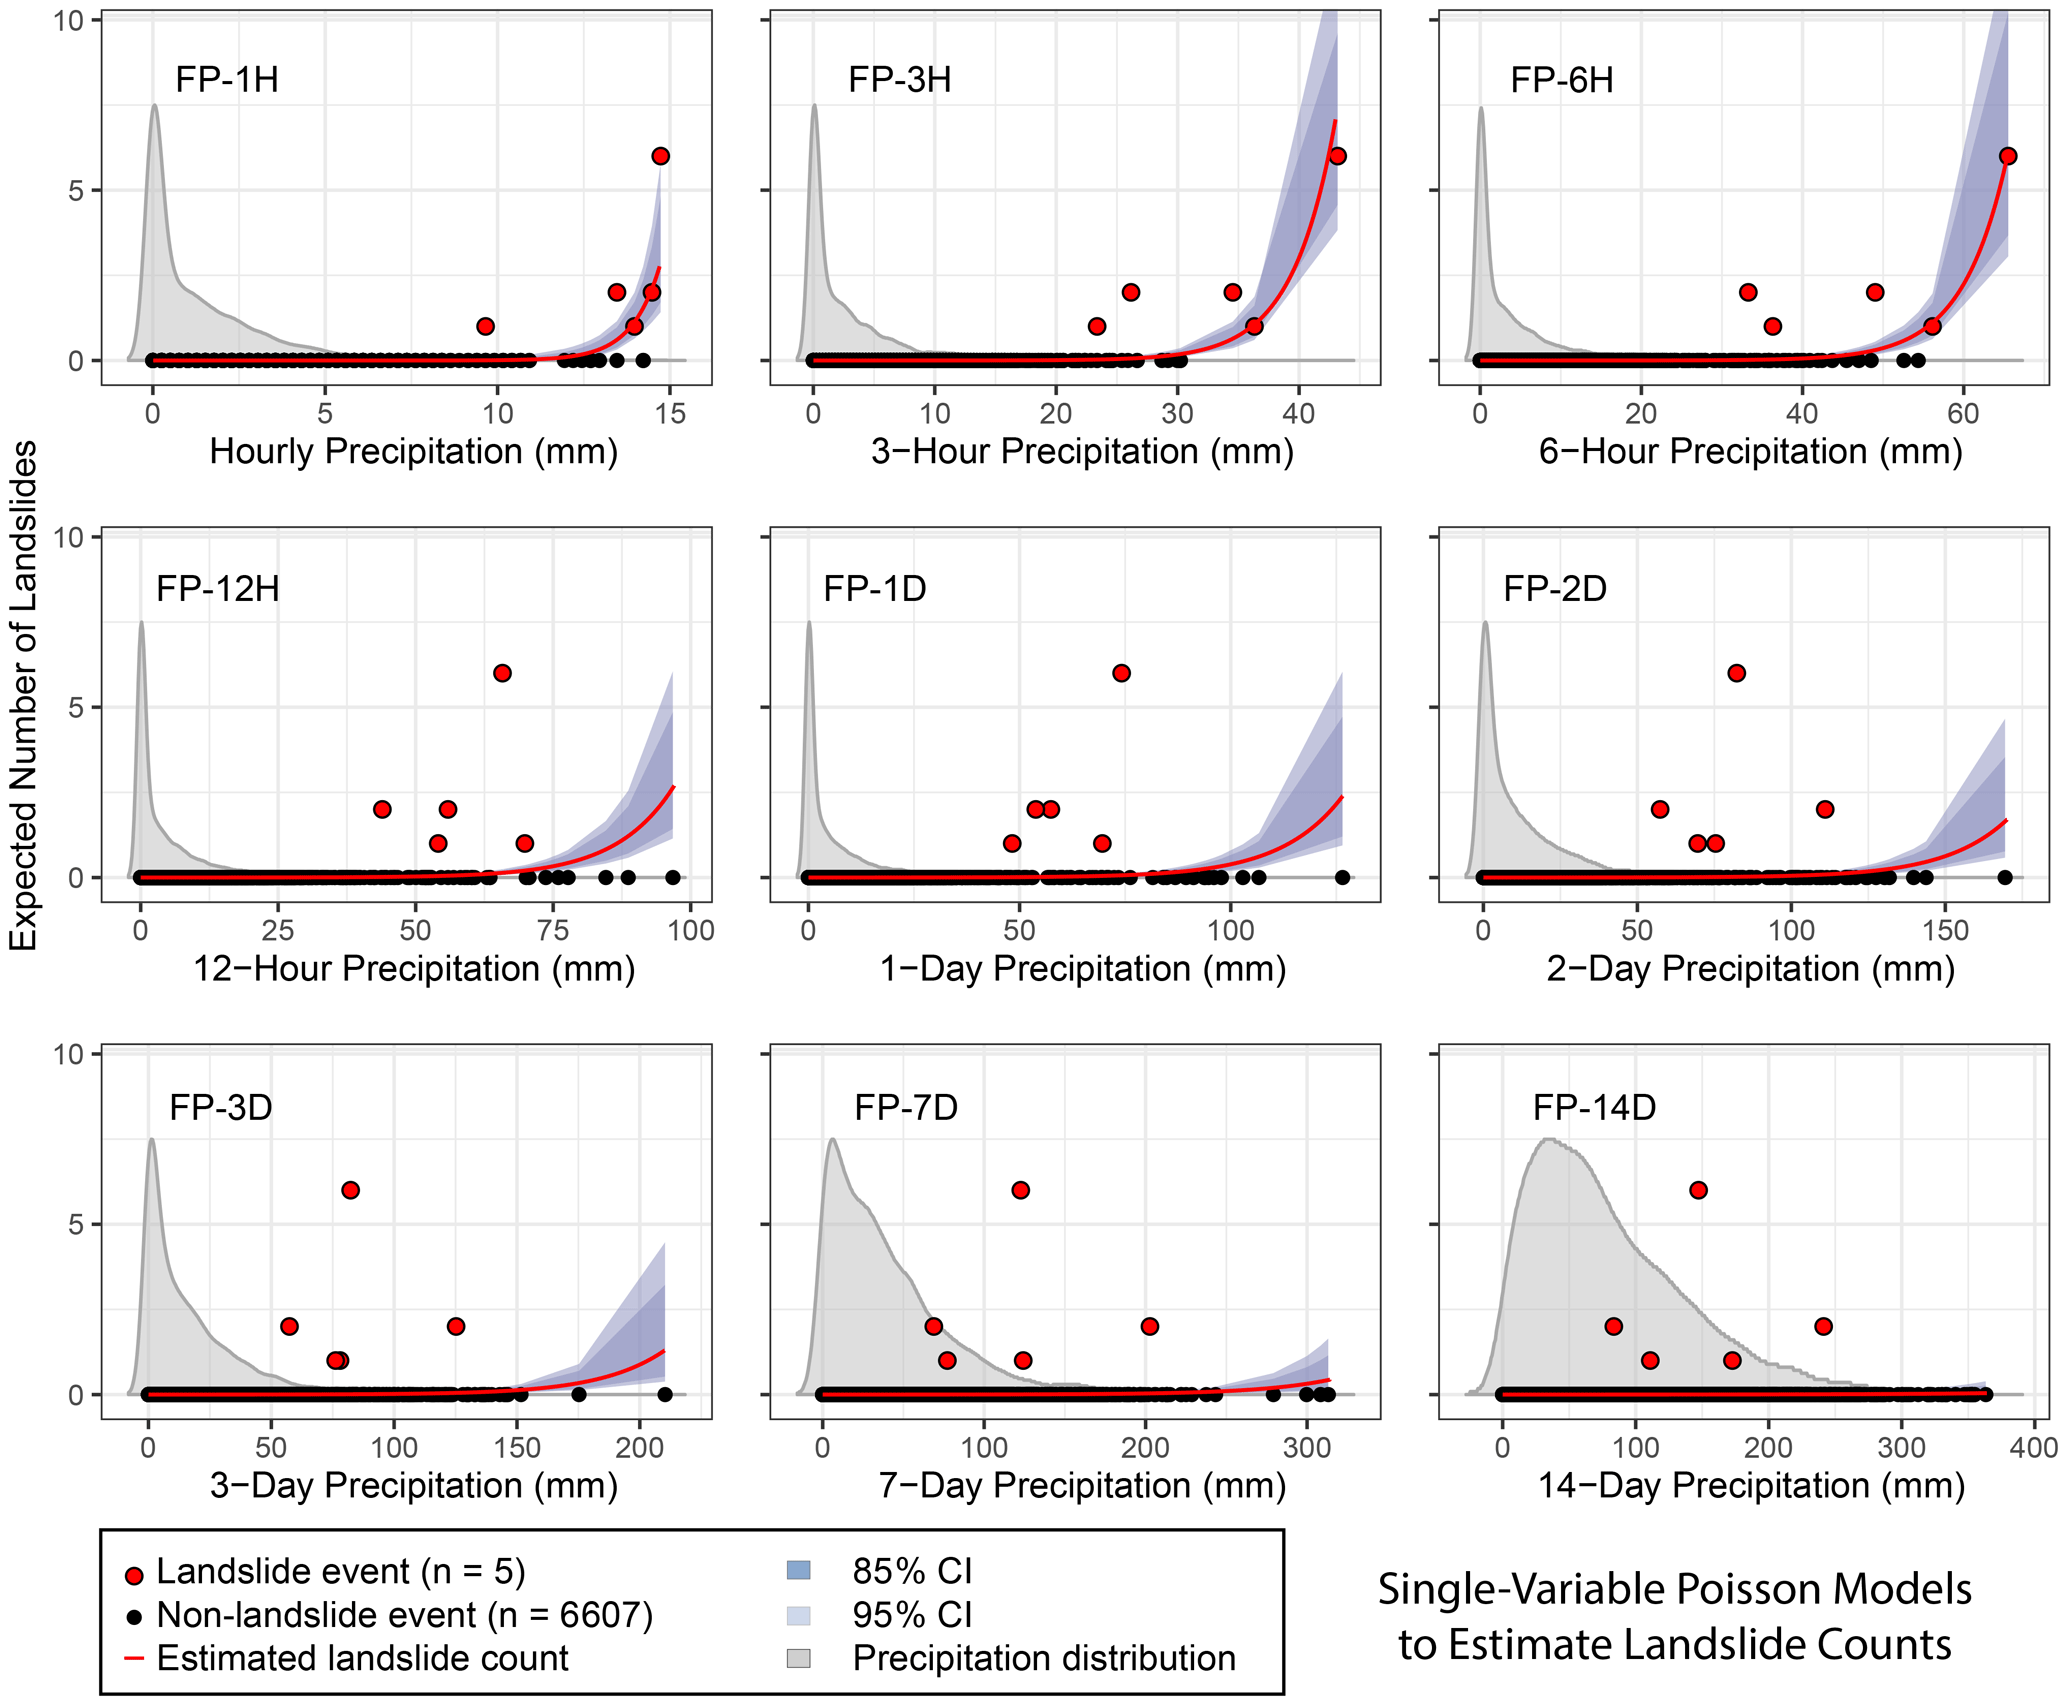
Figure 5Estimated daily average landslide count (red curve) from frequentist Poisson regression (λd) based on different durations of precipitation from 1 h to 2 weeks. Event outcomes (red circles) of ≥ 1 indicate the number of landslides that were reported, while 0 indicates no landslide reported. Confidence intervals (CIs) were estimated based on standard error. The 3 h precipitation produces the model with the best fit (lowest estimated out-of-sample prediction error based on Akaike information criterion (AIC) and Bayesian information criterion (BIC) fit parameters; Fig. 7). Kernel density distribution of all observed precipitation values are shown in gray, scaled for visual clarity.
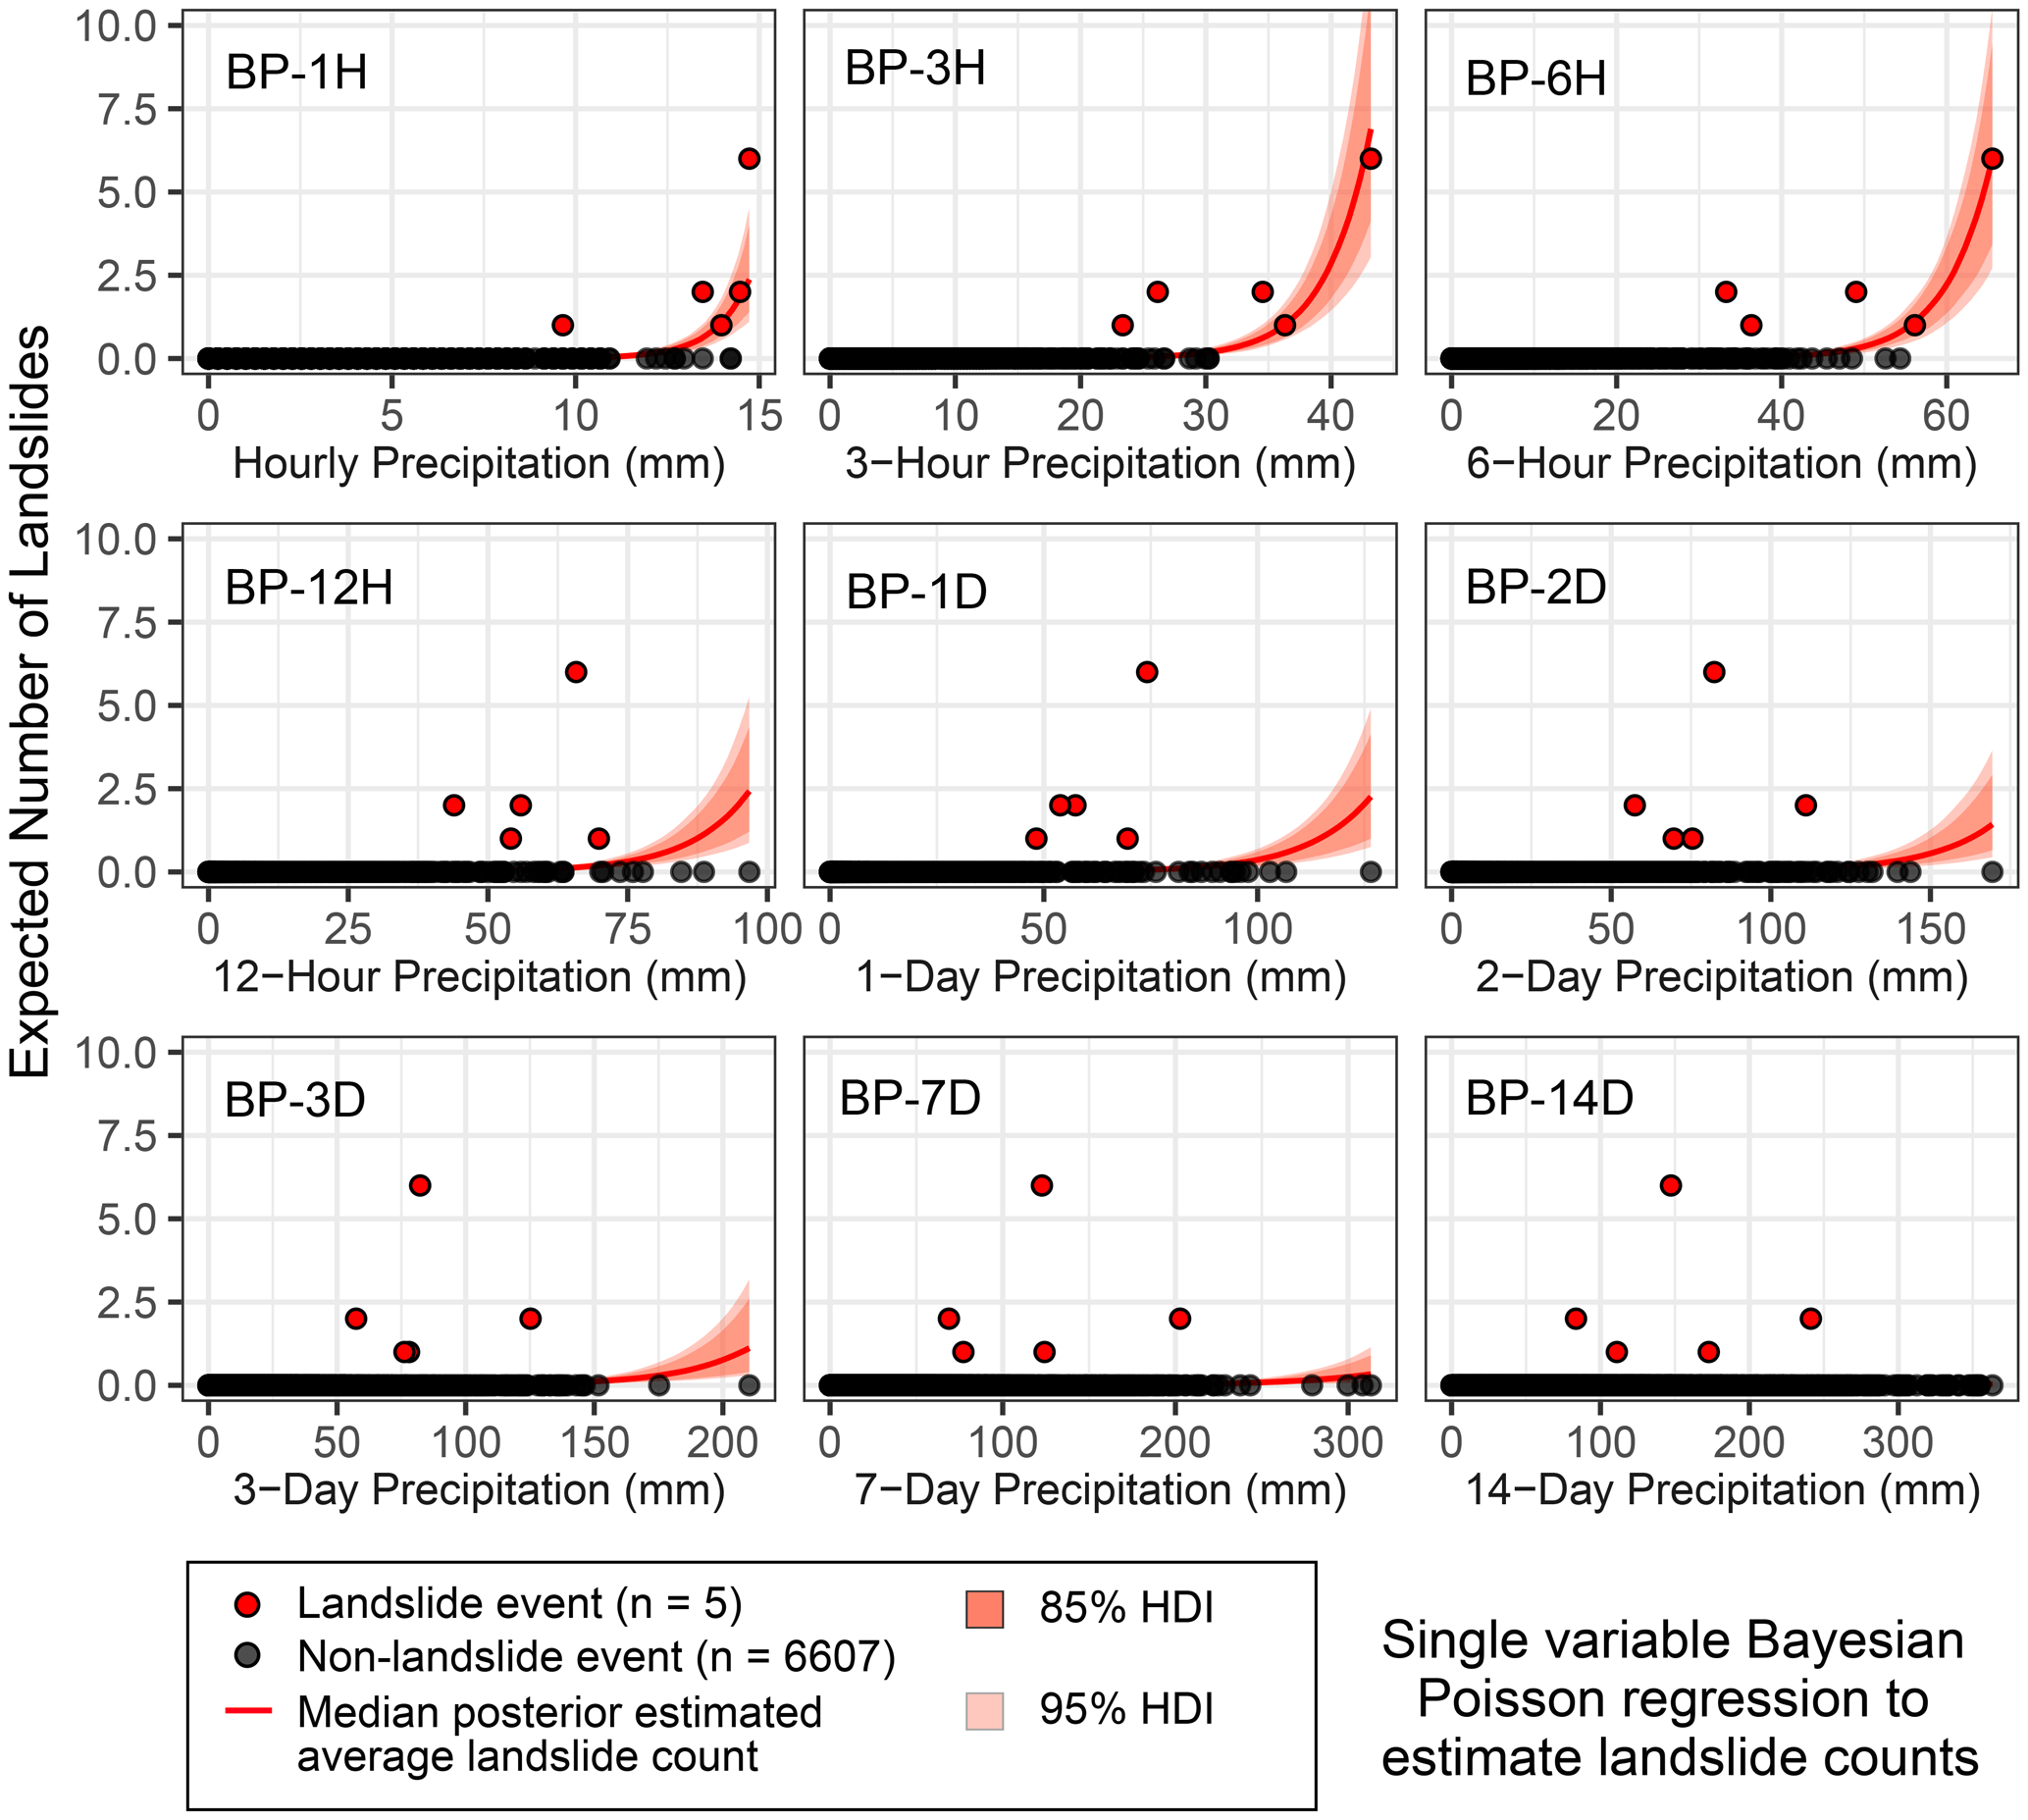
Figure 6Posterior Bayesian Poisson regression results, showing the posterior median for the daily average estimated number of landslides λd (red curve) with 85 % (darker orange) and 95 % (lighter orange) highest density intervals (HDIs). The 3 h precipitation gives the best out-of-sample predictive accuracy as measured by the leave-one-out information criterion (LOOIC) (Fig. 8).
3.3 Model comparison and evaluation
Models that incorporated short-term precipitation (3 h) demonstrated the best fit to the data and lowest estimated out-of-sample prediction errors (Figs. 7–8). All models that incorporate a metric of precipitation on the day of the landslide show lower AIC, BIC, and LOOIC values than models based on accumulated precipitation over multiple days.
We note that for many of the Bayesian models with longer precipitation timescales (> 1 d), Pareto-k values for some of the landslide days were > 0.7, indicating that these models would be very unlikely to predict a landslide at that precipitation value. In contrast, Pareto-k values for all landslide days in the 3 h logistic regression model are < 0.7, confirming that this model is not overly sensitive to the individual landslide points. (Pareto-k values are 0.28, 0.23, 0.47, 0.20, and 0.34 for model BL-3H.)
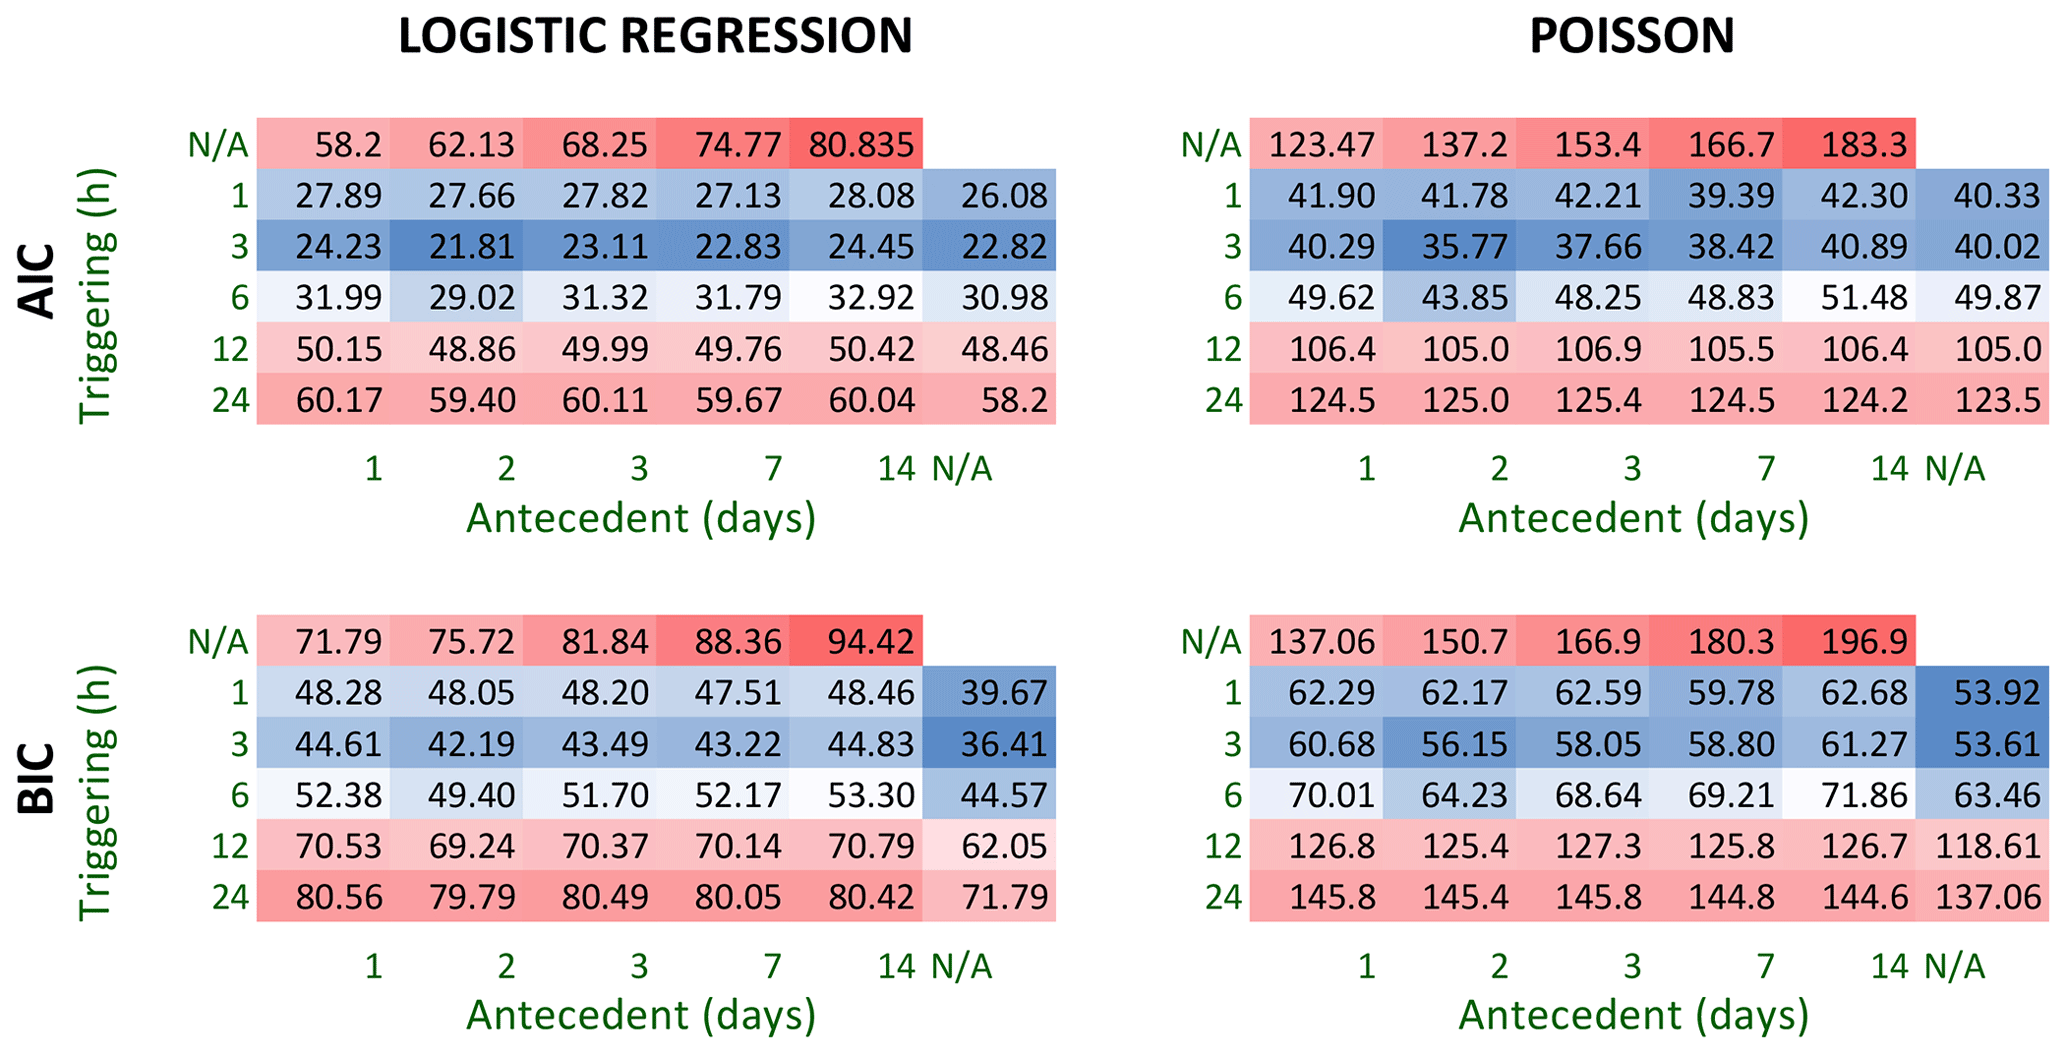
Figure 7Information criteria for a suite of frequentist models that estimate landslide probability (logistic regression) or the number of landslides (Poisson regression) for a given precipitation characteristic. Each cell corresponds to a model with one or two precipitation parameters, including daily maximum cumulative precipitation measured over 1–24 h (triggering) and antecedent precipitation measured over 1–14 d. Lower Akaike information criterion (AIC) and Bayesian information criterion (BIC) values (blue) correspond to a better model fit (lower estimated prediction error), and higher AIC and BIC values (red) correspond to a worse model fit. BIC more heavily penalizes complex models with multiple predictor variables. AIC and BIC scores are specific to a regression type and should not be compared between the logistic regression (probability output) and the Poisson regression (count output).
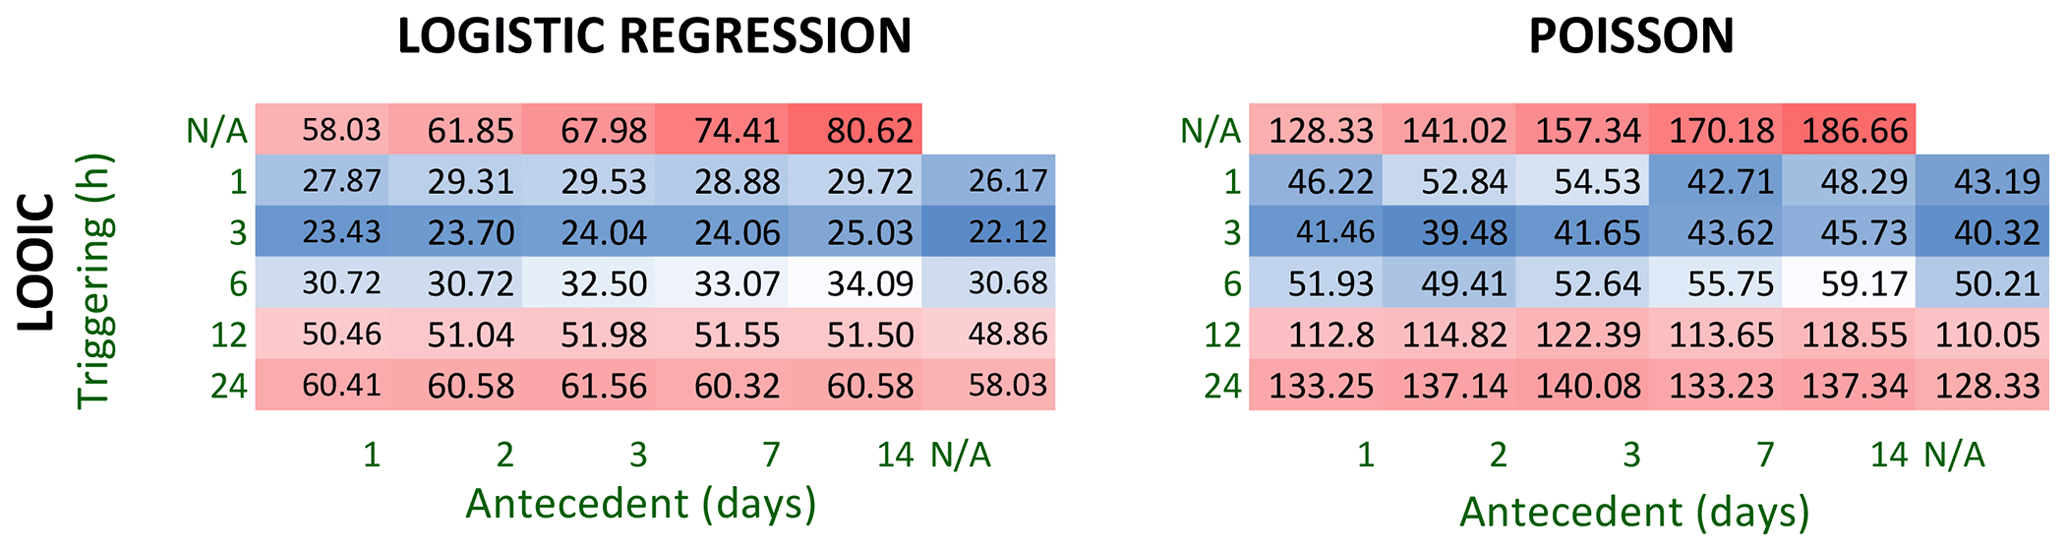
Figure 8Model comparison based on the leave-one-out information criterion (LOOIC) for a suite of Bayesian models that estimate landslide probability and average count for a given precipitation characteristic. Each cell corresponds to a model with one or two precipitation parameters, including daily maximum cumulative precipitation measured over 1–24 h (triggering) and antecedent precipitation measured over 1–14 d. Lower LOOIC values (blue) correspond to higher out-of-sample predictive accuracy, and higher LOOIC values (red) correspond to lower accuracy.
We also qualitatively evaluated the model fit by comparing the estimated landslide probability of the best-fit two-variable models that incorporate 3 h triggering precipitation with 1 d (FL-3H1D) and 2 d (FL-3H2D) antecedent precipitation, respectively, and the model FL-3H, the best-fit one-variable model that considers only 3 h triggering precipitation (Fig. 9). Using either the 24 or the 48 h antecedent precipitation as another predictor does modify the probability contours in Fig. 9b and d, but the trade-off between false and failed alarms is largely unchanged across all threshold values. Most observed landslides cluster at high to extreme triggering precipitation values and low or moderate antecedent precipitation totals. Increased model complexity does not significantly improve the model fit for the available database of landslide occurrence (Figs. 7–8).
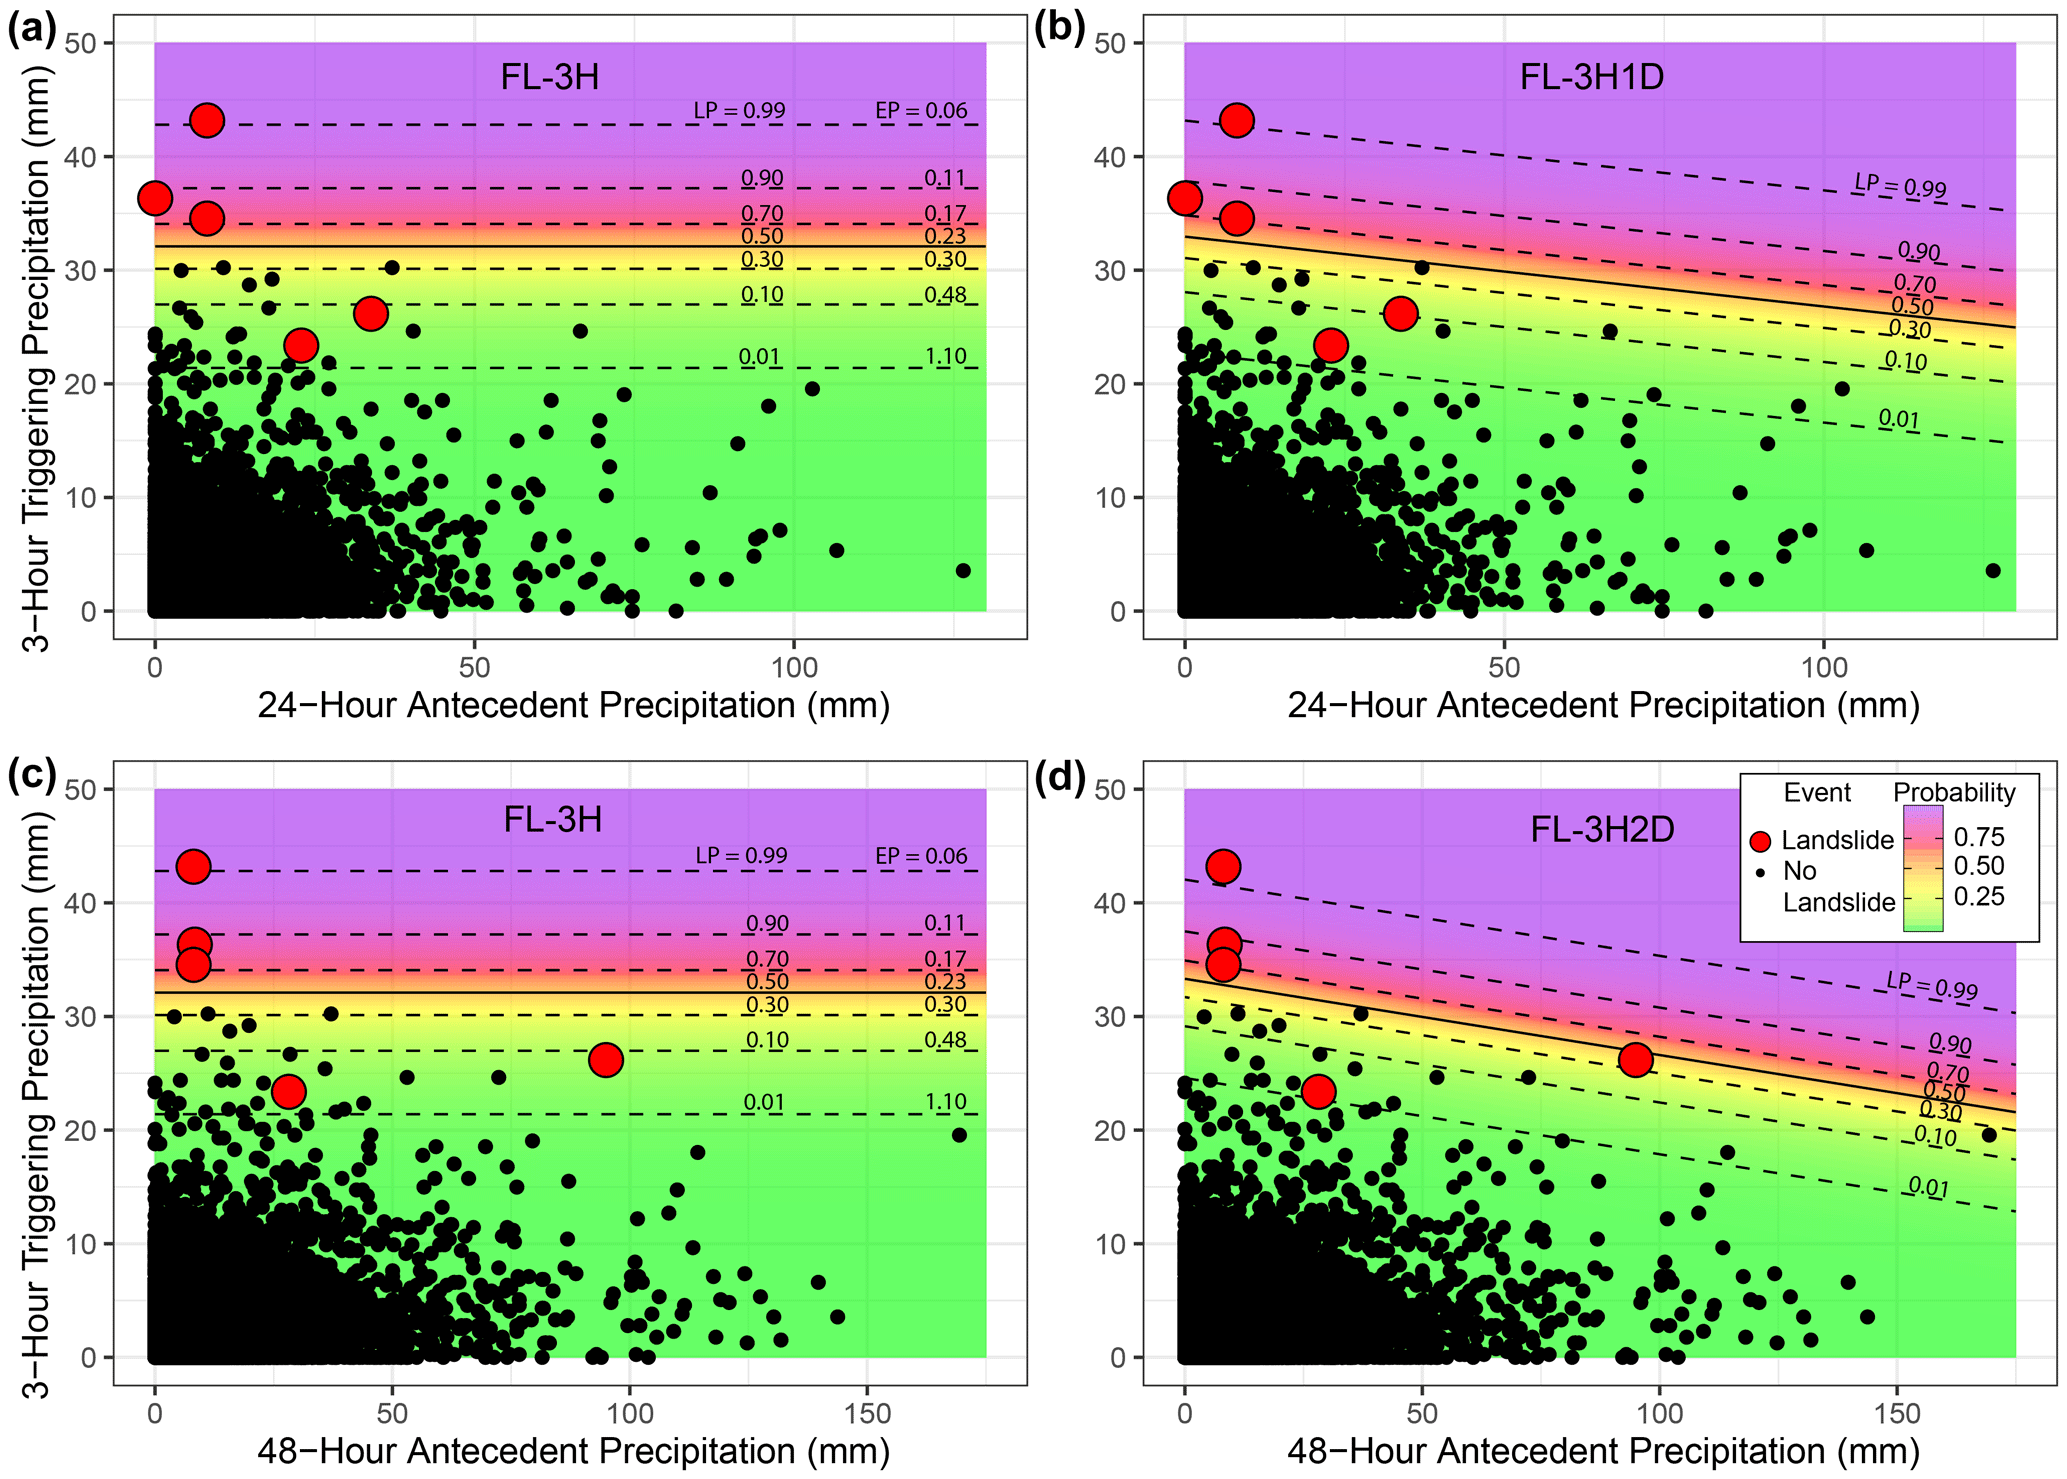
Figure 9Estimated landslide probability at varying precipitation values from the preferred “trigger-only” frequentist logistic regression model (FL-3H, panels a and c) compared to models that include antecedent precipitation (panels b and d, models FL-3H1D and FL-3H2D, respectively). The color gradient and black contours show estimated landslide probability with reported data shown as black points (no-landslide day) or red points (one or more landslides). The 3 h annual exceedance probabilities (EPs) reported by the NWS (Perica et al., 2012) are also plotted for the precipitation totals that generate the associated landslide probability (LP) contours from frequentist logistic regression in panels (a) and (c).
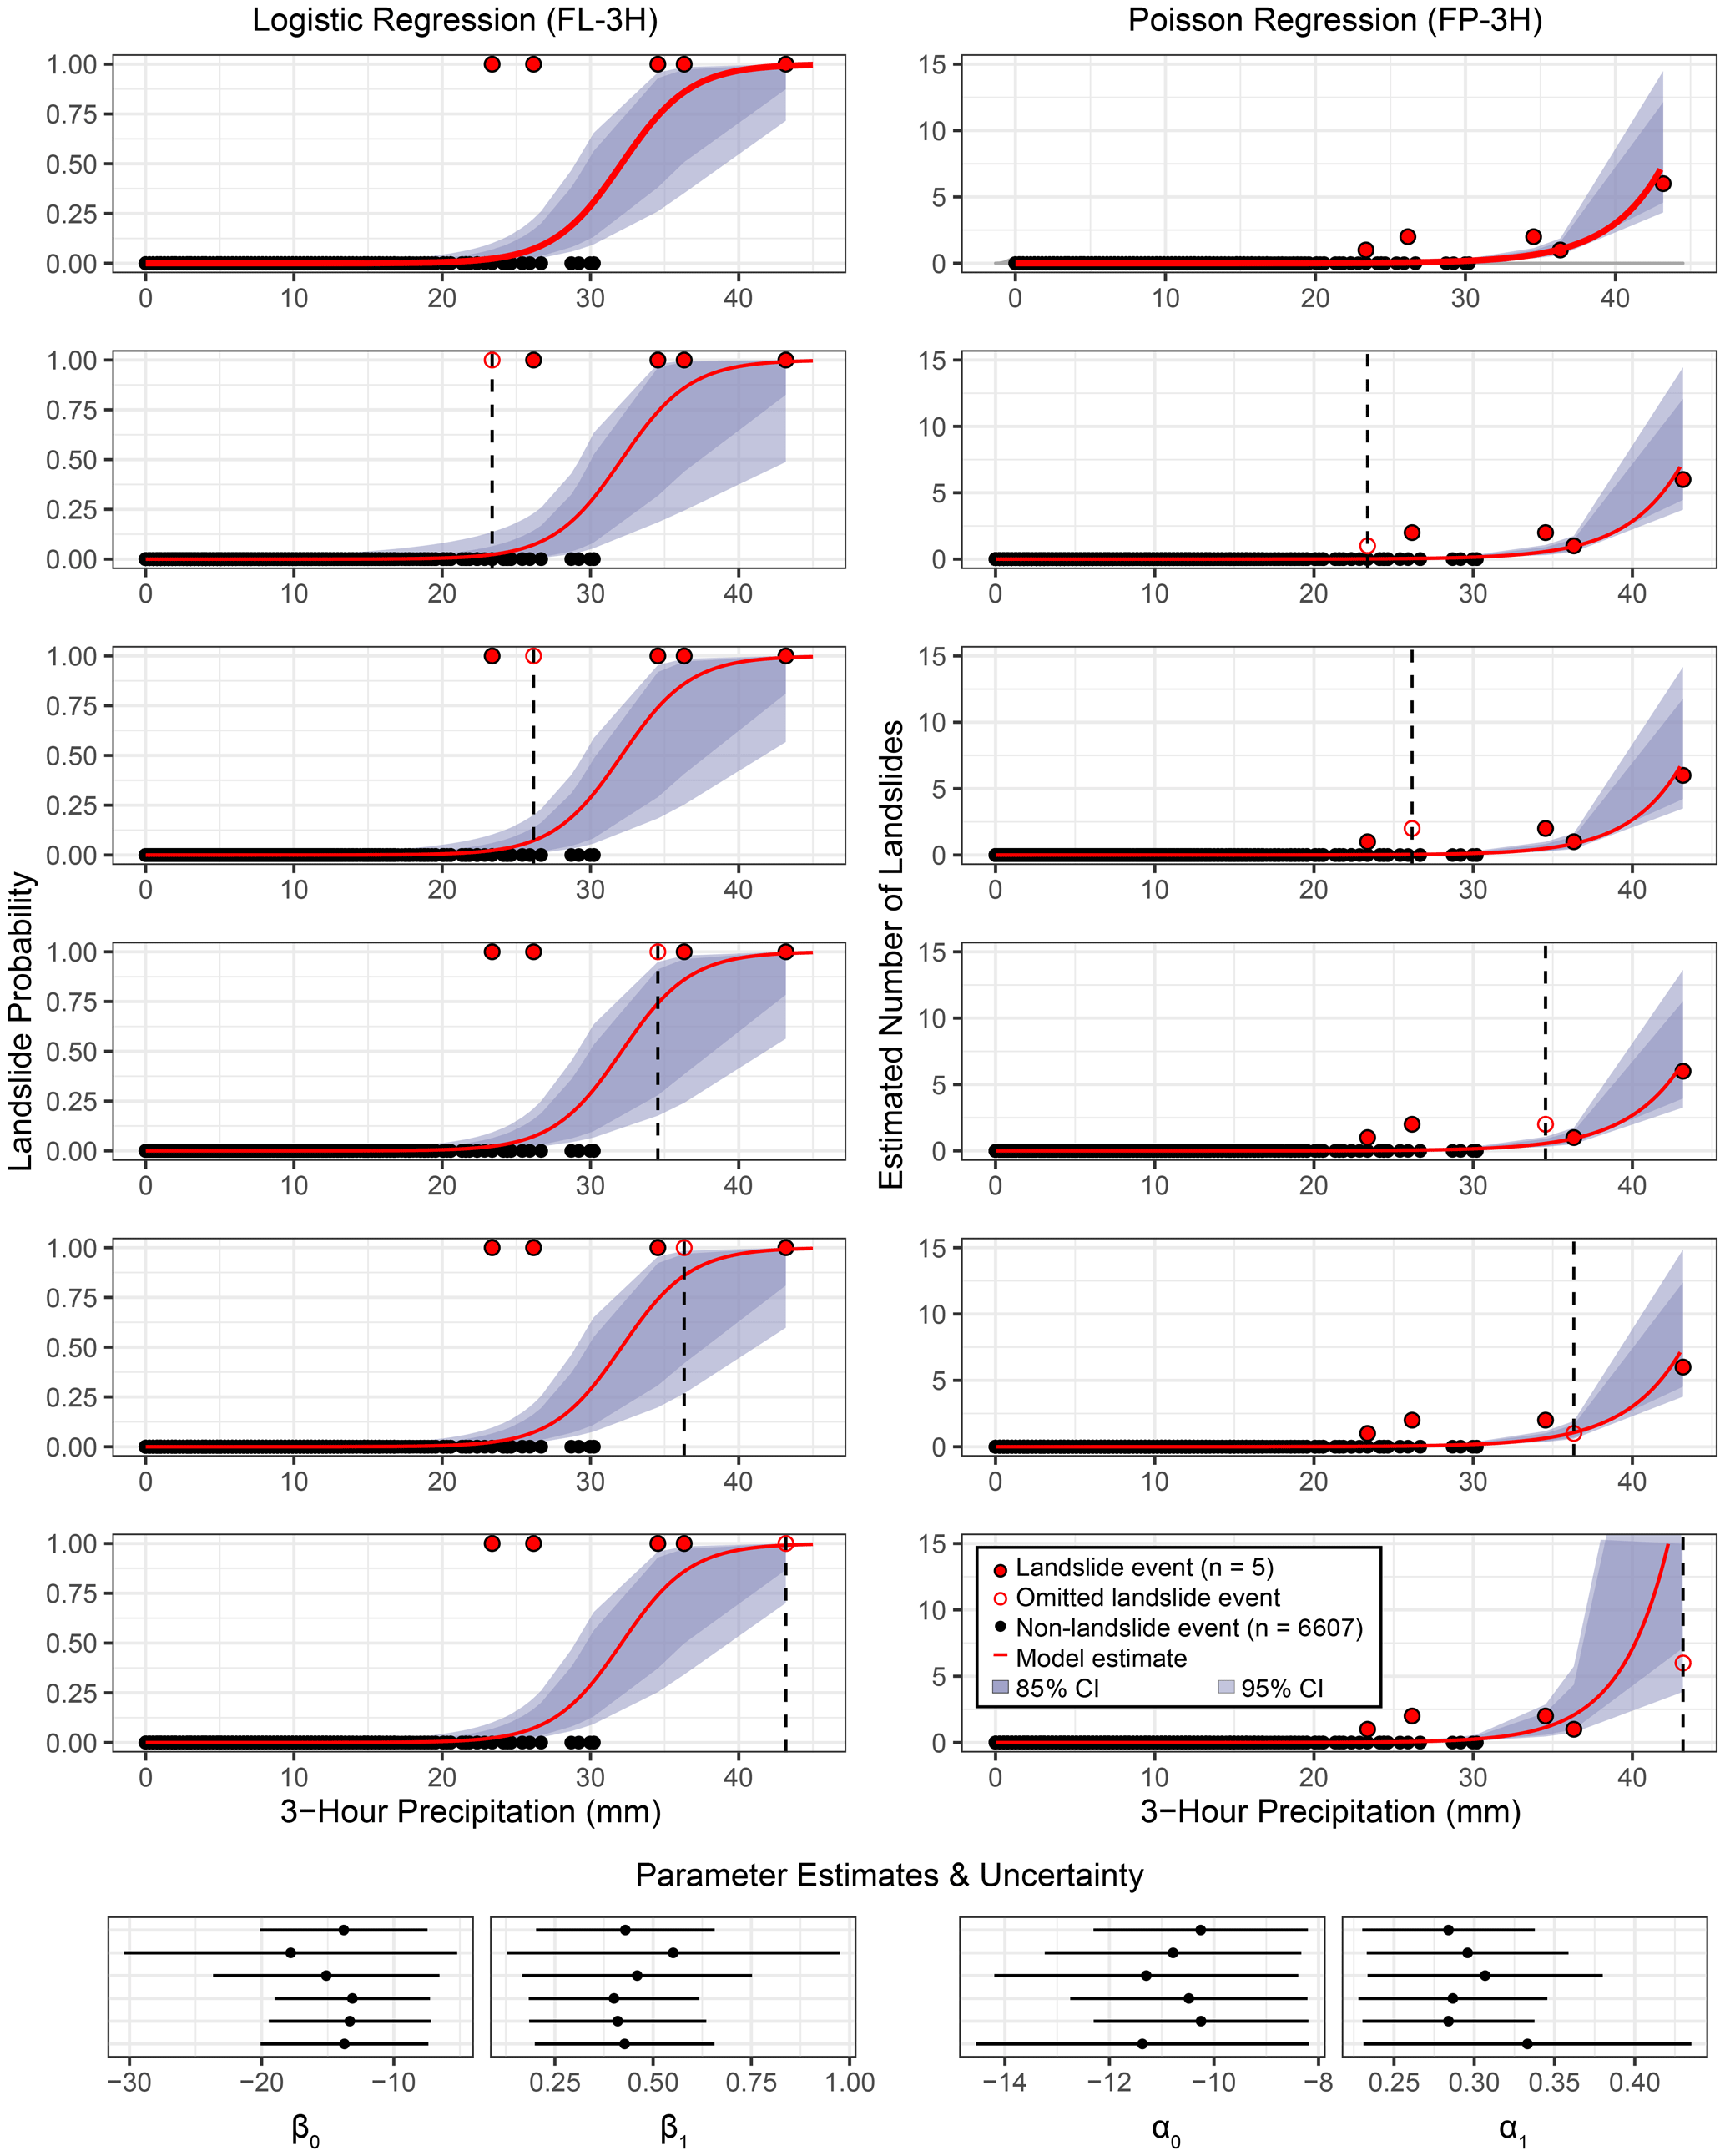
Figure 10Leave-one-out cross-validation for the preferred frequentist logistic regression model FL-3H (left column) and Poisson 3 h model FP-3H (right column). Similarly to Figs. 3 and 5, solid red points are landslide events; black points are non-landslide events; red lines show model estimates; and the dark- and light-shaded regions show 85 % and 95 % confidence intervals, respectively. Hollow red circles and dashed black lines show the landslide event that was omitted from each run. Model coefficient estimates are shown in the bottom panel with 95 % confidence intervals based on the standard error. Model output and coefficient estimates remain largely unchanged when an individual landslide event is “missed” in the inventory, but the uncertainty bounds of the logistic regression and Poisson regression are sensitive to “missing” the landslide events with the lowest and highest precipitation, respectively.
Given the small number of observed landslide events in the dataset, we evaluated the sensitivity of the 3 h models to individual landslide events using leave-one-out cross-validation (Figs. 10 and S1 in the Supplement). Parameter estimates and their 95 % confidence intervals for the leave-one-out models and the full dataset logistic regression models (FL-3H) overlap, indicating no relevant difference (Fig. 10). That we cannot distinguish these model parameters demonstrates that the model is not particularly sensitive to individual landslide points. The confidence intervals of the parameter estimates for the Poisson models also overlap with each other, with very high similarity in most cases, but we observe that the model is particularly sensitive to the single landslide day with six individual landslides. Further evaluations focus on the frequentist model (for ease of implementation) with the lowest prediction error: the frequentist model FL-3H.
Comparing FL-3H to a reference model based on historical daily frequency, we found a BSS of 0.54, indicating that logistic regression is more skillful than the reference.
3.4 Thresholds and predictive performance
Based on predicted daily landslide probability from the preferred logistic regression models (FL-3H, BL-3H), we established two decision thresholds for a landslide warning system (Fig. 11). A lower threshold was set at a probability of 0.01; in the past, this threshold would have resulted in no missed alarms (recall = 1). Any threshold below a probability of 0.023, based on model FL-3H estimates, results in a recall of 1; the threshold that maximizes precision at a recall of 1 would be 0.023, resulting in a precision of 0.22. We took a conservative approach and set the threshold lower, at 0.01. At 0.01, precision = 0.15, indicating that 28 false alarms would have occurred between 2002 and 2020 if this threshold had been used in the past.
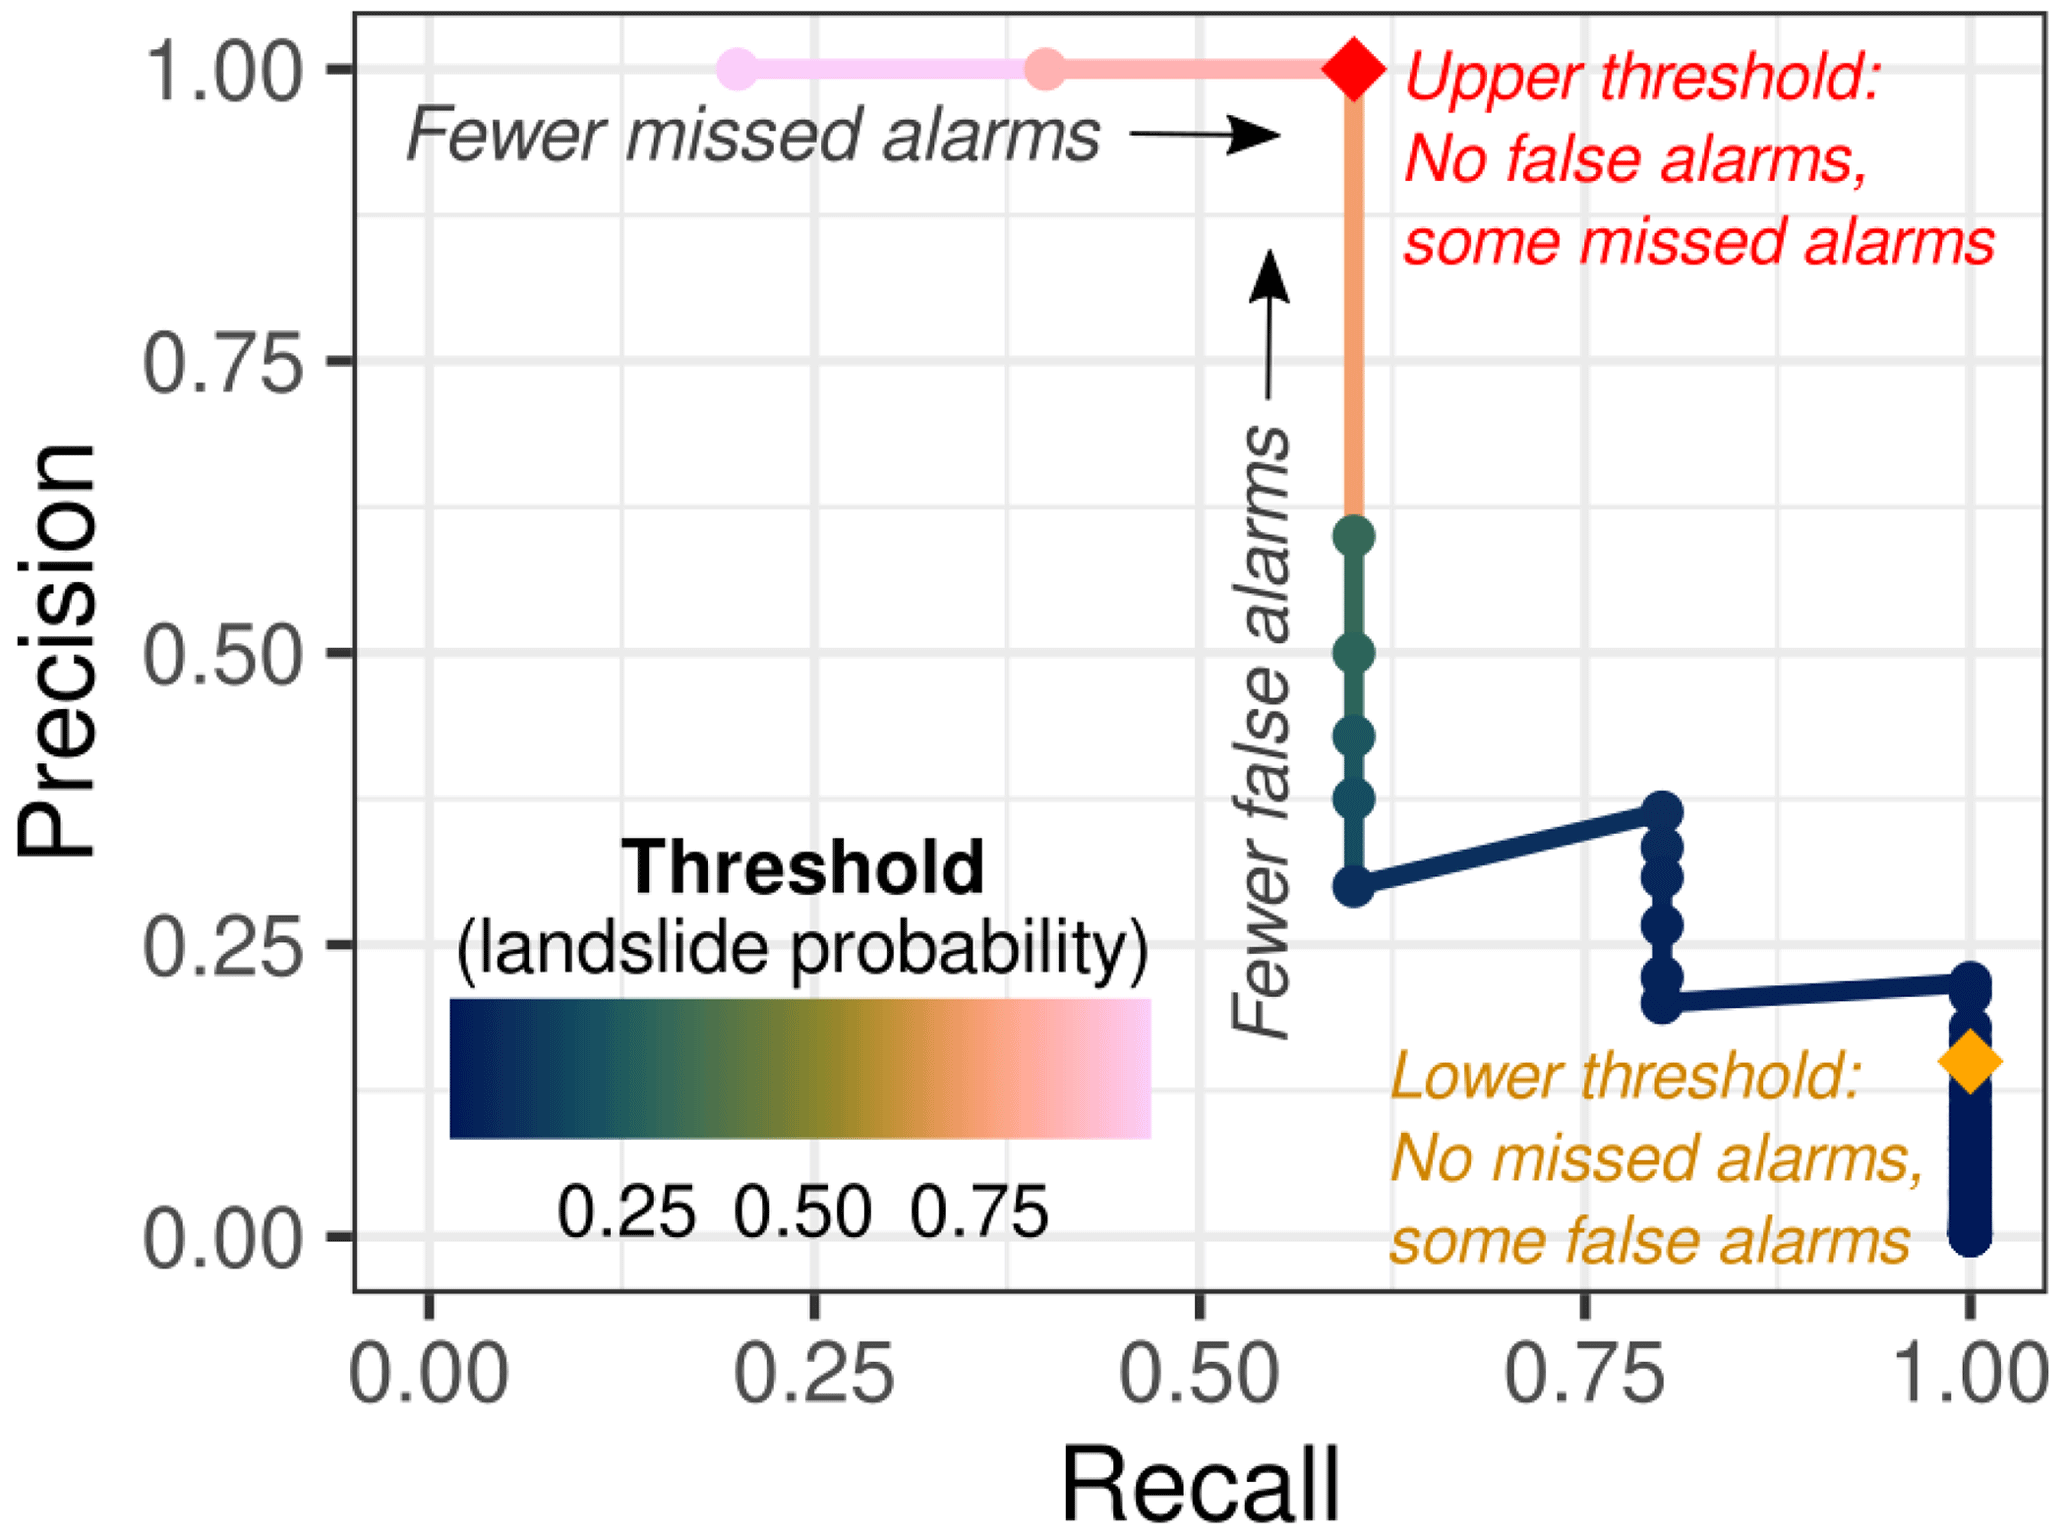
Figure 11Precision–recall curve based the preferred frequentist logistic regression 3 h model (FL-3H) (Eqs. 7–8). The upper threshold (red diamond) was heuristically set at a daily landslide probability of 0.7 to result in no false alarms (precision = 1). The lower threshold (orange diamond) was set at a probability of 0.1 to result in no missed alarms (recall = 1).
Frequentist logistic regression indicates that a probability of 0.01 corresponds to a precipitation total of 21.3 mm in 3 h (0.84 in.). Bayesian logistic regression indicates that a probability of 0.01 could correspond to precipitation values between 17.4 and 24.0 mm (95 % highest density interval, HDI) (0.685 to 0.945 in.). An upper threshold that would have resulted in no false alarms (precision = 1) was set at 0.70. Based on model FL-3H estimates, any threshold above a probability of 0.31 results in a precision of 1, and thresholds that maximize recall for a precision of 1 range from 0.31 to 0.74 (Fig. 11). This wide range results from both few reported landslides and few reported precipitation values at the tail end of the precipitation distribution. At 0.70, recall = 0.6, indicating that two of the five reported landslide events occurred below this threshold. At this probability, frequentist logistic regression corresponds to precipitation of 34.0 mm in 3 h (1.34 in.) and Bayesian logistic regression indicates precipitation between 31.0 and 39.2 mm (95 % HDI) (1.22 to 1.54 in.).
At a precipitation total of 21.3 mm in 3 h, the 3 h Poisson models predict the occurrence of 0.015 landslides per day on average in the study area (FP-3H) or between 0.0034 and 0.031 landslides (95 % HDI, BP-3H). At 34.0 mm of precipitation in 3 h, Poisson regression predicts 0.56 (FP-3H) or between 0.25 and 0.86 landslides (95 % HDI, BP-3H).
Decision thresholds for the landslide early warning system in Sitka were based on consideration of these ranges and our judgment. Using the frequentist logistic regression (FL-3H) model, probabilities < 0.01 were considered “low” hazard, those in the range of 0.01–0.70 were considered “moderate” hazard, and those > 0.70 were considered “high” hazard. The confusion matrix in Table 3 shows the warning levels that would have been generated by observed precipitation in 2002–2020 and the actual outcome. The probabilities of landslides exceeding our two alerts are consistent with other areas where dual or multiple thresholds are used (e.g., Chleborad et al., 2006).
Table 3Warning levels that would have been generated between 2002 and 2020 by model FL-3H and the selected decision thresholds, showing the number of times each warning level would have been reached and the actual outcome. For example, a high warning would have been reached three times, and landslides occurred all three times; similarly, zero landslides occurred during times when low probability of landslides would have been predicted by the model.
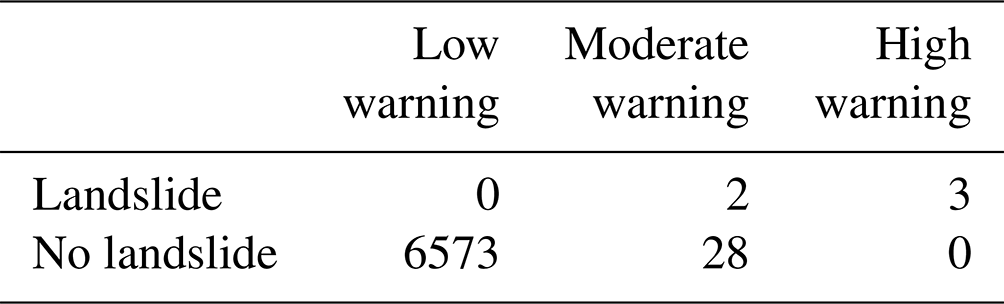
At these thresholds, a moderate warning level would have been issued 28 times on different days between 2002 and 2020; two of those dates actually resulted in landslides (Fig. 12a). A high warning level would have been issued three times, with all three dates actually resulting in landslides. No landslide warning would have been issued on 6573 of the days, and no landslides would have occurred on a day without a landslide warning. This is useful for estimating the impact on a community based on the frequency of warnings. For example, the moderate warning level would have been issued one to two times per year (on average) in the historical record. However, while the confusion matrix summarizes how the model would have behaved in the past, it is not an indicator of how well the model can predict landslides because it uses the same dataset for validation as was used for training.
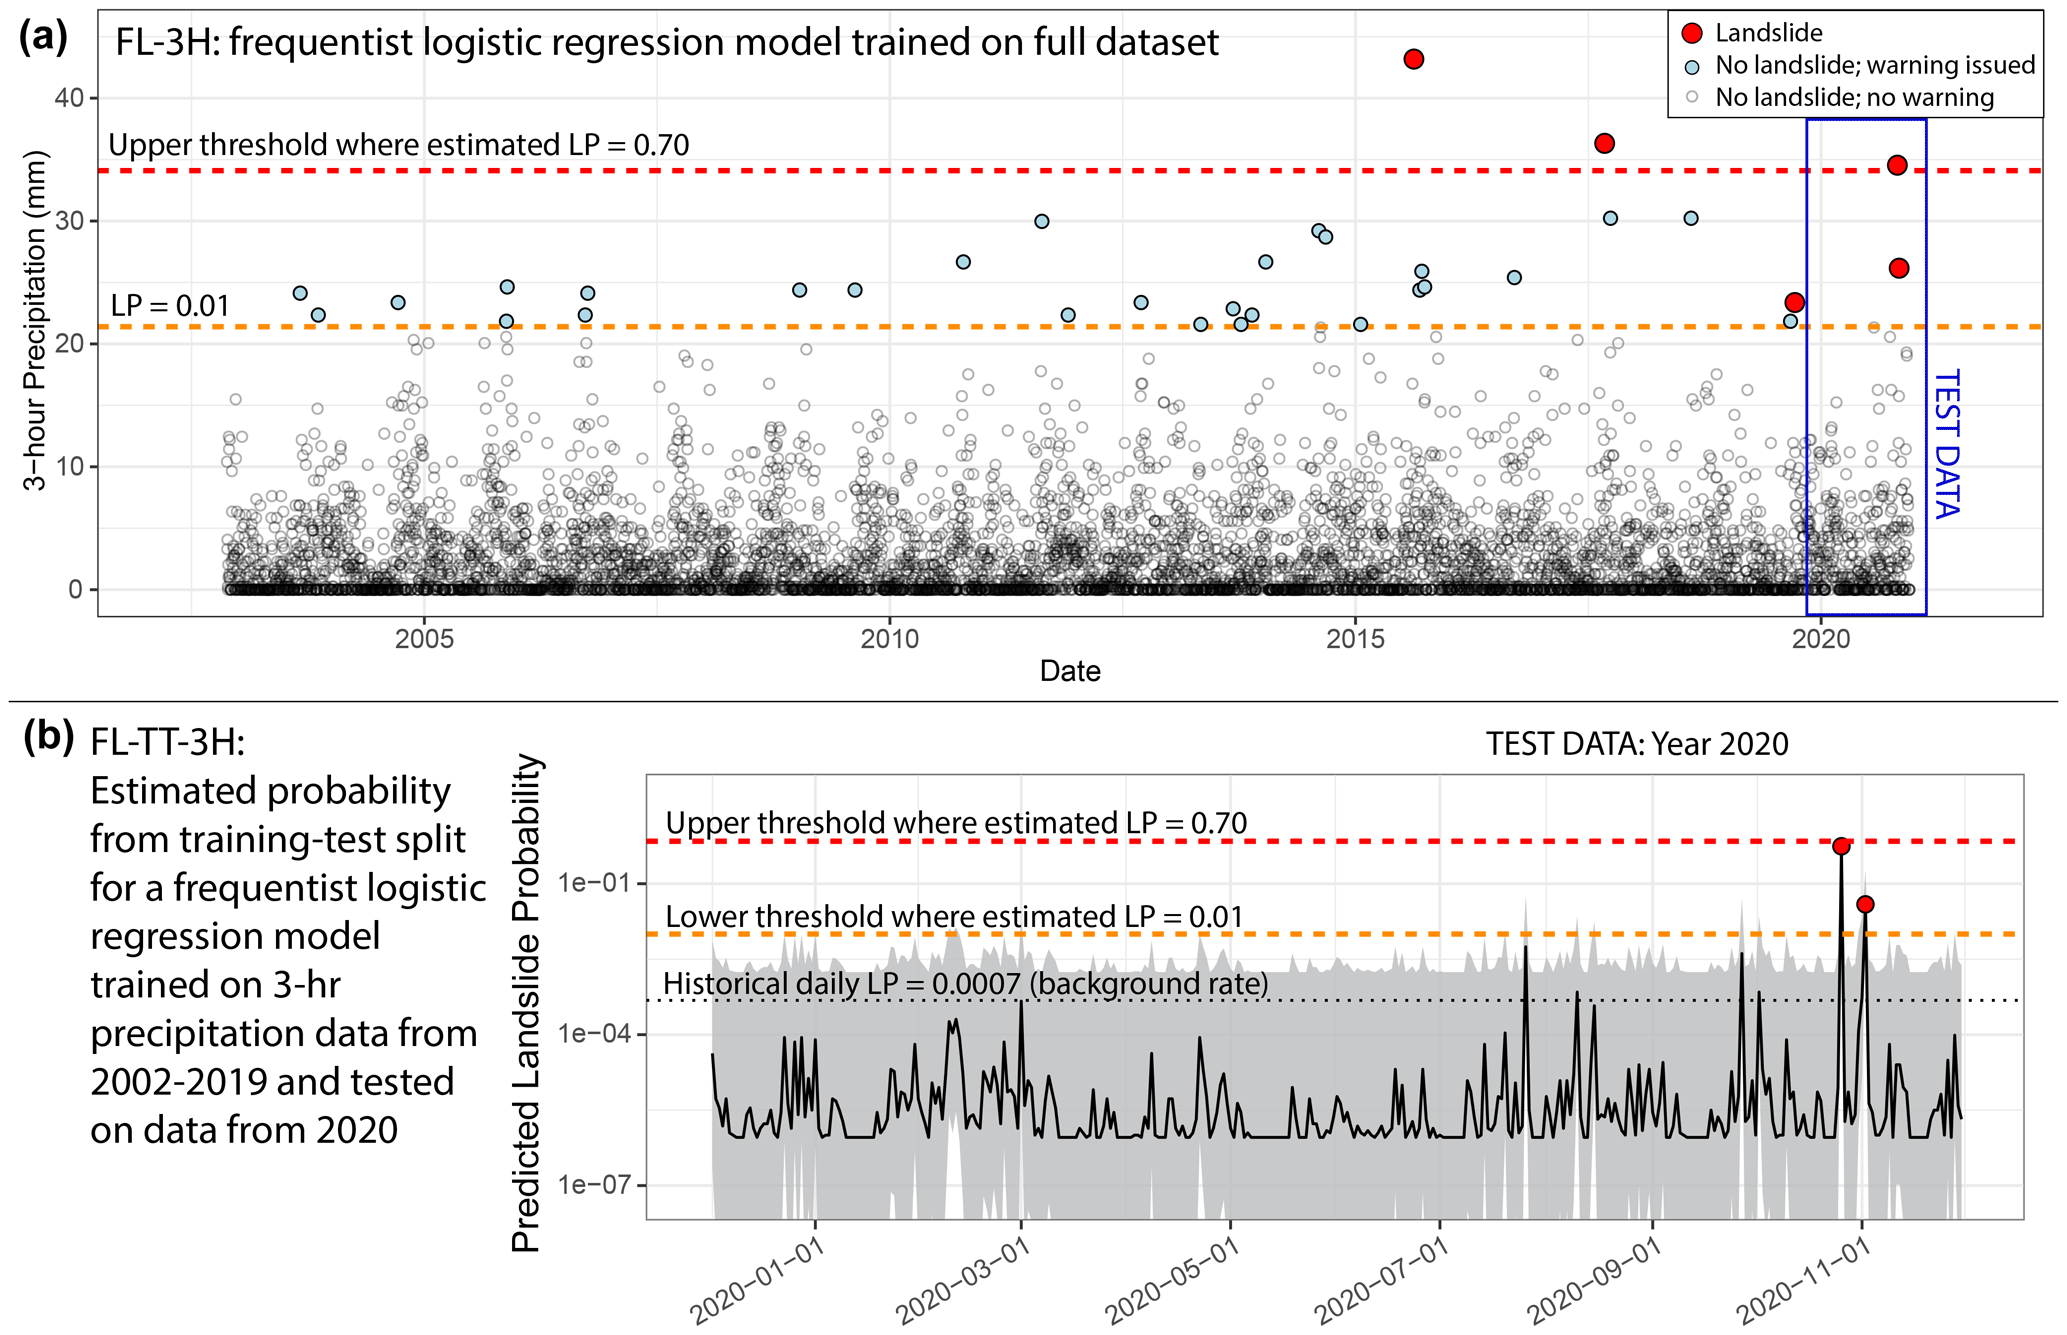
Figure 12(a) Timing of moderate-hazard storm events (probability > 0.01 in the 3 h frequentist logistic regression model, FL-3H) within the full period of record. All five landslide events in Sitka occurred within the last several years of record. Landslide probability is abbreviated as LP. (b) “Test” data for a model FL-TT-3H trained on the time series from 2002–2019. The black line indicates the point estimate, and the gray field shows the 95 % standard error. The model correctly predicts elevated hazard during the two landslide-initiating storms in 2020. The historical daily probability is also shown for comparison of estimated probabilities against the background landslide rate. The thresholds where probability (p) = 0.01 and p=0.70 are similar but not exactly the same in the two models (FL-3H and FL-TT-3H), such that one of the 2020 storms would have been predicted as high hazard (p > 0.70) in model FL-3H trained on the full dataset (a) but moderate (0.01 < p < 0.70) hazard in model FL-TT-3H trained on a subset of the dataset (b). The date format is year-month-day.
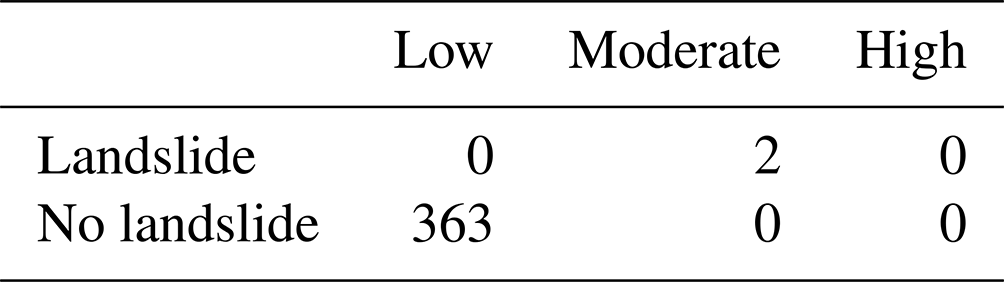
In the frequentist logistic regression model FL-TT-3H, we split the precipitation time series into training (12 November 2002–30 November 2019) and test data (1 December 2019–30 November 2020). Model FL-TT-3H is trained using only 3 landslide days and 6225 non-landslide days, and with thresholds at 0.01 and 0.70. This version of the model predicts elevated landslide probabilities on the days when landslides occurred in October and November of 2020 (Fig. 12b). It also outperforms historical frequency during the training period for December 2019–November 2020 (BSS = 0.44). Table 4 presents a confusion matrix for predicted warning levels for all days in the test dataset. A moderate warning would have been issued on two dates, and both of those days did see landslides. No high warnings would have been issued. A low warning level would have been present on the 363 remaining days, with no landslides occurring. When we flip the training and testing periods and apply the same thresholds (probability = 0.01 and 0.7), the model would have issued warnings for all three testing landslide events, corresponding to a recall of 1 and no missed alarms (Fig. S3, Table S2).
Table 4Confusion matrix for 2020 predictions, based on model FL-TT-3H trained on 2002–2019 and with thresholds at probabilities of 0.01 and 0.7, showing the number of times each warning level would have been reached and the actual outcome. For example, a moderate warning would have been reached twice, and landslides occurred both times.
In this study, we applied logistic regression and Poisson regression to develop probabilistic daily estimates of landslide hazard in Sitka, Alaska, using limited landslide inventory data and nearly 20 years of hourly precipitation records (2002–2020). Based on these hazard estimates, we established two decision thresholds for landslide warning for implementation in a public-facing online dashboard that is driven with NWS forecast data and is automatically updated in real time.
4.1 Probability-based decision thresholds for landslide warning
The most commonly applied approaches to determining thresholds for landslide initiation seek to distinguish between precipitation and/or hydrological conditions that lead to landsliding from those that do not or to determine a boundary below which landslides have not been previously observed. A disadvantage to such thresholds is that they (by design) provide only a binary outcome and no estimate of relative hazard. Probabilistic models, in contrast, estimate hazard and its uncertainty at every value of a predictor variable (e.g., maximum daily 3 h precipitation), providing richer information than a binary threshold.
Identifying the most appropriate timescales for triggering and antecedent precipitation data influences the accuracy of landslide prediction tools (Gariano et al., 2020). By exploring the fit and predictive performance of selected precipitation timescales, including both triggering and antecedent precipitation, our models also provide insight into the physical processes that govern landslide initiation near Sitka.
We found that the 3 h precipitation predictors best fit the data (e.g., models FL-3H, FP-3H, BL-3H, BP-3H), with negligible improvement in models that further incorporate 24 or 48 h antecedent precipitation (e.g., models FL-3H1D, FL-3H2D, BL-3H1D). Including antecedent precipitation over timescales > 48 h reduced the model fit. Compared to some examples of cumulative precipitation thresholds in Seattle, Washington, which incorporate 3 and 15 d antecedent precipitation totals (Chleborad et al., 2006; Scheevel et al., 2017), these timescales in Sitka are short. Similarly, intensity–duration thresholds in Seattle rely on additional information on antecedent wetness for accurate performance (Chleborad et al., 2006).
These short timescales and lack of improvement with antecedent information for Sitka may result from multiple factors, including the steep topography, thin and locally permeable colluvial soils (Swanston and Marion, 1991), preferential flow and fracture-driven hydrology, unconstrained meso-scale storm patterns associated with landslide initiation in Sitka, and the small number of observed landslides in the dataset. We hypothesize that the importance of relatively short periods of intense precipitation in Sitka reflects the rapid hydrologic response of shallow, porous soils on fractured bedrock that commonly are near saturation at critical failure depths. Antecedent information may be less predictive in this environment than in regions with thick or impermeable soils. Conversely, the lower performance of models using the 1 h timescale indicates that shorter-duration bursts of intense rainfall are not necessarily sufficient to trigger landslides and that some degree of sustained infiltration of rainfall is still needed.
Previous investigations on Chichagof Island, north of Sitka, demonstrate a rapid hydrologic response, with peaks in shallow pore pressure occurring within a few hours of observed precipitation and dissipating within several hours (Sidle, 1984); one investigation found that a shallow debris slide was most likely associated with maximum short-term intensity (2–6 h) of precipitation, rather than storm totals (Sidle and Swanston, 1981).
Although the probabilistic outputs of logistic regression and Poisson regression are useful for understanding the relative magnitude of landslide hazard, it was necessary to establish decision boundaries for warning levels to communicate hazard to the public. As described in Sect. 3.5, we selected two decision boundaries where frequentist logistic regression of maximum 3 h precipitation (FL-3H) estimates a daily landslide probability of 0.01 and 0.70 for moderate and high warning levels, respectively. Based on the historical record, moderate warnings would have been generated 31 times since 2002 and correctly predicted landslides only 3 times (Fig. 12). This means that there are many false alarms at the moderate warning level but, by design, no missed alarms for this lower threshold. In comparison, the higher threshold was only crossed three times since 2002, all of which resulted in > 1 landslide. These outcomes demonstrate the utility of having a tiered warning system, which provides more nuanced information about landslide hazard during a forecasted storm. As described below, these estimates do not account for unquantified error in precipitation forecasts or meso-scale atmospheric processes, which can generate above-threshold precipitation that may not be captured with traditional rain gauge networks (Collins et al., 2020).
The statistical models presented here are designed to be adaptable as additional data and observation allow us to further validate and refine the models. Bayesian reasoning in particular acknowledges such updates by evaluating how much has been learned in the revised posterior. Hydrologic monitoring (soil moisture, groundwater level, and soil water potential) has recently been implemented in Sitka, but the available data record is relatively short (records begin in 2019 and 2021 but only capture one landslide event). Further evaluation of this hydrologic time series could improve understanding of the hydrologic conditions that trigger landslides. For example, the preferred statistical models could be updated for seamless integration of additional hydrologic data or other predictor variables into the models if they improve prediction accuracy.
4.2 Few landslide observations and many no-landslide observations: strengths
While the overall dataset of precipitation observations is large (> 6600 d of hourly precipitation record), the number of landslide-inducing events in this highly localized dataset is small (five landslide events < 2 km from the road network). This imbalanced dataset results in large model uncertainty for extremely high precipitation values that have been rarely observed.
Our work confirms that useful precipitation thresholds may be defined with very few landslide events by including the distribution of non-triggering events, as demonstrated in recent investigations (Peres and Cancelliere, 2021). This is possible because high data availability for non-triggering events does constrain the relatively low probability of landslides at low precipitation values. In other words, prediction models built with non-triggering events provide larger datasets than those that consider only landslide-triggering events and can be robust when considered alone or in combination with known landslide occurrence. The values of low precipitation totals and non-triggering events are often overlooked in landslide prediction studies, but the large number of observations results in statistically robust models. This is reflected in our leave-one-out cross-validation results, where we show that logistic regression parameter estimates are insensitive to individual landslide events, and our training–test thresholding results, where we show that a model trained with only three landslide events is able to issue warnings during two test events. Poisson regression results are more sensitive to the largest landslide event, but a model trained without the largest landslide event would have predicted the occurrence of multiple landslides. We find that our preferred logistic regression models are more skillful in estimating landslide hazard than a reference model in which daily landslide probability is estimated by historical daily frequency, analogous to randomly guessing whether a landslide will occur based on how often they have occurred in the past.
Based on previous surveys, conversations, and feedback with the community in Sitka (Busch et al., 2021; Izenberg et al., 2022), one particularly valuable result of our modeling is a well-constrained low probability of landsliding, which is possible due to the extensive non-triggering events in the precipitation record. In addition to identifying days with elevated landslide hazard based on precipitation information, our statistical models can also identify days when the probability of landsliding is much lower than the background rate based on the historical daily probability (Fig. 12b). Identifying the times when landslide occurrence is not likely (i.e., < 1 % daily probability) allows residents to manage anxiety while living in a potentially hazardous landscape with frequent and sustained rainfall throughout the year.
4.3 Few landslide observations and many no-landslide observations: challenges
Although few landslide events combined with many non-landslide days resulted in robust statistical models, setting and validating decision thresholds based on only five landslide days presented additional challenges. For example, although receiver-operating-characteristic (ROC) curves are commonly used to select optimal decision thresholds based on logistic regression (Giannecchini et al., 2016), this approach is not as informative for highly imbalanced datasets as a precision–recall curve (Saito and Rehmsmeier, 2015) because a wide range of thresholds give a low false alarm rate. We therefore opted to consider the precision–recall curve (Fig. 11), which provides more information about how well a threshold can distinguish between true alarms and false alarms.
However, even when using the more appropriate precision–recall curve, three sources of uncertainty make the choice of threshold challenging: (1) because there are only five landslide events, a range of decision thresholds result in identical levels of precision and recall. For the upper threshold, for example, threshold values with the same precision and recall range from daily landslide probabilities of 0.31 to 0.74 based on the frequentist 3 h logistic regression model (FL-3H); (2) at any of these potential threshold levels, the given probability could be associated with a range of precipitation values – for an upper threshold of 0.70, for example, these range from 31.0 to 39.2 mm with 95 % posterior probability, based on the Bayesian 3 h logistic regression model (BL-3H); and (3) without further correction, logistic regression based on imbalanced datasets can underestimate landslide probability (King and Zeng, 2003). A conservative yet easy-to-implement approach is to reduce the lower threshold to below an optimal balance of precision and recall (threshold tuning), particularly if the primary goal of the (lower) decision threshold is to reduce risk of missed alarms.
Despite these uncertainties, two decision thresholds corresponding to specific precipitation values were required for implementation in the warning system to integrate with weather forecasts. We therefore chose a heuristic approach based on expert judgment to select precipitation values within the range of thresholds that lead to the desired precision and recall. We set the lower threshold to a probability of 0.01 in model FL-3H, which is generated by 21.3 mm in 3 h (0.84 in.). We set the upper threshold to a probability of 0.70 in model FL-3H, which is generated by 34.0 mm in 3 h (1.34 in.).
We also found challenges associated with the timing of landslides over the 18-year record: although the hourly precipitation record in Sitka starts in 2002, no landslides with well-constrained timing were reported until 2015. This presents an additional challenge when validating the selected thresholds for future predictive performance. An ideal approach would be to iteratively split the dataset into multiple training and test groups (k-fold cross-validation), each time fitting statistical models to the training set and testing performance with the test set. Because landslides in this dataset only occur in the final third of the dataset, k-fold cross-validation results in many training sets with no reported landslides, which are then unable to predict elevated landslide hazard and are not useful estimates of performance because the models applied in the warning system do include reported landslides in the training data. We emphasize that in the training–test split presented here (FL-TT-3H), a model trained on only three landslide points with our selected probability thresholds is able to issue moderate warnings during both testing landslide events. Although no false alarms occurred during the testing period, some false alarms can be expected in the future, as the low warning threshold has been exceeded in the past without triggering landslides (Table 3). More reported landslides in the Sitka area in the future would allow for more extensive validation of the thresholds. We consider several potential explanations for this inconsistent frequency within the study period.
First, it is possible that small, isolated slope failures may have occurred prior to the major event in 2015 but were not well documented. We consider it unlikely, however, that large or extensive landslides occurred and were not observed between 2002 and 2015 in Sitka. A second potential explanation is that, although moderate-hazard rain events have occurred throughout the period of record (Fig. 12), the only high-hazard events on record occurred after 2015. Global warming is predicted to result in increased frequency of extreme precipitation in upcoming years and decades, but further study is needed to evaluate the links between changing precipitation patterns and landslide occurrence in southeast Alaska. A third potential explanation is increased human alteration of hillslopes. At least one recent landslide occurred in human-made fill material, which may have increased susceptibility to landslide failure compared to a natural slope by altering hydrologic characteristics and slope strength through vegetation removal, slope cutting, and addition of fill material (e.g., BeVille et al., 2010; Bozzolan et al., 2020; Johnston et al., 2021). If intense precipitation events are becoming more frequent or if slope modification increases through expanded urban development (or both), landslides in the study area are likely to become more frequent in the future.
4.4 Experience with frequentist and Bayesian inference for estimating landslide hazard
We explored both frequentist and Bayesian approaches to fitting logistic regression and Poisson regression models for estimating landslide hazard. By design, both of these approaches produced similar results; however, they do have different implications for use and interpretation. Frequentist inference remains more commonly used in landslide research (Melillo et al., 2018; Segoni et al., 2018), indicating familiarity, and frequentist approaches tend to be straightforward to implement in commonly used statistical modeling software, like R glm applied here. However, when considering imbalanced datasets with rare events, frequentist logistic regression may underestimate landslide probability (King and Zeng, 2003), and parameter estimates may be unstable when near-perfect separation between landslide and no-landslide days occurs, as is the case in this dataset. We note that statistical strategies exist to correct for underestimation (King and Zeng, 2003) and to obtain stable parameter estimates (Kosmidis and Firth, 2021), which could be applied if Bayesian inference were unavailable as a cross-check. Additionally, frequentist confidence intervals must be estimated in an additional step, and their interpretation is arguably less intuitive than Bayesian credibility intervals. However, in this case we found frequentist inference to still be useful for defining heuristic decision thresholds.
Bayesian inference remains less common in landslide research, and although additional expertise is required to set prior distributions and interpret the results (e.g., McElreath, 2020; Bürkner, 2017), Bayesian inference allows for incorporation of prior knowledge, which is advantageous when few landslide events are reported. Here, we encoded our prior knowledge that landslide activity is likely to increase with increasing precipitation in a weakly informative prior, which by design has only a small influence on the posterior distribution. When few data are available, more informative priors based on other studies could be used to, for example, tell the model about a distribution of outcomes that are known to be possible from nearby areas but were not observed in the small dataset at hand. Weakly informative priors have also been shown to lead to stable parameter estimates in the case of imbalanced datasets with rare events, which overcomes the problem of unstable parameter estimates that frequentist logistic regression can show without an additional correction, making these Bayesian models better suited to estimating hazard from imbalanced datasets (Gelman et al., 2008). Posterior distributions of parameter estimates provide intrinsic estimates of uncertainty learned from the data, which informed our understanding of the range of precipitation values that could be associated with a given decision threshold.
Overall, we conclude that frequentist models are familiar and easy to implement, but Bayesian models capture the rare-events problem more explicitly and allow for better understanding of uncertainty. Either model can be effectively used for probabilistic landslide models and to determine meaningful decision thresholds. Here we present thresholds for the easy-to-implement frequentist model, but consideration of the best-fit Bayesian model and parameter uncertainty improved our understanding of both models' strengths and weaknesses. Furthermore, either workflow is transferrable to other regions, but they would need to be trained on local data.
4.5 Landslide prediction and uncertainty based on weather forecasts
Accurate precipitation and landslide timing data facilitated the development of robust thresholds for low, moderate, and high landslide potential. Implementation of these thresholds into actionable information to provide advance warning of landslide potential hinges upon accurate precipitation forecasts. Uncertainty in the forecasted precipitation is added to uncertainty in the model and decision threshold. As storms approach and precipitation forecasts become more constrained, the precipitation uncertainty will be reduced (Fabry and Seed, 2009; Ashok and Pekkat, 2022). Thus, landslide predictions for the future (days in advance) become more accurate as the storm approaches (hours in advance). Effective warning education can encourage residents to stay alert for updated landslide predictions. Further studies would be useful to better quantify the magnitude of error expected in dynamic storm forecasting and the relationship between forecast uncertainty and time into the future.
Models trained on and applied to precipitation data from a single monitoring station (Sitka Rocky Gutierrez Airport) cannot account for spatial variability in precipitation totals. Although the geographically small study area described here is intended to minimize these impacts, mountainous areas (like Sitka) are characterized by spatially variable climate and weather patterns (Johnson and Hanson, 1994; Tullos et al., 2016; Napoli et al., 2019). Meso-scale atmospheric processes linked to spatial distribution of landslide initiation are difficult to model (Collins et al., 2020) and are not typically incorporated into kilometer-scale precipitation forecasts.
Predicted landslide hazard could also be complemented by applying the model to recent precipitation observations as an estimate of current hazard. “Nowcasting” by looking at observed precipitation (e.g., Kirschbaum and Stanley, 2018) incorporates instrument and model error but not weather forecast error, and it can alert residents to hazardous conditions that exceeded previous predictions. This type of information provides indicators of immediate hazard but is less useful for developing emergency response plans or informing operational decisions, which require sufficient lead time to take suitable action. In Sitka, for example, the observed landslides with high-resolution timing data occurred 1–3 h following peak precipitation, which may still provide valuable time for emergency responders and risk-averse individuals to take actions that reduce risk if precipitation totals exceed forecasts.
4.6 Application to landslide early warning system in Sitka, Alaska
In Sitka, our best-fit frequentist model FL-3H (based on 3 h precipitation) with the three warning levels (low, moderate, high) described in Sect. 3.5 has been applied to a public-facing dashboard for situational awareness. This dashboard provides residents, emergency planners, and NWS forecasters with near-real-time updates of current and predicted landslide hazard (referred to as “risk” in the dashboard for ease of use by a non-technical audience) and suggests actions to mitigate risk. In Sitka, individual differences in risk tolerance create a need for contextualized risk information to be available to everyone in the community (Busch et al., 2021). To provide this service, project members worked with the community, web developers, and NWS forecasters to construct a series of warning levels that indicate the three levels of landslide hazard developed and tested in this work. The beta version of this dashboard is accessible at https://sitkalandslide.org/, which, at the time of writing, is functionally serving as a landslide early warning system used by the public to inform individual decision-making and by NWS forecasters to guide special weather watch, warning, and advisory products.
In this study we developed and evaluated probabilistic models for landslide hazard estimation built with a small landslide inventory. The best-fit models used 3 h triggering precipitation only. Including antecedent precipitation in addition to triggering rainfall did not improve the model fit for the available database of landslide occurrence relative to using only the triggering precipitation conditions.
Despite the small number of landslide events (five dates with landslides), a large dataset of non-triggering events produces robust model results, albeit with higher uncertainty at high precipitation values. Validation through leave-one-out analysis demonstrates that the model is robust even if we assume that we missed a landslide event. Furthermore, training the model on only three of five landslide events and thousands of no-landslide events would still have resulted in a model that could correctly predict the subsequent two landslide events. This model outperforms a reference model based on historical landslide frequency. Combined with probabilistic models, the small number of landslide events allowed for the development of usable decision thresholds for landslide warning.
Although frequentist inference and Bayesian inference produce similar estimates of landslide hazard by design, they do have different implications for use and interpretation: frequentist models are familiar and easy to implement, but Bayesian models capture the rare-events problem more explicitly and allow for better understanding of uncertainty.
Developing precipitation thresholds based on time intervals (e.g., 3 h) that match NWS forecasting products allows for application to landslide predictions within the NWS operational framework. This landslide early warning system was developed in partnership with the community and prioritized community needs identified in previous studies (Busch et al., 2021). A publicly accessible web dashboard, https://sitkalandslide.org/, uses our preferred frequentist logistic regression model (FL-3H) and precipitation thresholds to display current landslide hazard (based on recent precipitation) and “forecasted” landslide hazard (based on NWS forecasts) in real time.
Raw weather data from Sitka Rocky Gutierrez Airport are curated by the University of Utah's MesoWest climate data service through collaborative agreements with several agencies (https://mesowest.utah.edu, University of Utah, Department of Atmospheric Sciences, 2023). Full records for station PASI are available from Synoptic Data (https://download.synopticdata.com/#a/PASI, Synoptic, 2023). The full Tongass National Forest Landslide Areas inventory (initiation points and landslide areas) is available from the US Forest Service data portal (https://gis.data.alaska.gov/datasets/usfs::tongass-national-forest-landslide-areas/about, US Forest Service, 2019). Processed data are available through GitHub (https://github.com/pattonai/sitka-lews, last access: 5 January 2023) with a release on 5 January 2023 (https://doi.org/10.5281/zenodo.7508537, Patton and Luna, 2023).
The supplement related to this article is available online at: https://doi.org/10.5194/nhess-23-3261-2023-supplement.
AIP and JJR conceptualized the study, and AIP and LVL co-led the study. AIP and LVL performed statistical analyses, produced figures, and co-wrote the text. JJR, AJ, OK, and BBM contributed to discussing results and reviewing the manuscript. LVL and AIP revised and edited the text. The authors have no competing interests.
The contact author has declared that none of the authors has any competing interests.
Publisher’s note: Copernicus Publications remains neutral with regard to jurisdictional claims in published maps and institutional affiliations.
This article is part of the special issue “Hydro-meteorological extremes and hazards: vulnerability, risk, impacts, and mitigation”. It is a result of the European Geosciences Union General Assembly 2022, Vienna, Austria, 23–27 May 2022.
We would like to thank our collaborators including Robert Lempert, Ryan Brown, and Max Izenberg (RAND Corporation) and Lisa Busch (Sitka Sound Science Center) for leading conversations with Sitkans about risk perception; Jacquie Foss (US Forest Service) for curating and clarifying entries in the Tongass National Forest Landslide Areas inventory and documenting landslide impacts; Jeff Frankl, Klaas Hoekema, and Steph Wall (Azavea) for designing and building the public-facing warning dashboard; and Cora Siebert and Jacyn Schmidt (Sitka Sound Science Center) for documenting storm impacts. We thank Corina Cerovski-Darriau (USGS) and Ugur Özturk (University of Potsdam) for their thoughtful reviews, which allowed us to improve the clarity and conclusions of this work. Any use of trade, firm, or product names is for descriptive purposes only and does not imply endorsement by the US Government.
This research has been supported by the National Science Foundation (grant no. 1831770) and the Deutsche Forschungsgemeinschaft (NatRiskChange GRK 2043).
This paper was edited by Francesco Marra and reviewed by two anonymous referees.
Akaike, H.: Information Theory and an Extension of the Maximum Likelihood Principle, in: Breakthroughs in Statistics: Foundations and Basic Theory, edited by: Kotz, S. and Johnson, N. L., Springer, New York, NY, 610–624, https://doi.org/10.1007/978-1-4612-0919-5_38, 1992
Ashok, S. P. and Pekkat, S.: A systematic quantitative review on the performance of some of the recent short-term rainfall forecasting techniques, J. Water Clim. Change, 13, 3004–3029, https://doi.org/10.2166/wcc.2022.302, 2022.
Berti, M., Martina, M. L. V., Franceschini, S., Pignone, S., Simoni, A., and Pizziolo, M.: Probabilistic rainfall thresholds for landslide occurrence using a Bayesian approach, J. Geophys. Res.-Earth, 117, F04006, https://doi.org/10.1029/2012JF002367, 2012.
BeVille, S. H., Mirus, B. B., Ebel, B. A., Mader, G. G., and Loague, K.: Using simulated hydrologic response to revisit the 1973 Lerida Court landslide, Environ. Earth Sci., 61, 1249–1257, https://doi.org/10.1007/s12665-010-0448-z, 2010.
Bogaard, T. and Greco, R.: Invited perspectives: Hydrological perspectives on precipitation intensity-duration thresholds for landslide initiation: proposing hydro-meteorological thresholds, Nat. Hazards Earth Syst. Sci., 18, 31–39, https://doi.org/10.5194/nhess-18-31-2018, 2018.
Booth, A. M., Sifford, C., Vascik, B., Siebert, C., and Buma, B.: Large wood inhibits debris flow runout in forested southeast Alaska, Earth Surface Processes and Landforms, 45, 1555–1568, https://doi.org/10.1002/esp.4830, 2020.
Bozzolan, E., Holcombe, E., Pianosi, F., and Wagener, T.: Including informal housing in slope stability analysis – an application to a data-scarce location in the humid tropics, Nat. Hazards Earth Syst. Sci., 20, 3161–3177, https://doi.org/10.5194/nhess-20-3161-2020, 2020.
Brier, G. W.: Monthly weather review, Mon. Weather Rev., 78, 1–3, 1950.
Brunetti, M. T., Peruccacci, S., Rossi, M., Luciani, S., Valigi, D., and Guzzetti, F.: Rainfall thresholds for the possible occurrence of landslides in Italy, Nat. Hazards Earth Syst. Sci., 10, 447–458, https://doi.org/10.5194/nhess-10-447-2010, 2010.
Bürkner, P.-C.: brms: An R Package for Bayesian Multilevel Models Using Stan, J. Stat. Softw., 80, 1–28, https://doi.org/10.18637/jss.v080.i01, 2017.
Busch, L., O'Connell, V., Prussian, K., Foss, J., Landwehr, D. J., Hoffman, J., Becker, M., Gould, A., Wolken, G., Stevens, D. A., Whorton, E., Jacobs, A., Curtis, J., Holloway, E., Fielding, E., Buma, B., and Carter, B.: August 2015 Sitka Landslides, Sitka Geotask Force Summaries, 1, 1–32, 2016.
Busch, L., Lempert, R., Izenberg, M., and Patton, A.: Run Uphill for a Tsunami, Downhill for a Landslide, Issues Sci. Technol., 38, 40–46, 2021.
Chae, B.-G., Park, J.-J., Catani, F., Simoni, A., and Berti, M.: Landslide prediction, monitoring and early warning: a concise review of state-of-the-art, Geosci. J., 21, 1033–1070, 2017.
Chleborad, B. A. F., Baum, R. L., Godt, J. W., and Report, U. S. G. S. O.: Rainfall Thresholds for Forecasting Landslides in the Seattle, Washington, Area – Exceedance and Probability: USGS Open-File Report 2006-1064, 1–31, https://doi.org/10.3133/ofr20061064, 2006.
Chu, M., Patton, A., Roering, J., Siebert, C., Selker, J., Walter, C., and Udell, C.: SitkaNet: A low-cost, distributed sensor network for landslide monitoring and study, HardwareX, 9, e00191, https://doi.org/10.1016/j.ohx.2021.e00191, 2021.
Collins, B. D., Oakley, N. S., Perkins, J. P., East, A. E., Corbett, S. C., and Hatchett, B. J.: Linking Mesoscale Meteorology With Extreme Landscape Response: Effects of Narrow Cold Frontal Rainbands (NCFR), J. Geophys. Res.-Earth, 125, e2020JF005675, https://doi.org/10.1029/2020JF005675, 2020.
Cordeira, J. M., Stock, J., Dettinger, M. D., Young, A. M., Kalansky, J. F., and Ralph, F. M.: A 142-year climatology of northern California landslides and atmospheric rivers, B. Am. Meteorol. Soc., 100, 1499–1509, https://doi.org/10.1175/BAMS-D-18-0158.1, 2019.
Cutter, S. L. and Finch, C.: Temporal and spatial changes in social vulnerability to natural hazards, P. Natl. Acad. Sci. USA, 105, 2301–2306, https://doi.org/10.1073/pnas.0710375105, 2008.
Darrow, M. M., Nelson, V. A., Grilliot, M., Wartman, J., Jacobs, A., Baichtal, J. F., and Buxton, C.: Geomorphology and initiation mechanisms of the 2020 Haines, Alaska landslide, Landslides, 19, 2177–2188, https://doi.org/10.1007/s10346-022-01899-3, 2022.
Diamond, H. J., Karl, T. R., Palecki, M. A., Baker, C. B., Bell, J. E., Leeper, R. D., Easterling, D. R., Lawrimore, J. H., Meyers, T. P., Helfert, M. R., Goodge, G., and Thorne, P. W.: U.S. Climate Reference Network after One Decade of Operations: Status and Assessment, B. Am. Meteorol. Soc., 94, 485–498, https://doi.org/10.1175/BAMS-D-12-00170.1, 2013.
Elliott, J. and Freymueller, J. T.: A Block Model of Present-Day Kinematics of Alaska and Western Canada, J. Geophys. Res.-Sol. Ea., 125, 1–30, https://doi.org/10.1029/2019JB018378, 2020.
Fabry, F. and Seed, A. W.: Quantifying and predicting the accuracy of radar-based quantitative precipitation forecasts, Adv. Water Resour., 32, 1043–1049, https://doi.org/10.1016/j.advwatres.2008.10.001, 2009.
Gariano, S. L., Melillo, M., Peruccacci, S., and Brunetti, M. T.: How much does the rainfall temporal resolution affect rainfall thresholds for landslide triggering?, Nat. Hazards, 100, 655–670, https://doi.org/10.1007/s11069-019-03830-x, 2020.
Gelman, A., Jakulin, A., Grazia Pittau, M., and Su, Y.-S.: A weakly informative default prior distribution for logistic and other regression models, Ann. Appl. Stat., 2, 1360–1383, https://doi.org/10.1214/08-AOAS191, 2008.
Giannecchini, R., Galanti, Y., Amato, G. D., and Barsanti, M.: Geomorphology Probabilistic rainfall thresholds for triggering debris flows in a human-modified landscape, Geomorphology, 257, 94–107, https://doi.org/10.1016/j.geomorph.2015.12.012, 2016.
Guzzetti, F.: Invited perspectives: Landslide populations – can they be predicted?, Nat. Hazards Earth Syst. Sci., 21, 1467–1471, https://doi.org/10.5194/nhess-21-1467-2021, 2021.
Guzzetti, F., Peruccacci, S., Rossi, M., and Stark, C. P.: The rainfall intensity-duration control of shallow landslides and debris flows: An update, Landslides, 5, 3–17, https://doi.org/10.1007/s10346-007-0112-1, 2008.
Guzzetti, F., Gariano, S. L., Peruccacci, S., Brunetti, M. T., Marchesini, I., Rossi, M., and Melillo, M.: Geographical landslide early warning systems, Earth-Sci. Rev., 200, 102973, https://doi.org/10.1016/j.earscirev.2019.102973, 2020.
Hamilton, T. D.: Correlation of quaternary glacial deposits in Alaska, Quaternary Sci. Rev., 5, 171–180, 1986.
Hennon, A., Paul, E., Amore, D., David, V., Dustin, T., and Melinda, B.: Influence of Forest Canopy and Snow on Microclimate in a Declining Yellow-Cedar Forest of Southeast Alaska, Northwest Sci., 84, 73–87, https://doi.org/10.3955/046.084.0108, 2010.
Izenberg, M., Brown, R., Siebert, C., Heinz, R., Rahmattalabi, A., and Vayanos, P.: A Community-Partnered Approach to Social Network Data Collection for a Large and Partial Network, Field Method., 35, 1–7, https://doi.org/10.1177/1525822X221074769, 2022.
Jacobs, A., Holloway, E., and Dixon, A.: Atmospheric Rivers in Alaska – Yes they do exist, and are usually tied to the biggest and most damaging rain-generated floods in Alaska, International Atmospheric Rivers Conference, La Jolla, CA, USA, 8–11 August 2016, http://cw3e.ucsd.edu/ARconf2016/Posters/Jacobs_IARC2016.pdf (last access: 11 October 2023), 2016.
Jakob, M., Holm, K., Lange, O., and Schwab, J. W.: Hydrometeorological thresholds for landslide initiation and forest operation shutdowns on the north coast of British Columbia, Landslides, 3, 228–238, https://doi.org/10.1007/s10346-006-0044-1, 2006.
Jakob, M., Owen, T., and Simpson, T.: A regional real-time debris-flow warning system for the District of North Vancouver, Canada, Landslides, 9, 165–178, https://doi.org/10.1007/s10346-011-0282-8, 2012.
Johnson, A. C., Swanston, D. N., and Mcgee, K. E.: Landslide Initiation, Runout, and Deposition within Clearcuts and Old-Growth Forests of Alaska, J. Am. Water Resour. As., 36, 17–30, 2000.
Johnson, G. L. and Hanson, C. L.: Topographic and Atmospheric Influences on Precipitation Variability over a Mountainous Watershed, J. Appl. Meteorol., 34, 68–87, 1994.
Johnston, E. C., Davenport, F. V., Wang, L., Caers, J. K., Muthukrishnan, S., Burke, M., and Diffenbaugh, N. S.: Quantifying the Effect of Precipitation on Landslide Hazard in Urbanized and Non-Urbanized Areas, Geophys. Res. Lett., 48, e2021GL094038, https://doi.org/10.1029/2021GL094038, 2021.
Khan, S., Kirschbaum, D. B., and Stanley, T.: Investigating the potential of a global precipitation forecast to inform landslide prediction, Weather Clim. Extrem., 33, 100364, https://doi.org/10.1016/j.wace.2021.100364, 2021.
King, G. and Zeng, L.: Explaining Rare Events in International Relations, Int. Organ., 55, 693–715, 2003.
Kirschbaum, D. and Stanley, T.: Satellite-Based Assessment of Rainfall-Triggered Landslide Hazard for Situational Awareness, Earth's Future, 6, 505–523, https://doi.org/10.1002/2017EF000715, 2018.
Kosmidis, I. and Firth, D., Jeffreys-prior penalty, finiteness and shrinkage in binomial-response generalized linear models, Biometrika, 108, 71–82, https://doi.org/10.1177/0049124103262065, 2021.
Kristensen, L., Czekirda, J., Penna, I., Etzelmüller, B., Nicolet, P., Pullarello, J. S., Blikra, L. H., Skrede, I., Oldani, S., and Abellan, A.: Movements, failure and climatic control of the Veslemannen rockslide, Western Norway, Landslides, 1963–1980, https://doi.org/10.1007/s10346-020-01609-x, 2021.
Kuha, J.: AIC and BIC: Comparisons of assumptions and performance, Sociol. Method. Res., 33, 188–229, https://doi.org/10.1177/0049124103262065, 2004.
Lee, S., Won, J. S., Jeon, S. W., Park, I., and Lee, M. J.: Spatial Landslide Hazard Prediction Using Rainfall Probability and a Logistic Regression Model, Math. Geosci., 47, 565–589, https://doi.org/10.1007/s11004-014-9560-z, 2015.
Leonarduzzi, E., Molnar, P., and McArdell, B.: Predictive performance of rainfall thresholds for shallow landslides in Switzerland from gridded daily data, J. Am. Water Resour. As., 5, 6612–6625, https://doi.org/10.1111/j.1752-1688.1969.tb04897.x, 2017.
Lesnek, A. J., Briner, J. P., Lindqvist, C., Baichtal, J. F., and Heaton, T. H.: Deglaciation of the Pacific coastal corridor directly preceded the human colonization of the Americas, Science Advances, 4, eaar5040, https://doi.org/10.1126/sciadv.aar5040, 2018.
Mann, D. H.: Wisconsin and Holocene Glaciation of Southeast Alaska, Glaciat. Alaska Geol. Rec., 64, 237–265, https://doi.org/10.4018/978-1-60566-198-8.ch103, 1986.
Marino, P., Peres, D. J., Cancelliere, A., Greco, R., and Bogaard, T. A.: Soil moisture information can improve shallow landslide forecasting using the hydrometeorological threshold approach, Landslides, 17, 2041–2054, https://doi.org/10.1007/s10346-020-01420-8, 2020.
McCullagh, P. and Nelder, J. A.: Generalized Linear Models, 2nd ed., Chapman and Hall, London New York, 532 pp., https://doi.org/10.2307/2347392, 1989.
McElreath, R.: Statistical Rethinking: A Bayesian Course with Exampels in R and STAN, Second Edn., Chapman and Hall/CRC, ISBN 978-0-367-13991-9, 2020.
Melillo, M., Brunetti, M. T., Peruccacci, S., Gariano, S. L., Roccati, A., and Guzzetti, F.: A tool for the automatic calculation of rainfall thresholds for landslide occurrence, Environ. Modell. Softw., 105, 230–243, https://doi.org/10.1016/j.envsoft.2018.03.024, 2018.
University of Utah, Department of Atmospheric Sciences: MesoWest, https://mesowest.utah.edu, last access: 12 October 2023.
Miller, D.: Modeling Susceptibility to Landslides and Debris Flows in Southeast Alaska, https://terrainworks.sharefile.com/share/view/s8532031dfcf44ab0a87bc8a83b2b3b1c (last access: 12 October 2023), 2019.
Mirus, B. B., Morphew, M. D., and Smith, J. B.: Developing Hydro-Meteorological Thresholds for Shallow Landslide Initiation and Early Warning, Water, 10, 1–19, https://doi.org/10.3390/w10091274, 2018a.
Mirus, B. B., Becker, R. E., Baum, R. L., and Smith, J. B.: Integrating real-time subsurface hydrologic monitoring with empirical rainfall thresholds to improve landslide early warning, Landslides, 15, 1909–1919, https://doi.org/10.1007/s10346-018-0995-z, 2018b.
Napoli, A., Crespi, A., Ragone, F., Maugeri, M., and Pasquero, C.: Variability of orographic enhancement of precipitation in the Alpine region, Sci. Rep., 9, 1–8, https://doi.org/10.1038/s41598-019-49974-5, 2019.
Patton, A. and Luna, L.: pattonai/sitka-lews: sitka-lews repository for manuscript submission 20210105, Zenodo [data set] and [code], https://doi.org/10.5281/zenodo.7508537, 2023.
Oakley, N. S., Lancaster, J. T., Kaplan, M. L., and Ralph, F. M.: Synoptic conditions associated with cool season post-fire debris flows in the Transverse Ranges of southern California, Nat. Hazards, 88, 327–354, https://doi.org/10.1007/s11069-017-2867-6, 2017.
Osanai, N., Shimizu, T., Kuramoto, K., Kojima, S., and Noro, T.: Japanese early-warning for debris flows and slope failures using rainfall indices with Radial Basis Function Network, Landslides, 7, 325–338, https://doi.org/10.1007/s10346-010-0229-5, 2010.
Patton, A. I., Roering, J. J., and Orland, E.: Debris flow initiation in postglacial terrain: Insights from shallow landslide initiation models and geomorphic mapping in Southeast Alaska, Earth Surf. Proc. Landf., 47, 1583–1598, https://doi.org/10.1002/esp.5336, 2022.
Peres, D. J. and Cancelliere, A.: Comparing methods for determining landslide early warning thresholds: potential use of non-triggering rainfall for locations with scarce landslide data availability, Landslides, 18, 3135–3147, https://doi.org/10.1007/s10346-021-01704-7, 2021.
Perica, S., Kane, D., Dietz, S., Maitaria, K., Martin, D., Pavlovic, S., Roy, I., Stuefer, S., Tidwell, A., Trypaluk, C., Unruh, D., Yekta, M., Betts, E., Bonnin, G., Heim, S., Hiner, L., Lilly, E., Narayanan, J., Yan, F., and Zhao, T.: NOAA Atlas 14 Precipitation-Frequency Atlas of the United States, US Department of Commerce, National Oceanic and Atmospheric Administraion, National Weather Service, and University of Fairbanks, Silver Spring, Maryland, v7-2.0, https://www.weather.gov/media/owp/oh/hdsc/docs/Atlas14_Volume7.pdf (last access: 13 October 2023), 2012.
Peruccacci, S., Brunetti, M. T., Gariano, S. L., Melillo, M., Rossi, M., and Guzzetti, F.: Rainfall thresholds for possible landslide occurrence in Italy, Geomorphology, 290, 39–57, https://doi.org/10.1016/j.geomorph.2017.03.031, 2017.
Piciullo, L., Gariano, S. L., Melillo, M., Brunetti, M. T., Peruccacci, S., Guzzetti, F., and Calvello, M.: Definition and performance of a threshold-based regional early warning model for rainfall-induced landslides, Landslides, 14, 995–1008, https://doi.org/10.1007/s10346-016-0750-2, 2017.
Piciullo, L., Calvello, M., and Cepeda, J. M.: Territorial early warning systems for rainfall-induced landslides, Earth-Sci. Rev., 179, 228–247, https://doi.org/10.1016/j.earscirev.2018.02.013, 2018.
R Core Team: R: A languge and environment for statistical computing, https://www.r-project.org/ (last access: 10 October 2023), 2019.
Reichenbach, P., Rossi, M., Malamud, B. D., Mihir, M., and Guzzetti, F.: A review of statistically-based landslide susceptibility models, Earth-Sci. Rev., 180, 60–91, https://doi.org/10.1016/j.earscirev.2018.03.001, 2018.
Riehle, J. R., Champion, D. E., Brew, D. A., and Lanphere, M. A.: Pyroclastic deposits of the Mount Edgecumbe volcanic field, southeast Alaska: eruptions of a stratified magma chamber, J. Volcanol. Geoth. Res., 53, 117–143, https://doi.org/10.1016/0377-0273(92)90078-R, 1992a.
Riehle, J. R., Mann, D. H., Peteet, D. M., Engstrom, D. R., Brew, D. A., and Meyer, C. E.: The Mount Edgecumbe tephra deposits, a marker horizon in southeastern Alaska near the Pleistocene-Holocene boundary, Quaternary Res., 37, 183–202, https://doi.org/10.1016/0033-5894(92)90081-S, 1992b.
Roth, A., Hock, R., Schuler, T. V., Bieniek, P. A., Pelto, M., and Aschwanden, A.: Modeling Winter Precipitation Over the Juneau Icefield, Alaska, Using a Linear Model of Orographic Precipitation, Front. Earth Sci., 6, 1–19, https://doi.org/10.3389/feart.2018.00020, 2018.
Saito, H., Nakayama, D., and Matsuyama, H.: Relationship between the initiation of a shallow landslide and rainfall intensity-duration thresholds in Japan, Geomorphology, 118, 167–175, https://doi.org/10.1016/j.geomorph.2009.12.016, 2010.
Saito, T. and Rehmsmeier, M.: The Precision-Recall Plot Is More Informative than the ROC Plot When Evaluating Binary Classifiers on Imbalanced Datasets, PLOS ONE, 10, e0118432, https://doi.org/10.1371/journal.pone.0118432, 2015.
Sandberg, E.: A History of Alaska Population Settlement, Alaska Dep. Labor Work. Dev., 19, https://live.laborstats.alaska.gov/pop/estimates/pub/pophistory.pdf (last accessed: 10 October 2023), 2013.
Scheevel, C. R., Baum, R. L., Mirus, B. B., and Smith, J. B.: Precipitation thresholds for landslide occurrence near Seattle, Mukilteo, and Everett, Washington: U.S. Geological Survey Open-File Report 2017–1039, USGS Open-File Rep. 2017-1039, 51, https://doi.org/10.3133/ofr20171039, 2017.
Schwarz, G.: Estimating the Dimenson of a Model, Ann. Stat., 6, 461–464, 1978.
Segoni, S., Piciullo, L., and Gariano, S. L.: A review of the recent literature on rainfall thresholds for landslide occurrence, Landslides, 15, 1483–1501, https://doi.org/10.1007/s10346-018-0966-4, 2018.
Shanley, C. S., Pyare, S., Goldstein, M. I., Alaback, P. B., Albert, D. M., Beier, C. M., Brinkman, T. J., Edwards, R. T., Hood, E., MacKinnon, A., McPhee, M. V., Patterson, T. M., Suring, L. H., Tallmon, D. A., and Wipfli, M. S.: Climate change implications in the northern coastal temperate rainforest of North America, Climatic Change, 130, 155–170, https://doi.org/10.1007/s10584-015-1355-9, 2015.
Sharma, A. R. and Déry, S. J.: Variability and trends of landfalling atmospheric rivers along the Pacific Coast of northwestern North America, Int. J. Climatol., 40, 544–558, https://doi.org/10.1002/joc.6227, 2019.
Sharma, A. R. and Déry, S. J.: Contribution of atmospheric rivers to annual, seasonal, and extreme precipitation across British Columbia and southeastern Alaska, J. Geophys. Res.-Atmos., 125, e2019JD031823, https://doi.org/10.1029/2019jd031823, 2020.
Sidle, R. C.: Shallow groundwater fluctuations in unstable hillslopes of coastal Alaska, Zeitschrift für Gletscherkd. und Glazialgeol., 20, 79–95, 1984.
Sidle, R. C. and Swanston, D. N.: Analysis of a small debris slide in coastal Alaska, Can. Geotech. J., 19, 167–174, https://doi.org/10.1139/t82-018, 1981.
Staley, D. M., Negri, J. A., Kean, J. W., Laber, J. L., Tillery, A. C., and Youberg, A. M.: Prediction of spatially explicit rainfall intensity–duration thresholds for post-fire debris-flow generation in the western United States, Geomorphology, 278, 149–162, https://doi.org/10.1016/j.geomorph.2016.10.019, 2017.
Stan Development Team: Stan User's Guide 2.28, 1–9, https://www.mc-stan.org (last access: 10 February 2022), 2022.
Stanley, T. and Kirschbaum, D. B.: A heuristic approach to global landslide susceptibility mapping, Nat. Hazards, 87, 145–164, https://doi.org/10.1007/s11069-017-2757-y, 2017.
Swanston, D. N.: Mechanics of Debris Avalanching in Shallow Till Soils of Southeast Alaska, USDA Forest Service Research Paper PNW-103, Juneau, Alaska, https://doi.org/10.5962/bhl.title.87969, 1970.
Swanston, D. N. and Marion, D. A.: Landslide response to timber harvest in Southeast Alaska, in: Proceedings of the 5th Fed. Interag. Sediment. Conf., Las Vegas, NV, USA, 18–21 March 1991, 10, 49–56, https://pubs.usgs.gov/misc/FISC_1947-2006/pdf/1st-7thFISCs-CD/5thFISC/5Fisc-V2/5Fsc2-10.PDF (last access: 11 October 2023), 1991.
Synoptic: PASI Station Data Download, Synoptic [data set], https://download.synopticdata.com/#a/PASI, 2023.
Thomas, M. A., Mirus, B. B., Collins, B. D., Lu, N., and Godt, J. W.: Variability in soil-water retention properties and implications for physics-based simulation of landslide early warning criteria, Landslides, 15, 1265–1277, https://doi.org/10.1007/s10346-018-0950-z, 2018.
Tufano, R., Cesarano, M., Fusco, F., and Vita, P. De: Probabilistic approaches for assessing rainfall thresholds triggering shallow landslides. The study case of the peri-vesuvian area (Southern Italy), Ital. J. Eng. Geol. Environ., 2019, 105–110, https://doi.org/10.4408/IJEGE.2019-01.S-17, 2019.
Tullos, D., Byron, E., Galloway, G., Obeysekera, J., Prakash, O., and Sun, Y. H.: Review of challenges of and practices for sustainable management of mountain flood hazards, Nat. Hazards, 83, 1763–1797, https://doi.org/10.1007/s11069-016-2400-3, 2016.
US Census Bureau: QuickFacts for the Sitka city and borough, Alaska, https://www.census.gov/quickfacts/sitkacityandboroughalaska (last access: 12 October 2023), 2022.
US Forest Service: Tongass National Forest Landslide Areas, State of Alaska Open Data Portal, https://gis.data.alaska.gov/datasets/usfs::tongass-national-forest-landslide-areas/about (last access: 12 October 2023), 2019.
Vascik, B. A., Booth, A. M., Buma, B., and Berti, M.: Estimated Amounts and Rates of Carbon Mobilized by Landsliding in Old-Growth Temperate Forests of SE Alaska, J. Geophys. Res.-Biogeo., 126, 1–21, https://doi.org/10.1029/2021JG006321, 2021.
Vehtari, A., Gelman, A., and Gabry, J.: Practical Bayesian model evaluation using leave-one-out cross-validation and WAIC, Stat. Comput., 27, 1413–1432, https://doi.org/10.1007/s11222-016-9696-4, 2017.
Wendler, G., Galloway, K., and Stuefer, M.: On the climate and climate change of Sitka, Southeast Alaska, Theor. Appl. Climatol., 126, 27–34, https://doi.org/10.1007/s00704-015-1542-7, 2016.
White, C., Gehrels, G. E., Pecha, M., Giesler, D., Yokelson, I., McClelland, W. C., and Butler, R. F.: U-Pb and Hf isotope analysis of detrital zircons from Paleozoic strata of the southern Alexander terrane (Southeast Alaska), Lithosphere, 8, 83–96, https://doi.org/10.1130/L475.1, 2016.
Wicki, A., Lehmann, P., Hauck, C., Seneviratne, S. I., Waldner, P., and Stähli, M.: Assessing the potential of soil moisture measurements for regional landslide early warning, Landslides, 17, 1881–1896, https://doi.org/10.1007/s10346-020-01400-y, 2020.
Wilks, D. S.: Forecast Verification, Int. Geophys., 100, 301–394, https://doi.org/10.1016/B978-0-12-385022-5.00008-7, 2011.