the Creative Commons Attribution 4.0 License.
the Creative Commons Attribution 4.0 License.
 | 28 Sep 2023
Lava flow hazard modeling during the 2021 Fagradalsfjall eruption, Iceland: applications of MrLavaLoba
Melissa A. Pfeffer
Sara Barsotti
Simone Tarquini
Mattia de'Michieli Vitturi
Bergrún A. Óladóttir
Ragnar Heiðar Þrastarson
The 6-month-long effusive eruption at the Fagradalsfjall volcano in 2021 is the most visited eruption site in Iceland to date (June 2023), and it needed intense lava flow hazard assessment. In this study we document how strategies for lava flow modeling were implemented using the stochastic model MrLavaLoba to evaluate hazards during this effusive event. Overall, the purposes were threefold: (a) pre-eruption simulations to investigate potential lava inundation of critical infrastructure, (b) syn-eruption simulations for short-term (2-week time frame) lava flow hazard assessment and (c) syn-eruption simulations for long-term (months to years) hazard assessments. Additionally, strategies for lava barrier testing were developed, and syn-eruption topographic models were incorporated into simulations in near real time. The model provided promising results that were shared regularly at stakeholder meetings with the monitoring personnel, scientists and civil-protection representatives helping to identify potential short-term and long-term lava hazards. This included evaluation of the timing of barrier overflow and the filling and spilling of lava from one valley to another.
During the crisis the MrLavaLoba model was updated to increase functionality such as by considering multiple active vents. Following the eruption, the model was optimized substantially, decreasing the computational time required for the simulations and speeding up the delivery of final products.
- Article
(15965 KB) - Full-text XML
- BibTeX
- EndNote


On 19 March 2021, the first eruption on the Reykjanes Peninsula in ca. 800 years started at Fagradalsfjall, a mountainous area cut by nested enclosed valleys (Fig. 1). Being located in the backyard of the capital Reykjavík and the international airport, thousands of people visited the eruption each day, which therefore needed intense monitoring and thorough hazard assessment (Barsotti et al., 2023). The 2021 Fagradalsfjall eruption did not impact any critical infrastructure. However, it became a case study for the monitoring and hazard assessment of future effusive eruptions since several volcanic systems on the Reykjanes Peninsula have the potential to transport lava into inhabited areas or inundate critical infrastructure.
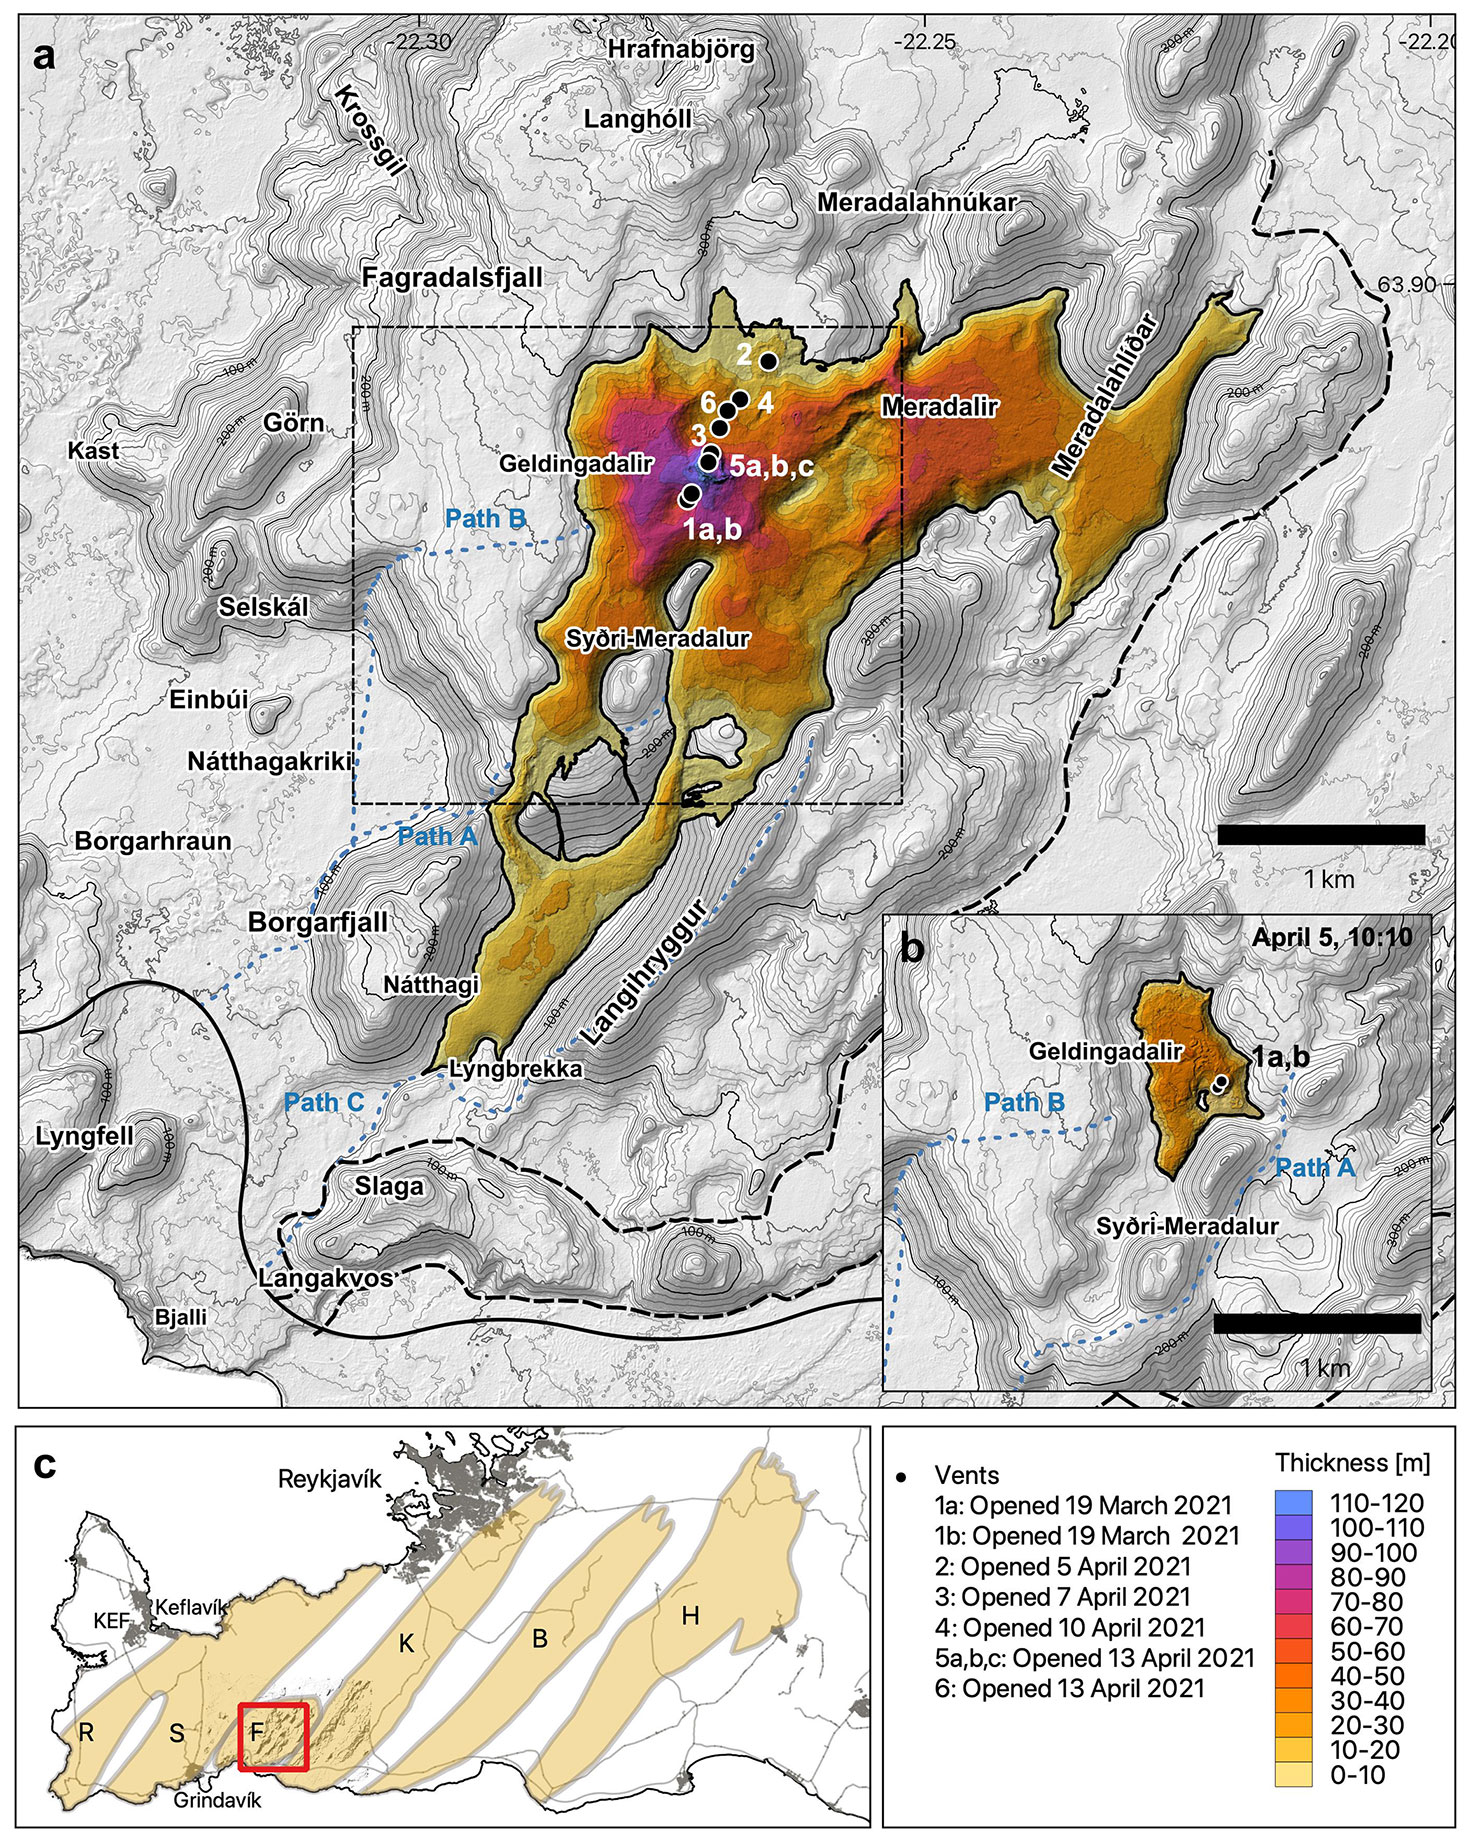
Figure 1(a) Overview of the Fagradalsfjall area at the end of the eruption. Vents are marked with dots and numbered chronologically after opening time. The lava thickness map is from 30 September 2021 (Pedersen et al., 2022b). Dashed black box indicates the extent of panel (b). The highway is marked with a solid black line, and dirt roads are dashed black lines. Hiking paths are marked with a dashed blue line (all roads are based on data from the National Land Survey of Iceland; IS50V). (b) Overview of the Fagradalsfjall area by the end of phase 1. The lava thickness map is from 5 April 2021 (Pedersen et al., 2022b). (c) Map of the Reykjanes Peninsula. The red box indicates the area displayed in (a). Densely populated areas are marked in gray. Volcanic systems (Fig. 4.13.1 of Sæmundsson and Sigurgeirsson, 2013) are marked in orange and denoted by capital letters according to their name: R – Reykjanes, S – Svartsengi, F – Fagradalsfjall, K – Krýsuvík, B – Brennisteinsfjöll, H – Hengill. Background topography is based on IslandsDEM (Porter et al., 2018).
To address the varied lava flow hazards during the pre-eruption unrest phase and during the eruption, we implemented different strategies for lava flow modeling using the stochastic model MrLavaLoba (de'Michieli Vitturi and Tarquini, 2018). The model proved to be a useful and flexible tool to evaluate pre-eruption as well as syn-eruption short-term and long-term hazards during the 6-month-long effusive event. Different approaches as well as new developments of the code were used to account for the changes in the eruptive behavior and to resolve challenges provided by the complex topographic terrain, where infilling and overflowing of nested valleys created hazards for visitors that changed with time. Additionally, strategies for lava barrier testing were developed and near-real-time syn-eruption topographic models were incorporated as the eruption progressed. We describe in detail the model performance throughout the eruption, and at the end we address caveats that should be considered when applying the model and make suggestions for future improvements.
1.1 Geological setting and eruptive history
The Reykjanes Peninsula is an oblique spreading zone, characterized by eruptive fissures, open fissures and north–south-striking strike-slip faults that are associated with the mid-Atlantic plate boundary (e.g., Klein et al., 1977; Gee, 1998; Clifton and Kattenhorn, 2006; Einarsson et al., 2020; Sæmundsson et al., 2020). The eruptive centers have been divided into four to six volcanic systems (Fig. 1c), based on high-temperature geothermal areas, magnetic anomalies, eruptive centers and geochemistry and are named the following from east to west: Hengill, Brennisteinsfjöll, Krýsuvík, Fagradalsfjall, Svartsengi and Reykjanes (e.g., Jakobsson et al., 1978; Einarsson and Sæmundsson, 1987; Einarsson et al., 2020; Sæmundsson et al., 2020).
Volcanic activity on the Reykjanes Peninsula has been episodic, with several eruptions occurring in multiple volcanic systems over several hundred years followed by ∼ 800–1000 years of quiescence. During the eruptive cycles of the last 4000 years, the Reykjanes, Svartsengi, Krýsuvík, Brennisteinsfjöll and Hengill volcanic systems have erupted (Fig. 1c), while the Fagradalsfjall volcanic system remained inactive (Sæmundsson et al., 2020). The most recent eruptive period of the Reykjanes Peninsula ended in 1240 CE (Sæmundsson et al., 2020). Basaltic subaerial volcanic activity has dominated the Reykjanes Peninsula since the termination of the last glaciation, estimated at around 12 000–15 000 years ago (e.g., Jakobsson et al., 1978; Sæmundsson et al., 2010). The axial centers of the volcanic systems are dominated by eruption fissures, while shield volcanoes lie on the periphery of each swarm (Jakobsson et al., 1978). The fissure eruptions were presumably short-lived eruptions that had a high effusion rate, while the shields are believed to be long-lived, monogenetic eruptions that dominated the early postglacial times (Rossi, 1996; Jakobsson et al., 1978). During interglacial periods volcanic eruptions formed widespread glaciovolcanic edifices on the peninsula ranging from small mounds, tindars and flat-topped tuyas to multiple polygenetic complexes of intergrown tindars and tuyas (Jones, 1969; Sæmundsson et al., 2010; Pedersen and Grosse, 2014). Fagradalsfjall lies in a complex of intergrown tuyas, tindars and mounds of different ages creating a complex of mountains ranging from 100–350 m elevation above sea level cut by nested enclosed valleys ranging from 50–215 m a.s.l. elevation. Around this glaciovolcanic complex there are postglacial lava fields gently dipping away from the complex in all directions (Sæmundsson et al., 2010).
1.2 Fagradalsfjall unrest and eruption
In the following section the Fagradalsfjall 2021 unrest and eruption phases (Fig. 2, column 1) are described with a focus on those characteristics of the eruption that affected the lava flow simulations performed at each stage (Fig. 2, column 2).
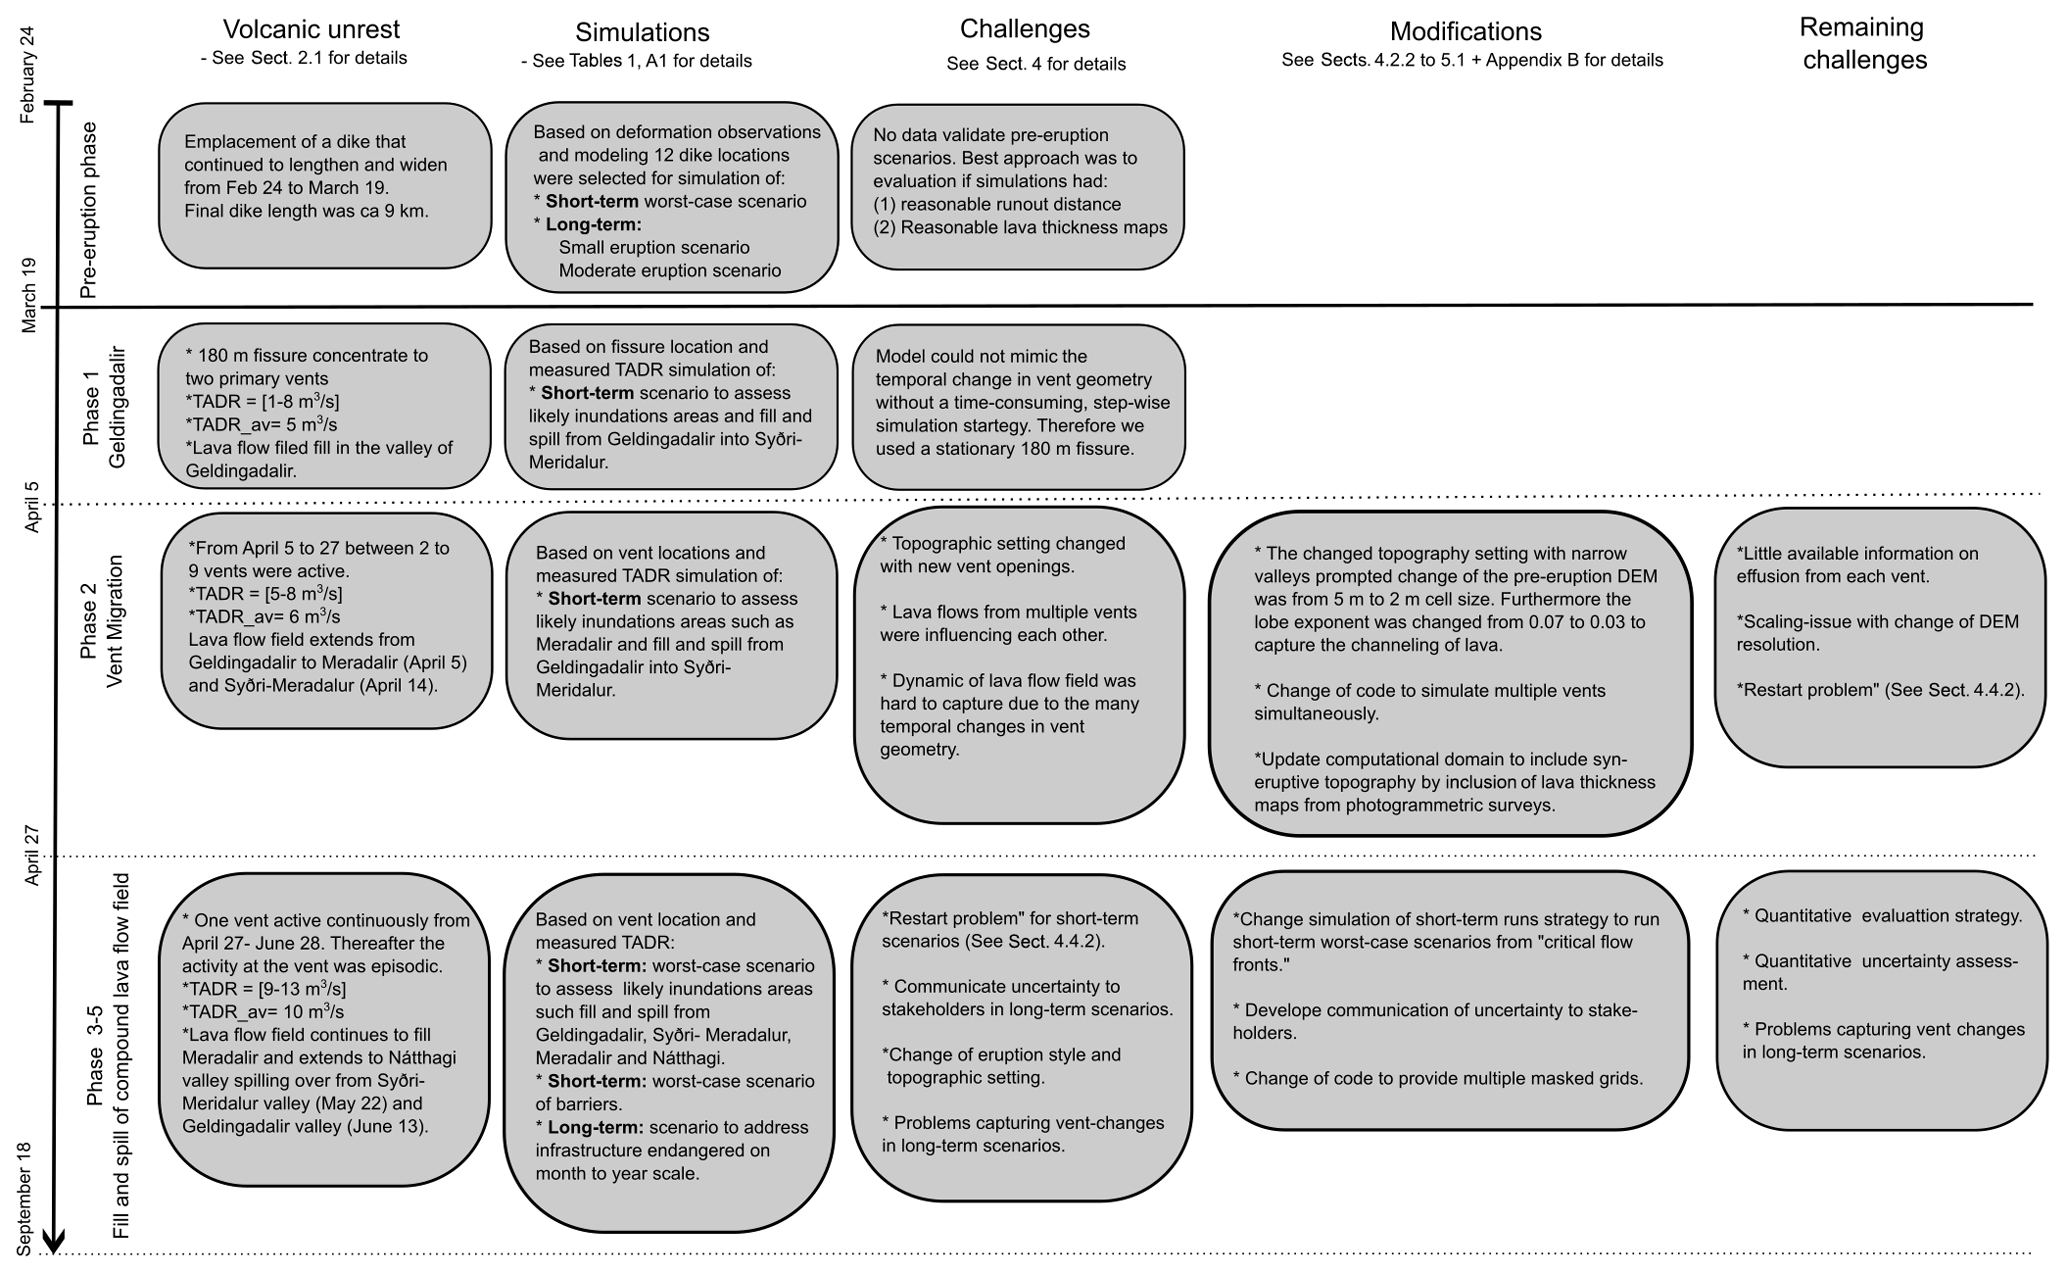
Figure 2Illustration of the temporal development of the volcanic unrest (column 1), the simulations performed addressing these developments (column 2), the identified simulation challenges (column 3), the modifications implemented to address these challenges (column 4) and the remaining challenges.
Prior to the eruption, volcano-seismic unrest was detected at multiple volcanic systems (Svartsengi, Reykjanes and Krýsuvík) along the Reykjanes Peninsula. Intense seismicity started in December 2019, and ground deformation revealing episodes of inflation and deflation started in January 2020 (Cubuk-Sabuncu et al., 2021; Flóvenz et al., 2022; Sigmundsson et al., 2022; Greenfield et al., 2022; Barsotti et al., 2023). On 24 February 2021, an intense earthquake swarm began with an Mw 5.64, located 2–4 km northeast of Fagradalsfjall, marking the start of a dike intrusion. The location of the seismicity was associated with both the dike intrusion and the neighboring faults which were activated by induced stress changes in the crust (Sigmundsson et al., 2022). The dike continued to lengthen to approximately 9 km during the next 23 d before it erupted east of Fagradalsfjall (Sigmundsson et al., 2022).
The eruption began on 19 March between 20:30 and 20:50 UTC in Geldingadalir valley when a 180 m long fissure opened (Pedersen et al., 2022a; Barsotti et al., 2023). The fissure quickly concentrated into two neighboring vents (Eibl et al., 2023). The lava started infilling the valley with a time-averaged discharge rate (TADR) ranging from 1 to 8 m3 s−1 (Pedersen et al., 2022a). By 5 April a new phase of eruptive activity had started as two new fissures opened 800 m northeast of the first fissure. Further fissures opened at midnight on 7, 10 and 13 April. Each fissure concentrated into one to two circular vents, which over the following 10 d became inactive, except for the southern vent that developed from the 13 April fissures (Barsotti et al., 2023). By 27 April only one vent was active, and it remained active throughout the rest of the eruption (Barsotti et al., 2023). During this vent migration phase the TADR ranged from 5 to 8 m3 s−1 (Pedersen et al., 2022a) and the lava started to flow into the valleys of Meradalir (5 April) and Syðri-Meradalur (14 April). From 27 April to 28 June the TADR increased from 9 m3 s−1 to a maximum of 13 m3 s−1, and with this increased effusion rate the lava migrated to its maximum extent of 3.3 km from the active vent. The lava was transported in systems of connected channels, lava ponds and tubes (Pedersen et al., 2022a). The lava “filled and spilled” to Nátthagi valley through Syðri-Meradalur (22 May) and through southern Geldingadalir (13 June). From 28 June to 2 September the lava effusion from the vent changed from being continuous to episodic (ca. 12–24 h of lava emplacement), followed by inactive periods of similar length (Barsotti et al., 2023). Despite this change, the TADR in this phase was similar to the previous phase, ranging from 9 to 11 m3 s−1 (Pedersen et al., 2022a). The episodic activity disrupted the dominant lava transport system, causing large overflows in the vent region where an additional 50 m of lava piled up, increasing the total maximum lava thickness to 124 m (Pedersen et al., 2022a). In the last days of the eruption, 2–18 September, a 9 d long pause (2–11 September) was followed by a week-long period (11–18 September) of activity (Pedersen et al., 2022a; Barsotti et al., 2023). Most of the lava emplacement was in Geldingadalir, where a 10–15 m thick lava pond was established north-northwest of the active crater between 11–15 September. The pond partly drained southward through an upwelling zone and into Nátthagi (15–18 September). The measured TADR was 12 m3 s−1 for 9–17 September, and the final bulk volume of the lava flow field increased to 150.8×10⁶ m3, covering an area of 4.85 km2 (Pedersen et al., 2022a).
1.3 Lava flow simulations
Numerical models for the simulation of the emplacement of lava flows are widely used for hazard and risk assessments purposes before and during eruptions, and they are often divided into deterministic and stochastic (or probabilistic) models. The so-called deterministic models are intended to mimic the behavior of the natural systems by modeling physical processes based on a set of conservation equations and including parameters such as lava discharge rate, lava temperature and heat transfer (e.g., Dietterich et al., 2017; FLOWGO: Harris and Rowland, 2001; PyFLOWGO: Chevrel et al., 2018; MAGFLOW: Cappello et al., 2016a). The stochastic models are based on the evidence that lava is a gravitational flow which tends to follow the steepest path of descent downhill (Favalli et al., 2012) but can deviate from it in an unpredictable way (e.g., DOWNFLOW: Favalli et al., 2005; Tarquini and Favalli, 2013; Q-LAVHA: Mossoux et al., 2016). Recent developments of stochastic models have included erupted volume as an input parameter, allowing for the lava field thickness to be one of the model outputs (Glaze and Baloga, 2013; MrLavaLoba: de'Michieli Vitturi and Tarquini 2018). The deterministic models and some of the stochastic ones attempt to replicate the patterns of channelized lava flows (e.g., Mossoux et al., 2016; Dietterich et al., 2017; Chevrel et al., 2018), while a few stochastic models additionally replicate tube-fed flows (Favalli et al., 2005; de'Michieli Vitturi and Tarquini, 2018).
Starting with the pioneering work at Etna during the 1991–1993 eruption (Barberi and Villari, 1994), numerical modeling of lava flows has increasingly been used to mitigate potential destruction caused by active lava flows. This approach has been refined over the years in both theoretical and practical aspects (e.g., Wright et al., 2008; Cappello et al., 2016a; Harris et al., 2019), including using an operational tool which combines satellite-derived discharge rate estimates and the MAGFLOW numerical code (Vicari et al., 2011; Ganci et al., 2012).
Paths of steepest descent have been used since 2007 by the Hawaiian Volcano Observatory (HVO) to assess likely lava flow routes during effusive crises (Kauahikaua, 2007). During the 2018 eruption in the district of Puna (Neal et al., 2019), the HVO produced preliminary lava flow path forecasts using the DOWNFLOW code (Favalli et al., 2005) to inform about probable future lava flow directions.
At Piton de la Fournaise (La Réunion, France), the local Observatoire Volcanologique du Piton de la Fournaise (OVPF) tackles the hazard related to frequent effusive eruptions by combining the processing of satellite data with numerical lava flow modeling (Harris et al., 2017, 2019; Peltier et al., 2022). The OVPF has promoted effective collaboration between scientists affiliated with a multinational array of institutes and is able to issue hazard maps based on DOWNFLOW (Favalli et al., 2005; Chevrel et al., 2021) and PyFLOWGO (Chevrel et al., 2018) within a few hours after the onset of an effusive eruption (Peltier et al., 2021).
In other recent effusive crises such as the 2014–2015 Fogo eruption, Cabo Verde lava flow hazard assessment was performed using both DOWNFLOW (Richter et al., 2016) and MAGFLOW (Cappello et al., 2016b), while the 2021 La Palma eruption used VORIS code (Felpeto et al., 2007; Carracedo et al., 2022; Martí et al., 2022).
1.4 Lava flow hazard modeling in Iceland
The first lava flow simulations during an eruption in Iceland were performed during the 2010 Fimmvörðuháls eruption with VORIS, which is a GIS-based (geographic information system) program for volcanic hazard assessment (Felpeto et al., 2007; Thorkelsson et al., 2012). The simulation was made to assess potential eruption scenarios with a given eruption location and runout length as input parameters. Prior to the onset of the 2014–2015 Holuhraun eruption, VORIS ran as part of the VOLCANBOX package (https://volcanbox.wordpress.com/, last access: 4 September 2023) within the VeTools project (http://www.evevolcanoearlywarning.eu/vetools-objectives/, last access: 4 September 2023) and the initial versions of the MrLavaLoba model started being run (de'Michieli Vitturi and Tarquini, 2018). During the unrest phase before the Holuhraun eruption, both VORIS and MrLavaLoba were run regularly and compared to each other. MrLavaLoba continued to be developed and improved throughout the eruption (Tarquini et al., 2019). After this eruption, both VORIS and MrLavaLoba were used for volcanic hazard assessment projects in Iceland (Andrésdóttir, 2016, 2018; Pfeffer et al., 2020). Since 2015 the Icelandic Meteorological Office, the volcano observatory in Iceland, has performed lava hazard assessments using the stochastic model MrLavaLoba. This is not only because of its fast computational time compared to more complex “deterministic” models that have greater computational requirements but also because of its ability to account for lava flow volume and the syn-eruption modification of the topography compared to other stochastic models.
The primary data sources for lava flow simulations were the pre-eruption and syn-eruption digital elevation models (DEMs) that constitute the computational domain for the lava flow simulations.
In the pre-eruption phase, the lava flow simulations were initialized by using pre-defined, hypothetical, longer-term scenarios characterized by different total volumes and fissure lengths. Two main volumetric eruptive scenarios were considered based on data from the eruptive history of the Reykjanes Peninsula (Sigurgeirsson and Einarsson, 2016; Einarsson, 2019a, b; Sæmundsson, 2019; Sigurgeirsson and Einarsson, 2019; Óladóttir, 2022), comprising a small and a medium-sized scenario characterized by volumes of < 0.1 and 0.1–0.5 km3, respectively. Two lava flow fields, Illahraun (0.02 km3) and Arnarseturshraun (0.3 km3), served as a template for these scenarios (Sæmundsson et al., 2010). Two fissure lengths were chosen based on Jónsson's (1978) geological data for the Reykjanes Peninsula, namely short fissures (2 km) and long fissures (10 km). Input data for the syn-eruption phase relied on observations of extruded volume and vent geometry (Pedersen et al., 2022a, b) and were used for initializing simulations to produce the short-term and long-term hazard assessment.
2.1 Pre-eruption DEM
We used the 2 m cell size IslandsDEMv0 (https://atlas.lmi.is/dem, last access: 4 September 2023) as the pre-eruption DEM, a seamless mosaic of the ArcticDEM (Porter et al., 2018) with improved positional accuracy and a reduced number of data outliers. Based on comparisons with lidar surveys carried out in the vicinity of the Icelandic glaciers (Jóhannesson et al., 2013), the elevation accuracy of the pre-eruption IslandsDEMv0 is better than 0.5 m (https://gatt.lmi.is/geonetwork/srv/eng/catalog.search#/metadata/e6712430-a63c-4ae5-9158-c89d16da6361, last access: 4 September 2023). The cell size and number of cells of the computational domain (i.e., the DEM in grid format representing the local topography) have a strong impact on the performance of the MrLavaLoba code (Tarquini et al., 2019); as the number of grid cells increases, the simulation time increases. IslandsDEMv0 was therefore downsampled depending on the expected spatial extent of simulated scenarios. Long-term scenarios (volume of > 0.02 km3) were simulated on 10 m cell size grids, while smaller short-term scenarios (volume of < 0.02 km3) were simulated on 5 m cell size grids. In a few simulations of lava flows close to barriers or within a narrow valley setting, the full-resolution 2 m cell size of IslandsDEMv0 was used as the computational domain. We note that the use of a 5 or 10 m cell size DEM is customary in lava flow modeling (Flynn et al., 2023) and we only used a 2 m cell size DEM when higher detail was necessary.
2.2 Syn-eruption photogrammetric surveys
Throughout the eruption, photogrammetric surveys were acquired as a part of the monitoring in near real time of the Fagradalsfjall 2021 eruption. These surveys consisted mainly of aerial photographs and Pléiades stereo images, and by 30 September 2021, 32 syn-eruption surveys had been carried out. The acquisition and processing of these surveys are described in detail in Pedersen et al. (2022a). Each of the surveys was co-registered to the pre-eruption DEM, i.e., IslandsDEMv0, using the DEM co-registration method of the Nuth and Kääb (2011).
Each survey yielded DEMs (2 m cell size) and orthomosaics (0.3 m cell size) from which the lava flow outline was obtained, and these data are available via Pedersen et al. (2022b). By subtracting the DEMs with a pre-eruption DEM and with the DEMs from the previous surveys it was possible to obtain thickness maps (2 m cell size) and estimate bulk eruption volumes and time-averaged discharge rates (TADRs). These data products were generally available 3–6 h after acquisition.
The thickness maps were used in the lava flow simulations for two purposes: (a) to compare to the results of lava flow simulations and (b) to update the computational domain from pre-eruption to syn-eruption topography for the short-term simulation after 27 April, when the lava field had become very complex to simulate due to changes in the vent activity and the expansion of the lava field infilling multiple valleys at variable rates.
MrLavaLoba is a probabilistic lava flow simulation model that was developed starting in 2014 and first released in 2018 (de'Michieli Vitturi and Tarquini, 2018). It is freely available at the model repository (http://demichie.github.io/MrLavaLoba/, last access: 4 September 2023) and has previously been applied to Etna in 2001, Kīlauea in 2014–2016 and Holuhraun in 2014–2015 and for hazard assessment of Heimaey (de'Michieli Vitturi and Tarquini, 2018; Tarquini et al., 2019; Pfeffer et al., 2020). A general introduction to the model is summarized below. For a detailed technical explanation of the code, we refer the reader to de'Michieli Vitturi and Tarquini (2018) as well as the abovementioned GitHub repository.
The MrLavaLoba model requires (a) a computational domain constituted by the pre-emplacement topography and (b) a series of input parameters (including, e.g., vent position and geometry, total extruded lava volume, the number of computational flows). The lava emplacement is simulated as elliptical lava “parcels” or “lobes” with a given area and thickness that are deposited stepwise along the flow path, constantly modifying the topography. Each new parcel buds from an existing one so that the simulation progresses by creating chains of a given number of parcels. The chains of parcels (making up a flow path) are called computational “flows”. The direction of propagation of each parcel with respect to the parent parcel (the parcel where the budding process occurs) is determined by the local direction of the steepest descent path (computed on the topography with the addition of a random perturbation) and of an additional contribution (called the “inertial factor”) given by the direction of the parent parcel (de'Michieli Vitturi and Tarquini, 2018). Once the direction of propagation is determined, the new parcel is added in its final position. Another stochastic variable, the “lobe exponent”, controls the probability distribution among the existing parcels to bud a new parcel. When this parameter is set to 0, the latest parcel emplaced buds the next parcel and no branching occurs. The model proceeds by iteratively setting new parcels on the topography until their cumulative volume equals the lava volume prescribed for the simulation. At the end of each simulation the model provides a raster map of the final lava thickness, where each cell in the raster constitutes the cumulative thickness of all parcels that covered or inundated that cell. The model also allows for saving masked grids obtained by considering inundated cells fulfilling a specified threshold value. As an example, if this threshold is set to 95 % (0.95), the thinnest portion of the final lava deposit (i.e., of the map of the final lava thickness) representing 5 % of the total volume is disregarded from the map and the remaining constitutes a “masked” map of the final lava deposit. This step is relevant due to the probabilistic nature of the model, where the thinnest part of the final lava deposit represents a lower probability of inundation, which may change between simulations with the same input parameters. The 95 % masked grids from different simulations with the same input parameters tend to converge (de'Michieli Vitturi and Tarquini, 2018) and represent an area more likely to be inundated. Through iterations of a large number of computational flows, MrLavaLoba handles the probabilistic aspect of lava emplacement (de'Michieli Vitturi and Tarquini, 2018).
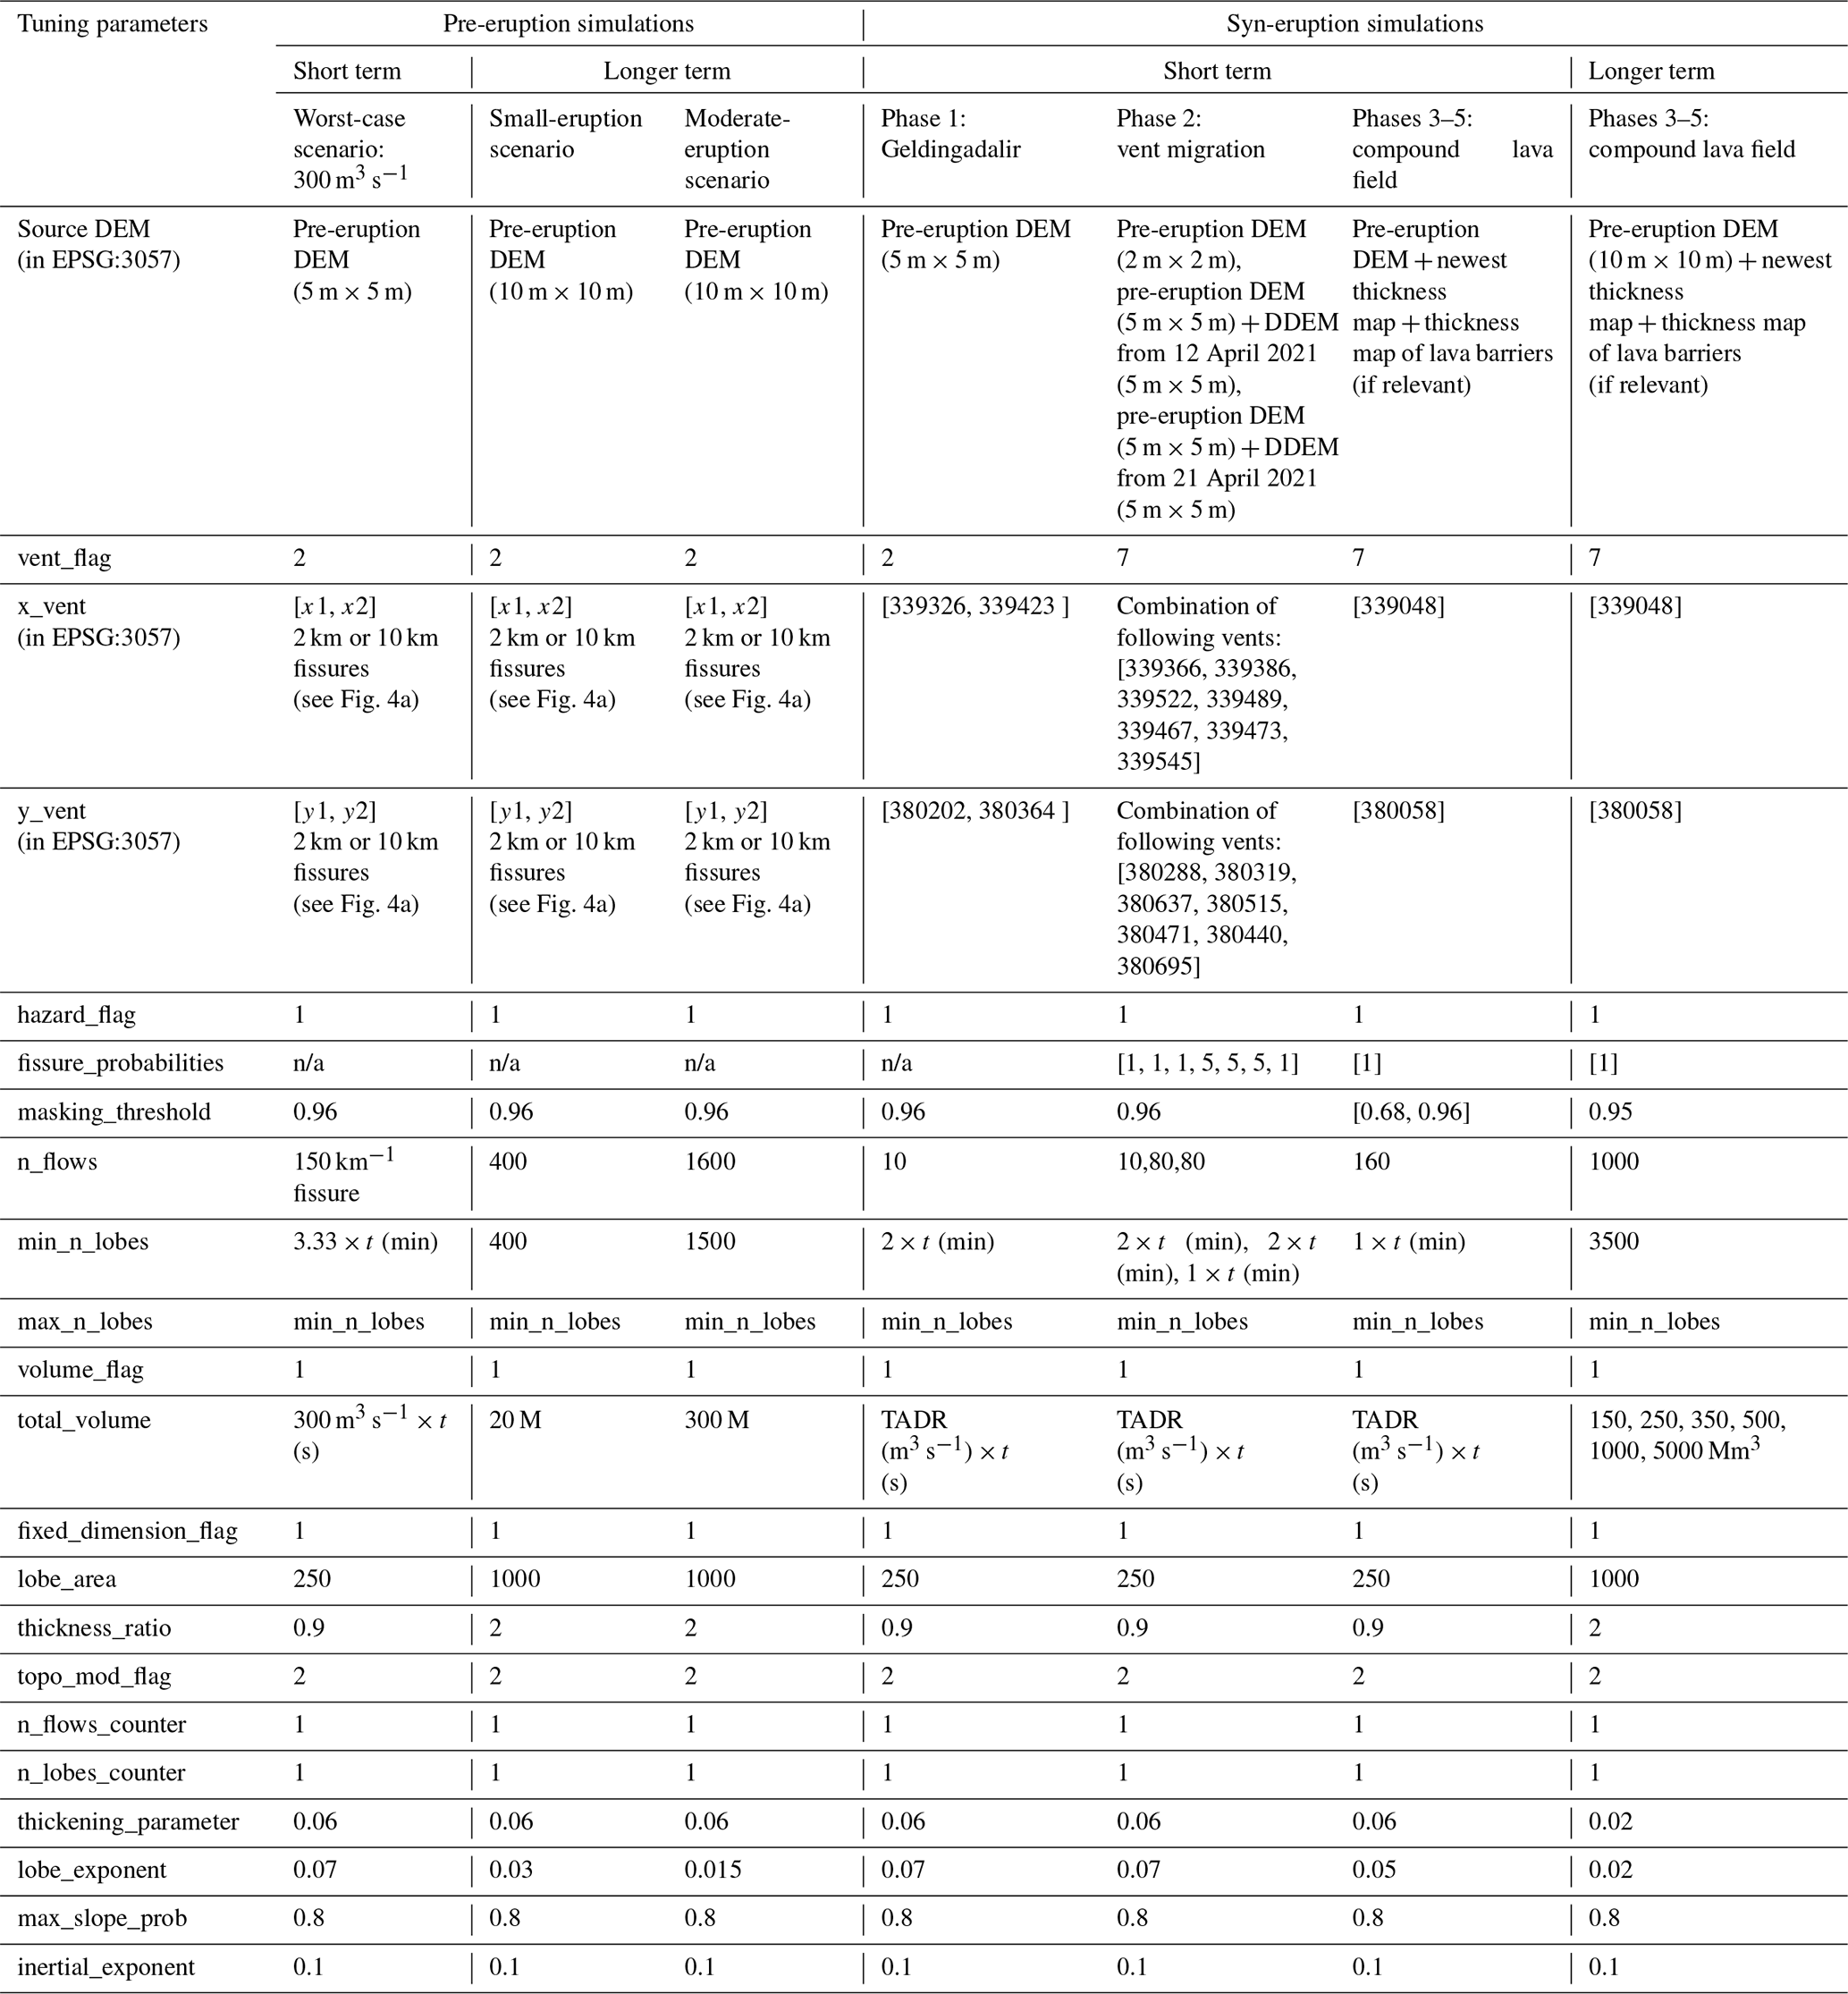
Additional topographic layers can easily be included in the model, such as lava thickness maps from syn-eruption surveys or thickness maps of lava barriers, allowing for quick modification of the pre-emplacement topography (Fig. 3). Several tuning options are implemented to mimic different lava transport mechanisms (channelized flows, lava tubes or stochastic budding of lava lobes), accounting for a given propensity to lengthening, widening or thickening of the flow field. Examples of input settings written in heavily commented Python code can be found in the code repository (http://demichie.github.io/MrLavaLoba/, last access: 4 September 2023). Furthermore, specific input parameters used in the pre-eruption and syn-eruption phase of the Fagradalsfjall 2021 unrest are provided in Table 1 (overview of the most important input parameters) and Table A1 (all input parameters).
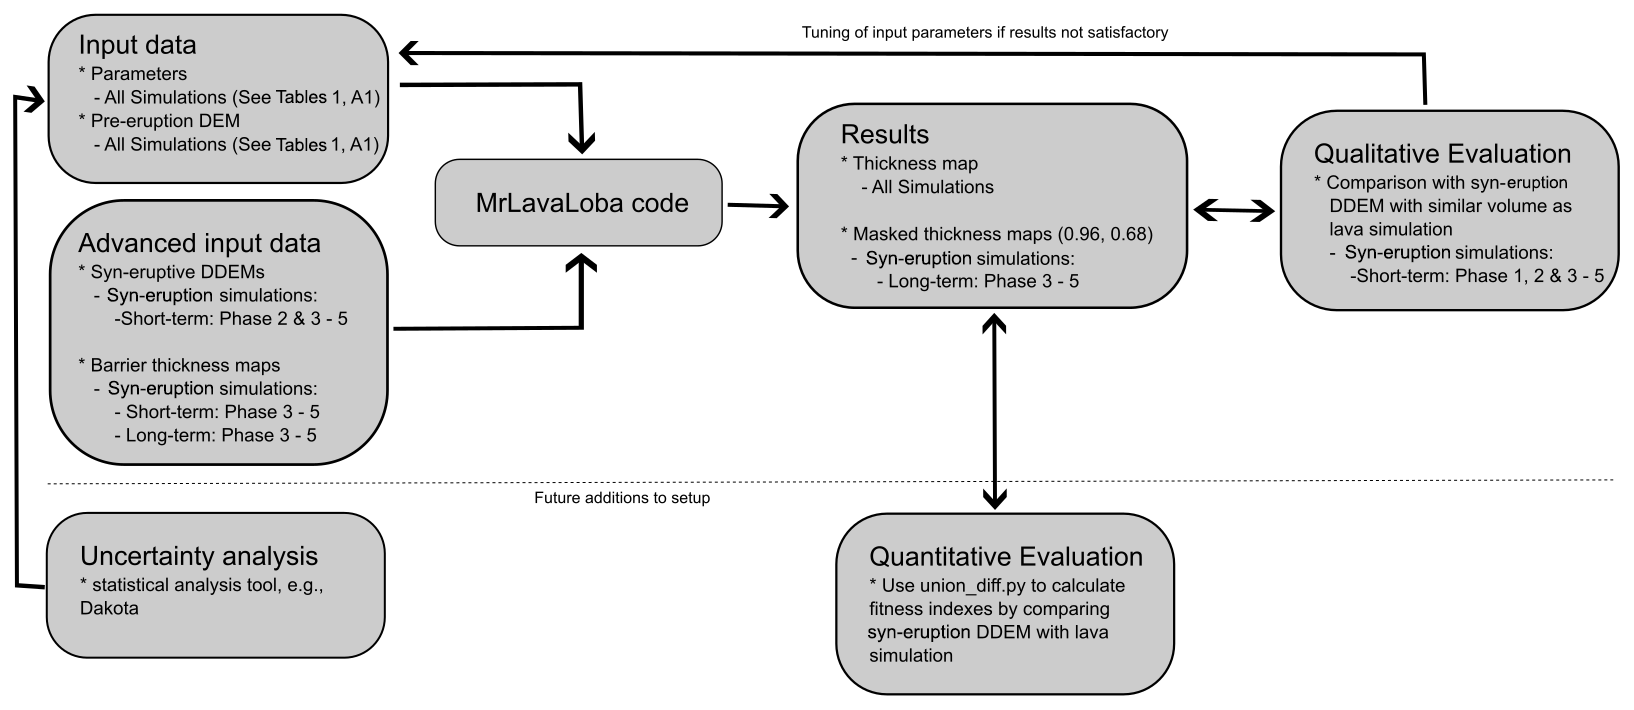
Figure 3Flowchart for the lava flow simulations performed with the MrLavaLoba code during the Fagradalsfjall 2021 volcanic unrest. Suggested future improvements of the setup are added below the dashed line.
During the Fagradalsfjall eruption several new features were implemented to improve MrLavaLoba's applicability to the dynamic event (see Sect. 4). The first change was to add the possibility of having multiple vents (or multiple fissures) active at the same time with a prescribed supply probability. Second, the model was modified to enable multiple threshold values for a single simulation, in order to filter inundated areas as differing levels of likelihood of inundation. Finally, the code was optimized to accelerate runs. This improvement was primarily done by providing a faster method to update the topography as new lava parcels are settled by constraining the computationally expensive “update topography” function to a very limited area around the new lava parcel. With respect to the version available at the beginning of the Fagradalsfjall 2021 unrest, the optimized code now is up to 5–10 times faster. Appendix B provides details on the specific code changes and when they were implemented.
Table 1Overview of implementation strategies of MrLavaLoba for pre- and syn-eruption simulations. DDEM: differential digital elevation model. n/a: not applicable.
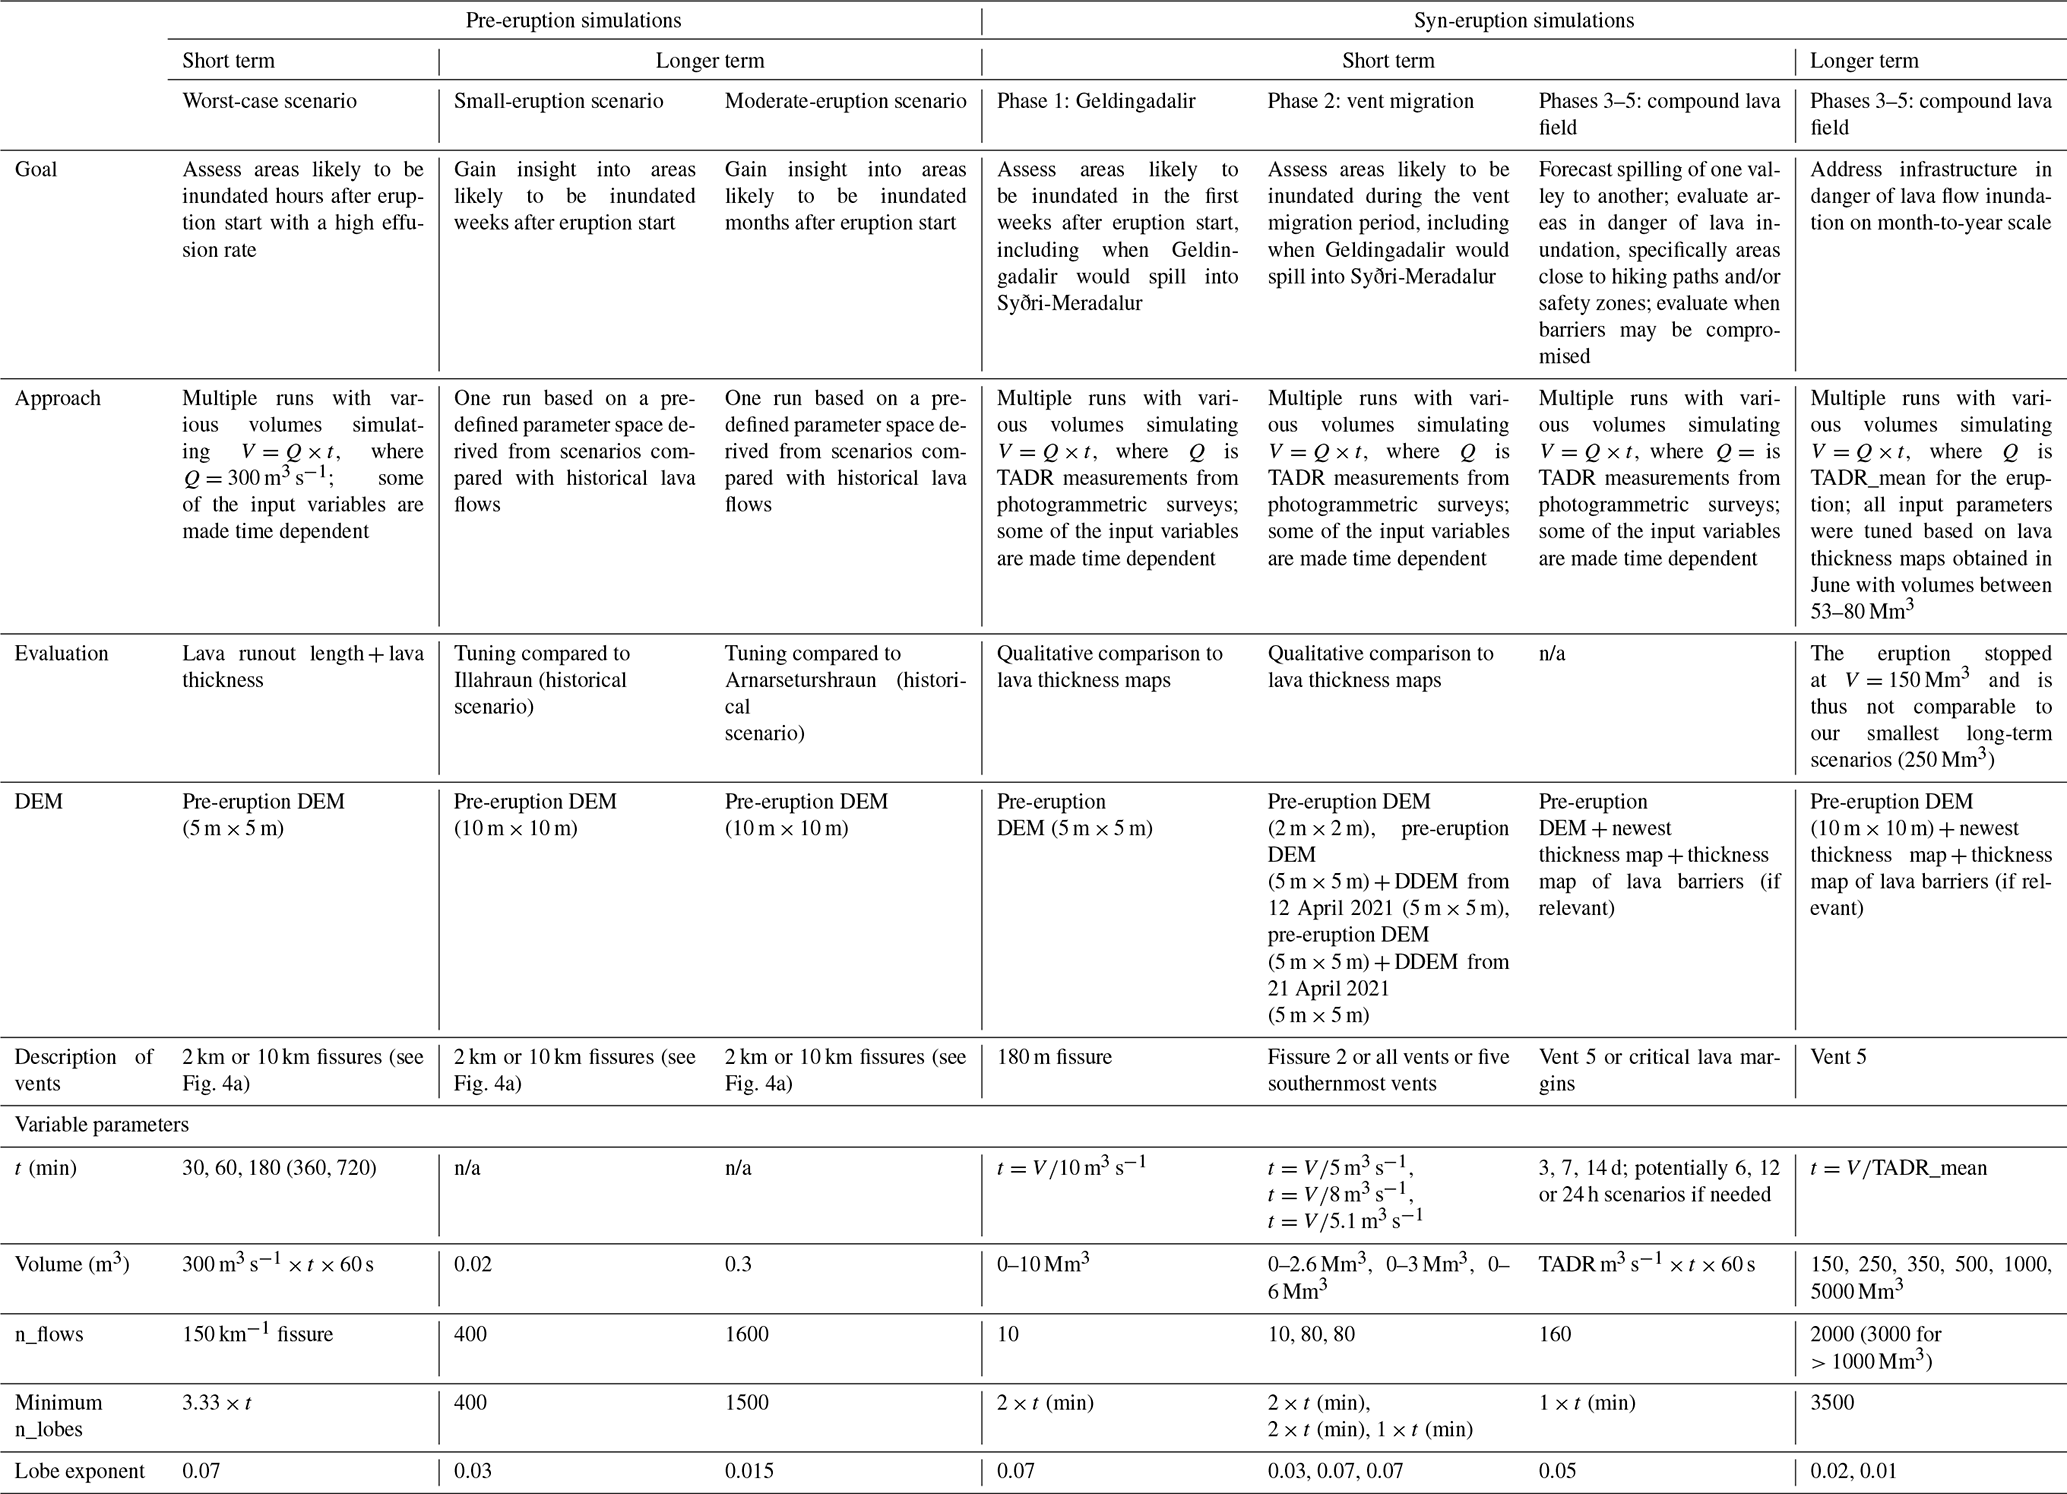
A flowchart showing the implementation of input data and input parameters for the simulations, simulation results and evaluation can be found in Fig. 3. The implementation of the MrLavaLoba model depended on the purpose of the simulation, and Table 1 provides a general overview of the simulation goals, approaches and most important input parameters, while the full set of input parameters can be found in Table A1.
Since MrLavaLoba is a stochastic model, a single simulation does not describe the temporal evolution of the lava emplacement. However, by performing a series of runs simulating different volumes, it is possible to constrain the lava flow field evolution by using the relationship , where V is volume, Q is volume flux and t is time. In the pre-eruption phase Q is a hypothetical effusion rate, while in the syn-eruption phase Q is derived from the TADR measurement performed at a given time (Pedersen et al., 2022a). We scaled the number of computational flows (n_flows) and lobes per computational flow (min_n_lobes and max_n_lobes) as a function of effusion rate and time. Thus, a higher effusion rate would provide more and longer flows from the vent (so larger n_flows and min_n_lobes). With time the number of lobes would also increase (larger min_n_lobes). In this way, insight into the temporal evolution of the lava field could be addressed. The exact tuning of n_flows and min_n_lobes can be found in Tables 1 and A1.
Different lava simulation strategies were implemented during the pre-eruption unrest and during the eruption depending on the purpose of the simulation (Table 1). Overall, the purposes were threefold: (a) pre-eruption simulations to investigate the risk to infrastructure, (b) syn-eruption simulations to investigate short-term (2 weeks) lava hazards and (c) syn-eruption simulations to investigate long-term (months to years) lava hazards.
4.1 Pre-eruption simulations
The pre-eruption lava flow simulations were initiated after seismic and crustal deformation, consistent when a 9 km long dike was detected (Sigmundsson et al., 2022). Because of triggered seismicity along neighboring faults, a combination of seismic observations, deformation observations and modeling (Sigmundsson et al., 2022) gave the best indication of potential fissure openings. Based on this information 12 different dike openings of 2–10 km length (see Sect. 3.1) were chosen for pre-eruption lava flow simulations (Fig. 4a). Two different strategies were implemented in this unrest phase: (a) short-term scenarios with a high effusion rate addressing areas likely to be inundated within a few hours after eruption start (relevant to emergency response planning) and (b) longer-term scenarios to provide insight into areas likely to be inundated within weeks to months (relevant for identification of infrastructure at risk) (Table 1, Fig. 2).
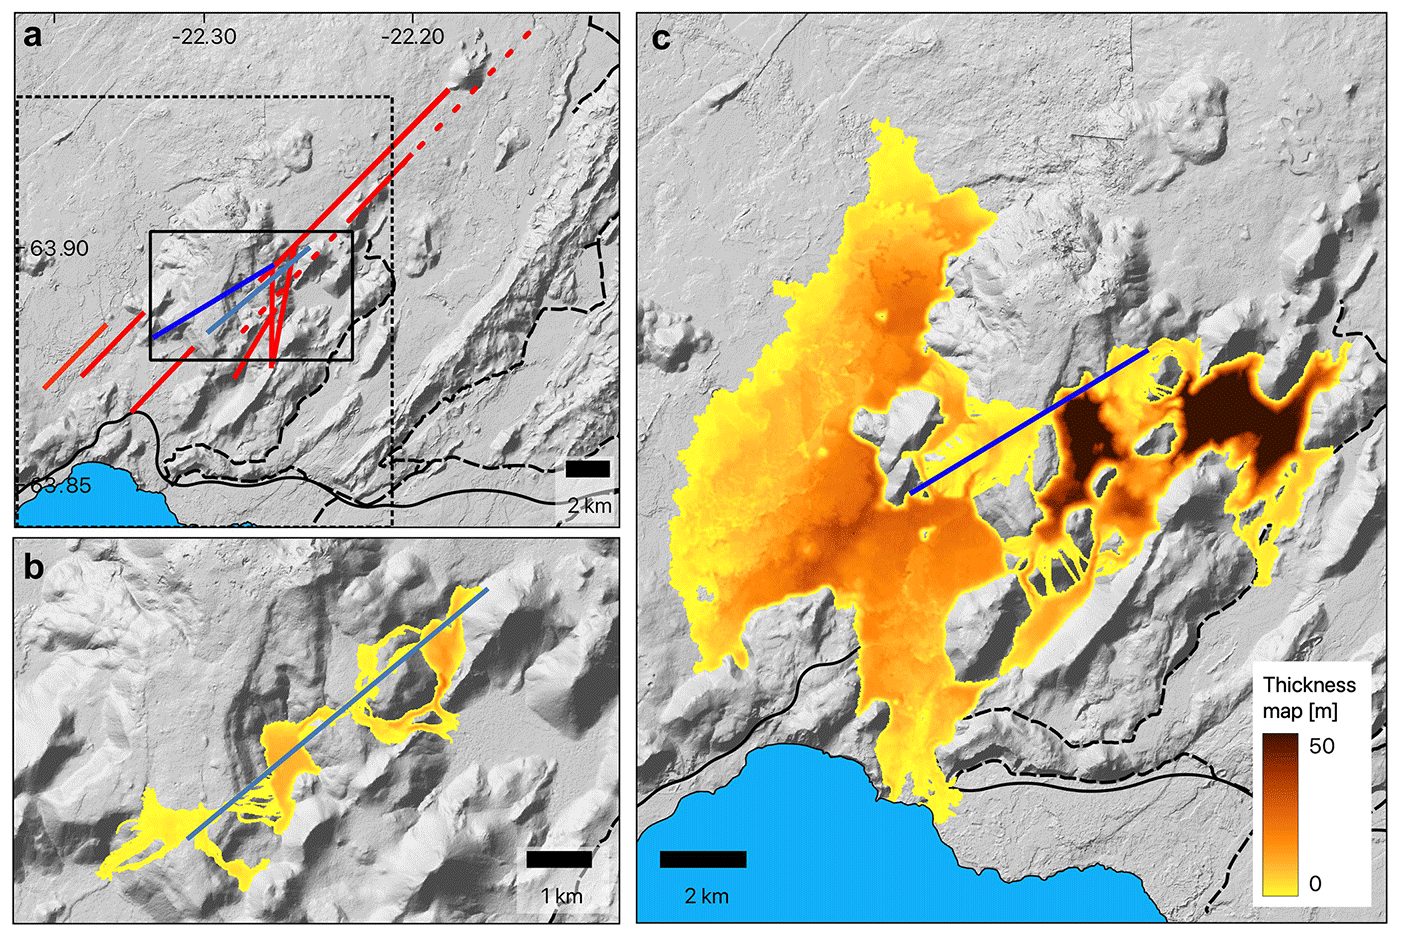
Figure 4(a) Overview of modeled pre-eruption potential fissures (red and light blue for fissure in panel b and dark blue for fissure in panel c). Solid black box indicates the extent of panel (b), and dashed black box indicates the extent of panel (c). The highway is marked with a solid black line, and dirt roads are dashed black lines (all roads are based on data from the National Land Survey of Iceland; IS50V). (b) Short-term scenario with a high effusion rate (300 m3 s−1) for t=180 min for a pre-eruption fissure (light blue). (c) Moderate-scenario (0.3 km3) run for a pre-eruption fissure (dark blue). Background topography is based on IslandsDEM (Porter et al., 2018).
4.1.1 Short-term scenario with a high effusion rate
The scenario with a high effusion rate was defined as fissures with an assumed effusion rate of 300 m3 s−1, which is considered a high effusion rate on the Reykjanes Peninsula. We assigned the number of flows as n_flows = 300, and min_n_lobes was multiplied by 3.33 per minute to mimic the lengthening of the flows (Tables 1, A1). This multiplication factor was estimated to be rather high based on the runout distance from the vent but was preferred rather than being too conservative. The results of the short-term scenarios with a high effusion rate for the 12 defined dike openings (see example in Fig. 4b) suggested that no inhabited areas were in immediate danger during the first hours, and infrastructure was only in danger the first hours if the dike continued propagating south, crosscutting a nearby highway (Fig. 4a). A caveat of this strategy was that the only way to validate the chosen parameter space was based on runout distance and thickness of the final deposit.
4.1.2 Long(er)-term scenario
During the pre-eruption phase the small- and medium-eruption scenarios were simulated to evaluate potential endangered infrastructures. The tuning of these scenarios had been done before the volcanic unrest in Fagradalsfjall and is described in Sect. 3.1, with input parameters found in Tables 1 and A1. An example of the moderate scenario is shown in Fig. 4c, showing that the only infrastructure in danger was the nearby highway.
4.2 Syn-eruption simulations: short-term hazard assessments
During the eruption the complexity and demands of the short-term runs increased. Here we describe results from three different approaches applied during the crisis to address the evolution of eruptive activity and the challenges they posed (Fig. 2 and Table 1).
4.2.1 Phase 1 of the eruption: Geldingadalir (19 March–5 April)
The first syn-eruption runs of MrLavaLoba started on 19 March around 22:00 UTC (1.5 h after the eruption started) using preliminary vent coordinates obtained on a helicopter flight. The precise location and length of the fissure were first acquired the following morning when the first aerial images during daylight had been georeferenced. The main purpose of these first runs was to evaluate how the lava would fill Geldingadalir valley and when it would spill into Syðri-Meradalur, east of Geldingadalir, inundating the hiking path and exposing visitors to lava hazards (Figs. 1, 5; Table 1).
During this phase we used a 180 m fissure erupting with the same rate along its extension, though in reality, the fissure quickly concentrated into two active vents. This was done because mimicking the evolution of the fissure would have required either a major change in the MrLavaLoba code or a time-consuming, stepwise simulation strategy inconvenient during “emergency-mode” response (Fig. 2, column 2 and 3).
The lava simulations were qualitatively evaluated by comparing the thickness maps obtained from photogrammetric surveys with the modeled lava thickness maps. For the first hours of the eruption (< 12 h) the only documentation was from a few oblique photographs. The smallest run (V=0.018 Mm3) shows northern and southern lobes agreeing with the photographs documenting the extent of the lava at midnight on 19 March, ca. 3–4 h after eruption start (Fig. 5). As the volume increased to 0.2–3 Mm3, the lava simulations overestimated the southern extent of the lava field, while underestimating the lava thickness of the northern lobe, which is explained by the closing of the southern part of the fissure. As the volume increased further to 3–7 Mm3 the modeled results agreed well with the observations, suggesting that the lava was so confined by Geldingadalir valley that the change in vent geometry had little effect on the lava inundation area.
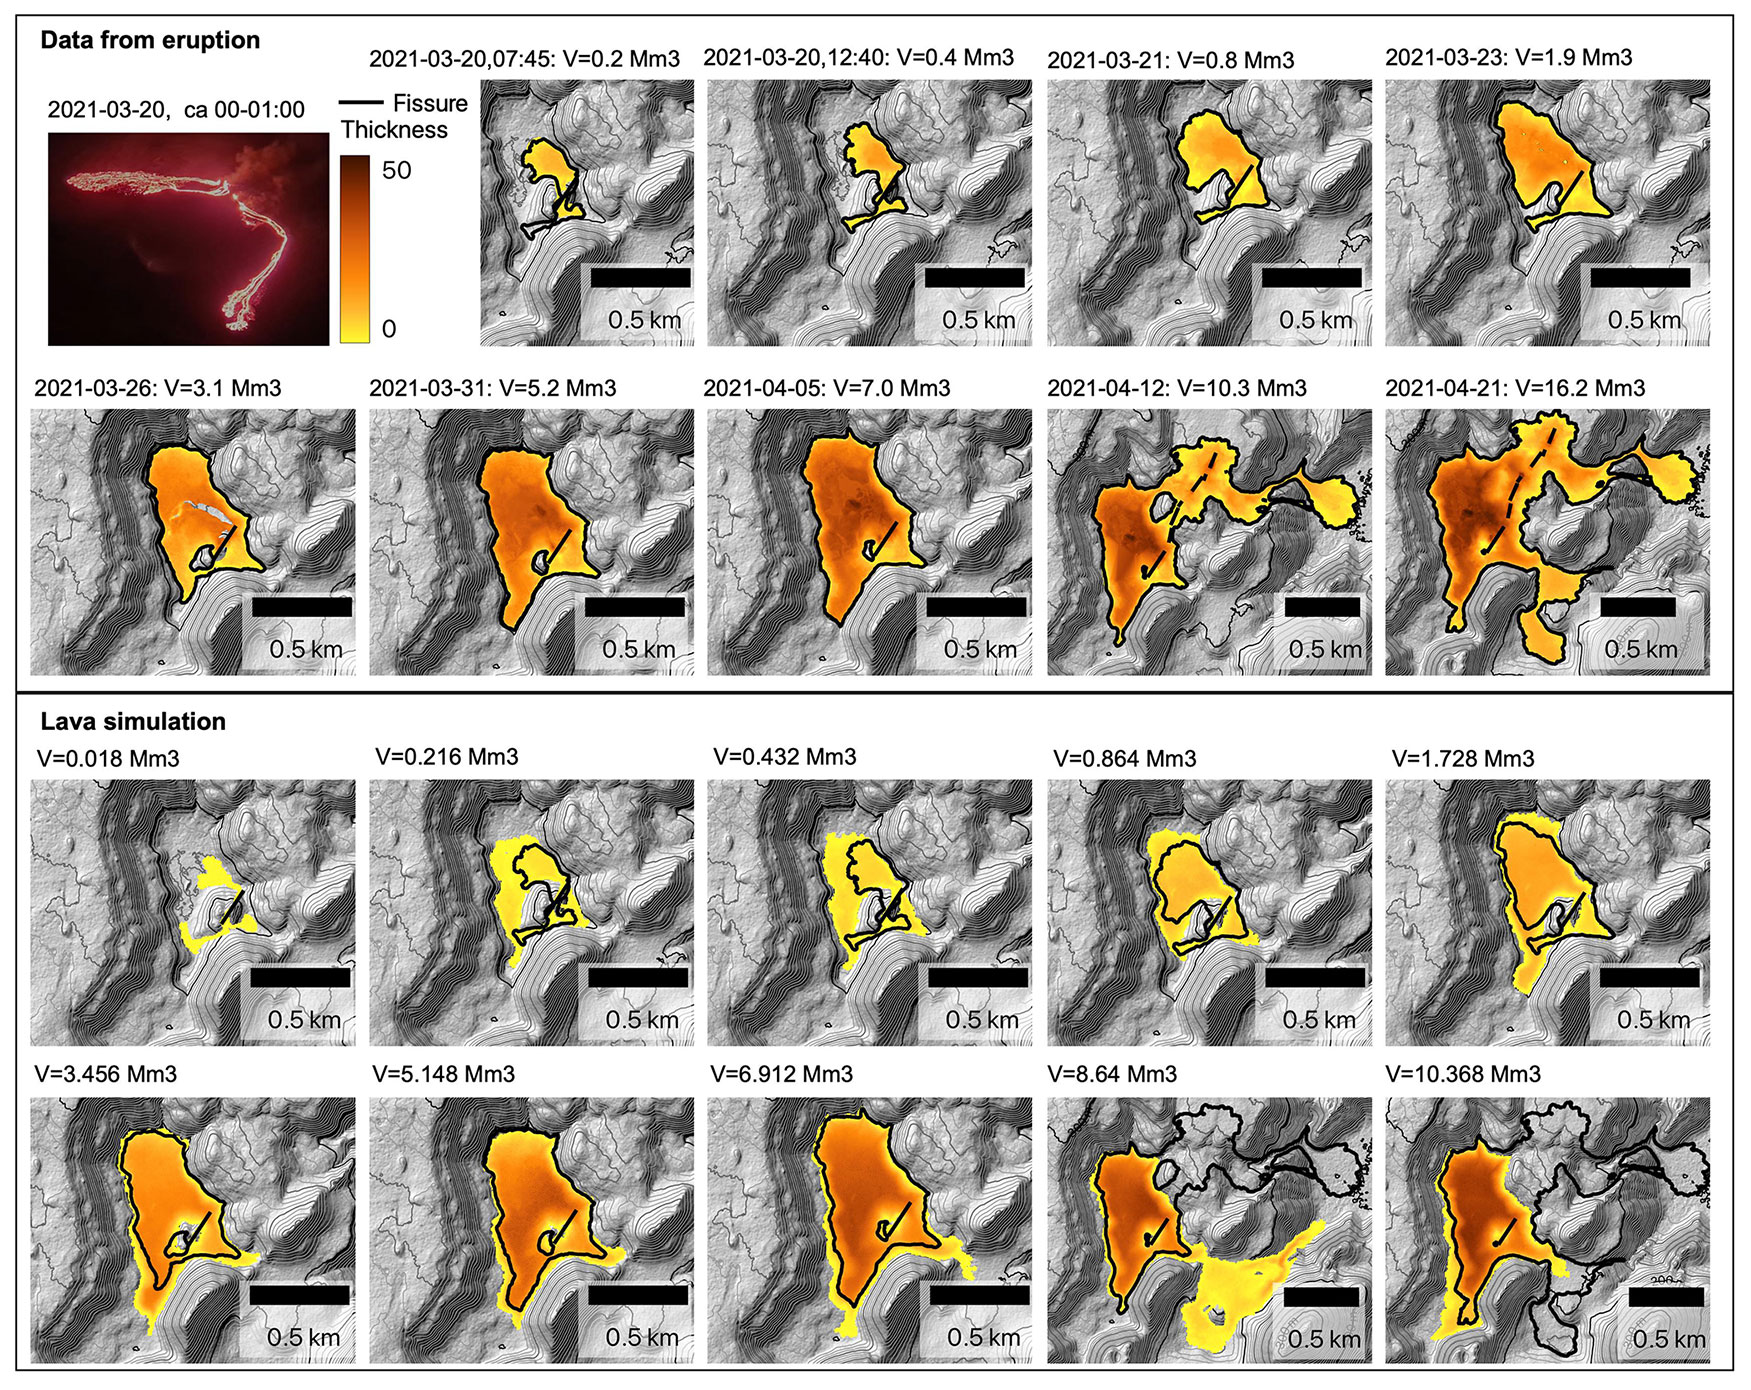
Figure 5Comparison between thickness maps obtained from the lava field (upper box) in the first 24 d of the eruption (Pedersen et al., 2022b) and lava simulation thickness maps (lower box). The volume of each thickness map is noted above each map. Thickness scale is the same for DDEMs and lava simulation thickness maps. The initial length of the first fissure is marked as a black line. The last two panels showing thickness maps from the eruption extend into phase 2 and therefore also include the fissures that opened in phase 2. Background topography is based on IslandsDEM (Porter et al., 2018). Photo in the top left is by Freysteinn Sigmundsson. Please note that the date format used in this and the following figures is year-month-day.
The simulations predicted a potential exit from Geldingadalir valley into Syðri-Meradalur valley when the volume reached 7–10 Mm3, with slightly different volumes from run to run due to the stochastic nature of the MrLavaLoba code. To provide potential timings of when Geldingadalir would spill into Syðri-Meradalur valley, we used two different effusion rates of 8 and 5 m3 s−1 based on the observed maximum and mean TADR (TADR_mean) estimates in this phase (Pedersen et al., 2022a). This gave exit times from Geldingadalir of 10–14 d (29 March–2 April) and 16–24 d (4–12 April), respectively. The lava eventually spilled out from Geldingadalir valley on 14 April, but by 5 April new vents had opened north of Geldingadalir, with lava draining into Meradalir. By calculating the lava volume within Geldingadalir by 18 April (first photogrammetric survey after lava exited Geldingadalir), we get a volume of 10.8 Mm3. This volume of 10.8 Mm3 is on the upper end of the predicted volume of 7–10 Mm3, but taking into account that 10.8 Mm3 is the volume in Geldingadalir 4 d after the lava spilled into Syðri-Meradalur, we find this in good agreement with the lava simulations.
4.2.2 Phase 2: vent migration (5–27 April)
In the second phase the active vents migrated as multiple new fissures opened between 5–13 April and became inactive over the next 10 d, except for one vent (see Sect. 2.1, Fig. 1). This change in eruption activity provided new challenges to the lava flow modeling (Fig. 2). The first challenge was that the topography drastically changed with the new vent openings. While lava was strongly constrained within Geldingadalir valley in the first phase, after 5 April lava was issued from the plateau to the northeast of Geldingadalir and channelized into narrow gullies before spreading out like a fan within Meradalir valley. Fissure 2, which opened 5 April, had sufficient spacing from Geldingadalir so that it could be simulated in a separate run from Geldingadalir (Fig. 6, V < 0.4 Mm3). However, to capture the channelizing into the narrow valleys, it was necessary to increase the resolution of the computational domain DEM (from 5 to 2 m cell size) and change the lobe exponent parameter (from 0.07 to 0.03), increasing the probability of new lobes being generated by younger lobes (Fig. 2). After this adjustment the new flows were well captured in the simulation (Fig. 6, V < 0.4 Mm3).
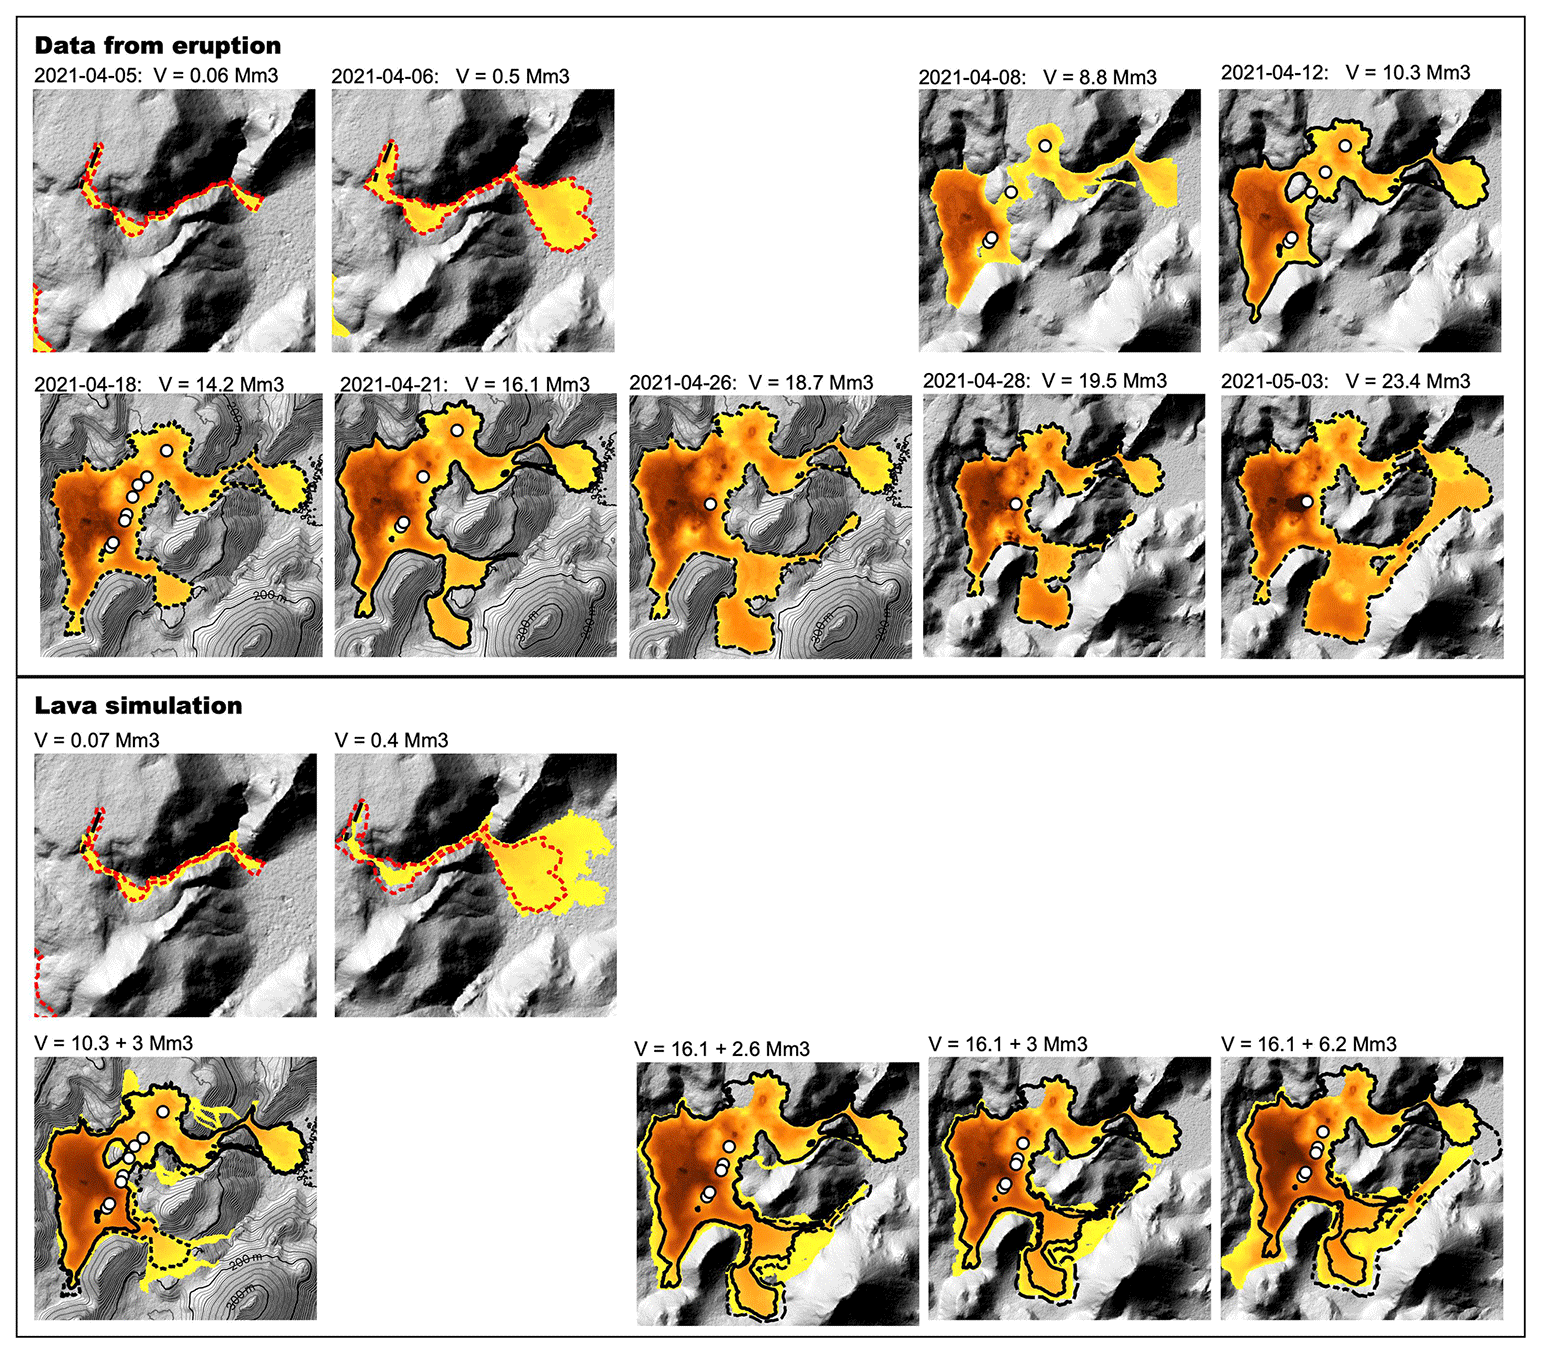
Figure 6Comparison between thickness maps obtained from the lava field (Pedersen et al., 2022b) from 5 April to 3 May (upper box) and lava simulation thickness maps performed during the vent migration phase (lower box). The lava simulations in the bottom panel show the cumulative thickness of the syn-eruption thickness map and the results from the simulation. The volume of each thickness map is noted above each map, which for the cumulative thickness maps is split into the volume contribution from the syn-eruption thickness map and the simulation (e.g., V=16.1 + 6.2 Mm3). The thickness scale is the same for DDEMs and lava simulation thickness maps going from 0 m (yellow) to 50 m (brown). The extent of the thickness maps used as input to the simulation has a solid black outline, while the extent of the lava thickness maps from the lava field with comparable volume is marked with hatched outlines. The active vents are in white, except for fissure 2 (top left), where the initial two fissure segments are shown as black lines. Background topography is based on IslandsDEM (Porter et al., 2018).
After fissure 3 opened on 7 April, it was clear that the lava flows from the different vents were influencing each other, and it was therefore necessary to simulate multiple vents that emitted variable percentages of the total lava volume. The MrLavaLoba code was therefore modified to allow for this configuration (see Sect. 3.2.1, Fig. 2 and Appendix B). Qualitative estimates of the variable percentages from each vent were based on webcams and direct observations in the field with no direct way of validating these estimates.
As the lava flow field emplacement progressed, it became evident that it was necessary to include the most recent lava thickness maps from the photogrammetric surveys (Pedersen et al., 2022a). By adding the thickness maps on top of the pre-eruption DEM, new simulations were performed on the most updated topography. Examples of two runs with two different vent configurations can be found in the lowermost panel of Fig. 6: one with all vents being active (left) and one performed after the two northernmost vents had shut down (right). These simulations showed how the lava would expand in Geldingadalir and the neighboring valleys, Syðri-Meradalur and Meradalir. However, the expansion in Geldingadalir and the plateau to the northeast were overestimated, and the expansion into Meradalir was underestimated. We ascribed this to a problem that we refer to as the “restart problem” (Fig. 2). By restarting the simulation on updated topography, the lava parcels would be initiated from the vents, resulting in increased lava deposition close to the vents (explaining the overestimation of Geldingadalir and the plateau to the northeast) and a delay in expansion of the lava field far away from the vents (such as Meradalir) compared to the real flow field.
4.2.3 Phases 3–5: fill and spill of a highly compound lava flow field (27 April–18 September)
After April 27 the vent activity stabilized at one location (Fig. 1, vent 5). The mean TADR increased from 6 to 11 m3 s−1 (Pedersen et al., 2022a). The lava flow field expanded into neighboring valleys such as Nátthagi and further into Meradalir in a fill-and-spill process. There was great interest in simulations that forecasted when and how the lava might overflow from one valley to another, e.g., from Geldingadalir into Nátthagi (crosscutting a popular hiking path) or when the lava would exit from Meradalir valley (inundating a dirt road) or when it would exit Nátthagi (threatening a highway and critical communication cables, as well as approaching the sea). However, due to the restart problem (see Sect. 4.2.2) and because the lava discharge into different valleys was highly variable (Pedersen et al., 2022a), it was decided to address these questions related to short-term hazards using worst-case scenario approaches. These scenarios were presented at bi-weekly stakeholder meetings, where the aim was to identify hazardous areas (upcoming inundation of hiking paths, roads or installed infrastructure) and suggest the potential closure of areas to public access (e.g., closing of Nátthagakriki in September 2021).
The short-term worst-case scenarios were defined as a scenario where all lava emitted from the vent would be transported to one of the critical lava margins, e.g., lava margins close to a hiking path or infrastructure that could be inundated by the lava. In these simulations, the most recent TADR estimate (Pedersen et al., 2022a) was used to calculate lava volumes that would be extruded over periods of 3, 7 and 14 d. These volumes were then released at critical lava margins close to valley exits to evaluate if each given volume was sufficient to overflow the valley in the given time frame. If a 3 d scenario would spill out of the valley, then 6, 12 and 24 h scenarios were additionally modeled. In these runs, the input parameter for the “number of flows” (n_flows) was doubled (from 80–160, Table 1) both because of the increase in the TADR and to reduce the uncertainty in the simulation outputs (Fig. 7 in de'Michieli Vitturi and Tarquini, 2018).
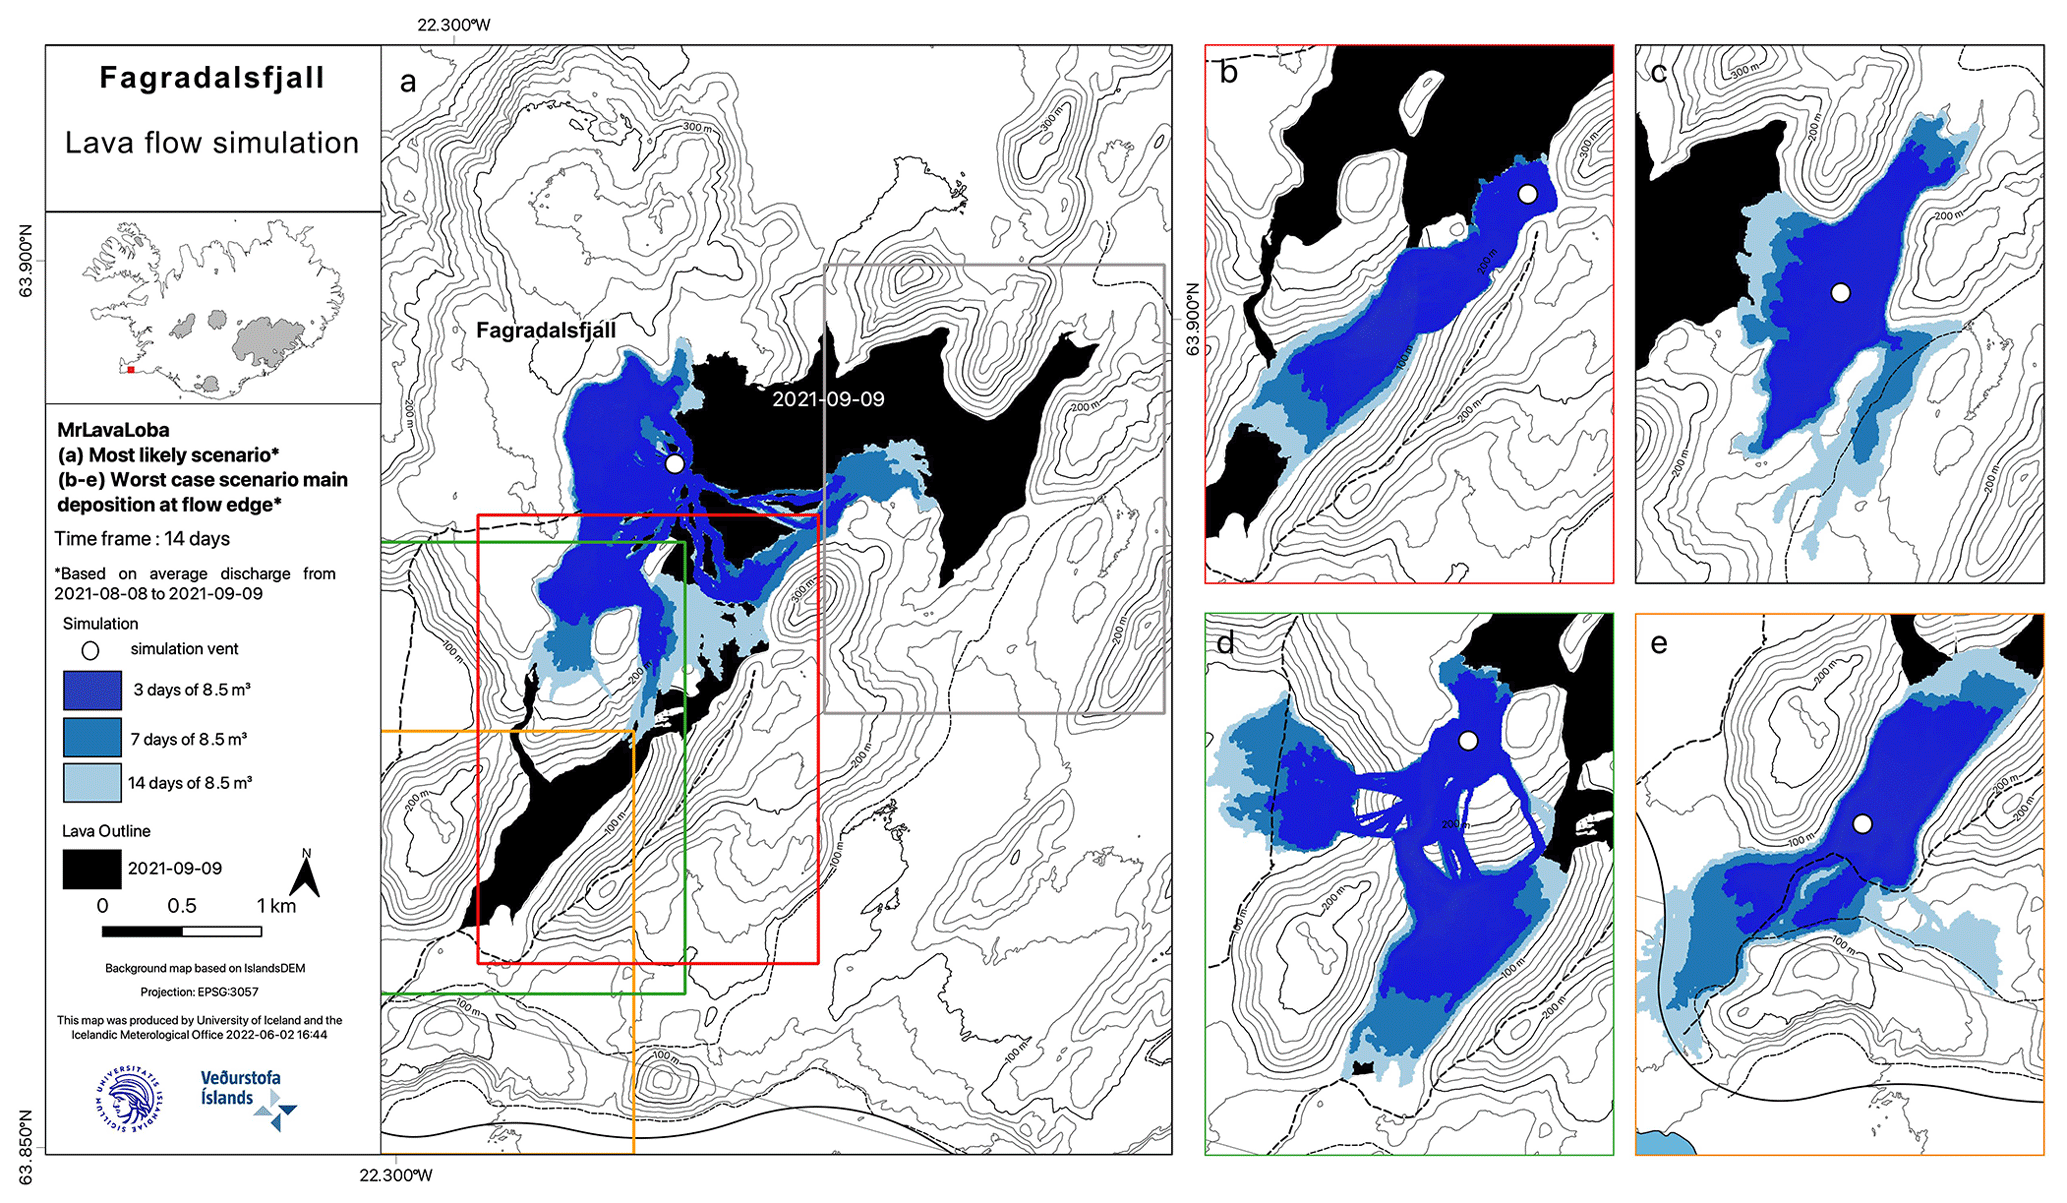
Figure 7An example of how the short-term worst-case scenarios were presented. Example from 9 September 2021. (a) Simulation from vent 5, which was considered the most likely scenario. (b) Worst-case scenario for Syðri-Meradalur to investigate if lava could exit the valley through the saddle point to the southeast. Based on these results the lava seemed more likely to exit south to Nátthagi. (c) Worst-case scenario for Meradalir to investigate if lava would spill to the east out of the valleys. Based on the results this was considered an option given most of the erupted volume would reach Meradalir. (d) Worst-case scenario for Geldingadalir to investigate if lava would spill to the southwest into Nátthagakriki over the built barriers. Based on the results this was considered an option. (e) Worst-case scenario for Nátthagi to investigate if lava would spill to the south out of the valley. Based on the results this was considered an option given most of the erupted volume would reach Nátthagi. Lava outline is from Pedersen et al. (2022b), roads are from the National Land Survey of Iceland (IS50V) and background topography is based on IslandsDEM (Porter et al., 2018).
An example of how these worst-case scenarios were presented at stakeholder meetings is provided in Fig. 7. To simplify the maps, only the lava inundation areas and not the simulated lava thickness maps were presented in accordance with the stakeholders' interest. The results for the volumes extruded over 3, 7 and 14 d were displayed on one map. The main map (Fig. 7a) shows simulations from vent 5 and was considered the most likely scenario, while the four smaller maps show the same volumes released at defined critical locations (Fig. 7b–e). As can be seen by the provided example from 9 September 2021, Meradalir, Geldingadalir and Nátthagi valleys had the potential to overflow if the lava was transported to the critical lava margins. A weakness of this approach was that the locations of critical lava margins were manually selected on the basis of the available knowledge and expert evaluation.
A similar approach was used to test lava barriers that were built or planned to be built during the eruption. An example can be found in Fig. 8, where the overflow of Geldingadalir was simulated with and without barriers based on photogrammetric data from a survey on 11 June 2021. All scenarios show that with a lava volume of 1 Mm3 Geldingadalir would overflow into Nátthagi. In the absence of barriers lava would also spill west into Nátthagakriki, but with the proposed barriers it seemed plausible to stall the westward migration for small volumes. Once again, these were worst-case scenarios because (a) they required that the given volume of lava was transported to the critical margin and (b) the simulations assumed that the transport systems near the barrier promoted the lava piling up near the barrier. However, if an efficient channel or tube developed, most of the lava would be transported into Nátthagi valley, resulting in little lava deposition at the barriers, meaning that the barrier would last longer.
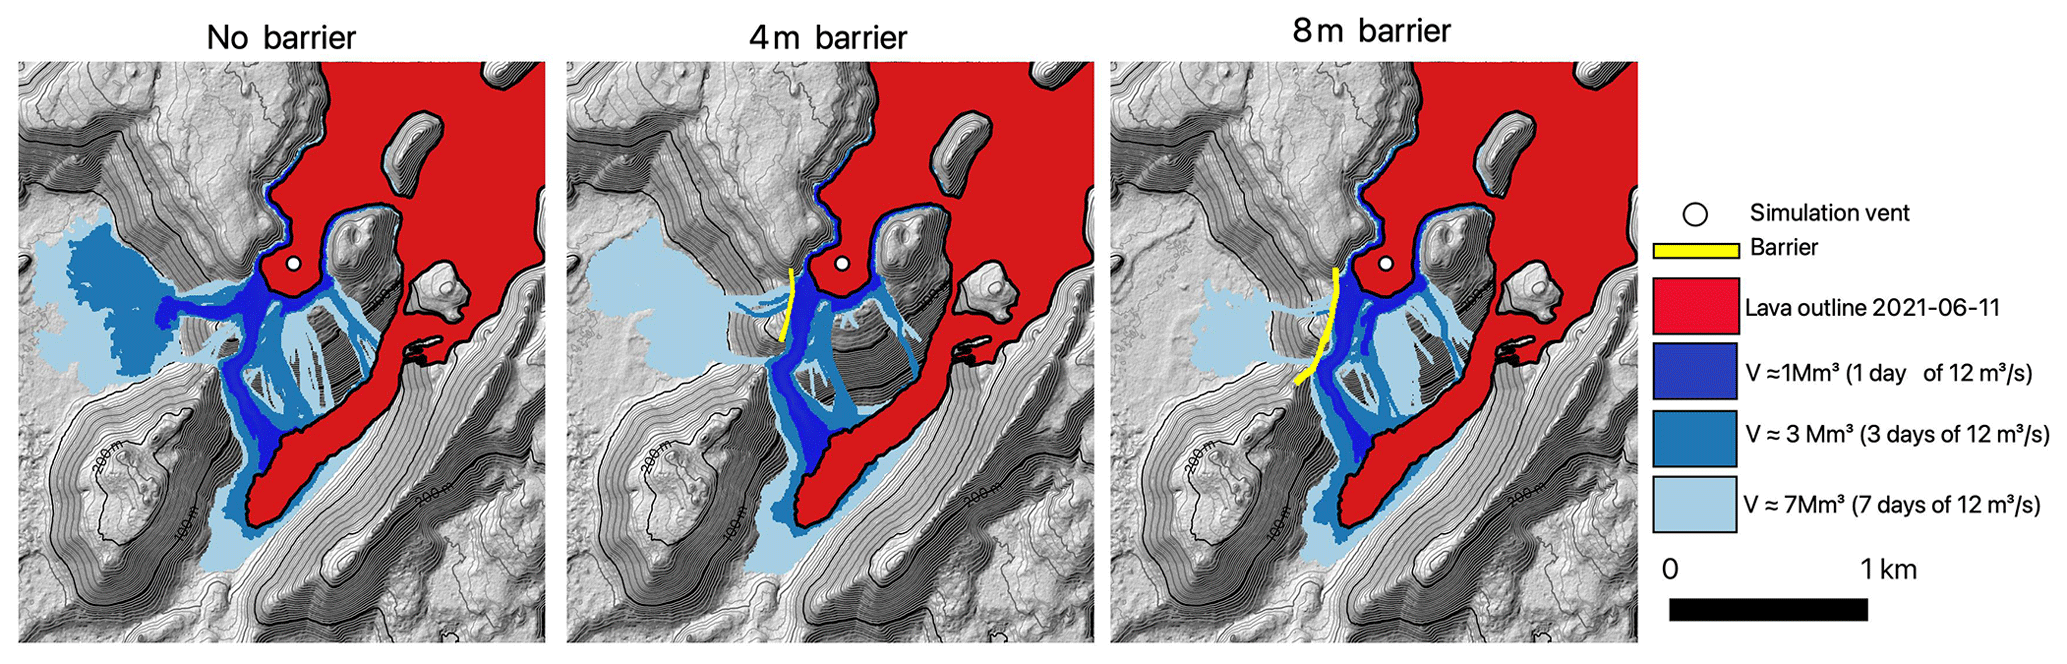
Figure 8An example of lava simulations predicting how Geldingadalir would overflow with and without lava barriers. The simulation vent is located in southern Geldingadalir based on observation of lava inflation in that area. Data are based on the survey from 11 June 2021 (Pedersen et al., 2022b), and the calculated volumes and timescales are based on the estimated TADR from the same survey. Background topography is based on IslandsDEM (Porter et al., 2018).
4.3 Long-term runs
Stakeholders (managers of critical infrastructure, municipalities, civil-protection authorities) requested long-term scenarios for longer-term planning, and we aimed to provide them in September 2021. The eruption stopped on 18 September, and these results were therefore only presented at stakeholder meetings. The long-term scenarios were simulated by considering erupted lava volumes ranging between 250–5000 Mm3. Assuming a constant mean TADR of 9.5 m3 s−1 (Pedersen et al., 2022a) across the entire eruption, the simulated long-term scenarios would cover time frames of half a year to decades.
In these large simulations only one vent (vent 5 in Fig. 1) was active throughout the simulation, which had been the case for most of the eruption. Furthermore, each scenario was obtained as a single run (with a single tuning) and not as an iterative process of tuning the model step by step. We tuned the long-term runs against the lava thickness maps obtained in June 2021 with volumes between 53–80 Mm3 and preferred to overestimate rather than underestimate the lava inundation area. Figure 9 shows that the full extent of the long-term model for 80 Mm3 (center top) fits the real lava deposit very well in both extent and thickness (center bottom), except around the plateau to the northeast, which is explained by the model only having vent 5 as the active vent. The thickening close to the vent was underestimated, and the thickening in Meradalir was overestimated.
The long-term hazard assessment was specifically intended for stakeholders with no experience with lava flow simulations, and like the short-term worst-case scenario maps produced in phases 3–5 (see Sect. 4.2.3, Table 1) we choose only to display the lava inundation area, since this was the main interest of stakeholders. The new challenge was how to communicate the uncertainty in our results to non-experts (Pallister et al., 2019). We decided to create maps where lava inundation would be divided into three qualitative categories: “more likely”, “likely” and “less likely” (Fig. 9, bottom left). We defined the more likely category to be the 95 % masked grid (see Sect. 3.2.1), which filters out the places least likely to be inundated (Fig. 9, top left). The full extent of the lava simulation was decided to be categorized as likely (Fig. 9, top center). For the less likely category we wanted to communicate the uncertainty related to the model tuning. We tuned the model when the lava flow field was highly constrained by the surrounding topography. However, in a large eruption the lava would escape the confining valleys and be able to spread more freely over flat-lying areas. To display this uncertainty, it was decided to change the tuning of the lobe exponent (from 0.02 to 0.01), which is a crucial parameter for the lava flow spreading. A lower lobe exponent promotes lower flow thickness and a longer runout length as revealed in our tuning data set overestimating the inundation area (Fig. 9, top right). We therefore defined this as the less likely category.
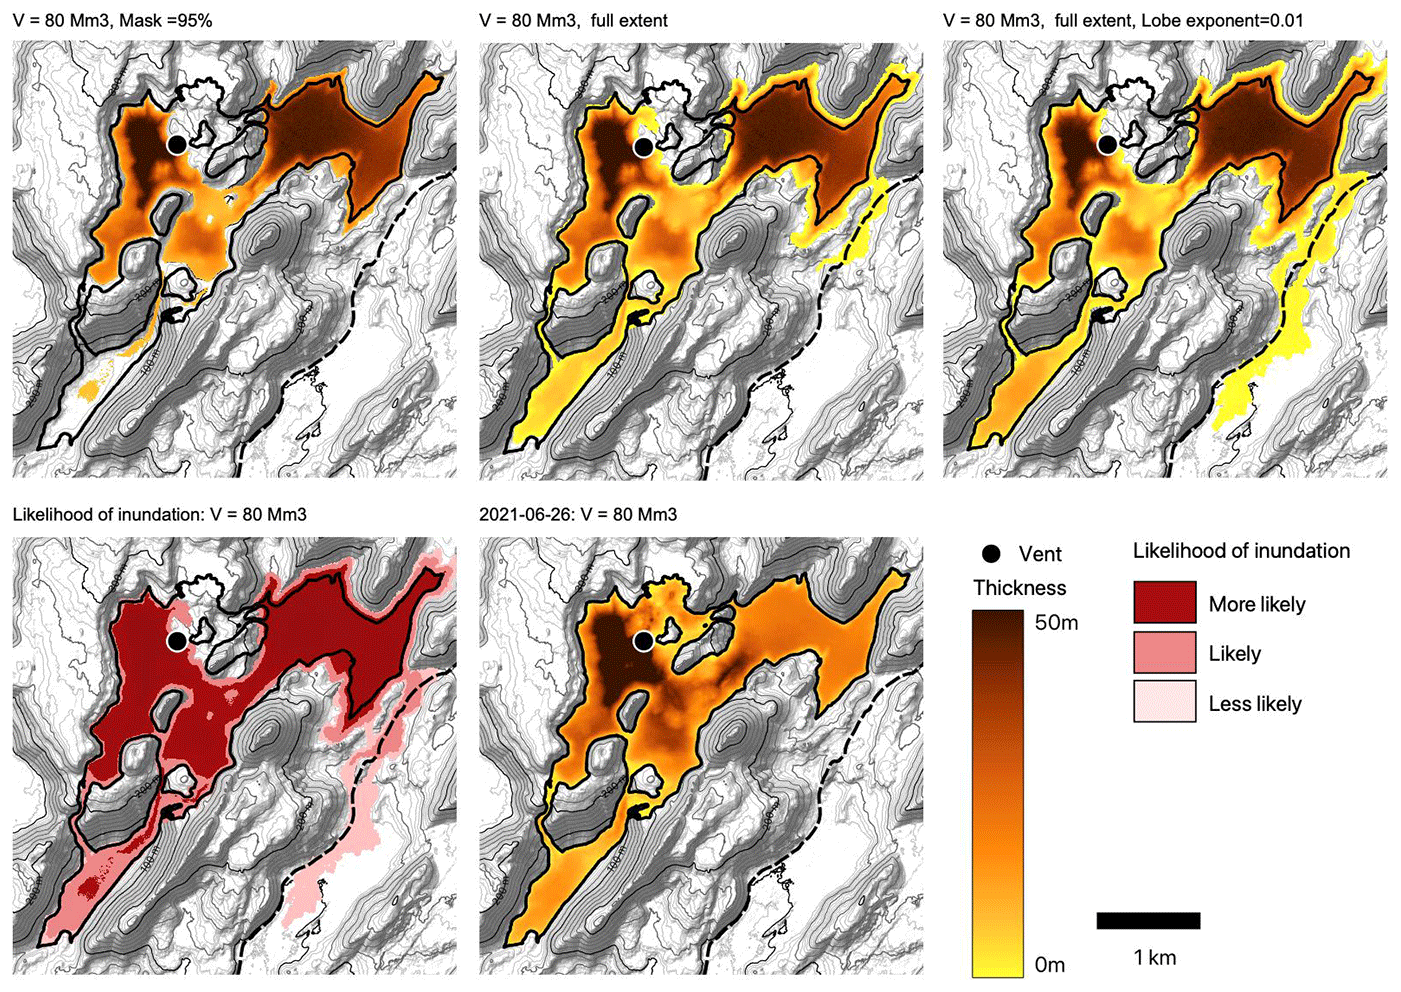
Figure 9The top row shows an example of the best tuning result for the 80 Mm3 simulation showing the 95 % lava thickness mask representing the category more likely and the full extent representing the likely category. To the right is an 80 Mm3 simulation result with a lower lobe exponent representing the less likely category. The bottom row is a map showing the likelihood of inundation based on the 80 Mm3 simulations shown in the top row (left) and lava thickness map from 26 June 2021 (Pedersen et al., 2022b), which can be compared to the simulation results in the top row (right). Roads are from the National Land Survey of Iceland (IS50V), and background topography is based on IslandsDEM (Porter et al., 2018).
One example of the long-term hazard maps can be found in Fig. 10. The most important message for the authorities from these long-term simulations was that none of the runs reached Grindavík town or the Svartsengi power plant, which were the two main areas of concern. We underlined that these long-term runs were quite uncertain because as the scenario grows in volume, so does the uncertainty. Some factors contributing to uncertainty were (a) tuning being undertaken while the lava was highly controlled by topography, (b) changes in eruptive activity from continuous (May–June, when tuning was performed) to episodic activity (July–September) and (c) MrLavaLoba not including vent processes such as cone buildup. The latter was important because the real vent built up faster than predicted in the simulation, meaning that the lava flows could inundate Fagradalsfjall faster than predicted in these models.
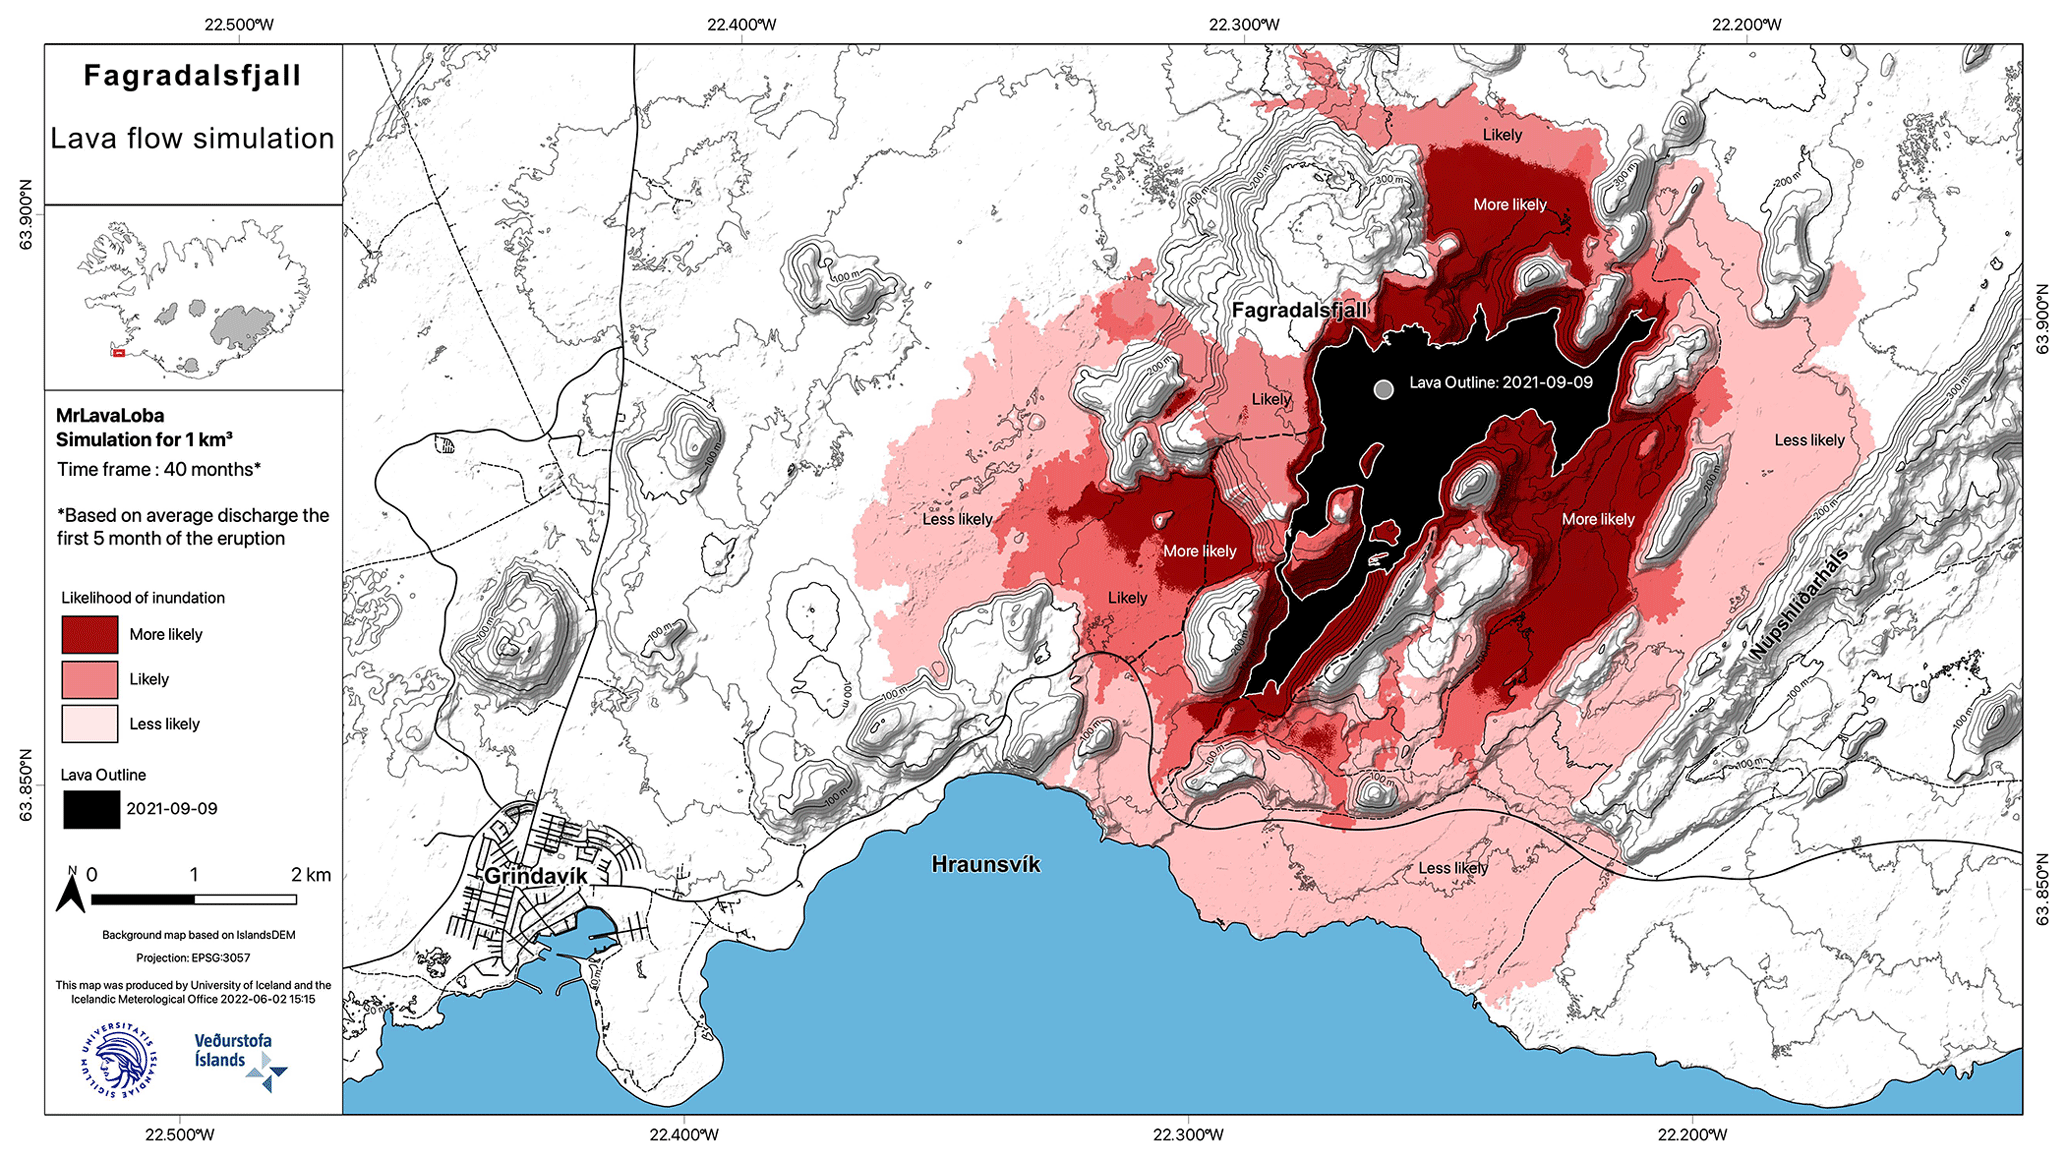
Figure 10Long-term scenario for lava emplacement of 1000 Mm3 volume issued from vent 5. Lava outline is from Pedersen et al. (2022b), roads are from the National Land Survey of Iceland (IS50V) and background topography is based on IslandsDEM (Porter et al., 2018).
5.1 MrLavaLoba code: advantages and disadvantages
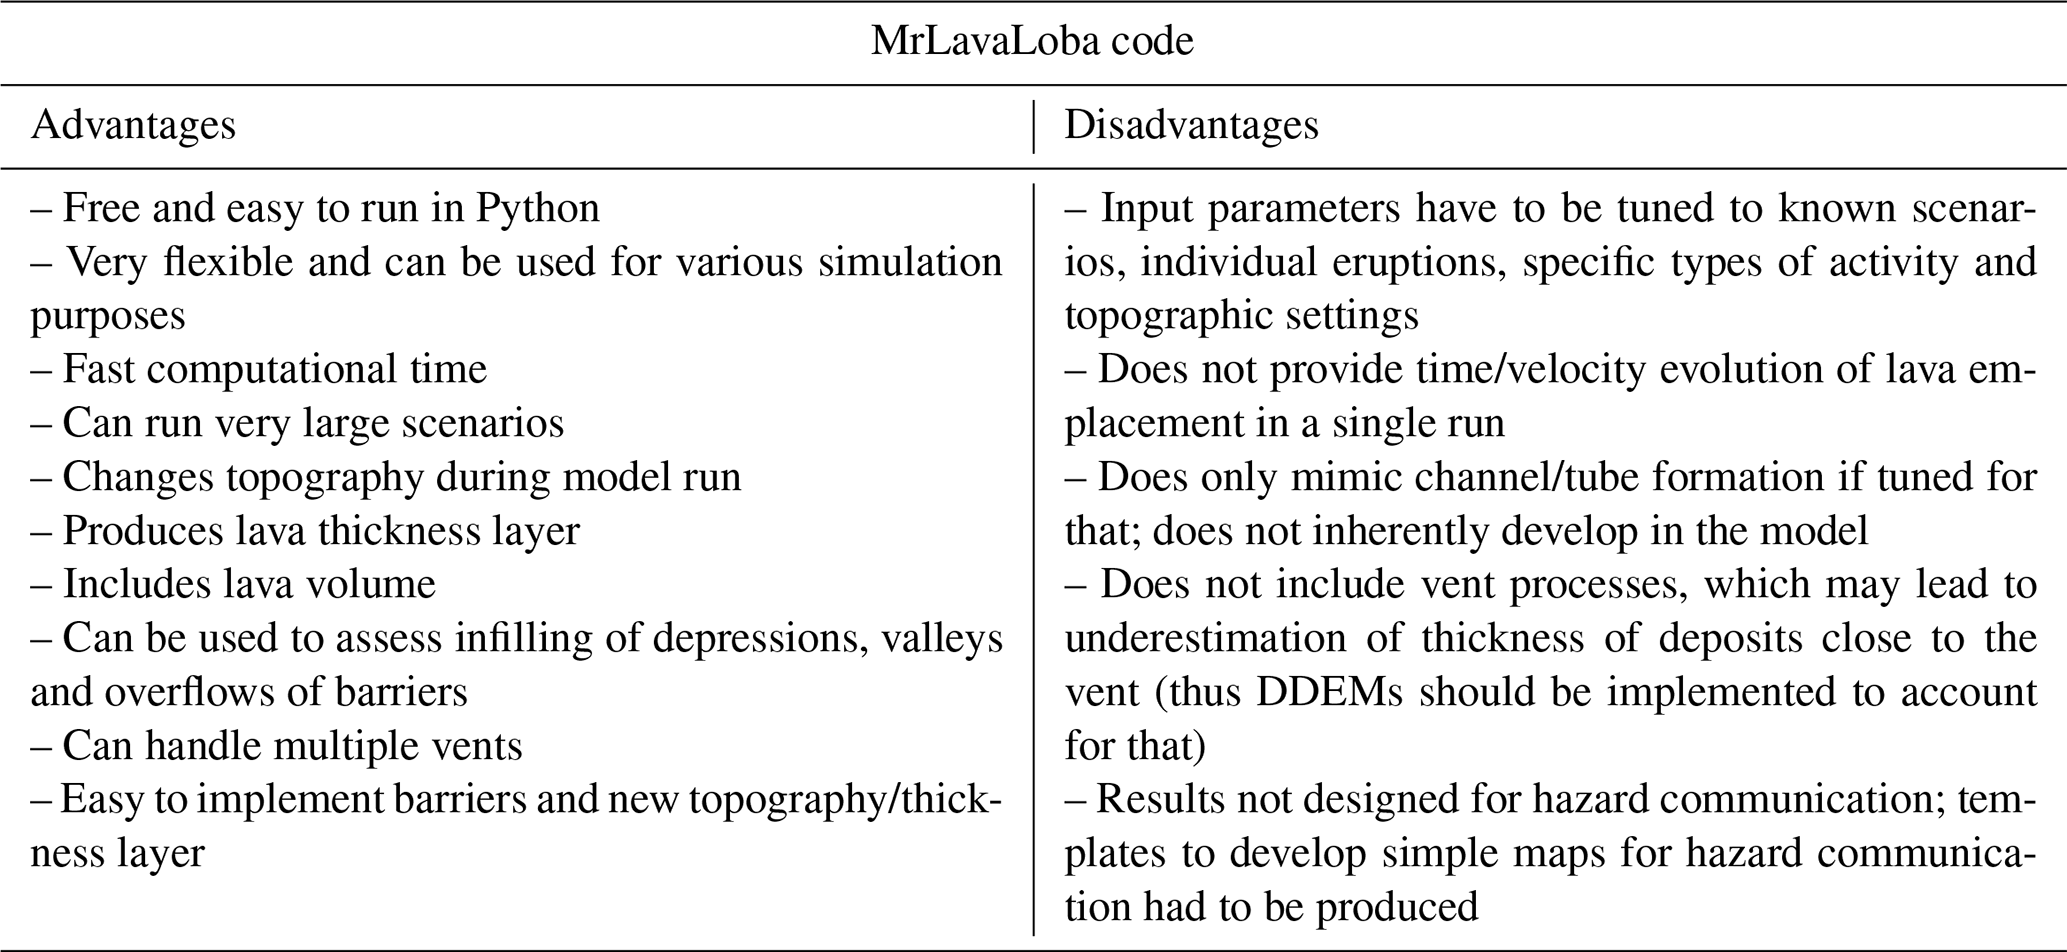
The MrLavaLoba model is freely available, easy to run, coded in Python and computationally fast and can therefore be used to tackle high-volume scenarios (Table 2). Unlike other stochastic models it accounts for lava volume, it produces lava thickness layers and it models ongoing topographic changes during the simulation. These characteristics were very important during the Fagradalsfjall 2021 eruption because assessing the timing of hazards related to the fill and spill of nested valley systems could only be addressed by codes that accounted for lava volume. It was easy to implement topographic changes into the model, including the syn-eruption differential DEMs of the lava flow thickness and lava barriers, which was key for testing both hypothetical barriers and built lava barriers (Table 2).
However, we also highlight weaknesses: the MrLavaLoba model provides neither the temporal evolution of the lava field during each run nor direct velocity estimates of the lava emplacement (Table 2). Input parameters must be tuned for specific eruptive scenarios and locations. It is possible to mimic different lava emplacement processes (e.g., lava channels or tubes), but this must be tuned as well. Furthermore, the model does not include vent processes, which leads to an underestimation of the lava thickness close to the vent for the long-term scenarios. However, to our knowledge, no existing lava simulation code includes vent processes, so this issue would also have affected any other lava flow simulation model.
Table 2Overview of advantages and disadvantages of the MrLavaLoba code.
5.2 Towards improved modeling
To improve our communication of uncertainty in the lava simulations, MrLavaLoba was upgraded in September 2021 to enable multiple masked lava thickness grids (Sect. 3.2.1, Appendix B). In the future we can therefore provide maps with uncertainty comprised of the full extent (100 % mask) of the lava flow simulation; the 95 % mask; and, e.g., the 68 % mask, indicating the likelihood of inundation. In addition, we would like to evaluate the uncertainty in the input parameters themselves, which can be addressed by using statistical tools such as Dakota (Adams et al., 2021), which is specifically designed to perform sensitivity analysis and uncertainty quantification with existing numerical codes (Fig. 3, bottom).
In the Fagradalsfjall 2021 eruption the lava flow simulations were evaluated
qualitatively (Table 1, Fig. 3), but a quantitative approach would have been
preferred. For future eruptions we would like to automate a quantitative
comparison between two rasters (e.g., simulation and observation) with
respect to the accuracy of the estimated (a) lava inundation area and (b) lava thickness. This can be done by using the Python script
union_diff.py available in the model repository (http://demichie.github.io/MrLavaLoba/, last access: 4 September 2023), which permits such comparisons
(Fig. 3, bottom).
Vent changes (temporal changes in vent configuration and geometry, vent buildup, and collapse) remained a challenge for the lava simulations during the eruption. This problem was partly solved in April 2021 when the MrLavaLoba code was upgraded to simulate multiple vents (see Sect. 3.2.1, Appendix B), and thus the modeler initialized a new lava simulation when the number of active vents changed. Doing stepwise simulations was possible since we could do simulations on updated topography. This strategy was intended as a route to improve lava flow simulations and reproduce the lava flow fields more consistently (Harris et al., 2016; Tarquini et al., 2019). However, as we discovered, updating the topographic domain created a new problem, namely the restart problem (see Sect. 4.2.2): the re-initialized simulation experienced a delay in the lava field expansion. This problem is not unique to MrLavaLoba but relevant to all lava flow simulation code that intends to do stepwise simulations. Some potential ways forward to solve this could include introducing “spinup” time that will re-establish activity to the flow field edges or implementing additional sources at active lava margins as we did for the worst-case scenario runs (see Sect. 4.2.3).
Finally, a remaining challenge is related to changing the spatial resolution of the computational domain in the simulations. Some input parameters need to be re-tuned if the input DEM resolution is changed. Tuning takes time, which is inconvenient during an ongoing eruption. As a rule of thumb, the lobe area is 10 × (DEM cell size)2. If the lobe area changes by a factor G, the number of lobes should change by a factor of for scenarios with a lobe exponent of 0. For other scenarios experimentation with the code and different DEM resolutions could provide us with an automatically applied scaling of these sensitive parameters in the case of DEM resolution changes.
5.3 Improved dissemination strategies
During this prolonged volcanic crisis, delivering information on the lava flow hazard assessment was a complicated task and identifying good strategies to do it was a learning process. Two main elements were eventually considered when designing map layouts and content: (a) the type of stakeholders receiving the information and the role they had during the crisis (e.g., experts, civil defense/responders, decision-makers or the public) and (b) the information they needed to receive to fulfill their operations and tasks.
During the eruption regular and frequent meetings were held between monitoring personnel on duty, scientists, civil-protection representatives, local police and rangers who were patrolling the area. For the first few months they were held daily, and eventually they held were bi-weekly. Lava flow invasion maps were shown and discussed at these briefings (Barsotti et al., 2023), as well as during dedicated meetings, and were occasionally reiterated based on feedback provided by the users.
Thanks to this interaction with the stakeholders, it became clear that the main products for them were the short-term scenarios, short-term worst-case scenarios (Fig. 7) and the long-term scenarios (Fig. 10). The maps were prepared by following three main criteria: simple maps (a) showing potential lava inundation areas and not lava thicknesses; (b) showing the uncertainty related to the model results; and (c) including all key information (e.g., name of lava simulation model, key input parameters, time frame and main assumptions) to ensure that final product would be self-explaining, even if a figure caption inadvertently was separated from the map. Thus, we were providing multiple map products and customizing them to user needs, which is in accordance with volcano observatory best-practice workshops (Pallister et al., 2019; Lowenstern et al., 2022). Distributing maps for the public was complicated and required several iterations and double-checking from experts to avoid results triggering many questions and alarming the community (see, e.g., maps made publicly available on the Icelandic Meteorological Office's website at https://www.vedur.is/um-vi/frettir/vel-fylgst-med-skjalftahrinunni-vid-keili, last access: 4 September 2023 and https://www.vedur.is/um-vi/frettir/hraunflaedilikon-hafa-sannad-sig-i-eldgosinu-vid-fagradalsfjall, last access: 4 September 2023).
As described above (Sect. 5.1 and 5.2) including the uncertainty in the lava simulation results required changes to the model and to the modeling approach, which, to begin with, required extra time. However, it also became clear that when we had efficient ways of including uncertainty in the simulation results, the modeler could (a) avoid time-consuming fine tuning of input parameters, (b) save time in the map production and (c) be much more efficient in communicating the results in a consistent way.
For the next volcanic crisis, the goal is to have pre-formatted map templates for short-term scenarios, short-term worst-case scenarios and long-term scenarios similar to Figs. 7, 8 and 10. These should be developed collaboratively with hazard and cartography experts to help the lava flow modelers to find a suitable balance between essential information and readability. Secondly, an explanation of the approach of lava hazard modeling should be prepared in multiple languages to accompany the maps when communicated to the public. Finally, it would be helpful to discriminate between the design of map products delivered to (a) the scientific community, (b) stakeholders and (c) the public and potentially set up some a priori agreements about what type of results should be disseminated to each group and consider the appropriate platform for such information (websites, web map services, social media).
After 23 d of volcanic unrest, the eruption at Fagradalsfjall started on 19 March 2021 and lasted 6 months. The lava flow hazards varied during this event due to the changes in eruptive activity and due to the complex topographic setting where lava was infilling a nested valley system. This study addresses how these varied lava flow hazards were evaluated by implementing different lava flow simulation strategies using the stochastic model MrLavaLoba. Pre-eruption simulations were performed to investigate exposure of critical infrastructure to lava flow inundation, while syn-eruption simulations addressed short-term (weeks) lava hazards and worst-case scenarios. Finally, simulations were performed to address long-term (months to years) lava hazards.
MrLavaLoba provides the final lava extent and lava thickness layers, and it continually modifies the topography during the simulation. This was very important during the Fagradalsfjall 2021 crisis because the timing of the filling and spilling from one valley to another could not have been addressed by code not including lava volume. It is very easy to implement topographic changes, e.g., by implementing lava flow thickness maps obtained during the eruption or lava barriers, a key functionality of the code that made it suitable for testing suggested and built lava barriers. As the eruption got more complex, weaknesses of the lava flow simulation came into light. Some input parameters required time-consuming tuning when the spatial resolution of the runs was changed, a restart problem related to stepwise simulations with updated topography caused delayed activation of lava flow margins and challenges related to time-evolving changes in eruption style.
During the crisis the MrLavaLoba model was improved to increase functionalities including multiple eruption vents simultaneously and produce multiple lava thickness masks. The former was important during the vent migration phase, while the latter was necessary to communicate uncertainty in model results.
Future scientific improvements could include strategies to automate quantitative evaluations of model results, quantitative uncertainty analysis of input parameters and prepared map templates to efficiently disseminate results.
The lava flow model results were shared regularly with the scientific community, the agencies responsible for the operations in situ and the public (through news articles on institutions' websites). The numerical code and the established modeling procedures are considered to have been very successful in responding to an eruption that attracted tourists and visitors from all over the world.
Table A1Overview of all input parameters used depending on modeling approach. M: 1 000 000, t: time.
n/a: not applicable.
In this Appendix we describe the modifications implemented in the MrLavaLoba code to improve its usage during and after the 2021 Fagradalsfjall eruption. These changes have been uploaded to the MrLavaLoba GitHub repository (https://github.com/demichie/MrLavaLoba, last access: 4 September 2023) as commits, which are records with a unique ID that identifies specific changes in GitHub documents, when the changes were made and who made them. The code that has been added is highlighted in green, while code that has been deleted is in red.
- 1.
April 2021. Commit 9f60549: Simulation of the whole ongoing eruption as a series of “phases”.
This commit improved the usage of restart files, i.e., the possibility of starting a new simulation including the output of a previous simulation. Following this change the code now allows for implementing the simulation of the eruption as a series of phases without losing the benefit of the thickening parameter.
- 2.
April 2021. Commits 80d4230, e2885d1, 9e1826c, 23f6a16, 2311a50: possibility to have multiple vents/fissures.
These commits allow for considering multiple vents/fissures and assigning a different activity probability to each fissure. Below is a list of the new conditions available:
- –
vent_flag = 4 – the initial lobes are on multiple fissures, and all points of the fissures have the same probability that a “lobe chain” will start from them;
- –
vent_flag = 5 – the initial lobes are on multiple fissures, and all the fissures have the same probability that a lobe chain will start from them;
- –
vent_flag = 7 – the initial lobes are on multiple fissures, and the probability of each fissure is fixed by “fissure_probabilities”.
- –
- 3.
September 2021. Commit 3c4e5d3: enabling of multiple threshold values.
In addition to the final lava thickness map, the MrLavaLoba code allows for saving masked grids obtained by considering inundated cells fulfilling a specified threshold value (de'Michieli Vitturi and Tarquini, 2018). This is controlled by the input parameter masking_threshold, expressed as a fraction of the total volume (i.e., varying within the interval [0; 1]). As an example, if the cut is applied to the thickness and masking_threshold is set to 0.95, the thinnest portion of the final lava deposit representing 5 % of the total volume emplaced is cut out from the results. In the original version of MrLavaLoba it was possible to set a single value of masking_threshold for each simulation, but with this commit it is possible to set multiple values and thus save multiple output raster files.
- 4.
January 2022. Commits d6d0953, 08afee3: code optimization.
With these commits input parameters to crop the DEM file and then the computational domain have been introduced. This crop reduces the computational time when the DEM is large and the area covered by the flow is a lot smaller.
In addition, an analysis with a profiler identified the NumPy function “copy”, used to create a copy of a NumPy array, which was a bottleneck of the code. For this reason, the code has been rewritten to reduce the call to this function. The two changes increased the speed of the code by a factor of 5 to 10. The optimization also allowed us to remove some input parameters that became unnecessary after the changes.
MrLavaLoba was published in 2018 (d'Michieli Vitturi and Tarquini, 2018) and is freely available at the model repository (http://demichie.github.io/MrLavaLoba/, last access: 11 September 2023). Relevant data for this study can be found in Pedersen et al. (2022b, https://doi.org/10.5281/zenodo.7866738). The outputs of MrLavaLoba simulations are available upon request to the corresponding author.
GBMP undertook the manuscript preparation, model implementation, strategy development, validation, formal analysis and communication with stakeholders. MAP undertook the background research, model implementation for pre-eruption runs, formal analysis, communication with stakeholders and review of the manuscript. SB undertook the background research, supervision of the strategy development, contact with stakeholders and review of the manuscript. ST and MdMV undertook the code development, supervision of the strategy development, code implementation and review of the manuscript. BAÓ undertook the background research and review of the manuscript. RHÞ contributed to map production and review of the manuscript.
The contact author has declared that none of the authors has any competing interests.
Publisher’s note: Copernicus Publications remains neutral with regard to jurisdictional claims in published maps and institutional affiliations.
The authors would like to acknowledge scientists and stakeholders who provided feedback on the communication of hazard maps during stakeholder meetings. Furthermore, they would like to thank Alik Ismail-Zadeh and an anonymous reviewer as well as Freysteinn Sigmundsson, who provided an image of the eruption used in Fig. 5.
This research has been supported by the Icelandic Centre for Research (grant no. 206755-052).
This paper was edited by Giovanni Macedonio and reviewed by Alik Ismail-Zadeh and one anonymous referee.
Adams, B. M., Bohnhoff, W. J., Dalbey, K. R., Ebeida, M. S., Eddy, J. P., Eldred, M. S., Hooper, R. W., Hough, P. D., Hu, K. T., Jakeman, J. D., Khalil, M., Maupin, K. A., Monschke, J. A., Ridgway, E. M., Rushdi, A. A., Seidl, D. T., Stephens, J. A., Swiler, L. P., and Winokur, J. G.: Dakota, A Multilevel Parallel Object-Oriented Framework for Design Optimization, Parameter Estimation, Uncertainty Quantification, and Sensitivity Analysis: Version 6.15 User's Manual, Sandia Technical Report SAND2020-12495, Sandia National Laboratories, 2021.
Andrésdóttir, Þ. B.: Eldfjallavá á Reykjanesi, Thesis, University of Iceland, Háskólaprent, Reykjavík, 2016.
Andrésdóttir, Þ. B.: Volcanic hazard and risk assessment at Reykjanes, vulnerability of infrastructure, Thesis, University of Iceland, Háskólaprent, Reykjavík, 2018.
Barberi, F. and Villari, L.: Volcano monitoring and civil protection problems during the 1991–1993 Etna eruption, Acta Vulcanol., 4, 157–165, 1994.
Barsotti, S., Parks, M. M., Pfeffer, M. A., Óladóttir, B. A., Barnie, T., Titos, M. M., Jónsdóttir, K., Pedersen, G. B. M., Hjartardóttir, Á. R., Stefansdóttir, G., Johannsson, T., Arason, Þ., Gudmundsson, M. T., Oddsson, B., Þrastarson, R. H., Ófeigsson, B. G., Vogfjörd, K., Geirsson, H., Hjörvar, T., von Löwis, S., Petersen, G. N., and Sigurðsson, E. M.: The eruption in Fagradalsfjall (2021, Iceland): how the operational monitoring and the volcanic hazard assessment contributed to its safe access, Nat. Hazards, 116, 3063–3092, https://doi.org/10.1007/s11069-022-05798-7, 2023.
Cappello, A., Ganci, G., Calvari, S., Pérez, N. M., Hernández, P. A., Silva, S. V., Cabral, J., and Del Negro, C.: Lava flow hazard modeling during the 2014–2015 Fogo eruption, Cape Verde, J. Geophys. Res.-Sol. Ea., 121, 2290–2303, https://doi.org/10.1002/2015JB012666, 2016a.
Cappello, A., Hérault, A., Bilotta, G., Ganci, G., and Del Negro, C.: MAGFLOW: a physics-based model for the dynamics of lava-flow emplacement, Geol. Soc. Lond. Spec. Publ., 426, 357–373, https://doi.org/10.1144/SP426.16, 2016b.
Carracedo, J. C., Troll, V. R., Day, J. M. D., Geiger, H., Aulinas, M., Soler, V., Deegan, F. M., Perez-Torrado, F. J., Gisbert, G., Gazel, E., Rodriguez-Gonzalez, A., and Albert, H.: The 2021 eruption of the Cumbre Vieja volcanic ridge on La Palma, Canary Islands, Geol. Today, 38, 94–107, https://doi.org/10.1111/gto.12388, 2022.
Chevrel, M. O., Labroquère, J., Harris, A. J. L., and Rowland, S. K.: PyFLOWGO: An open-source platform for simulation of channelized lavahermoso-rheological properties, Comput. Geosci., 111, 167–180, https://doi.org/10.1016/j.cageo.2017.11.009, 2018.
Chevrel, M. O., Favalli, M., Villeneuve, N., Harris, A. J. L., Fornaciai, A., Richter, N., Derrien, A., Boissier, P., Di Muro, A., and Peltier, A.: Lava flow hazard map of Piton de la Fournaise volcano, Nat. Hazards Earth Syst. Sci., 21, 2355–2377, https://doi.org/10.5194/nhess-21-2355-2021, 2021.
Clifton, A. E. and Kattenhorn, S. A.: Structural architecture of a highly oblique divergent plate boundary segment, Tectonophysics, 419, 27–40, https://doi.org/10.1016/j.tecto.2006.03.016, 2006.
Cubuk-Sabuncu, Y., Jónsdóttir, K., Caudron, C., Lecocq, T., Parks, M. M., Geirsson, H., and Mordret, A.: Temporal Seismic Velocity Changes During the 2020 Rapid Inflation at Mt. Þorbjörn-Svartsengi, Iceland, Using Seismic Ambient Noise, Geophys. Res. Lett., 48, e2020GL092265, https://doi.org/10.1029/2020GL092265, 2021.
de'Michieli Vitturi, M. and Tarquini, S.: MrLavaLoba: A new probabilistic model for the simulation of lava flows as a settling process, J. Volcanol. Geotherm. Res., 349, 323–334, https://doi.org/10.1016/j.jvolgeores.2017.11.016, 2018.
Dietterich, H. R., Lev, E., Chen, J., Richardson, J. A., and Cashman, K. V.: Benchmarking computational fluid dynamics models of lava flow simulation for hazard assessment, forecasting, and risk management, J. Appl. Volcanol., 6, 9, https://doi.org/10.1186/s13617-017-0061-x, 2017.
Eibl, E. P. S., Thordarson, T., Höskuldsson, Á., Gudnason, E. Á., Dietrich, T., Hersir, G. P., and Ágústsdóttir, T.: Evolving shallow conduit revealed by tremor and vent activity observations during episodic lava fountaining of the 2021 Geldingadalir eruption, Iceland, Bull. Volcanol., 85, 10, https://doi.org/10.1007/s00445-022-01622-z, 2023.
Einarsson, P., Hjartardóttir, Á. R., Hreinsdóttir, S., and Imsland, P.: The structure of seismogenic strike-slip faults in the eastern part of the Reykjanes Peninsula Oblique Rift, SW Iceland, J. Volcanol. Geotherm. Res., 391, 106372, https://doi.org/10.1016/j.jvolgeores.2018.04.029, 2020.
Einarsson, P. and Sæmundsson, K.: Earthquake epicenters 1982–1985 and volcanic systems in Iceland = Upptok jardskjalfta 1982–1985 og eldstodvakerfi a Islandi [Map], Menningarsjóður, 1987.
Einarsson, S.: Brennisteinsfjöll Alternative name: Bláfjöll, in: Catalogue of Icelandic volcanoes, edited by: Óladóttir, B. A., Larsen, G., and Gudmundsson, M. T., IMO, UI and CPD-NCIP, http://icelandicvolcanoes.is/?volcano=BRE (last access: 11 September 2023), 2019a.
Einarsson, S.: Krýsuvík-Trölladyngja Alternative name: Krísuvík, in: Catalogue of Icelandic volcanoes, edited by: Óladóttir, B. A., Larsen, G., and Gudmundsson, M. T., IMO, UI and CPD-NCIP, http://icelandicvolcanoes.is/?volcano=KRY (last access: 11 September 2023), 2019b.
Favalli, M., Pareschi, M. T., Neri, A., and Isola, I.: Forecasting lava flow paths by a stochastic approach, Geophys. Res. Lett., 32, L03305, https://doi.org/10.1029/2004GL021718, 2005.
Favalli, M., Tarquini, S., Papale, P., Fornaciai, A., and Boschi, E.: Lava flow hazard and risk at Mt. Cameroon volcano, Bull. Volcanol., 74, 423–439, https://doi.org/10.1007/s00445-011-0540-6, 2012.
Felpeto, A., Martí, J., and Ortiz, R.:Automatic GIS-based system for volcanic hazard assessment, J. Volcanol. Geotherm. Res., 166, 106–116, https://doi.org/10.1016/j.jvolgeores.2007.07.008, 2007.
Flóvenz, Ó. G., Wang, R., Hersir, G. P., Dahm, T., Hainzl, S., Vassileva, M., Drouin, V., Heimann, S., Isken, M. P., Gudnason, E. Á., Ágústsson, K., Ágústsdóttir, T., Horálek, J., Motagh, M., Walter, T. R., Rivalta, E., Jousset, P., Krawczyk, C. M., and Milkereit, C.: Cyclical geothermal unrest as a precursor to Iceland's 2021 Fagradalsfjall eruption, Nat. Geosci., 15, 397–404, https://doi.org/10.1038/s41561-022-00930-5, 2022.
Flynn, I. T., Chevrel, M. O., Crown, D. A., and Ramsey, M. S.: The effects of digital elevation model resolution on the PyFLOWGO thermorheological lava flow model, Environ. Model. Softw., 167, 105768, https://doi.org/10.1016/j.envsoft.2023.105768, 2023.
Ganci, G., Vicari, A., Cappello, A., and Del Negro, C.: An emergent strategy for volcano hazard assessment: From thermal satellite monitoring to lava flow modeling, Remote Sens. Environ., 119, 197–207, https://doi.org/10.1016/j.rse.2011.12.021, 2012.
Gee, M. A. M.: Volcanology and geochemistry of Reykjanes Peninsula: Plume-mid-ocean ridge interaction, PhD thesis, University of London, 1998.
Glaze, L. S. and Baloga, S. M.: Simulation of inflated pahoehoe lava flows,. J. Volcanol. Geotherm. Res., 255, 108–123, https://doi.org/10.1016/j.jvolgeores.2013.01.018, 2013.
Greenfield, T., Winder, T., Rawlinson, N., Maclennan, J., White, R. S., Ágústsdóttir, T., Bacon, C. A., Brandsdóttir, B., Eibl, E. P. S., Glastonbury-Southern, E., Gudnason, E. Á., Hersir, G. P., and Horálek, J.: Deep long period seismicity preceding and during the 2021 Fagradalsfjall eruption, Iceland, Bull. Volcanol., 84, 101, https://doi.org/10.1007/s00445-022-01603-2, 2022.
Harris, A. J. and Rowland, S.: FLOWGO: A kinematic hermos-rheological model for lava flowing in a channel, Bull. Volcanol., 63, 20–44, https://doi.org/10.1007/s004450000120, 2001.
Harris, A. J. L., Villeneuve, N., Di Muro, A., Ferrazzini, V., Peltier, A., Coppola, D., Favalli, M., Bachèlery, P., Froger, J.-L., Gurioli, L., Moune, S., Vlastélic, I., Galle, B., and Arellano, S.: Effusive crises at Piton de la Fournaise 2014–2015: a review of a multi-national response model, J. Appl. Volcanol., 6, 11, https://doi.org/10.1186/s13617-017-0062-9, 2017.
Harris, A. J. L., Chevrel, M. O., Coppola, D., Ramsey, M. S., Hrysiewicz, A., Thivet, S., Villeneuve, N., Favalli, M., Peltier, A., Kowalski, P., DiMuro, A., Froger, J.-L., and Gurioli, L.: Validation of an integrated satellite-data-driven response to an effusive crisis: the April–May 2018 eruption of Piton de la Fournaise, Ann. Geophys., 62, VO230, https://doi.org/10.4401/ag-7972, 2019.
Jakobsson, S. P., Jónsson, J., and Shido, F.: Petrology of the Western Reykjanes Peninsula, Iceland, J. Petrol., 19, 669–705, https://doi.org/10.1093/petrology/19.4.669, 1978.
Jones, J. G.: Intraglacial volcanoes of the Laugarvatn region, south-west Iceland – I, Q. J. Geol. Soc., 124, 197–211, https://doi.org/10.1144/gsjgs.124.1.0197, 1969.
Jónsson, J.: Jarðfræðikort af Reykjanesskaga (Geological map of the Reykjanes Peninsula), Orkustofnun Jarðhitadeilsd 7831, 1978.
Jóhannesson, T., Björnsson, H., Magnusson, E., Gudmundsson, S., Palsson, F., Sigurdsson, O., Throsteinsson, T., and Berthier, E.: Ice-volume changes, bias estimation of mass-balance measurements and changes in subglacial lakes derived by lidar mapping of the surface ofhermosnc glaciers, Ann. Glaciol., 54, 63–74, 2013.
Kauahikaua, J.: Lava flow hazard assessment, as of August 2007, for Kilauea east rift zone eruptions, Hawaii island, U.S. Geological Survey Open-File Report 2007-1264, August, 9 pp., http://www.usgs.gov/pubprod (last access: 5 September 2023), 2007.
Klein, F. W., Einarsson, P., and Wyss, M.:The Reykjanes Peninsula, Iceland, earthquake swarm of September 1972 and its tectonic significance, J. Geophys. Res., 82, 865–888, https://doi.org/10.1029/JB082i005p00865, 1977.
Lowenstern, J. B., Wallace, K., Barsotti, S., Sandri, L., Stovall, W., Bernard, B., Privitera, E., Komorowski, J.-C., Fournier, N., Balagizi, C., and Garaebiti, E.: Guidelines for volcano-observatory operations during crises: recommendations from the 2019 volcano observatory best practices meeting, J. Appl. Volcanol., 11, 3, https://doi.org/10.1186/s13617-021-00112-9, 2022.
Martí, J., Becerril, L., and Rodríguez, A.: How long-term hazard assessment may help to anticipate volcanic eruptions: The case of La Palma eruption 2021 (Canary Islands), J. Volcanol. Geotherm. Res., 431, 107669, https://doi.org/10.1016/j.jvolgeores.2022.107669, 2022.
Mossoux, S., Saey, M., Bartolini, S., Poppe, S., Canters, F., and Kervyn, M.: Q-LAVHA: A flexible GIS plugin to simulate lava flows, Comput. Geosci., 97, 98–109, https://doi.org/10.1016/j.cageo.2016.09.003, 2016.
Neal, C. A., Brantley, S. R., Antolik, L., Babb, J. L., Burgess, M., Calles, K., Cappos, M., Chang, J. C., Conway, S., Desmither, L., Dotray, P., Elias, T., Fukunaga, P., Fuke, S., Johanson, I. A., Kamibayashi, K., Kauahikaua, J., Lee, R. L., Pekalib, S., Miklius, A., Million, W., Moniz, C. J., Nadeau, P. A., Okubo, P., Parcheta, C., Patrick, M. R., Shiro, B., Swanson, D. A., Tollett, W., Trusdell, F., Younger, E. F., Zoeller, M. H., Montgomery-Brown, E. K., Anderson, K. R., Poland, M. P., Ball, J. L., Bard, J., Coombs, M., Dietterich, H. R., Kern, C., Thelen, W. A., Cervelli, P. F., Orr, T., Houghton, B. F., Gansecki, C., Hazlett, R., Lundgren, P., Diefenbach, A. K., Lerner, A. H., Waite, G., Kelly, P., Clor, L., Werner, C., Mulliken, K., Fisher G., and Damby, D.: The 2018 rift eruption and summit collapse of Kīlauea Volcano, Science, 363, 367–374, https://doi.org/10.1126/science.aav7046, 2019.
Nuth, C. and Kääb, A.: Co-registration and bias corrections of satellite elevation data sets for quantifying glacier thickness change, The Cryosphere, 5, 271–290, https://doi.org/10.5194/tc-5-271-2011, 2011.
Óladóttir, B. A., Óladóttir, B. A., Larsen, G., and Gudmundsson, M. T.: Fagradalsfjall Also known as part of Krýsuvík-Trölladyngja volcanic system, in: Catalogue of Icelandic volcanoes, IMO, UI and CPD-NCIP, http://icelandicvolcanoes.is/?volcano=FAG (last access: 11 September 2023), 2022.
Pallister, J., Papale, P., Eichelberger, J., Newhall, C., Mandeville, C., Nakada, S., Marzocchi, W., Loughlin, S., Jolly, G., Ewert, J., and Selva, J.: Volcano observatory best practices (VOBP) workshops – A summary of findings and best-practice recommendations, J. Appl. Volcanol., 8, 2, https://doi.org/10.1186/s13617-019-0082-8, 2019.
Pedersen, G. B. M. and Grosse, P.: Morphometry of subaerial shield volcanoes and glaciovolcanoes from Reykjanes Peninsula, Iceland: Effects of eruption environment, J. Volcanol. Geotherm. Res., 282, 115–133, https://doi.org/10.1016/j.jvolgeores.2014.06.008, 2014.
Pedersen, G. B. M., Belart, J. M. C. Óskarsson, B. V., Gudmundsson, M. T., Gies, N., Högnadóttir, Th., Hjartardóttir, A. R., Pinel, V., Berthier, E., Dürig, T., Reynolds, H. I., Hamilton, C. W., Valsson, G., Einarsson, P., Ben-Yehosua, D., Gunnarsson, D., and Oddsson, B.: Volume, effusion rate, and lava transport during the 2021 Fagradalsfjall eruption: Results from near real-time photogrammetric monitoring, Geophis. Res. Lett., 49, 13, https://doi.org/10.1029/2021GL097125, 2022a.
Pedersen, G. B. M., Belart, J. M.C., Óskarsson, B. V., Gudmundsson, M. T., Gies, N., Högnadóttir, Th., Hjartadótti, Á. R. Pinel, V., Berthier, E., Dürig, T., Reynolds, H. I., Hamilton, C. W., Valsson, G., Einarsson, P., Ben-Yehosua, D., Gunnarsson, A., and Oddsson, B.: Digital Elevation Models, orthoimages and lava outlines of the 2021 Fagradalsfjall eruption: Results from near real-time photogrammetric monitoring (Version v1.2), Zenodo [data set], https://doi.org/10.5281/zenodo.7866738, 2022b.
Peltier, A., Ferrazzini, V., Di Muro, A., Kowalski, P., Villeneuve, N., Richter, N., Chevrel, M. O., Froger, J.-L., Hrysiewicz, A., Gouhier, M., Coppola, D., Retailleau, L., Beauducel, F., Boissier, P., Brunet, C., Catherine, P., Fontaine, F., Lauret, F., Garavaglia, L., Lebreton, J., Canjamale, K., Desfete, N., Griot, C., Arellano, S., and Liuzzo, M. G. S.: Volcano crisis management during COVID-19 lockdown at Piton de la Fournaise (La Réunion), Seismol. Res. Lett., 92, 38–52, https://doi.org/10.1785/0220200212, 2020.
Peltier, A, Chevrel, M. O., Harris, A. J. L., and Villeneuve, N.: Reappraisal of gap analysis for effusive crises at Piton de la Fournaise, J. Appl. Volcanol., 11, 1–17, https://doi.org/10.1186/s13617-021-00111-w, 2022.
Pfeffer, M. A., Barsotti, S., Karlsdóttir, S., Jensen, E. H., Pagneux, E. P., Björnsson, B. B., Jóhannesdóttir, G., Höskuldsson, Á., Sandri, L., Selva, J., and Tarquini, S.: An initial volcanic hazard assessment of the Vestmannaeyjar Volcanic System, Icelandic Meterological Office, Iceland, 73 pp., Veðurstofa Íslands The report has the following numbers: VÍ 2020-011, ISSN 1670-8261, 2020.
Porter, C., Morin, P., Howat, I., Noh, M.-J., Bates, B., Peterman, K., Keesey, S., Schlenk, M., Gardiner, J., Tomko, K., Willis, M., Kelleher, C., Cloutier, M., Husby, E., Foga, S., Nakamura, H., Platson, M., Wethington Jr., M., Williamson, C., Bauer, G., Enos, J., Arnold, G., Kramer, W., Becker, P., Doshi, A., D'Souza, C., Cummens, P., Laurier, F., and Bojesen, M.: ArcticDEM. Harvard Dataverse, V1. Polar Geospatial Center, University of Minnesota, Polar Geospatial Center (PGC), https://doi.org/10.7910/DVN/OHHUKH, 2018.
Richter, N., Favalli, M., de Zeeuw-van Dalfsen, E., Fornaciai, A., da Silva Fernandes, R. M., Pérez, N. M., Levy, J., Victória, S. S., and Walter, T. R.: Lava flow hazard at Fogo Volcano, Cabo Verde, before and after the 2014–2015 eruption, Nat. Hazards Earth Syst. Sci., 16, 1925–1951, https://doi.org/10.5194/nhess-16-1925-2016, 2016.
Rossi, M. J.: Morphology and mechanism of eruption of postglacial shield volcanoes in Iceland, Bull. Volcanol., 57, 530–540, https://doi.org/10.1007/BF00304437, 1996.
Sigmundsson, F., Parks, M., Hooper, A., Geirsson, H., Vogfjörd, K. S., Drouin, V., Ófeigsson, B. G., Hreinsdóttir, S., Hjaltadóttir, S., Jónsdóttir, K., Einarsson, P., Barsotti, S., Horálek, J., and Ágústsdóttir, T.: Deformation and seismicity decline before the 2021 Fagradalsfjall eruption, Nature, 609, 523–528, https://doi.org/10.1038/s41586-022-05083-4, 2022.
Sigurgeirsson, M. A. and Einarsson, S.: Reykjanes and Svartsengi volcanic systems, in: Catalogue of Icelandic Volcanoes, edited by: Oladottir, B., Larsen, G., and Guðmundsson, M. T., IMO, UI and CPD-NCIP, http://icelandicvolcanoes.is/?volcano=REY (last access: 11 Septeber 2013), 2016.
Sæmundsson, K.: Hengill, in: Catalogue of Icelandic volcanoes, edited by: Óladóttir, B. A., Larsen, G., and Gudmundsson, M. T., IMO, UI and CPD-NCIP, http://icelandicvolcanoes.is/?volcano=HEN (last access: 11 Septeber 2013), 2019.
Sæmundsson, K. and Sigurgeirsson, M. Á.: Reykjanesskagi, in: Náttúruvá, edited by: Sólnes, J., Sigmundsson, F., and Bessason, B., Viðlagatrygging Íslands/Háskólaútgáfa, 379–401, 2013.
Sæmundsson, K., Jóhanneson, H., Hjartarson, Á., Kristinsson, S. G., and Sigurgeirsson, M. Á.: Geologic map of Southwest Iceland, Map, Iceland Geosurvey, 2010.
Sæmundsson, K., Sigurgeirsson, M. Á., and Friðleifsson, G. Ó.: Geology and structure of the Reykjanes volcanic system, Iceland, J. Volcanol. Geotherm. Res., 391, 106501, https://doi.org/10.1016/j.jvolgeores.2018.11.022, 2020.
Tarquini, S. and Favalli, M.: Uncertainties in lava flow hazard maps derived from numerical simulations: The case study of Mount Etna, J. Volcanol. Geotherm. Res., 260, 90–102, https://doi.org/10.1016/j.jvolgeores.2013.04.017, 2013.
Tarquini, S., Vitturi, M. de' M., Jensen, E., Pedersen, G., Barsotti, S., Coppola, D., and Pfeffer, M. A.: Modeling lava flow propagation over a flat landscape by using MrLavaLoba: The case of the 2014–2015 eruption at Holuhraun, Iceland, Ann. Geophys., 62, VO228, https://doi.org/10.4401/ag-7812, 2019.
Thorkelsson, B. (Ed.): The 2010 Eyjafjallajökull eruption, Iceland. Report to ICAO – June 2012, Icelandic Meteorological Office, University of Iceland. Institute of Earth Sciences, The National Commissioner of the Icelandic Police, Reykjavík. IVATF 4-IP/3, 206 s, Steering and editorial committee: Sigrún Karlsdóttir (chair), Ágúst Gunnar Gylfason, Ármann Höskuldsson, Bryndís Brandsdóttir, Evgenia Ilyinskaya, Magnús Tumi Guðmundsson and Þórdís Högnadóttir, ISBN 978-9979-9975-4-2, 2012.
Vicari, A., Ganci, G., Behncke, B., Cappello, A., Neri, M., and Del Negro, C.: Near-real-time forecasting of lava flow hazards during the 12–13 January 2011 Etna eruption, Geophys. Res. Lett., 38, L13317, https://doi.org/10.1029/2011GL047545, 2011.
Wright, R., Garbeil, H., and Harris, A. J. L.: Using infrared satellite data to drive a hermos-rheological/stochastic lava flow emplacement model: A method for near-real-time volcanic hazard assessment, Geophys. Res. Lett., 35, 1–5, https://doi.org/10.1029/2008GL035228, 2008.