the Creative Commons Attribution 4.0 License.
the Creative Commons Attribution 4.0 License.
 | 20 Sep 2023
Lessons learnt from a rockfall time series analysis: data collection, statistical analysis, and applications
Sandra Melzner
Marco Conedera
Johannes Hübl
Mauro Rossi
Historical rockfall catalogues are important data sources for the investigation of the temporal occurrence of rockfalls, which is crucial information for rockfall hazard and risk assessments. However, such catalogues are rare and often incomplete. Here, we selected and analysed seven catalogues of historical rockfalls in Austria, Italy, and the USA to highlight existing relationships between data collection and mapping methods and representativeness of the resulting rockfall records. Heuristic and simple statistically based frequency analysis methods are applied to describe and compare the different historical rockfall catalogues. Our results show that the mapping strategy may affect the frequency of the assessed rockfall occurrence and the completeness and representativeness of the related time series of historical rockfalls. We conclude by presenting the advantages and limitations of the application of different frequency-based methods for analysing rockfall catalogues and providing recommendations for rockfall mapping. We furthermore present non-parametric statistical methods for dealing with typically small rockfall datasets, which are particularly suited for the characterization of basic rockfall catalogues. Such recommendations should help in the definition of standards for collecting and using temporal rockfall data in hazard and risk assessments.
- Article
(5139 KB) - Full-text XML
-
Supplement
(963 KB) - BibTeX
- EndNote


The investigation of the temporal occurrence of processes is an essential part in a hazard and risk assessment. In the case of rockfall, for instance, temporal analyses may focus on the estimation of rockfall frequency over time, on the analysis of dispositional and triggering factors of rockfalls, or on the medium- to long-term analysis of rockfall occurrence trends over time. Such statistical frequency analysis of rockfall catalogues and of rockfall time series provides fundamental information for hazard and risk studies.
However, published statistical temporal analyses of rockfalls (e.g. power law approaches) are usually rare (De Biagi et al., 2017; Melzner et al., 2020) and commonly aim at estimating the annual, seasonal, or daily frequency of rockfalls (and the related return period) and at establishing magnitude–frequency relationships (Agliardi et al., 2009; Corominas et al., 2017; Crosta et al., 2015; De Biagi et al., 2017; Moya et al., 2010). Further, only a few landslides or rockfall studies include an estimation of the quality of the available data (Guzzetti et al., 2012; Melzner et al., 2020).
The objective of this study is to stimulate comprehensive rockfall data collections using standardized procedures. For this purpose, we statistically analyse seven catalogues with temporal information on rockfalls collected with different methods in Italy, USA, and Austria and discuss the influence of the applied methods on the quality, representativeness, and completeness of the obtained temporal distribution of rockfalls. Advantages and limitations of the different approaches are presented and discussed, promoting standards in rockfall data collection and providing guidance for the proper usage of the statistical analysis of rockfall time series and for the evaluation of their representativeness.
2.1 Definitions
Information about rockfalls is usually stored in form of inventories, catalogues, and records. According to Melzner et al. (2020), a rockfall inventory is a type of landslide inventory (Guzzetti et al., 2012) that contains geographical and typological information on the source, transport, and deposition area of rockfalls. Information about an individual rockfall or multiple rockfalls can be extracted from the rockfall inventory database in the form of different thematic rockfall catalogues. A historical rockfall catalogue lists the time of occurrence of rockfalls, whereas a historical catalogue of rockfall consequences is a list of information on damage, fatalities, and casualties of rockfall events over a period of time. A historical rockfall record or a rockfall time series reports the rockfall events that occurred for a given region and time period, although detailed spatial information is not always available. As a rule, r rockfall time series records are irregular and discontinuous over time.
The temporal occurrence of rockfall is fundamental information to assess the rockfall risk, which is the probability that a harmful event can occur. Specifically, rockfall risk can be achieved by investigating the frequency and consequences of the rockfall events. The consequences of a rockfall can be expressed by the severity of damage on structures and infrastructures and the impact on population in terms of number of fatalities and causalities.
According to Melzner et al. (2020), possible criteria for the evaluation of the quality of a rockfall catalogue should combine the amount of data with the level of detail and the thematic variability of the information. The level of comprehensiveness of the catalogue can be described with completeness and the representativeness of the collected data and the variability of the geographical location of the single of multiple features encompassed by a rockfall: completeness refers to the proportion of rockfalls contained in the catalogue with respect to the total number of occurred rockfalls. Representativeness of a given rockfall sample or subset refers to the degree with respect to the entire rockfall catalogue from which it is derived, i.e. unbiased statistical inference of the whole population. Thematic variability refers to the amount of imprecision of the identification and classification of a rockfall or a given rockfall feature. Geographic variability refers to the amount of imprecision of the graphical representation of a rockfall feature to the real geographic position in the study area.
Rockfall time series can be analysed by identifying change points or structural breaks. Change points mark abrupt or step changes (i.e. a shift to a higher or lower value) in the mean frequency of documented rockfalls (Pettitt, 1979; Xie et al., 2013). Instead, structural breaks are changes over time in the parameters of a regression model fitting the values of a rockfall time series.
2.2 Data collection
The frequency of occurrence of rockfalls can be determined (i) qualitatively in the field (Melzner, 2015; Melzner et al., 2019; Wieczorek and Snyder, 2004; Wieczorek et al., 1992), (ii) quantitatively based on historical data on rockfalls or monitoring data (Janeras Casanova et al., 2017; Katz et al., 2011; Luckman, 2008; Mavrouli and Corominas, 2017; Melzner, 2016; Melzner et al., 2020; Wieczorek et al., 1992; Wieczorek and Snyder, 2004), or (iii) derived indirectly from the triggering events (Antonini et al., 2002; Chau et al., 2003; Grant et al., 2018; Huang and Li, 2009; Kobayashi et al., 1990).
In the field, a qualitative assessment of areas with frequent rockfall occurrence may be achieved by detecting a high number of recent and still visible rockfall scarps or rockfall boulders and impact marks on ground, trees, and objects. Broken trees, low vegetation, or aisles in the forest cover may give a good indication of high rockfall frequency. Depending on the type of lithology, the fresh look of rockfall scarps in the rock walls and rockfall boulders (Fig. 1a and b) may disappear within a few years, making it difficult to estimate the timing of the events based on field data.
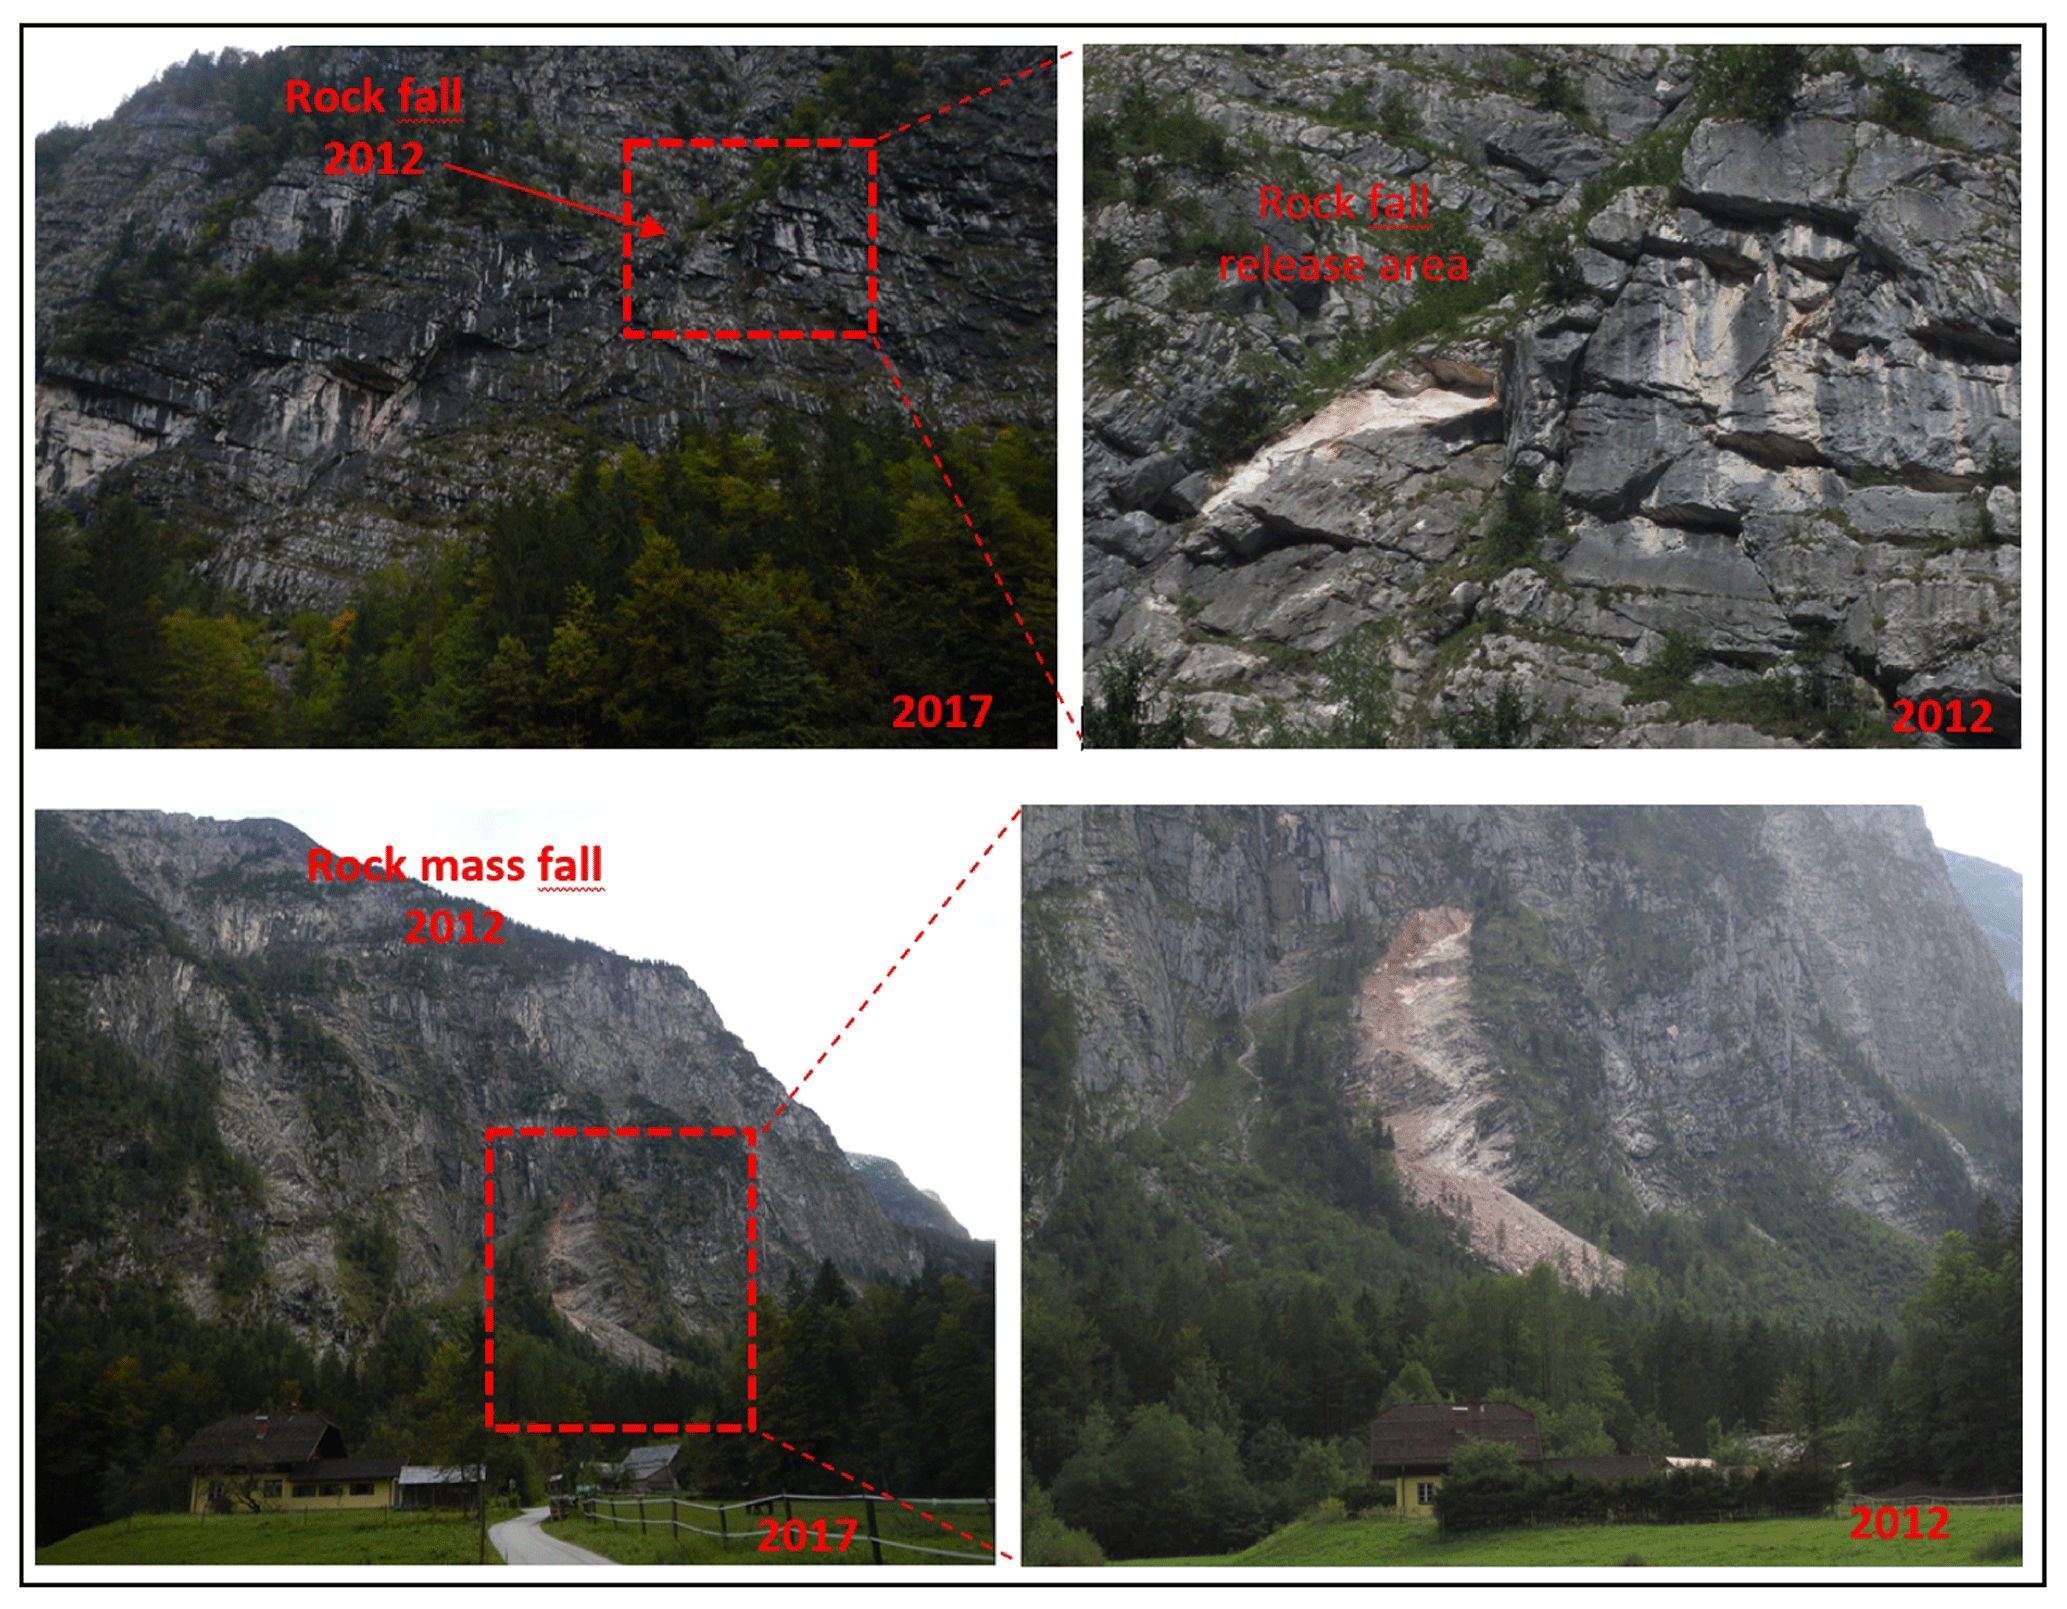
Figure 1Estimation of temporal occurrence or age of a rockfall or rock mass fall based on the rock colour in Dachstein limestone. In the case of the rockfall (upper pictures) the rockfall release area and rockfall boulders already have the same colour as the surrounding rock after 3–4 years. In the case of the large rock mass fall (lower pictures) a similar colour transition is visible (photos by Sandra Melzner, Geological Survey of Austria archive).
Quantitative data about the temporal occurrence of rockfalls can be gathered by a systematic review of various historical accounts and sources including (i) chronicles and archives in churches, museums, police and fire departments, administrative and government institutions; (ii) newspapers, (iii) technical and scientific reports; (iv) internet alerts; (v) historic photographs; and/or by (vi) interviewing of eyewitnesses and (vii) monitoring of rock faces.
Rockfall descriptions in historical accounts may contain sufficient detail to determine the exact rockfall locations, including release and deposit area. However, in other historical reports the location is only mentioned vaguely referring to segments of valleys, roads, trails, and villages or regional toponyms. Often the informal (local) place names reported in the historical reports are not mentioned or published in official (topographic) maps. The collaboration with local habitants and/or police officers is essential in order to determine the exact location of the rockfalls (Guzzetti et al., 1994; Melzner, 2015; Melzner and Braunstingl, 2017; Salvati et al., 2010). Historical rockfall records usually lack of complete information on both the timing of the event and the size of the rock, which are usually referred to in relative terms (i.e. “very often”, “large”, “destructive or catastrophic event”) or are estimated in the field in pre-defined size classes. In the case of rockfalls which are identifiable from the examination of photographs only, the time precision is reduced to the year or the decade (Wieczorek and Snyder, 2004).
2.3 Rockfall statistics and applications
Frequency analysis of temporal patterns of rockfalls can be performed or displayed using absolute numbers of rockfalls, cumulative number of rockfalls, and normalized cumulative number of rockfalls per time unit. Heuristic and statistical analyses and tests are used to check and detect frequency changes in rockfall data samples and to investigate temporal trends and patterns in rockfall time series.
The total number of rockfalls per unit of time gives information about the rockfall rate, per year or per day. Cumulative rockfall time series display cumulative numbers of rockfalls per year or per day and can be used to analyse trends in rockfall occurrence and detecting data discontinuities or changes in the collection procedures. Normalized cumulative rockfall series display the (cumulated) frequency of rockfall divided by the total number of rockfall. The analysis of the normalized cumulative number of rockfall and of the related slopes shows the difference in statistics among the datasets more clearly. This is an important step in the evaluation of the completeness or representativeness of data of a historical rockfall catalogue.
Change point and structural breaks in rockfall time series can be detected heuristically or automatically using different statistical tests. The literature on this topic is vast but mostly refers to applications on continuous time series. Pettitt's test (Pettitt, 1979) is largely applied for detecting change points. In this test, the H0 (null hypothesis) corresponds to the absence of change points. If the p value is less than 0.05, the null hypothesis is rejected, which means that there is a change in rockfall numbers. This corresponds to the k value, as shown by the Pettitt plot. If the p value is greater than 0.05, the null hypothesis is accepted, which indicates that there are no significant changes in rockfall numbers. The detection of structural changes can be conducted using the Rec-CUSUM (Cumulative SUM of Recursive Residues) method (Brown et al., 1975). Possible variations of rockfalls over time can be detected by significant monotonic upward or downward trends over time. The Mann–Kendall (Gilbert, 1987; Kendall, 1975; Mann, 1945) test is used as an alternative to a parametric linear regression analysis, which tests whether the slope of the estimated linear regression line fitting the time series data is statistically different from zero.
The magnitude of a rockfall time series trend, i.e. quantifying the rate of increase or decrease of rockfalls over time, can be evaluated with a simple non-parametric procedure called Sen's slope (Sen, 1968). The test is based on the calculation of the Sen's slope statistics expressing the linear rate of rockfall change. Sen's slope may be lower and greater than zero, indicating respectively the rate of the decreasing or increasing trend.
Temporal-pattern analysis and trends and change point detection are important steps in the evaluation of the completeness or representativeness of a historical rockfall catalogue, including the detection of instrumental and measuring errors or significant process changes.
3.1 Collection of temporal rockfall data
We used seven catalogues of historical rockfalls in Austria, Italy, and the USA to analyse the impact of mapping method or strategy. Some of the catalogues are subsets of comprehensive rockfall inventories, including detailed information about other relevant rockfall information, such as volumes and structural geologic factors (Table 1) (see Melzner et al., 2020, for statistical analysis on rockfall size). Different data collection strategies were adopted to collect these temporal rockfall data.
Table 1Overview about catalogues of historical rockfalls used for statistical analysis. Please see Melzner et al. (2020) for details on catalogues of rockfall sizes.
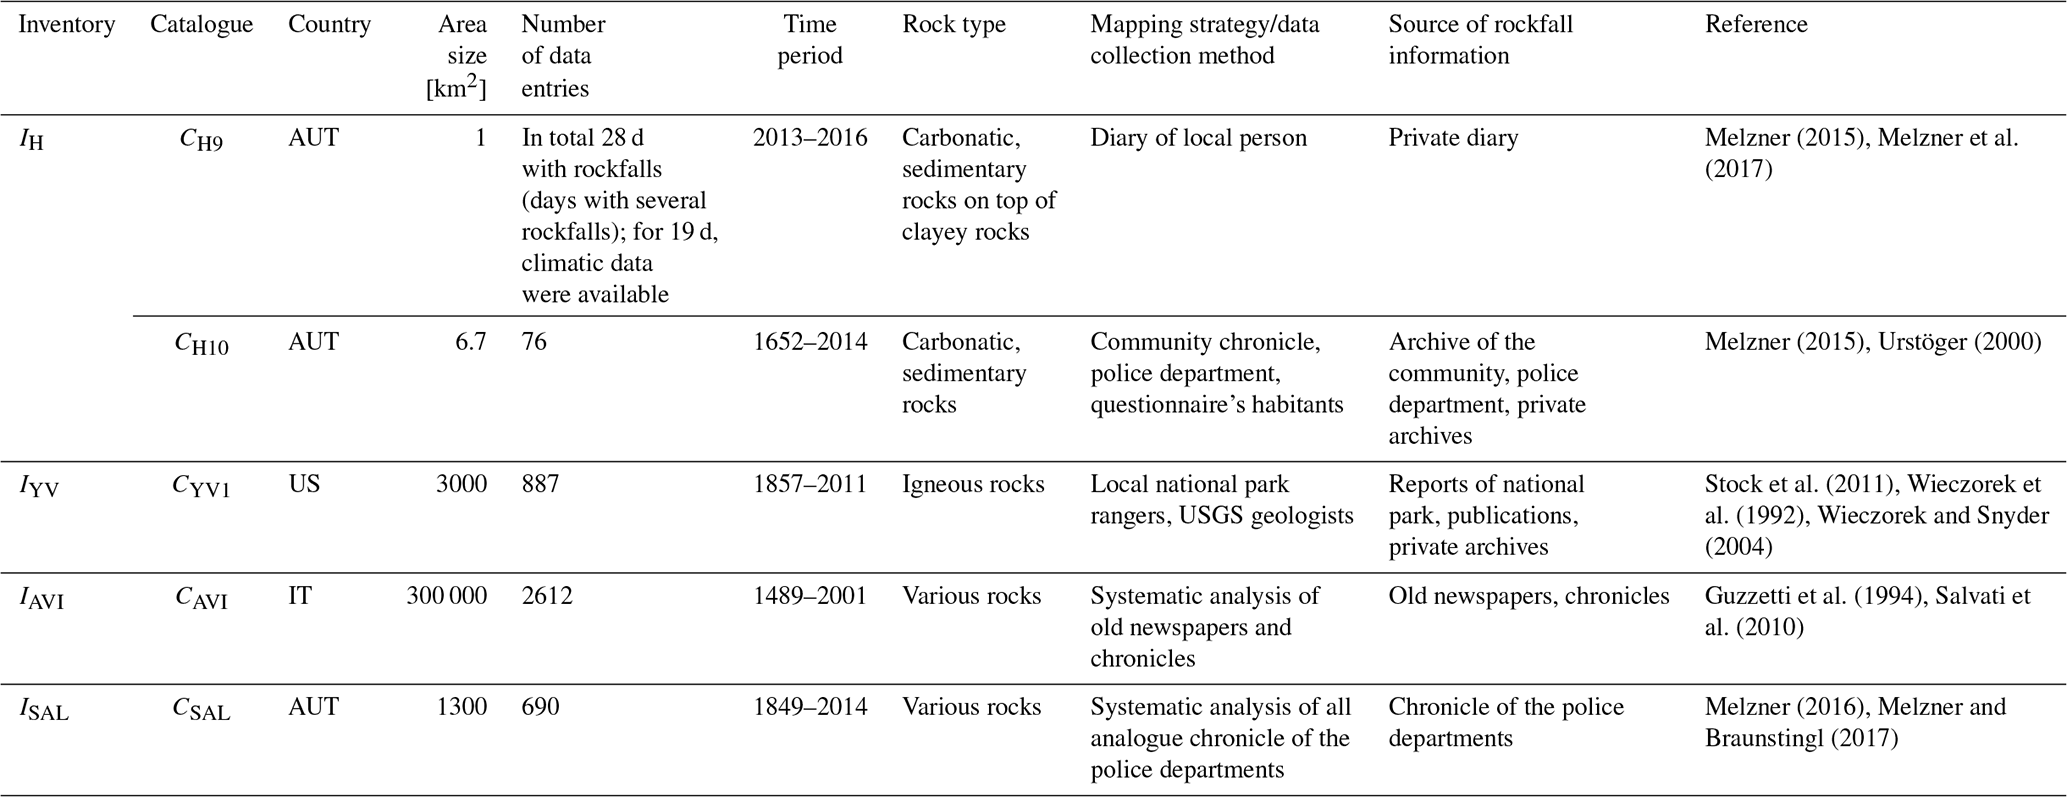
The inventory IH covers an area of about 17 km2 in Austria, which is built up by carbonatic sedimentary rocks. The inventory contains the historical rockfall catalogues CH8, CH9, and CH10 and a variety of information (see catalogues on rockfall size C1–7 in Melzner et al., 2020). The historical catalogue of rockfalls CH8 (compiled in 2014) contains information about 76 historical rockfalls for the 362-year period from 1652 to 2014. This detailed catalogue was prepared by a systematic analysis of different historical archives of community, museum, police department, and collaboration and interviews with eyewitnesses. Quantitative information about volume for most of these historical rockfalls is not existent. The qualitative information about volume and damage was interpreted in terms of rockfall intensity and stored in the catalogue of rockfalls consequences CH10 (Melzner, 2015, 2017; Urstöger, 2000). The historical catalogue of rockfalls CH9 (compiled in 2016) captures 28 historical rockfalls over the 3-year period spanning from December 2013 to September 2016, which occurred within a progressive rockfall scarp alongside a deep-seated lateral rock spread located in a remote area. The catalogue was compiled by the analysis of information from a diary of a local habitant (hunter) who lives permanently in the vicinity of that slope failure. The eyewitness only documented large rockfalls in their diary (large rockfalls by hearing loud noises); absolute volume information is therefore non-existent (Melzner, 2016).
The inventory IYV covers an area of about 3000 km2 in the USA, which is built up by igneous rocks. The inventory contains an extensive catalogue of rockfall sizes (see catalogue of rockfall size CYV in Melzner et al., 2020) and the historical catalogue of rockfalls CYV1. This catalogue contains information about 887 historical rockfalls for the 154-year period from 1857 to 2011. The assessment strategy focused on the review of published and unpublished historical accounts, scientific reports, newspaper articles, and eyewitness observations integrated by field mapping and remote-sensing analysis (Stock et al., 2011; Wieczorek and Snyder, 2004).
The country-wide inventory IAVI covers the area of Italy of about 300 000 km2, which is built up by large variety of rock types. The historical catalogue CAVI covers a time period from 1489 to 2001 with a total number of entries of about 2612 rockfalls. The technique used to compile the historical rockfall catalogue Aree Vulnerate Italiane (AVI) for the whole of Italy was on rockfalls that resulted in damage, affected buildings and roads, and caused fatalities (Guzzetti and Tonelli, 2004).
The inventory ISAL covers an area of about 1300 km2 in Austria. The study area was chosen to contain a wide range of different topographic and geologic settings to cover a large variety of different processes. The inventory was compiled by the systematic review of analogue police chronicles (Melzner, 2016), and the researched information could be classified into 5 process groups (fluviatile processes (FP), gravitational mass movements (GM), snow processes (SP), meteorological processes (MP), seismic processes (S)) and 11 process types (i.e. rockfalls). The catalogue contains information about 690 historical rockfalls for the 162-year period from 1854 until 2016.
3.2 Statistical analysis
We analysed the historical rockfall catalogues in terms of numbers of rockfalls per year, normalized cumulative number of rockfalls per year, and cumulative number of rockfalls per year.
We calculated the absolute numbers of rockfalls per year for the catalogues CAVI, CYV, CH8, CSAL, and CH9 to gain an overview of the sequence of rockfalls which are reported in the different study areas in the time period 1857 to 2011. The annual rockfall frequency Nj was determined by counting the number of rockfalls per year. Furthermore, we analysed the relationship between the documentation of rockfall occurrence (historical rockfall catalogues CH8) and the related damages (catalogue of rockfalls consequences CH10) for the time period 1857 to 2011.
We calculated the cumulative number of rockfalls per year for the catalogues CAVI, CYV, CH8, CSAL, and CH9 to analyse differences in datasets, e.g. rate of rockfalls per year for the time period 1489 to 2011 and for the time period 1857 to 2011. The two time periods were selected to present the entire rockfall data contained in the different rockfall catalogues (1489 to 2011). The second time interval (1857 to 2011) was selected, because for this time span rockfall data were available for all datasets, making a comparison possible (R Core Team, 2020; Pohlert, 2020). The statistical analysis is conducted by (i) counting the rockfalls per unit of time (e.g. a month, a year) to obtain a continuous time series, (ii) cumulating this new time series, and then (iii) analysing the rates of increase or decrease of the slope of the cumulative series over time (i.e. evaluating the first derivative). The angular coefficient (slope) of the linear fitting of a period gives the average number of rockfalls mapped every year in this period. Such a coefficient basically quantifies the rate at which rockfalls were reported in different portions of the time series.
We analysed the normalized cumulative number of rockfall for the catalogues CAVI, CYV, CH8, CSAL, and CH9 and of the related slopes for the two selected time periods by calculating the cumulative number of rockfalls and dividing it by the total number of rockfalls (frequency distribution of rockfall scaled from 0 to 1).
We delineated different periods of rockfall occurrence using a heuristic approach and statistical test. We applied the Pettitt test to verify the presence of changes in the yearly rockfall time series. Compared to heuristic analyses, the Pettitt test allows for a more objective and robust detection of the changes of the rockfall datasets. Specifically, we used the Pettitt test to detect the statistically relevant changes in the time series average numbers. This was conducted on the yearly rockfall counts series and using a specific procedure coded in R language using the package trend.
We analysed the relationship between daily and seasonal variability of high-magnitude rockfalls occurring alongside a deep-seated active lateral rock spread with respect to climatic time series. The rockfall time series displayed in Fig. 7 is a subset of catalogue CH9 or the meteorological data of a nearby weather station (source: eHYD, 2021) that were available for the period December 2013 to December 2014 (Melzner et al., 2017).
Lastly, we analysed the relationship between cumulative number of different processes and rockfalls which resulted in consequences by calculating the cumulative number of processes per year and mosaic plot. Such a plot was realized in order to enable the general overview of datasets with two or more variables and to identify the possible correlations or co-occurrences between their different characteristics. In the present example we display the catalogue CSAL and show the relationship between consequences and rockfalls and other processes, which are analysed using the number of rockfalls causing fatalities.
The results of the comparison of the numbers of rockfalls per year (DR) are shown in Fig. 2. The country-wide catalogue CAVI contains the highest number of reported rockfalls, and catalogue CH9 contains the lowest number of reported rockfalls, mainly concentrated in two time periods. Although referring to similar area settings (i.e. glacially over steepened valley), catalogue CYV shows a much higher number of reported rockfalls with respect to CH8.
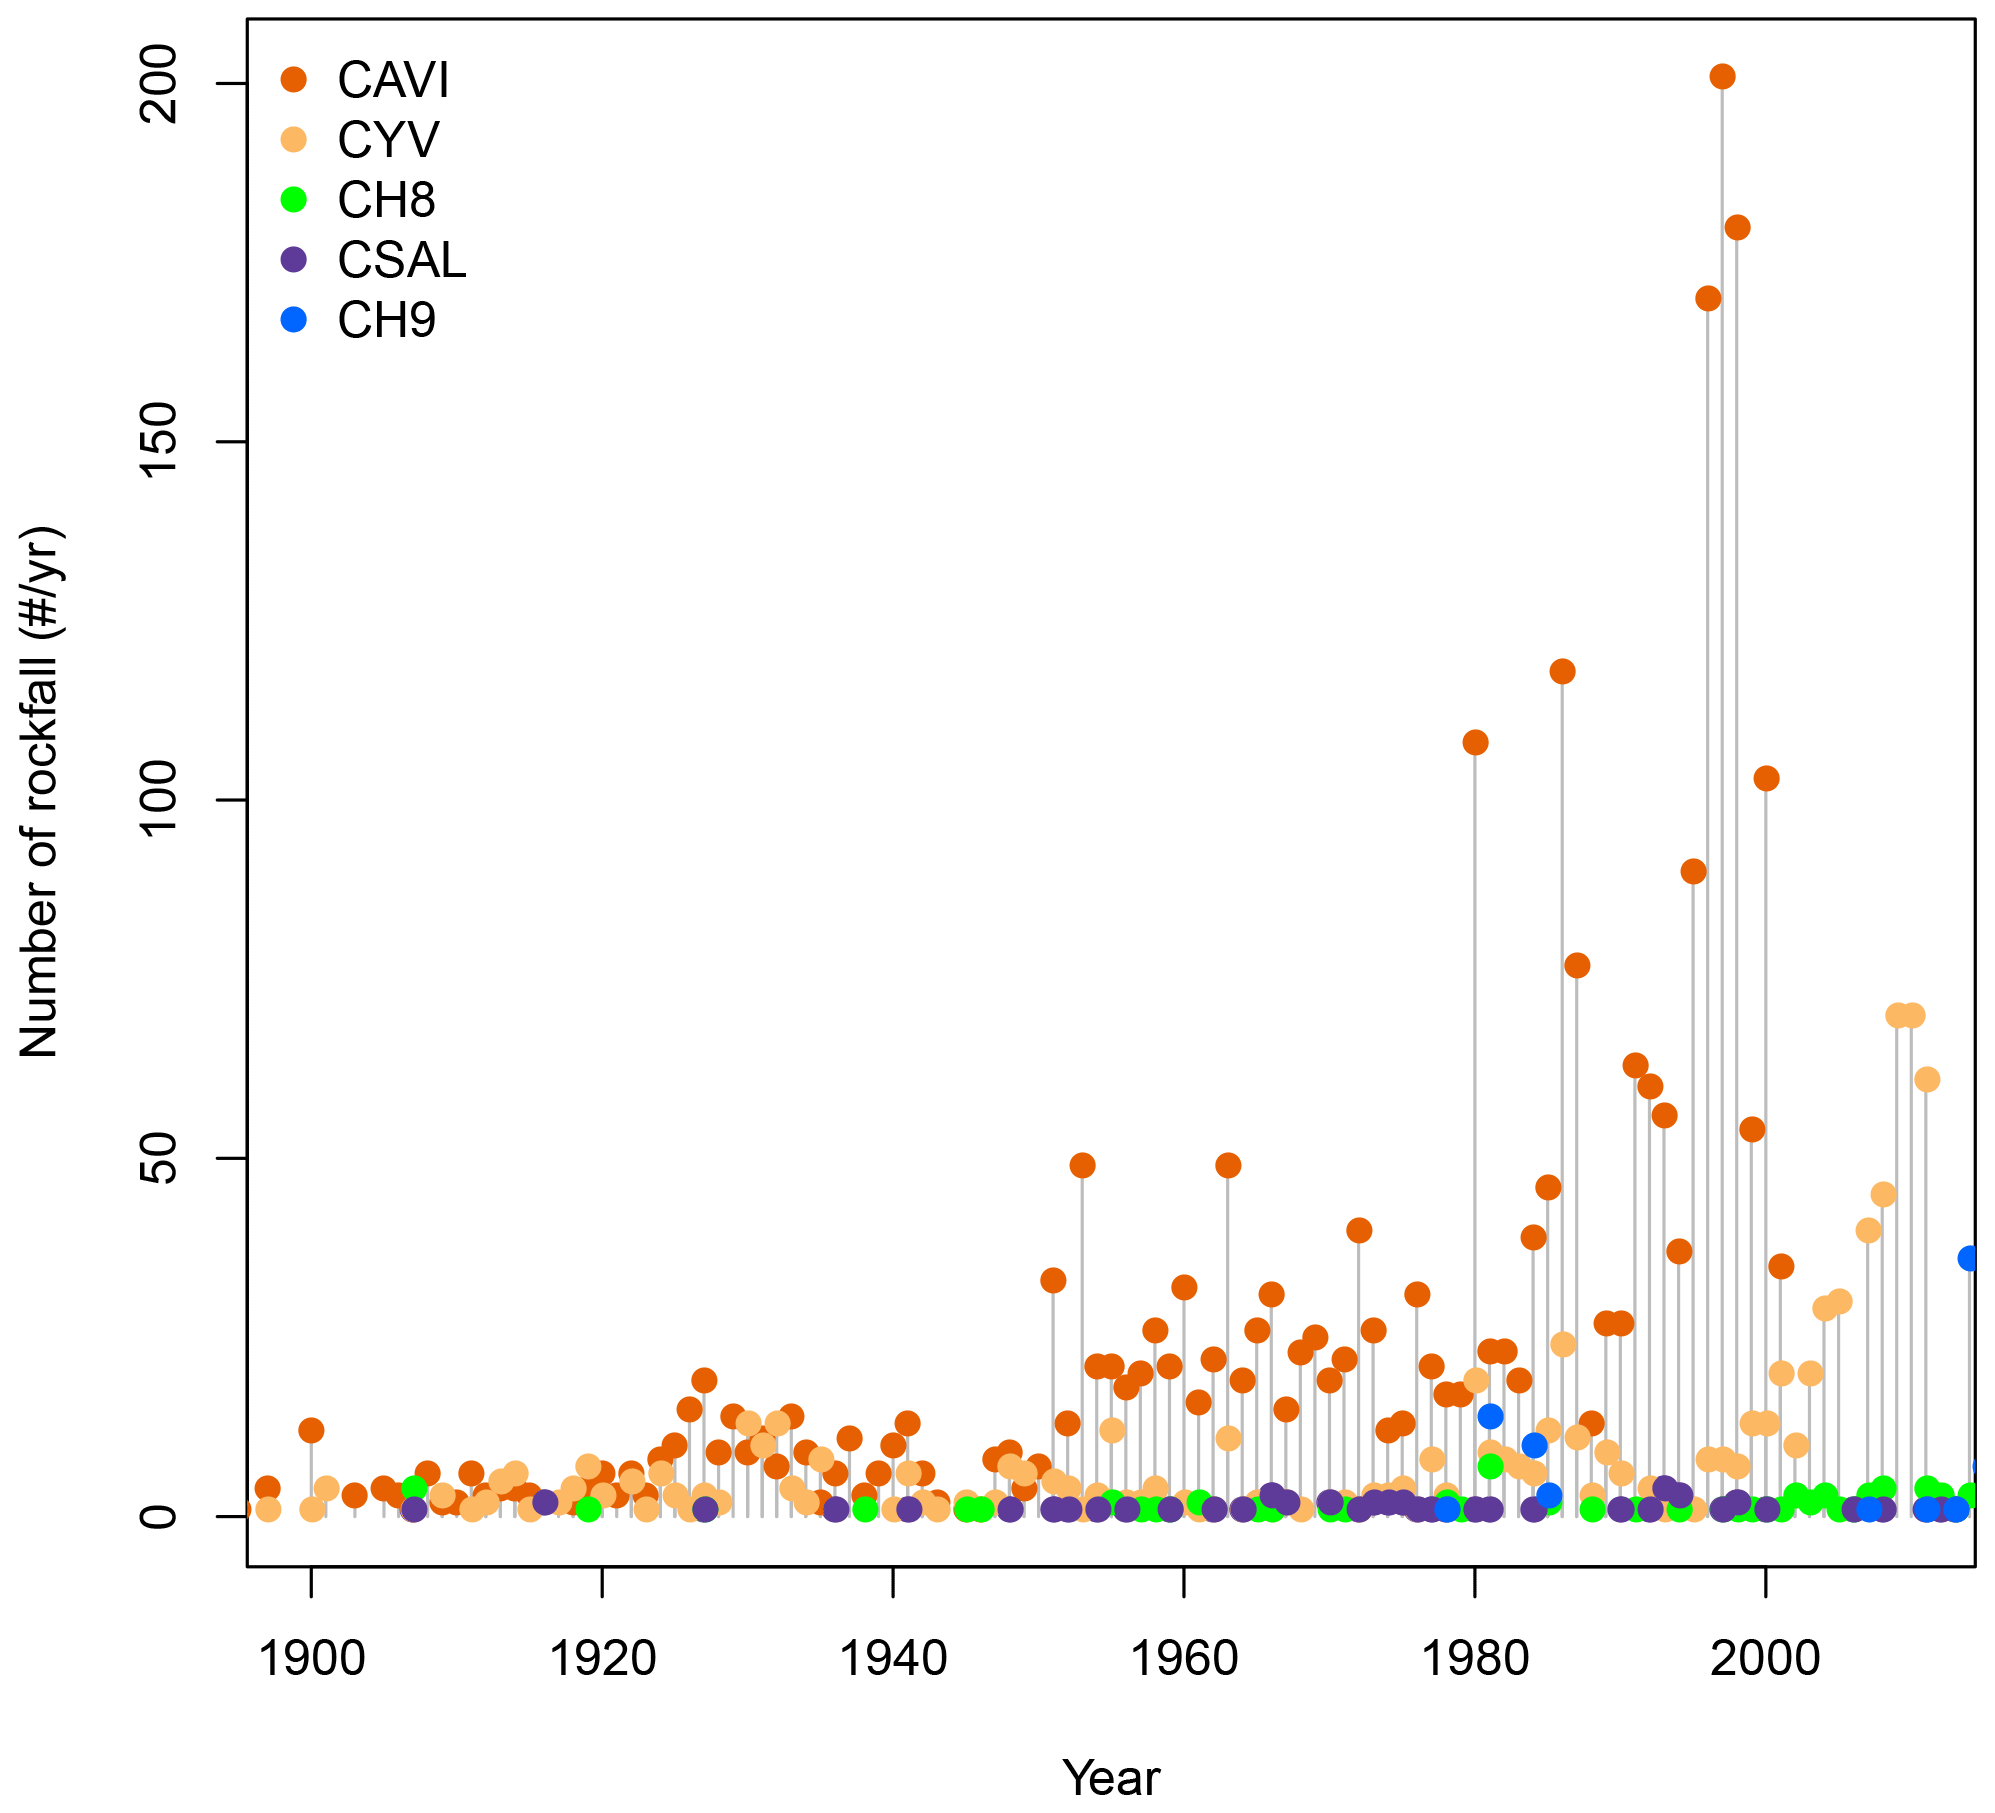
Figure 2Comparison of absolute number of rockfalls per year (Nj) (annual rockfall frequency) of five historical rockfall time series in Italy (red), Austria (green, purple, and blue), and USA (orange): CYV catalogue 1857–2011 (total number of rockfalls: 887), CAVI 1489–2001 (total number of rockfalls: 2612), CH8 1652–2014 (total number of rockfalls: 76), CSAL 1907–2016 (total number of rockfalls: 53), and CH9 1978–2016 (total number of rockfalls: 41).
The comparison of the historical rockfall catalogue CH8 and the rockfall catalogue of damage CH10 (Table 1 and Fig. 3) reveals that very old rockfalls before 1920 were only documented if houses were destroyed. Most of the recorded rockfalls after 1920 caused severe damage (red and orange points) or resulted in fatalities (blue points) and injured persons (pink points). Since 2000, rockfalls that did not cause severe damage have been well documented.
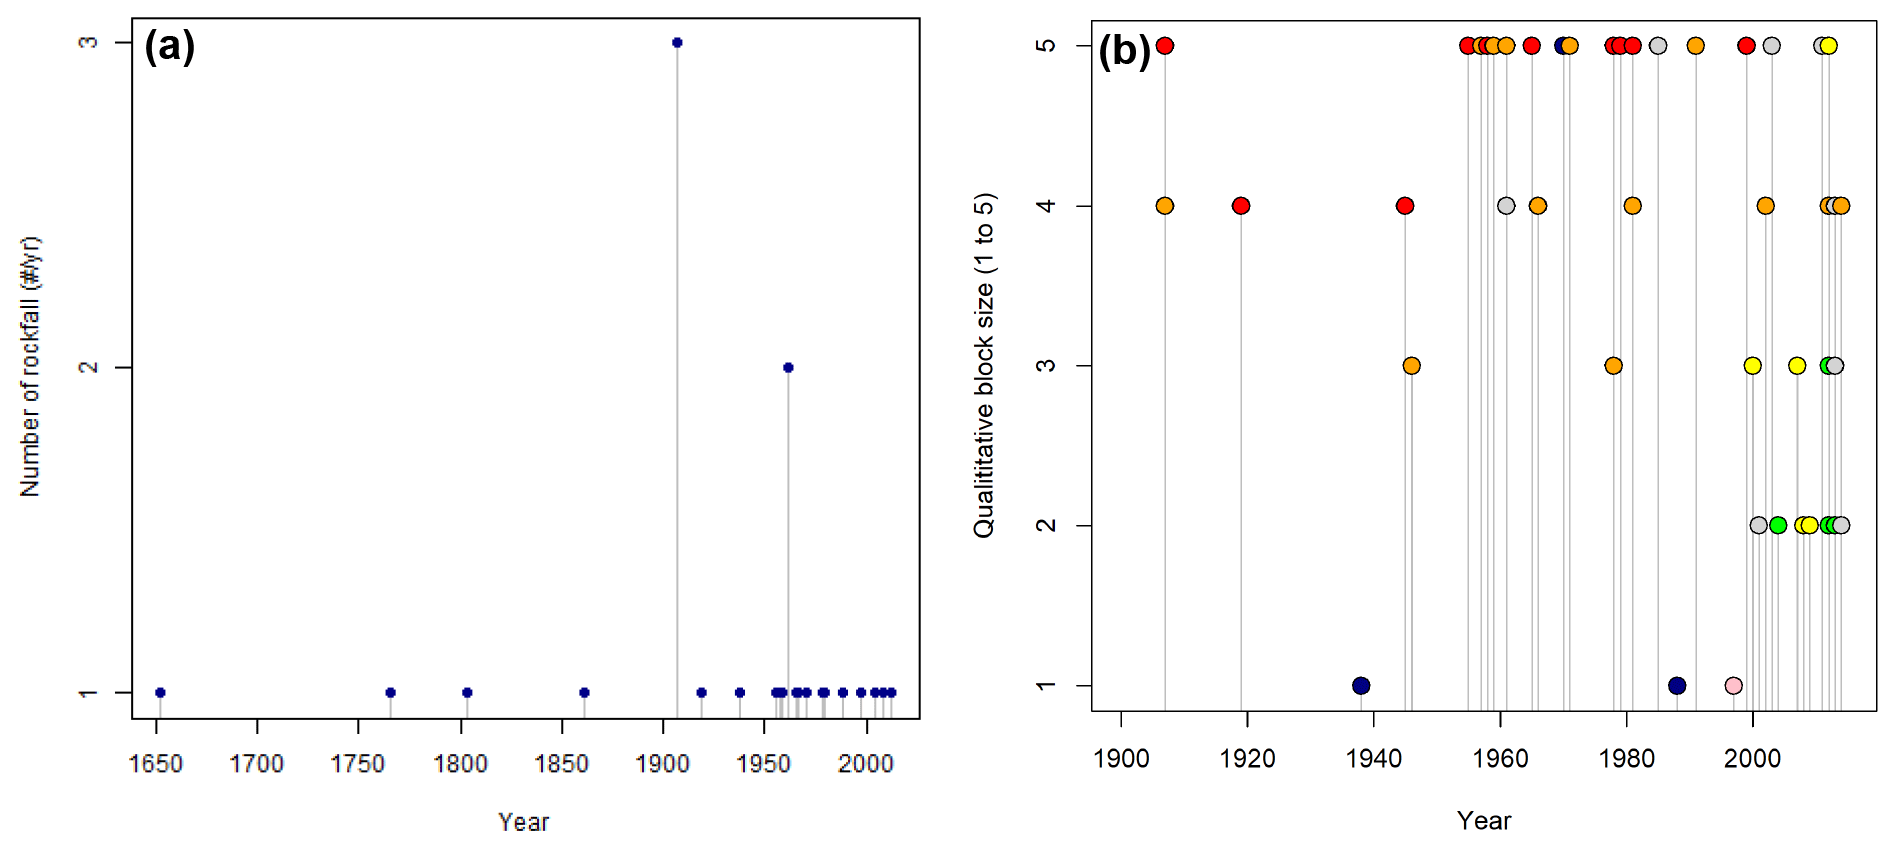
Figure 3Relationship between the representativeness of the rockfall time series CH8 (a) with respect to rockfall which resulted in consequences CH10 (b). (b) Red points – very large intensity, orange points – large intensity, yellow points – medium intensity, green points – low intensity, blue points – fatality, rosa points – injury, grey points – no info, and grey points – no damage.
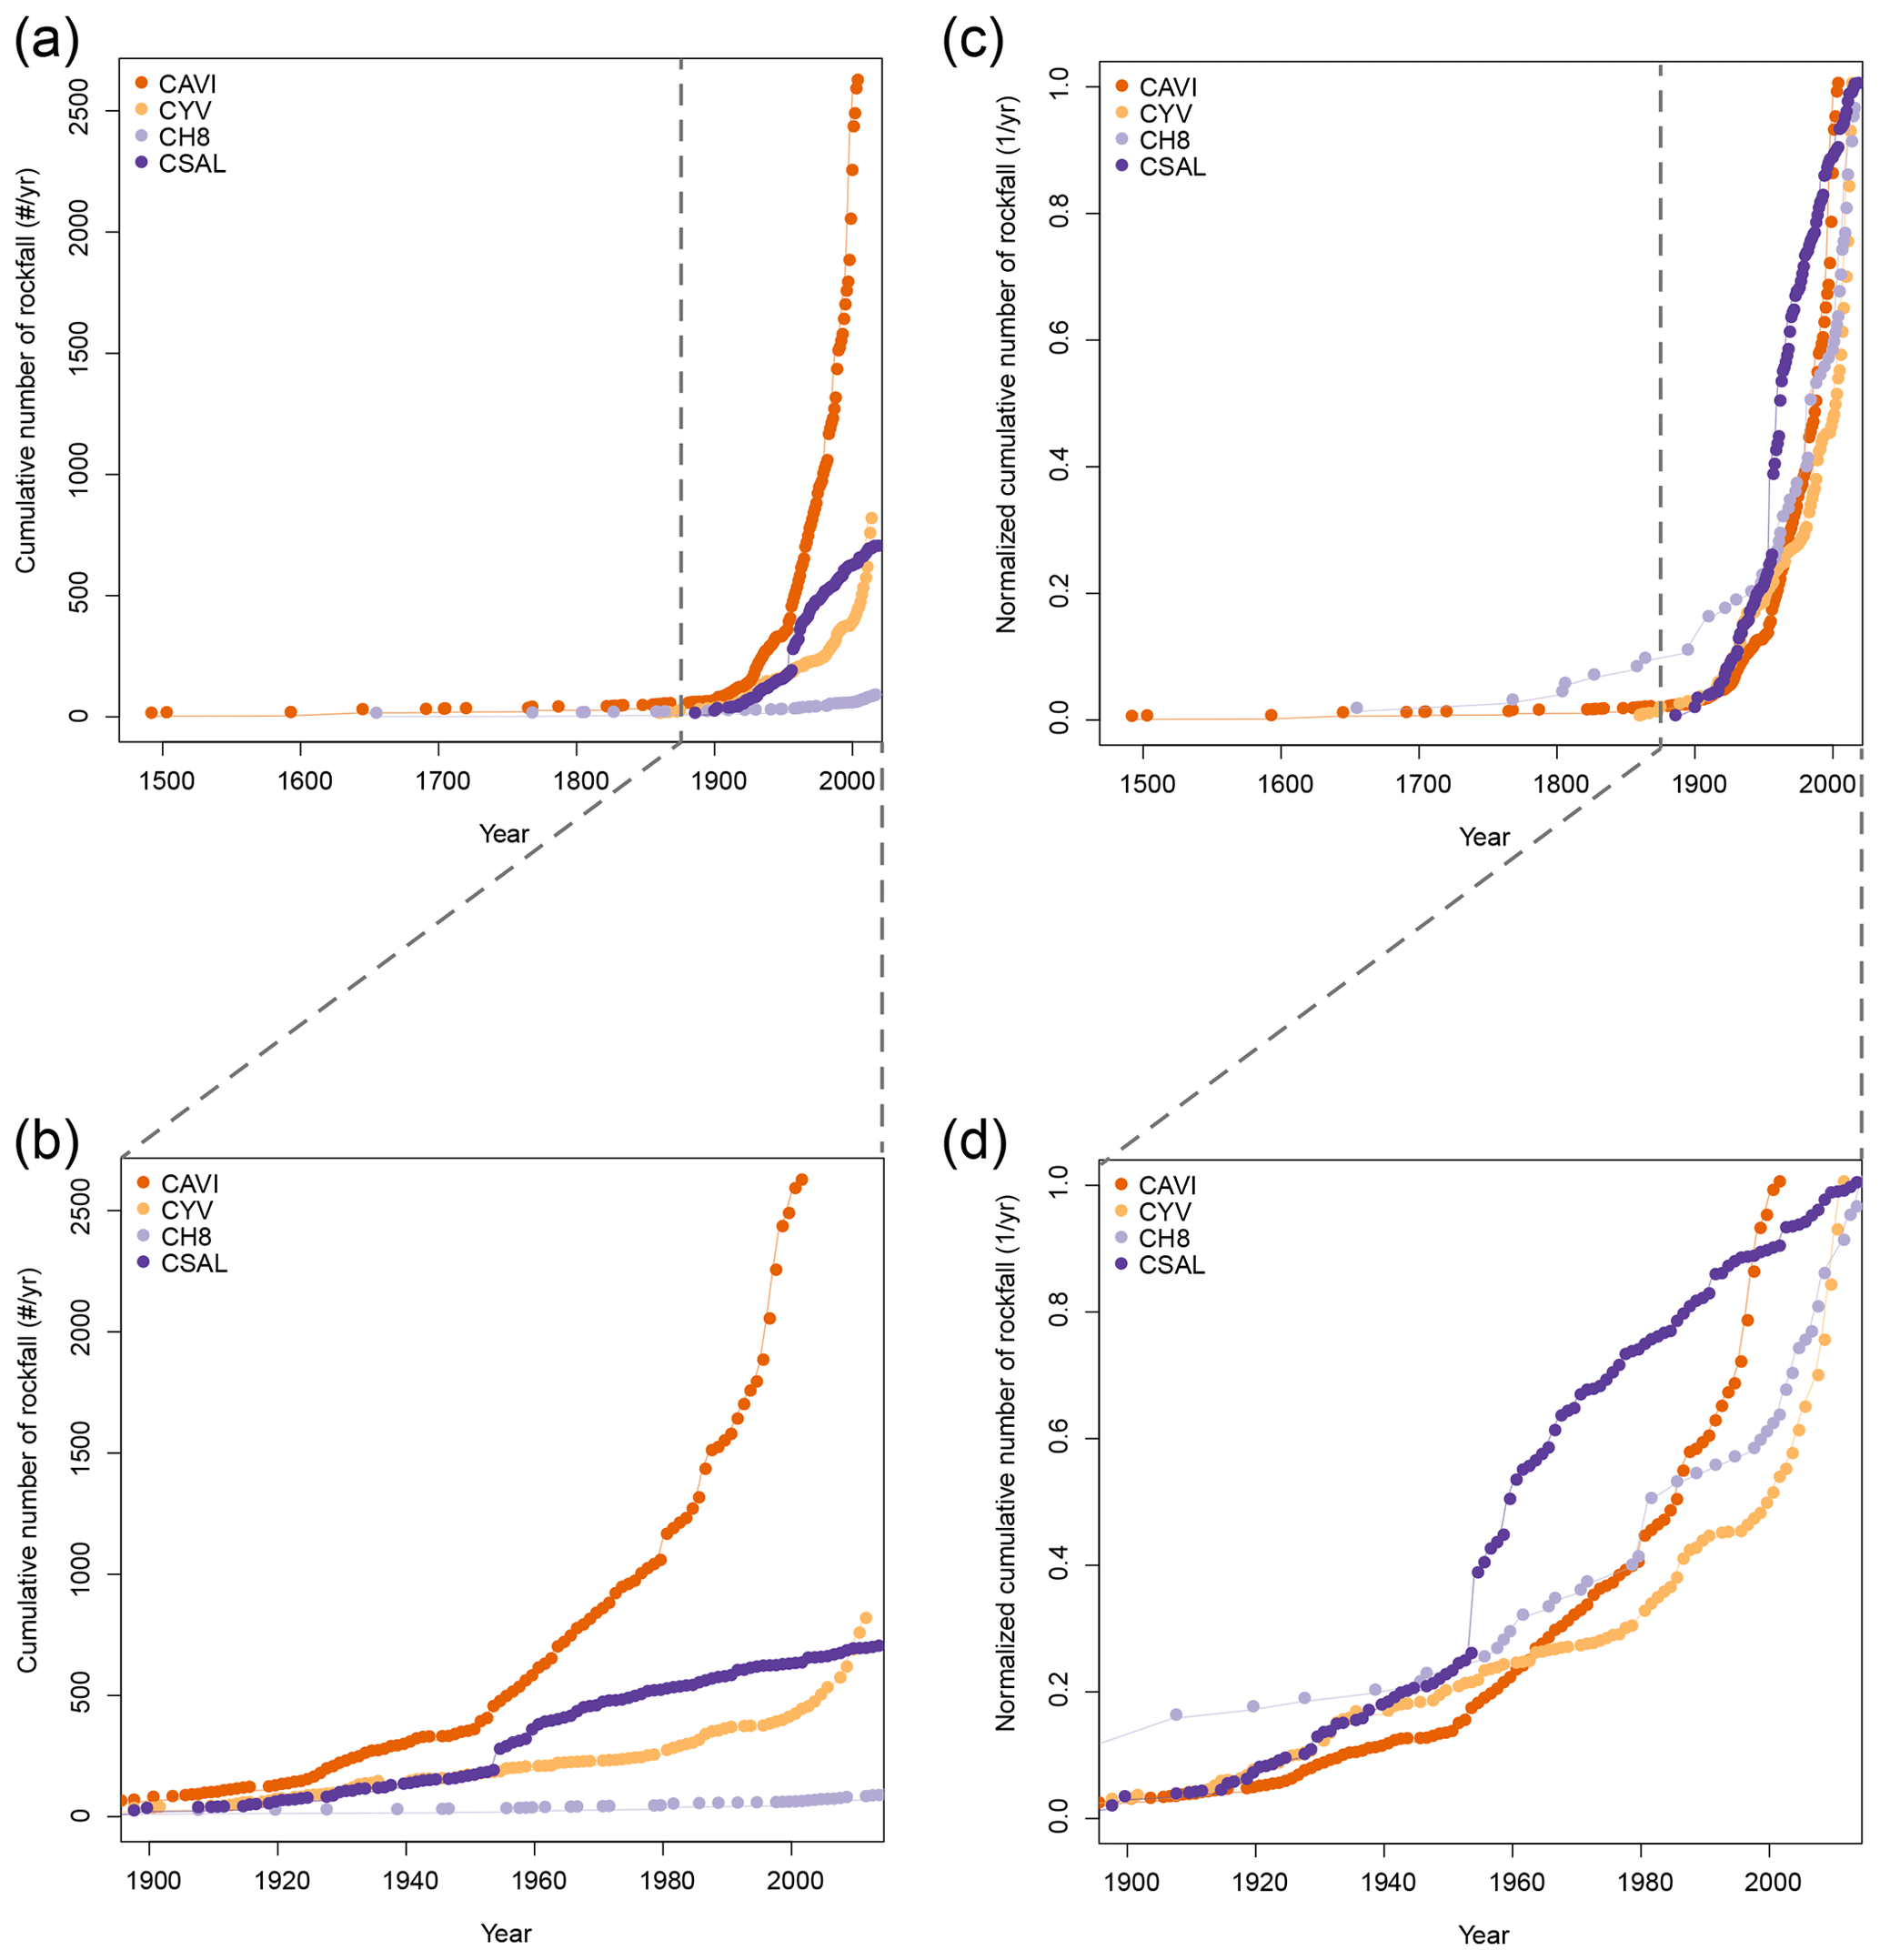
Figure 4Comparison of the cumulative number of rockfalls (a, b) and normalized cumulative number of rockfalls (NCR, as a function of year), (c, d) of the five historical rockfall catalogues CH8, CH9, CYV, CAVI and CCSAL from USA (yellow curve), Italy (orange curve) and Austria (dark and light purple).
The comparison of the rockfall time series CH8, CH9, CYV, CAVI, and CSAL (Fig. 4) reveals differences among the datasets, indicating that the data collection method/source of information affects the definition of periods with similar slopes of rockfall rates. We detected three different periods for CH9; five for CYV, CH8, and CSAL; and up to six for CAVI (Table 2). The comparison of adjusted R2, with the majority of values greater than 0.9, suggests that the heuristic procedure was able to correctly capture the linear trends in different periods of the data series. The change points detected using the Pettitt test (Fig. 5 and Table 3) show a general trend for all catalogues towards the detection of fewer periods than detected with the heuristic methods: for catalogue CH8 two change points, for CYV four change points, for CSAL one change point, for CAVI three change points, and for CH9 no change points could be identified (Fig. 5 and Table 3). The analysis reveals some correspondence with those obtained by the heuristic analysis. For CAVI the Pettitt test detected three change points for the years 1877, 1950, and 1983, which may correspond to the heuristically detected breakpoints in the years 1890, 1950, and 1981 (Table 2). In the case of CYV, the statistical test detected three change points in the years 1911, 1979, and 1996 that may correspond to the heuristically detected breakpoints in the years 1917, 1978, and 1995. For CH8, CH9, and CSAL, the comparison does not highlight any correspondence (Table 3).
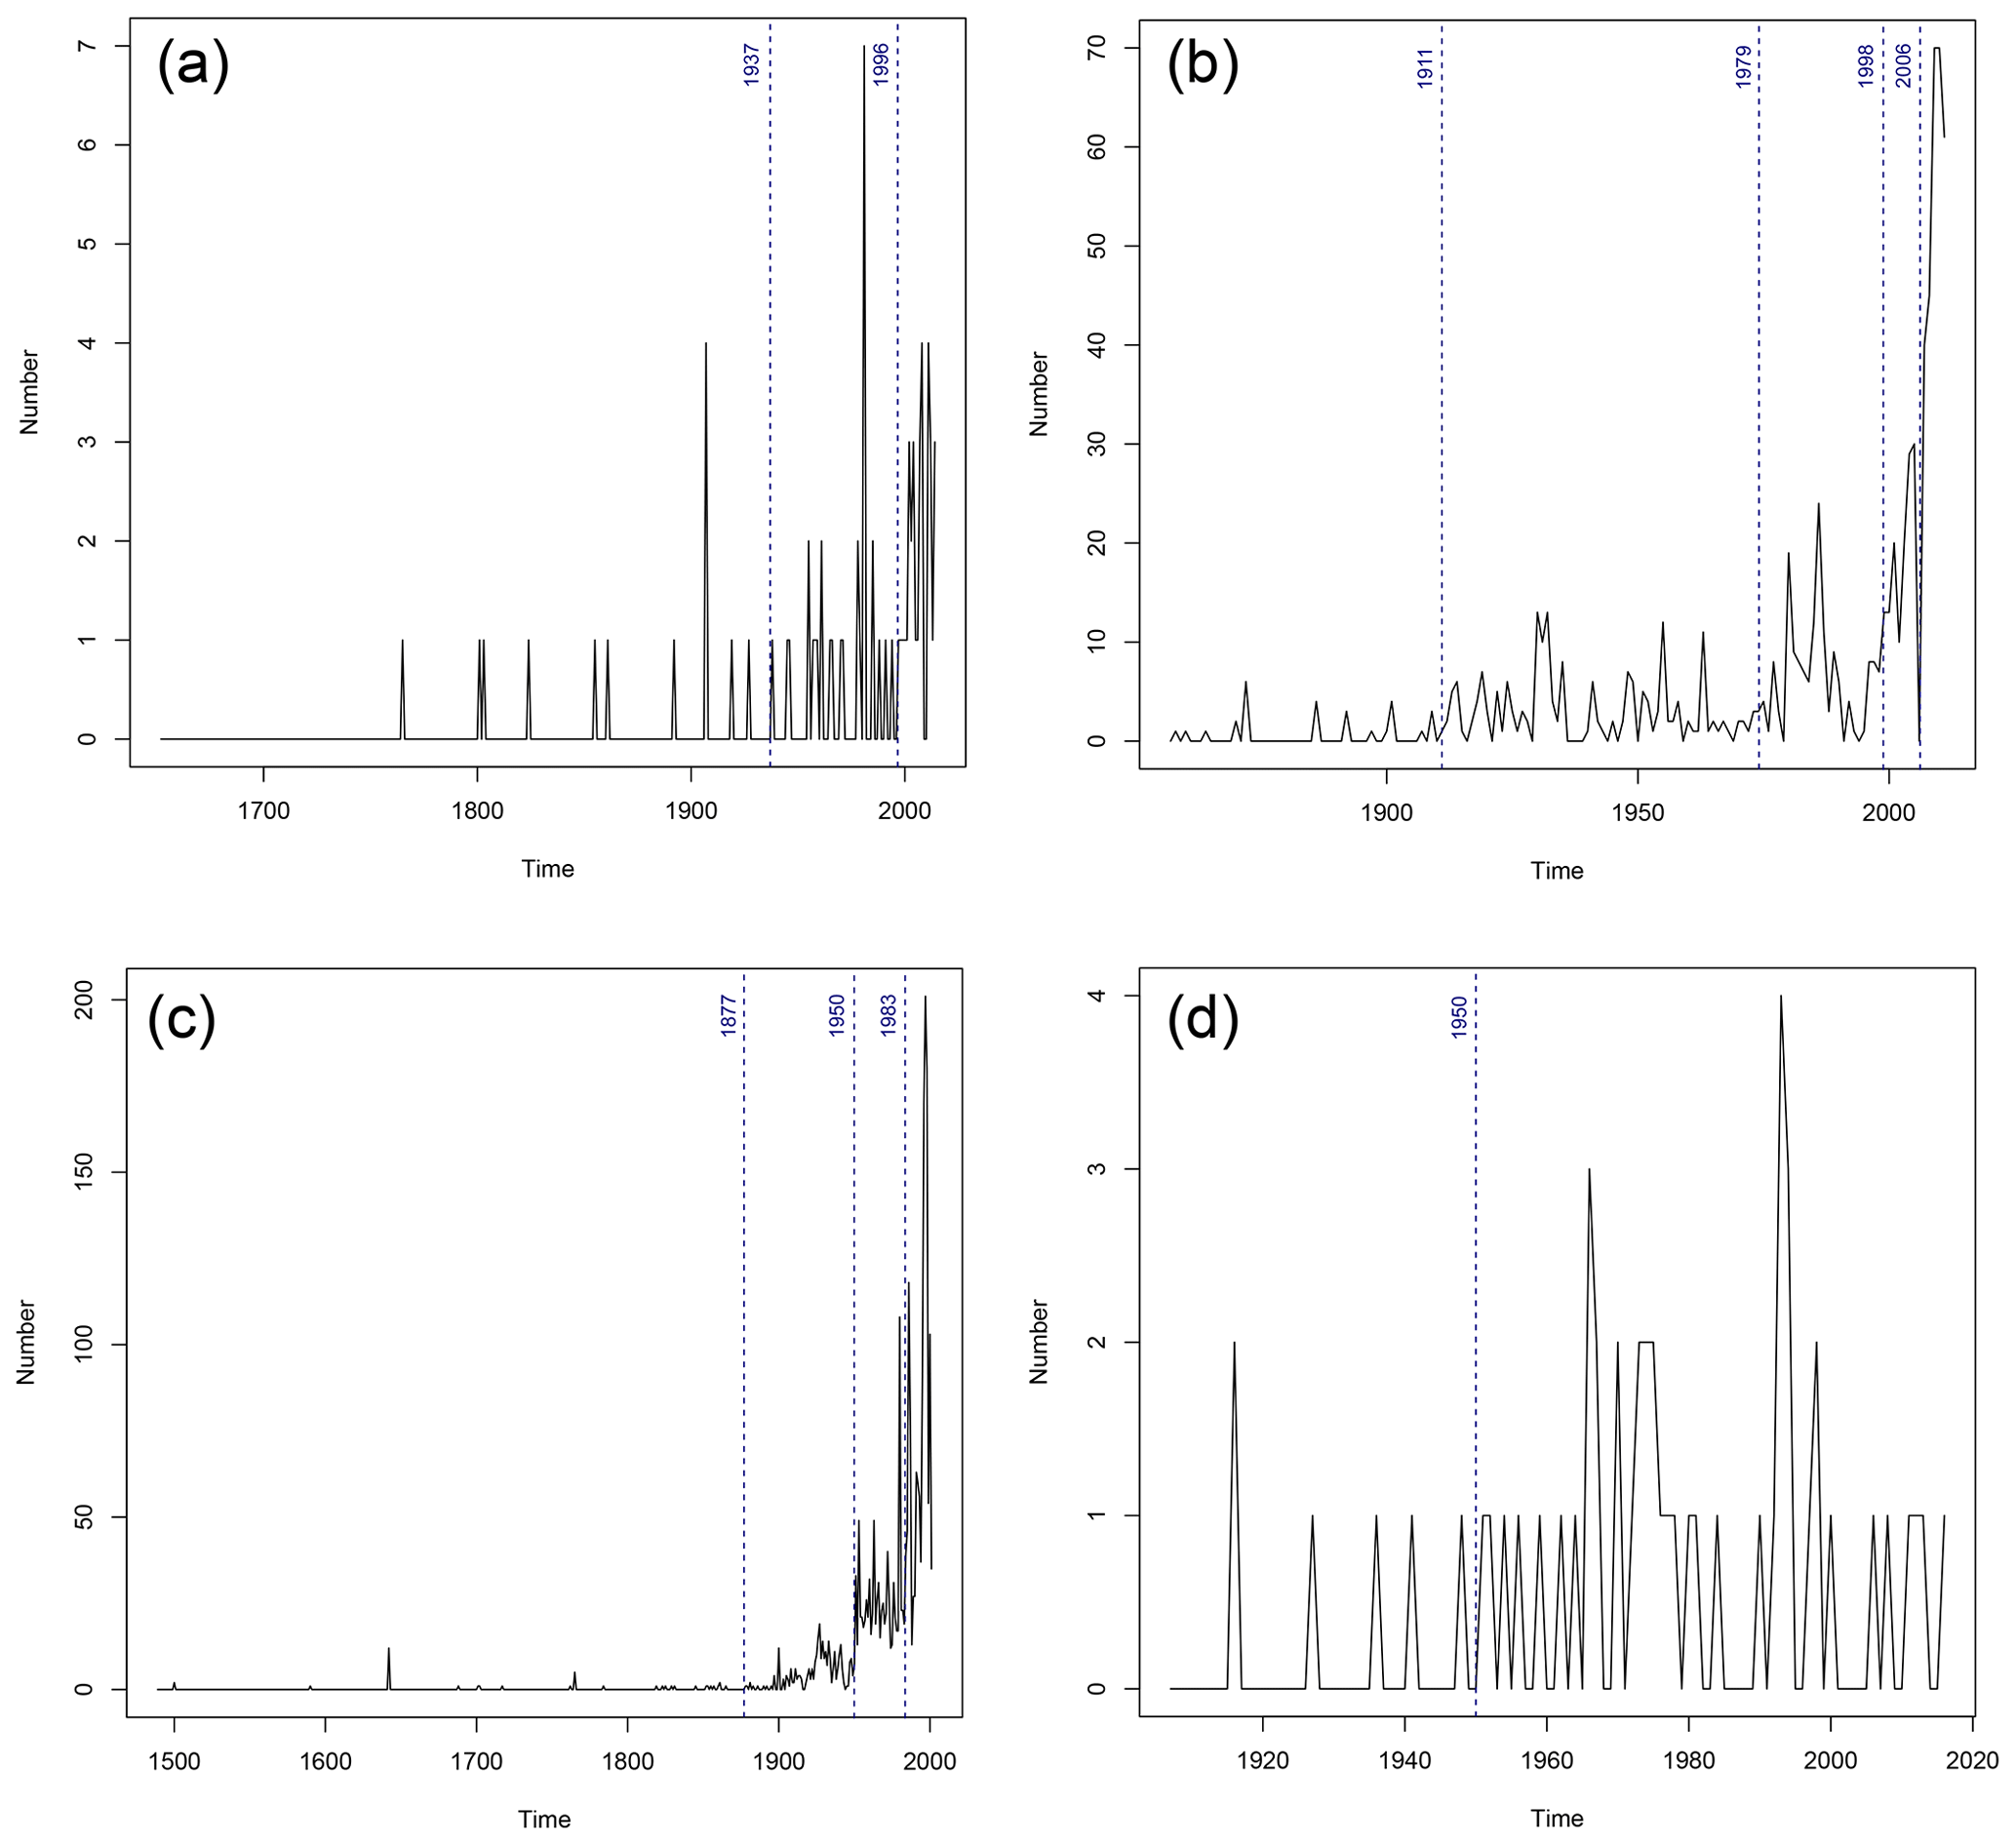
Figure 5Results of the Pettitt test for the different rockfall datasets: (a) CH8, (b) CYV, (c) CAVI, and (d) CSAL. Vertical dashed blue lines show the change points detected by the test. Datasets without detected change points are not shown.
Table 2Results of the heuristic manual analysis of the cumulative rockfall series. For the different catalogues (CH8, CYV, CAVI, CSAL, CH9), the heuristic analysis of the slope of the cumulative rockfall frequency enabled the delineation of different periods. For each period the slope (“Estimated rockfall rate”) gives information on the yearly average number of mapped rockfalls. Adjusted R2 quantifies the degree of fitting of the linear model assumed for fitting the data in the different periods.
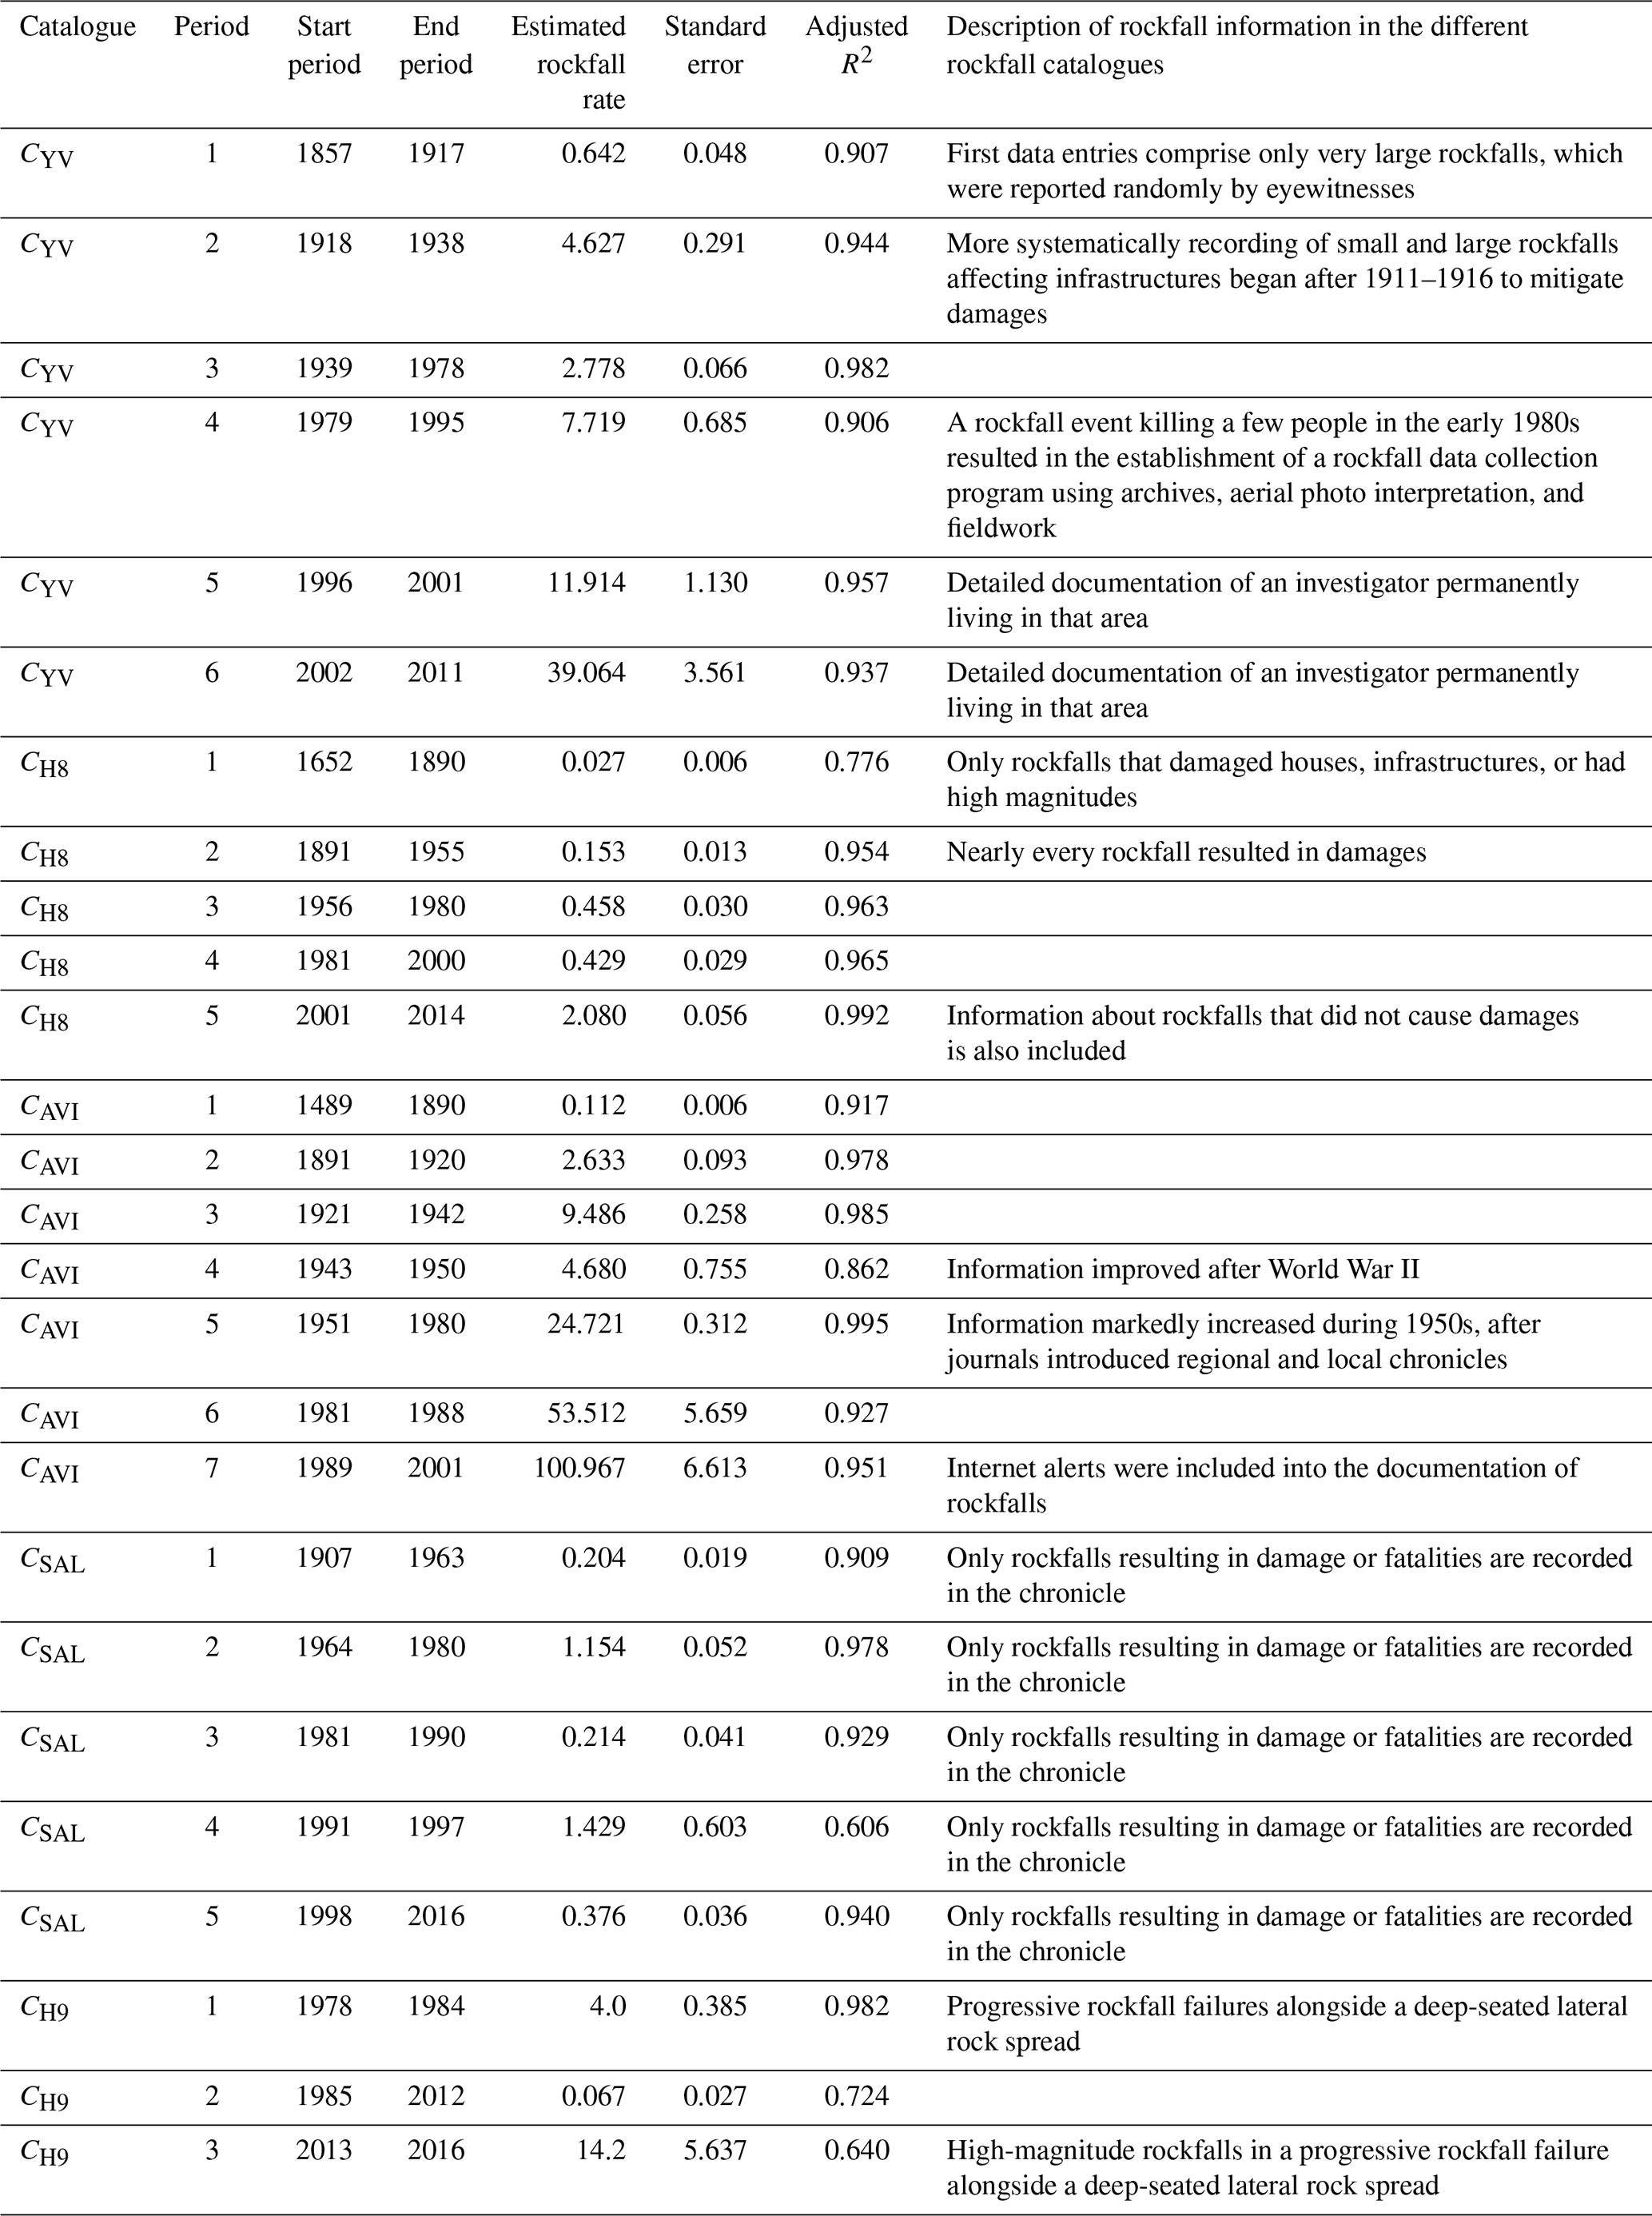
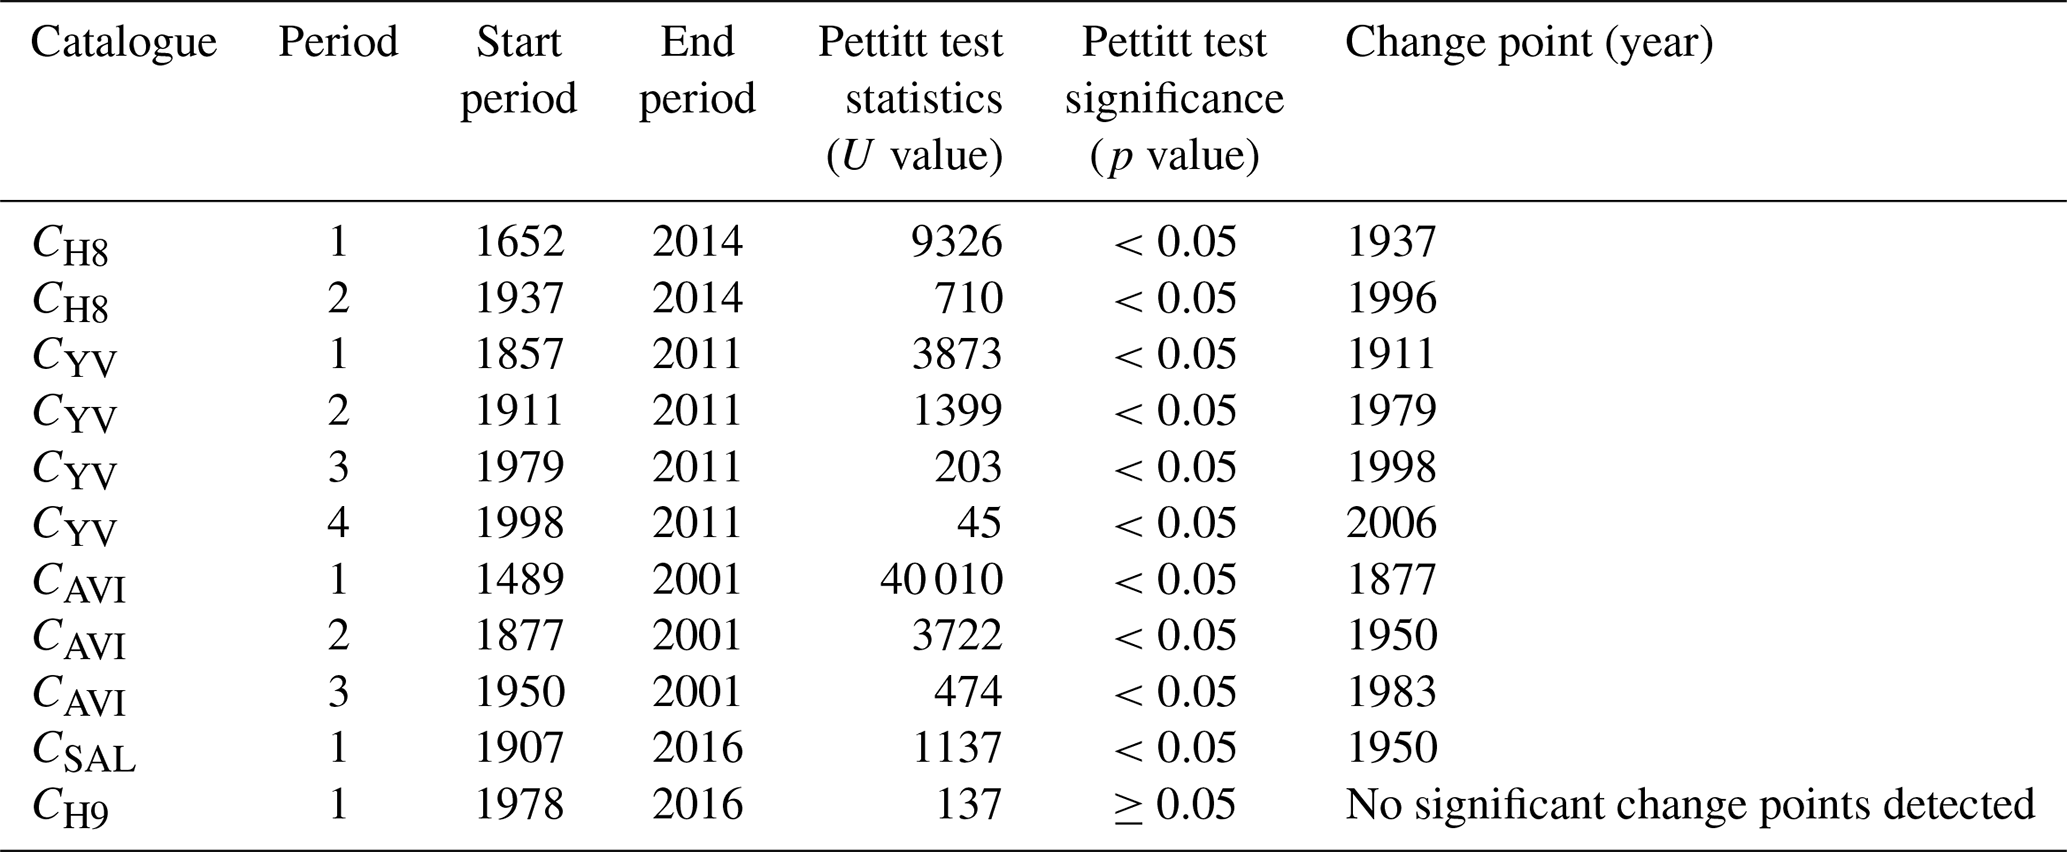
Table 3Results of the Pettitt test for the detection of change points in rockfall frequencies in temporal rockfall catalogues.
The catalogue CH9 contains data on historical high-magnitude rockfalls which occurred 28 d in the period November 2013 to November 2016 at the deep-seated lateral spread (Fig. 6). The analysis of the daily occurrence of rockfalls reveals that a total of 19 d during a 1-year period (December 2013 to December 2014) were subject to rockfalls; on 2 d several rockfalls were documented (Fig. 7). The first rockfall occurred on 27 December 2013, followed by 3 or 4 to 5 d periods (12 to 15 February; 27 to 27 February; and 1 to 4 March 2014) with a rockfall reported each day; several rockfalls occurred on 15 February (during the day) and 4 March 2014 (in the night), with another single rockfall on 27 March 2014. In April and May 2014 during 2 d periods (11 to 12 April and 7 to 8 May 2014) and on 2 May 2014 each day, a rockfall occurred. The comparison with the meteorological data does not reveal any significant correlation.
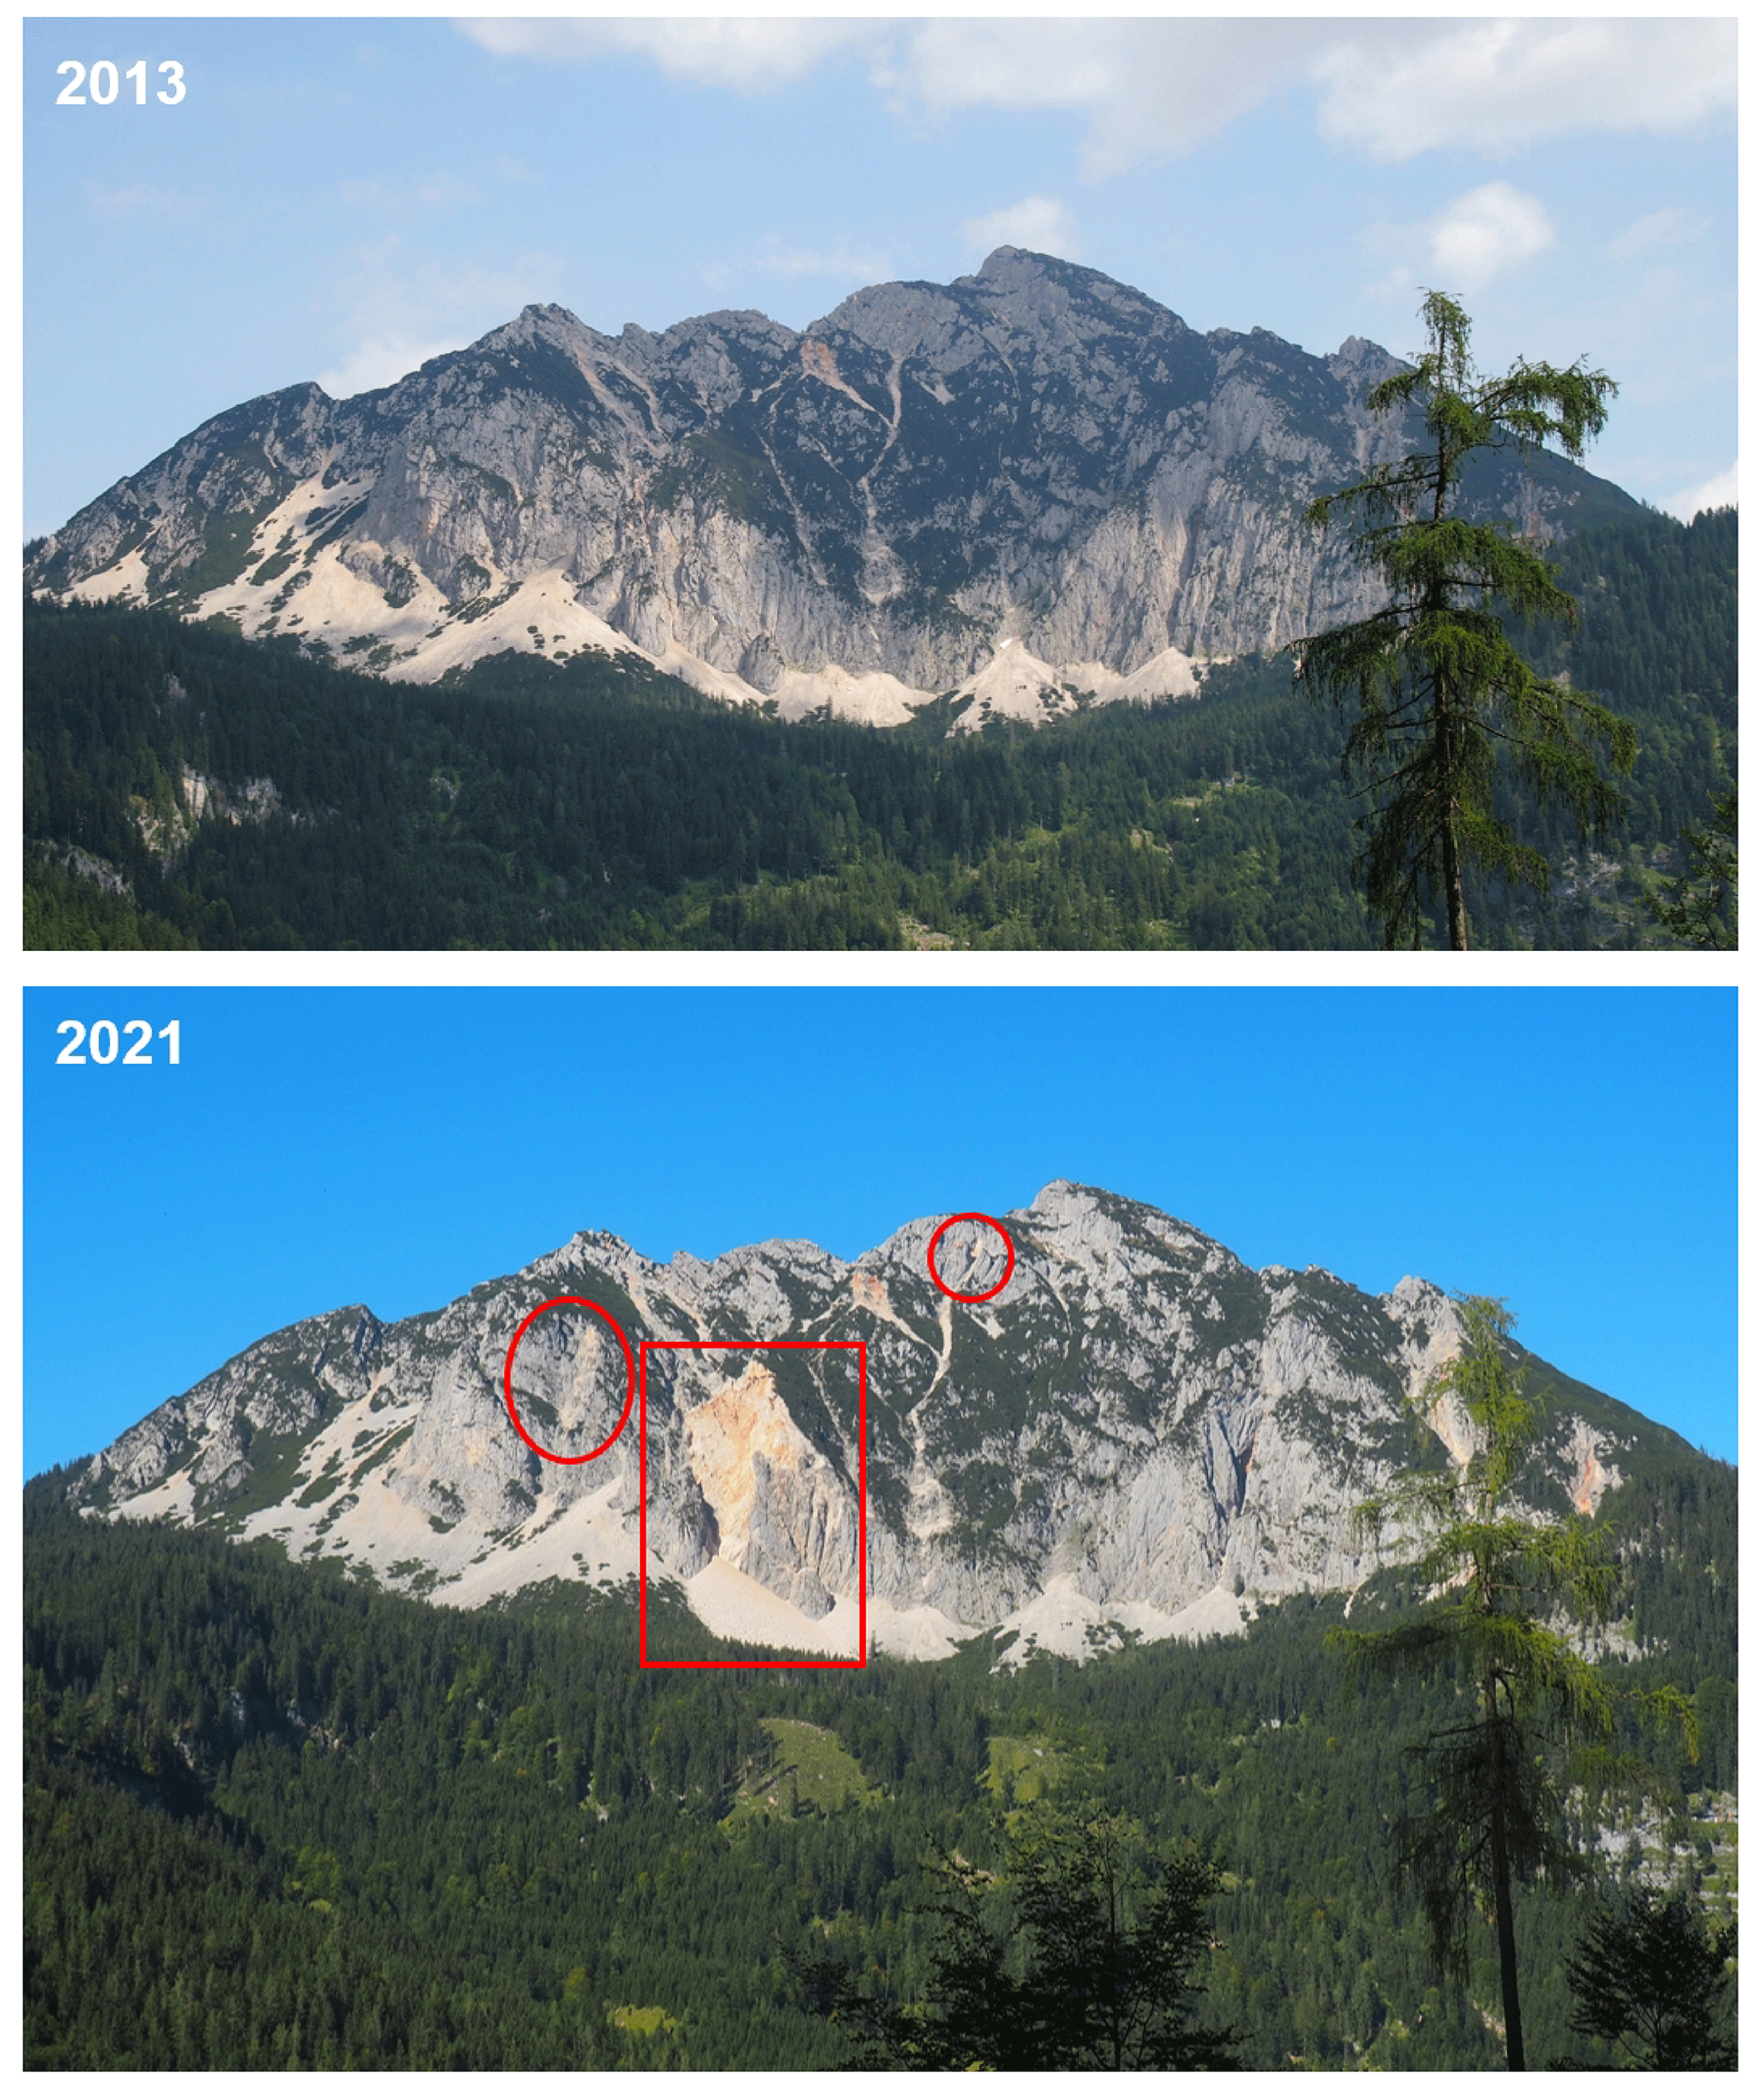
Figure 6High-magnitude rockfalls occurring always in the same rockfall source area (progressive failure) alongside a large rock spread (photos taken July 2013 and September 2021 by Sandra Melzner; see Melzner et al., 2017).
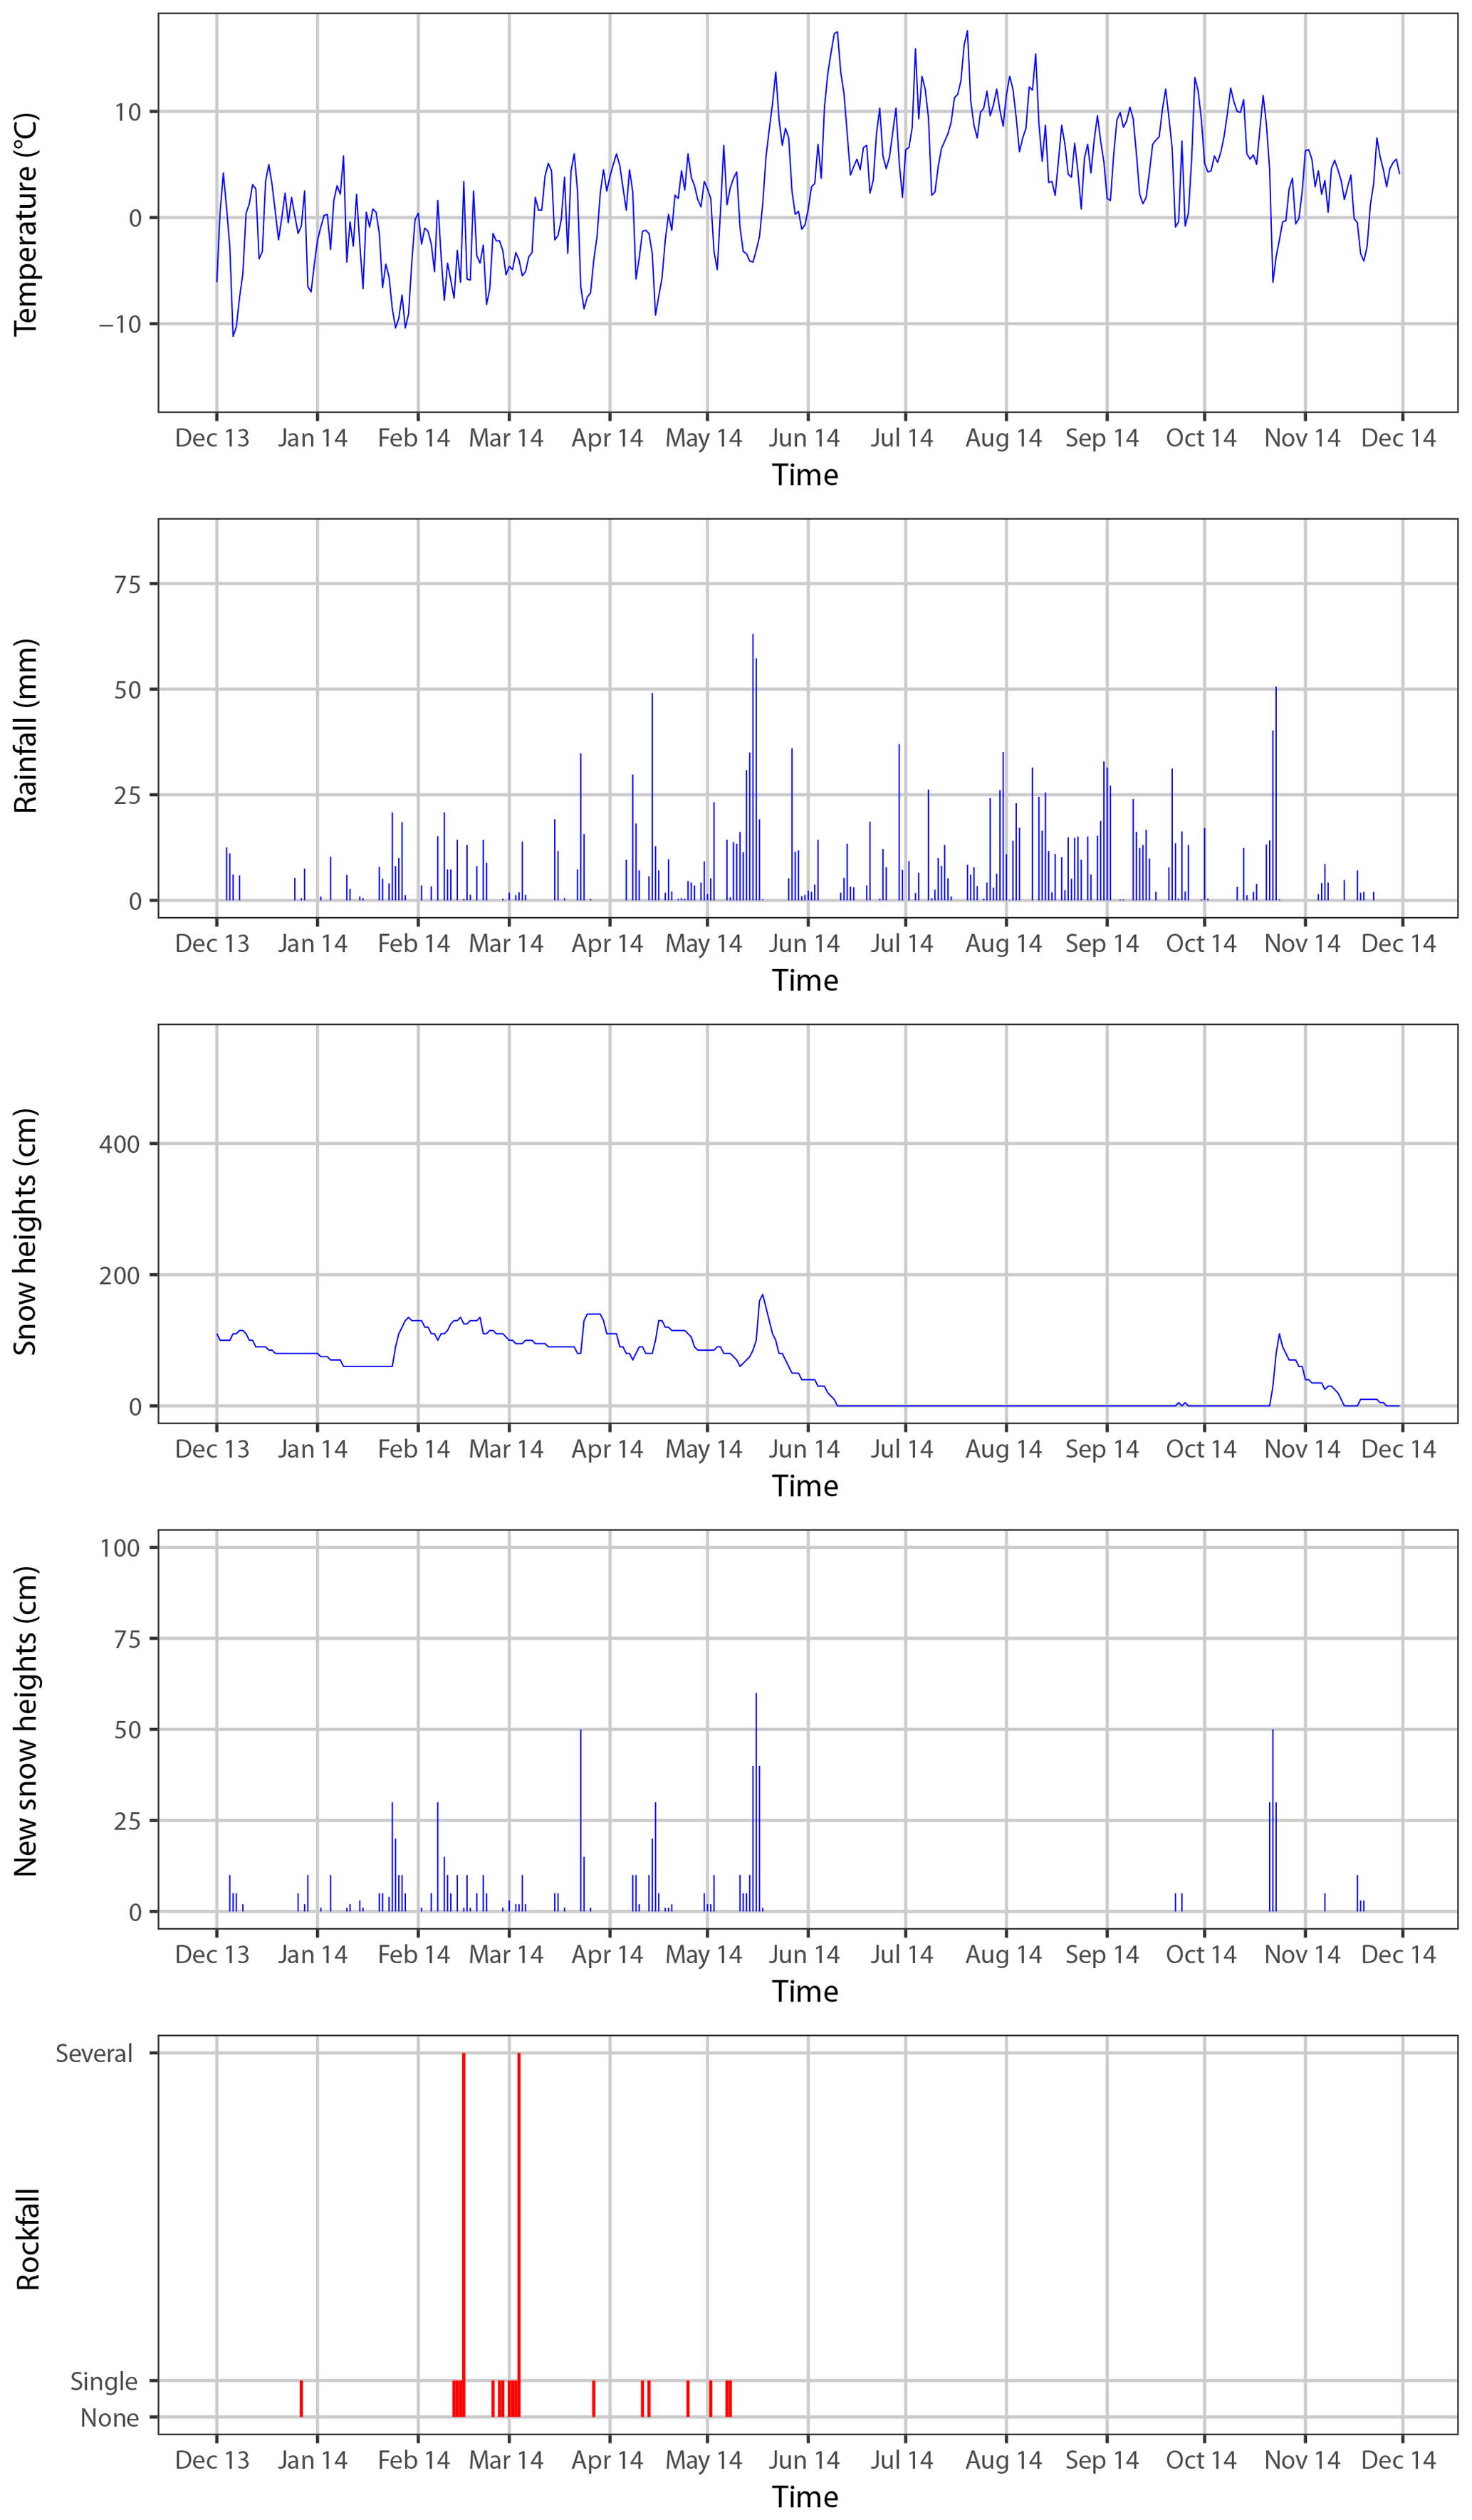
Figure 7Comparison of rockfalls with climatic conditions (new snow, snow heights, rainfall, temperature). Rockfall data collected by questionnaire/diary of an eyewitness (a hunter) who permanently lives in this remote area. Data represent only high-magnitude rockfalls always in the same rockfall source area (progressive failure).
The results of the analysis of catalogue CSAL (Figs. 8 and 9) show that the majority of the events resulted in property damage, but 71 process events also claimed fatalities or injured persons (number: 100). For 62 event entries no information on property damage or personal injury was included, and for 17 events it was explicitly noted that no personal injury or property damage was caused by the event. The personal injuries investigated were primarily caused by fluviatile processes. In the case of gravitational mass movements, only rockfall resulted in fatalities: a total of 15 deaths and 10 injuries were recorded due to rockfalls. A total of 31 people were killed and 13 injured in snow avalanches, with 14 deaths, 4 injured, and more due to storms and thunderstorms (exact number of injured is not mentioned in two chronicle entries). Figure 9 displays that major property damage is caused by floods, but most deaths are caused by rockfalls.
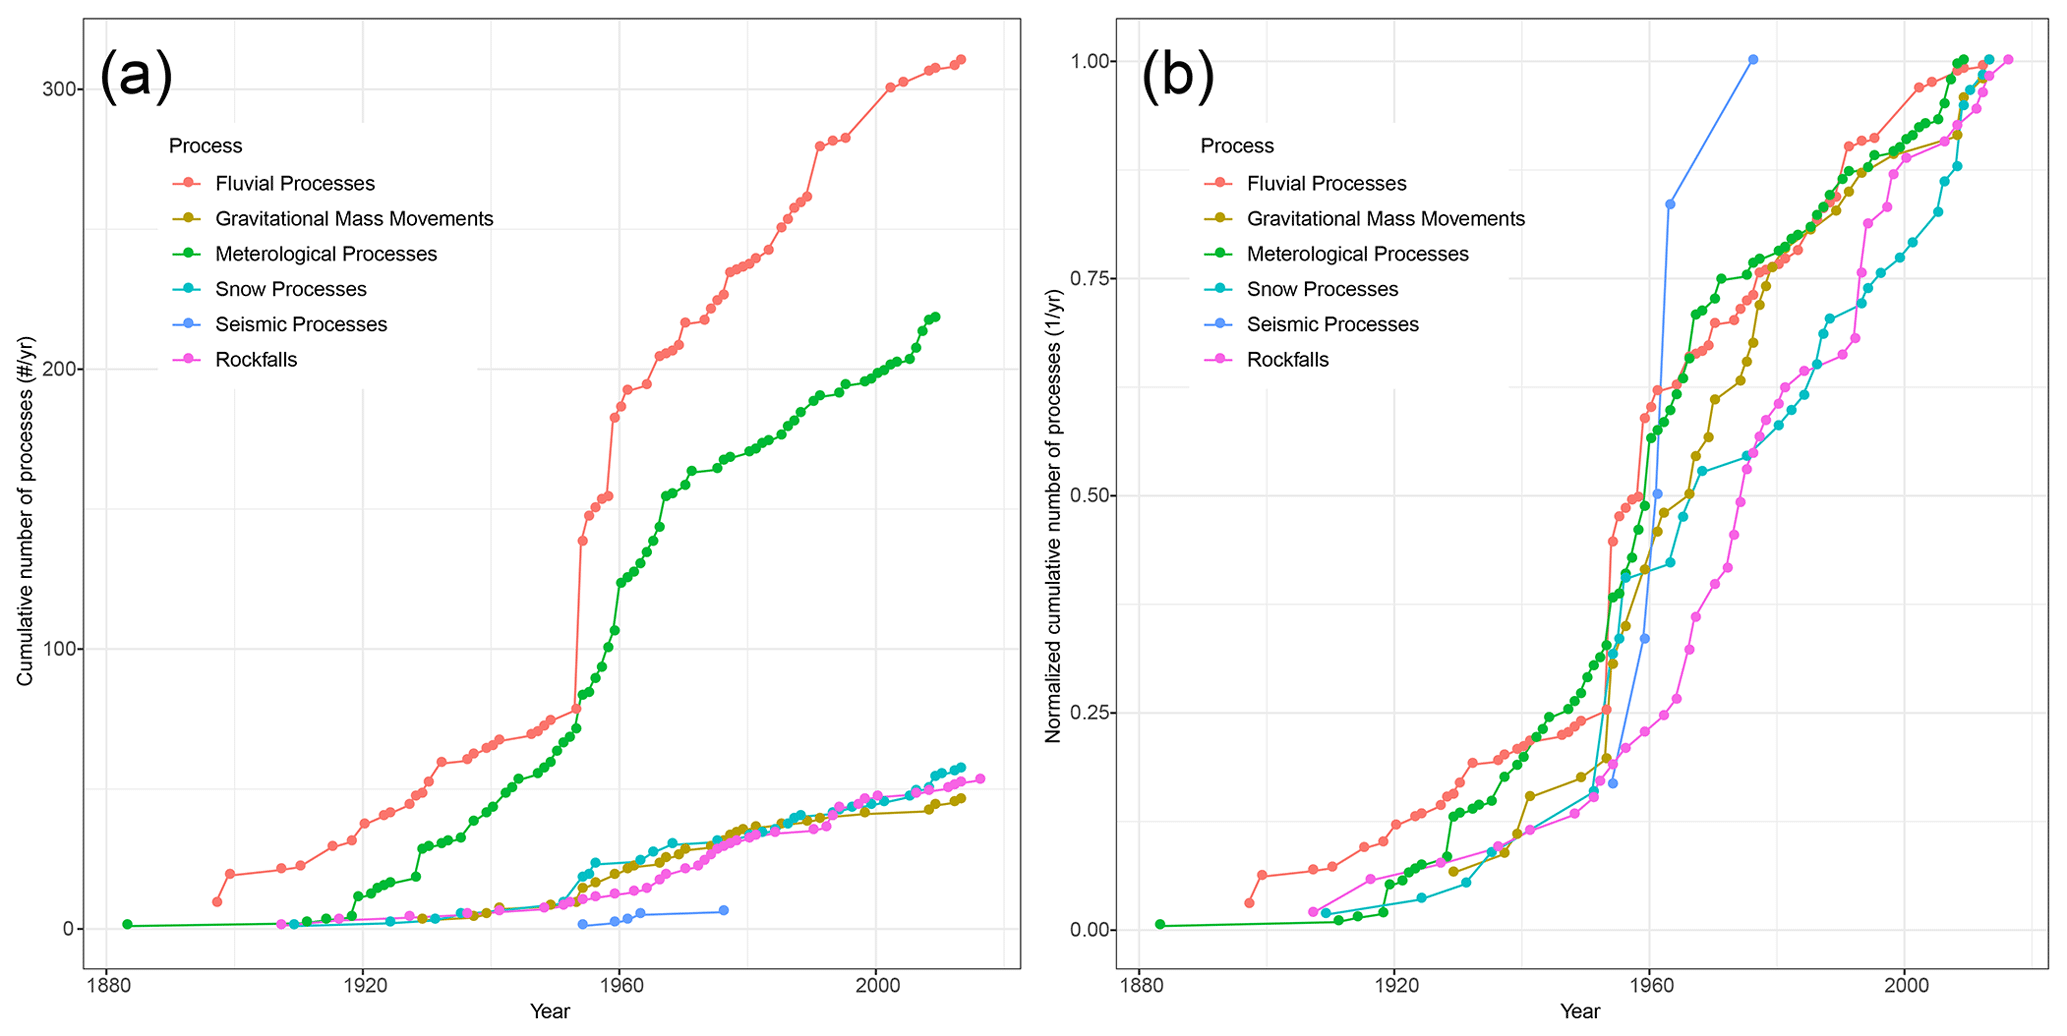
Figure 8Comparison of the cumulative number of different natural processes (NCR, as a function of year) of the catalogue CSAL compiled by the review of the chronicles of the police department in Austria.
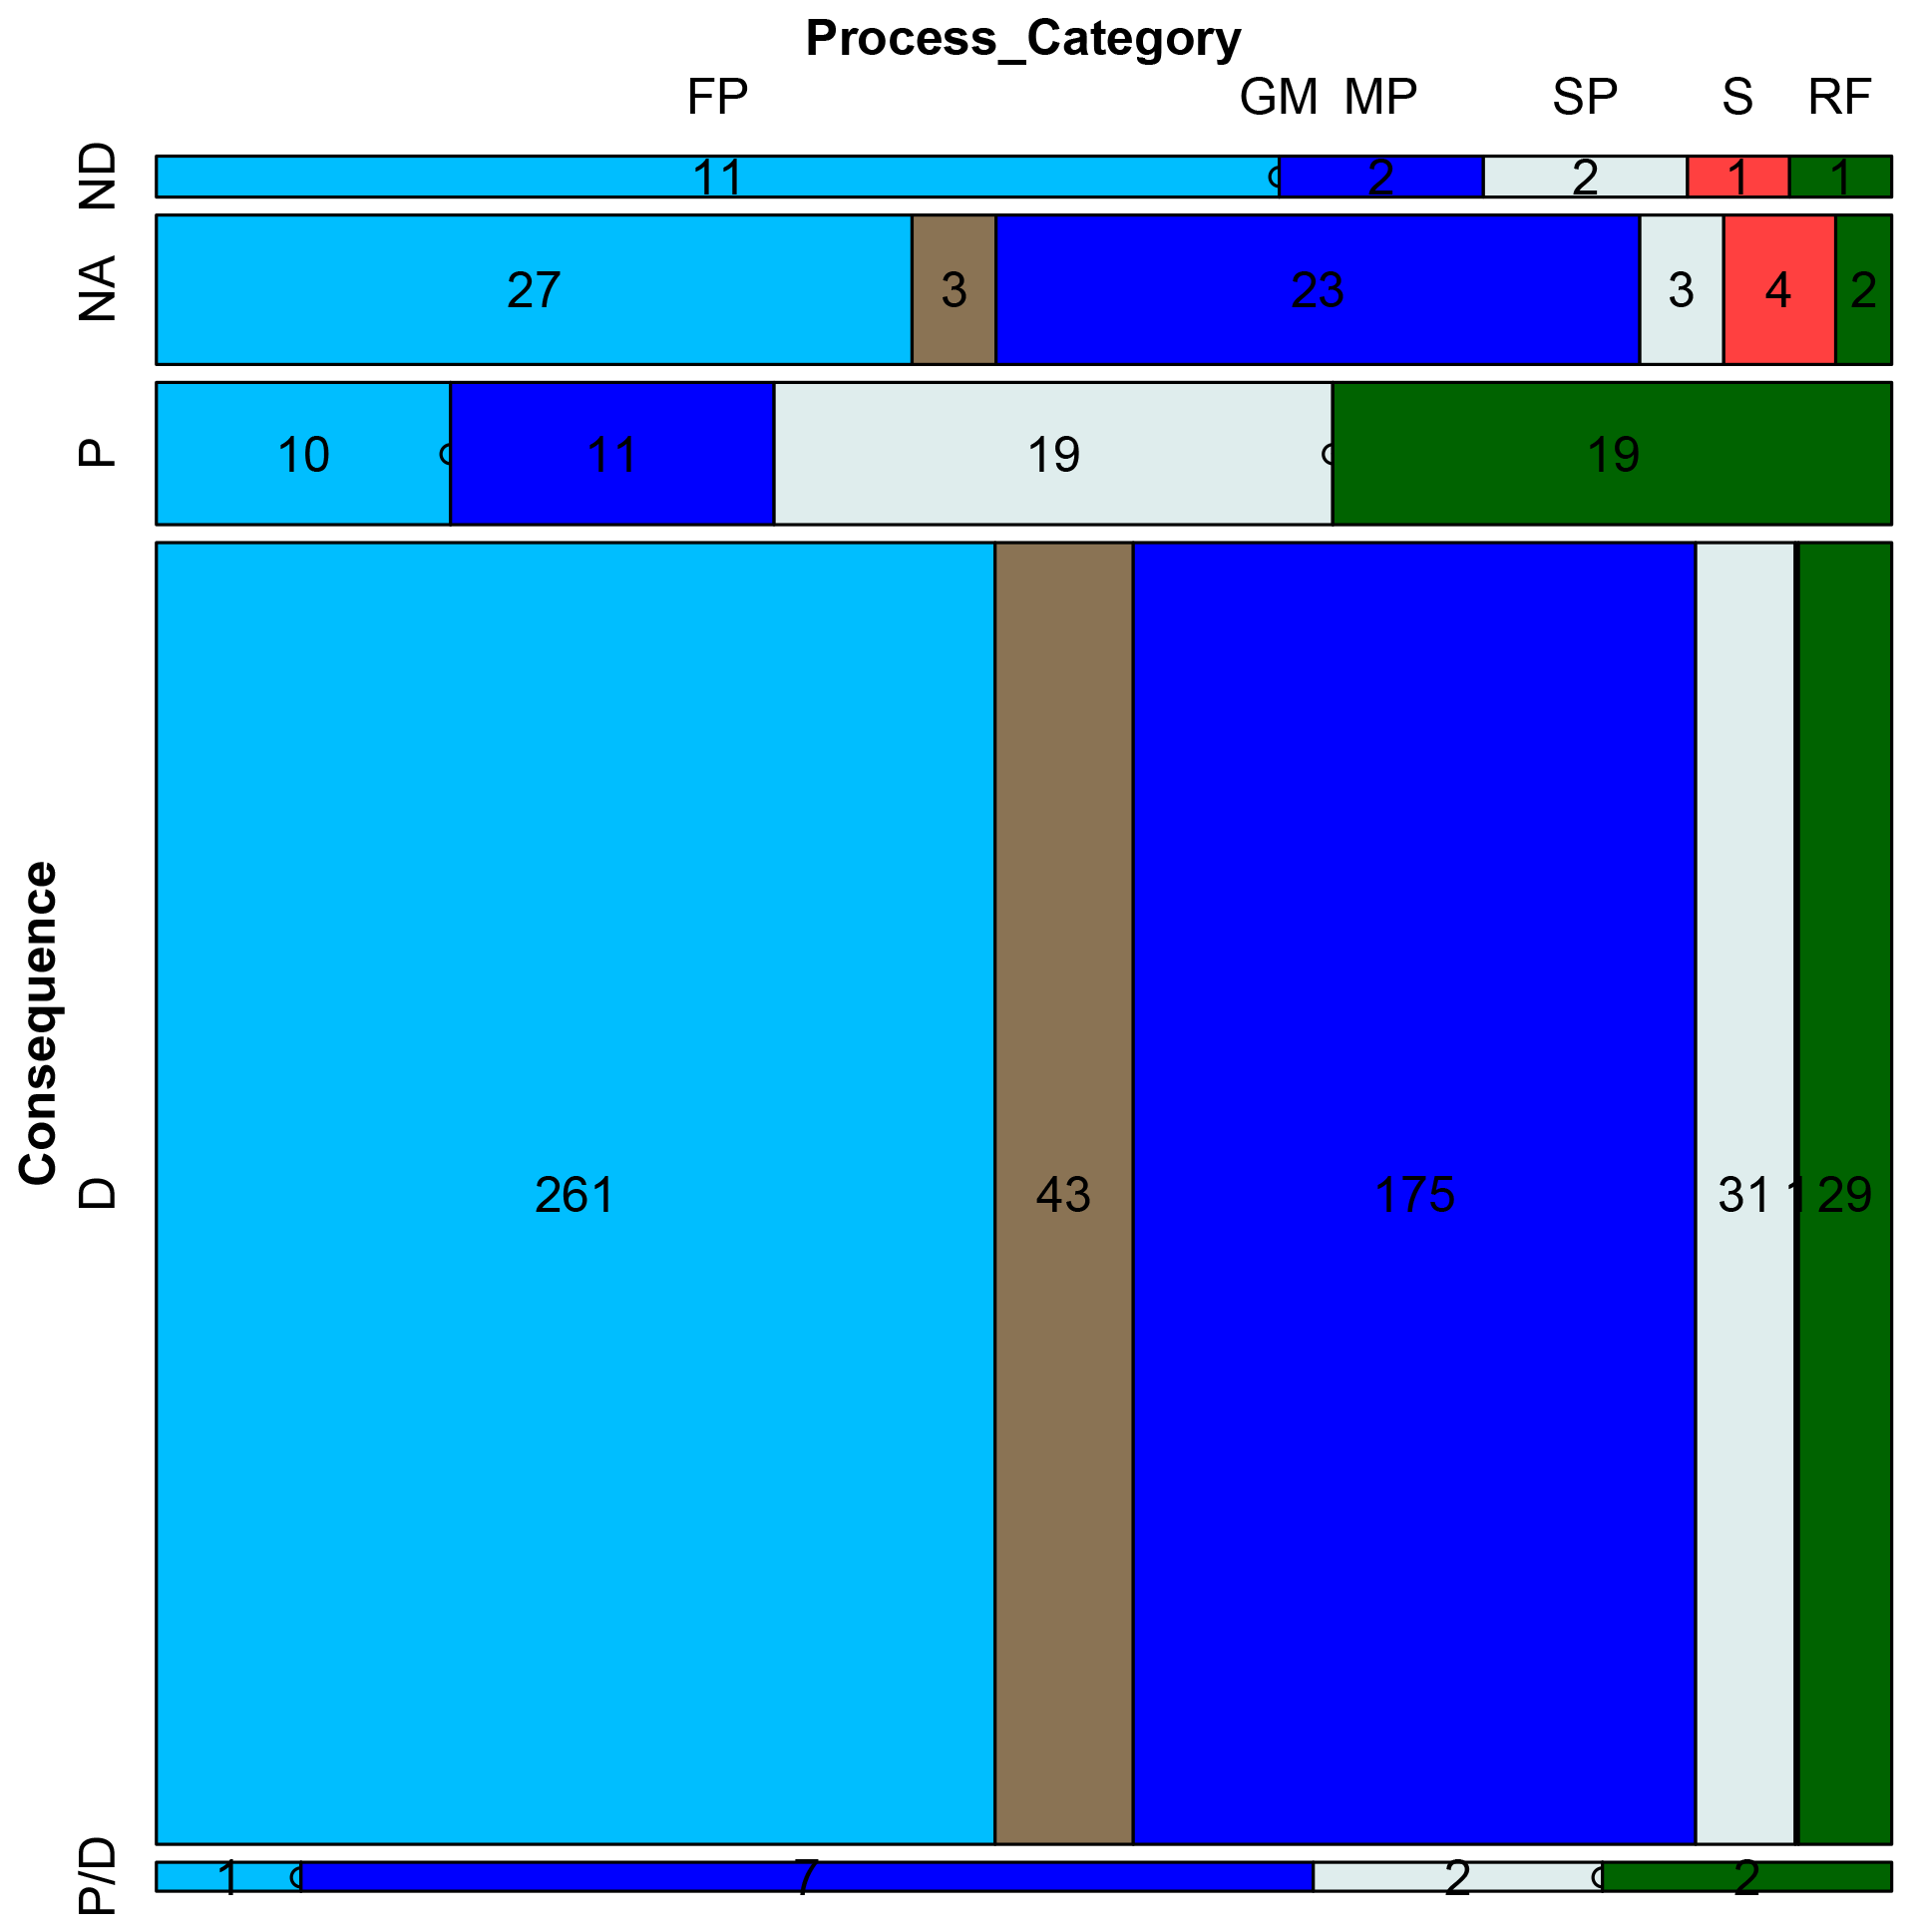
Figure 9Relationship consequences and natural processes of the catalogue CSAL compiled by the review of the chronicles of the police department in Austria. P/D – damage and fatalities, D – damage, P – fatalities, NA – no information in the historical account, ND – no consequences. FP – fluvial processes (light blue), GM – gravitational mass movement (brown), MP – meteorologic processes (blue), SP – snow processes (grey), S – seismic processes (red), and RF – rockfall (green).
The following facts can be summarized for catalogue CYV (Fig. 4 and Table 2) concerning the completeness and representativeness of data: (i) No data were available before 1851, which is the discovery year of the Yosemite Valley. (ii) First data entries comprise only very large rockfalls, which were reported randomly by eyewitnesses. (iii) More systematical recording of small and large rockfalls affecting infrastructures began after ∼1911–1916 to mitigate damages. (iv) Increasing tourist numbers and thus higher risk required a more systematical collection of rockfall data resulting in a higher number of reported rockfalls in the catalogue. (v) A rockfall event that killed a few people in the early 1980s resulted in the establishment of a rockfall data collection program using archives, aerial photo interpretation, and fieldwork. (vi) The high rockfall rates in recent years are due to very detailed documentation of an investigator permanently living in the region (Wieczorek and Snyder, 2004).
In contrast, the analysis of the completeness and representativeness of the catalogue CH8 time series (Fig. 4 and Table 2) showed the following: (i) In the first period only rockfalls were reported in which there were damaged houses or infrastructure or ones of high magnitude. (ii) In the second period nearly every documented rockfall resulted in damages (Fig. 4). (iii) In the last, most recent, period rockfalls were included in which damage was not caused. (iv) Type and extent of damage were most of the times provided; volume was reported in a qualitative manner. (v) Significant changes in the abundance and distribution of the elements at risks, including the population, are important factors influencing rockfall rates. (vi) The effects of preventive measures are only relevant in very few parts in the last period (Melzner, 2015, 2017; Melzner et al., 2019). In contrast to CYV, the area has a very long settlement history; thus very old rockfalls could be recorded by eyewitnesses.
The analysis of the completeness and representativeness of the catalogue CAVI (Fig. 4 and Table 2) showed that, with a systematic collection of data focusing on rockfalls which resulted in consequences, a very comprehensive countrywide database could be established. The following facts can be stressed: (i) Journals emphasize high-magnitude rockfalls. (ii) Information about rockfalls improved after World War II and markedly increased during the 1950s (i.e. change detected by both heuristic and statistical tests), after journals had introduced regional and local chronicles. (iii) Newsletter articles provided quality data on the dates but not the time and the triggering mechanism of occurrence. (iv) The exact location was rarely reported and only for single, large rockfalls. (v) Economic estimates of the type and extent of damage were provided in a few articles; material and volume were seldom reported. (vi) Review of technical and scientific documents provide high-quality data for a small number of events, rarely describe extent of damage, or contain social and economic consideration. (vii) Interviews with experts provide general information on a limited number of rockfalls (Guzzetti et al., 1994; Salvati et al., 2010).
The European datasets (CAVI, CSAL and CH8) show a common increase between 1950 and 1956 that could be possibly related to the increase of data source availability in the period of recovery and reconstruction after the Second World War, which did not affect the USA (CYV). This change was detected by both heuristic and statistical procedures. In all the datasets, except the last period of rockfall rates of CSAL, the rockfall frequency increased with some fluctuations. Catalogue CH9 forms an exception to being a progressive rockfall failure, showing two periods of higher rockfall rates.
The main findings on the comparison of the catalogues of historical rockfalls can be summarized as follows: constant, high rates of yearly cumulative number of rockfall rate are recognizable, if the data were collected continuously by an expert, or the data were collected with the internet and social media. Low rates of cumulated rockfalls can be justified by (i) large-magnitude rockfalls being preferentially reported, number of smaller rockfalls are underestimated, (ii) rockfalls with no consequences (fatalities and damage) are underrepresented; (iii) rockfalls in remote areas; and (iv) rockfalls during night are often not recorded or reported. Recurring visits of rockfall areas and a close contact with local people/authorities raise the number of reported rockfalls. Geographic location of information is very accurate if the rockfall resulted in a consequence. In very old historical sources, the geographical location of a rockfall is given by specific local names which do not appear on recent maps. Further, in the Alps, it is common to name places or single houses after the name of residents, which are not named in base data such as topographic maps. An accurate geographical positioning of this information is only possible with the support of the knowledge of local habitants or experts. Personal relations to the local people due to recurring visits increase the results of data acquisition. Common to historical rockfall records is that estimates of rockfall size are incomplete, size estimates are given in relative terms (i.e. small, large, very large), or they are estimated in pre-defined size classes. This makes it very difficult to establish frequency–size relations, the data being biased.
The analysis of the relationship of the catalogue CH9 with the meteorological data does not show any significant correlation. This might be due to the fact that the weather station is located a few hundred metres lower down in the valley. Or this might indicate that rockfalls were initiated by the acceleration in the lateral spreading of the deep-seated slope deformation (Melzner et al., 2017), thus giving relative information about the activity phases of this deep-seated rock spread. High-frequency low-magnitude rockfalls occur often in this active spreading area and have not been recorded systematically. The analysis of an optic photo monitoring system showed that this method is more suitable to detect large-volume rockfalls. Especially the fast-changing climatic conditions (light, fog, rain) in such a high alpine area make it difficult to apply semi-automatic or automatic analysis methods for the detection of rockfalls.
Finally, catalogue CSAL showed that a systematic review of police chronicles for a selected pilot area (covering different geological units and reliefs) allows the establishment of a very comprehensive database of different processes (Melzner, 2016; Melzner and Braunstingl, 2017), although non-damaging rockfalls are still underrepresented. Chronicles of police departments in Austria provide condensed information about the susceptibility of a (large) region towards different natural processes and risk data. The subjective feelings and interests of the police inspectors have a strong effect on the level of detail of the entries. Most of the natural events in this catalogue resulted in damage and personal injury.
The estimation of the temporal frequency of the involved rockfall processes is an important part in hazard and risk assessments. Different methods can be used to collect and analyse rockfall data. Depending on lithology, recent rockfall scarps or rockfall boulders may rapidly lose their fresh appearance or are removed by the habitants, which makes it difficult to estimate the time of occurrence of rockfalls and a corresponding return period of the rockfalls in the field. Monitoring of rockwalls in Alpine relief is most of the time not practicable or affordable by the communities.
The main recommendations for the definition of data collection strategies and of the applicability of historical catalogues arising from these findings are as follows:
-
Historical rockfall data often do not contain quantitative information on rockfall size. Qualitative size or damage information has to be interpreted according to the rockfall intensity.
-
Rockfalls triggered during meteorological extreme events (storms, floods, and wildfires) may not be recorded in the rockfall catalogue.
-
Historical rockfall catalogues for specific analyses may result in a reduced rockfall sample and have to be used with caution for hazard and risk analysis.
-
Progressive rockfall failures may stay active many years; correlations with climatic data from public weather stations should be conducted over longer time spans and carefully evaluated.
-
Frequency–size distributions are highly accurate on single cliffs, where a site-specific monitoring system is installed.
-
Repeated study site visits and experience in conducting interviews paired with empathy and knowledge of human nature increase the quality and representativeness of historical rockfall catalogues.
From a data collection point of view, research activities in different archives enable the compilation of rockfall inventories and rockfall catalogues (with information on data source and definition of quality criteria). Smart use of the data (e.g. a careful selection of representative samples) is of high importance in hazard and risk assessments.
From a statistical point of view, rockfall datasets are nearly always incomplete. Commonly, only rockfall data samples are available and investigating their statistical representativeness is of paramount importance. Simple heuristic and statistical frequency-based methods can be used for the basic rockfall catalogue analysis and characterization. However, additional non-parametric methods have to be developed to cope with fewer data entries and close data gaps and to support the identification of a shared standard methods for rockfall time series analysis. The detection and handling of breakpoints/change points may avoid inappropriate use of data series and related models in hazard and risk analysis.
Accurate data collection approaches and the application of statistical methods on existing rockfall data series as reported in this study should be better considered in rockfall hazard and risk assessments in the future.
The analyses performed have been conducted using different open-source scripts coded in R (an open-source programming language). Such scripts have not been completely structured for the use by general users, and proper documentation is still missing. However, this software will be made available upon request to CNR-IRPI (contact person Mauro Rossi).
The underlaying research data are not public, and they have been made available to the authors for this specific study. However data will be available upon request by contacting GeoSphere Austria (formerly Geological Survey Austria, contact person Robert Supper), CNR-IRPI (contact person Paola Salvati) and National Park Service (contact person Greg Stock).
The supplement related to this article is available online at: https://doi.org/10.5194/nhess-23-3079-2023-supplement.
SM: conceptualization and coordination, data collection, selection of datasets, statistical analysis of data, table/figure drafting and preparation of figures, and manuscript writing. MR: preparation of R codes and statistical analysis of data, table/figure drafting, and manuscript writing. MC: review of final manuscript. JH: review of final manuscript.
The contact author has declared that none of the authors has any competing interests.
Publisher's note: Copernicus Publications remains neutral with regard to jurisdictional claims in published maps and institutional affiliations.
The Geological Survey of Austria is thanked for supporting Sandra Melzner during the paper completion, also after leaving the Geological Survey. Special thanks go to Fausto Guzzetti, Paola Reichenbach, Mauro Cardinali, and Paola Salvati (CNRI, IRPI, Perugia) for several discussions on the topic and the AVI dataset and thanks to Gerald F. Wieczorek (USGS) and Greg Stock (NPS) for discussions, the invitation to Yosemite National Park, and the Yosemite rockfall dataset. The data acquisition was conducted in the framework of the GEORIOS project by the Geological Survey of Austria (GBA), NARIS project (funded by GBA and the Federal State Government of Salzburg). Climatic data were provided by eHYD. Special thanks go to the community of Hallstatt (in particular Karl Wirobal and Hans-Joergen Urstöger from the Museum Hallstatt, Stefan Janu, Friedrich Idam, and Klaus Reisenauer) for providing information about rockfall events and the Salzburg State Police Department and the employees of the various police inspections supporting the analysis of the police chronicles. Thank you to CNR-IRPI for funding the open-access publishing of the present article. Thank you to the three reviewers for their valuable comments on the manuscript and the editor, Paolo Tarolli, for managing the publication process.
The preparation and writing of the article was financially supported with internal funds of (i) GEO GEOCHANGE Consulting e.U., (ii) Institute of Mountain Risk Engineering (IAN), University of Natural Resources and Life Sciences (BOKU), (iii) Research Unit Community Ecology, Swiss Federal Research Institute (WSL), (iv) Department of Civil Engineering and Natural Hazards, University of Natural Resources and Life Sciences (BOKU), and (v) Istituto di Ricerca per la Protezione Idrogeologica (IRPI), Consiglio Nazionale delle Ricerche (CNR). The costs for open-access publication was financially supported with internal funds of Istituto di Ricerca per la Protezione Idrogeologica (IRPI), Consiglio Nazionale delle Ricerche (CNR).
This paper was edited by Paolo Tarolli and reviewed by Daniel Costantini, Roberto Sarro, and one anonymous referee.
Agliardi, F., Crosta, G. B., and Frattini, P.: Integrating rockfall risk assessment and countermeasure design by 3D modelling techniques, Nat. Hazards Earth Syst. Sci., 9, 1059–1073, https://doi.org/10.5194/nhess-9-1059-2009, 2009.
Antonini, G., Ardizzone, F., Cardinali, C., Galli, M., Guzzetti, F., and Reichenbach, P.: Surface deposits and landslide inventory map of the area affected by the 1997 Umbria-Marche earthquakes, Boll. Soc. Geol. Lt., 1, 843–853, 2002.
Brown, R. L., Durbin, J., and Evans, J. M.: Techniques for Testing the Constancy of Regression Relationships over Time, J. Roy. Stat. Soc. Ser. B, 37, 149–192, 1975.
Chau, K. T., Wong, R. H. C., Liu, J., and Lee, C. F.: Rockfall Hazard Analysis for Hong Kong Based on Rockfall Inventory, Rock Mech. Rock Eng., 36, 383–408, https://doi.org/10.1007/s00603-002-0035-z, 2003.
Corominas, J., Mavrouli, O., and Ruiz-Carulla, R.: Magnitude and frequency relations: are there geological constraints to the rockfall size?, Landslides, 15, 829–845, https://doi.org/10.1007/s10346-017-0910-z, 2017.
Crosta, G. B., Agliardi, F., Frattini, P., and Lari, S.: Key Issues in Rock Fall Modeling, Hazard and Risk Assessment for Rockfall Protection, in: Engineering Geology for Society and Territory – Volume 2, Springer, Cham, 43–58, https://doi.org/10.1007/978-3-319-09057-3_4, 2015.
De Biagi, V., Napoli, M. L., Barbero, M., and Peila, D.: Estimation of the return period of rockfall blocks according to their size, Nat. Hazards Earth Syst. Sci., 17, 103–113, https://doi.org/10.5194/nhess-17-103-2017, 2017.
eHYD: Der Zugang zu hydrographischen Daten Österreichs, https://ehyd.gv.at/ (last access: 28 December 2021), 2021.
Gilbert, R. O.: Statistical methods for environmental pollution monitoring, John Wiley & Sons, ISBN 0-471-28878-0, 1987.
Grant, A., Wartman, J., Massey, C., Olsen, M. J., O'Banion, M., and Motley, M.: The impact of rockfalls on dwellings during the 2011 Christchurch, New Zealand, earthquakes, Landslides, 15, 31–42, https://doi.org/10.1007/s10346-017-0855-2, 2018.
Guzzetti, F. and Tonelli, G.: Information system on hydrological and geomorphological catastrophes in Italy (SICI): a tool for managing landslide and flood hazards, Nat. Hazards Earth Syst. Sci., 4, 213–232, https://doi.org/10.5194/nhess-4-213-2004, 2004.
Guzzetti, F., Cardinali, M., and Reichenbach, P.: The AVI project: A bibliographical and archive inventory of landslides and floods in Italy, Environ. Manage., 18, 623–633, https://doi.org/10.1007/BF02400865, 1994.
Guzzetti, F., Mondini, A. C., Cardinali, M., Fiorucci, F., Santangelo, M., and Chang, K.-T.: Landslide inventory maps: New tools for an old problem, Earth-Sci. Rev., 112, 42–66, 2012.
Historical rock falls in Yosemite National Park: California (1857–2011), https://pubs.er.usgs.gov/publication/ds746 (last access: 29 January 2018), 2018.
Huang, R. Q. and Li, W. L.: Analysis of the geo-hazards triggered by the 12 May 2008 Wenchuan Earthquake, China, Bull. Eng. Geol. Environ., 68, 363–371, https://doi.org/10.1007/s10064-009-0207-0, 2009.
Janeras Casanova, M., Jara, J., Royán, M. J., Vilaplana, J., Aguasca, A., Fabregas, X., A. Gili, J., and Buxó, P.: Multi-technique approach to rockfall monitoring in the Montserrat massif (Catalonia, NE Spain), Eng. Geol., 219, 4–20, https://doi.org/10.1016/j.enggeo.2016.12.010, 2017.
Katz, O., Paola, R., and Guzzetti, F.: Rock fall hazard along the railway corridor to Jerusalem, Israel, in the Soreq and Refaim valleys, Nat. Hazards, 56, 649–665, https://doi.org/10.1007/s11069-010-9580-z, 2011.
Kendall, M. G.: Rank Correlation Methods, in: 4th Edn., Charles Griffin, London, ISBN 9780852641996, 1975.
Kobayashi, Y., Harp, E. L., and Kagawa, T.: Simulation of rockfalls triggered by earthquakes, Rock Mech. Rock Eng., 23, 1–20, 1990.
Luckman, B. H.: Forty Years of Rockfall Accumulation at the Mount Wilcox Site, Jasper National Park, Alberta, Canada, Geogr. Polon., 81, 79–91, 2008.
Mann, H. B.: Nonparametric tests against trend, Econometrica, 13, 245–259, 1945.
Mavrouli, O. and Corominas, J.: Comparing rockfall scar volumes and kinematically detachable rock masses, Eng. Geol., 219, 64–73, https://doi.org/10.1016/j.enggeo.2016.08.013, 2017.
Melzner, S.: Analyse des Gefahrenpotentials durch primäre Sturzprozesse (Steinschlag/ Felssturz) – Gemeindegebiet Hallstatt, Geological Survey of Austria, Vienna, Austria, 2015.
Melzner, S.: Erstellung eines Ereignis- und Schadenkatasters auf Basis der Chroniken der Gendarmerie und Polizei Salzburg, Geological Survey of Austria (GBA), Vienna, Austria, https://www.geochange-consulting.com/wp-content/uploads/2023/08/Melzner_2022.pdf (last access: 14 September 2023), 2016.
Melzner, S.: Steinschlag- und Felssturzdisposition im Dachsteinkalk, in: Arbeitstagung 2017 – Angewandte Geowissenschaften, 19–22 June 2017, Bad Ischl, Hallstatt, Gmunden, Vienna, Austria, 126–131, https://www.geologie.ac.at/onlineshop/detail/?pid=1771&seo=arbeitstagung-2017-bad-ischl-hallstatt-gmunden&no_cache=1 (last access: 14 September 2023), 2017.
Melzner, S. and Braunstingl, R.: Erstellung eines Ereignis- und Schadenskatasters auf Basis der Chroniken der Polizei Salzburg, in: Arbeitstagung 2017 – Angewandte Geowissenschaften, 19–22 June 2017, Bad Ischl, Hallstatt, Gmunden, Vienna, Austria, 208–209, https://www.geologie.ac.at/onlineshop/detail/?pid=1771&seo=arbeitstagung-2017-bad-ischl-hallstatt-gmunden&no_cache=1 (last access date: 14 September 2023), 2017.
Melzner, S., Moser, M., Ottowitz, D., Otter, J., Lotter, M., Motschka, K., Imrek, E., Wimmer-Frey, I., Rohn, J., and Preh, A.: Multidisziplinäre Grundlagenerhebung als Basis für die Implementierung eines Monitoringsystems am Plassen, in: Arbeitstagung 2017 – Angewandte Geowissenschaften, 19–22 June 2017, Bad Ischl, Hallstatt, Gmunden, Wien, 140–146, https://www.geologie.ac.at/onlineshop/detail/?pid=1771&seo=arbeitstagung-2017-bad-ischl-hallstatt-gmunden&no_cache=1 (last access: 14 September 2023), 2017.
Melzner, S., Shtober-Zisu, N., Katz, O., and Wittenberg, L.: Brief communication: Post-wildfire rockfall risk in the eastern Alps, Nat. Hazards Earth Syst, Sci., 19, 2879–2885, https://doi.org/10.5194/nhess-19-2879-2019, 2019.
Melzner, S., Rossi, M., and Guzzetti, F.: Impact of mapping strategies on rockfall frequency-size distributions, Eng. Geol., 272, 105639, https://doi.org/10.1016/j.enggeo.2020.105639, 2020.
Moya, J., Corominas, J., Pérez Arcas, J., and Baeza, C.: Tree-ring based assessment of rockfall frequency on talus slopes at Solà d'Andorra, Eastern Pyrenees, Geomorphology, 118, 393–408, https://doi.org/10.1016/j.geomorph.2010.02.007, 2010.
Pettitt, A.: A non-parametric approach t, Stat. Soc. Ser. C, 28, 126–135, 1979.
Pohlert, T.: Trend: Non-Parametric Trend Tests and Change-Point Detection, R package version 1.1.4, CRAN, https://CRAN.R-project.org/package=trend (last access: 14 September 2023), 2020.
R Core Team: R: A language and environment for statistical computing, R Foundation for Statistical Computing, Vienna, Austria, https://www.R-project.org/ (last access: 14 September 2023), 2020.
Salvati, P., Bianchi, C., Rossi, M., and Guzzetti, F.: Societal landslide and flood risk in Italy, Nat. Hazards Earth Syst. Sci., 10, 465–483, https://doi.org/10.5194/nhess-10-465-2010, 2010.
Sen, P. K.: Estimates of the regression coefficient based on Kendall's tau, J. Am. Stat. Assoc., 63, 1379–1389, 1968.
Stock, G. M., Bawden, G. W., Green, J. K., Hanson, E., Downing, G., Collins, B. D., Bond, S., and Leslar, M.: High-resolution three-dimensional imaging and analysis of rock falls in Yosemite Valley, California, Geosphere, 7, 573–581, 2011.
Urstöger, H.-J.: Hallstatt-Chronik- von den Anfängen bis zum Jahr 2000, in: 3rd Edn., Verlag des Musealvereins Hallstatt, Hallstatt, 748 pp., https://shop.salzkammergut.co.at/pi.php/Buecher1/Salzkammergut/hallstatt-chronik-von-den-anfaengen-bis-zum-jahr-2000.html (last access: 14 September 2023), 2000.
Wieczorek, G. F. and Snyder, J. B.: Historical Rock Falls in Yosemite National Park, California, US Geological Survey Open-File Report 03-491, US Geological Survey, 10 pp., https://pubs.usgs.gov/of/2003/of03-491/of03-491.pdf (last access: 14 September 2023), 2004.
Wieczorek, G. F., Snyder, J. B., Alger, C. S., and Issacson, K. A.: Rock falls in Yosemite Valley, California, Open-File Report 92-387, US Geological Survey, https://doi.org/10.3133/ofr92387, 1992.
Xie, H., Li, D., and Xiong, L.: Exploring the ability of the Pettitt method for detecting change point by Monte Carlo simulation, Stoch. Environ. Res. Risk A., 28, 1643–1655, https://doi.org/10.1007/s00477-013-0814-y, 2013.