the Creative Commons Attribution 4.0 License.
the Creative Commons Attribution 4.0 License.
 | 07 Sep 2023
Coastal earthquake-induced landslide susceptibility during the 2016 Mw 7.8 Kaikōura earthquake, New Zealand
Corinne Singeisen
Timothy Stahl
Andrew Howell
Chris Massey
Dougal Mason
Coastal hillslopes often host higher concentrations of earthquake-induced landslides than those further inland, but few studies have investigated the reasons for this occurrence. As a result, it is unclear if regional earthquake-induced landslide susceptibility models trained primarily on inland hillslopes are effective predictors of coastal susceptibility. The 2016 Mw 7.8 Kaikōura earthquake on the northeastern South Island of New Zealand resulted in ca. 1600 landslides > 50 m2 on slopes > 15∘ within 1 km of the coast, contributing to an order of magnitude greater landslide source area density than inland hillslopes within 1 to 3 km of the coast. In this study, logistic regression modelling is used to investigate how landslide susceptibility differs between coastal and inland hillslopes and to determine the factors that drive the distribution of coastal landslides initiated by the 2016 Kaikōura earthquake. Strong model performance (area under the receiver operator characteristic curve or AUC of ca. 0.80 to 0.92) was observed across eight models, which adopt four simplified geology types. The same landslide susceptibility factors, primarily geology, steep slopes, and ground motion, are strong model predictors for both inland and coastal landslide susceptibility in the Kaikōura region. In three geology types (which account for more than 90 % of landslide source areas), a 0.03 or less drop in model AUC is observed when predicting coastal landslides using inland-trained models. This suggests little difference between the features driving inland and coastal landslide susceptibility in the Kaikōura region. Geology is similarly distributed between inland and coastal hillslopes, and peak ground acceleration (PGA) is generally lower in coastal hillslopes. Slope angle, however, is significantly higher in coastal hillslopes and provides the best explanation for the high density of coastal landslides during the 2016 Kaikōura earthquake. Existing regional earthquake-induced landslide susceptibility models trained on inland hillslopes using common predictive features are likely to capture this signal without additional predictive variables. Interestingly, in the Kaikōura region, most coastal hillslopes are isolated from the ocean by uplifted shore platforms. Enhanced coastal landslide susceptibility from this event appears to be a legacy effect of past erosion from wave action, which preferentially steepened these coastal hillslopes.
- Article
(20117 KB) - Full-text XML
- BibTeX
- EndNote


Steep rocky coastlines, which account for ca. 80 % of waterfront around the globe (Emery and Kuhn, 1982), are a naturally desirable location to live in and for recreation. A growing global population has resulted in human encroachment on coastlines, with nearly one-quarter of the human population now living in close proximity to the coast (Small and Nichols, 2003). At the same time, global climate change and rising sea levels threaten to increase the rate of coastal landsliding and cliff retreat, in part, due to wave action overtopping protective beaches and impacting coastal cliff faces more frequently (e.g. Young et al., 2014; Limber et al., 2018). The increasing frequency and intensity of these events will impact people and infrastructure near coastal hillslopes (e.g. Jibson, 2006; Dellow et al., 2017; Handwerger et al., 2019).
To help mitigate and manage these hazards, previous studies have attempted to define landslide susceptibility models for steep coastal regions using a physical understanding of the forcings that contribute to coastal mass wasting and the susceptibility factors that make failure more likely (e.g. Keefer, 2000; He and Beighley, 2008; Budetta et al., 2008; Dickson and Perry, 2016; Francioni et al., 2018; Young, 2018; Limber et al., 2018). Forcings include rainfall, wave and tidal action, and storm surge, whereas susceptibility factors include steep topography, geology, rock structure, hydrology, urbanization, and soil moisture, among other factors (Vann Jones et al., 2015; Dickson and Perry, 2016; He and Beighley, 2008). In tectonically active regions, earthquakes also act as a forcing that contributes to coastal landslide susceptibility (Griggs and Plant, 1998; Hancox et al., 2002), but few models have considered the influence of strong ground motion.
Similarly, while a number of studies (e.g. Budimir et al., 2015; Parker et al., 2015; Massey et al., 2018) have attempted to define factors contributing to regional earthquake-induced landslide susceptibility, few have focused specifically on coastlines. In several cases (e.g. Griggs and Plant, 1998; Collins et al., 2012; Massey et al., 2018) a significantly higher landslide density was observed on coastal hillslopes as compared with inland hillslopes, but this has yet to be considered in most probabilistic landslide susceptibility assessments. Given the potential influence of increased precipitation, weathering, and soil moisture along coastlines (Mottershead, 2013), it is possible that regional earthquake-induced landslide susceptibility models, primarily trained on inland hillslopes, may not effectively predict coastal landslide distributions. In this study, we explicitly test whether a landslide susceptibility model trained on landslides from inland hillslopes captures the distribution of coastal landslides. The purpose of this test is to determine if existing variables can explain the difference between inland and coastal landslide densities or if future landslide susceptibility models should consider additional coastal-specific variables.
Following the 2016 Mw 7.8 Kaikōura earthquake along the northeastern coast of the South Island of New Zealand (Hamling et al., 2017), Massey et al. (2018) observed an order of magnitude greater number of landslides along coastal hillslopes as compared with inland hillslopes. No clear physical control on this increased landslide density was identified, although several hypotheses were presented, including differing slope geometry resulting in ground motion amplification along the Kaikōura coast and reduced rock mass strength. Here, the distribution of coastal landslides from the 2016 Kaikōura earthquake is used to (1) train comparative logistic regression earthquake-induced landslide susceptibility models for use in coastal and inland hillslopes in the Kaikōura region, (2) evaluate factors that might contribute to an increased coastal coseismic landslide density during an earthquake, and (3) explore some of the mechanisms that resulted in increased coseismic landslide susceptibility along the Kaikōura coast in 2016.
2.1 The 2016 Mw 7.8 Kaikōura earthquake
The 2016 Mw 7.8 Kaikōura earthquake initiated on the Humps fault near the township of Waiau ca. 40 km inland from the coast in the northeastern South Island of New Zealand (Hamling et al., 2017). The earthquake triggered a cascade of fault ruptures on more than 20 onshore and offshore faults primarily to the northeast of the epicentre (Fig. 1; Litchfield et al., 2018). The earthquake, which caused complex surface deformation along ca. 110 km of coastline (Clark et al., 2017), ruptured faults of both the North Canterbury Domain (NCD) and the Marlborough Fault System (MFS) tectonic domains which transfer plate motion from the Hikurangi Subduction Zone in the north to the transpresive Alpine Fault in the south (Fig. 1; Litchfield et al., 2018).
The earthquake generated more than 30 000 landslides, which were primarily concentrated within the steep slopes of the Seaward Kaikōura Range, around surface fault ruptures, and in steep sections of coastline (Figs. 1 and 2; Massey et al., 2018, 2020a; Bloom et al., 2022). Statistical modelling by Massey et al. (2018, 2020a) found that the regional distribution of landslides from the Kaikōura earthquake was well explained by geology, slope, distance to surface fault traces, peak ground velocity (PGV), local slope relief, and elevation. While Massey et al. (2018) acknowledged a higher density of landslides along the Kaikōura coast, they did not investigate coastal landslide susceptibility, nor the underlying mechanisms involved in the distribution of coastal earthquake-induced landslides. Here, we separate out coastal versus non-coastal hillslopes from this regional analysis and independently investigate the factors that might have contributed towards increased landslide susceptibility of coastal hillslopes during the 2016 Kaikōura earthquake.
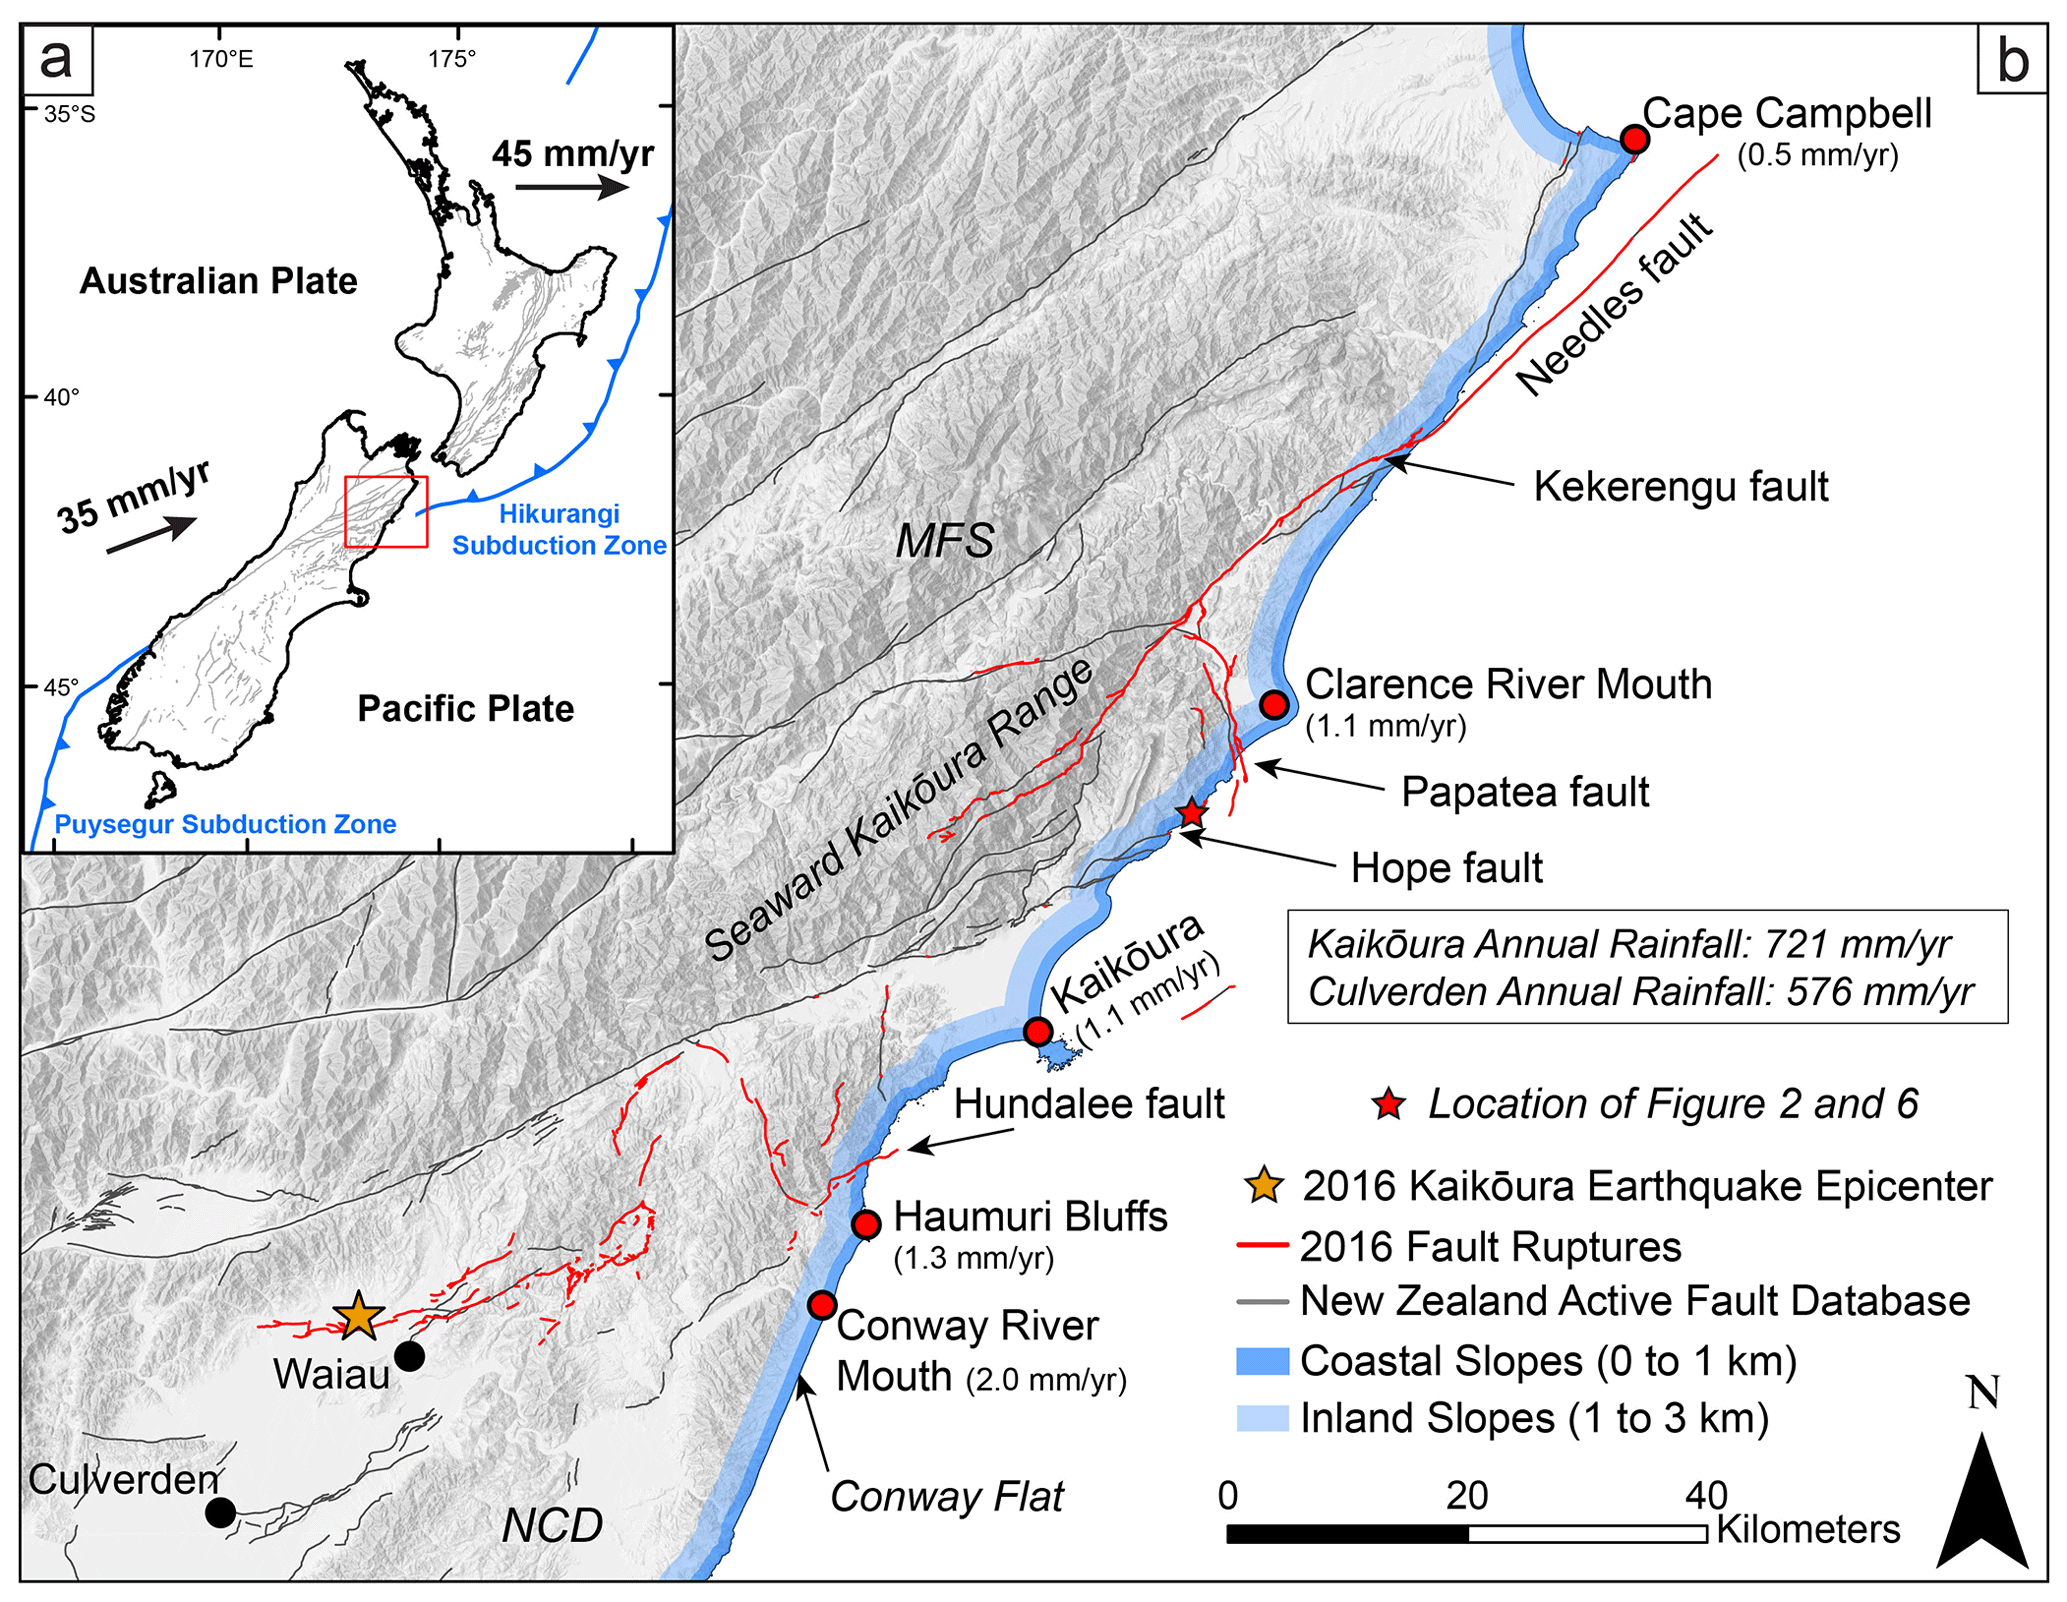
Figure 1(a) Location of the Kaikōura earthquake within the tectonic setting of New Zealand. Active faults from the 1:250 000 scale New Zealand Active Faults Database (Langridge et al., 2016) are in grey, and simplified major offshore structures are in blue. The black arrows show the relative motion of the Pacific and Australian plates (Beavan et al., 2002). (b) Area of the Kaikōura earthquake with active faults of the New Zealand Active Faults Database in grey and fault ruptures from the 2016 Kaikōura earthquake in red (Litchfield et al., 2018; Zinke et al., 2019). The shaded blue area is the focus of this study, a 3 km buffer of the coast where modelled PGA from the Kaikōura earthquake was greater than 0.2 g. The red points identify locations where Ota et al. (1996) estimated coastal uplift rates (noted next to labels). Major faults that cross the coastline in the Kaikōura region are labelled. MFS refers to the Marlborough Fault System north of the Hope fault, while NCD refers to the North Canterbury Domain south of the Hope fault. The base image is a multidirectional hillshade of the Land Information New Zealand 8 m DEM (LINZ, 2021a).
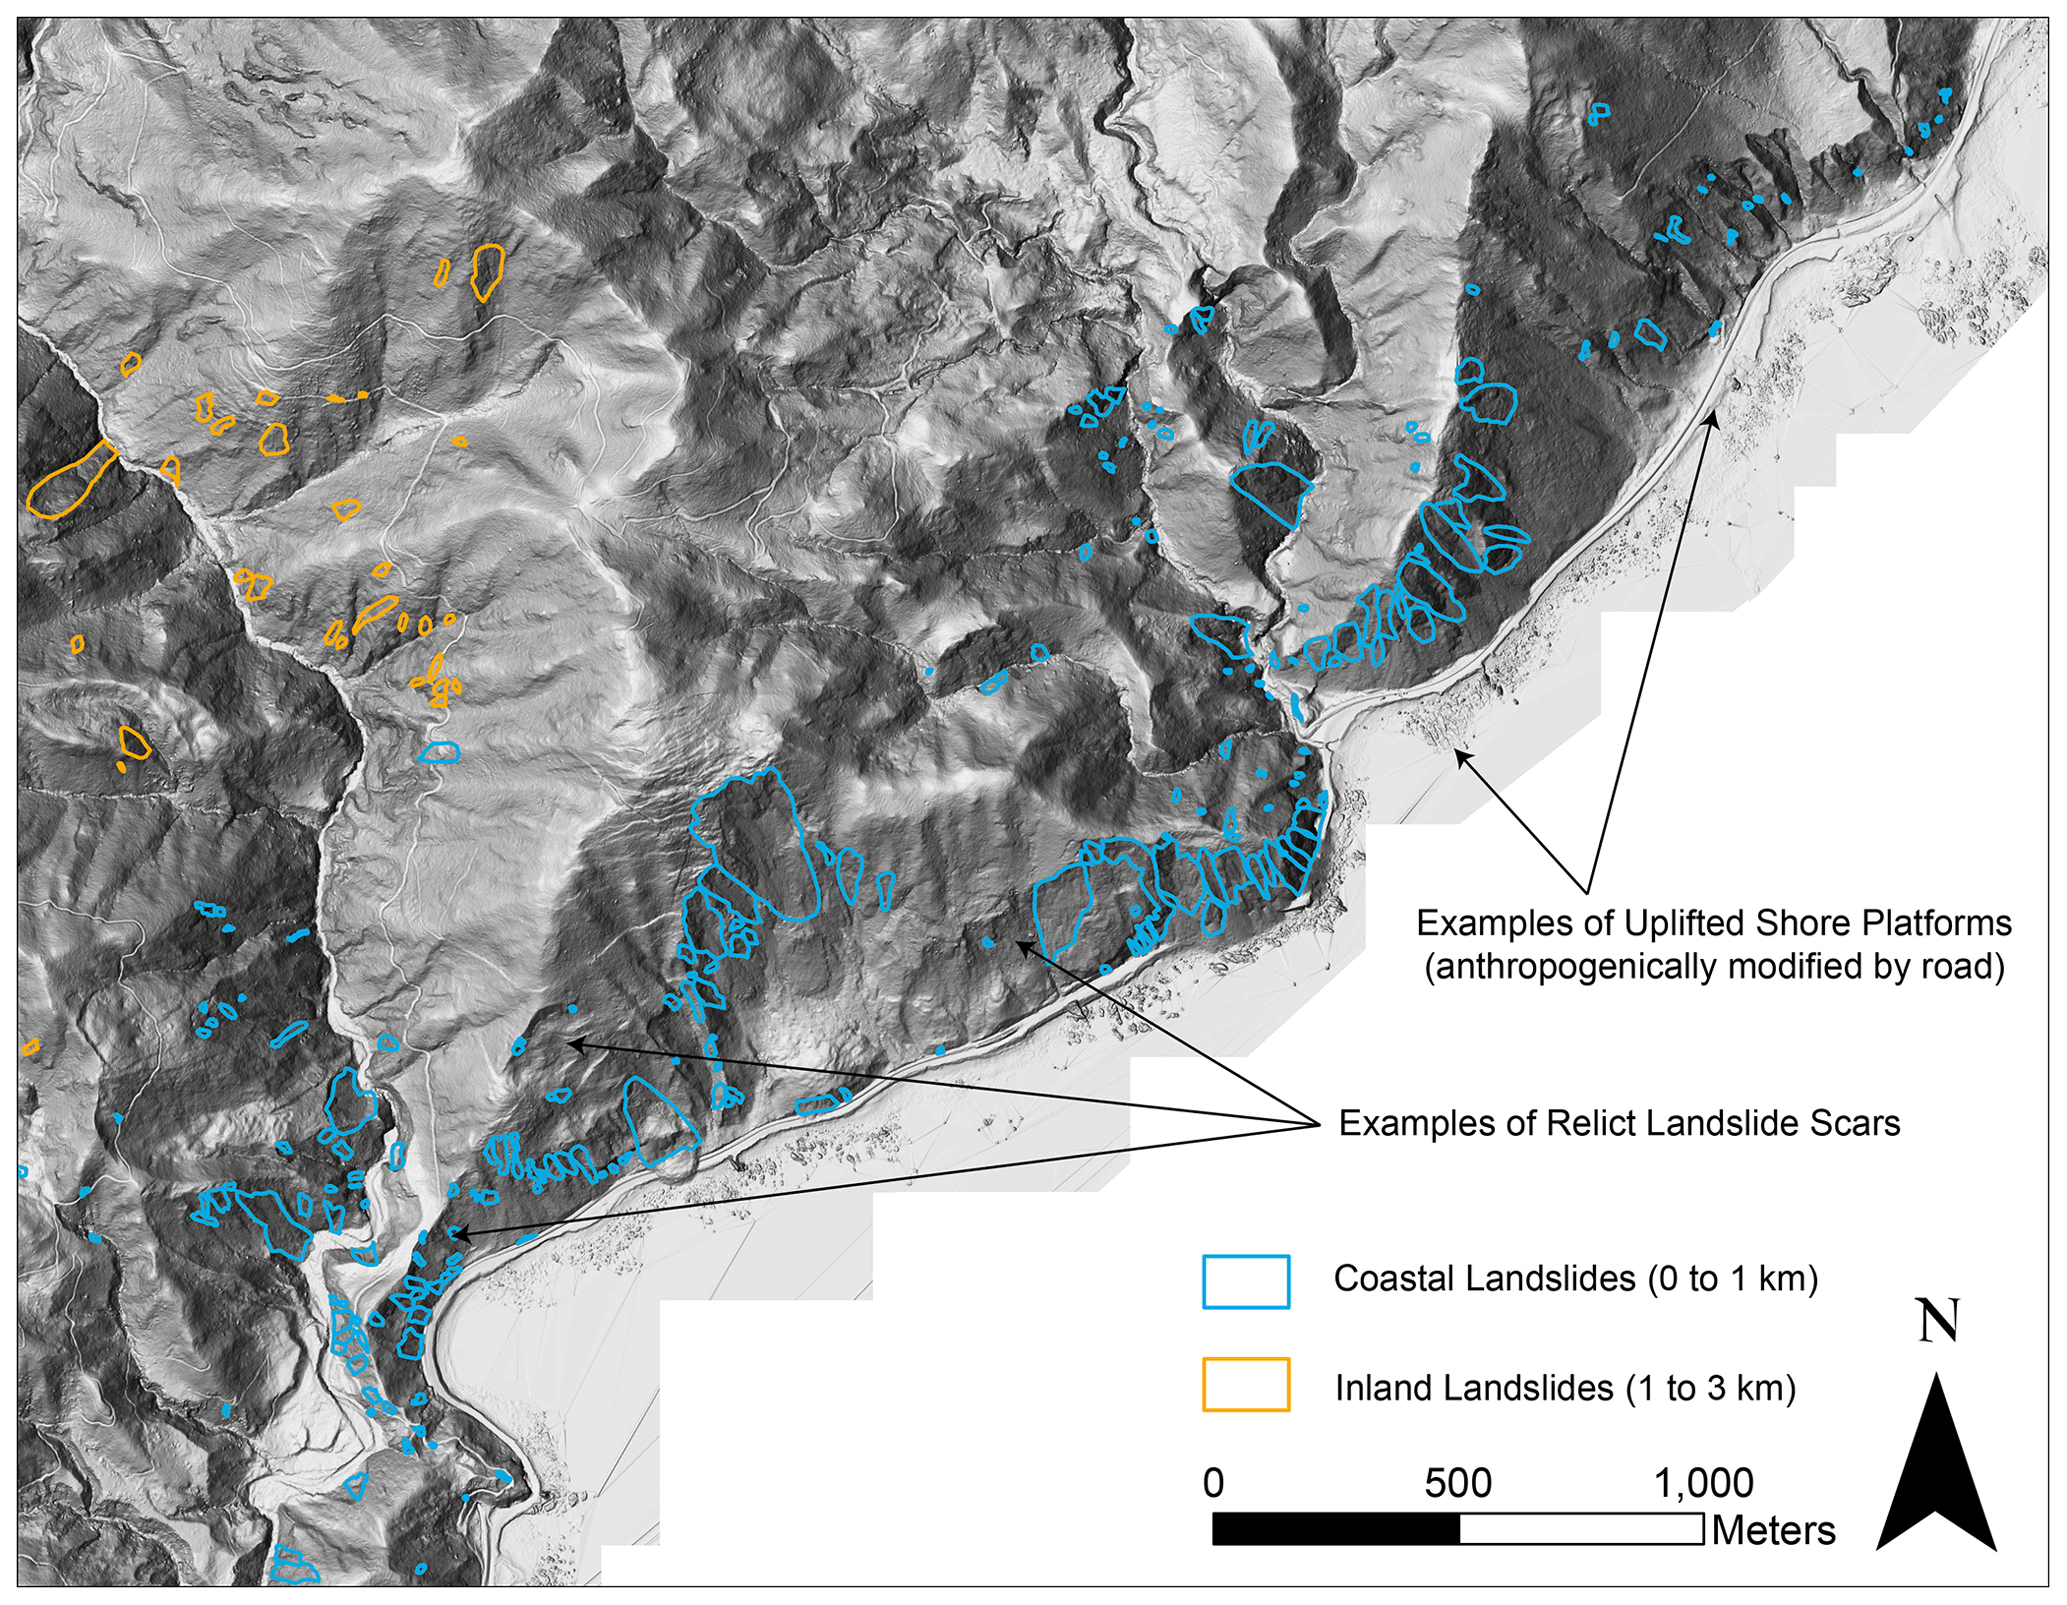
Figure 2A multidirectional hillshade of post-earthquake lidar (Massey et al., 2020b) with coastal earthquake-induced landslides mapped by Massey et al. (2020a). A high density of coastal earthquake-induced landslides was observed within the scars of relict landslides that are common along the coastline. Shore platforms modified by road and rail corridors buffer the base of the coastal hillslopes.
2.2 Coastal and geologic setting
Much of the northeastern coast of New Zealand's South Island is steep and rocky (Figs. 1 and 2). Coastal hillslopes are primarily composed of intensely jointed Lower Cretaceous greywacke of the Torlesse Supergroup along with younger Upper Cretaceous to Neogene sedimentary units (Rattenbury et al., 2006). These units are, in places, overlain by less-consolidated Pleistocene alluvial, fluvial, and beach deposits. Portions of the region's steep coastline, primarily south of the Haumuri Bluffs at Conway Flat (Fig. 1), form steep coastal cliffs ca. 50 to 150 m in height, many of which are subject to wave action at high tide (Bloom et al., 2023). North of the Haumuri Bluffs, however, most coastal hillslopes are uplifted and buffered from direct wave action by shore platforms that have, in places, been anthropogenically modified to facilitate road and rail corridors (Fig. 2; Mason et al., 2017; Stringer et al., 2021).
Long-term coastal uplift in the Kaikōura region is locally variable as a result of major faults, including the Hope, Kekerengu–Needles, and Hundalee, which cross-cut the coastline (Fig. 1; Litchfield et al., 2018; Howell and Clark, 2022). Approximate regional estimates of uplift based on Pleistocene marine terraces suggest ca. 2.0 mm yr−1 of uplift at the Conway River mouth, 1.3 mm yr−1 at the Haumuri Bluffs, 1.1 mm yr−1 at Kaikōura township, 1.1 mm yr−1 at the Clarence River mouth, and ca. 0.5 mm yr−1 ca. 10 km south of Cape Campbell (Fig. 1; Ota et al., 1996). These measurements generally align well with more recent measurements of ca. 0.9 to 1.3 mm yr−1 at Kaikōura (Nicol et al., 2022). Single-event vertical displacement from the 2016 Kaikōura earthquake ranged from ca. −2.5 to 6.5 m along the Kaikōura coast (Clark et al., 2017; Howell and Clark, 2022), but the areas that subsided in 2016 have undergone net uplift over the Holocene and Pleistocene (Ota et al., 1996; Howell and Clark, 2022).
As a result of low coastal population density, little work has been done to estimate long-term coastal retreat rates for the South Island of New Zealand. The few studies that have estimated retreat (Bloom et al., 2023; Kirk, 1975, 1977) suggest highly variable rates modulated by lithology and topography. Average rainfall measured in the township of Kaikōura is ca. 721 mm yr−1 (Macara, 2014) but is highly spatially variable along the Kaikōura coast, ranging from ca. 675 to ca. 1500 mm yr−1 (NIWA, 2022). Over the historical record, significant landsliding along the Kaikōura coast has been observed following large storms, for example Cyclone Alison (March 1975) and ex-Tropical Cyclone Ita (April 2014), which brought high rainfall to the region over a short period of time (Massey et al., 2021a).
To explore coastal earthquake-induced landslide susceptibility in the Kaikōura region, we rely on a combination of predictive landslide susceptibility features and an earthquake-induced landslide inventory produced by Massey et al. (2020a) following the 2016 Kaikōura earthquake (Fig. 2). These datasets are used to examine the distribution of landslides with distance from the Kaikōura coast and provide training data for comparative inland and coastal landslide susceptibility models (Fig. 3). For the purposes herein, inland hillslopes are defined as hillslopes within > 1 to 3 km of the Kaikōura coast and coastal hillslopes as hillslopes within 1 km of the coastline (Massey et al., 2018). This distinction was based on three main factors. First, the observed landslide density is much higher within 1 km of the coast than within 1 to 3 km despite generally similar distributions of lithology, elevation, and vegetation. Second, hillslopes greater than 3 km from the coast capture a different proportion of lithology and alpine terrain (Fig. 1) with a higher landslide density. These hillslopes are more difficult to compare with the coastal setting and may be affected by different processes. Third, the area within 1 km of the coast primarily encompasses terrain up to the first topographic ridgeline (Massey et al., 2018) and is therefore more representative of “coastal-facing” hillslopes than those at greater distances. The differences between the coastal and inland susceptibility models are investigated to examine the factors contributing to an increased density of landslides on the Kaikōura coast. The following sections provide an overview of these datasets and analyses.
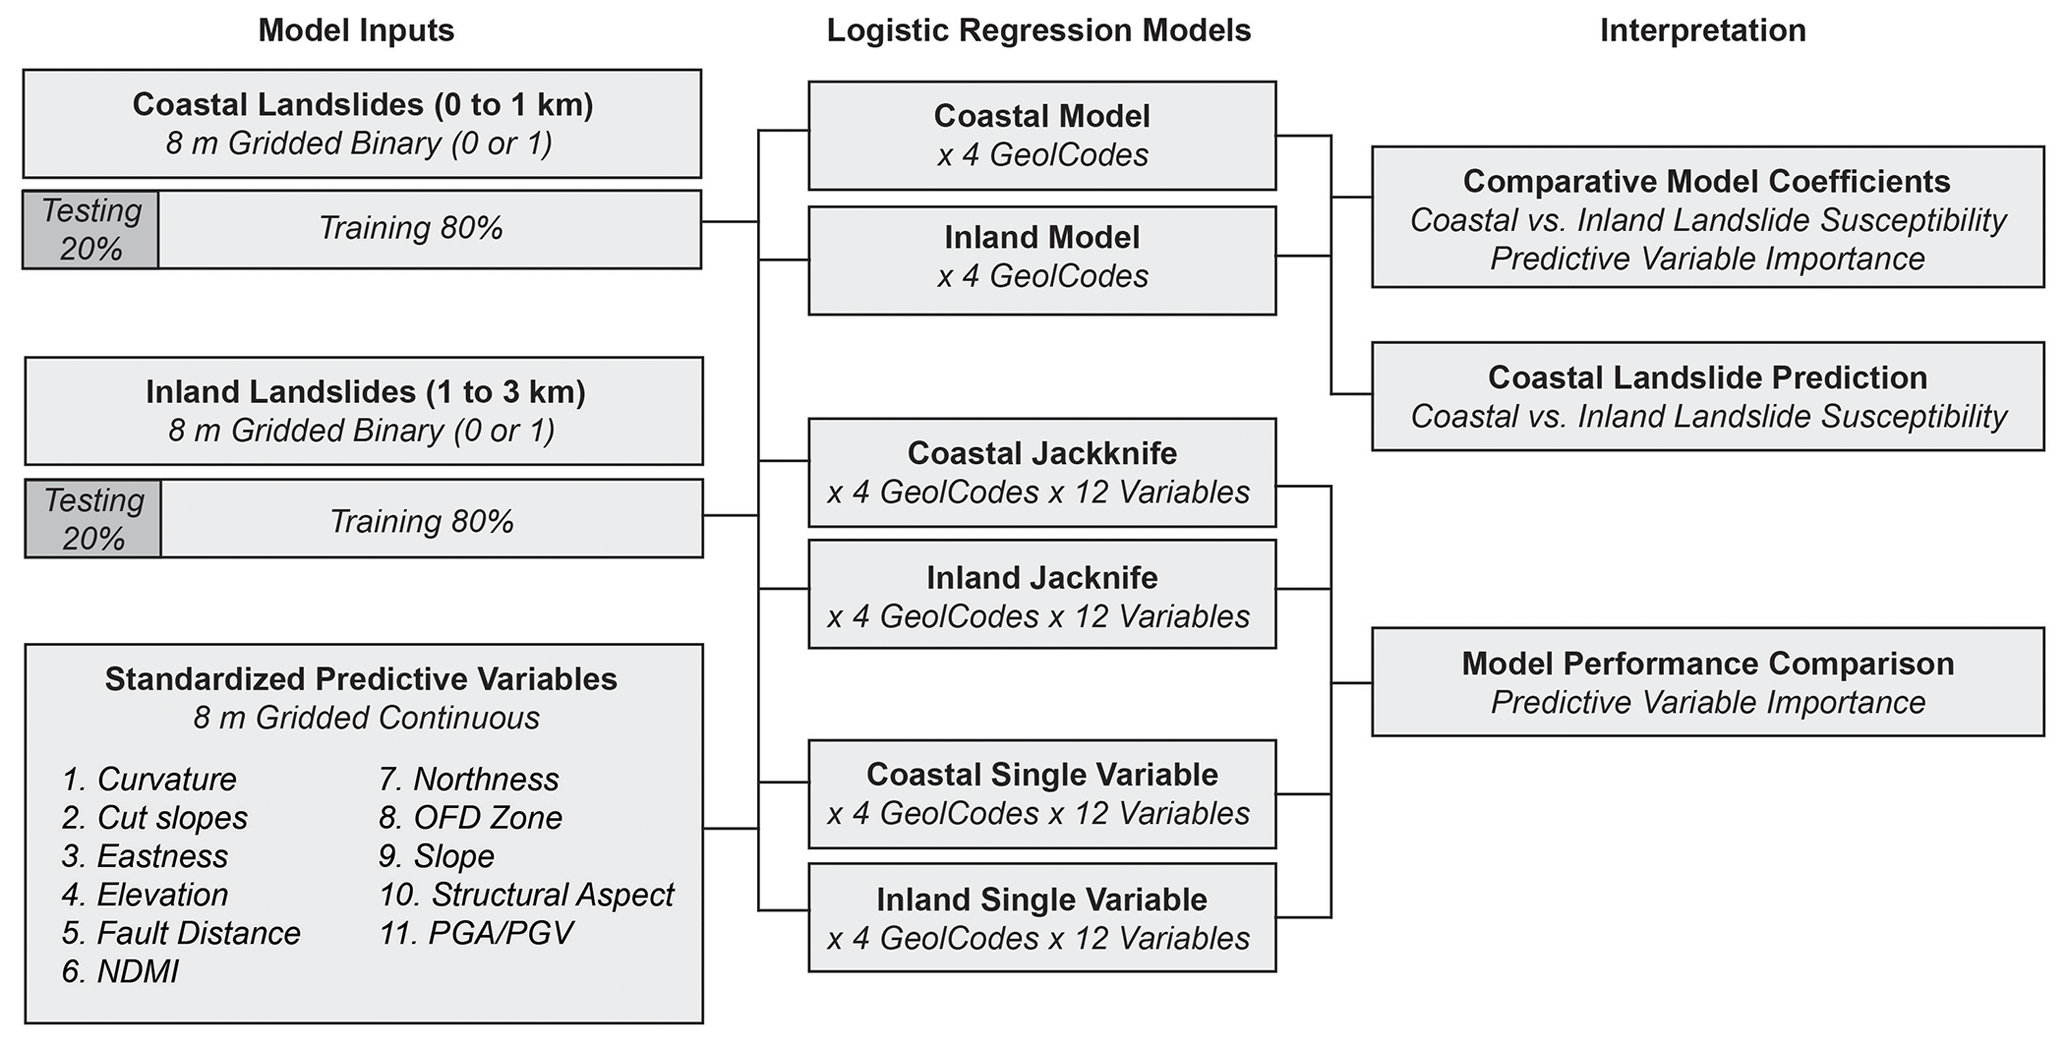
Figure 3Logistic regression model workflow. Gridded landslide data and predictive features are used to train and test binary logistic regression models. Model results are used to compare inland and coastal landslide susceptibility and to assess the importance of predictive features. NDMI stands for normalized difference moisture index, while PGA/PGV stands for peak ground acceleration/velocity.
3.1 The 2016 Kaikōura landslide inventory
For this analysis, mapped source area polygons from version 2.0 of the 2016 Kaikōura earthquake-induced landslide inventory (Figs. 2 and 3; Massey et al., 2020a) were converted into a binary 8 m grid of landslide and non-landslide grid cells. Grid cells were assigned a value of 1 if the centre point of the grid cell fell within a landslide source area polygon and a value of 0 if it did not. Based on the size area distribution of landslides within 3 km of the Kaikōura coastline, landslides smaller than 50 m2 were excluded from the analysis. This was done in an effort to eliminate potential bias resulting from preferential mapping of smaller failures along the Kaikōura coastal road corridor (Fig. A1 in the Appendix). Here, distance to the Kaikōura coastline was defined using the nearest Euclidean distance from the centre point of each 8 m grid cell to the coast as defined by the Land Information New Zealand (LINZ) Topo50 New Zealand Coastlines (LINZ, 2021b). Investigations were limited to slopes greater than 15∘, which captured ca. 91 % of cumulative landslide source area, while excluding most hillslopes unlikely to produce significant landsliding in this region. This threshold is commonly applied (e.g. Meunier et al., 2007; Kritikos et al., 2015) to confine investigations to hillslopes capable of producing landslides. Furthermore, analyses were limited to those areas where modelled PGA (Worden et al., 2020) was greater than 0.2 g (the triggering threshold for New Zealand's earthquake-induced landslide response tools; Massey et al., 2021b). Areas with PGA greater than 0.2 g include ca. 99 % of mapped coastal landslide source areas from the 2016 Kaikōura earthquake. Finally, the ca. 452 000 m2 seafront landslide was excluded from the analysis to avoid skewing descriptive statistics and modelling. The source area of the seafront landslide occurs approximately 1 to 3 km from the coast but is located directly along a surface-rupturing fault (> 9 m vertical displacement; Bloom et al., 2021). The failure is almost an order of magnitude larger than the next largest 2016 failure within 3 km of the coastline and is not representative of failures within the wider coastal region.
To supplement the landslide inventory, we reviewed the high-resolution pre- and post-event digital elevation models and orthophotographs used to create the Kaikōura earthquake-induced landslide inventory (Massey et al., 2020a) and manually assigned each landslide source area polygon either a “first movement” designation or one of three landslide activity designations derived from Cruden and Varnes (1996): “reactivated retrogressive rock or debris”, “reactivated moving debris”, or “reactivated moving rock”. These designations represent the landslide activity in relation to past failures. For the purposes herein, a past failure was defined as any landslide, landslide debris, or landslide scar that was apparent on the hillslope before the 2016 earthquake. First movements have no obvious link with a pre-2016 failure. Reactivated retrogressive rock or debris exhibited extension of a pre-2016 landslide head scarp opposite to the failure direction. In this case we also include coastal cliff-top failures where there was evidence of past landslides. Reactivated moving rock exhibited remobilization of the majority of material within an observed pre-2016 landslide. Reactivated moving debris exhibited minor deformation within the body of a past landslide, including partial reactivation of landslide debris.
3.2 Landslide distribution
To examine the distribution of landslides in relation to the coast, the landslide source area density, referred to herein as landslide density, was calculated at an increasing distance from the coast. Landslide density is the sum of the gridded landslide source area within 24 m bins at a distance from the LINZ Topo50 New Zealand Coastlines (LINZ, 2021b) divided by the total area within the bin. Landslide density was further broken down within five geology types (GeolCodes) simplified from the New Zealand QMAP (Rattenbury et al., 2006). GeolCode 1 represents Quaternary sands, silts, and gravels that are primarily fluvial deposits but also include alluvial fan, marine, and recent beach deposits; GeolCode 2 represents Neogene limestones, sandstones, and siltstones; GeolCode 3 represents Upper Cretaceous to Paleogene rocks, including limestones, sandstones, and siltstones; GeolCode 4 represents minor undifferentiated volcanic rocks; GeolCode 5 represents Lower Cretaceous Torlesse (Pahau terrane) basement rocks that are predominantly heavily deformed sandstones and argillite, commonly referred to as greywacke in New Zealand; and finally GeolCode 6 represents undifferentiated relict landslides and hillslope deposits as defined by QMAP. It is important to note that relict landslides and hillslope deposits are not systematically mapped within QMAP (Rattenbury et al., 2006).
3.3 Landslide susceptibility features
A number of machine learning and statistical modelling techniques, for example logistic regression, random forest, or deep neural networks, have been successfully applied to regionally estimate landslide susceptibility (Reichenbach et al., 2018). The choice of modelling technique is largely governed by the scale and requirements of the analysis. In this study the binary logistic regression technique is used because it (1) balances relatively high model performance with low model training times and (2) has high “explainability”, allowing us to easily identify the importance of individual predictive features in trained models (Fig. 3; Budimir et al., 2015). The purpose of using machine learning in this study is to better understand predictive features, not to create a forecast model or susceptibility maps. Other types of models, for example deep neural networks, may result in higher model performance more suited to forecasting but sacrifice explainability and require longer training times (Reichenbach et al., 2018), limiting their application in this case.
The basic requirements for all empirical landslide susceptibility analyses are, typically, a categorical landslide dataset (defining the presence or absence of a landslide at any given location) and one or more predictive features that can be used to train the model (Fig. 3; Budimir et al., 2015). A separate categorical landslide dataset (not used in model training) is used to test the efficacy of the trained model (Fig. 3). Model performance is optimized differently based on the modelling technique but usually involves varying model “hyperparameters” or values used to control model process and refining the predictive features used to train the model (Lombardo and Mai, 2018; Reichenbach et al., 2018). Here, we discuss the choice of predictive features and further describe the application of the logistic regression modelling technique.
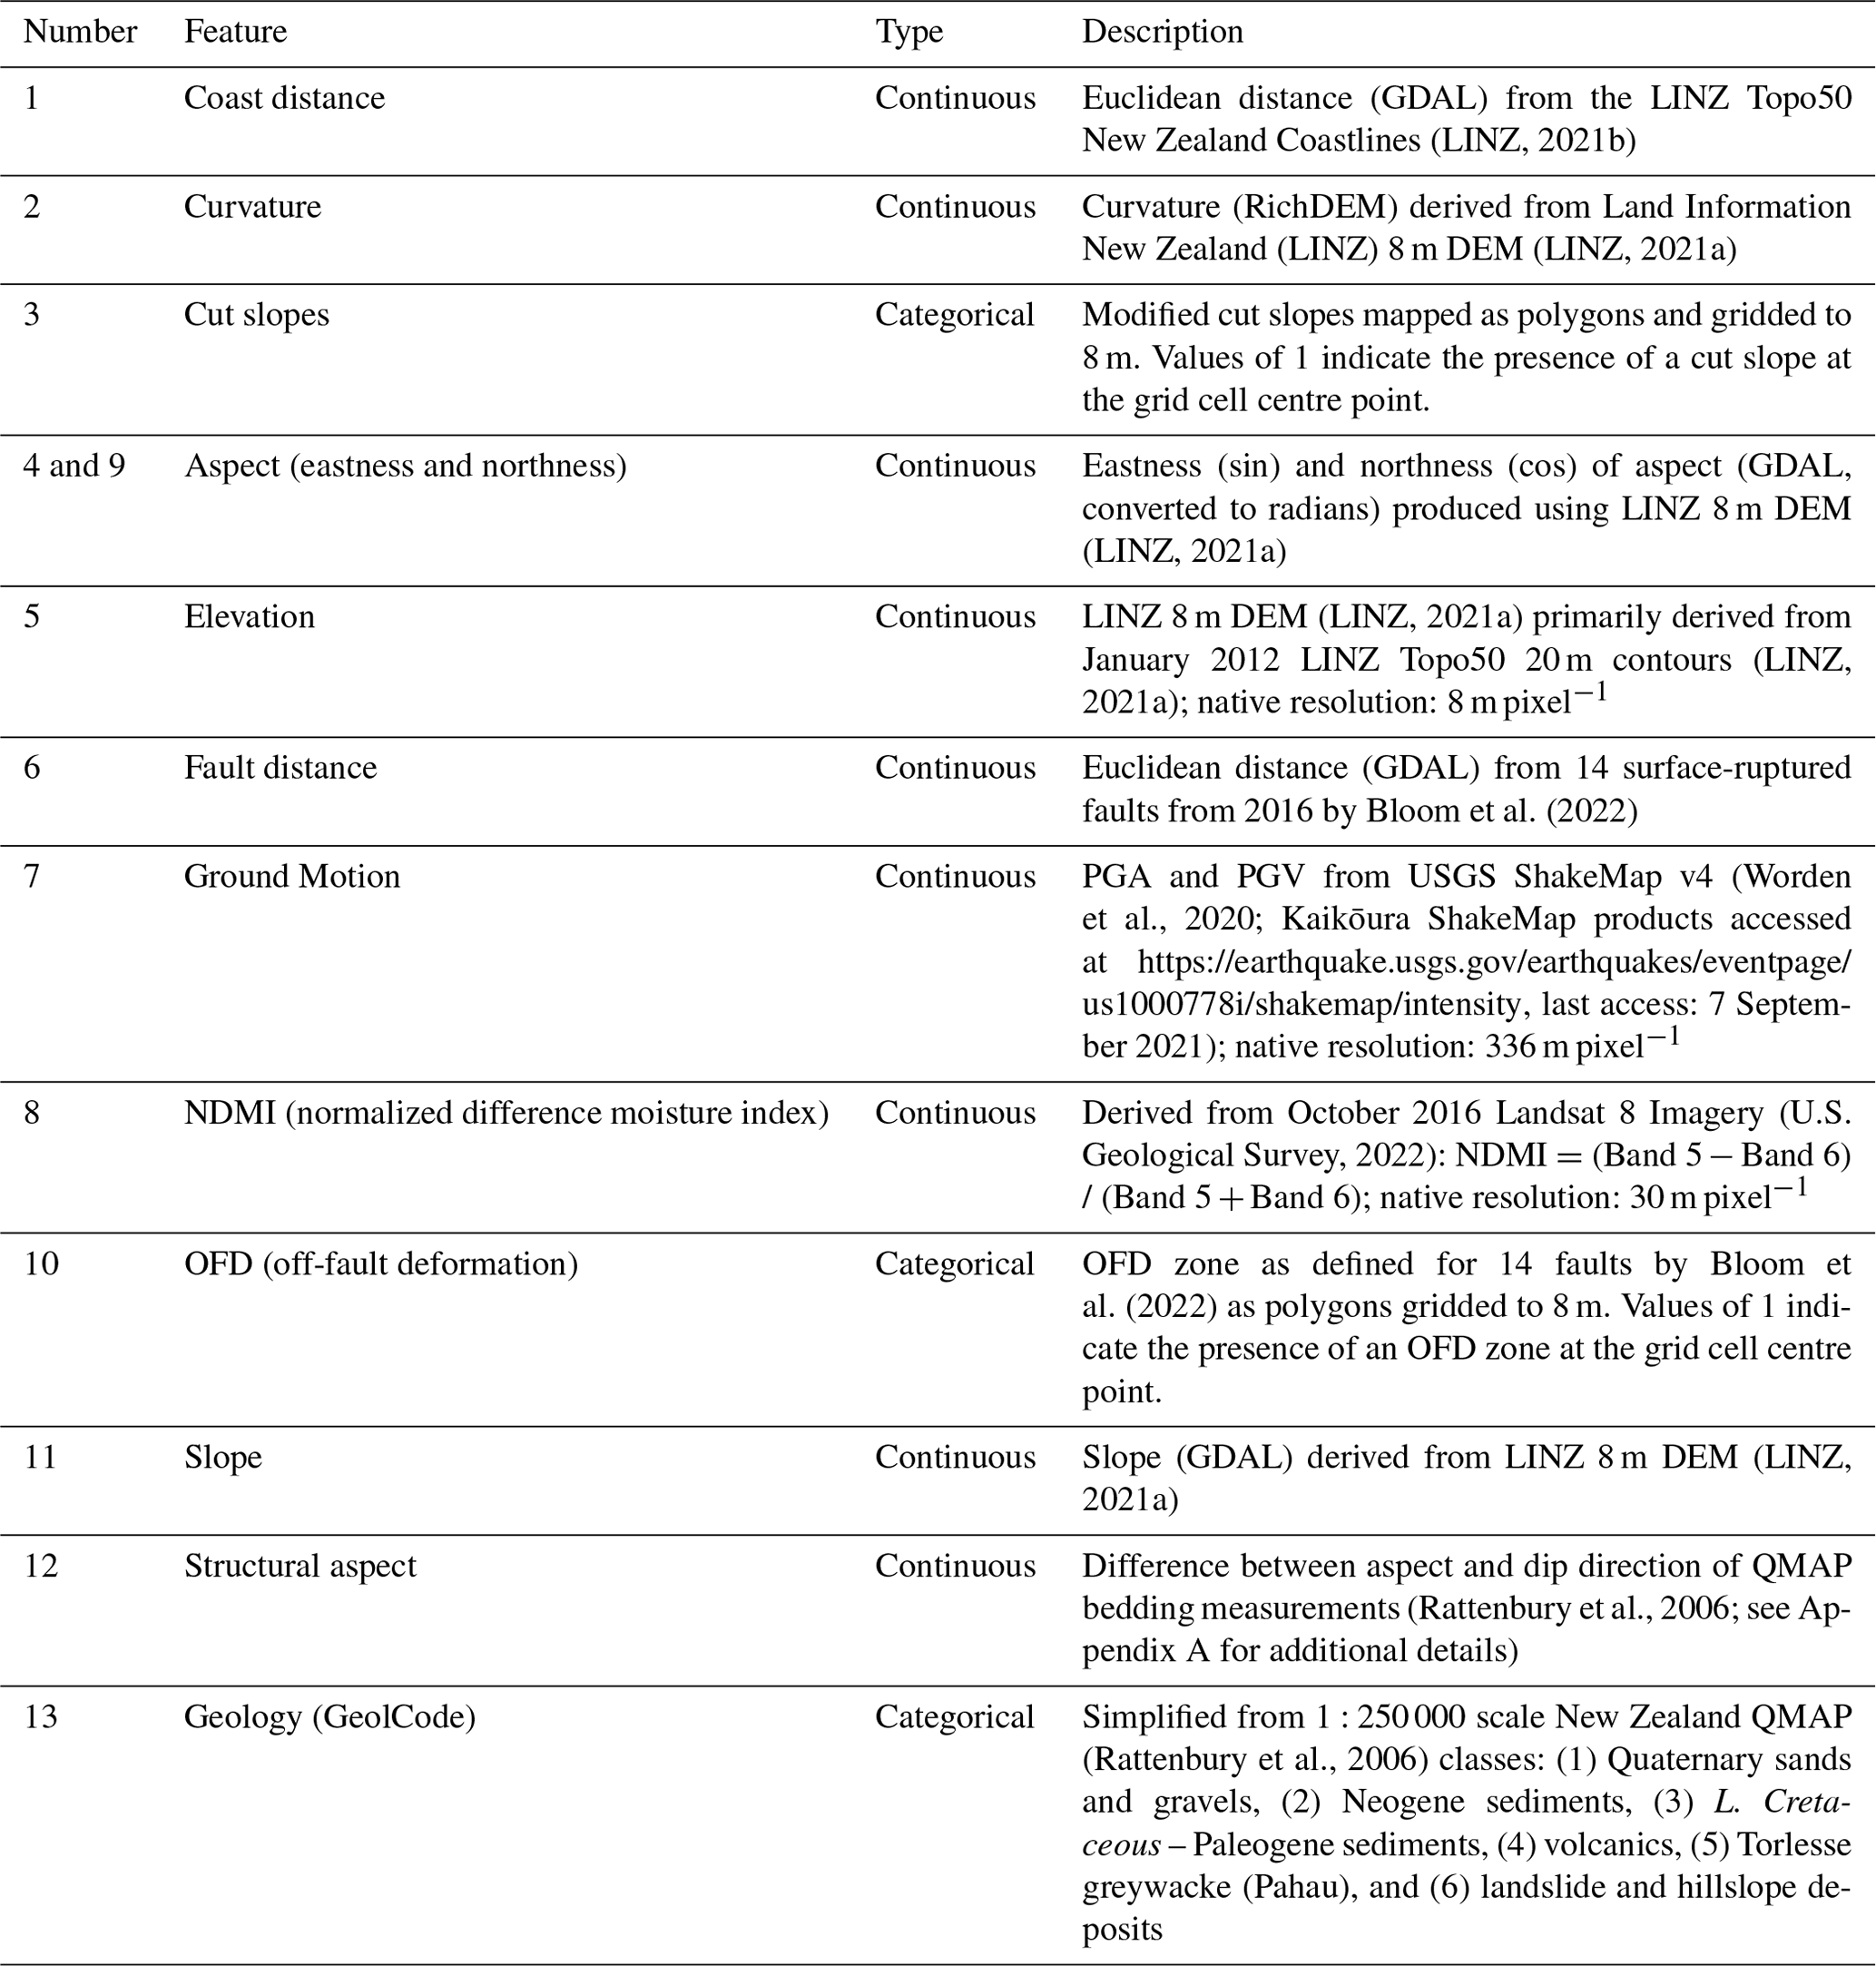
For this analysis, 25 common predictive features used in other landslide susceptibility studies (e.g. Budimir et al., 2015) were developed. These features included a range of lithologic, topographic, and surface conditions, for example, slope angle, roughness, and vegetation greenness (NDVI) (Fig. A2). Of these features, 13 that produced variance inflation factor (VIF) scores greater than 10 were excluded. VIF, defined as
is an assessment of the linear relationship between any individual feature and all other potential features () (Kutner et al., 2004). Excluding collinear features ensures more representative model weighting, generally improves model performance, and maintains model explainability.
The various features used in this analysis (Table 1) were converted to raster format and/or aligned to the spatial resolution of the LINZ 8 m DEM (LINZ, 2021a) using the GDAL rasterize and warp functions with nearest-neighbour resampling. The LINZ 8 m DEM, primarily derived from the January 2012 LINZ Topo50 20 m contours (LINZ, 2021a), was used to derive the curvature, aspect, elevation, and slope features used in the analysis (Table 1). While the LINZ 8 m DEM has known limitations for local terrain analysis, on a regional scale, it captures the majority of terrain characteristics (Appendix A) and is one of the few datasets with appropriate coverage and resolution for our analysis.
Similar to the landslide density analysis, the extent of features (Table 1) was limited to slopes greater than 15∘ and areas with PGA (defined by the USGS ShakeMap; Worden et al., 2020) greater than 0.2 g. Continuous landslide susceptibility features (Fig. 3, Table 1) were scaled using the following standard scalar method:
where the standardized value (z) is the original value (x) minus the mean (μ) of all values divided by the standard deviation (σ) of all values. Using the standard scalar allows us to compare model coefficients or the weights assigned to each feature during model training side-by-side.
3.4 Logistic regression modelling
The predictive power of individual landslide susceptibility features during the Kaikōura earthquake was strongly modulated by geology type (Massey et al., 2018, 2020a; Singeisen et al., 2022). Separate coastal (0 to 1 km from the coast) and inland (1 to 3 km from the coast) models were, therefore, trained in four simplified geology types (GeolCodes 1, 2, 3, and 5; Fig. 3) using predictive features and the Scikit-learn Python library (Table 1). GeolCode 4 (volcanics) and GeolCode 6 (mapped hillslope deposits) lacked sufficient data to support a robust model and were excluded from the analysis. Additional models were trained using the combined data from inland and coastal hillslopes, and these results are included in Appendix B (Figs. B1 and B2).
Models were trained on 80 % of gridded data, leaving 20 % of data for independent verification of the model performance (Fig. 3). Across model training, random 10-fold cross-validation was used to evaluate model uncertainty. In K-fold cross-validation, the training dataset is partitioned into K (in this case 10) parts (Hastie et al., 2017), and models are iteratively trained using all parts minus one. The remaining portion of data excluded from training in each iteration is used to validate model performance. An L1 regularization was used to penalize poor features and improve model prediction by simplifying the model (Lombardo and Mai, 2018). Using the L1 (also known as the least absolute shrinkage selection operator or LASO; Tibshirani, 1996) allows the model to assign overly collinear or unsupportive features a coefficient of 0. The Stochastic Average Gradient Accelerated (SAGA) solver (Defazio et al., 2014), which supports L1 regularization, was used to weight coefficients. In all cases, models converged prior to a maximum of 100 iterations. Based on hyperparameter tuning, a C (inverse of regularization strength) of 1 was applied to the models. The target datasets have a greater number of non-landslide source area (value of 0) grid cells than landslide (value of 1) grid cells (Table A1 in the Appendix). To limit overprediction, no attempt was made to balance or otherwise weight the datasets during model training.
The intention of this work was not to systematically evaluate or compare model prediction. However, estimates of the area under the receiver operator characteristic (AUC) curve were used to demonstrate the relatively high performance of all trained models. The ROC curve (e.g. Fawcett 2006; Lombardo and Mai, 2018) plots the true positive rate (TPR) against the false positive rate (FPR) at different probability thresholds. TPR, also known as “sensitivity”, represents the ratio of positive predictions that were correctly classified as positive by the model, i.e. pixels modelled as failures that actually failed in 2016. FPR is calculated as 1 – specificity, where specificity is the true negative rate (TNR) or the ratio of negative model predictions that were correctly classified as negative. The shape of the ROC curve is used to evaluate the goodness of fit for a binary classifier – in this case, whether a grid cell represents a landslide source area or not (Y=1 or Y=0). The class prediction for each instance is determined based on the probability threshold. The area under the ROC curve is calculated to quantify the shape of the curve in a single reportable value. Values of AUC close to 1 represent better model performance, while values close to 0.5 represent near-random results (Hosmer et al., 2013). As a final test to demonstrate the efficacy of the models, we used the results of models trained on inland data to predict the coastal landslide distribution (Fig. 3), and this is also reported based on AUC.
Because model features were standardized using the standard scalar method, model coefficients can be directly compared for each predictive feature to estimate feature importance (Fig. 3). Following the techniques of Lombardo and Mai (2018) and Williams et al. (2021), jackknife and single-variable logistic regression model permutations were also trained for inland and coastal hillslopes in GeolCodes 1, 2, 3, and 5 to further assess feature importance (Fig. 3). In the jackknife method, a single landslide susceptibility feature is iteratively removed during model training (Lombardo and Mai, 2018; Williams et al., 2021). Individual model results are then compared in order to evaluate the influence of removing each feature from the model. A more substantial drop in model AUC suggests higher importance for the removed feature. In the single-variable method, models are iteratively trained on each susceptibility feature separately to determine individual feature importance. In these models, a higher model AUC suggests that the feature has a greater independent explanatory value.
4.1 Distribution of coastal earthquake-induced landslides
Similar to the results of Massey et al. (2018), an order of magnitude greater earthquake-induced landslide density was observed across coastal hillslopes as a result of the 2016 Kaikōura earthquake (Fig. 4). Within 1 km of the coast, 1621 landslides > 50 m2 were observed on slopes greater than 15∘ with a mean PGA greater than 0.2 g. Given these filters, on average, coastal landslides were slightly larger than inland landslides (ca. 870 m2 for coastal hillslopes and ca. 780 m2 for inland hillslopes; Table B1). Removing landslide size and slope filters results in a similar coastal landslide density. Source area density peaks at ca. 7 % between 0 and 100 m from the coastline and drops to ca. 0.5 % at 1000 m from the coastline (Fig. 4). Between 1000 m from the coastline and 3000 m from the coastline, landslide source area density remains generally consistent, with an average density of ca. 0.5 % (Fig. 4).
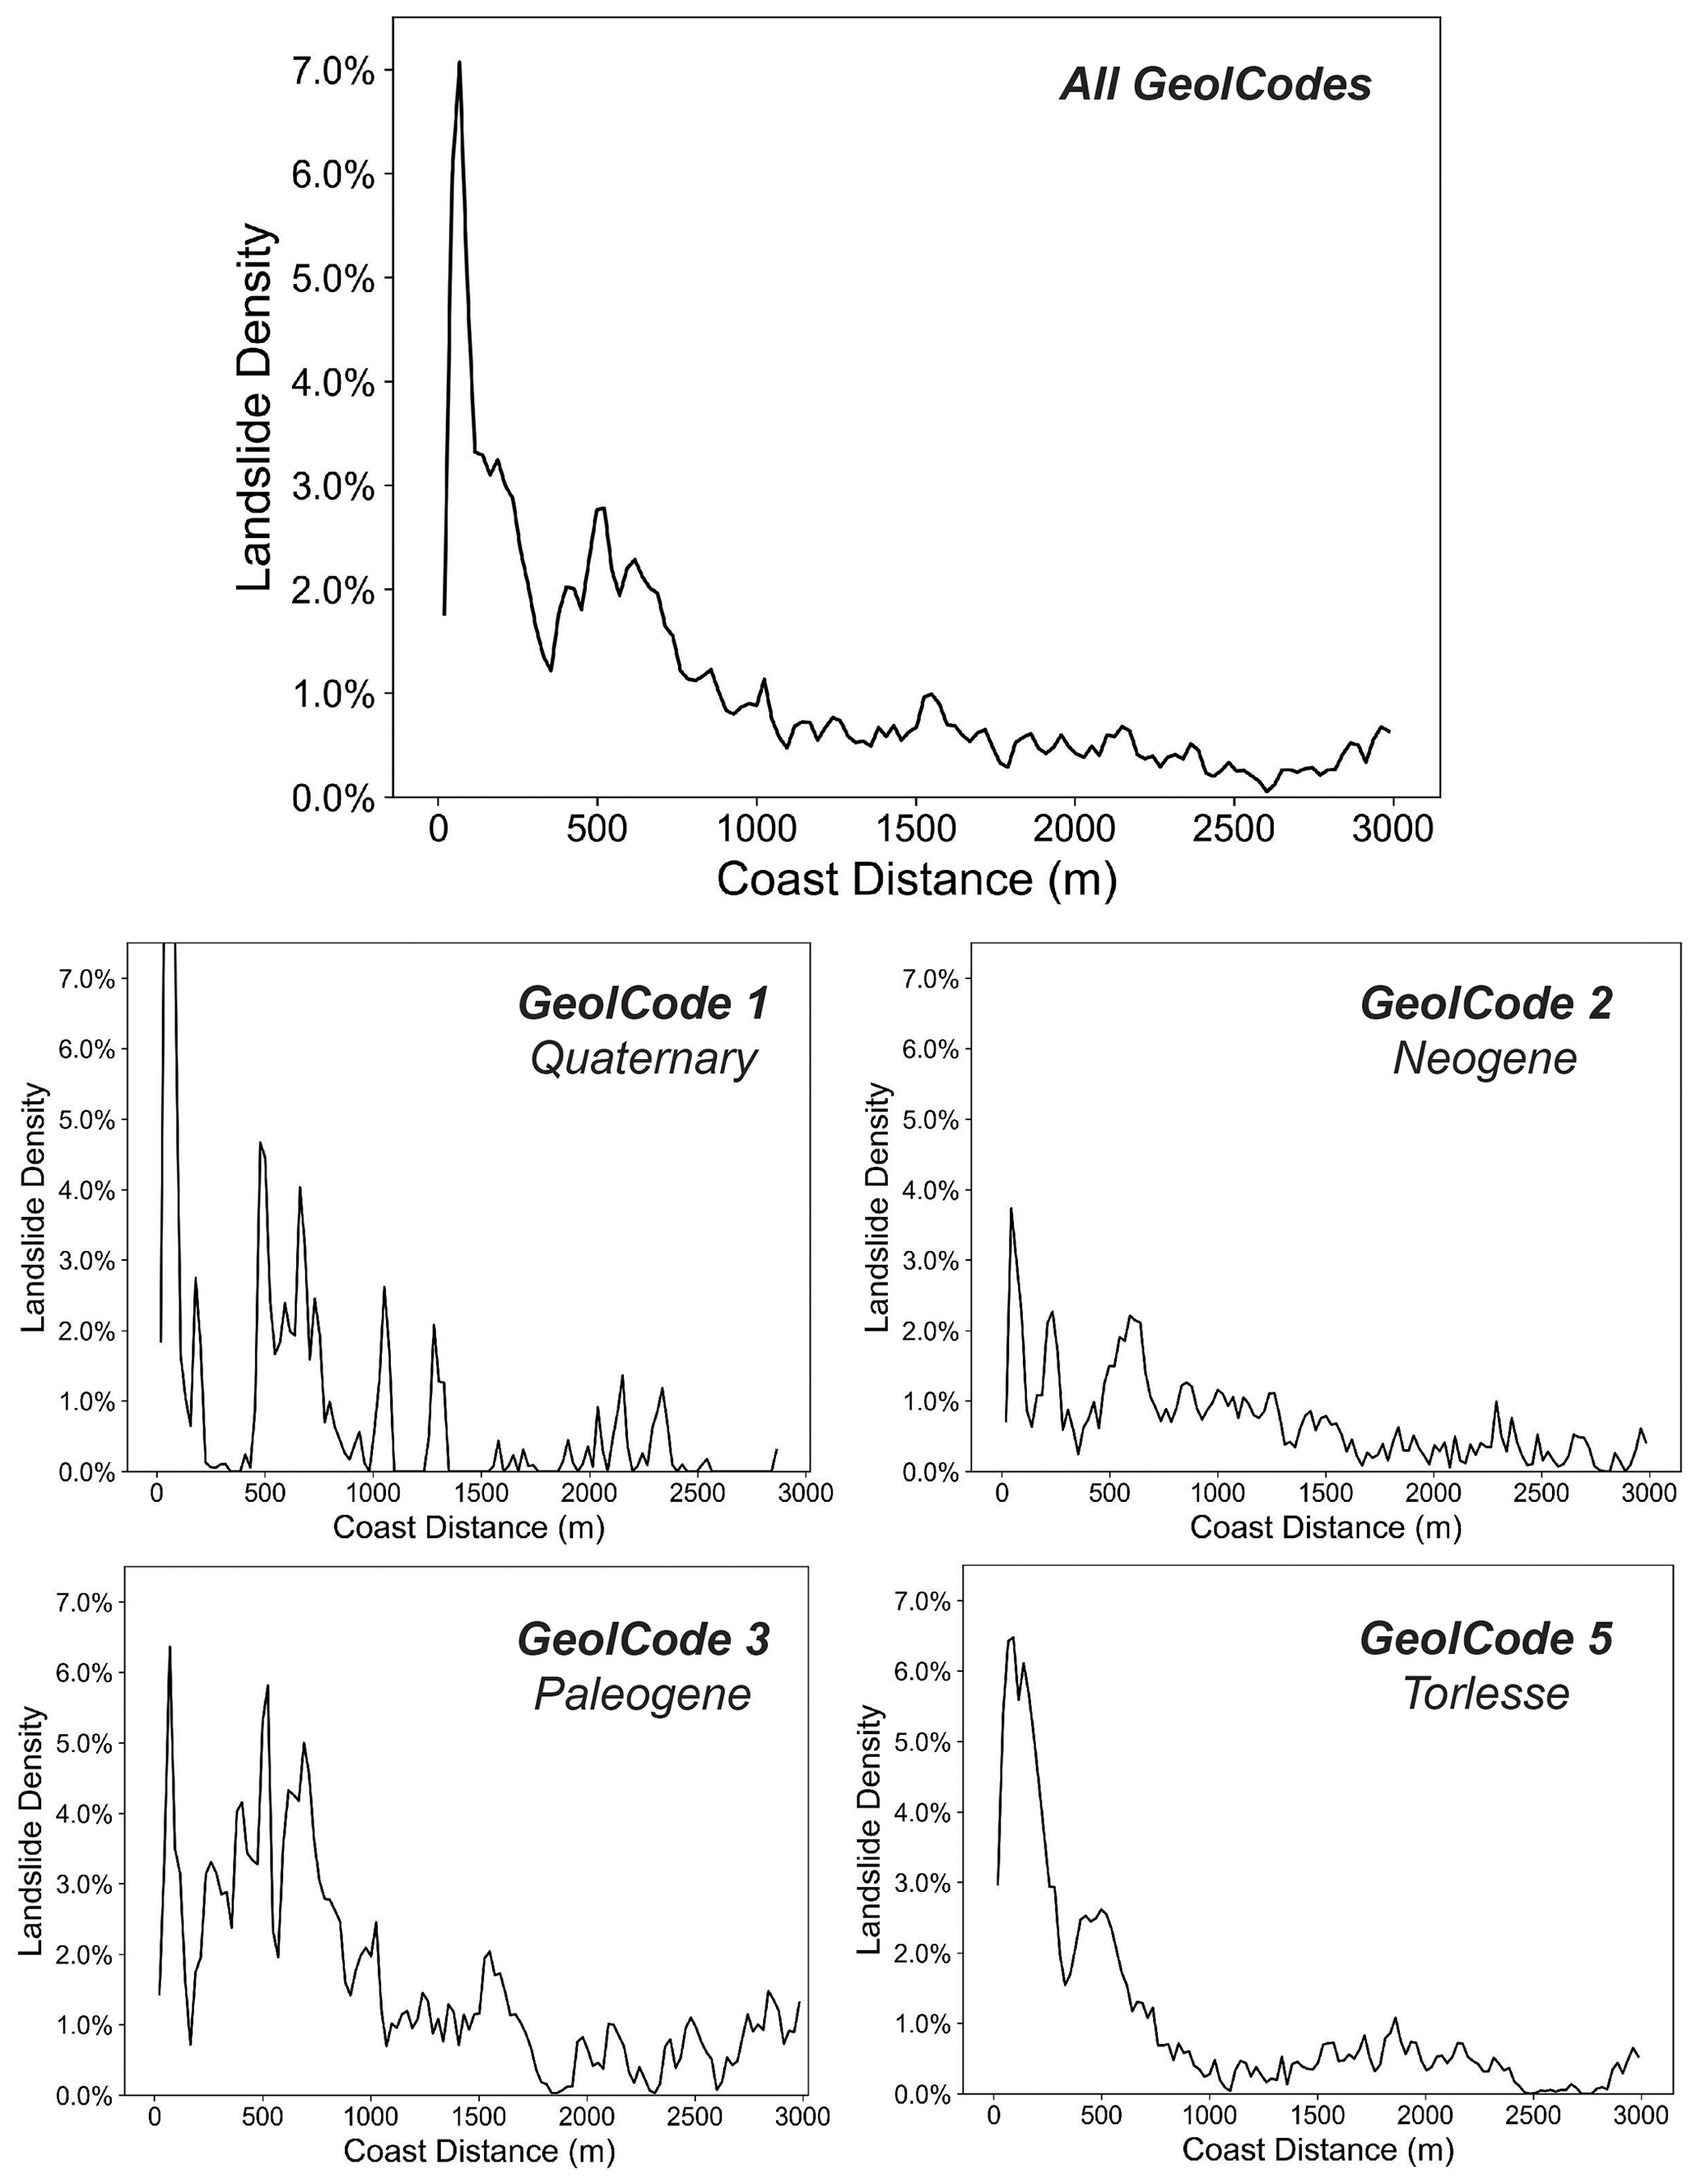
Figure 4Overall landslide source area density (landslide density) within 24 m bins at an increasing distance from the Kaikōura coast as defined by the LINZ Topo50 Coastlines (LINZ, 2021b). Landslide densities within GeolCodes 1, 2, 3, and 5 are presented separately in the bottom plots.
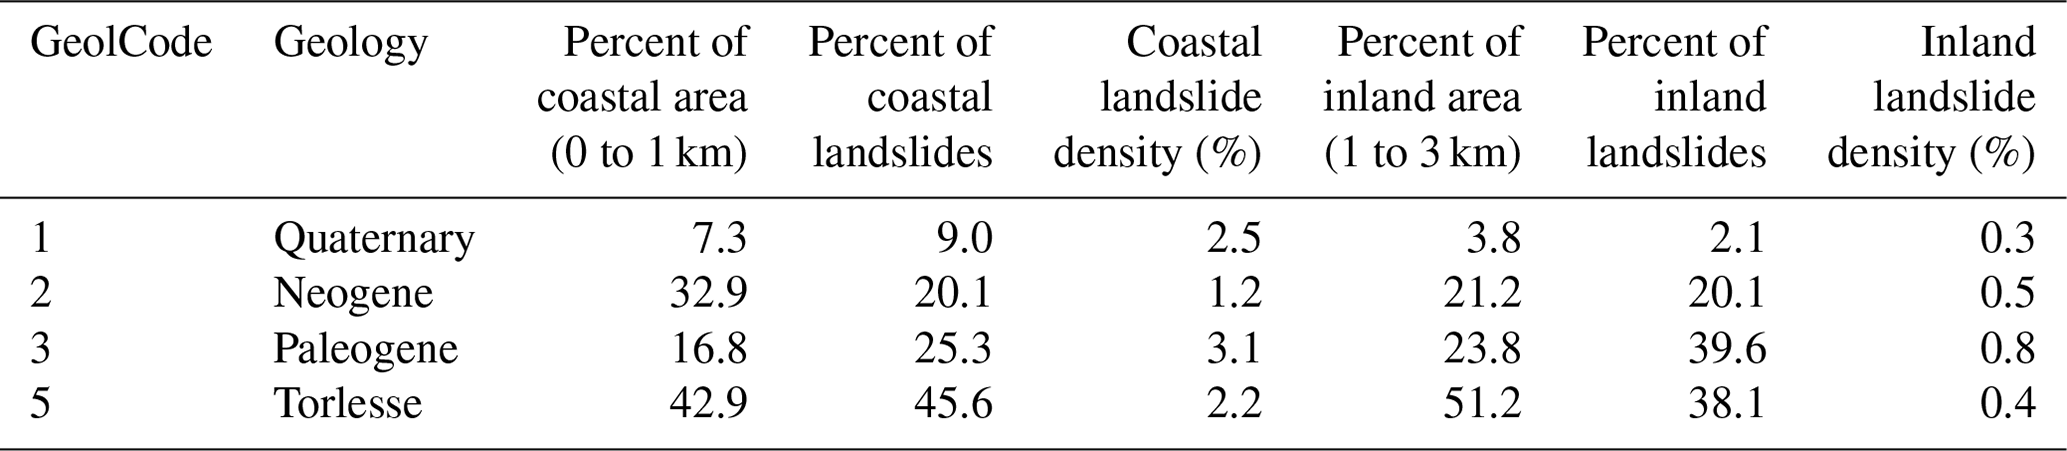
4.2 Distribution of lithology
Most landslides from the 2016 Kaikōura earthquake occur within Torlesse greywacke (GeolCode 5), younger sedimentary units (GeolCode 2 and 3), and unconsolidated Quaternary units (GeolCode 1) (Table 2). Less than 1 % of landslides were observed within volcanic rocks (GeolCode 4) or mapped pre-existing failures and hillslope deposits (GeolCode 6), which are not systematically mapped. Regional landslide density does not mirror the distribution of lithology (Table 2), and landslide source areas disproportionately occur within Upper Cretaceous to Paleogene sediments (GeolCode 3) and, along the coast, within Lower Cretaceous Torlesse greywacke (GeolCode 5). The general landslide density trends are primarily driven by these two geology types. Within ca. 100 m of the coast, landslide density is as high as ca. 6 % in both GeolCode 3 and GeolCode 5 (Fig. 4).
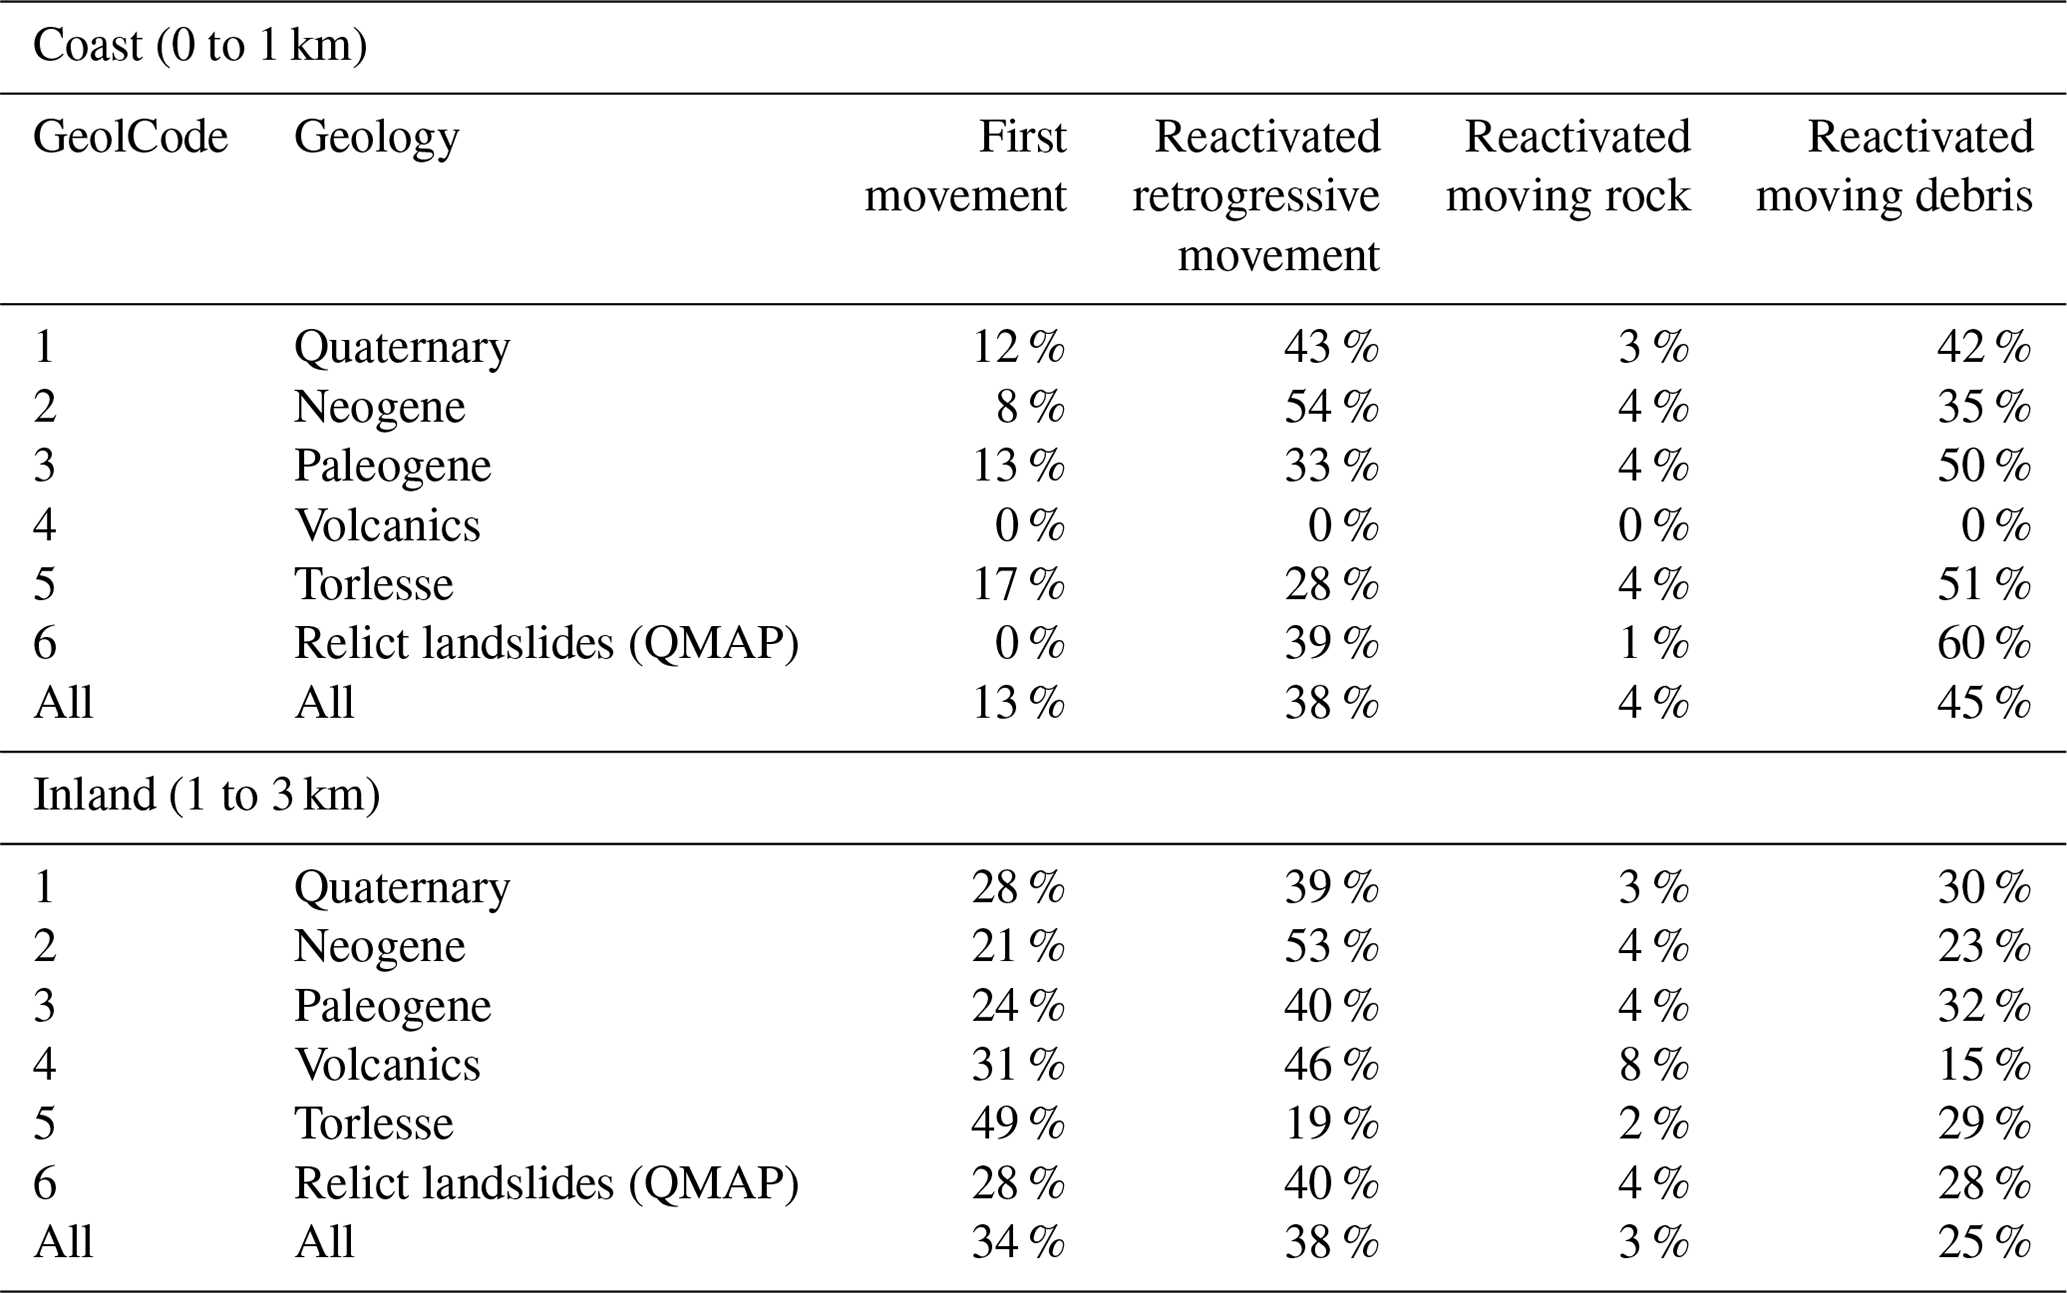
4.3 Landslide activity
Of the mapped landslides from the 2016 Kaikōura earthquake, ca. 13 % within 1 km of the coast and ca. 34 % between 1 and 3 km of the coast were first movements (Table 3). The remaining failures were a combination of reactivation of relict landslides, including retrogression of pre-existing landslide head scarps, and reactivation of landslide debris. Within Torlesse greywacke (GeolCode 5), ca. 49 % of inland landslides were first movements as compared with ca. 17 % of coastal failures (Table 3).
Table 3Earthquake-induced landslide activity in relation to past failures.
4.4 Coastal vs. inland earthquake-induced landslide susceptibility models
The AUC of cross-validated coastal models is generally consistent with similar studies (e.g. Reichenbach et al., 2018; Williams et al., 2021) and ranges from ca. 0.79 in coastal Neogene sediments (GeolCode 2) to ca. 0.92 in coastal Quaternary sediments (GeolCode 1) with generally low variability across 10 cross-validations (Fig. 5). Additionally, all model AUCs were within the range of cross-validations when independently testing model performance using 20 % of data withheld from model training (Fig. 5).
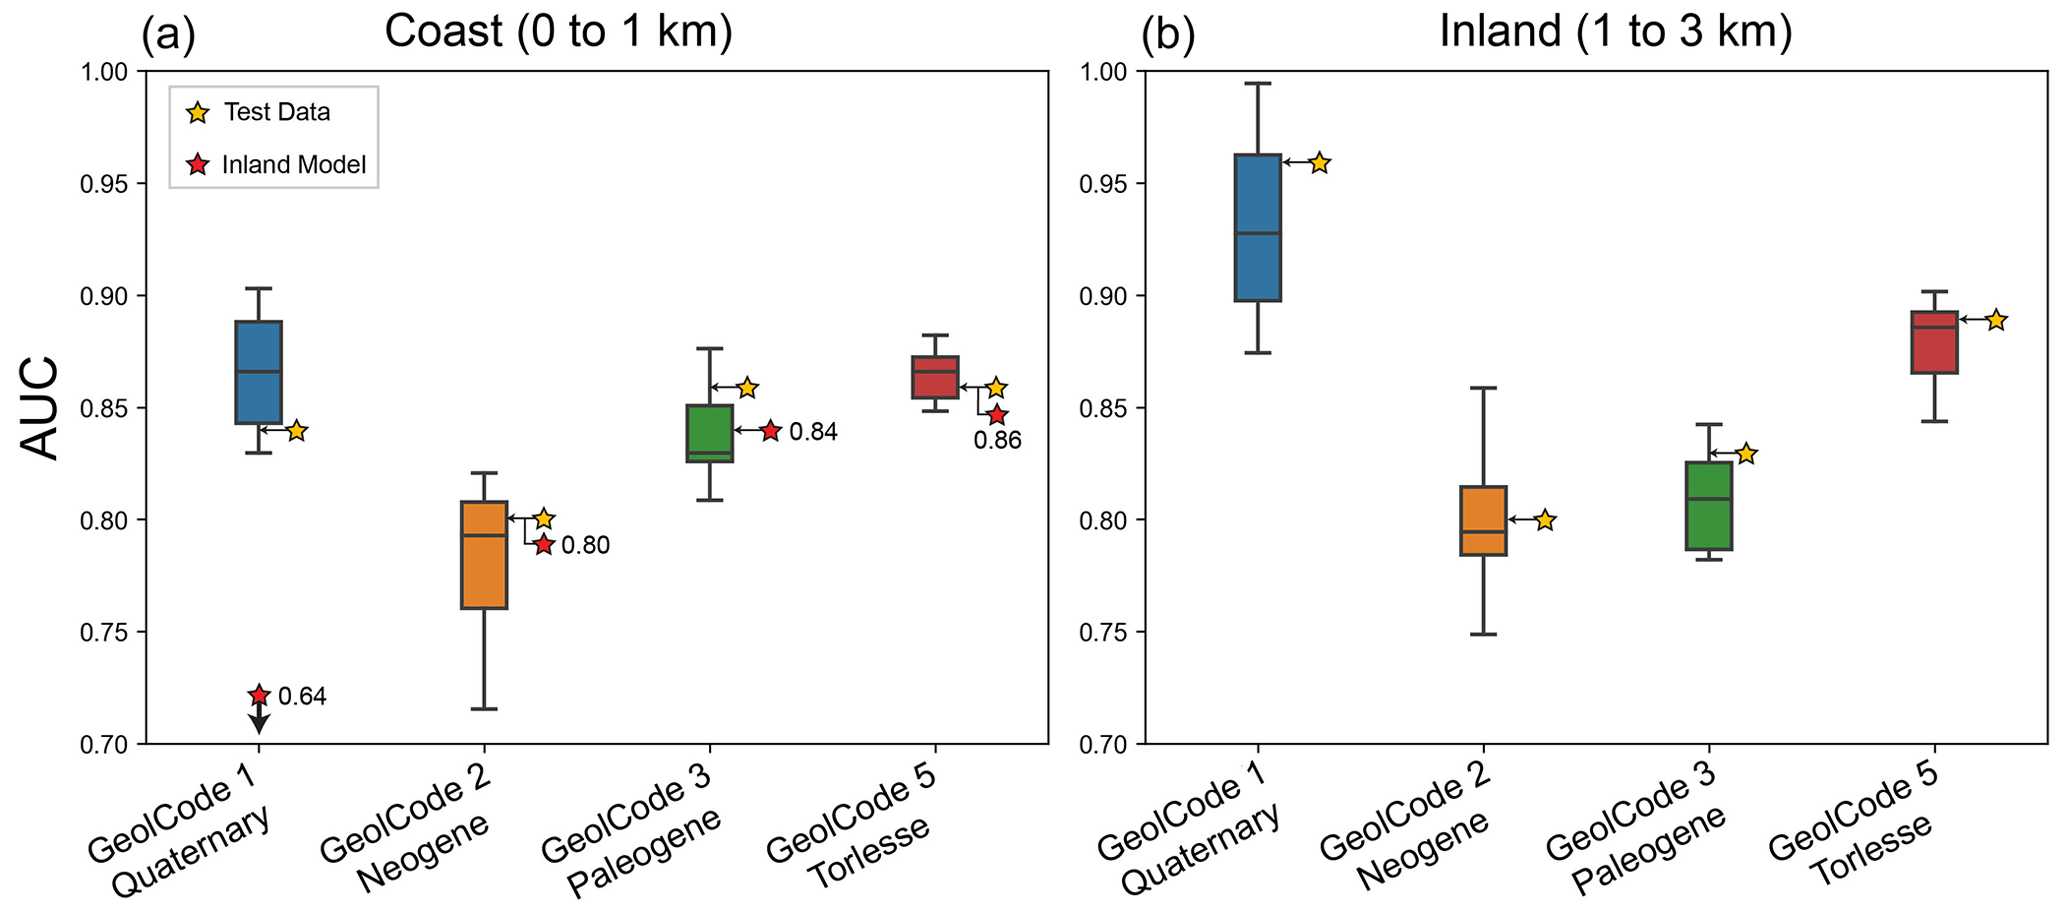
Figure 5Logistic regression model performance from models trained on each geology type (GeolCode) in coastal (a) and inland (b) hillslopes. Model performance is measured by the area under the receiver operator characteristic curve (AUC). Each boxplot shows the results of 10-fold cross-validation using 80 % of the available target dataset. The yellow stars represent the model performance when applied to the 20 % of data withheld from training. The red stars in the coast results represent the performance of the inland model when applied to the coast dataset. The red star with an arrow pointing down in the GeolCode 1 coast represents an AUC beyond the extent of the plot at 0.64.
The results of inland model training were used to predict the coastal landslide distribution (Figs. 5 and 6). Models trained on inland landslides and applied to coastal hillslopes generally produced the same or lower AUC values than models trained on coastal hillslopes (Fig. 5). There was a ca. 0.20 drop in AUC in GeolCode 1, a ca. 0.03 drop in GeolCode 3, and almost no drop in GeolCodes 2 and 5 (Fig. 5). Visual inspection of modelled landslide probability when applying the inland-trained model to coastal hillslopes also suggests relatively strong model performance (Fig. 6). We generally observe higher landslide probability where coastal landslides (not included in model training) occurred during the Kaikōura earthquake.
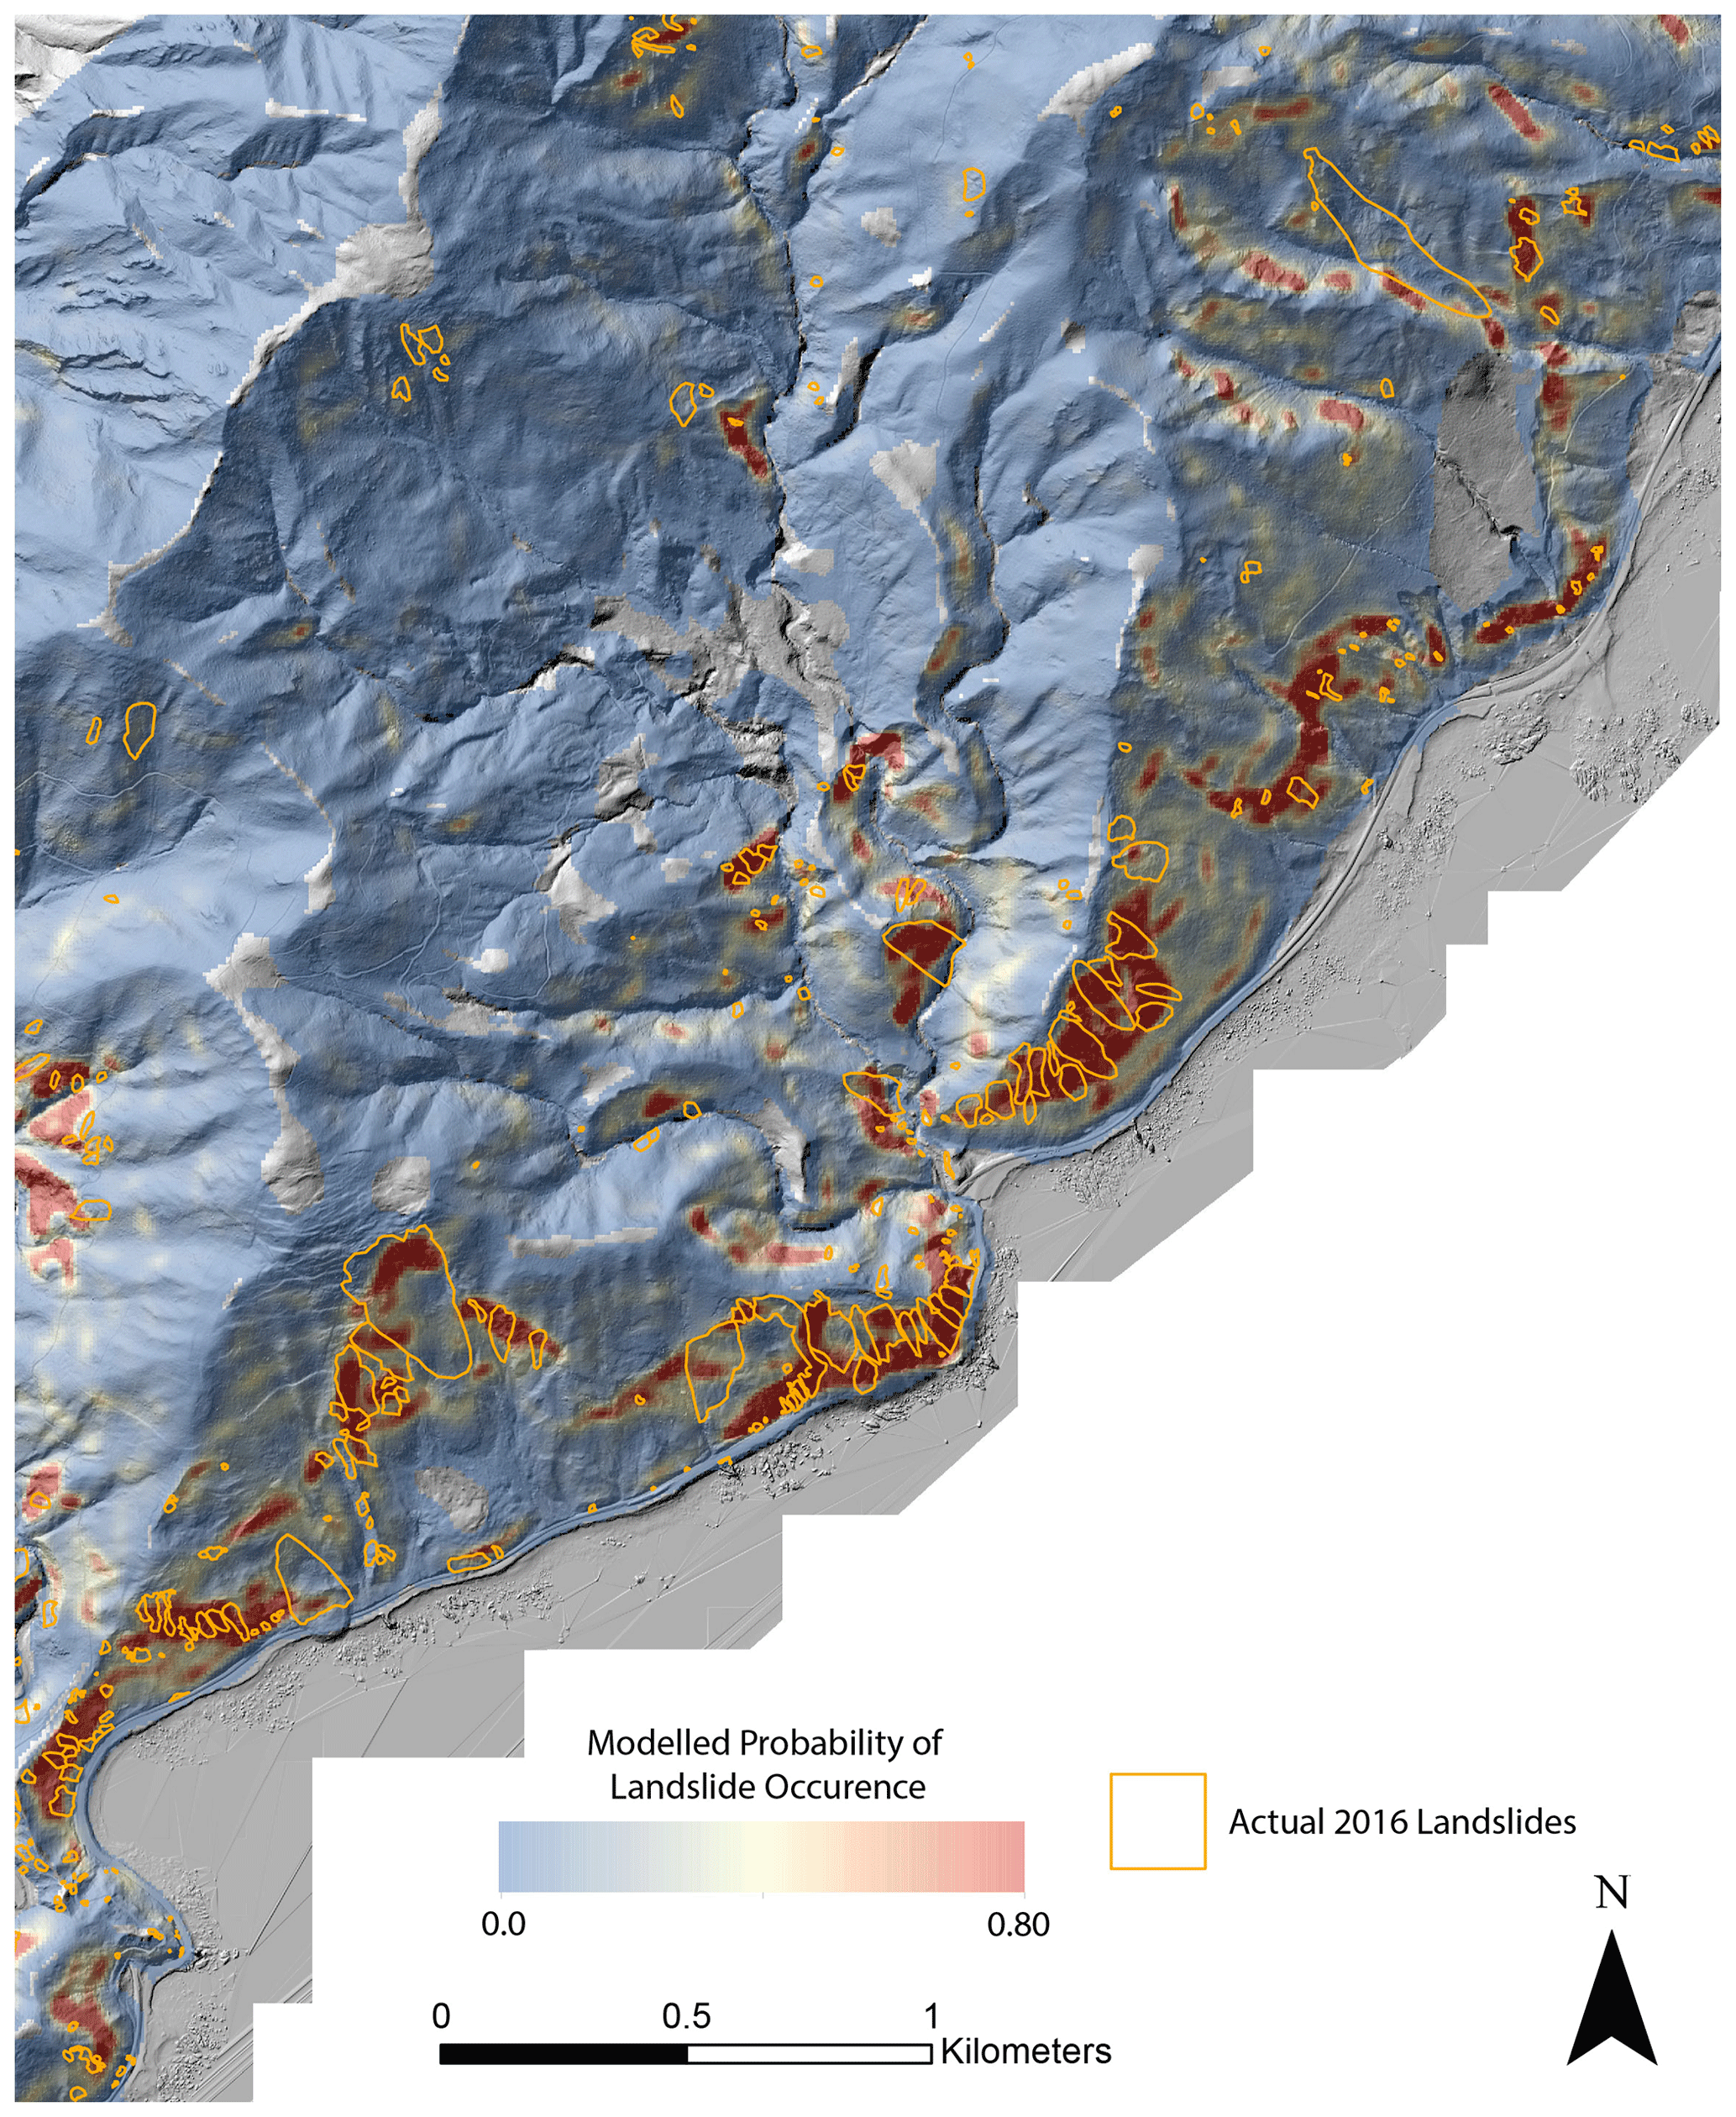
Figure 6Example of an inland-trained (1 to 3 km from the coast) landslide susceptibility model applied to both inland and coastal hillslopes. The base image is a hillshade of post-earthquake lidar (Massey et al., 2020b) with actual earthquake-induced landslides mapped by Massey et al. (2020a). The location is coincident with Fig. 2 (location identified in Fig. 1).
We compare and contrast model coefficients alongside the results of jackknife and single-variable models for each geology type (Figs. 7 and 8) to further examine the relative importance of the predictive features.
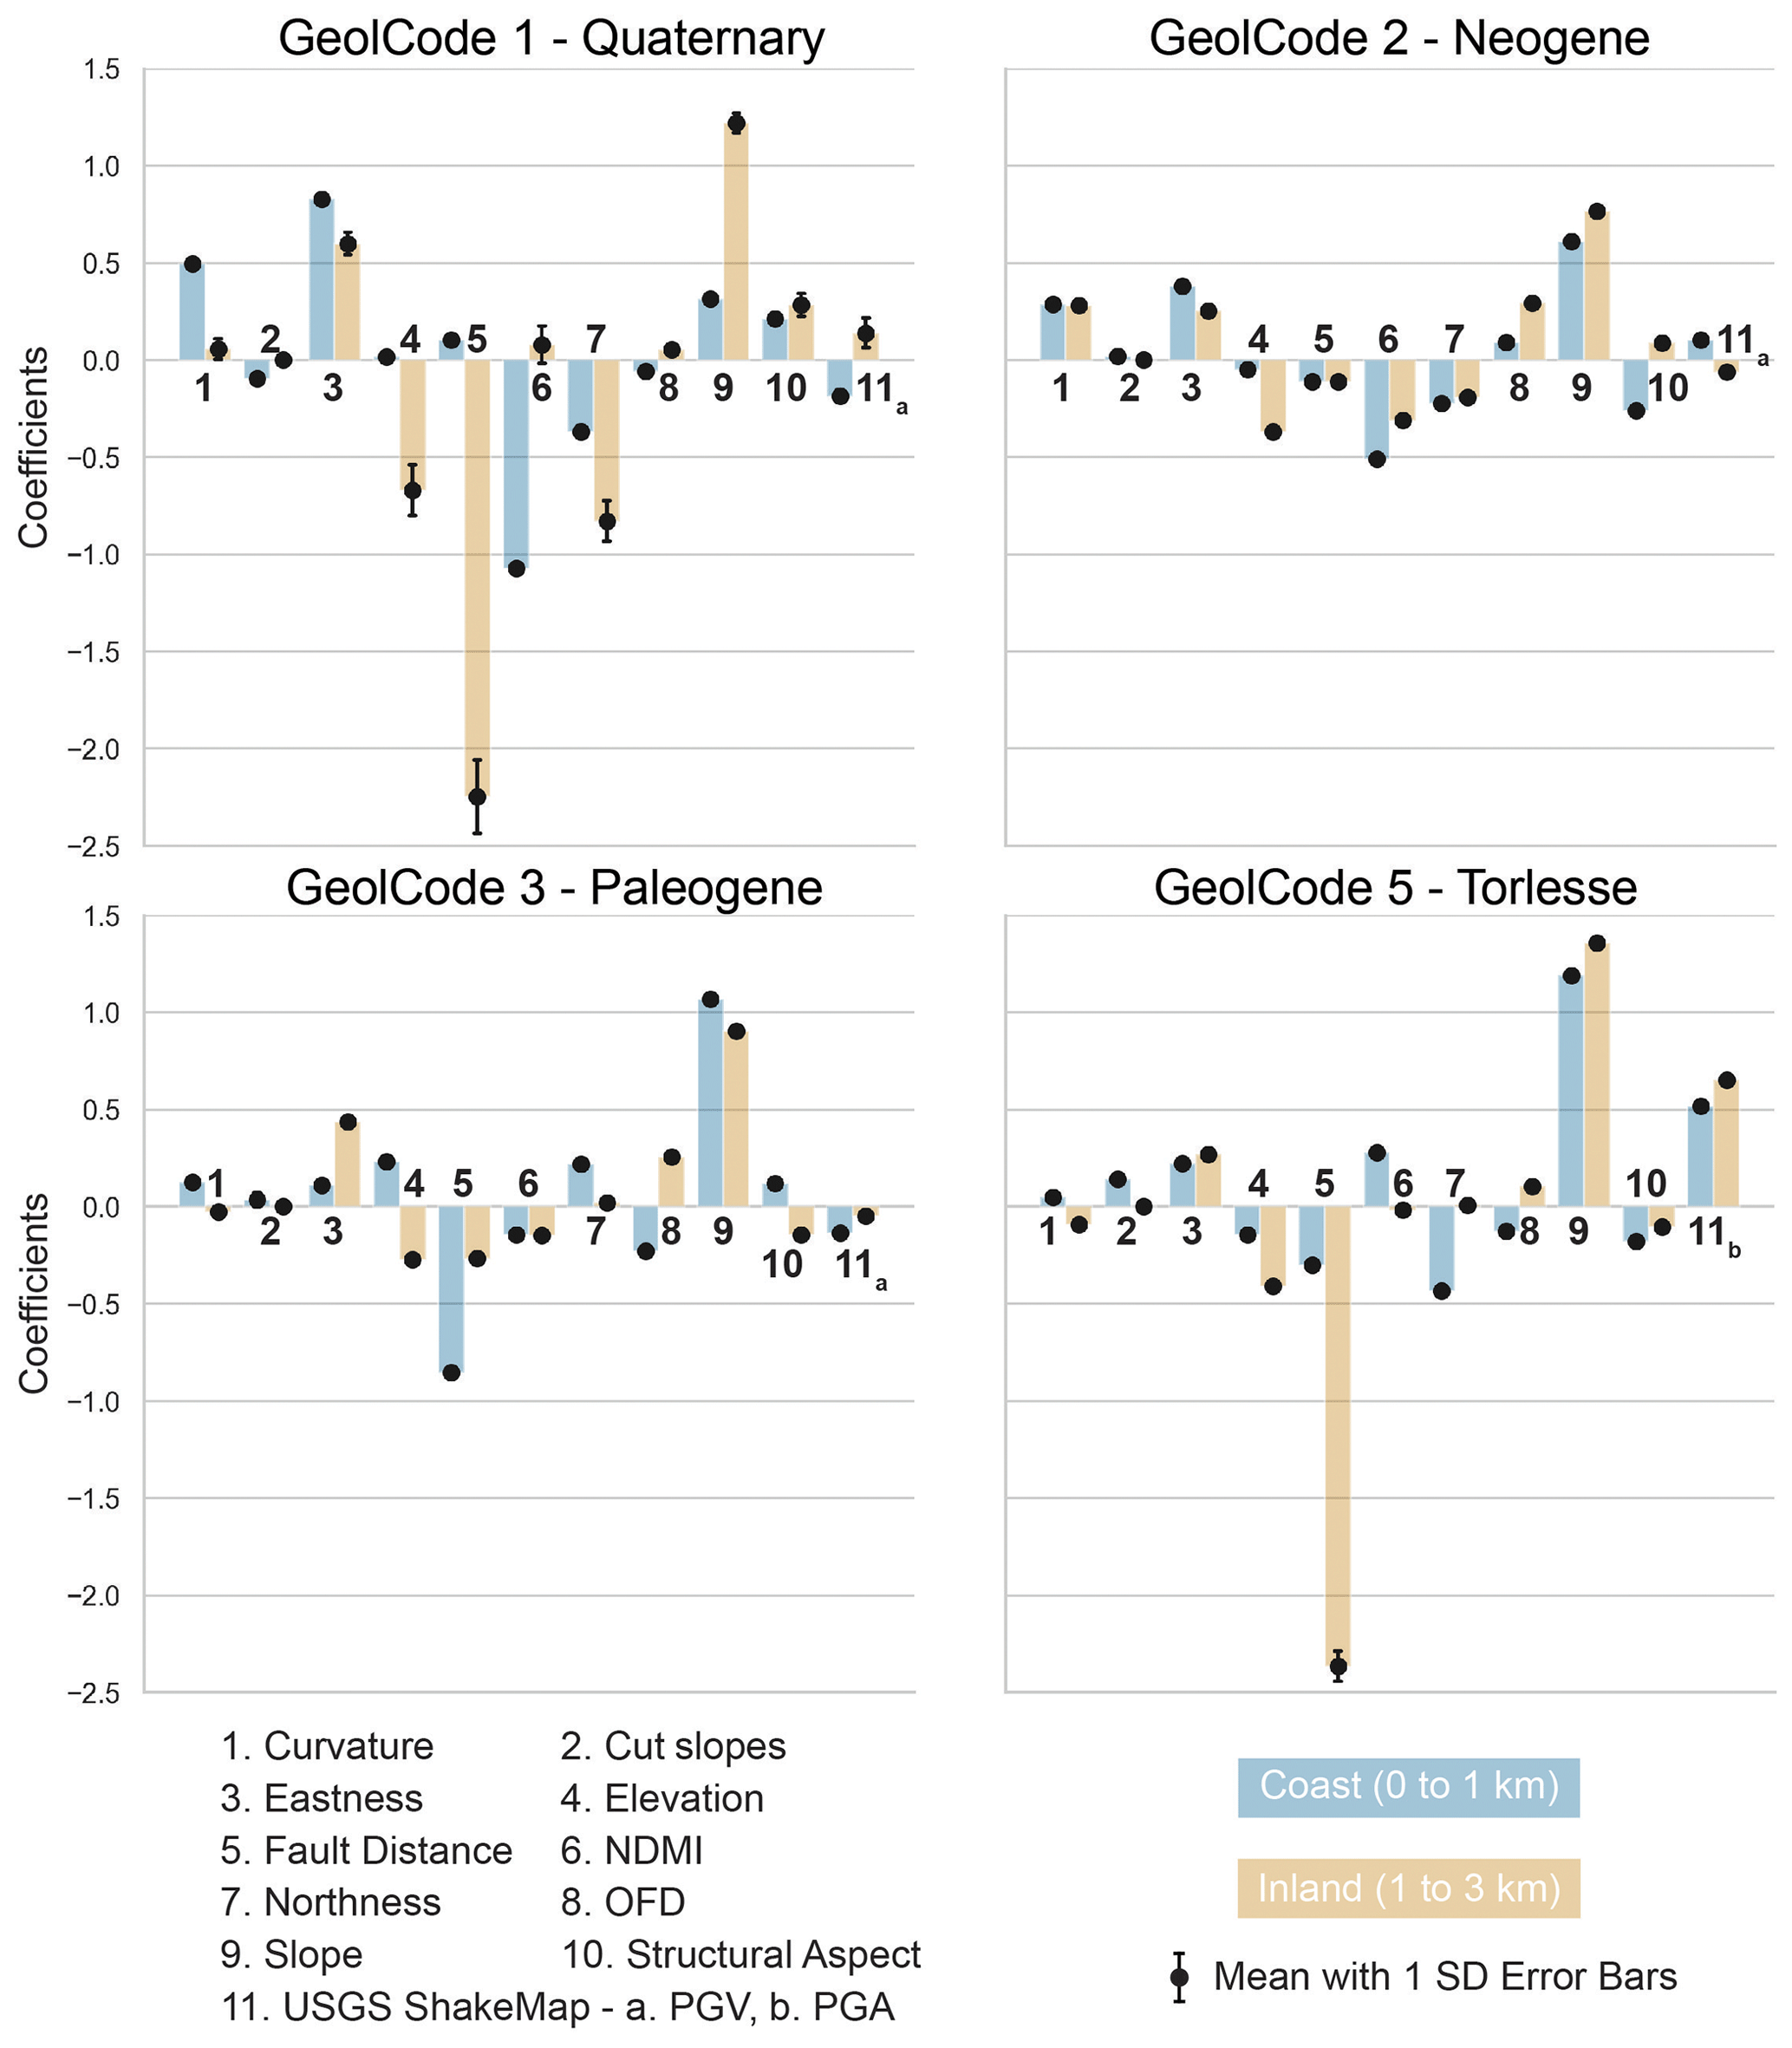
Figure 7Model coefficients for models trained on each GeolCode. The points with associated error bars represent the mean and standard deviation (SD) of the coefficient across 10-fold cross-validations. The colour bars indicate which feature the point is associated with and the model data used to train the model (either coast or inland). In cases where no error bar is present, the standard deviation is less than 0.1. Negative coefficients result in a higher weight for small values, while positive coefficients result in a higher weight for high values. For example, a negative coefficient for fault distance suggests that there is a higher landslide susceptibility closer to faults, while a positive coefficient for slope suggests that a greater slope angle has higher landslide susceptibility. All features are standardized prior to model training, allowing for the direct comparison of coefficients within the same model.
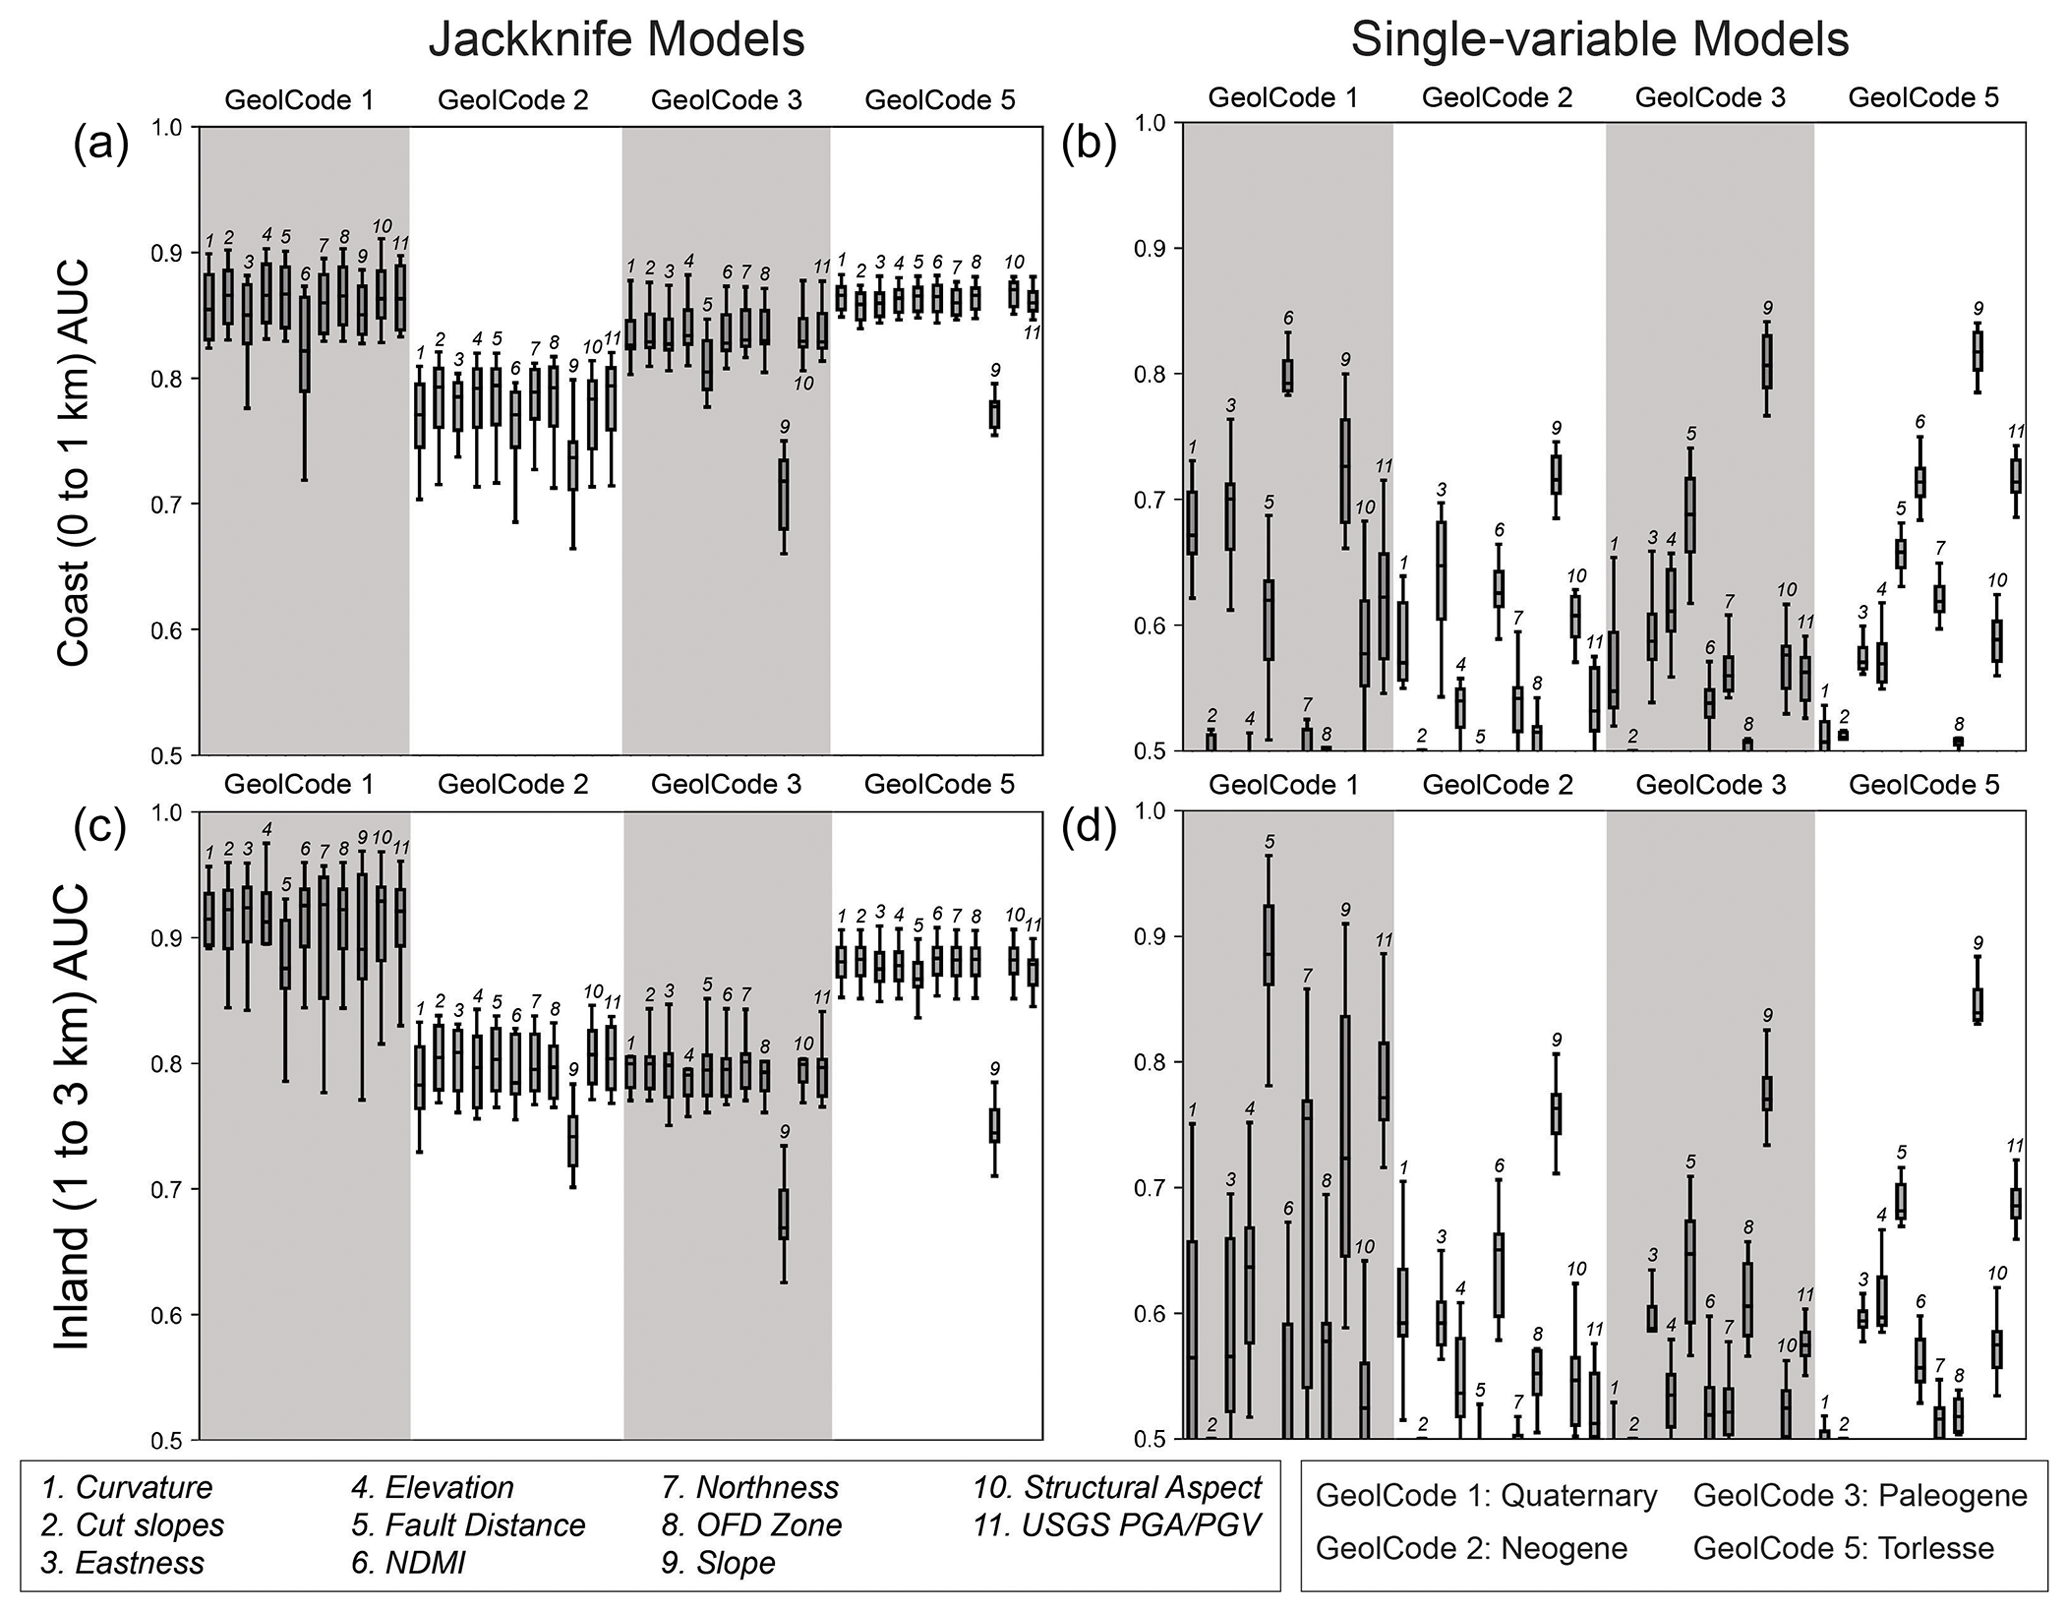
Figure 8Results of jackknife (a, c) and single-variable (b, d) logistic regression models. The model performance is measured by the area under the receiver operator characteristic curve (AUC). The boxplot for each model shows the results of a random 10-fold cross-validation. In jackknife models, a single model feature is iteratively removed from model training, and a bigger drop in AUC represents higher feature importance. In single-variable models, a separate model is trained using each feature, and a higher AUC represents a higher explanatory value. An AUC close to 0.5 represents near-random results, while an AUC near 1 represents near-perfect results (Hosmer et al., 2013).
4.4.1 GeolCode 1 – Quaternary
For inland (1 to 3 km from the coast) unconsolidated Quaternary units (GeolCode 1), the distance to fault and slope features had the highest model coefficients (Fig. 7). For coastal hillslopes (0 to 1 km from the coast), a low model coefficient was observed for the NDMI (soil moisture) feature, suggesting an inverse relationship where lower values of the soil moisture proxy predict higher landslide susceptibility. A ca. 0.04 drop in AUC was observed for coastal jackknife models trained without the NDMI predictor (Fig. 8). In single-variable models, NDMI alone produced an AUC of ca. 0.79 ±0.03 (±1σ) in coastal hillslopes, ca. 0.07 higher than the slope-only model which yielded the next highest AUC. In jackknife models of inland hillslopes, there was not a substantial drop in AUC for any model iteration, and in single-variable models of inland hillslopes, a number of features produced high model performance (fault distance an AUC of ca. 0.88±0.04, ShakeMap PGV an AUC of ca. 0.79±0.03, and slope an AUC of ca. 0.74±0.11; Fig. 8).
4.4.2 GeolCode 2 – Neogene
In Neogene sediments (GeolCode 2), a similar distribution of coefficients for inland and coastal hillslopes was observed, with the highest model coefficients for the slope feature (Fig. 7). Additionally, negative coefficients for NDMI were observed in both inland and coastal hillslopes. While observations of model coefficients were largely supported by jackknife models in both inland and coastal hillslopes, the most substantial drop in AUC (ca. 0.05) was seen with the exclusion of the coastal slope feature (Fig. 8). Single-variable models showed an AUC of ca. 0.72±0.02 for coastal slope features and ca. 0.75±0.03 for inland slope features (Fig. 8).
4.4.3 GeolCode 3 – Paleogene
In Paleogene sediments (GeolCode 3) a similar distribution of coefficients was again observed in inland and coastal hillslopes, with the highest model coefficients for the slope and distance to fault features (Fig. 7). A strong negative coefficient was also observed for the mean PGA in inland hillslopes. In jackknife models there was a ca. 0.13 drop in both coastal and inland model AUCs with the removal of the slope feature and a ca. 0.03 drop in a coastal model AUC with the removal of the fault distance feature (Fig. 8). In single-variable models, slope showed the best model performance, with an inland model AUC of ca. 0.77±0.03 and a coastal model AUC of ca. 0.81±0.03 (Fig. 8).
4.4.4 GeolCode 5 – Lower Cretaceous
In Lower Cretaceous Torlesse greywacke (GeolCode 5), high model coefficients were observed for the slope and mean PGA features, although these are strongly outweighed by the fault distance feature in inland hillslopes (Fig. 7). A ca. 0.09 drop in a coastal model AUC and a ca. 0.13 drop in an inland model AUC were observed with the removal of the slope feature in jackknife models (Fig. 8). Interestingly, only a ca. 0.01 drop in an inland model AUC was observed with the removal of the fault distance feature despite a high model coefficient. As a single feature, slope had the highest AUC in both inland (0.85±0.2) and coastal (0.82±0.02) models (Fig. 7), while PGA had an AUC of ca. 0.72±0.02.
4.5 Summary of results
Despite an order of magnitude higher landslide density observed within 1 km of the Kaikōura coast (Fig. 4), few significant differences were observed between modelled coefficients in inland and coastal landslide susceptibility models. Additional models trained on both coastal and inland data yielded similar model coefficients (Fig. B2). Models trained on data from 1 to 3 km inland and applied to coastal hillslopes from 0 to 1 km were still highly predictive and only resulted in a 0.03 or less drop in AUC as compared with models trained and tested on coastal hillslopes in GeolCodes 2, 3, and 5 (Fig. 5). These three geology types account for greater than 90 % of coastal landslide density (Table 2).
The larger variation in model performance (ca. 0.20) between inland and coastal models of GeolCode 1 could represent a true difference between inland and coastal landslide susceptibility. Inland GeolCode 1, however, accounts for less than 4 % of the total inland area and ca. 2 % of inland landslides (Table 2). Given a slightly larger spread in AUC (Figs. 5 and 8) and model coefficients (Fig. 7) across 10 cross-validations, it is also possible that there is simply not enough data to train an effective model in inland GeolCode 1.
Some minor differences in model coefficients were observed, in particular the higher importance of fault distance in coastal GeolCode 3 and inland GeolCode 5, but these do little to explain the overall landslide density trend. Despite a high model coefficient for fault distance in inland GeolCode 5, there was only a ca. 0.01 drop in AUC in jackknife models, suggesting a potentially high correlation with other predictive features (likely PGA; Fig. A2). Across jackknife and single-variable models, slope and, in the case of GeolCode 5, PGA appear to be much stronger and more effective features than fault distance for predicting the regional landslide distribution within both inland and coastal hillslopes of the Kaikōura region.
5.1 Factors controlling increased coastal landslide density
Modelling of landslide susceptibility successfully captures the coastal distribution of landslides from the Kaikōura earthquake but does not provide a clear explanation for the order of magnitude difference in inland and coastal landslide density. To better explain this occurrence, the distribution of several of the most important landslide susceptibility features from the modelling was further examined (Fig. 9; additional features are discussed in Appendix B).
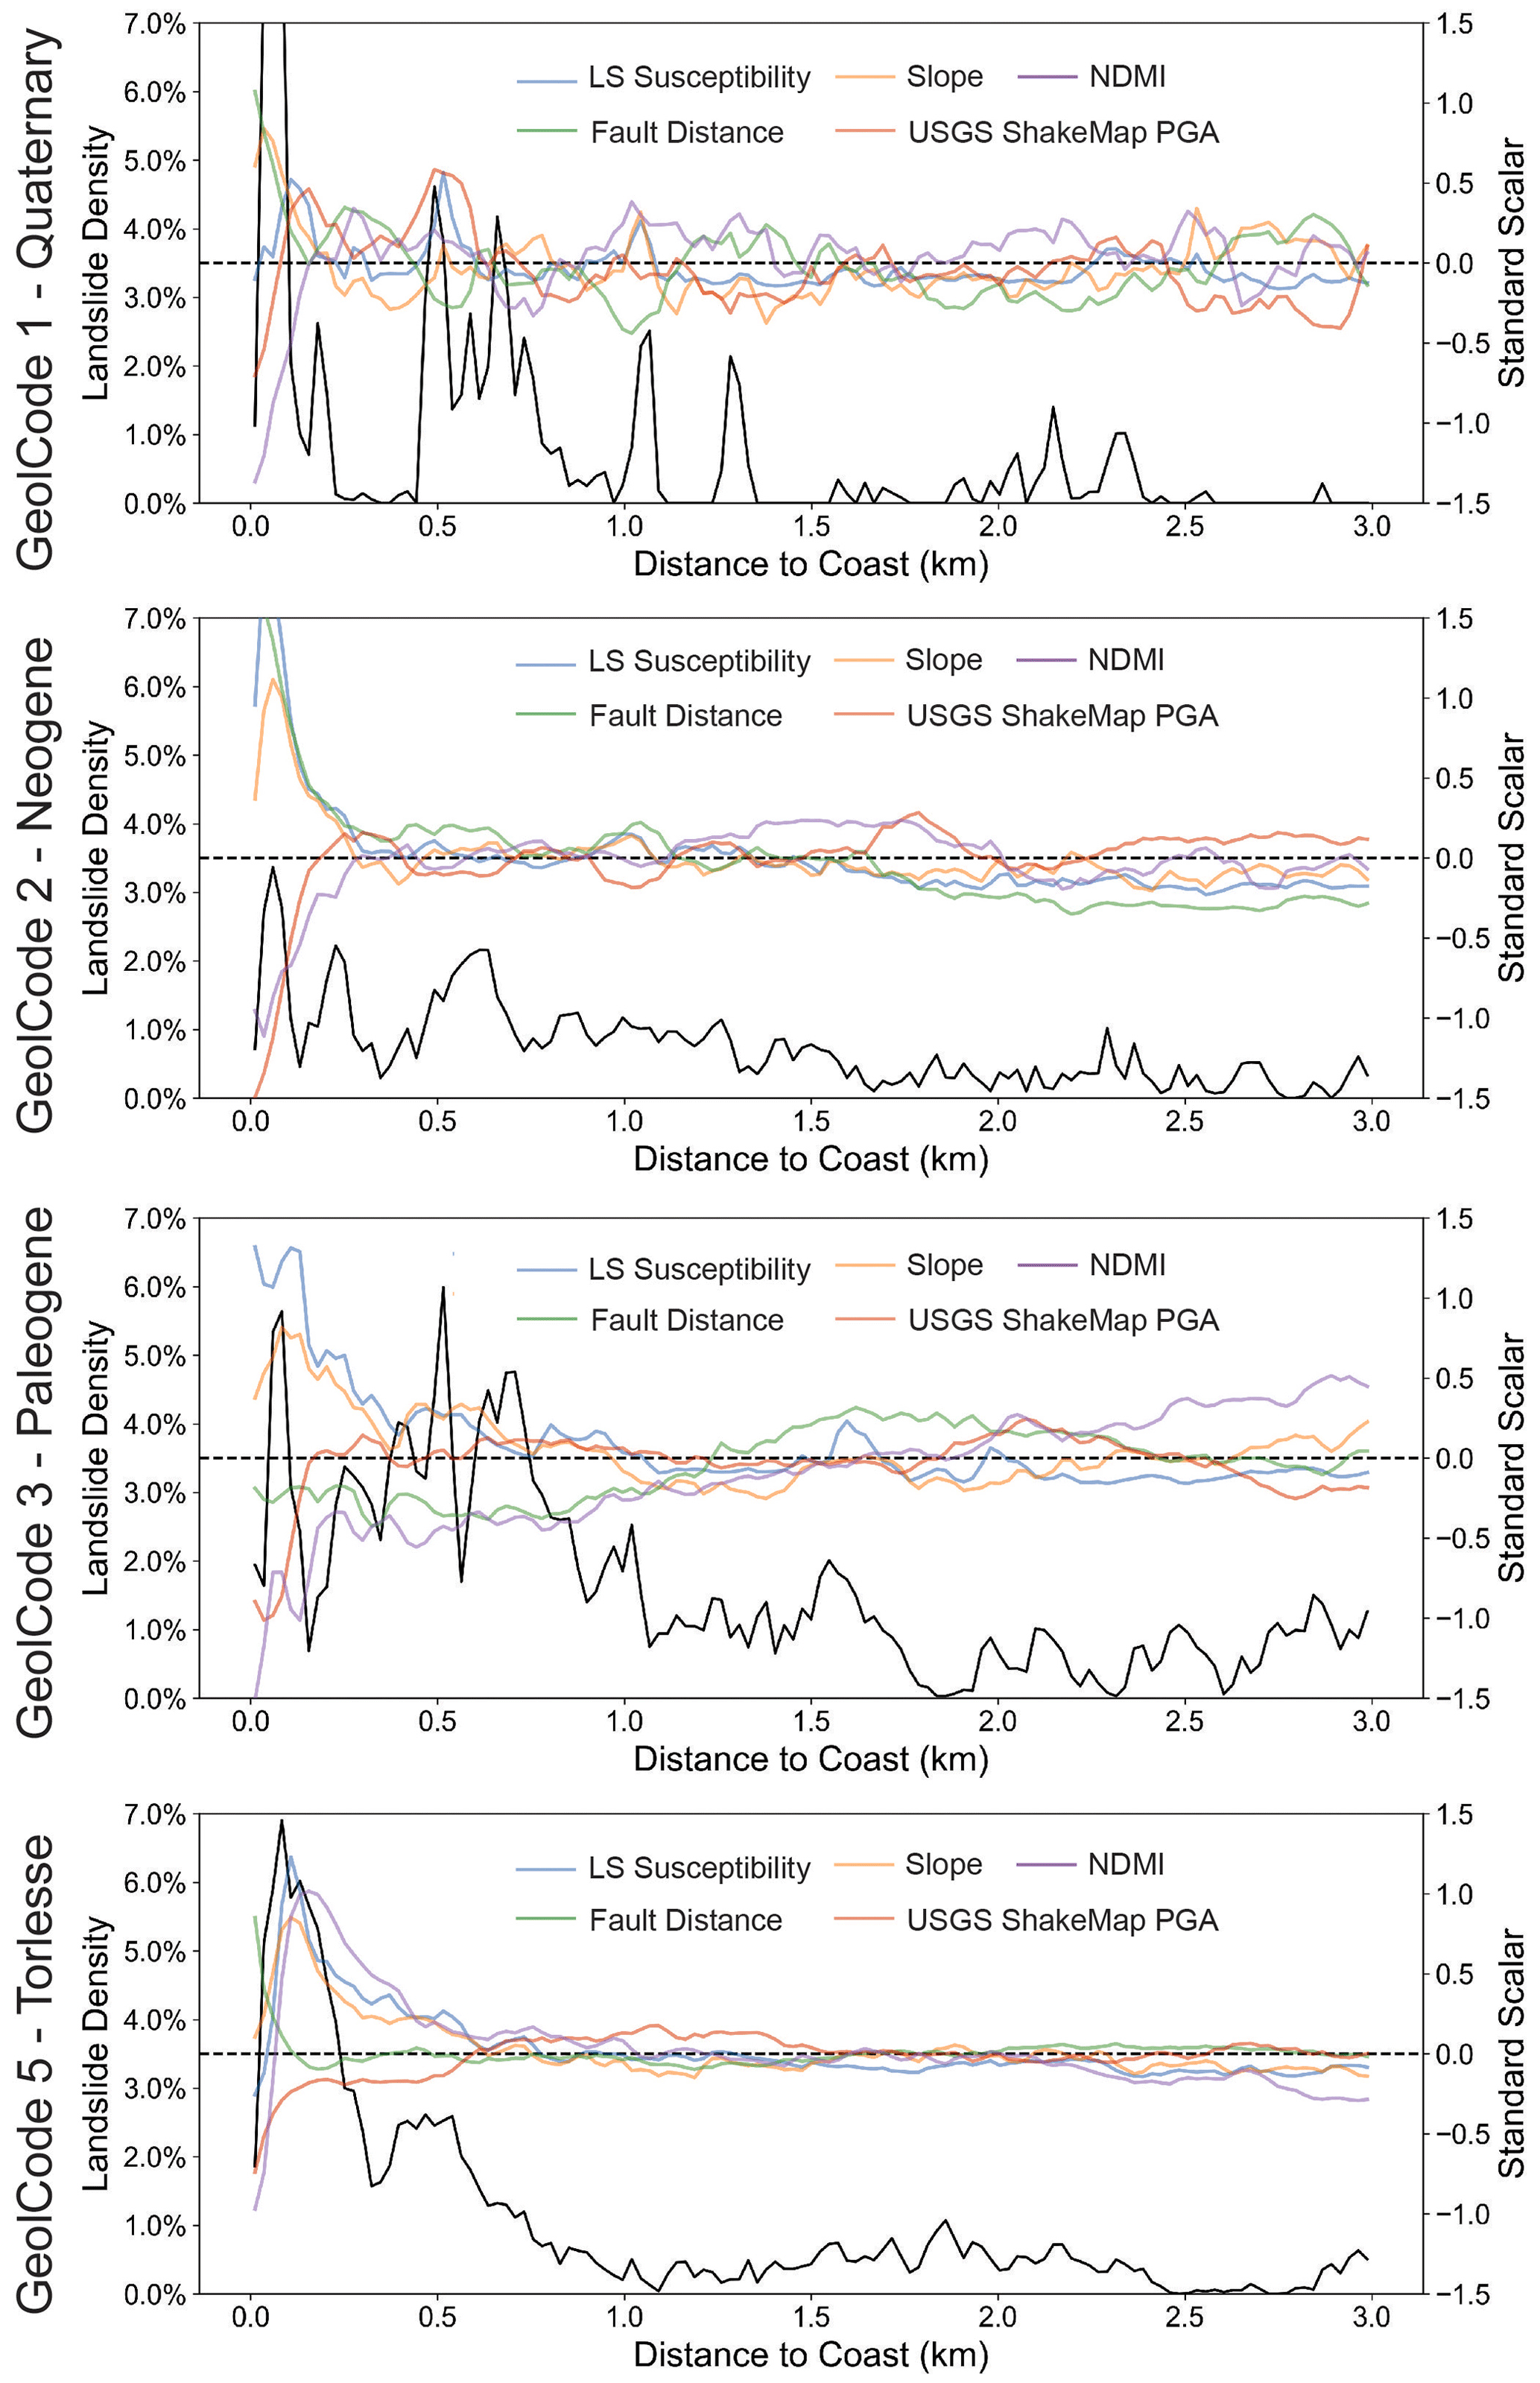
Figure 9Landslide density for each GeolCode (solid black line) within 24 m bins at an increasing distance from the Kaikōura coast plotted alongside the distribution of standardized predictive features (orange, green, purple, and red lines) and landslide (LS) susceptibility (blue line) based on a logistic regression model trained on inland data from 1 to 3 km. Standardized features and landslide susceptibility are presented as the mean of values within 24 m bins with distance from the coast.
Slope. Model coefficients and jackknife models (Figs. 7 and 8) suggest that slope is one of the most important features determining the distribution of landslides from the Kaikōura earthquake in both inland and coastal slopes. Massey et al. (2018) noted a lower overall distribution of slope near the coast in the Kaikōura region; however, when hillslopes below 15∘ are excluded, we observe a slightly higher average slope (ca. 1∘) within 1 km of the coast as compared with 1 to 3 km inland (Fig. B3). While this difference may seem small, the variation in slope with distance from the coast largely mirrors modelled landslide susceptibility and landslide density trends across geology types (Fig. 9). Steeper slopes, predominantly those occurring within ca. 500 m of the coastline (Fig. 9), appear to have a primary control on increased coseismic landslide density in proximity to the Kaikōura coastline.
Strong ground motion (mean PGA and distance to fault). Across geology types a decrease in ground motion and an increase in fault distance are observed at ca. 500 m from the coast. This is particularly evident in GeolCode 5 (Fig. 9) and does little to explain the observed landslide density trends. It is important to note, however, that there is a large concentration of landslides on the northern Kaikōura coast where modelled ground motion is high, and model coefficients suggest that, particularly for GeolCode 5, high modelled PGA is a good predictor of coastal landslide density (Fig. 7). The steep decrease in modelled PGA/PGV observed near the coast (Fig. 9) could be a result of increasing distance from the seismic source south of Kaikōura. Here, coastal landslides concentrate within weaker actively eroded lithologies that fail at lower ground motions (Bloom et al., 2023).
Topographic and site amplification of seismic waves (e.g. Ashford et al., 1997) likely contributed to local variability in strong ground motion intensity within individual coastal and inland hillslopes during the Kaikōura earthquake. Ground motion variability is known to influence landslide susceptibility (e.g. Sepúlveda, 2022; Massey et al., 2022) but remains challenging to estimate on a regional scale. Outside of applying regional ground motion intensity estimates (PGA/PGV from the USGS ShakeMap), this analysis does not investigate the role of site-specific ground motion. Given the coarse native resolution of PGA/PGV estimates from the USGS ShakeMap (336 m pixel−1; Worden et al., 2020), uncharacterized ground motion variability may have an influence on the distribution of landslides from the 2016 Kaikōura earthquake.
Lithology and geologic structure (geology and structural aspect). A similar distribution of lithology was observed in both inland and coastal hillslopes (Table 2), and it is assumed that, over short distances, geology has a relatively consistent influence on landslide susceptibility. As a result, while geology appears to strongly modulate landslide density, it does not readily explain the increase in coastal landslide density from the 2016 Kaikōura earthquake. Likewise, the correlation between lithologic bedding and topographic aspect does not strongly define coastal landslide susceptibility on the Kaikōura coast. There is some correlation between bedding and aspect within GeolCode 3 along the coast north of the Clarence River mouth (Fig. 1) and in coastal GeolCode 5 where landslide densities are higher. However, hillslopes within the heavily deformed GeolCode 5 may be susceptible to failure regardless of the presence of persistent structural discontinuity. In the heavily jointed rock mass, debris and rock avalanches, the dominant failure mechanism along the Kaikōura coast can develop along centimetre- to metre-scale discontinuities (Singeisen et al., 2022) that are not captured by the estimation of larger-scale bedding. Furthermore, field investigations along the Kaikōura coast (e.g. Stringer et al., 2021) have shown that many failures from the 2016 earthquake, particularly in mapped GeolCode 5, occurred as reactivations of pre-existing landslide debris or within Quaternary hillslope deposits that were unlikely to be strongly influenced by bedding orientation. While QMAP (Rattenbury et al., 2006) provides the highest-resolution mapping currently available at the required extent for this regional analysis, the mapping resolution is not high enough to sufficiently resolve these materials regionally.
Fault zones (distance to fault and OFD). Bloom et al. (2022) observed a higher incidence of landslides within the fault zone of ruptured faults from the 2016 Kaikōura earthquake. While there is a slightly higher density of landslides within the OFD zone, there is a lower proportion of OFD area along the Kaikōura coastline as compared with inland hillslopes. Approximately 0.6 % of coastal area occurs within the OFD zone of surface fault rupture from the 2016 Kaikōura earthquake, while ca. 2.5 % of inland hillslopes occur within a mapped OFD zone. Landslide source areas that occur within the OFD zone account for ca. 19 % of landslide source area in inland hillslopes but only ca. 1 % of landslide source area along the coast.
OFD may partially explain the distribution of landslide source areas in inland hillslopes but does little to explain widespread coastal failures or the order of magnitude greater number of coastal landslides. This being said, there is still some ambiguity as to the influence of rock mass deformation from fault zones along the coast that did not rupture significantly in 2016, for example the Hope fault, which extends just offshore in parallel to much of the northern Kaikōura coast. A history of strong ground motion and fault deformation has been shown to progressively decrease rock mass strength and increase landslide susceptibility over multiple earthquakes (Parker et al., 2015; Gischig et al., 2016; Bloom et al., 2022; Massey et al., 2022). This may result in an increased landslide susceptibility due to amplification of strong ground motion and decreased rock mass strength. While it is possible that damaged rock within the fault zone of the Hope fault results in a higher landslide density in the northern Kaikōura coast, there is also an increase in landslide susceptibility along the coast south of Kaikōura, where faults like the Hundalee are present further offshore (Fig. 1). This suggests that the relatively continuous zone of increased coastal landslide density is not solely influenced by fault zones on the Kaikōura coast.
Anthropogenic modification of slopes (cut slopes). Uplifted shore platforms and marine terraces both north and south of Kaikōura have been anthropogenically modified by cut and fill slopes to support road and rail infrastructure. Most fill slope failures are too small and are not steep enough to be resolved in this analysis (which considers failures greater than 50 m2 and slopes steeper than 15∘). Cut slopes only account for ca. 1 % of hillslopes along the Kaikōura coastline. Approximately 4 % of coastal landslides (63 of 1621) were found to be in contact with a cut slope near the coast. Even if we consider all failures associated with cut slopes to be a direct result of hillslope modification, this cannot fully explain the higher density of coastal landslides well beyond anthropogenic influence.
Precipitation, soil moisture, and enhanced weathering (NDMI). NDMI, a proxy for soil moisture, is generally similar within coastal and inland hillslopes (Fig. B3). In Torlesse greywacke (GeolCode 5), NDMI is on average 0.17 for coastal hillslopes and 0.13 for inland hillslopes, which could indicate increased moisture along greywacke portions of the Kaikōura coast 1 month prior to the earthquake (Figs. 9 and B3). A high spatial variability in average rainfall observations (NIWA, 2022), however, makes it difficult to expand this observation out to longer timescales. It might be expected that increased rainfall and other moisture on the coast would increase chemical weathering rates, leading to a reduction in rock mass strength, but it is not currently possible to characterize these influences on a regional scale. On a single-event or seasonal timescale, increased NDMI might be a proxy for increased pore water pressure along the Kaikōura coast; however, models suggest that higher NDMI, itself, does not fully explain the distribution of earthquake-induced landslides. In Quaternary and Neogene units, and to a lesser extent Paleogene units, lower NDMI is actually a better predictor of landslide occurrence (Fig. 7). NDMI is strongly correlated with vegetation greenness (Table A2), and less vegetation may help to explain some shallow failures. In Lower Cretaceous Torlesse greywacke, NDMI is a comparatively weak predictor of earthquake-induced landslides in both inland and coastal hillslopes.
5.2 Conceptual model relating coastal hillslope morphology and landslide susceptibility to geomorphic history
Based on the distribution of landslide susceptibility features and statistical analysis, the slope feature provides much of the explanation for increased landslide density along the Kaikōura coastline (Fig. 9). The distribution of slope within each GeolCode (Fig. 9) reveals substantially steeper slopes (up to ca. 4∘ higher on average) within ca. 250 to 500 m of the coast, particularly within GeolCodes 2, 3, and 5.
In many regions, coastal oversteepening results from a combination of uplift and wave action that actively undercuts coastal cliffs (Emery and Kuhn, 1982). In the Kaikōura region, however, most steep coastal slopes, with the exception of those at Conway Flat (Bloom et al., 2023), are currently isolated from direct wave action by recent uplift, which forms shore platforms. The ages of these uplifted platforms (Howell and Clark, 2022) suggest that this isolation has lasted for several hundred years at the least. Only 16 landslides outside of Conway Flat (ca. 1 % of landslides) have a direct connection with the ocean. As a result, while rapid uplift of the Kaikōura coast (Ota et al., 1996) contributes to steeper slopes, the contributions of wave erosion to long-term coastal evolution are less clear.
Increased landslide susceptibility along the coast can be traced back to physical variables associated with the geomorphic evolution of these hillslopes (Fig. 10). The primary observation is that coastal-facing slopes are generally steeper than their inland counterparts (Fig. 9). These steepened slopes also tend to coincide with pre-Kaikōura earthquake landslides – approximately 83 % of coastal landslides in Torlesse greywacke occurred partially to wholly within areas affected by past landslides (Table 3), often as reactivations (retrogression) of their head scarps (Fig. 2). Similar trends are observed for the distribution of landslides within younger sedimentary units (Table 3), and these findings are in line with field observations along the Kaikōura coast following the 2016 earthquake (e.g. Mason et al., 2017; Stringer et al., 2021). Thus, steeper coastal hillslopes are more prone to failure due to larger driving forces (i.e. gravitational component due to slope) and are collocated with rock masses at reduced or residual strength, leading to relatively low factors of safety and higher landslide susceptibility.
Relict landslides are a common observation in the hillslopes above uplifted shore platforms along the Kaikōura coast, particularly within Torlesse greywacke (GeolCode 5; Fig. 2). These relict landslides have left steep, potentially destabilized head scarps and, in some cases, debris within the body of failures (Stringer et al., 2021). The provenance and timing of these relict failures are largely unclear, but a general lack of deposited material at the base of the hillslopes (Fig. 2) suggests that they may have developed while in contact with an active erosional source, such as rivers or the ocean (Fig. 10; Crozier, 2010).
In our conceptual model, wave action leads to cliff collapse and landsliding while the ocean is in direct contact with the hillslope (Figs. 10(1) and 10(2)). Once uplift or relative sea level fall occurs, hillslopes are buffered from wave action at the toe but remain oversteepened, particularly within upper slopes where relict landslide head scarps are present (Fig. 10(3) and 10(4)). In the case of the Kaikōura region, uplifted wave cut platforms provide ideal locations for transportation infrastructure (Fig. 10(5)). While modification of lower hillslopes may not result in substantially increased landslide susceptibility on a regional scale, oversteepened upper hillslopes may remain highly susceptible to coseismic failure over multiple earthquake events (Fig. 10(6); Rault et al., 2019; Singeisen et al., 2022). Increased susceptibility is likely to persist until the hillslope reaches a state of relative equilibrium with the surrounding landscape or until active erosion recurs at the base of the slope (Crozier, 2010). With coastal uplift rates of ca. 2 to 0.5 mm yr−1 (Ota et al., 1996) along the Kaikōura coast, oversteepened slopes could represent up to thousands of years of increased landslide susceptibility. Without an active erosional source, earthquakes and large rainfall events may disproportionately contribute to the geomorphic evolution of these coastal hillslopes (Fig. 10).
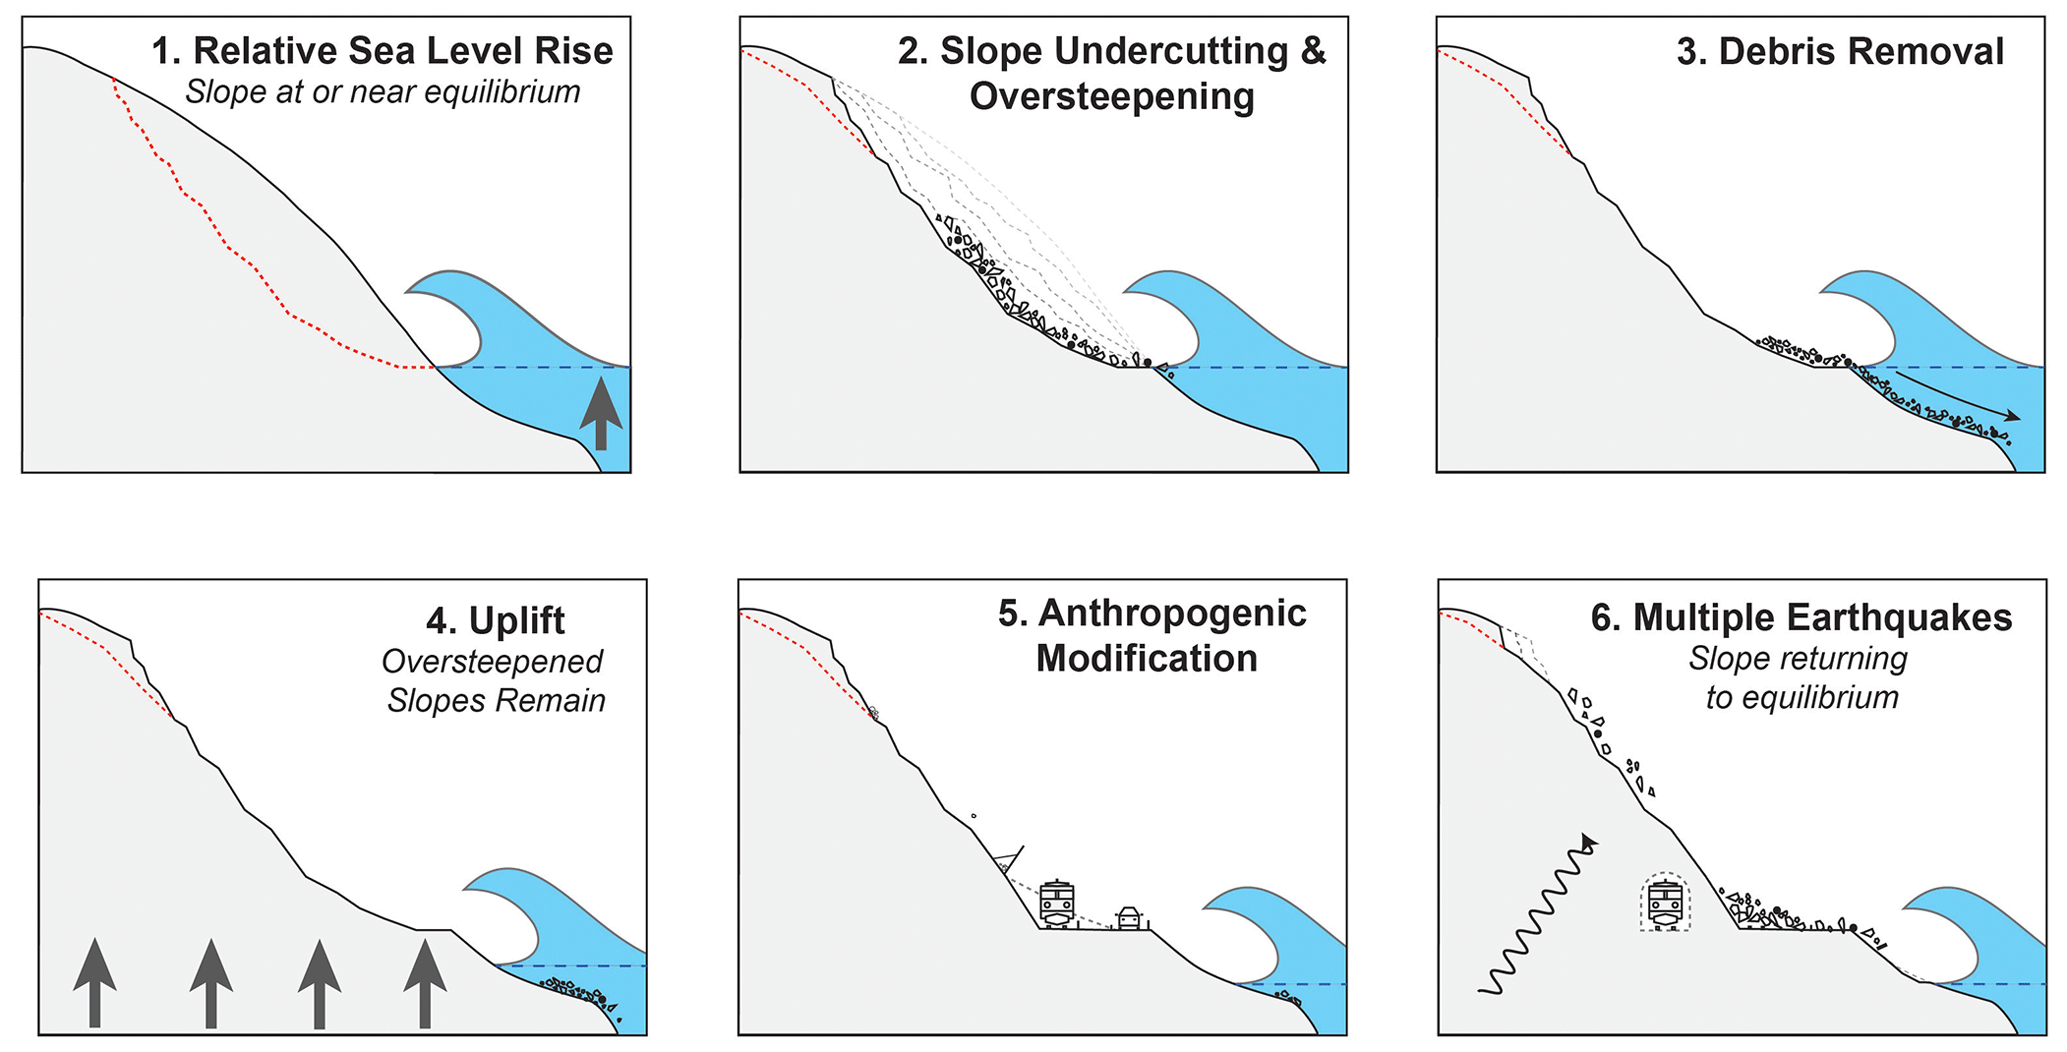
Figure 10Conceptual model for the evolution of slope stability along the Kaikōura coast. Hillslopes are oversteepened by active erosion, and debris is cleared from shore platforms by wave action. Following uplift, hillslopes are anthropogenically modified, and earthquakes result in failures within upper hillslopes and the scars of relict landslides. Terrestrial erosion from earthquakes and rainfall work to bring the oversteepened hillslope back into equilibrium with the surrounding landscape (Crozier, 2010).
5.3 Implications for earthquake-induced landslide susceptibility in coastal settings
Most earthquake-induced landslide susceptibility models already rely heavily on lithology, strong ground motion, and slope as predictive features. As such, the findings here support the efficacy of using regionally trained models to characterize earthquake-induced landslide susceptibility on the Kaikōura coast without additional predictive features. In the Kaikōura region, a “near-coast” categorical feature (Figs. B1 and B2) does not substantially improve model prediction. In other regions, such a feature may serve as a reasonable proxy for other underlying coastal influences, but this is subject to additional study.
Findings here may be applied to rocky coastlines elsewhere, but consideration should be made for potentially important site-specific conditions that may or may not be incorporated in this investigation. Of particular note, Parker et al. (2015) identified the accumulation of rock mass deformation over multiple earthquakes as a source of landscape preconditioning that results in higher susceptibility to future landslides. Similarly, the scars of relict landslides that occur within the steep hillslopes of the Kaikōura coastline suggest past susceptibility to failure and a potential accumulation of deformation that is largely unresolved by this analysis (and likely by most regional studies).
Previous investigations (e.g. Marc et al., 2015, 2019; Massey et al., 2022) have suggested that increased landslide susceptibility decays to background levels within several years of an earthquake. It may be possible, however, that the factors discussed in this study, including oversteepened hillslopes, fault deformation, coastal weathering, repeated earthquake shaking, and topographic amplification, contribute to an accumulation of stress within the hillslope and, in turn, a longer-term susceptibility to extreme event failure (Parker et al., 2015). Currently, the detailed rock mass characterization required to fully investigate the influence of rock mass strength remains largely confined to the site-specific scale. Our understanding of coastal landslide susceptibility would benefit from future studies that attempt to decouple the influence of steep slopes from rock mass deformation on a regional scale.
As a final note, since the 2016 Kaikōura earthquake, the coastal road and rail corridors north and south of Kaikōura have been fully re-established. In some cases, realignments have been made to address ongoing rockfall and other slope stability concerns (NZTA, 2021). In most cases, however, the road and rail lines have been cleared, repaired, and reopened in their original alignments (as in panel 5 of Fig. 10). Estimates of long-term network resilience were developed shortly after the Kaikōura earthquake and, in part, rely on quantified landslide hazard assessment (Justice et al., 2021). This hazard assessment adopts the established assumption that strong ground motion intensity plays a large role in governing the volume of coseismic landslide debris along the Kaikōura coast (Massey et al., 2019). While our study does not directly address quantified hazard, the results suggest that the distribution of slope angle is generally steeper on the Kaikōura coast compared with inland hillslopes. These steeper slopes (and attendant history of slope failures) resulted in a high density of coastal landslides during the 2016 Kaikōura earthquake. In future earthquakes, increased coastal landslide susceptibility – the result of steeper slopes along the coast – will expose coastal hillslopes to more landslides than inland hillslopes given the same level of ground motion intensity. The ongoing likelihood of aftershocks and strong ground motion in the Kaikōura region will test the efficacy of mitigation measures installed to reduce risk to people and infrastructure along the coast.
Distance to the Kaikōura coastline has a substantial influence on the distribution of landslides from the 2016 Kaikōura earthquake. An order of magnitude greater landslide density was observed within 500 m of the coastline (as high as ca. 6 %) as compared with 1000 to 3000 m (ca. 0.5 %). Comparative logistic regression modelling suggests that the same factors, primarily geology, strong ground motion, and slope, define the distribution of landslides in both coastal (within 1 km of the coast) and inland hillslopes (1 to 3 km from the coast). Regional earthquake-induced landslide susceptibility models that rely on geology, strong ground motion, and slope as strong predictive features are therefore likely to account for this increased coastal landslide susceptibility in the Kaikōura region without separate treatment. Along the Kaikōura coastline, hillslopes are generally steeper than those inland, when comparing slope angles within similar materials. Results suggest that slope angle provides the most explanatory power and the simplest explanation for increased coseismic landslide density at the coast. On the Kaikōura coast, most hillslopes are currently buffered from wave action by rapidly uplifted shore platforms; coastal hillslopes host a high density of relict landslides that may have resulted from relatively recent (< 1000 years) coastal erosion. Relict landslides and proportionally steeper hillslopes maintain lower factors of safety and higher coastal landslide susceptibility as a legacy effect within hillslopes out of equilibrium with the surrounding landscape, which may persist for up to thousands of years.
A1 Minimum landslide size
Prior to the 2016 Kaikōura earthquake, lidar was available for areas in close proximity (< 1 km) to the Kaikōura coastline. This pre-earthquake lidar coverage likely allowed for more detailed comparison with post-earthquake data. In order to limit any potential bias resulting from differences in the quality of landslide mapping on the Kaikōura coastline in this comparative analysis, we evaluate the size area distribution of earthquake-induced landslides mapped by Massey et al. (2020a) in proximity to the Kaikōura coast (Fig. A1) using the methods of Malamud et al. (2004). We observed a slightly higher distribution of small failures along the Kaikōura coast, with the distribution of failures diverging around 50 m2. While this may represent a real difference in landslide size along the coast, we chose to exclude failures smaller than 50 m2 from the analysis. Because of the small size of failures, this exclusion is unlikely to strongly influence the final results.
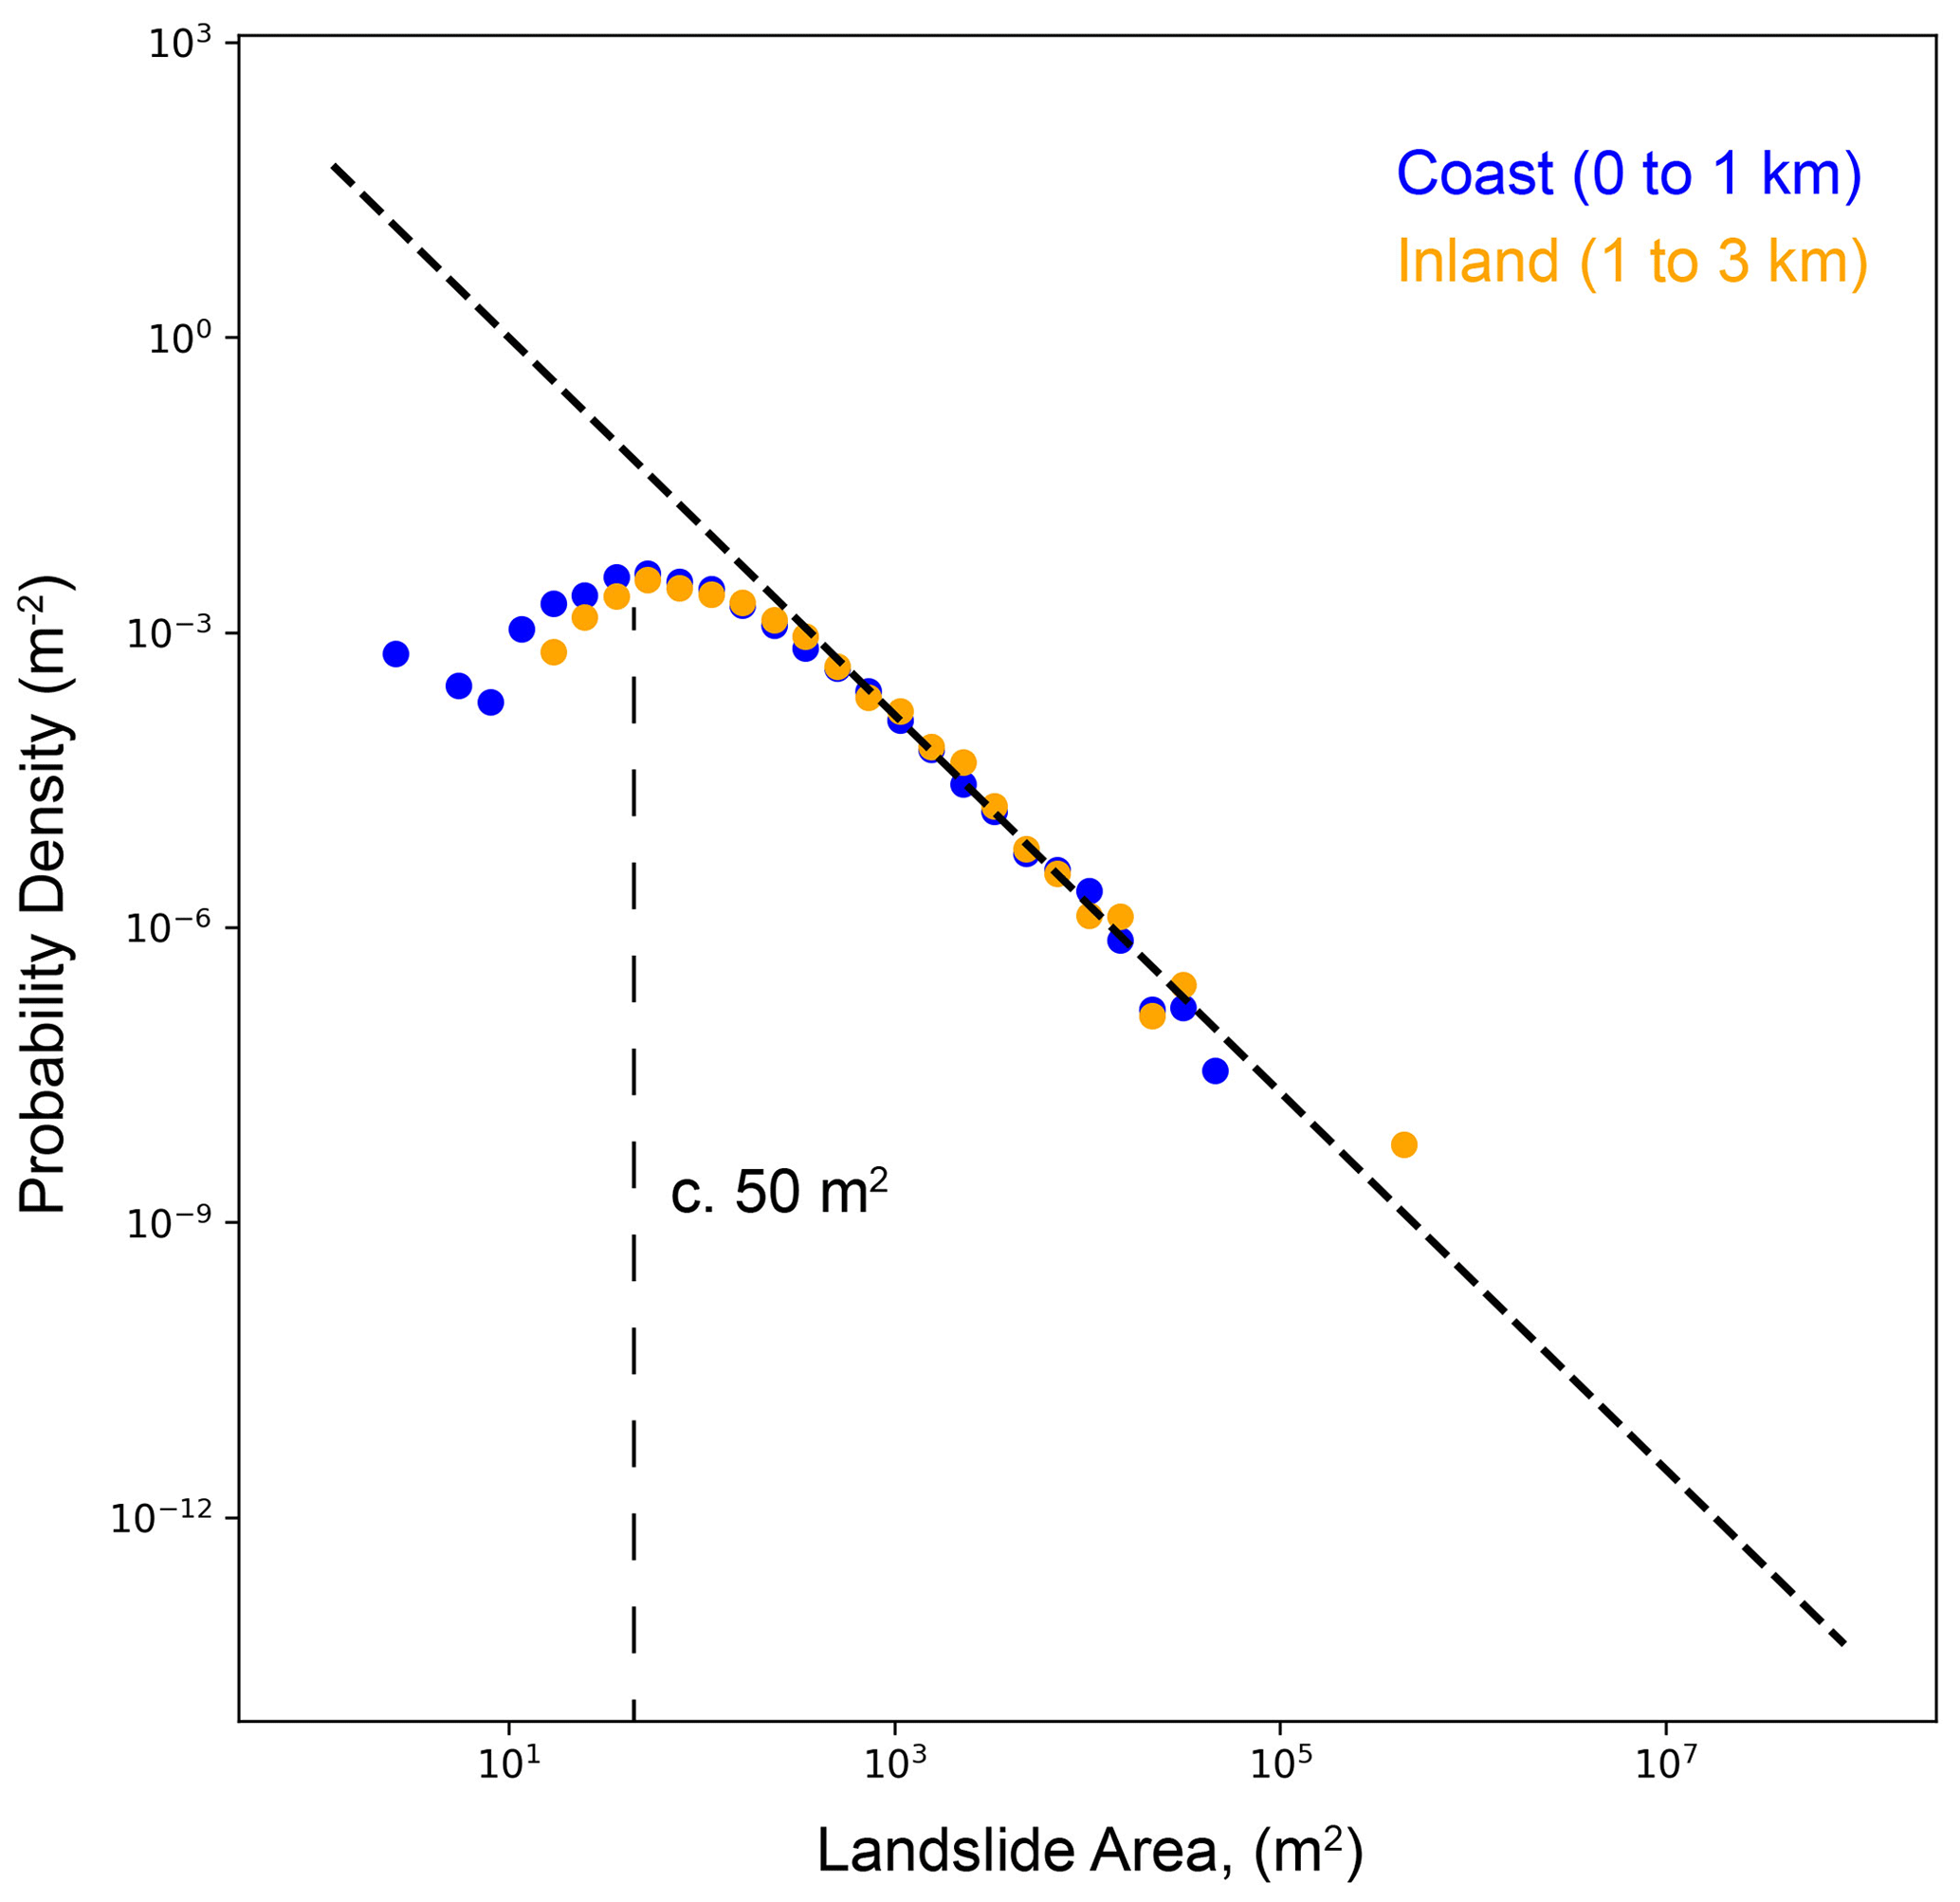
Figure A1Size area distribution of landslides (Malamud et al., 2004) from the Kaikōura earthquake-induced landslide inventory (Massey et al., 2020a) within 0 to 1 km (coast) and 1 to 3 km (inland) of the coastline. The distributions diverge from one another around 50 m2, and we use this as the minimum landslide size threshold.
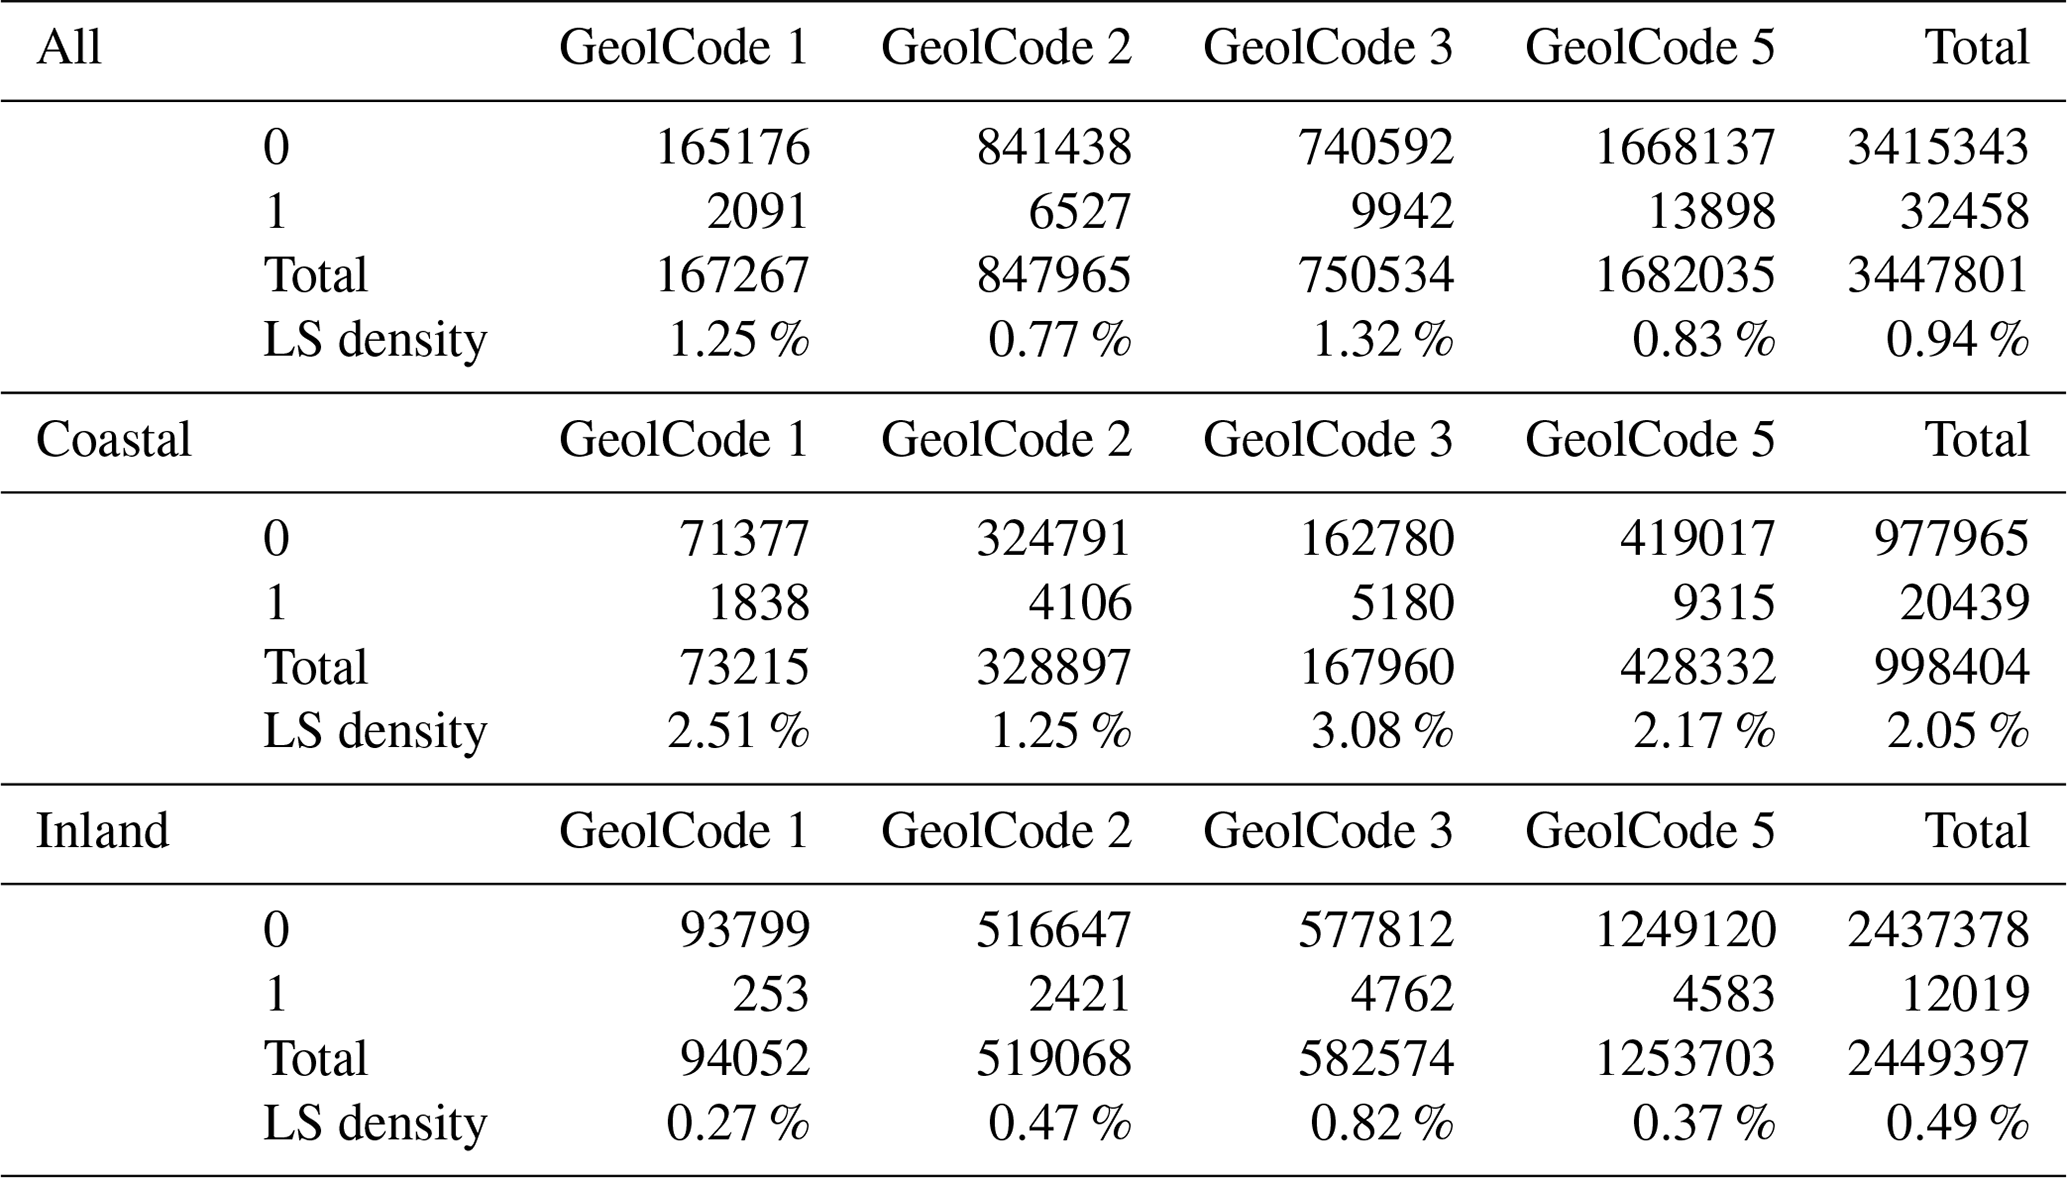
A2 Gridded landslide data
Landslide polygons from the inventory of Massey et al. (2020a) were gridded to the 8 m resolution of the digital elevation model (LINZ, 2021a) used to derive topographic landslide susceptibility features. Table 2 shows the percentage of landslide source area in each GeolCode. Table A1 shows the raw number of landslide (1) and non-landslide (0) grid cells used in the analysis.
Table A1Landslide (LS) density by GeolCodes in both coastal and inland hillslopes, coastal hillslopes only, and inland hillslopes only with the number of 1 and 0 landslide grid cells.
A3 Landslide susceptibility features
We initially evaluated 25 common predictive features for this analysis (Fig. A2). Of the 25 features we narrowed the choice of features using only those features with a variance inflation factor (VIF) score of 10 or less (Table A2). In comparative model training, the best model performance was achieved when using the USGS ShakeMap PGA (Worden et al., 2020) for models of GeolCode 5 and the USGS ShakeMap PGV for all other GeolCodes.
Table A2Variance inflation factor for features used in this analysis. PGA from the USGS ShakeMap (Worden et al., 2020) is used for GeolCode 5 and PGV from the same model for all other GeolCodes.
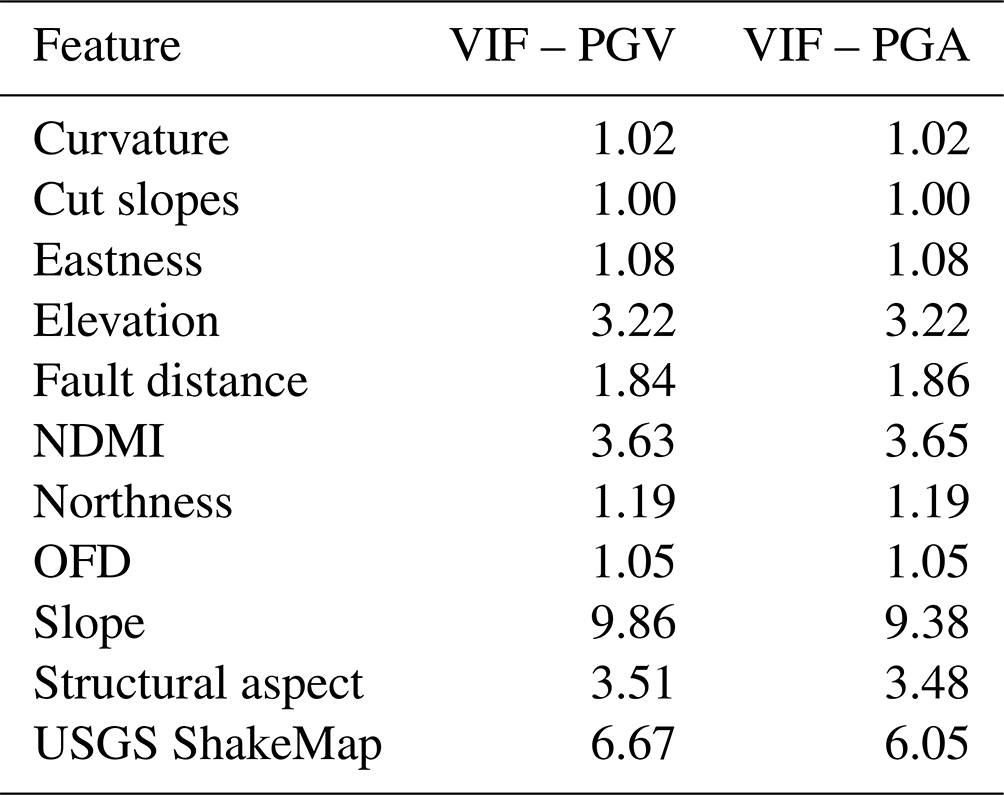
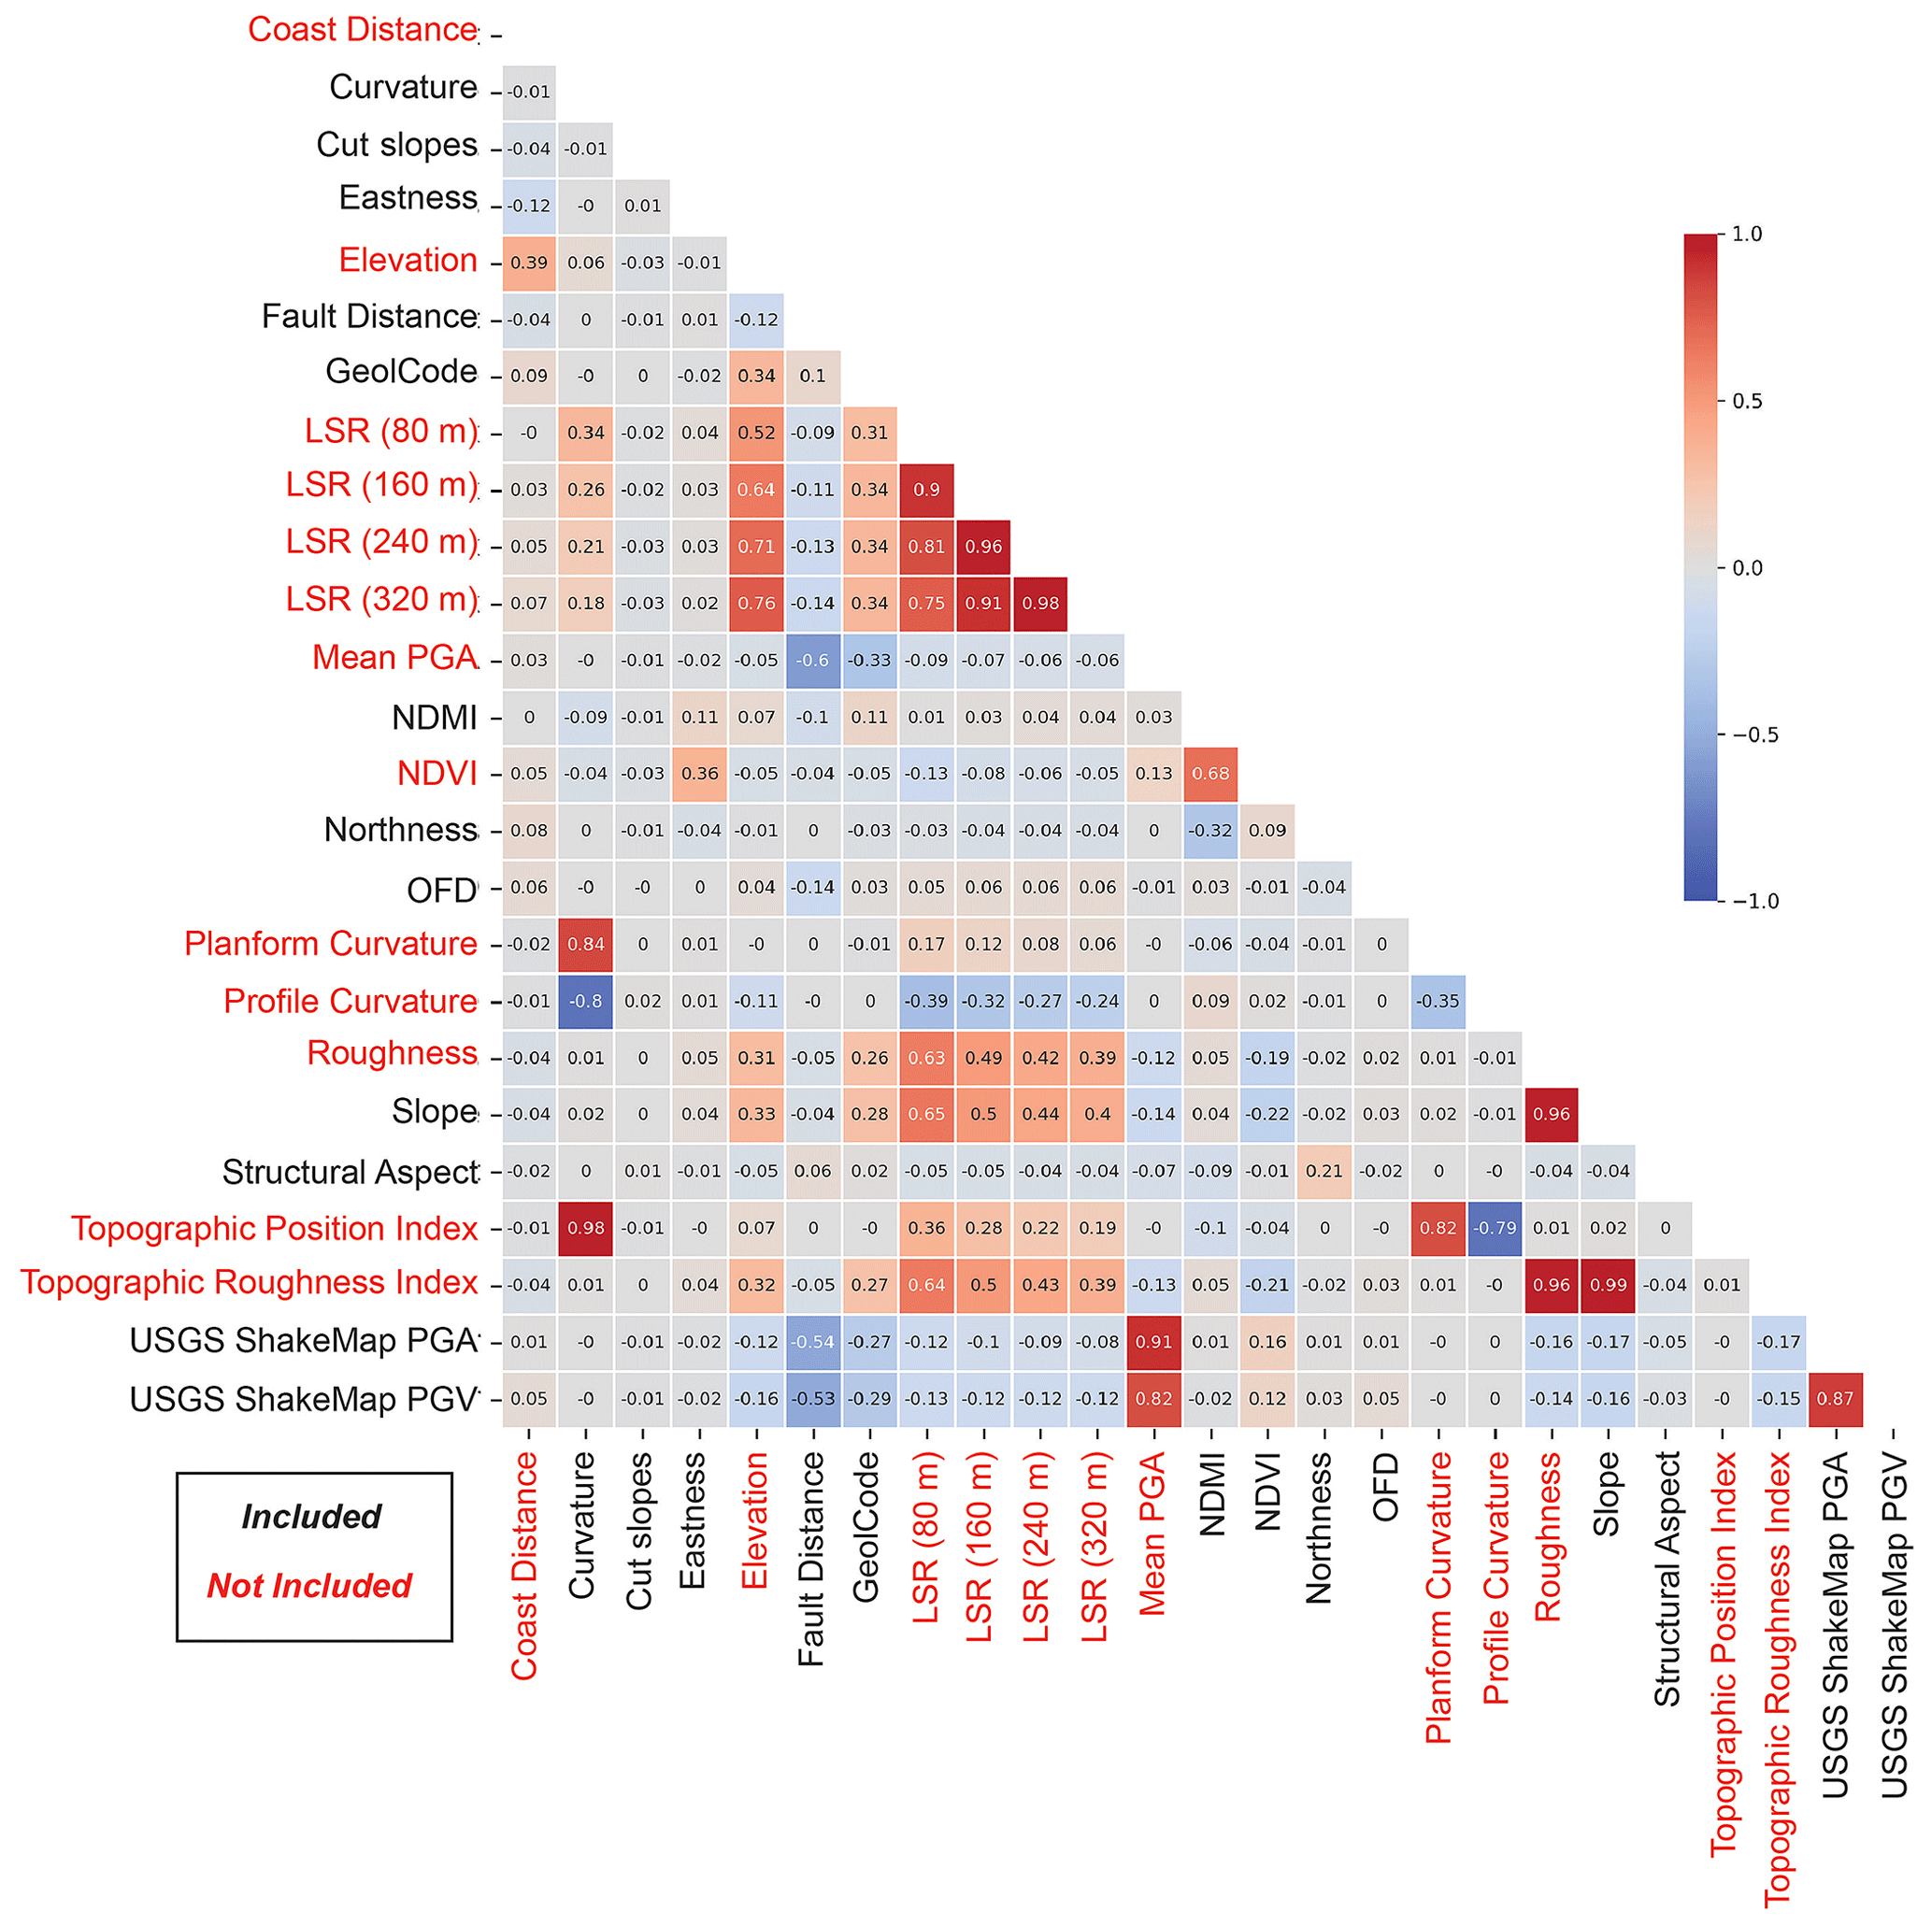
Figure A2Pearson's R2 correlation for common predictive features considered in this analysis. Red features were not included in the final modelling analysis.
A4 Deriving the structural aspect feature
To derive a correlation between the dip direction of the bedding and topographic aspect, we interpolated structural bedding measurements from the New Zealand QMAP (Rattenbury et al., 2006). We corrected for the 360∘ direction of the dip using the sin and cos of the dip direction and used the inverse distance-weighted (IDW) interpolation method in ArcGIS to produce a continuous estimate of the dip direction in each geology type (GeolCode). By subtracting the interpolated dip direction from the topographic aspect, we get values from −360 to 360∘, where a value close to −360, 0, or 360∘ represents a close correlation between the dip direction of the bedding and topographic aspect. To make a continuous range for this analysis, we take the absolute value of the difference (0 to 360), subtract 180 (−180 to 180), and take the absolute value again to arrive at 0 to 180, where 180 represents a high correlation between the dip direction and topographic aspect and 0 represents a low correlation.
A5 Efficacy of the LINZ 8 m DEM for regional analysis in the Kaikōura region
The LINZ 8 m DEM (LINZ, 2021a), interpolated from 20 m contours with post-processing and filtering, is primarily suitable for cartographic visualization. While this may not represent the most ideal dataset with which to conduct terrain analysis, it is the highest-resolution elevation dataset available with consistent coverage of the Kaikōura region prior to the 2016 Kaikōura earthquake. Given the relatively small size of many coastal landslides, using a coarser DEM would likely result in underprediction of coastal landslides and would limit our ability to make robust claims about differences in landslide susceptibility between inland and coastal slopes.
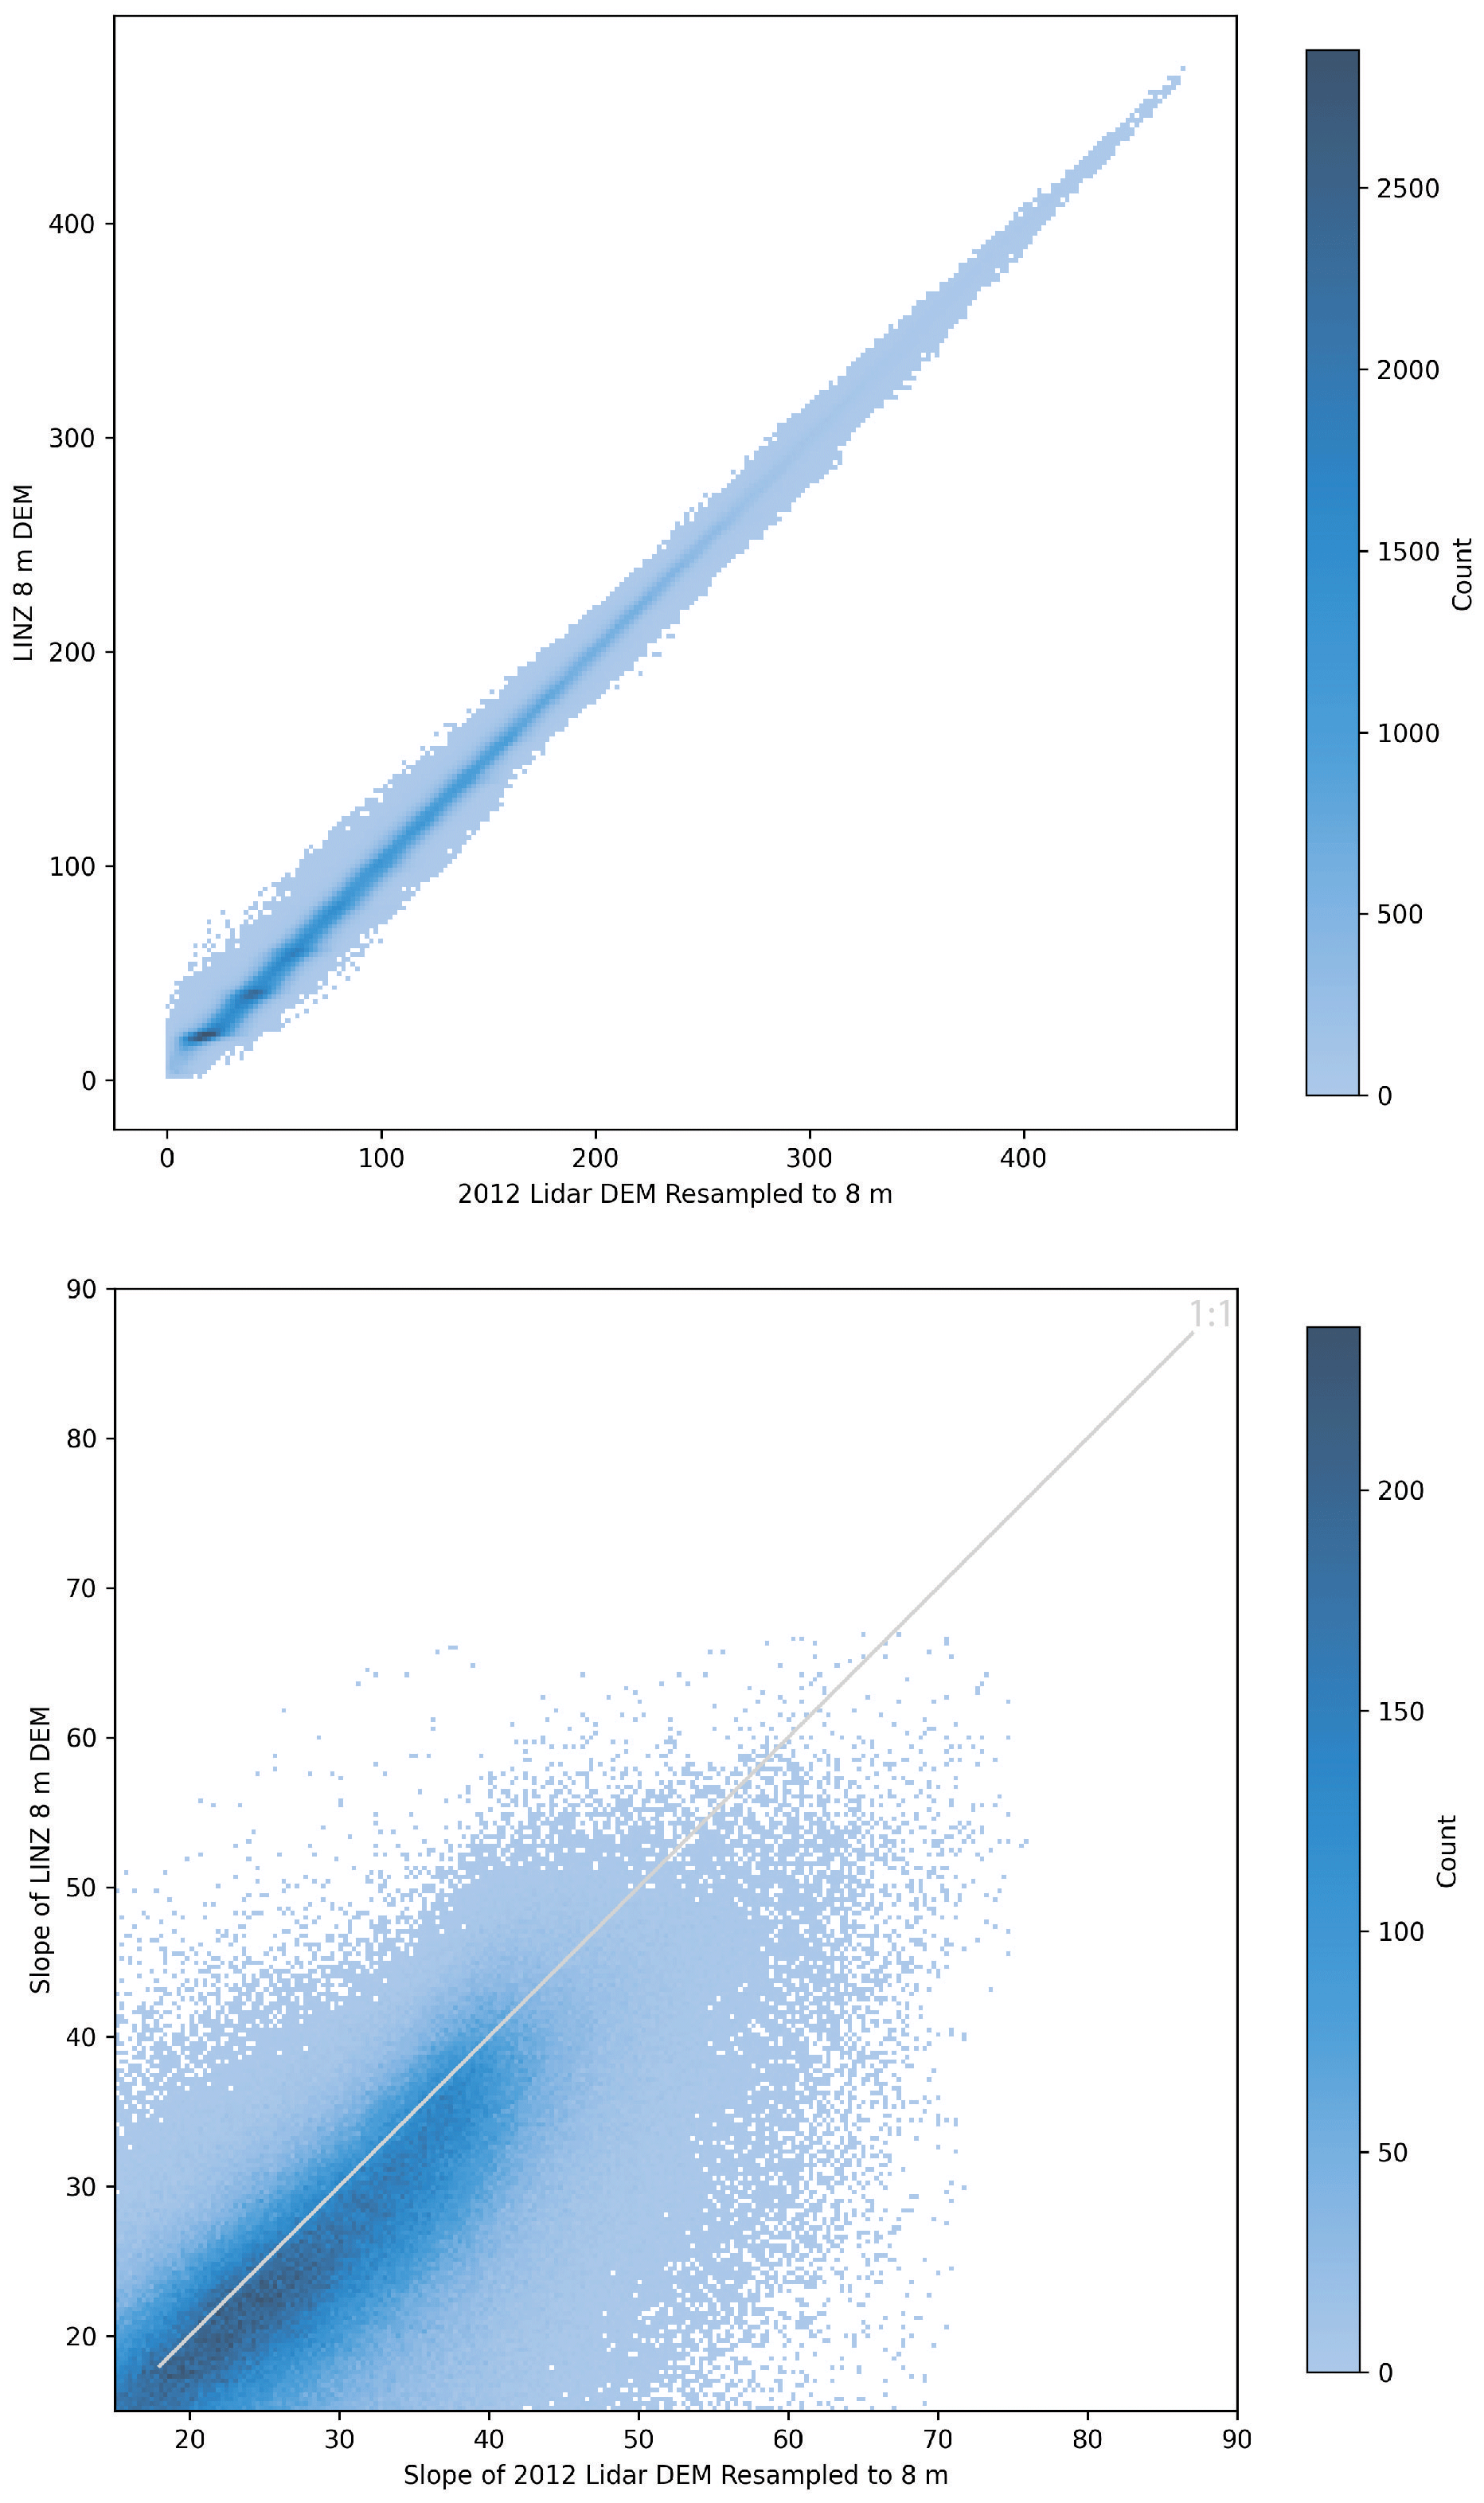
The regional nature of this assessment should reduce concern about local irregularities in the underlying DEM. To examine this assumption, we downsampled a limited 1 m pre-earthquake lidar-derived DEM collected along the Kaikōura coast in 2012 (LINZ, 2021c) to the 8 m resolution of the LINZ 8 m DEM (LINZ, 2021a) and compared the two datasets. Limited lidar coverage extends to ca. 500 m inland along much of the Kaikōura coastline and accounts for ca. 30 % of the study area included in this analysis. We find a strong one-to-one correlation between the two datasets (Fig. A3). While local irregularities in the LINZ 8 m DEM (LINZ, 2021a) may limit the usefulness of this dataset on a site-specific scale, on the regional scale of this analysis, the LINZ 8 m DEM and its derivations are largely characteristic of actual pre-earthquake terrain conditions.
B1 Full model
In addition to comparative models of inland and coastal hillslopes, two models were trained using 80 % of both inland and coastal data. The first model matches the inland and coastal models included in the main text. The second model includes an additional binary coast feature where inland hillslopes are assigned a value of 0 and coastal hillslopes a value of 1. Both models performed well and were predictive of both inland and coastal landslides in the remaining 20 % of data used for testing (Fig. B1). Model coefficients from the full model were generally similar to inland and coastal models (Fig. B2).
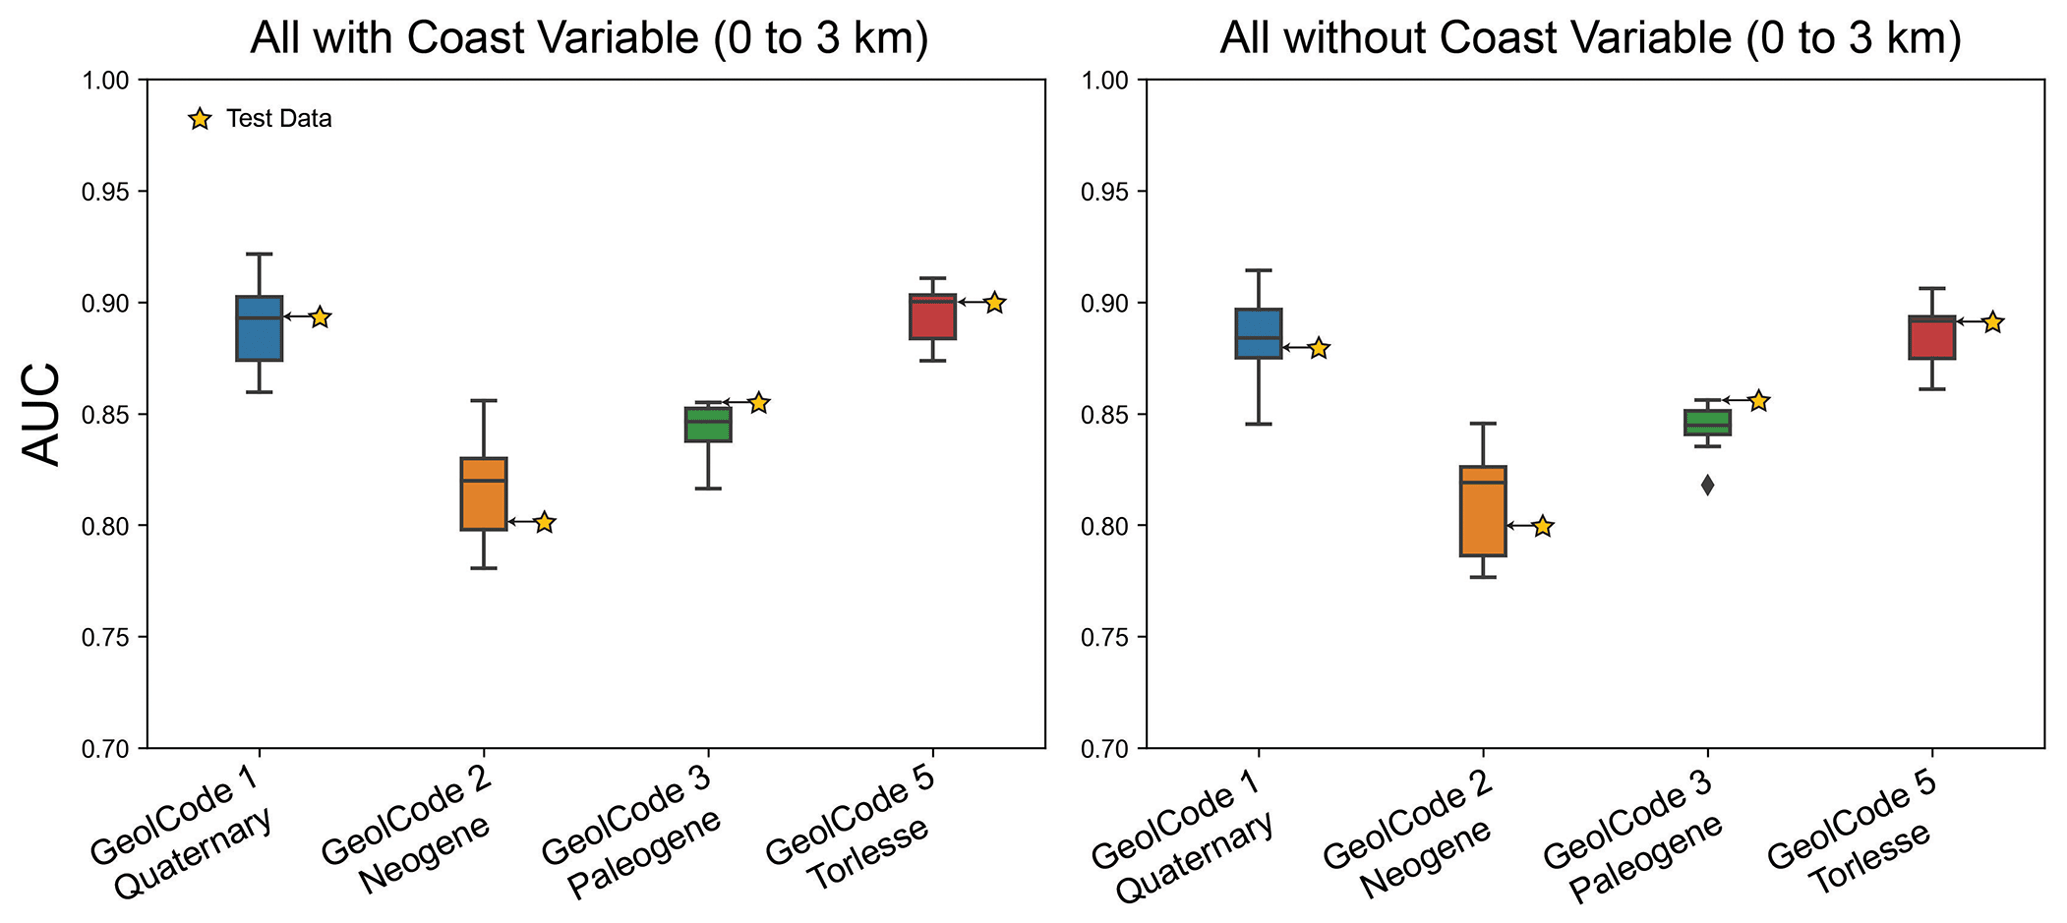
Figure B1Logistic regression model performance from models trained on each geology type (GeolCode) in both coastal and inland hillslopes. The model on the left includes a binary coast feature where grid cells within 1 km of the coast are assigned a value of 1 and grid cells within 1 to 3 km of the coast are assigned a value of 0. Model performance is measured by the area under the receiver operator characteristic curve (AUC). Each boxplot shows the results of 10-fold cross-validation using 80 % of the available target dataset. The yellow stars represent model performance when applied to the 20 % of data withheld from training.
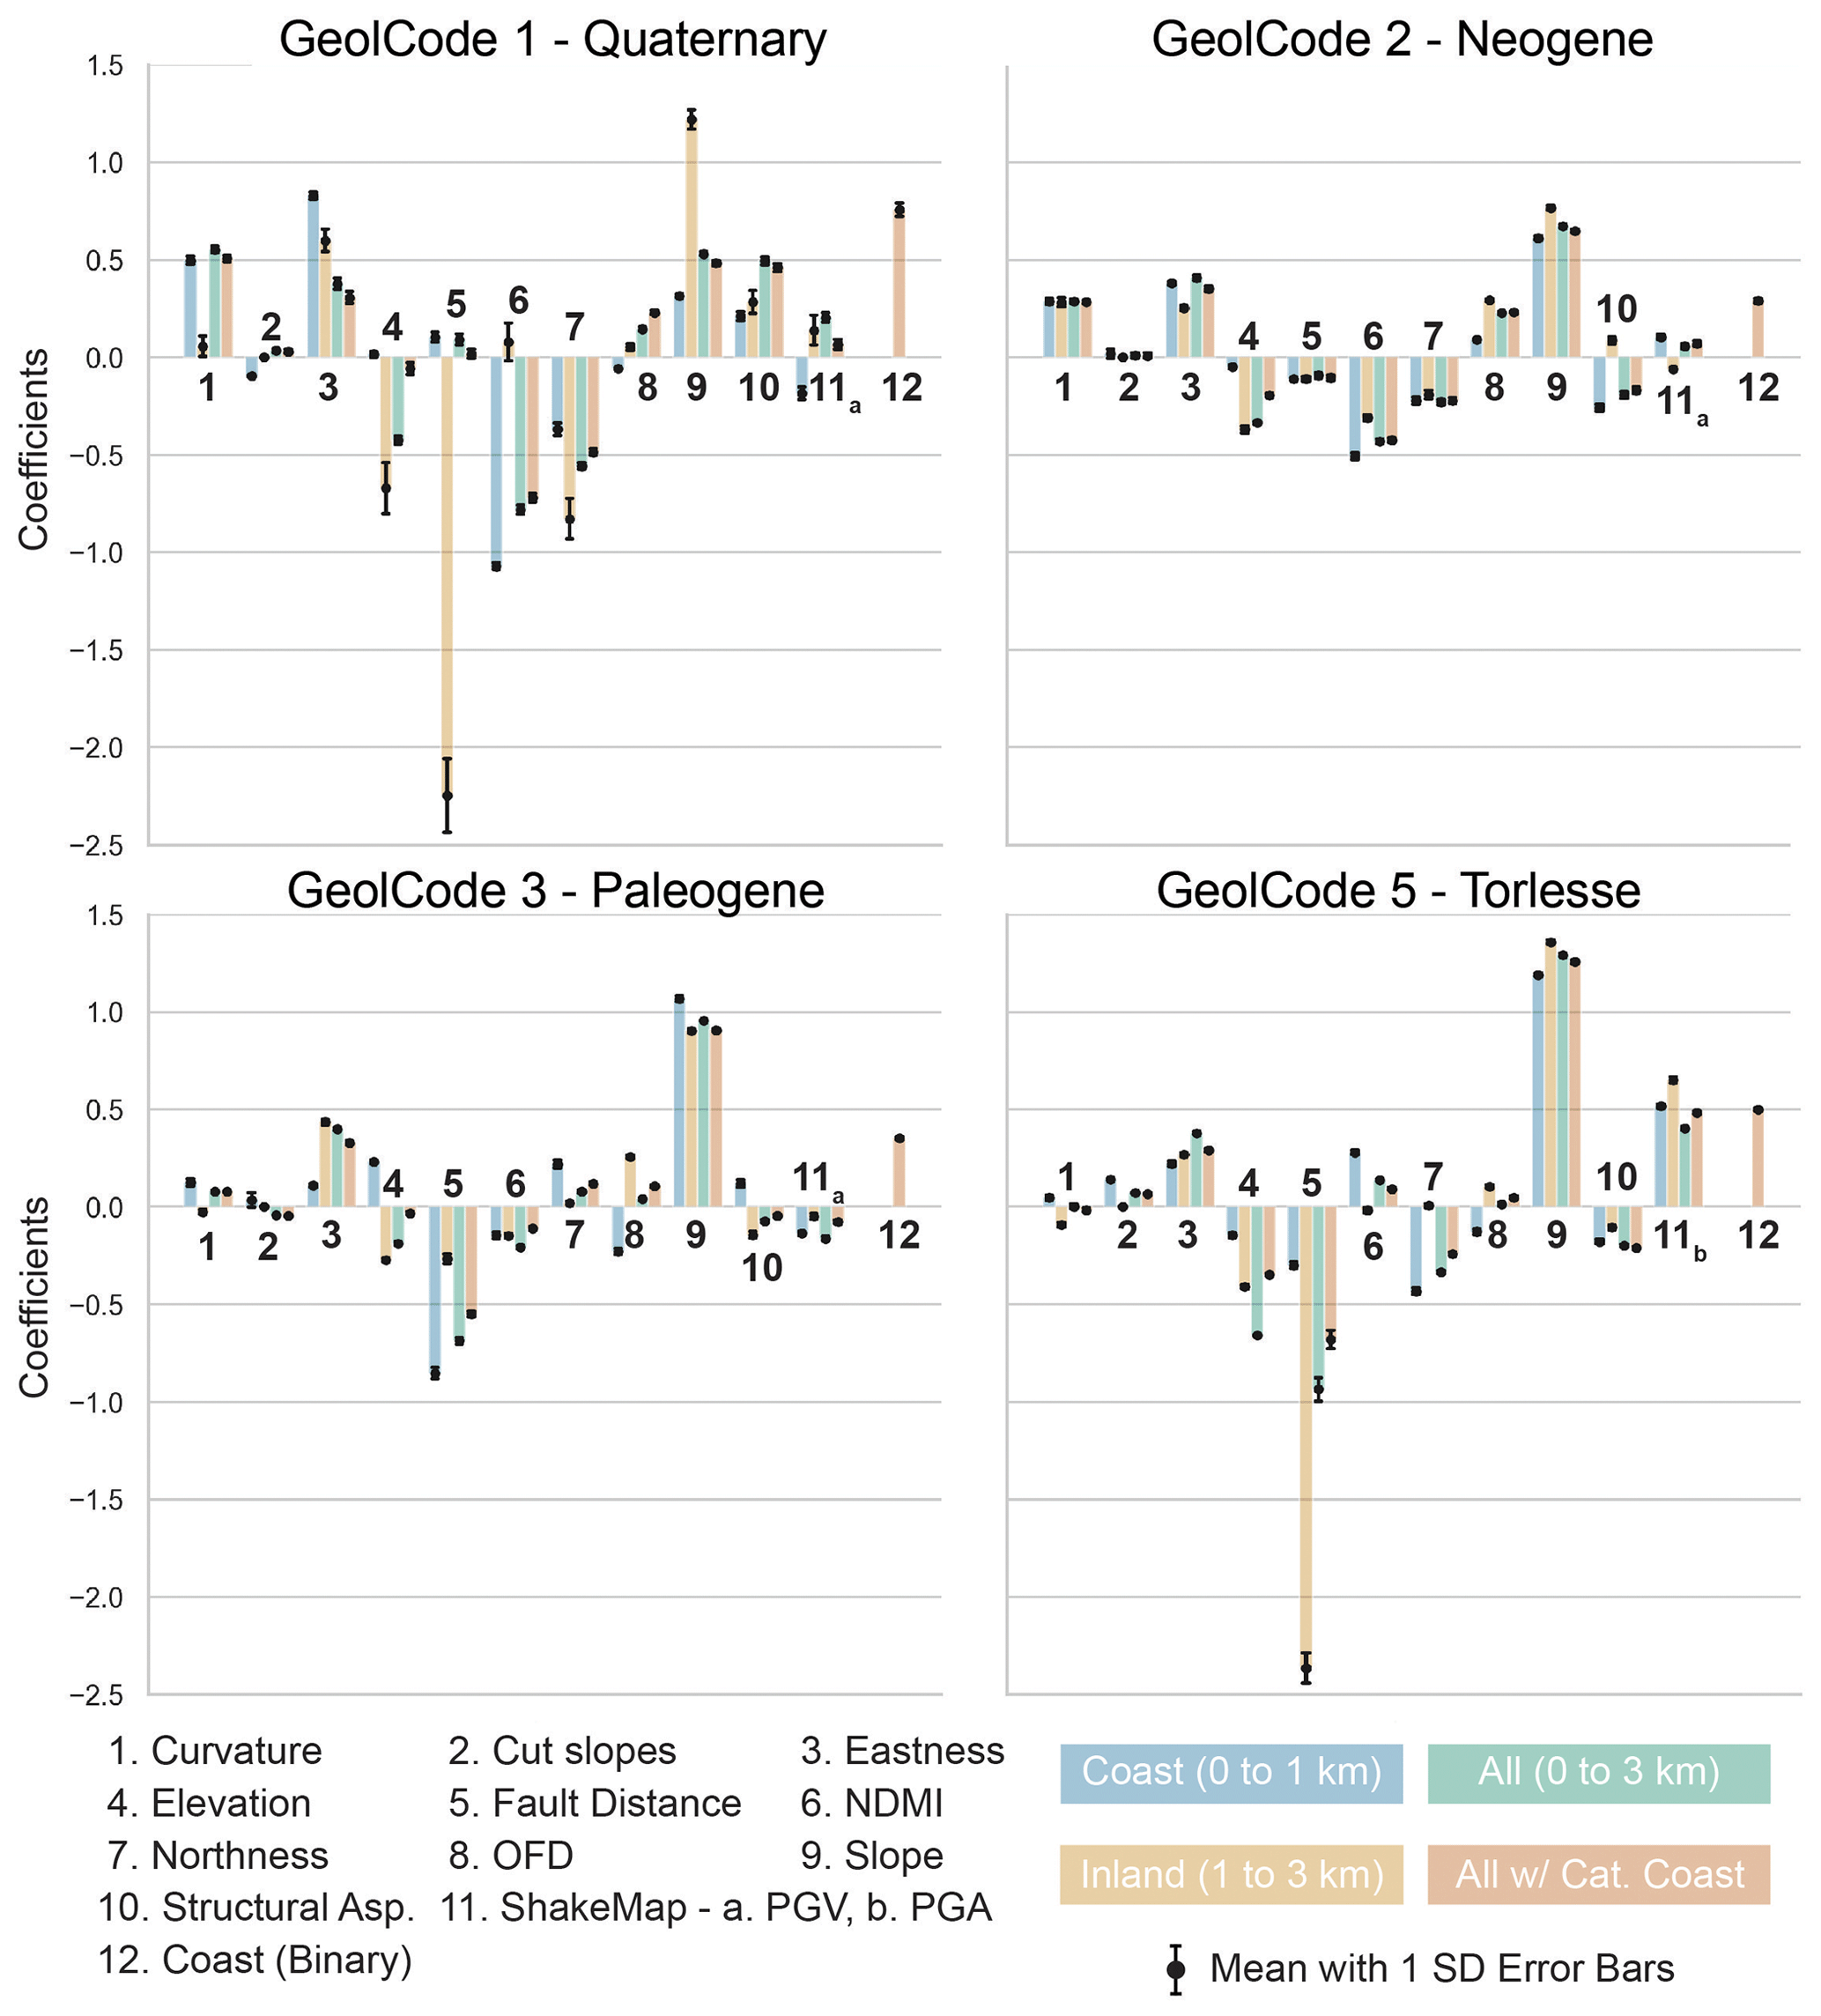
Figure B2Model coefficients for models trained on each GeolCode. The points with associated error bars represent the mean and standard deviation (SD) of the coefficient across 10 cross-validations. The colour bars indicate which feature the point is associated with and the model data used to train the model. In cases where no error bar is present, the standard deviation is less than 0.1. Negative coefficients result in a higher weight for small values, while positive coefficients result in a higher weight for high values. For example, a negative coefficient for fault distance suggests that there is a higher landslide susceptibility closer to faults, while a positive coefficient for slope suggests that a greater slope angle has higher landslide susceptibility. All features are standardized prior to model training, allowing for the direct comparison of coefficients within the same model.
B2 Coastal vs. inland features and landslides
In addition to the analysis presented in the main text we also examined the distribution of predictive features within inland and coastal slopes greater than 15∘ (Fig. B3).
We supplement this analysis by examining the distribution of predictive features within landslide source areas in inland and coastal slopes greater than 15∘ (Fig. B4).
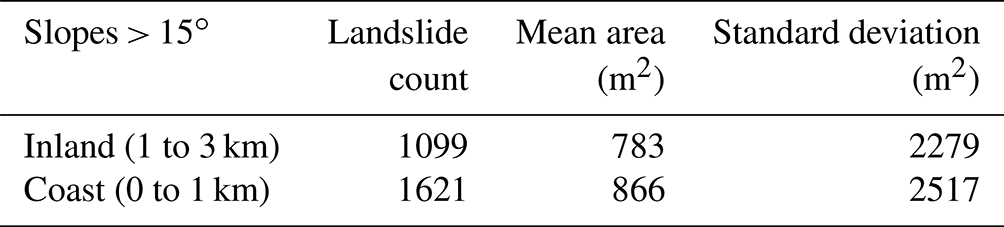
On average, coastal landslides (within 1 km of the coast) are ca. 10 % larger than inland landslides (between 1 and 3 km from the coast) on slopes > 15∘ with PGA > 0.2 g (when excluding the seafront landslide and landslides smaller than 50 m2; Table B1). Given the same filters, there are ca. 30 % more landslides in coastal hillslopes (Table B1), which make up ca. of the total study area.
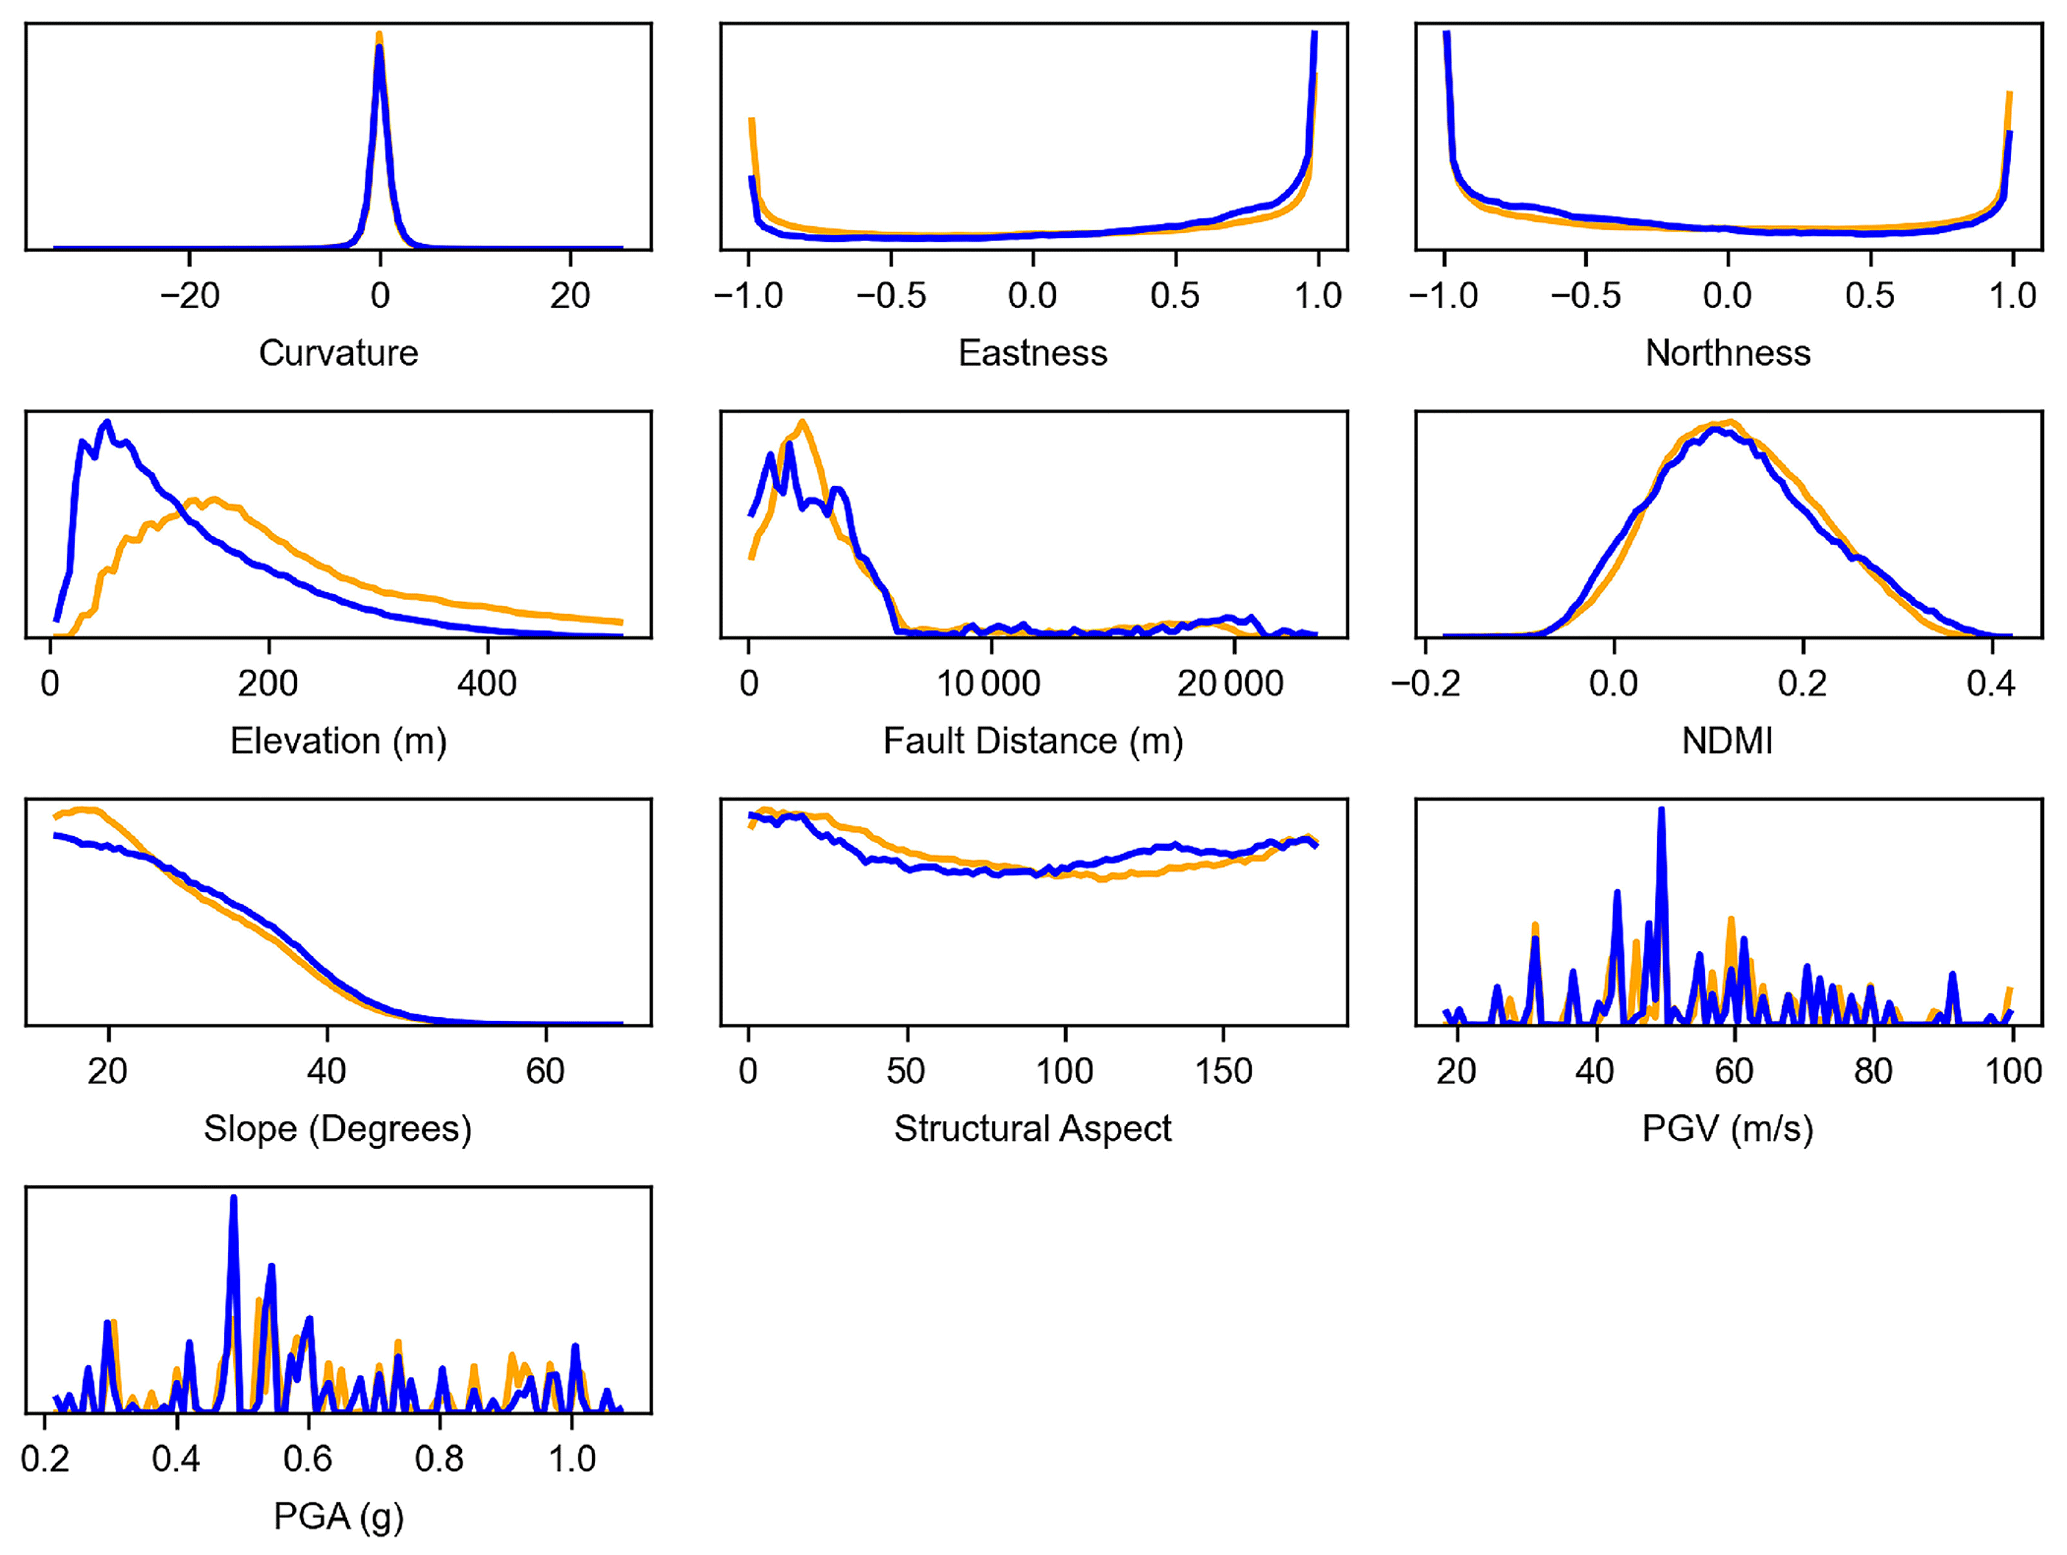
Figure B3Distribution of predictive features in all Kaikōura inland and coastal slopes greater than 15∘. Inland slopes are represented by orange lines, and coastal slopes are represented by blue lines.
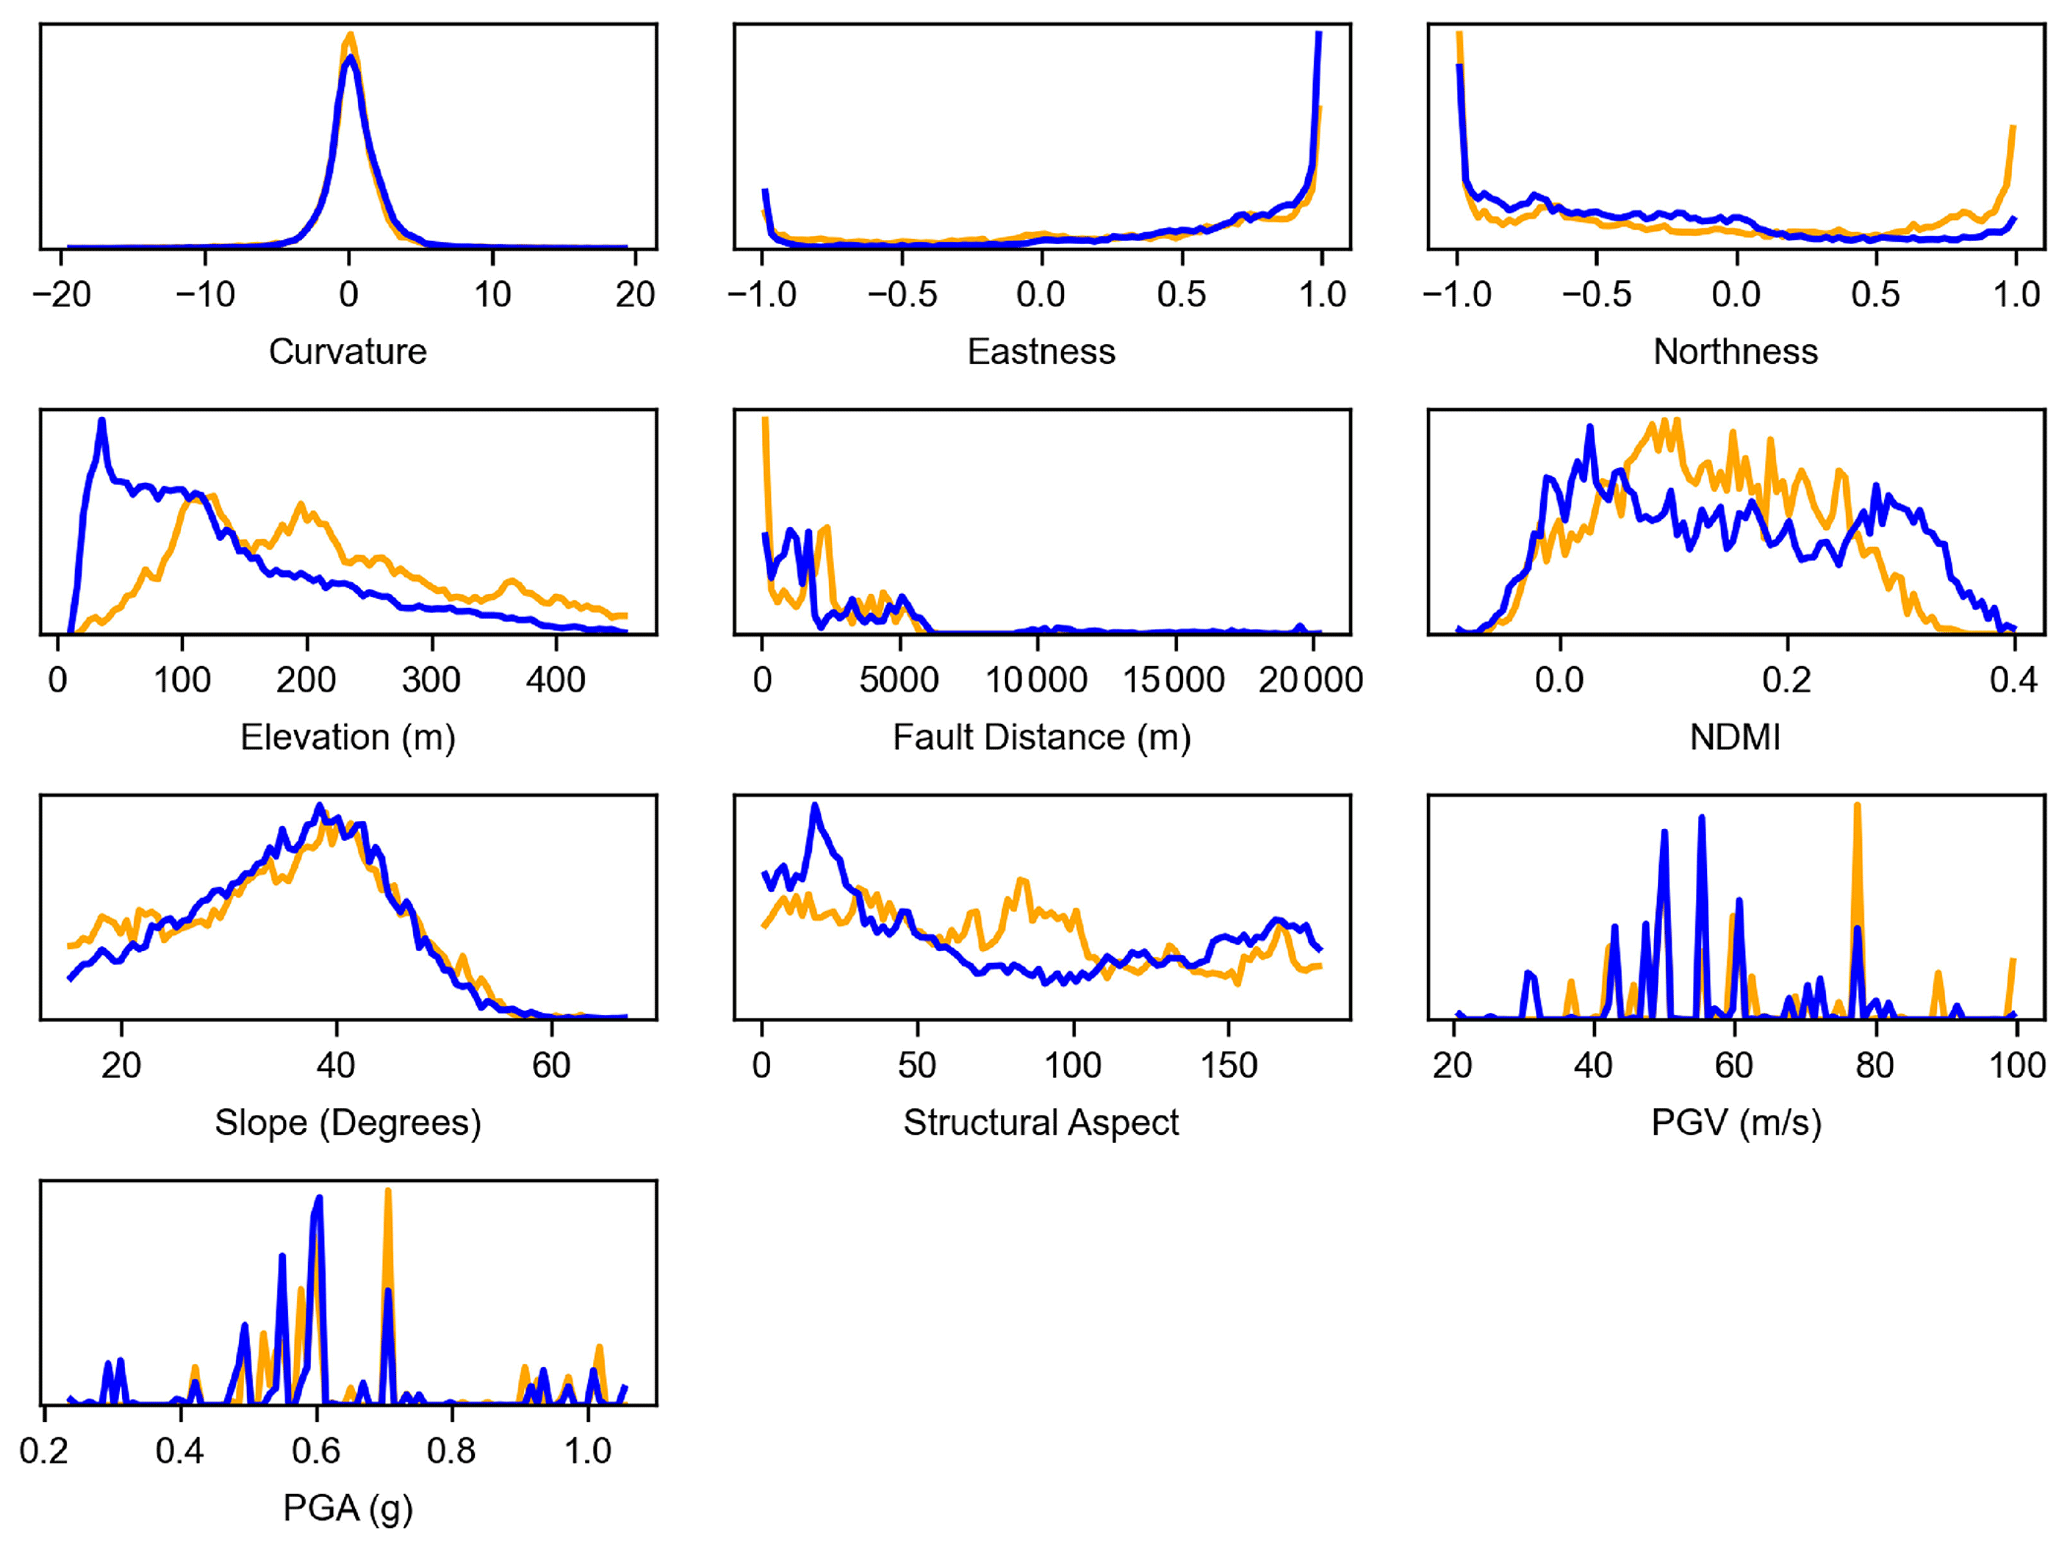
Figure B4Distribution of predictive features within the Kaikōura earthquake-induced landslide source areas on inland and coastal slopes greater than 15∘. Inland slopes are represented by orange lines, and coastal slopes are represented by blue lines.
Table B1Mean landslide area in inland and coastal hillslopes where slopes > 15∘, PGA > 0.2 g. Inland estimates exclude the seafront landslide.
B3 Additional observations
Curvature. Curvature was well distributed, and few differences between inland and coastal hillslopes were observed (Figs. B3 and B4).
Aspect (northness and eastness). Ridgelines and valleys generally trend from northeast to southwest in the Kaikōura region (Fig. B3), and landslide source areas on both inland and coastal hillslopes occur disproportionately on south- to southeast-facing hillslopes (Fig. B4). Within 1 km of the coastline, a larger proportion of southeast-facing hillslopes were observed that generally correlated well with landslide density trends across geology types.
Elevation. A steady rise in elevation is observed with distance from the Kaikōura coastline. This rise in elevation, however, does not appear to directly correlate with the landslide density trend that is observed with distance.
The code used to process the datasets in this paper (as outlined in Table 1) is available through RichDEM (http://github.com/r-barnes/richdem; Barnes, 2016) and GDAL (https://gdal.org; GDAL/OGR contributors, 2022). The code used to train the models included in this paper is available through scikit-learn (https://github.com/scikit-learn/scikit-learn; Pedregosa et al., 2011).
Datasets used to support the models in this paper include the following: (1) the 2016 Kaikōura earthquake-induced landslide inventory (Massey et al., 2020a); (2) the LINZ 8 m DEM (https://data.linz.govt.nz/layer/51768-nz-8m-digital-elevation-model-2012, LINZ, 2021a); (3) the LINZ Topo50 New Zealand Coastlines (https://data.linz.govt.nz/layer/50258-nz-coastlines-topo-150k/, LINZ, 2021b); (4) 14 surface-ruptured faults from the 2016 Kaikōura earthquake (Bloom et al., 2022); (5) the OFD zone as defined for 14 surface-ruptured faults from the Kaikōura earthquake (Bloom et al., 2022); (6) PGA and PGV from the USGS ShakeMap v4 (Worden et al., 2020, https://earthquake.usgs.gov/earthquakes/eventpage/us1000778i/shakemap/intensity); (7) October 2016 Landsat 8 imagery (https://earthexplorer.usgs.gov/, U.S. Geological Survey, 2022); and (8) New Zealand QMAP geology for the Kaikōura region (https://shop.gns.cri.nz/qkaikoura-zip/, Rattenbury et al., 2006). Additionally, NIWA's National Climate Database (https://cliflo.niwa.co.nz/, NIWA, 2022) was used to determine rainfall along the Kaikōura coast, and the New Zealand Active Faults Database (Langridge et al., 2016) was used to show active faults in the Kaikōura region alongside fault ruptures from the 2016 Kaikōura earthquake in Fig. 1.
CKB: conceptualization, methodology, formal analysis, investigation, visualization, writing (original draft). CS: methodology, investigation, visualization, writing (review and editing). TS: supervision, funding acquisition, conceptualization, methodology, writing (review and editing). AH: supervision, methodology, writing (review and editing). CM: supervision, funding acquisition, writing (review and editing). DM: methodology, investigation, writing (review and editing).
The contact author has declared that none of the authors has any competing interests.
Publisher’s note: Copernicus Publications remains neutral with regard to jurisdictional claims in published maps and institutional affiliations.
The authors would like to thank Simon Cox and Dougal Townsend at GNS Science for providing methods and insight into mapping structural domains in the Kaikōura region. Additional thanks go to the two anonymous reviewers for their helpful comments which improved the manuscript.
This research has been supported by the New Zealand Ministry of Business, Innovation and Employment Endeavour fund project “Earthquake-Induced Landslide Dynamics”, Te Hiranga Rū QuakeCoRE, the New Zealand Centre for Earthquake Resilience, and the Toka Tū Ake EQC University Research Programme project “Resilience to Earthquake and Landslide Multi-hazards”.
This paper was edited by Maria Ana Baptista and reviewed by two anonymous referees.
Ashford, S. A., Sitar, N., Lysmer, J., and Deng, N.: Topographic effects on the seismic response of steep slopes, B. Seismol. Soc. Am., 87, 701–709, 1997.
Barnes, R.: RichDEM: Terrain Analysis Soaware, http://github.com/r-barnes/richdem (last access: May 2022), 2016.
Beavan, J., Tregoning, P., Bevis, M., Kato, T., and Meertens, C.: Motion and rigidity of the Pacific Plate and implications for plate boundary deformation, J. Geophys. Res.-Sol. Ea., 107, ETG 19-1–ETG 19-15, https://doi.org/10.1029/2001jb000282, 2002.
Bloom, C., Stahl, T., and Howell, A.: Distributed displacement on the Papatea fault from the 2016 Mw 7.8 Kaikōura earthquake and implications for hazard planning, New Zeal, J. Geol. Geophys., 66, 217–227, https://doi.org/10.1080/00288306.2021.1975777, 2021.
Bloom, C. K., Howell, A., Stahl, T., Massey, C., and Singeisen, C.: The influence of off-fault deformation zones on the near-fault distribution of coseismic landslides, Geology, 50, 272–277, https://doi.org/10.1130/G49429.1, 2022.
Bloom, C. K., Singeisen, C., Stahl, T., Howell, A., and Massey, C.: Earthquake contributions to coastal cliff retreat, Earth Surf. Dynam., 11, 757–778, https://doi.org/10.5194/esurf-11-757-2023, 2023.
Budetta, P., Santo, A., and Vivenzio, F.: Landslide hazard mapping along the coastline of the Cilento region (Italy) by means of a GIS-based parameter rating approach, Geomorphology, 94, 340–352, https://doi.org/10.1016/j.geomorph.2006.10.034, 2008.
Budimir, M. E. A., Atkinson, P. M., and Lewis, H. G.: A systematic review of landslide probability mapping using logistic regression, Landslides, 12, 419–436, https://doi.org/10.1007/s10346-014-0550-5, 2015.
Clark, K. J., Nissen, E. K., Howarth, J. D., Hamling, I. J., Mountjoy, J. J., Ries, W. F., Jones, K., Goldstien, S., Cochran, U. A., Villamor, P., Hreinsdóttir, S., Litchfield, N. J., Mueller, C., Berryman, K. R., and Strong, D. T.: Highly variable coastal deformation in the 2016 Mw 7.8 Kaikōura earthquake reflects rupture complexity along a transpressional plate boundary, Earth Planet. Sc. Lett., 474, 334–344, https://doi.org/10.1016/j.epsl.2017.06.048, 2017.
Collins, B. D., Kayen, R., and Tanaka, Y.: Spatial distribution of landslides triggered from the 2007 Niigata Chuetsu-Oki Japan Earthquake, Eng. Geol., 127, 14–26, https://doi.org/10.1016/j.enggeo.2011.12.010, 2012.
Crozier, M. J.: Landslide geomorphology: An argument for recognition, with examples from New Zealand, Geomorphology, 120, 3–15, https://doi.org/10.1016/j.geomorph.2009.09.010, 2010.
Cruden, D. and Varnes, D.: Landslide Types and Processes, Spec. Rep. Natl. Res. Counc. Transp. Res. Board, http://onlinepubs.trb.org/Onlinepubs/sr/sr247/sr247-003.pdf (last access: May 2022), 1996.
Defazio, A., Bach, F., and Lacoste-Julien, S.: SAGA: A fast incremental gradient method with support for non-strongly convex composite objectives, Adv. Neural Inf. Process. Syst., 2, 1646–1654, 2014.
Dellow, S., Massey, C., and Cox, S.: Response and initial risk management of landslide dams caused by the 14 November 2016 Kaikoura earthquake, South Island, New Zealand, Proc. 20th NZGS Geotech. Symp., https://fl-nzgs-media.s3.amazonaws.com/uploads/2022/06/NZGS2017-proceedings-1-1.pdf (last access June 2022), 2017.
Dickson, M. E. and Perry, G. L. W.: Identifying the controls on coastal cliff landslides using machine-learning approaches, Environ. Modell. Softw., 76, 117–127, https://doi.org/10.1016/j.envsoft.2015.10.029, 2016.
Emery, K. O. and Kuhn, G. G.: Sea cliffs: their processes, profiles, and classification., Geol. Soc. Am. Bull., 93, 644–654, https://doi.org/10.1130/0016-7606(1982)93<644:SCTPPA>2.0.CO;2, 1982.
Fawcett, T.: An introduction to ROC analysis, Pattern Recognit. Lett., 27, 861–874, https://doi.org/10.1016/j.patrec.2005.10.010, 2006.
Francioni, M., Coggan, J., Eyre, M., and Stead, D.: A combined field/remote sensing approach for characterizing landslide risk in coastal areas, Int. J. Appl. Earth Obs., 67, 79–95, https://doi.org/10.1016/j.jag.2017.12.016, 2018.
GDAL/OGR contributors: GDAL/OGR Geospatial Data Abstraction soaware Library, Open Source Geospatial Foundation, https://gdal.org, last access: May 2022.
Gischig, V., Preisig, G., and Eberhardt, E.: Numerical investigation of seismically induced rock mass fatigue as a mechanism contributing to the progressive failure of deep-seated landslides, Rock Mech. Rock Eng., 49, 2457–2478, https://doi.org/10.1007/s00603-015-0821-z, 2016.
Griggs, G. and Plant, N.: Coastal-bluff failures in northern Monterey Bay induced by the earthquake, in: The Loma Prieta, California, Earthquake of October 17, 1989-Landslides US Geological Survey Professional Paper, vol. 1551–C, 51–70, https://pubs.usgs.gov/pp/1551c/report.pdf (last access: June 2022), 1998.
Hamling, I. J., Hreinsdóttir, S., Clark, K., Elliott, J., Liang, C., Fielding, E., Litchfield, N., Villamor, P., Wallace, L., Wright, T. J., D'Anastasio, E., Bannister, S., Burbidge, D., Denys, P., Gentle, P., Howarth, J., Mueller, C., Palmer, N., Pearson, C., Power, W., Barnes, P., Barrell, D. J. A., Van Dissen, R., Langridge, R., Little, T., Nicol, A., Pettinga, J., Rowland, J., and Stirling, M.: Complex multifault rupture during the 2016 Mw 7.8 Kaikōura earthquake, New Zealand, Science, 356, 6334, https://doi.org/10.1126/science.aam7194, 2017.
Hancox, G. T., Perrin, N. D., and Dellow, G. D.: Recent studies of historical earthquake-induced landsliding, ground damage, and MM intensity in New Zealand, Bull. New Zeal. Soc. Earthq. Eng., 35, 59–95, https://doi.org/10.5459/bnzsee.35.2.59-95, 2002.
Handwerger, A. L., Huang, M. H., Fielding, E. J., Booth, A. M., and Bürgmann, R.: A shift from drought to extreme rainfall drives a stable landslide to catastrophic failure, Sci. Rep., 9, 1–12, https://doi.org/10.1038/s41598-018-38300-0, 2019.
Hastie, T., Tibshirani, R., and Friedman, J.: The Elements of Statistical Learning: Data Mining, Inference and Prediction, Springer, https://doi.org/10.1007/978-0-387-84858-7, 2017.
He, Y. and Beighley, E. R.: GIS-based regional landslide susceptibility mapping: a case study in southern California, Earth Surf. Proc. Land., 33, 380–393, https://doi.org/10.1002/esp.1562 Y., 2008.
Hosmer, D. W., Lemeshow, S., and Sturdivant, R. X.: Applied logistic regression, third edition, John Wiley and Sons, ISBN 978-0-470-58247-3, 2013.
Howell, A. and Clark, K. J.: Late Holocene coseismic uplift of the Kaikōura coast, New Zealand, Geosphere, 18, 1104–1137, https://doi.org/10.1130/GES02479.1, 2022.
Jibson, R. W.: The 2005 La Conchita, California, landslide, Landslides, 3, 73–78, https://doi.org/10.1007/s10346-005-0011-2, 2006.
Justice, R., Finlan, S., and Revell, T.: Lessons Learned On The North Canterbury Transport Infrastructure Recovery Project, NZ Geomech. News, https://www.nzgs.org/libraries/lessons-learned-on-the-north-canterbury-transportinfrastructure-recovery-project/ (last access: June 2022), 2021.
Keefer, D. K.: Statistical analysis of an earthquake-induced landslide distribution – The 1989 Loma Prieta, California event, Eng. Geol., 58, 231–249, https://doi.org/10.1016/S0013-7952(00)00037-5, 2000.
Kirk, R. M.: Coastal changes at Kaikoura, 1942–74, determined from air photographs, New Zeal. J. Geol. Geophys., 18, 787–801, https://doi.org/10.1080/00288306.1975.10423528, 1975.
Kirk, R. M.: Rates and forms of erosion on intertidal platforms at Kaikoura Peninsula, South Island, New Zealand, New Zeal. J. Geol. Geophys., 20, 571–613, https://doi.org/10.1080/00288306.1977.10427603, 1977.
Kritikos, T., Robinson, T. R., and Davies, T. R. H.: Regional coseismic landslide hazard assessment without historical landslide inventories: A new approach, J. Geophys. Res.-Earth, 120, 711–729, https://doi.org/10.1002/2014JF003224, 2015.
Kutner, M. H., Nachtsheim, C. J., Neter, J., and Li, W.: Applied Linear Statistical Models, McGraw-Hill/Irwin, New York, New York, ISBN 13 978–0073014661, 2004.
Langridge, R. M., Ries, W. F., Litchfield, N. J., Villamor, P., Van Dissen, R. J., Barrell, D. J. A., Rattenbury, M. S., Heron, D. W., Haubrock, S., Townsend, D. B., Lee, J. M., Berryman, K. R., Nicol, A., Cox, S. C., and Stirling, M. W.: The New Zealand Active Faults Database, New Zeal. J. Geol. Geophys., 59, 86–96, https://doi.org/10.1080/00288306.2015.1112818, 2016.
Limber, P. W., Barnard, P. L., Vitousek, S., and Erikson, L. H.: A Model Ensemble for Projecting Multidecadal Coastal Cliff Retreat During the 21st Century, J. Geophys. Res.-Earth, 123, 1566–1589, https://doi.org/10.1029/2017JF004401, 2018.
LINZ: LINZ Data Service – NZ 8m Digital Elevation Model (2012), https://data.linz.govt.nz/layer/51768-nz-8m-digital-elevation-model-2012, last access: 4 March 2021a.
LINZ: LINZ Data Service – NZ Coastlines (Topo, 1:50k), https://data.linz.govt.nz/layer/50258-nz-coastlines-topo-150k/, last access: 13 January 2021b.
LINZ: LINZ Data Service – Canterbury – Kaikoura LiDAR 1 m DEM (2012), https://data.linz.govt.nz/layer/53542-canterbury-kaikoura-lidar-1m-dem-2012/, last access: 10 October 2021c.
Litchfield, N. J., Villamor, P., van Dissen, R. J., Nicol, A., Barnes, P. M., Barrell, D. J. A., Pettinga, J. R., Langridge, R. M., Little, T. A., Mountjoy, J. J., Ries, W. F., Rowland, J., Fenton, C., Stirling, M. W., Kearse, J., Berryman, K. R., Cochran, U. A., Clark, K. J., Hemphill-Haley, M., Khajavi, N., Jones, K. E., Archibald, G., Upton, P., Asher, C., Benson, A., Cox, S. C., Gasston, C., Hale, D., Hall, B., Hatem, A. E., Heron, D. W., Howarth, J., Kane, T. J., Lamarche, G., Lawson, S., Lukovic, B., McColl, S. T., Madugo, C., Manousakis, J., Noble, D., Pedley, K., Sauer, K., Stahl, T., Strong, D. T., Townsend, D. B., Toy, V., Williams, J., Woelz, S., and Zinke, R.: Surface rupture of multiple crustal faults in the 2016 Mw 7.8 Kaikōura, New Zealand, earthquake, B. Seismol. Soc. Am., 108, 1496–1520, https://doi.org/10.1785/0120170300, 2018.
Lombardo, L. and Mai, P. M.: Presenting logistic regression-based landslide susceptibility results, Eng. Geol., 244, 14–24, https://doi.org/10.1016/j.enggeo.2018.07.019, 2018.
Macara, G. R.: The Climate and Weather of Canterbury, NIWA Sci. Technol. Ser., 68, 1–41, 2014.
Malamud, B. D., Turcotte, D. L., Guzzetti, F., and Reichenbach, P.: Landslides, earthquakes, and erosion, Earth Planet. Sc. Lett., 229, 45–59, https://doi.org/10.1016/j.epsl.2004.10.018, 2004.
Marc, O., Hovius, N., Meunier, P., Uchida, T., and Hayashi, S.: Transient changes of landslide rates after earthquakes, Geology, 43, 883–886, https://doi.org/10.1130/G36961.1, 2015.
Marc, O., Behling, R., Andermann, C., Turowski, J. M., Illien, L., Roessner, S., and Hovius, N.: Long-term erosion of the Nepal Himalayas by bedrock landsliding: the role of monsoons, earthquakes and giant landslides, Earth Surf. Dynam., 7, 107–128, https://doi.org/10.5194/esurf-7-107-2019, 2019.
Mason, D., Brabhaharan, P., and Saul, G.: Performance of road networks in the 2016 Kaikōura earthquake: observations on ground damage and outage effects, Proc. 20th NZGS Geotech. Symp., 8 pp., https://www.nzgs.org/libraries/nzgs20_mason/ (last access: June 2022), 2017.
Massey, C., Townsend, D., Rathje, E., Allstadt, K. E., Lukovic, B., Kaneko, Y., Bradley, B., Wartman, J., Jibson, R. W., Petley, D. N., Horspool, N., Hamling, I., Carey, J., Cox, S., Davidson, J., Dellow, S., Godt, J. W., Holden, C., Jones, K., Kaiser, A., Little, M., Lyndsell, B., McColl, S., Morgenstern, R., Rengers, F. K., Rhoades, D., Rosser, B., Strong, D., Singeisen, C., and Villeneuve, M.: Landslides triggered by the 14 November 2016 Mw 7.8 Kaikōura earthquake, New Zealand, B. Seismol. Soc. Am., 108, 1630–1648, https://doi.org/10.1785/0120170305, 2018.
Massey, C., de Vilder, S., Lukovic, B., Townsend, D., and Rosser, B.: District-scale landslide risk analysis of debris inundation for the Kaikōura District, GNS Sci. Consult. Rep., 2021/89, 2021a.
Massey, C., Lukovic, B., Huso, R., Buxton, R., and Potter, S.: Earthquake-induced landslide forecast tool for New Zealand: Version 2.0, GNS Sci. Consult. Rep., 2018/08, https://doi.org/10.21420/G2TP9V, 2021b.
Massey, C., Wolter, A., Huso, R., Lukovic, B., and Brideau, M.-A.: Coseismic Landslide Susceptibility and Triggering Analyses BT – Coseismic Landslides: Phenomena, Long-Term Effects and Mitigation, edited by: Towhata, I., Wang, G., Xu, Q., and Massey, C., Springer Nature Singapore, Singapore, 633–679, https://doi.org/10.1007/978-981-19-6597-5_18, 2022.
Massey, C. I., Lukovic, B., Taig, T., Rosser, B., and Ries, W.: The North Canterbury Infrastructure Recovery Alliance: Pilot study for assessing landslide hazards along the road and rail corridors, GNS Sci. Consult. Rep., 2017/185, 2019.
Massey, C. I., Townsend, D. T., Lukovic, B., Morgenstern, R., Jones, K., Rosser, B., and de Vilder, S.: Landslides triggered by the Mw 7.8 14 November 2016 Kaikōura earthquake: an update, Landslides, 17, 2401–2408, https://doi.org/10.1007/s10346-020-01439-x, 2020a.
Massey, C. I., Townsend, D., Jones, K., Lukovic, B., Rhoades, D., Morgenstern, R., Rosser, B., Ries, W., Howarth, J., Hamling, I., Petley, D., Clark, M., Wartman, J., Litchfield, N., and Olsen, M.: Volume Characteristics of Landslides Triggered by the Mw 7.8 2016 Kaikōura Earthquake, New Zealand, Derived from Digital Surface Difference Modeling, J. Geophys. Res.-Earth, 125, https://doi.org/10.1029/2019JF005163, 2020b.
Massey, C. I., Olsen, M. J., Wartman, J., Senogles, A., Lukovic, B., Leshchinsky, B. A., Archibald, G., Litchfield, N., Dissen, R., Vilder, S., and Holden, C.: Rockfall activity rates before, during and after the 2010/11 Canterbury Earthquake Sequence, J. Geophys. Res.-Earth, 127, https://doi.org/10.1029/2021jf006400, 2022.
Meunier, P., Hovius, N., and Haines, A. J.: Regional patterns of earthquake-triggered landslides and their relation to ground motion, Geophys. Res. Lett., 34, https://doi.org/10.1029/2007GL031337, 2007.
Mottershead, D.: Coastal Weathering, Treatise Geomorphol, 1–14, 228–244, https://doi.org/10.1016/B978-0-12-374739-6.00064-6, 2013.
Nicol, A., Begg, J., Saltogianni, V., Mouslopoulou, V., Oncken, O., and Howell, A.: Uplift and fault slip during the 2016 Kaikōura Earthquake and Late Quaternary, Kaikōura Peninsula, New Zealand, New Zeal. J. Geol. Geophys., 66, 1–16, https://doi.org/10.1080/00288306.2021.2021955, 2022.
NIWA: CliFlo: NIWA's National Climate Database on the Web, https://cliflo.niwa.co.nz/ (last access: May 2022), 2022
NZTA: NCTIR – Kaikōura Recovery Book: Moving Mountains to Reconnect Communities, https://www.nzta.govt.nz/projects/kaikoura-earthquake-response/publications (last access: June 2022), 2021.
Ota, Y., Pillans, B., Berryman, K., Beu, A., Fujimori, T., Miyauchi, T., Berger, G., Beu, A. G., and Climo, F. M.: Pleistocene coastal terraces of Kaikoura Peninsula and the Marlborough coast, South Island, New Zealand, New Zeal. J. Geol. Geophys., 39, 51–73, https://doi.org/10.1080/00288306.1996.9514694, 1996.
Parker, R. N., Hancox, G. T., Petley, D. N., Massey, C. I., Densmore, A. L., and Rosser, N. J.: Spatial distributions of earthquake-induced landslides and hillslope preconditioning in the northwest South Island, New Zealand, Earth Surf. Dynam., 3, 501–525, https://doi.org/10.5194/esurf-3-501-2015, 2015.
Pedregosa, F., Varoquaux, G., Gramfort, A., Michel, V., Thirion, B., Grisel, O., Blondel, M., Prettenhofer, P., Weiss, R., and Dubourg, V.: Scikit-learn: Machine learning in Python, J. Mach. Learn. Res., 12, 2825–2830, 2011 (code available at: https://github.com/scikit-learn/scikit-learn, last access: May 2022).
Rattenbury, M. S., Townsend, D. B., and Johnston, M. R.: Geology of the Kaikoura area, 1 pp., https://shop.gns.cri.nz/qkaikoura-zip/ (last access: June 2022), 2006.
Rault, C., Robert, A., Marc, O., Hovius, N., and Meunier, P.: Seismic and geologic controls on spatial clustering of landslides in three large earthquakes, Earth Surf. Dynam., 7, 829–839, https://doi.org/10.5194/esurf-7-829-2019, 2019.
Reichenbach, P., Rossi, M., Malamud, B. D., Mihir, M., and Guzzetti, F.: A review of statistically-based landslide susceptibility models, Earth-Sci. Rev., 180, 60–91, https://doi.org/10.1016/j.earscirev.2018.03.001, 2018.
Sepúlveda, S. A.: Earthquake-Induced Landslide Susceptibility and Hazard Assessment Approaches BT – Coseismic Landslides: Phenomena, Long-Term Effects and Mitigation, edited by: Towhata, I., Wang, G., Xu, Q., and Massey, C., Springer Nature Singapore, Singapore, 543–571, https://doi.org/10.1007/978-981-19-6597-5_14, 2022.
Singeisen, C., Massey, C., Wolter, A., Kellett, R., Bloom, C., Stahl, T., Gasston, C., and Jones, K.: Mechanisms of rock slope failures triggered by the 2016 Mw 7.8 Kaikōura earthquake and implications for landslide susceptibility, Geomorphology, 415, 108386, https://doi.org/10.1016/j.geomorph.2022.108386, 2022.
Small, C. and Nicholls, R. J.: A global analysis of human settlement in coastal zones, J. Coast. Res., 19, 584–599, 2003.
Stringer, J., Brook, M. S., and Justice, R.: Post-earthquake monitoring of landslides along the Southern Kaikōura Transport Corridor, New Zealand, Landslides, 18, 409–423, https://doi.org/10.1007/s10346-020-01543-y, 2021.
U.S. Geological Survey: Earth Explorer, https://earthexplorer.usgs.gov/ (last access: May 2022), 2022.
Tibshirani, R.: Regression Shrinkage and Selection Via the Lasso, J. R. Stat. Soc. B, 58, 267–288, https://doi.org/10.1111/j.2517-6161.1996.tb02080.x, 1996.
Vann Jones née Norman, E. C., Rosser, N. J., Brain, M. J., and Petley, D. N.: Quantifying the environmental controls on erosion of a hard rock cliff, Mar. Geol., 363, 230–242, https://doi.org/10.1016/j.margeo.2014.12.008, 2015.
Williams, F., McColl, S., Fuller, I., Massey, C., Smith, H., and Neverman, A.: Intersection of fluvial incision and weak geologic structures cause divergence from a universal threshold slope model of landslide occurrence, Geomorphology, 389, 107795, https://doi.org/10.1016/j.geomorph.2021.107795, 2021.
Worden, B. C., Thompson, E. M., Hearne, M., and Wald, D. J.: ShakeMap Manual Online: Technical Manual, User's Guide, and Software Guide, GitHub, https://usgs.github.io/shakemap/ (last access: May 2022), 2020.
Young, A. P.: Decadal-scale coastal cliff retreat in southern and central California, Geomorphology, 300, 164–175, https://doi.org/10.1016/j.geomorph.2017.10.010, 2018.
Young, A. P., Flick, R. E., O'Reilly, W. C., Chadwick, D. B., Crampton, W. C., and Helly, J. J.: Estimating cliff retreat in southern California considering sea level rise using a sand balance approach, Mar. Geol., 348, 15–26, https://doi.org/10.1016/j.margeo.2013.11.007, 2014.
Zinke, R., Hollingsworth, J., Dolan, J. F., and Van Dissen, R.: Three-Dimensional Surface Deformation in the 2016 Mw 7.8 Kaikōura, New Zealand, Earthquake From Optical Image Correlation: Implications for Strain Localization and Long-Term Evolution of the Pacific-Australian Plate Boundary, Geochem. Geophy. Geosy., 20, 1609–1628, https://doi.org/10.1029/2018GC007951, 2019.
- Abstract
- Introduction
- Background
- Data and methods
- Results
- Discussion
- Conclusions
- Appendix A: Additional methods and data
- Appendix B: Additional results
- Code availability
- Data availability
- Author contributions
- Competing interests
- Disclaimer
- Acknowledgements
- Financial support
- Review statement
- References