the Creative Commons Attribution 4.0 License.
the Creative Commons Attribution 4.0 License.
 | 30 Aug 2023
Avalanche size estimation and avalanche outline determination by experts: reliability and implications for practice
Elisabeth D. Hafner
Frank Techel
Rodrigo Caye Daudt
Jan Dirk Wegner
Konrad Schindler
Yves Bühler
Consistent estimates of avalanche size are crucial for communicating not only among avalanche practitioners but also between avalanche forecasters and the public, for instance in public avalanche forecasts. Moreover, applications such as risk management and numerical avalanche simulations rely on accurately mapped outlines of past avalanche events. Since there is not a widely applicable and objective way to measure avalanche size or to determine the outlines of an avalanche, we need to rely on human estimations. Therefore, knowing about the reliability of avalanche size estimates and avalanche outlines is essential as errors will impact applications relying on this kind of data. In the first of three user studies, we investigate the reliability in avalanche size estimates by comparing estimates for 10 avalanches made by 170 avalanche professionals working in Europe or North America. In the other two studies, both completed as pilot studies, we explore reliability in the mappings of six avalanches from oblique photographs from 10 participants and the mappings of avalanches visible on 2.9 km2 of remotely sensed imagery in four different spatial resolutions from 5 participants. We observed an average agreement of 66 % in the most frequently given avalanche size, while agreement with the avalanche size considered “correct” was 74 %. Moreover, European avalanche practitioners rated avalanches significantly larger for 8 out of 10 avalanches, compared to North Americans. Assuming that participants are equally competent in the estimation of avalanche size, we calculated a score describing the factor required to obtain the observed agreement rate between any two size estimates. This factor was 0.72 in our dataset. It can be regarded as the certainty related to a size estimate by an individual and thus provides an indication of the reliability of a label. For the outlines mapped from oblique photographs, we noted a mean overlapping proportion of 52 % for any two avalanche mappings and 60 % compared to a reference mapping. The outlines mapped from remotely sensed imagery had a mean overlapping proportion of 46 % (image resolution of 2 m) to 68 % (25 cm) between any two mappings and 64 % (2 m) to 80 % (25 cm) when compared to the reference. The presented findings demonstrate that the reliability of size estimates and of mapped avalanche outlines is limited. As these data are often used as reference data or even ground truth to validate further applications, the identified limitations and uncertainties may influence results and should be considered.
- Article
(11928 KB) - Full-text XML
-
Supplement
(911 KB) - BibTeX
- EndNote


Information on the location and size of avalanches is crucial for avalanche forecasting. A consistent and accurate documentation of the outlines of avalanches is important for applications such as avalanche-related risk management, hazard mitigation measures or hazard zone planning. In addition, these data are used as ground truth, for instance, for the validation of numerical avalanche simulations (e.g., Wever et al., 2018), when training models for the automated detection of avalanches on satellite images (e.g., Hafner et al., 2022) or for training models estimating avalanche size from snowpack simulations (e.g., Mayer et al., 2023). However, avalanche size estimates are subjective as they cannot easily be measured like, for instance, earthquakes. The same is true for avalanche outlines, where no objective way of determining them exists. In many applications where direct measurements are not possible, human estimates are used as the reference, sometimes referred to as a “gold standard” (e.g., Weller and Mann, 1997). Applications, where such data are used, include mapping of landslides (Ardizzone et al., 2002; Galli et al., 2008), identifying rock glaciers (Brardinoni et al., 2019), or the estimation of avalanche size and danger (e.g., Schweizer et al., 2020). When these data are used for validation, errors in the estimates may cause an observed reduction in model or forecast performance, simply due to errors in the reference (e.g., Bowler, 2006; Lampert et al., 2016). Therefore, quantifying reliability, defined as the consistency of repeated measurements or judgments of the same event relying on the same process (Cronbach, 1947), is vital.
The reliability of judgments of something that cannot be known directly may be described using Brunswik's lens model (Stewart, 2001): the parameter that cannot be directly measured is estimated using the information available (data). These data may be imperfectly describing the parameter of interest. The connection between the parameter and the actual event is the accuracy of the estimate. It may be reduced by unreliability either in the information (data) or in the information processing for making the judgment (skill of the judge; Stewart, 2001). The reliability of judgments may be approximated with repeated estimates, regression models or the measurement of agreement among estimates (Stewart, 2001). Such investigations, for comparable tasks where human estimates are important, have revealed that the automated mapping of clean glacier ice is at least as accurate as manual digitization (Paul et al., 2013). Galli et al. (2008) found the time available for field reconnaissance to correlate with the accuracy of landslide event inventory maps. Brardinoni et al. (2019) analyzed the variability in rock glacier inventories and found it to depend, in comparable proportions, on inter-operator variability and the quality of available imagery.
Since both avalanche size and avalanche outlines are currently assessed relying on human interpreters and since consistent and accurate size estimates and avalanche outlines are key data for several applications, our objective is to quantify the reliability of these data. We expand previous studies exploring the consistency in avalanche size estimates (Moner et al., 2013; Jamieson et al., 2014) using a larger sample. Moreover, we quantify the reliability in avalanche outlines mapped from oblique photographs and remotely sensed imagery and investigate potential factors explaining inter- and intra-rater variations.
In three independent user studies we address the following two research questions:
-
To what degree do experts agree when rating the size of an avalanche from photographs?
-
To what degree do experts agree when mapping the outline of avalanches from oblique photographs or from remotely sensed imagery?
Moreover, we explore potential factors influencing the agreement rates in size estimates or avalanche outline mappings. This allows for the estimation of benchmark values describing the reliability of these kind of data and hence the interpretation of the performance of applications relying on these data.
Avalanche size may be assessed by installing infrastructure to measure impact pressure (e.g., Sovilla et al., 2008) or by determining deposit volumes with photogrammetry (e.g., Eckerstorfer et al., 2016), optionally complemented with snow density samples of the avalanche deposit or by assuming a plausible density to calculate mass (Jamieson et al., 2014). Given current technologies, this is not feasible for all avalanches, and in addition it was not possible at all until a few years ago. Therefore most avalanche inventories rely on size estimates made by humans. Even though avalanches may be identified in remotely sensed imagery with high locational accuracy, there is as of yet no objective way to determine the outlines of avalanches, and – so far – all automatic approaches have been validated against manual mappings (e.g., Lato et al., 2012; Bianchi et al., 2021). Furthermore, suitable remotely sensed imagery is often not available; therefore avalanche outlines are mostly manually mapped, directly in the field or later from photographs.
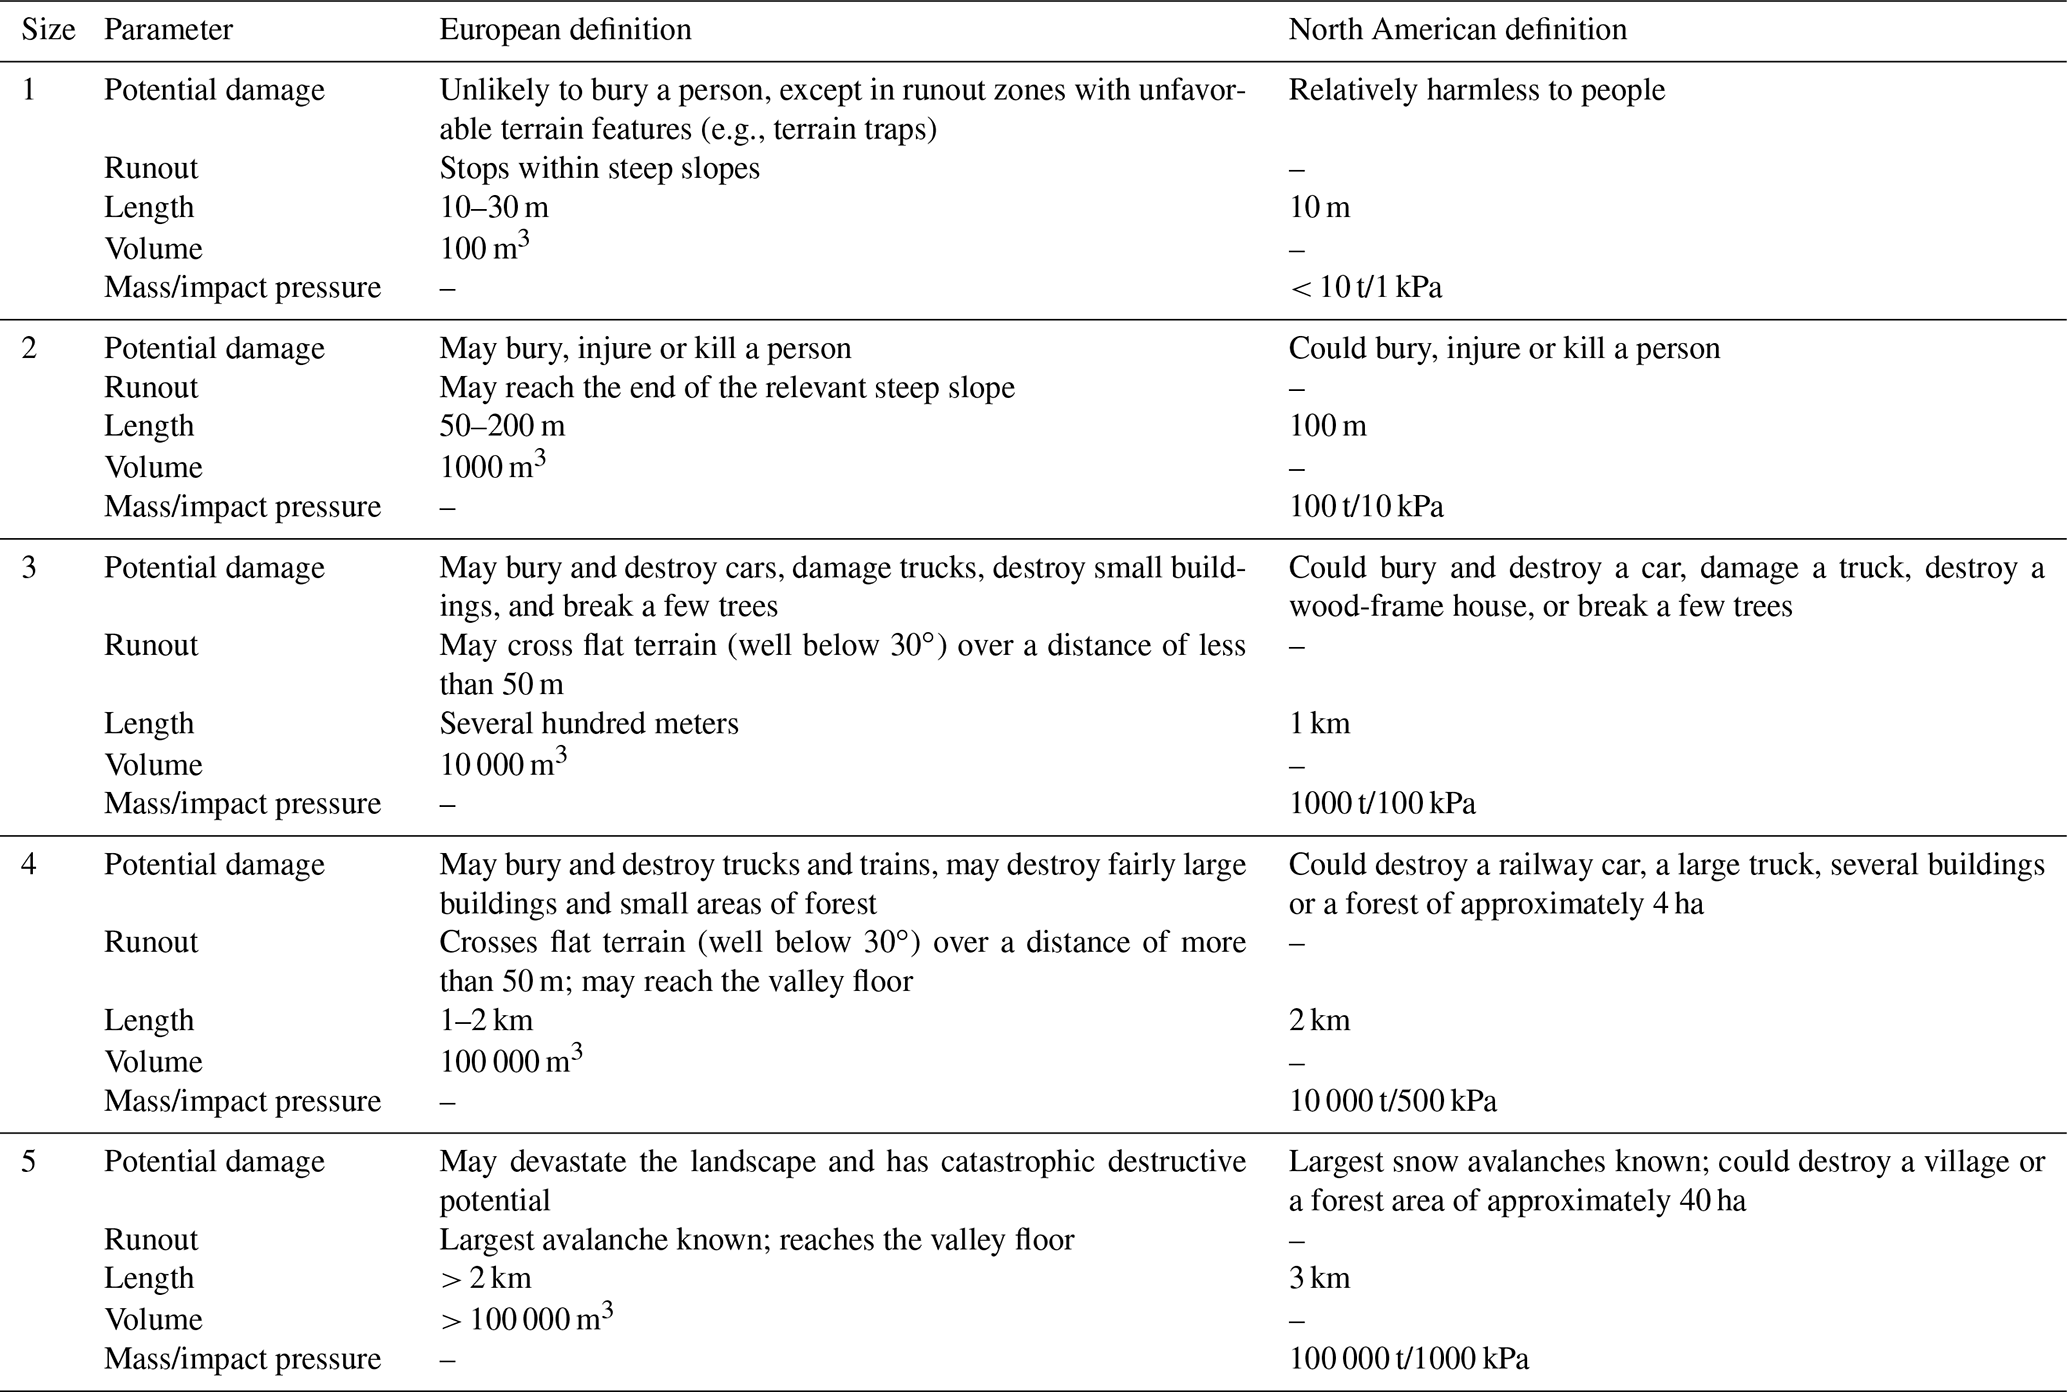
In practice, field observers or the public may provide an estimation of avalanche size together with the approximate location of the avalanche (a point) or map the outlines of avalanches, while avalanche forecasters recording avalanches may also use photographs provided by third parties for these tasks. It is common practice for avalanches to be assigned a size estimate using a scale. Standardized scales were first proposed about 60 years ago by the U.S. Department of Agriculture (1961) to “provide an effective vehicle for communication between the observers themselves and others” (McClung and Schaerer, 1980, p. 15). The earliest classification of avalanches into size categories was based on destructive potential (U.S. Department of Agriculture, 1961). Since then, the classification has been extended and refined by analyzing mass and frequency distributions of avalanches (McClung and Schaerer, 1980). This scale was adopted in several countries (among others, Canada and New Zealand). In addition, in the United States the destructive scale is often combined with a relative scale, where avalanches are given a size relative to the avalanche path they occurred on (Birkeland and Greene, 2011). In this system, the size of an avalanche is dependent on its location (McClung and Schaerer, 1980). Both scales use five size classes, with size 1 being the smallest and size 5 being the largest avalanche. With some variations, the destructive scale was adopted in Europe in 2009 and later complemented with more details. An overview of the scales currently used in North America and Europe is shown in Table 1.
Table 1Definition of avalanche size for Europe (EAWS, 2023) and North America (Canadian Avalanche Association, 2016; American Avalanche Association, 2022; Canadian definition for the description of potential damage, the other parameters are identical). In Europe, length and volume are subsumed under the headline typical dimensions (EAWS, 2023).
Inventories of avalanches mapped either directly in the field or later from photographs have been used in numerous studies (e.g., Hafner et al., 2021; Bühler et al., 2022; Techel et al., 2022) but are known to be incomplete (Schweizer et al., 2020) and biased towards accessible terrain and larger avalanches (Hendrikx et al., 2005). Avalanche size may be directly derived from avalanche outlines (Schweizer et al., 2020; Völk, 2020; Bühler et al., 2019), for example, by thresholding the mapped area. In addition to manual avalanche outline mapping, avalanches have increasingly been mapped (manually or automatically) from remotely sensed imagery such as satellite images or orthophotos acquired from airplanes or drones (e.g., Korzeniowska et al., 2017; Eckerstorfer et al., 2017; Bühler et al., 2019; Bianchi et al., 2021; Hafner et al., 2022). Specifically satellite imagery has the potential to close the information gap in avalanche documentation and record avalanche occurrences over large areas with a consistent methodology, thereby complementing existing databases (e.g., Lato et al., 2012; Vickers et al., 2016; Eckerstorfer et al., 2017; Bühler et al., 2019).
To explore the reliability of avalanche size estimates and avalanche outline determination, we conducted three user studies, described in Sect. 3.1 to 3.3. In all three studies, we simulated different typical size estimation or avalanche mapping tasks based on either oblique photos or remotely sensed images. For each of the three experiments, this translated to the following common task for the study participants: an assessor is given an image and has to (1) detect the avalanche(s) in the image. If an avalanche is detected, the assessor (2) either judges the size of the avalanche or distinguishes between an avalanche and no avalanche by drawing an outline.
3.1 Study 1: avalanche size estimation
To explore the reliability of avalanche size estimates provided by avalanche practitioners, we developed a survey consisting of 10 photographs of avalanches (see the Supplement). The photographs used were originally captured for the purpose of documenting avalanches. They show clearly identifiable avalanches in various terrain and were chosen to provide a diverse set of perspectives, sizes and illumination, as well as the presence of various reference objects. In the survey, each participant was asked to estimate the size of each of the 10 avalanches using the five-class integer scale, where we refer to estimates as “full” sizes (for instance, size 3; see Table 1). After estimating the full size of an avalanche, participants had the opportunity to provide an intermediate size (“half” size, nine levels; for instance, size 2.5). As a second task, we asked participants to rate the importance of the factors characterizing avalanche size for their size estimations on a four-point Likert scale as either very important, important, less important or not at all important (factors: destructive potential, dimensions, runout and volume; Table 1). We designed the survey with a European audience in mind and only later decided to extend it to North America. For this reason, runout and volume were included as factors even though they are not part of the North American avalanche size definition. Similarly, in the European definition typical length and volume are presented under the headline typical dimensions (EAWS, 2023), a term which is not present in the North American definition.
The survey was sent to avalanche practitioners, primarily regional avalanche forecasters in Europe and North America, through personal contacts or using forecast center mailing lists. The survey was available in English, French, German and Italian. We asked participants at the beginning of the survey whether they were avalanche forecasters and in which country they work. In total, 170 responses were received: 105 from Europe and 65 from North America. The proportion of professional avalanche forecasters in our dataset was 86 % (146). The other 24 participants either had additional roles besides forecasting or worked closely with the avalanche warning service, for example as avalanche educators, mountain guides, ski patrollers or field observers for a warning service. The professional forecasters in our sample were from the United States (39 participants), Italy (33), Canada (17), Norway (15), Spain (10), Austria (10) and Switzerland (7), while all other countries had 2 or fewer participants.
3.2 Study 2: avalanche mapping from oblique photographs
To investigate the reliability in avalanche outlines, we asked nine people, who map avalanches as part of their professional duties, to map six avalanches in the area around Davos (Switzerland) from winter 2020/21.
For each avalanche, we provided three to six photographs and indicated the approximate location by giving the name of a ridge or summit in the proximity of the avalanche (distance 50 to 300 m). Mapping was conducted using operational mapping tools, which provide the user with a topographic map (at best with a scale of 1:10 000; swisstopo, 2020a), orthophotos (resolution of 10×10 cm; swisstopo, 2020b) and slope incline classes for areas steeper than 30∘ (resolution 10 × 10 m). Each participant was asked to map the six avalanches with the same accuracy as they usually would when mapping avalanches. In addition to the nine participants, we used the avalanche outlines that were initially mapped for documentation purposes in winter 2020/21.
To create a reference for the map analysis, we georeferenced one image per avalanche with the monoplotting tool developed by Bozzini et al. (2012, 2013), then drew and exported the avalanche outlines. Since this approach allows for a much more accurate localization of avalanche outlines, we used these as a reference in this study. For one avalanche (Fig. 5a), the deposit was obscured by a tree in the only photograph where the whole avalanche was visible. This part of the avalanche was therefore disregarded in the analyses including this reference.
3.3 Study 3: avalanche mapping from remotely sensed imagery
The third experiment concerned the mapping of avalanche outlines from remotely sensed imagery. In addition to comparing mapped avalanche outlines between individuals, this experiment allowed for exploring some of the potential factors influencing the quality of mapped avalanche outlines (illumination, snow conditions, avalanche type, image resolution; Hafner et al., 2022).
We selected two georeferenced images acquired under different snow conditions (see Table 2) without artifacts, without saturation and as 16-bit radiometric information. The images were processed in Agisoft Metashape. To obtain different resolutions, we bi-linearly resampled the data in the red–green–blue channel (RGB) to 25 cm, 50 cm, 1 m and 2 m spatial resolution (for native resolutions, see Table 2). For separating illuminated from shaded areas, we used a support vector machine classifier to calculate a shadow mask (see Hafner et al., 2022, for details).
Table 2Properties of remotely sensed imagery, which was used to investigate variations in the performed avalanche mapping.
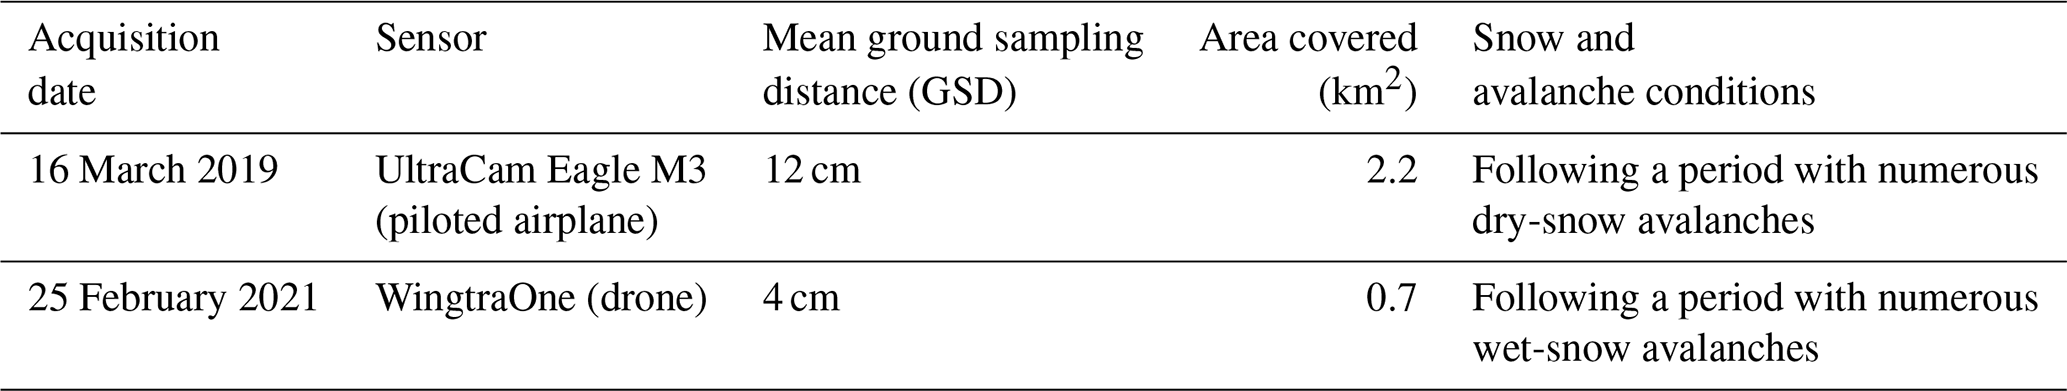
We provided a standardized introduction to the five participants, who were all familiar with avalanches and remotely sensed imagery. All visible avalanches were to be digitized in the software ArcGIS Pro, starting from the coarsest (2 m) and ending with the finest resolution (25 cm). Images with higher resolution were only made available after the mapping of the (one-step) coarser resolution had been completed. Participants could not re-examine their earlier mappings. They had access to the topographic map (at best a scale of 1:10 000; swisstopo, 2020a) and slope incline classes for areas steeper than 30∘ (resolution of 10 × 10 m). We instructed participants to outline all areas with signs of avalanche activity rather than drawing individual events; thus, they were asked to delimit all visible avalanche regions but not to separate them into individual avalanche polygons. The participants did not see the mapped outlines from other participants before they had finished with the highest resolution.
3.4 Data analysis
3.4.1 Avalanche size estimates
Presumably, having many assessors performing the same task is a rare exception; thus, in most situations only a single estimate for avalanche size is available. Therefore, the reliability of an individual estimate is of interest. Not making an assumption about whether any two size estimates contain the true label, the agreement between raters can be considered an indirect indicator of reliability (Stewart, 2001). For the avalanche size estimation study (Sect. 3.1), we calculated inter-rater agreement as the proportion of agreements in avalanche size between any two raters for the 10 avalanches (Pagree). Following Stewart (2001), if random errors between two raters are independent, then the correlation between two raters' estimates cannot be larger than the product of their reliabilities, except by chance. In other words, without knowing which rater is more competent or reliable, the reliability (rel) of an individual rater is the geometric mean of the individual reliabilities (Techel, 2020, p. 35). In the special case with two raters , rel can be derived as
Reliability rel thus provides an indication regarding the certainty related to estimates by individuals (Stewart, 2001, pp. 84–85).
Several studies have shown that the competency of raters influences the reliability of the labels (e.g., Lampert et al., 2016; Wong et al., 2022). We therefore investigated whether some raters more often provided different or rather extreme size estimates compared to others. As we are lacking an independent ground truth label, we infer a ground truth size assuming that the consensus or most frequently chosen size is a suitable approximation. This is a frequently used approach when no ground truth label is available (e.g., Lampert et al., 2016; Wong et al., 2022). Thus, we extracted the mode (smode) and median size. However, as the number of participants differed between North America and Europe, and not wanting to favor either in case of differences, we considered the mean of the corresponding median size in North America and Europe for avalanche j as the reference size . In the case that was between two integer values, for instance, 2.5, we considered the result inconclusive and treated the correspondingly lower and higher integer size as correct too (here size 2 and 3). Similarly, in the case of equal votes for two avalanche sizes, we considered both for the calculation of agreement with smode.
To obtain an indication on the competency of individual raters, we derived a proportion of those that are “correct” for each rater i of Pcorrect, defined as the number of size estimates sij being equal to divided by the number of avalanches. As an alternative approach, we calculated Pmode for each rater i, specified as the number of size estimates sij equal to the most frequently chosen size smode divided by the number of avalanches.
We used the Wilcoxon rank-sum test and the proportion test (as implemented in R Core Team, 2021) to test for significant differences between groups. We considered p values ≤ 0.05 as statistically significant.
3.4.2 Avalanche outline determination
For the outline determination exercises (studies 2 and 3), we calculated the intersection over union (IoU) as an indicator of spatial agreement in the mappings by any two annotators (e.g., Levandowsky and Winter, 1971). Here, IoU describes the overlapping proportion of two avalanche areas (AoO) relative to the combined area of the two avalanche areas (AoU):
where IoU lies between 0 (no overlap) and 1 (full overlap; Fig. 1).
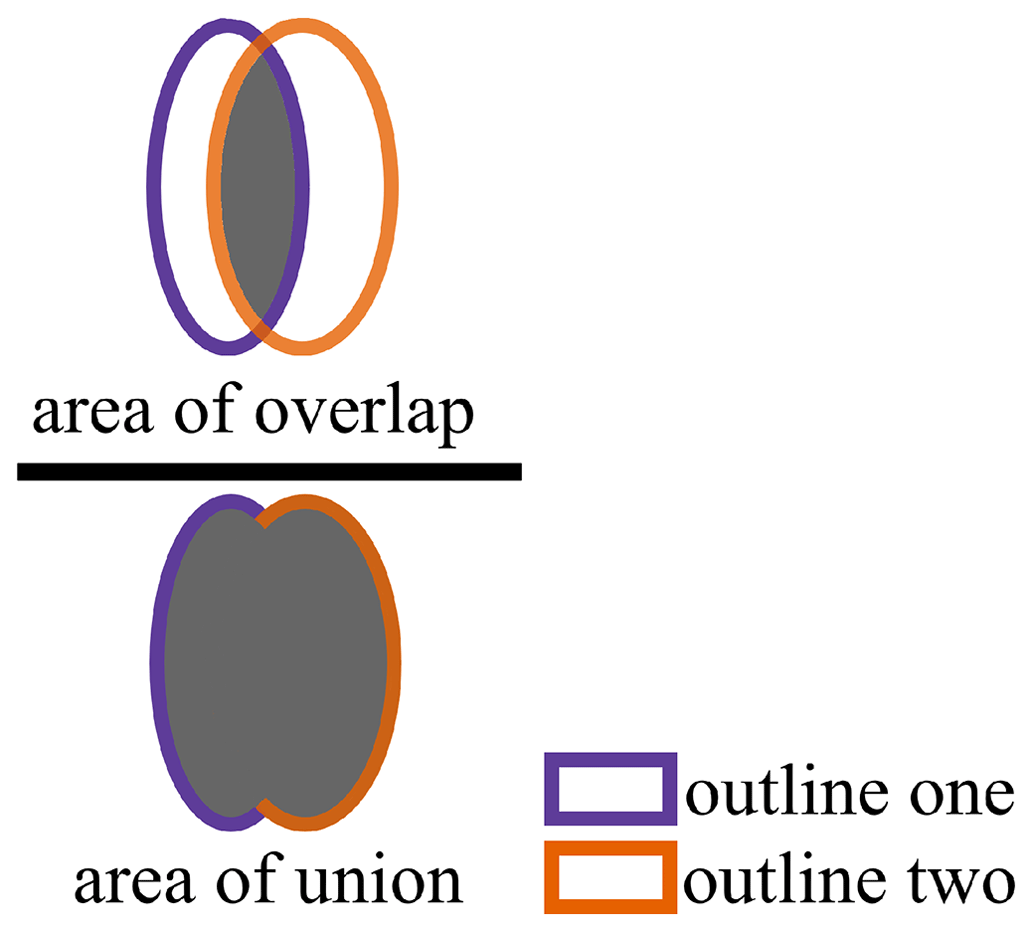
Figure 1Intersection over union (IoU) with the area of overlap (AoO) and the area of union (AoU).
We used three variations for IoU:
-
IoUpairwise, which is the ratio between the intersection of any two individual mappings to the union of these two mappings;
-
IoUall, which is the ratio between the intersection of an individual mapping to the union of all mappings;
-
IoUref, which is the ratio between the intersection of an individual mapping and the reference mapping to the union of these two mappings.
As for the avalanche size estimation study (Sect. 3.1), we explored annotator competence. In study 2 (Sect. 3.2), we used the reference mapping as ground truth. In study 3 (Sect. 3.3), with five participants, we assumed that the area marked as an avalanche by a simple majority (three out of five participants) represented a good approximation of a ground truth.
4.1 Avalanche size estimation (study 1)
A total of 170 people participated in the survey and estimated the size of 10 avalanches, shown in Fig. 2. The agreement rate between any two size estimates Pagree was 0.53, ranging from 0.22 to 0.68 for individual raters. Nine of these raters had an agreement rate lower than the 95th percentile of the 170 participants (Pagree≤0.39), indicating particularly low correspondence with avalanche size as perceived by others. Each of these nine raters suggested at least for one avalanche a rather “extreme” avalanche size, a size which less than 10 % of the participants had chosen. Without these nine raters, the agreement rate was 0.54, which is only marginally higher than the overall agreement. Considering all responses, the mean reliability rel of individual estimates was 0.72, ranging from 0.47 to 0.82, and, if excluding the nine raters with the lowest agreement with others, rel was 0.73.
On average, the agreement with the size considered correct () was Pcorrect= 0.74, or, if treating a simple most frequent vote smode as the reference size, Pmode was 0.66; 16 participants were in full agreement (Pcorrect=1) with the avalanche sizes considered the most likely size , while the nine raters with the lowest agreement with others also had low values of agreement with . Excluding these resulted in Pcorrect= 0.76.
In addition to the 66 % of the respondents who provided the same size estimate as the most frequently chosen size smode, another 29 % chose the second-most popular neighboring size. Thus, in total 92 % of all estimates fell into two adjacent size classes highlighting that there was a reasonable consensus on the most likely size(s). Relaxing the definition for agreement even more (as in Moner et al., 2013), 97 % of the responses were size smode±1, ranging from 46 % for Fig. 2b to 98 % for Fig. 2f. The average number of different full size classes chosen was 3.7, ranging between two for Fig. 2f and five for Fig. 2j. The latter example means that each of the five size classes were indicated at least once. This shows that even though most votes were in correspondence with one of the two most frequent size classes, at least some estimates regularly deviated strongly from this opinion.
An intermediate size class was given in 26 % of all cases. The agreement of the intermediate size estimated by a respondent with the most frequently indicated intermediate size smode.intermediate was 0.49, and for the agreement was 0.74, while Pcorrect was 0.53. The most frequent intermediate size was always between the two most frequent full sizes, underlining that a share of participants differed in their estimates less than a full size (Fig. 2). The mean agreement rate Pagree, when allowing for full and intermediate sizes, was 0.37; the reliability rel was consequently 0.61.
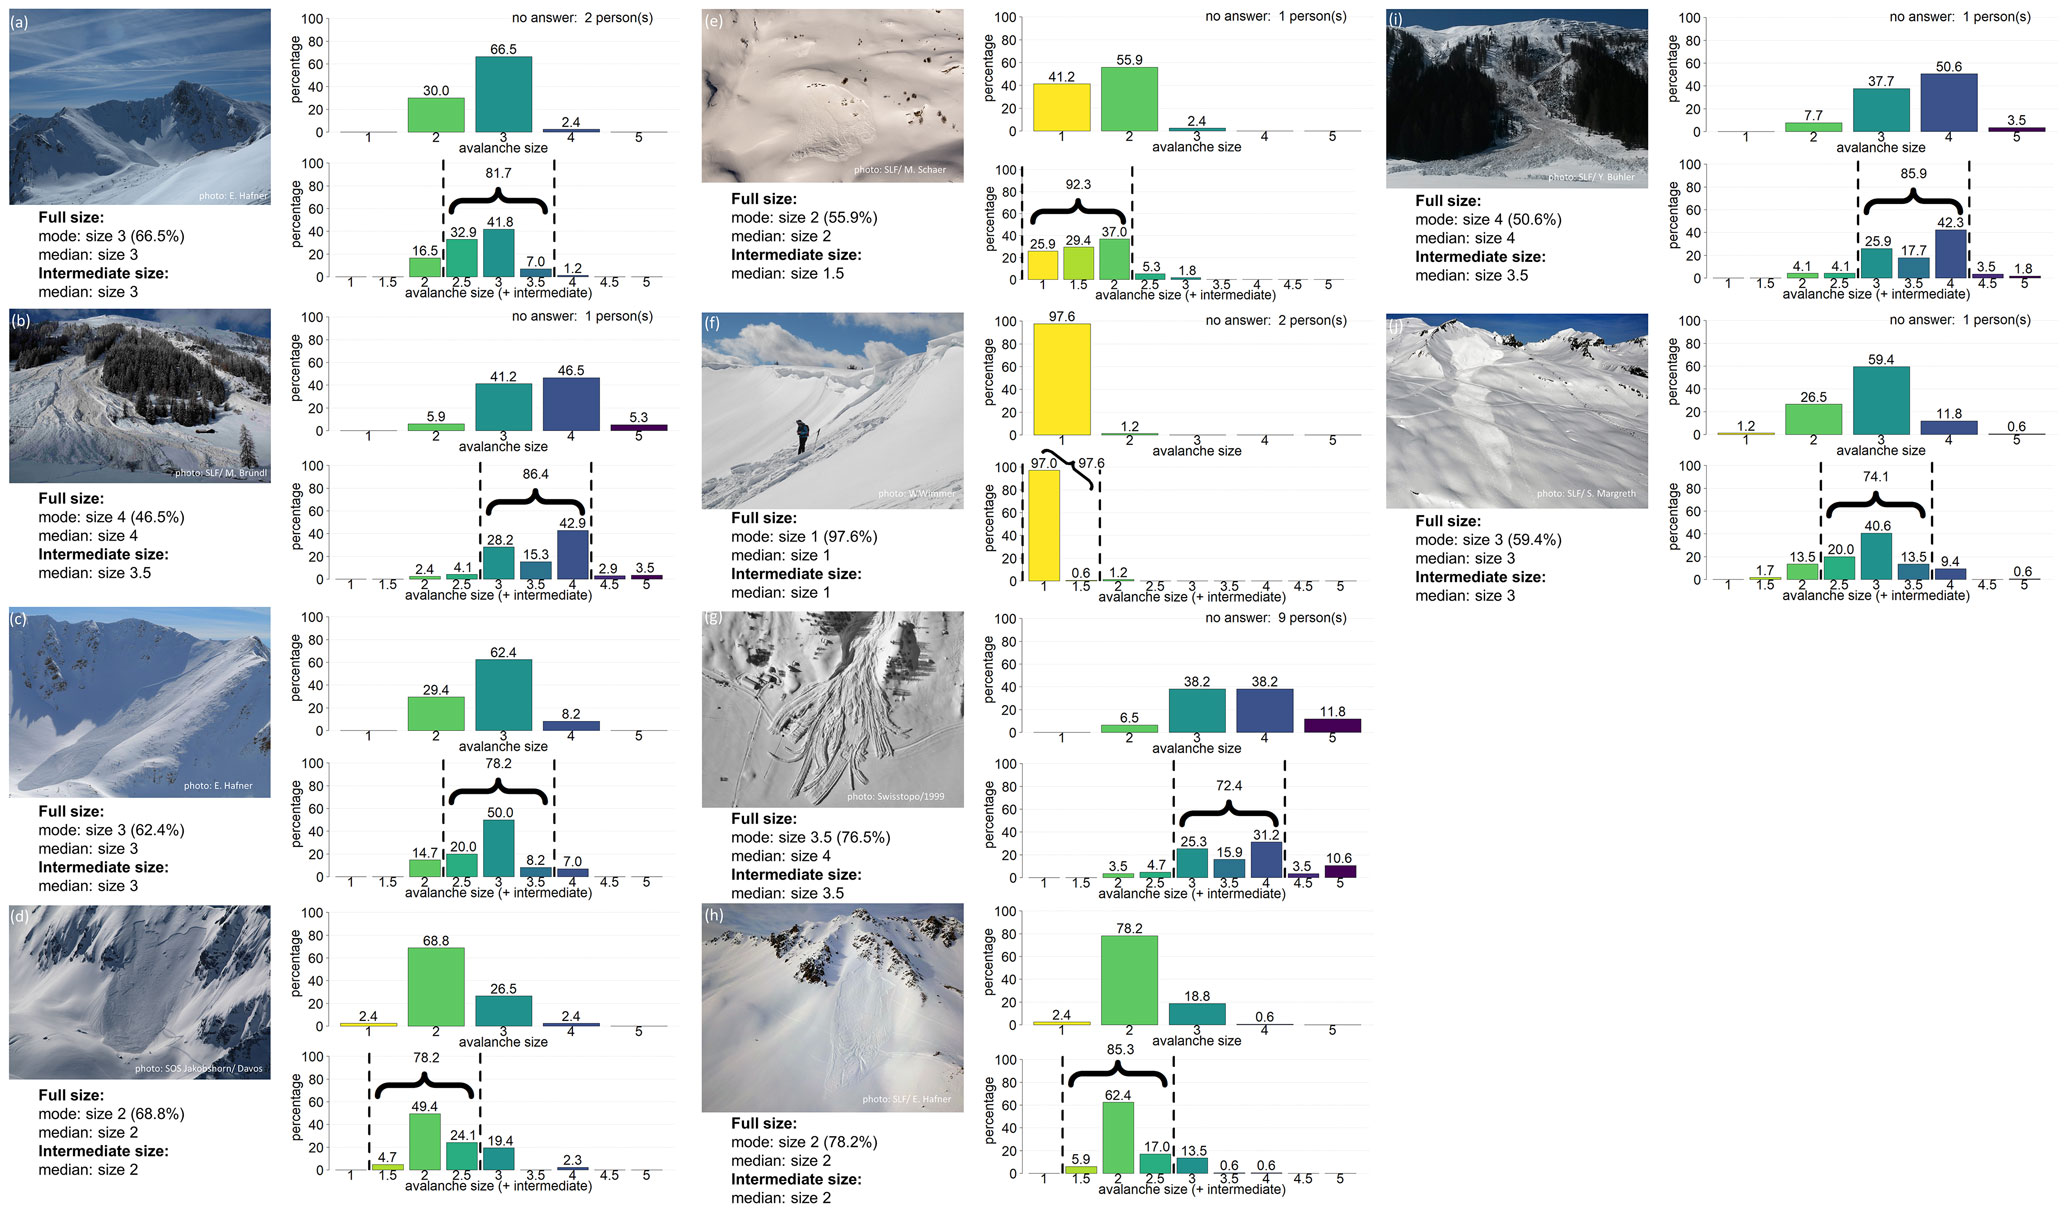
Figure 2Distribution of the size classes and the intermediate sizes assigned to avalanches/pictures (a) to (j) in the survey.
To explore if the size of an avalanche relative within an image and in relation to the surroundings influences size estimation, we included one avalanche twice though the image was cropped and flipped (avalanches in Fig. 2a and c); 168 out of 170 participants rated both avalanches. Of those 168, 78 % indicated the same size, and 15 % rated the avalanche one size larger in the close-up view in Fig. 2c than in the overview in Fig. 2a, whereas 7 % rated the avalanche one size smaller in the close-up view compared to the overview. The shift in the proportions is statistically significant (proportion test: p=0.036).
When comparing the results from Europe and North America, we found the agreement of individual raters in the most frequently estimated size smode to be identical (Pmode=0.66). This approach slightly favors European respondents, as these contributed a larger share of responses (Europe: N=105, North America: N=65). Considering instead, the agreement Pcorrect was 0.74 overall and 0.66 for both Europe and North America individually. The higher overall agreement results from the definition of the reference size , where two sizes were considered correct if the reference size was located in between two values. North Americans had a tendency to assign smaller sizes than their European counterparts. This is most notable for the three largest avalanches (avalanches in Fig. 3b, g and i), with a median size of 4 by Europeans and a median size of 3 by North Americans. With the exception of Fig. 3e and f, differences in size estimates were statistically significant (Wilcoxon rank-sum test: p ranging from 0.045 to <0.001). Within their continents, respondents had a similar agreement with each other (proportion test: p=1): on average, Pagree was 0.53 within Europe and 0.56 within North America, resulting in rel of 0.73 and 0.75, respectively. Intermediate sizes, which are more commonly used in North America, were chosen in 31 % of the cases by North Americans compared to 23 % by Europeans (proportion test: p=0.368). When using intermediate sizes, the agreement with the mode intermediate size smode.intermediate was 53 % for Europe (±0.5: 75 %) and 49% for North America (±0.5: 81 %).
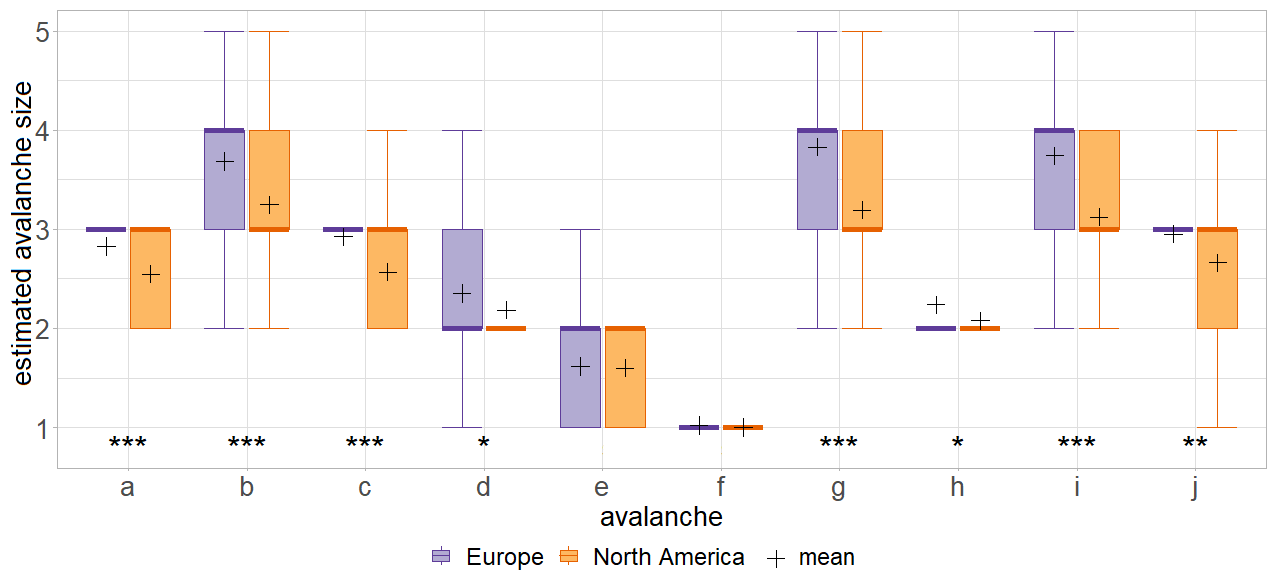
Figure 3Boxplots showing the size distributions for the 10 avalanches for Europe and North America. Mean values are indicated with +. Avalanches are labeled according to Fig. 2, and (a) and (c) depict the same avalanche. The results from the Wilcoxon rank-sum test indicate that the differences in avalanche size estimation between Europe and North America are significant for 8 out of the 10 avalanches (all except e and f; * (0.01, 0.05], (0.001, 0.01], ≤ 0.001).
Among the factors used to determine avalanche size (Table 1), runout was considered the most important with 56 % of respondents considering this factor as very important, followed by volume (very important: 39 %), dimensions (29 %) and destructive potential (20 %) (Fig. 4). Comparing responses from Europe and North America, we found the most frequent response to be identical for all four factors (very important for runout, important for the other three). However, runout was considered significantly less often as very important in Europe (46 %) compared to North America (72 %, proportion test: p=0.001). The factor volume showed a similar pattern with significantly more votes from North America (46 %) than Europe (18 %) for being very important (proportion test: p<0.001) and the opposite pattern for volume being either less important or not at all important (Europe: 39 %, North America: 7 %, proportion test: p<0.001). The differences between the continents for rating the importance of destructive potential and dimensions were not significant (proportion test with rating of very important: p=0.260 and p=0.718).
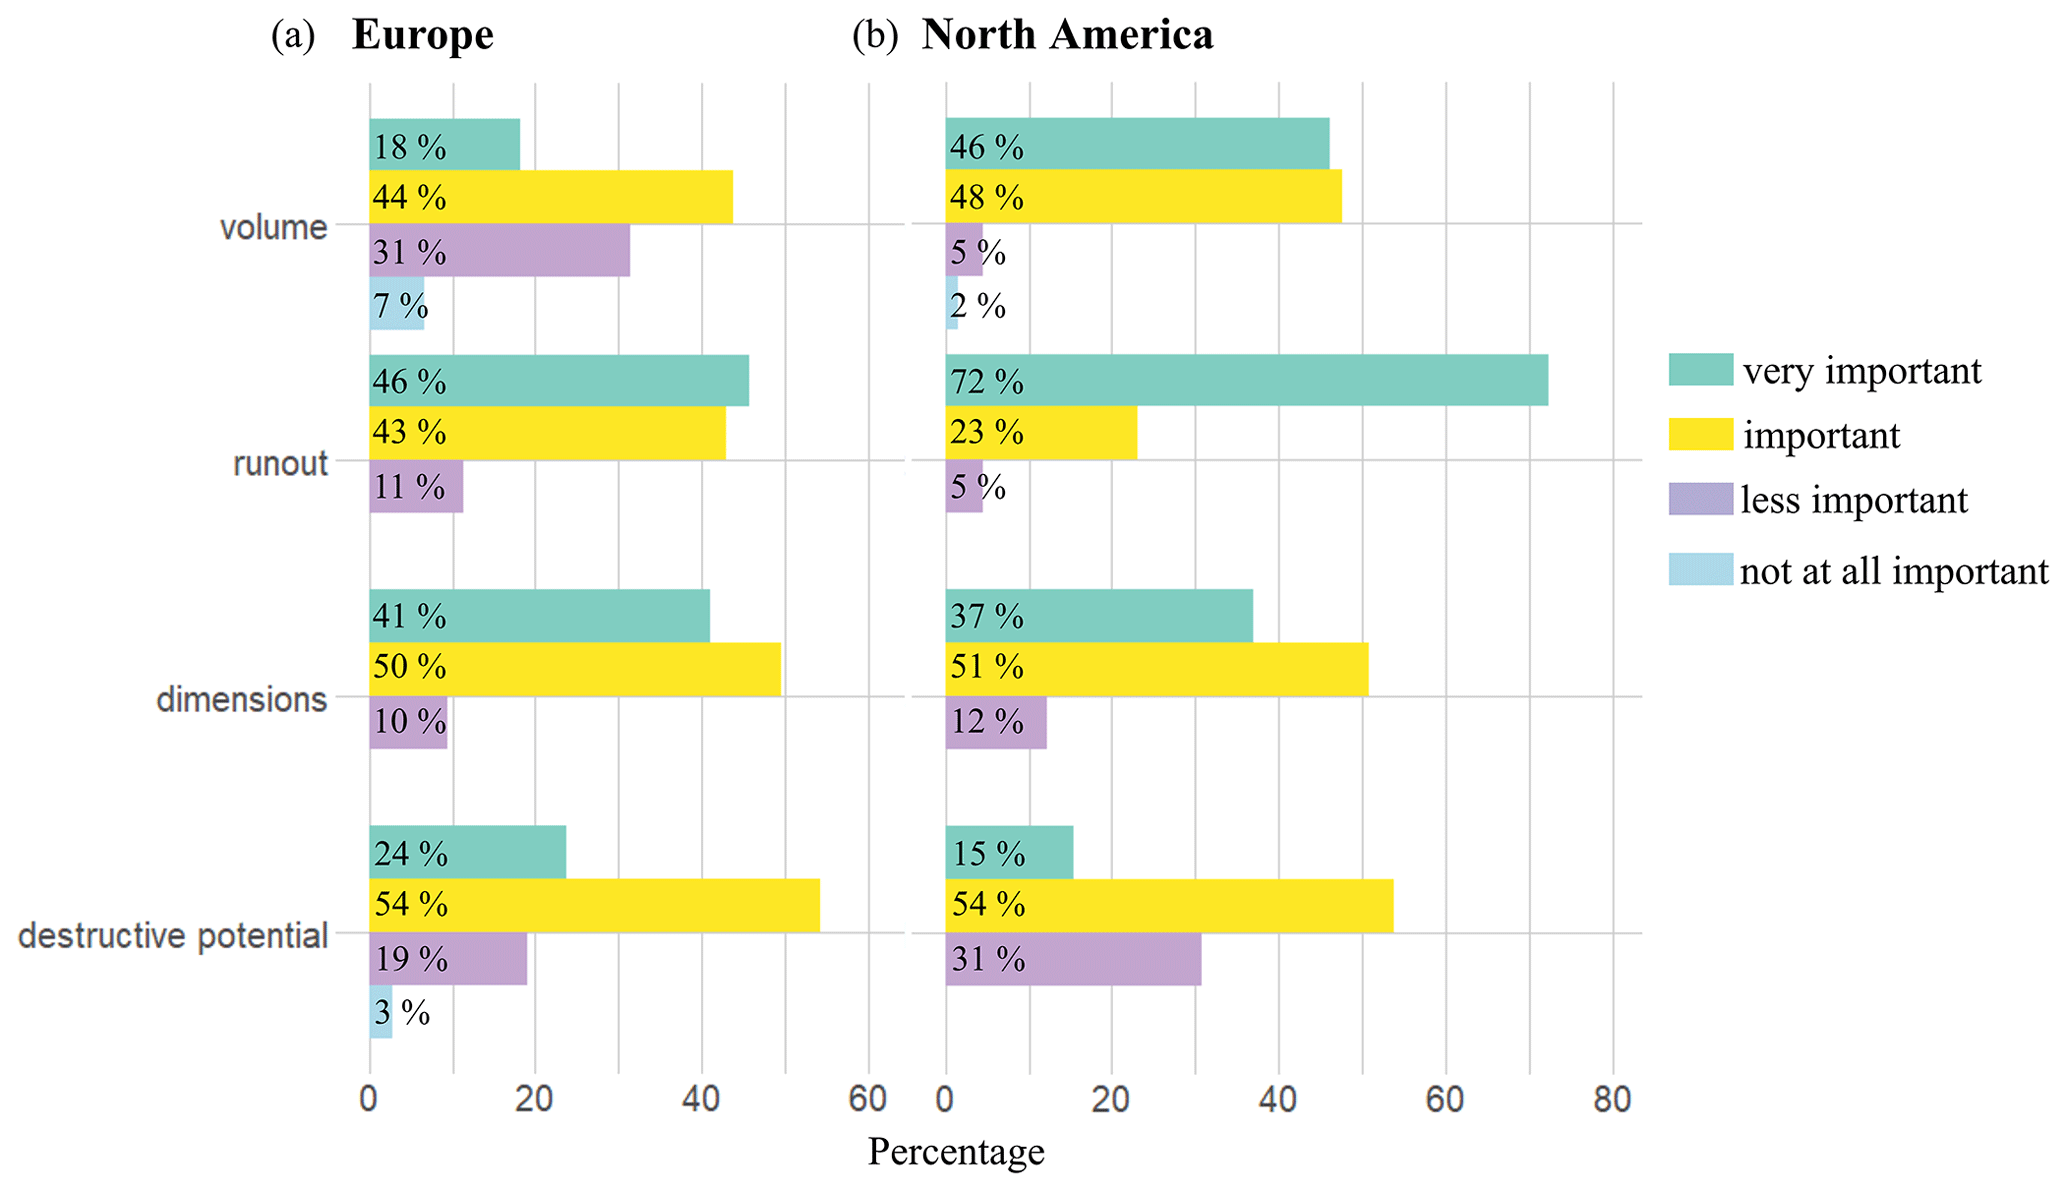
Figure 4Comparison of the importance ranking for the factors determining avalanche size for (a) Europe and (b) North America.
4.2 Avalanche mapping from oblique photographs (study 2)
The 10 participants, all very familiar with the study area, centered the avalanches based on oblique photographs around the corresponding reference mapping (Fig. 5), identifying the correct locations.
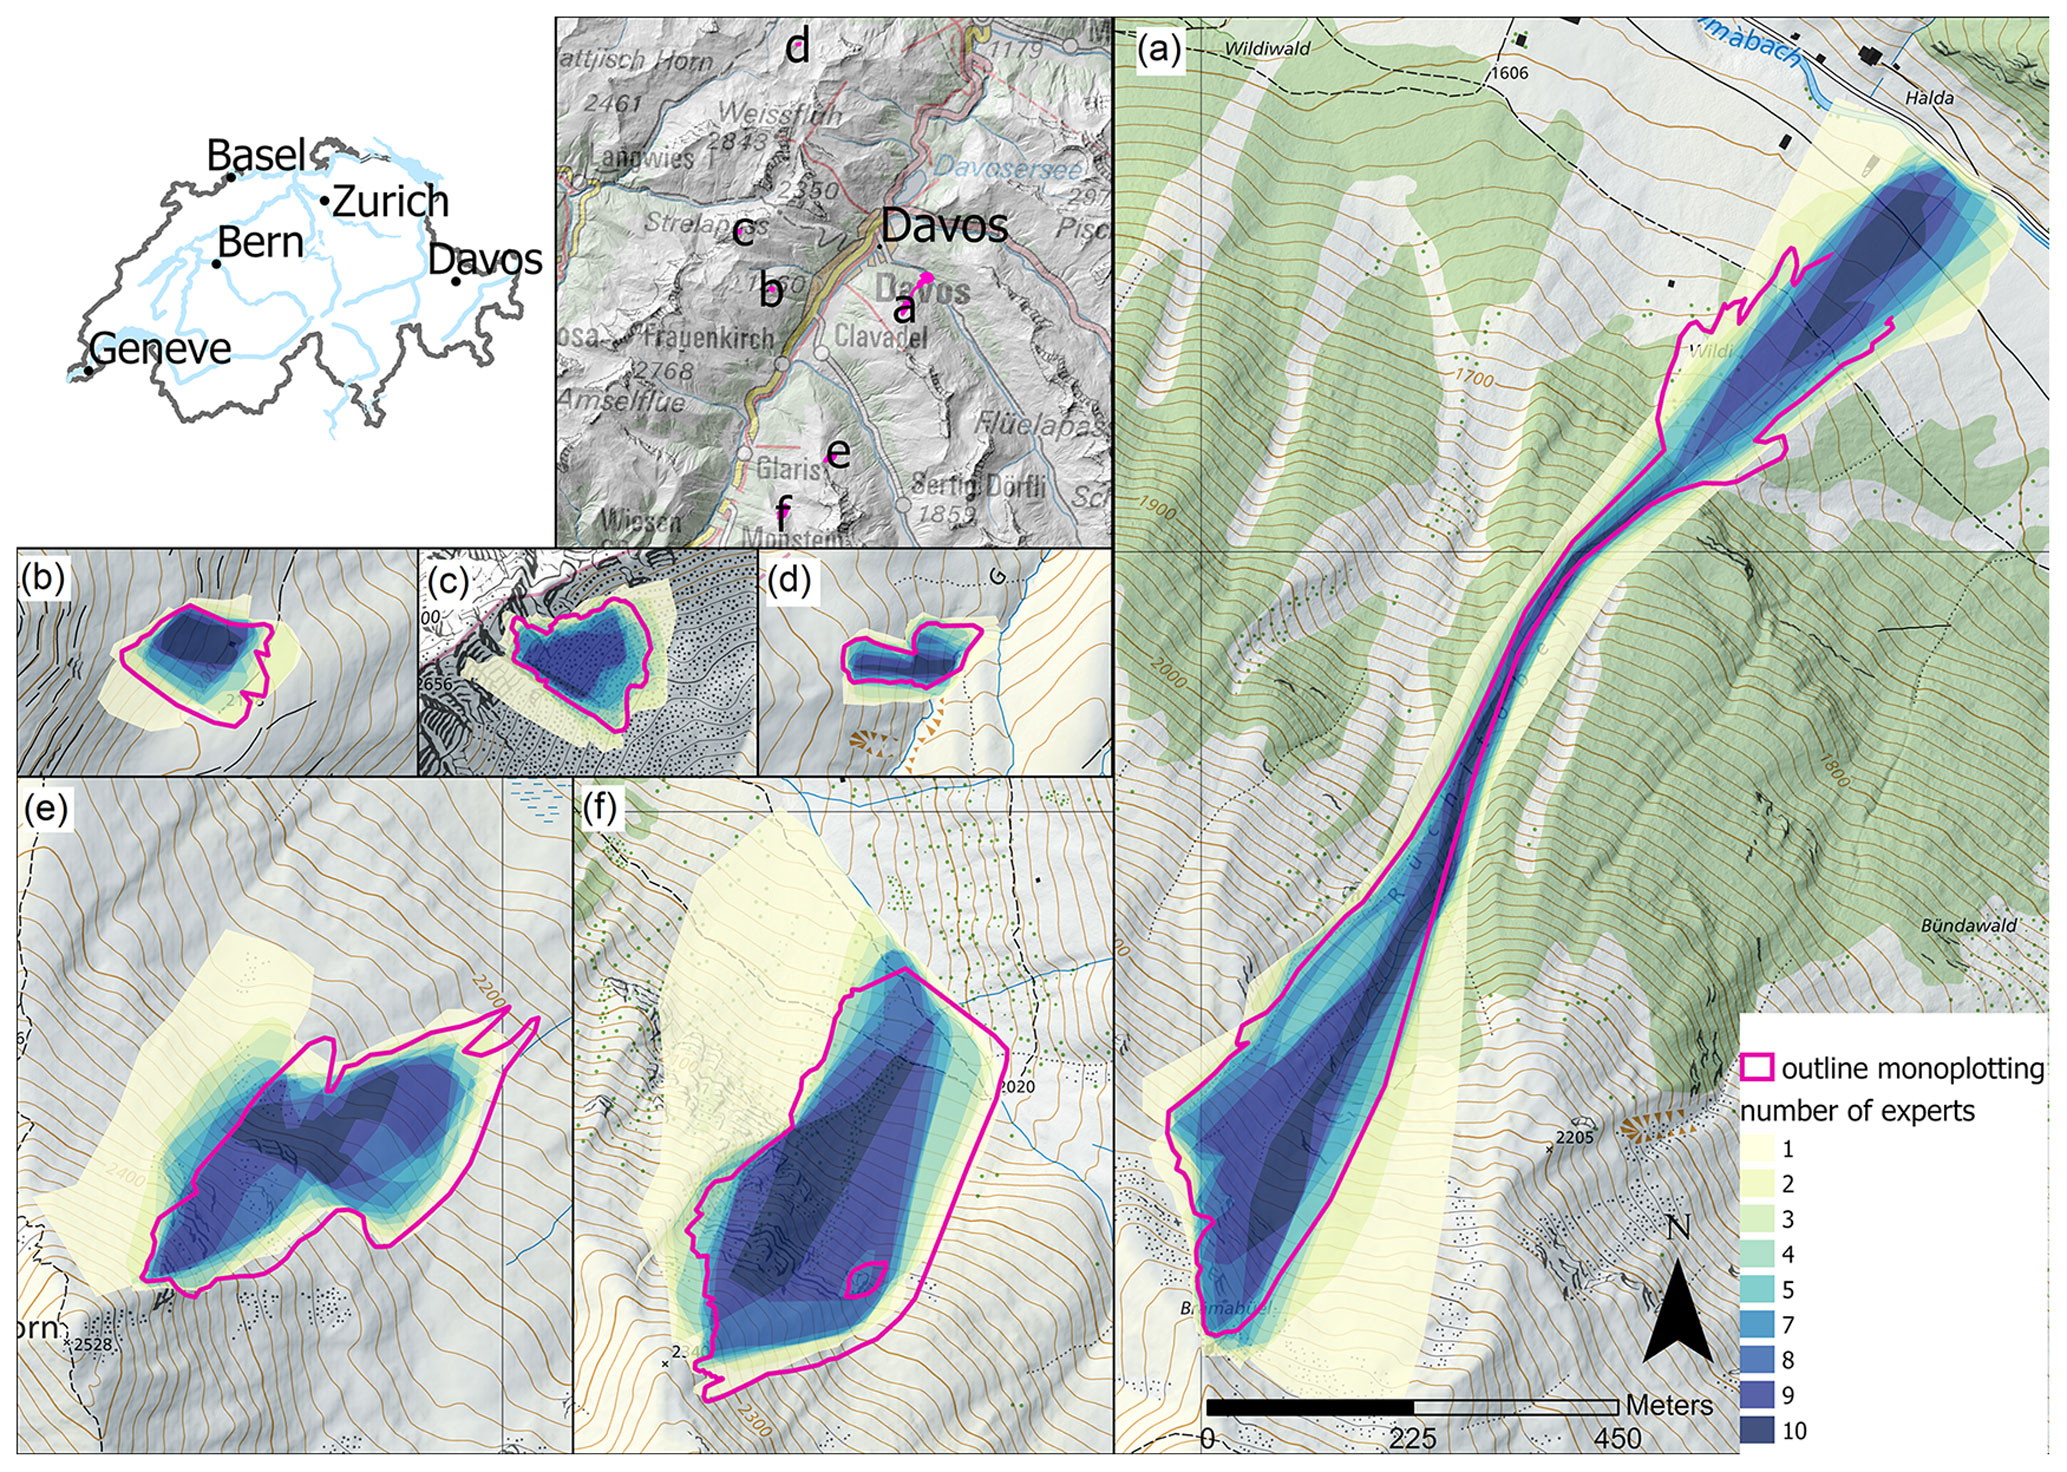
Figure 5Heat map illustrating expert agreement on avalanche area for the six avalanches mapped from oblique photographs. Dark blue indicates areas of very good agreement, identified as part of an avalanche by all 10 experts. For location and size comparison the outlines of the avalanches, mapped from the photographs georeferenced with the monoplotting tool by Bozzini et al. (2012, 2013), are shown as a reference in pink (for avalanche a the lower part was occluded by a tree; map source: Federal Office of Topography).
On average, the overlapping proportion of the mappings of any two participants of IoUpairwise was 0.52, varying from 0.32 for the worst pairwise agreement to 0.69 for the best one (Table 3). Individual pairwise comparisons are shown in Fig. A1 in the Appendix. When comparing individual mappings to the area mapped by at least one person as AoU, the mean IoUall is 0.31, ranging from 0.21 to 0.41. Only a fraction of 9 % of the combined area of union (AoU for all 10 participants) was identified by all participants as an avalanche (area of overlap for all 10 participants, AoO) showing the considerable scatter of individual mappings. Comparing individual mappings to the reference resulted in a mean IoUref of 0.60, with a minimum of 0.40 and a maximum of 0.80. These areas of higher agreement between participants, visible in darker hues in Fig. 5, coincide with the outlines from the reference mapping, highlighting that variations happened around the reference. In other words, individual mappings had a higher correspondence with the reference mapping compared to mappings by other individuals (see also Fig. A1 in the Appendix). The large variation between individual mappings was also shown when analyzing the absolute values of the mapped areas (Table 4): the largest mapped area was between 2 and 4 times larger than the smallest mapped area (avalanches in Fig. 5b and f). Additionally, the comparison with the reference showed a systematic tendency towards underestimation of the area, as in all cases the median mapped area was between 10 % and 36 % smaller than the reference area.
Table 3Intersection over union (IoU) for avalanches mapped from oblique photographs (study 2). Values represent the mean of six avalanches.
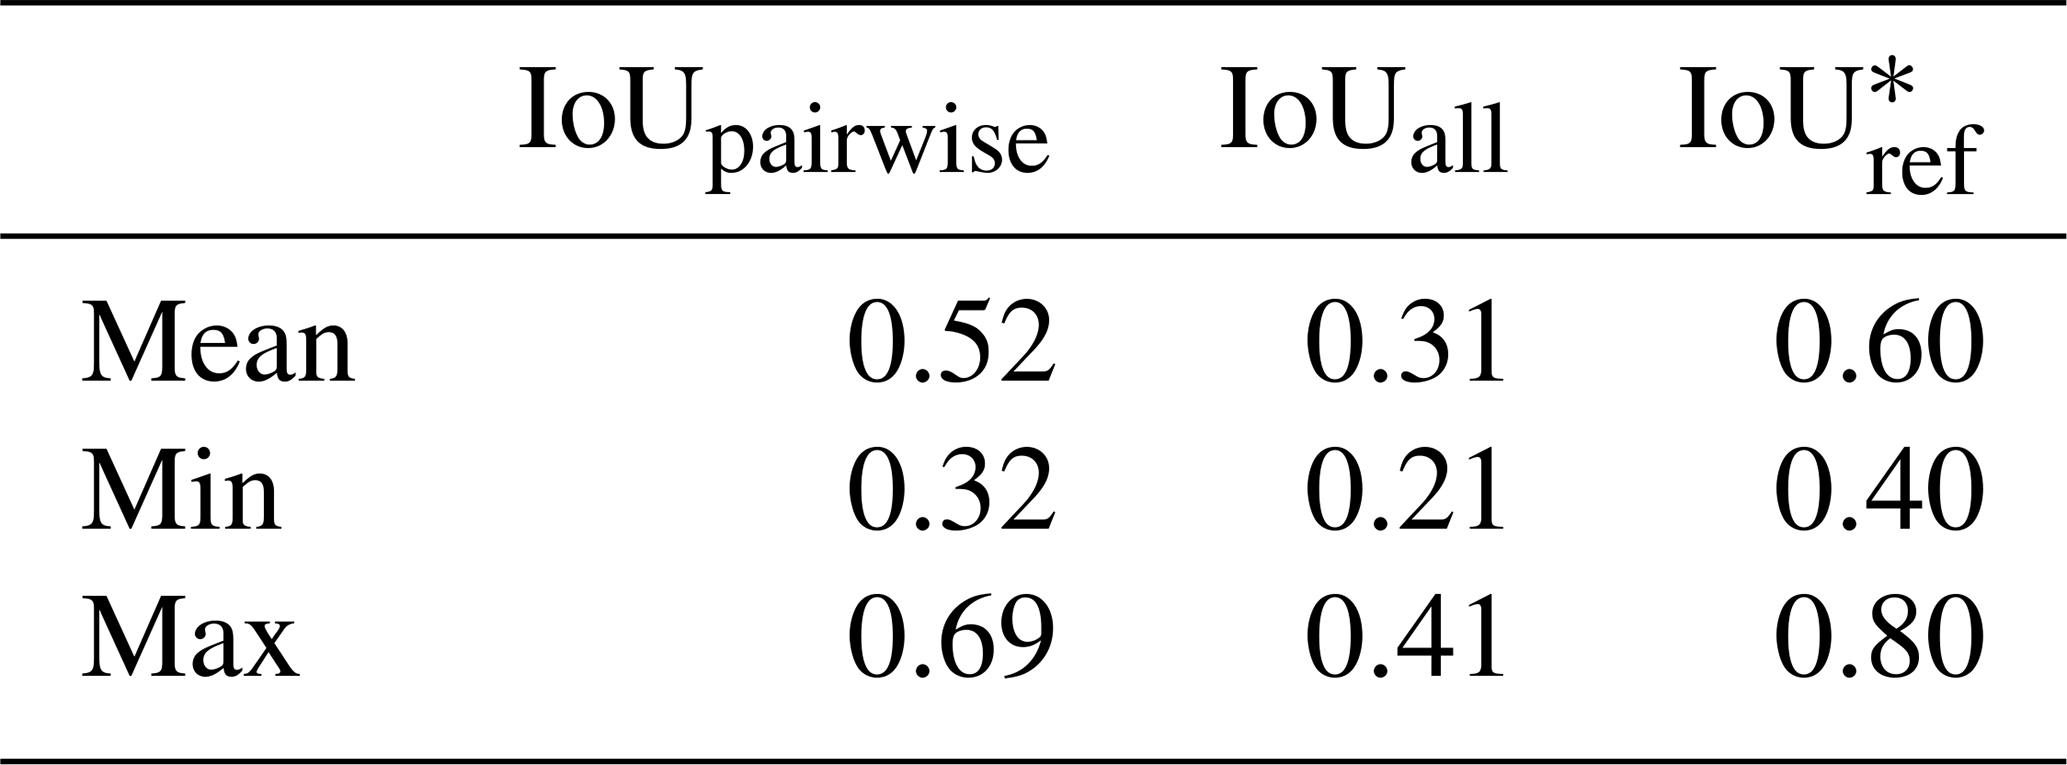
* Without deposit from Fig. 5a.
Table 4Avalanches mapped from oblique photographs (numbering corresponds to Fig. 5, study 2). Shown are the areas of the reference mapping and the respective median, minimum and maximum of the 10 individual mappings. The relative difference to the reference (in %) is indicated in parentheses.
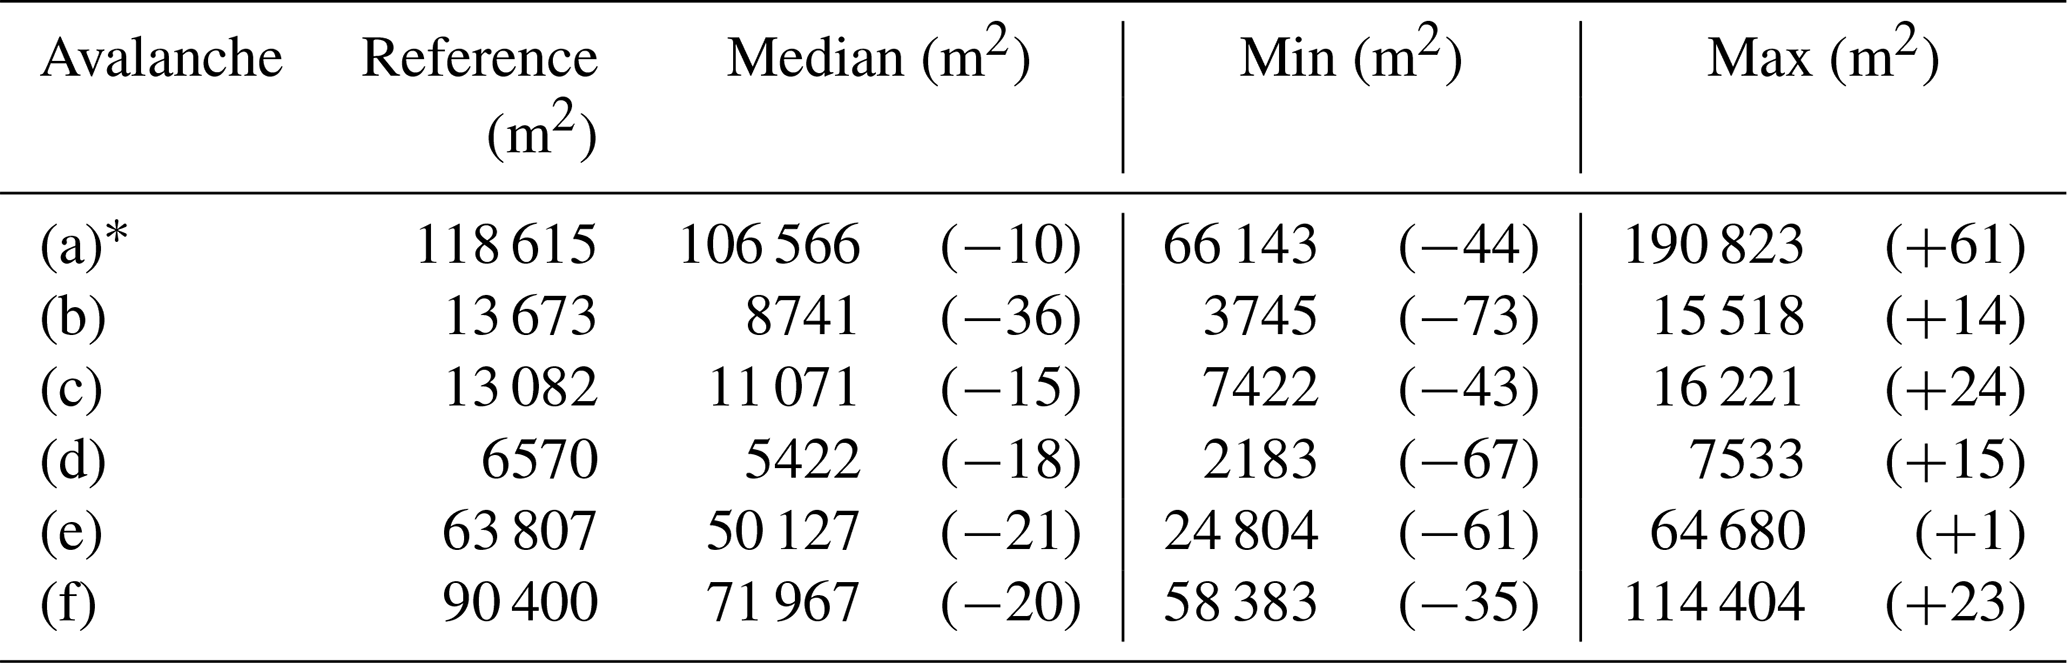
* Without the lower part of deposit.
Two of the raters had statistically lower pairwise overlap in their area of avalanche activity (mean IoUpairwise≤ 0.49) compared to the other eight raters (mean IoUpairwise≥ 0.69, Wilcoxon rank-sum test: p=0.011 and p=0.002; see Fig. A1 in the Appendix). These two raters also had the lowest agreement with the reference mapping (IoUref≤ 0.44), lower than the other eight (IoUref≥ 0.53).
4.3 Avalanche mapping from remotely sensed imagery (study 3)
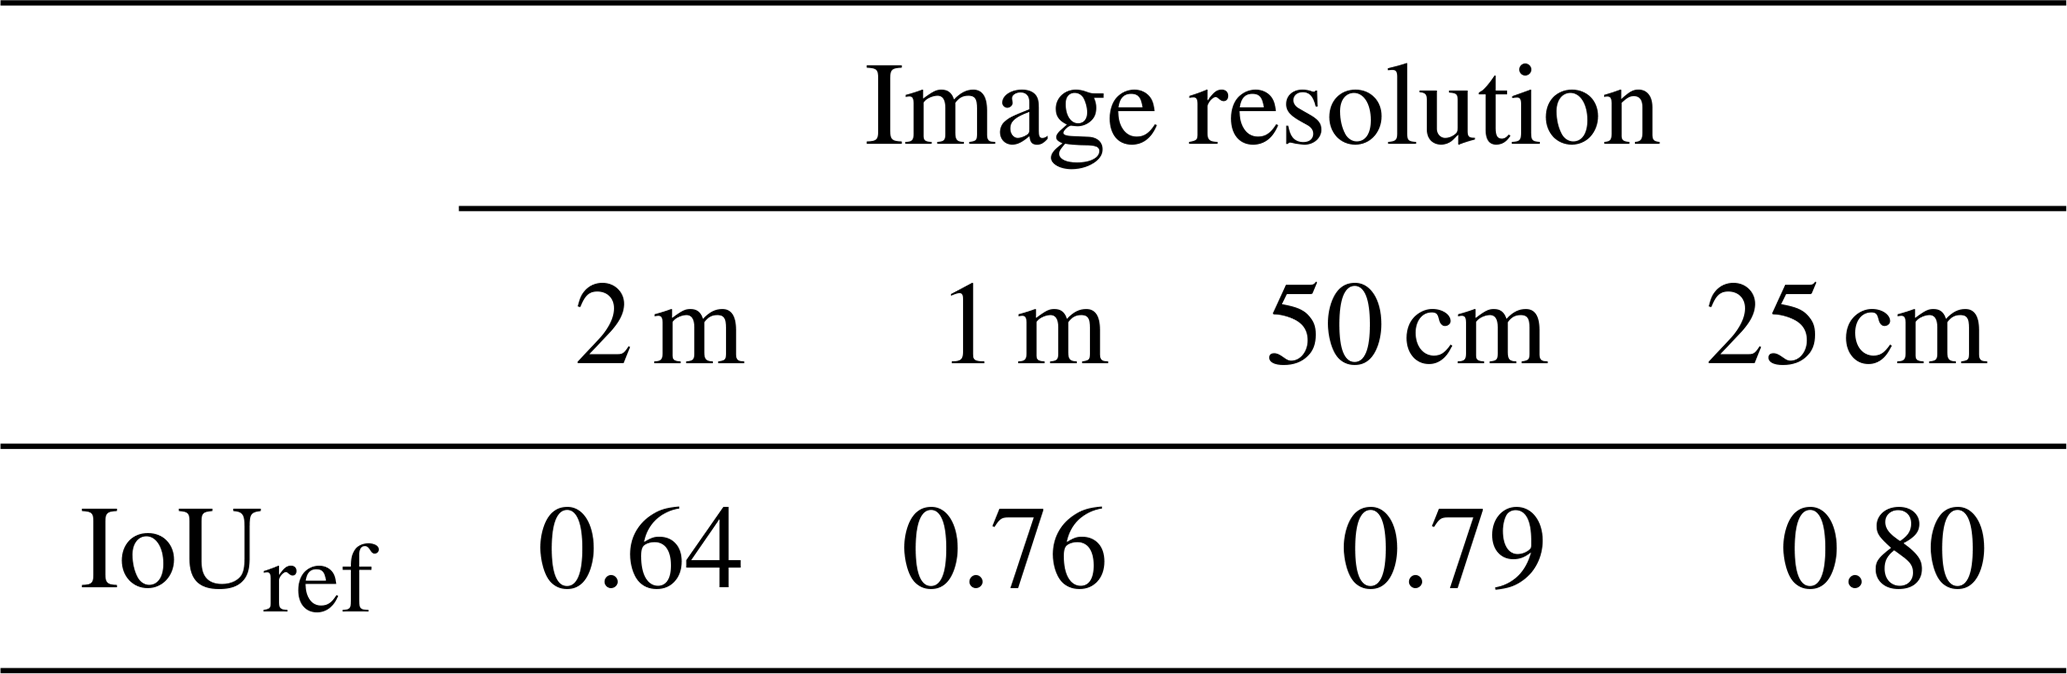
When visually comparing the mappings, differences can be observed not only between image resolutions (Fig. 6) but also between participants (Fig. 7). The mean of the pairwise overlapping proportion of avalanches of IoUpairwise increased with increasing image resolution from 0.46 at 2 m resolution to 0.68 at 25 cm resolution (Table 5). Considering the area classified as an avalanche by three or more raters as the reference showed an increase in IoUref from 0.64 at 2 m resolution to 0.80 at 25 cm resolution (Table 6). Regarding the influence of illumination conditions, all IoUpairwise scores were higher in illuminated areas compared to shaded areas of the image (for instance, at 25 cm resolution – illuminated: 0.77, shaded: 0.54; Table 5). Snow conditions also influenced the agreement of the mappings (Figs. 6 and 7): the mean IoUpairwise was higher in wet-snow conditions (25 cm resolution: 0.90) compared to dry-snow conditions (25 cm resolution: 0.66; Table 5). Moreover, individual mappings were also much more similar in wet-snow conditions compared to dry-snow conditions with the variations in IoUpairwise ranging for dry-snow conditions at 25 cm resolution between 0.56 and 0.77 (mean: 0.66; standard deviation: 0.07) and for wet-snow conditions between 0.88 and 0.91 (mean: 0.9; standard deviation: 0.01; Fig. 8d). Overall, variations in mean IoUpairwise were smaller across resolutions (0.02 to 0.22) than the differences between the minimum and maximum IoUpairwise within one resolution (0.20 for 25 cm resolution to 0.43 for 2 m resolution). This is especially pronounced for dry-snow conditions (Fig. 8). The large variations between different experts are also reflected in the avalanche area that was consistently identified by one person over all four spatial resolutions (dark red in Fig. 7).
Table 5Mean IoUpairwise for different subsets and spatial resolutions.
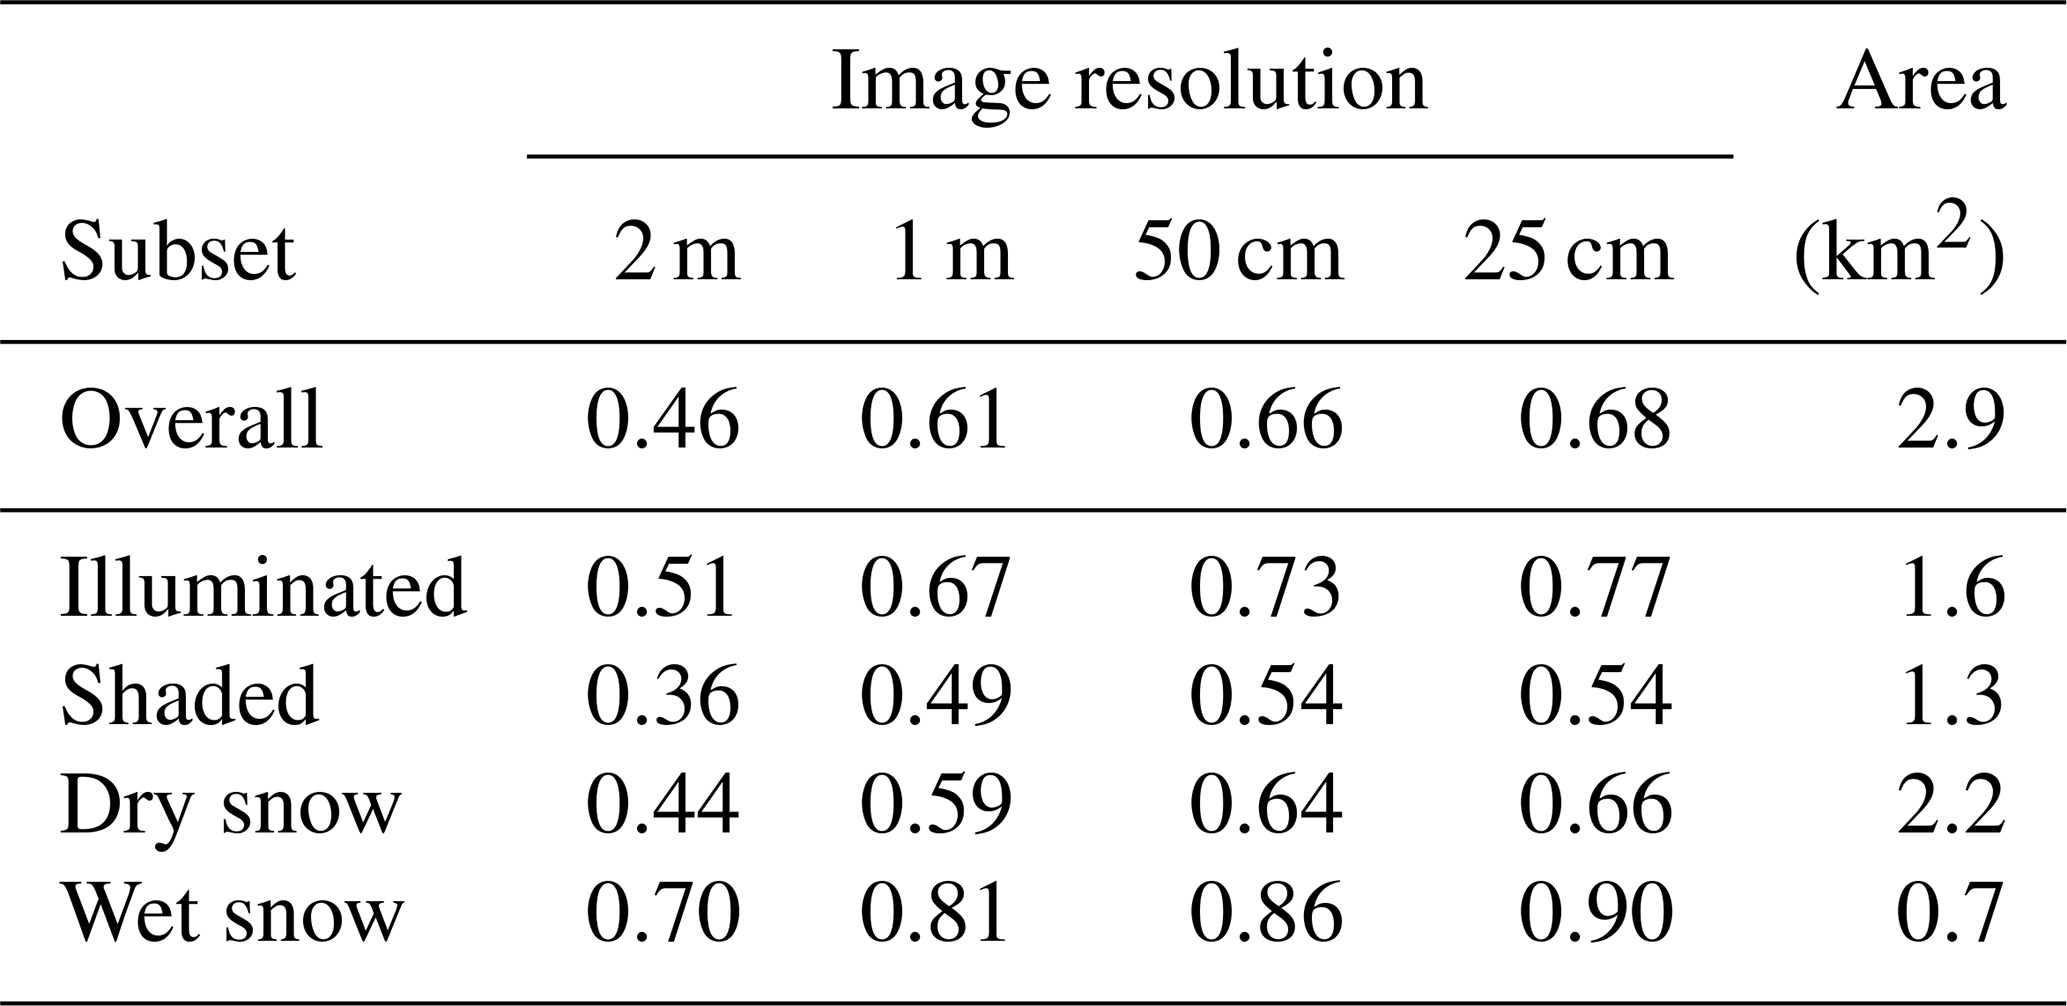
.
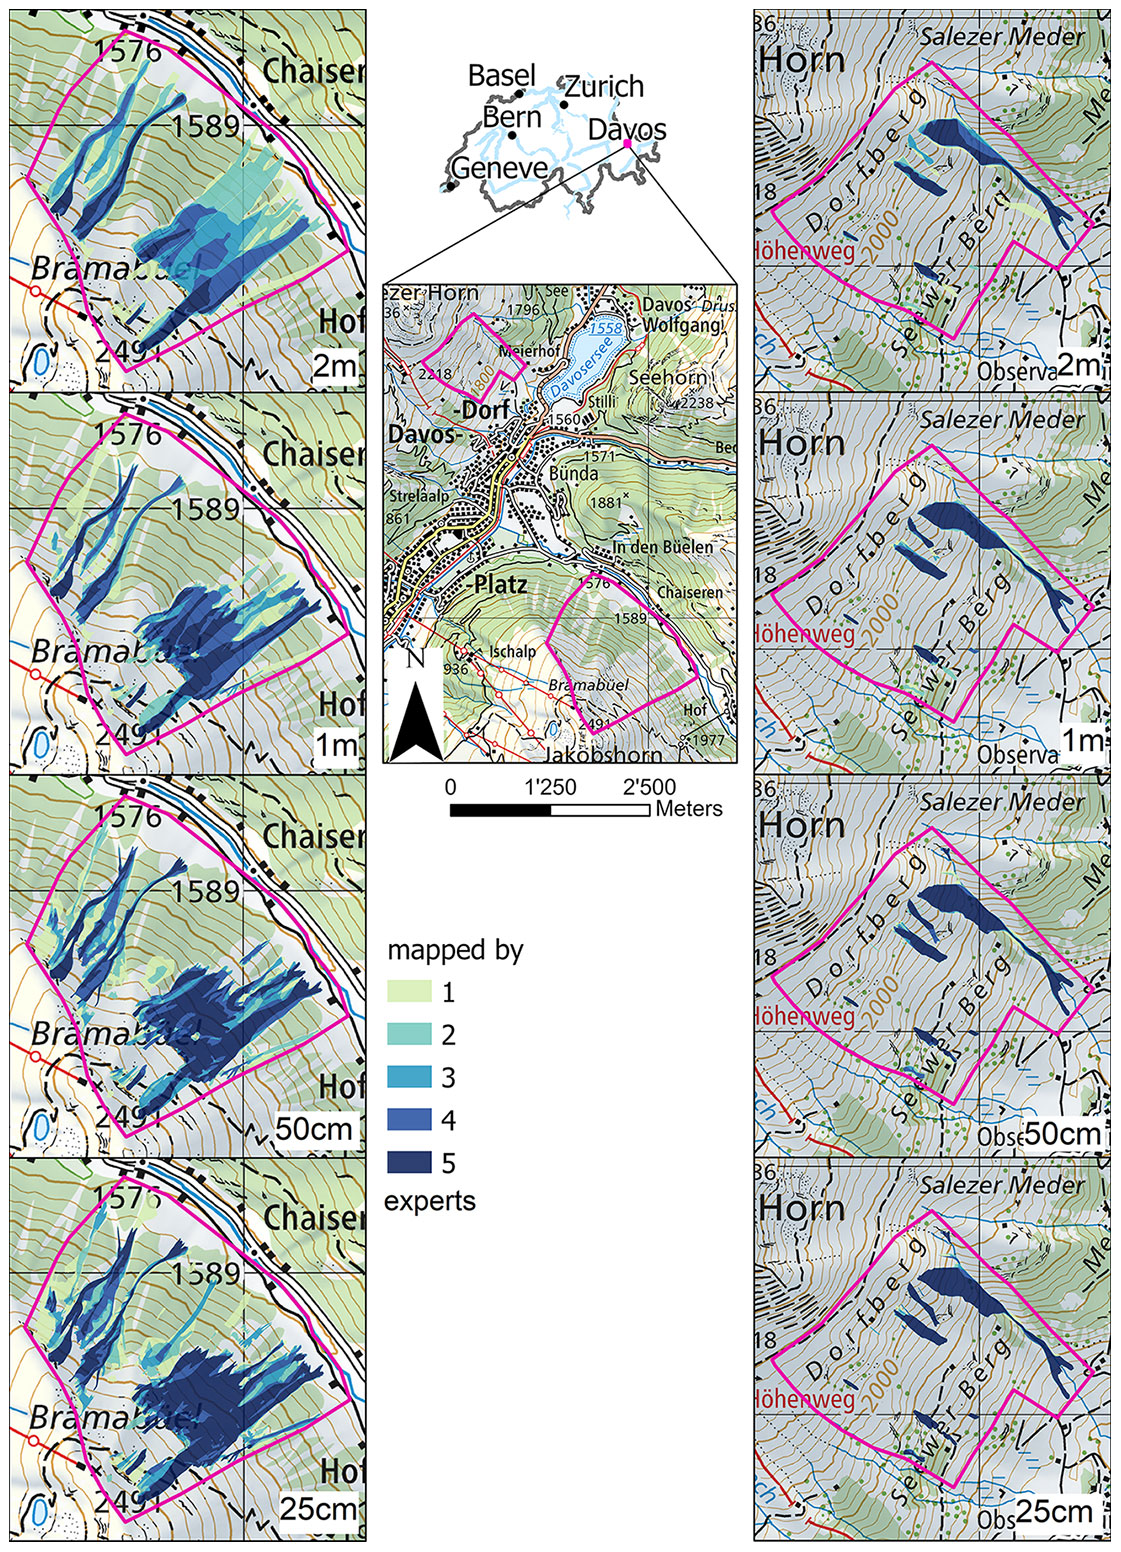
Figure 6Heat map illustrating expert agreement on the avalanche area mapped from remotely sensed imagery for four spatial resolutions (2 m to 25 cm, rows, from top to bottom) for the example dry-snow conditions (left column) and wet-snow conditions (right column). The darker the hue, the greater the agreement of the five experts on the existence of an avalanche in that particular location (map source: Federal Office of Topography).
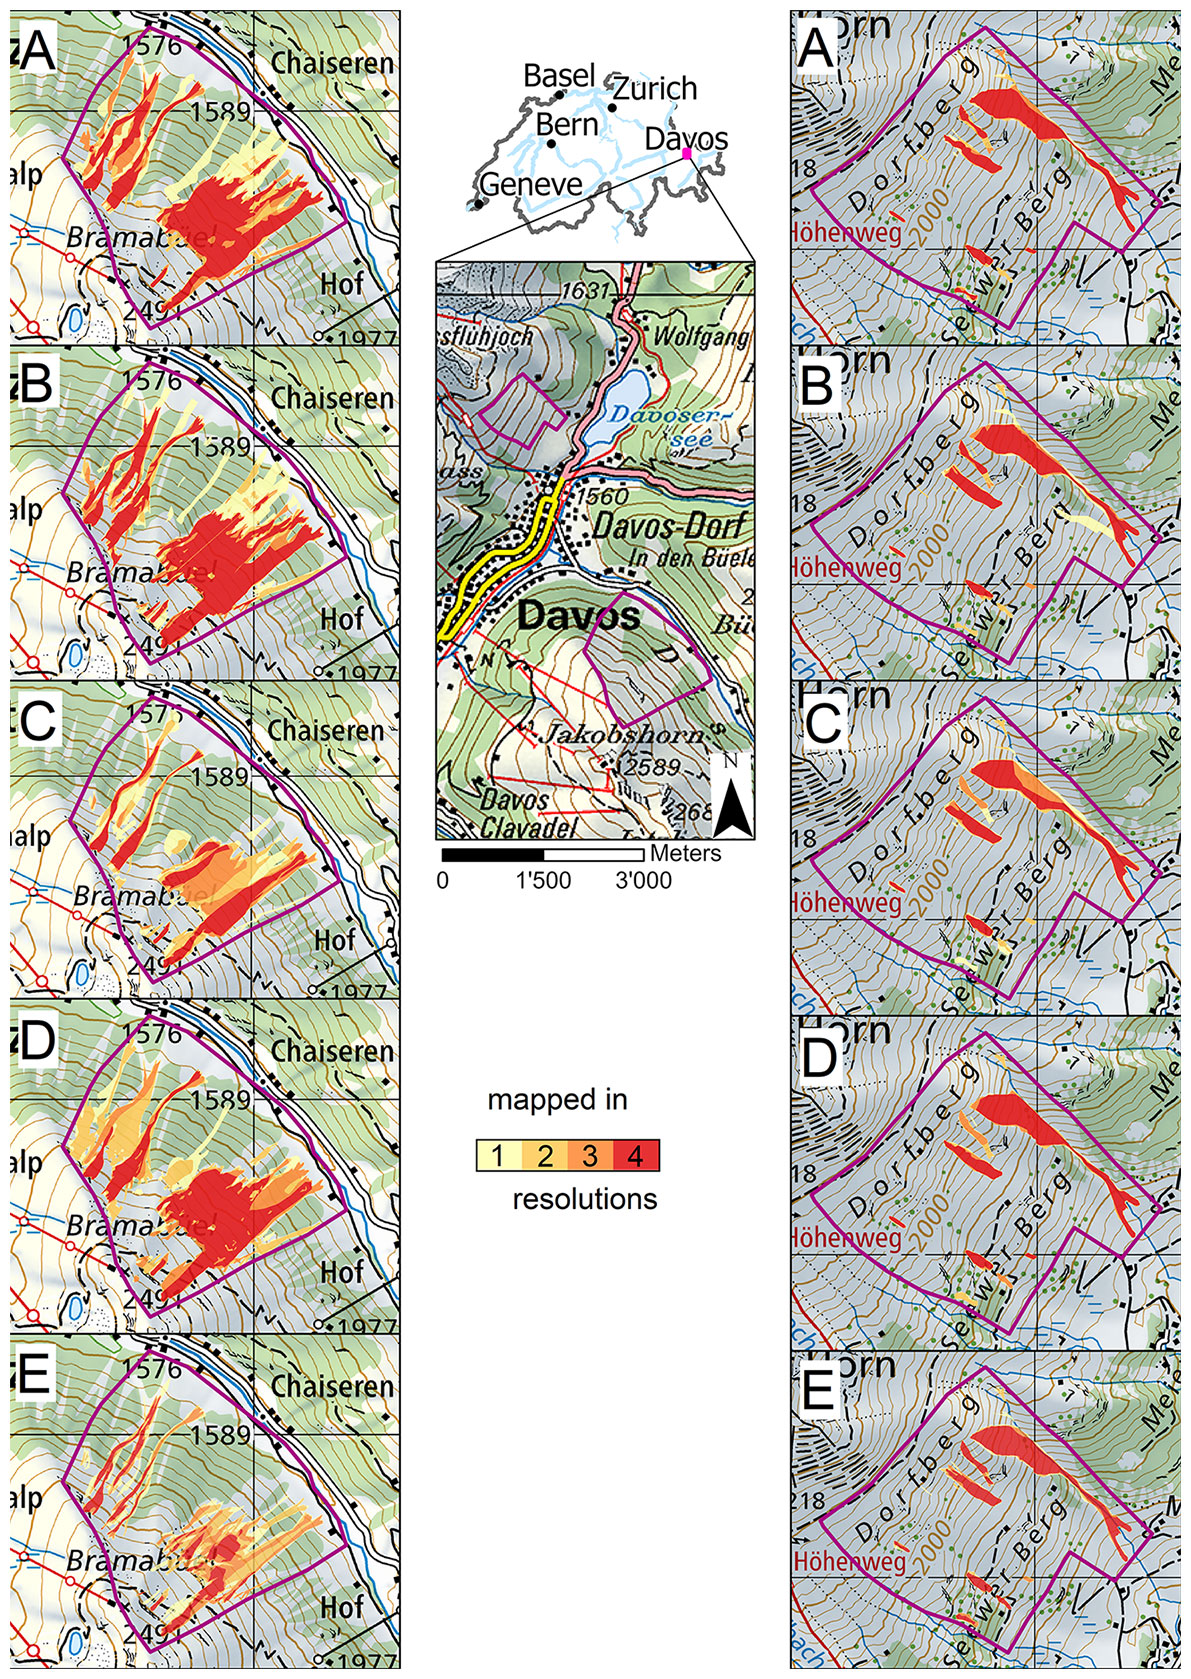
Figure 7Heat map showing differences in the avalanche mappings for participants A to E (rows, from top to bottom), as a function of the four resolutions for the example dry-snow conditions (left column) and wet-snow conditions (right column). Dark hues (red) indicate areas where an avalanche was detected in all four resolutions; light hues indicate areas where an avalanche was detected in only one resolution (map source: Federal Office of Topography).
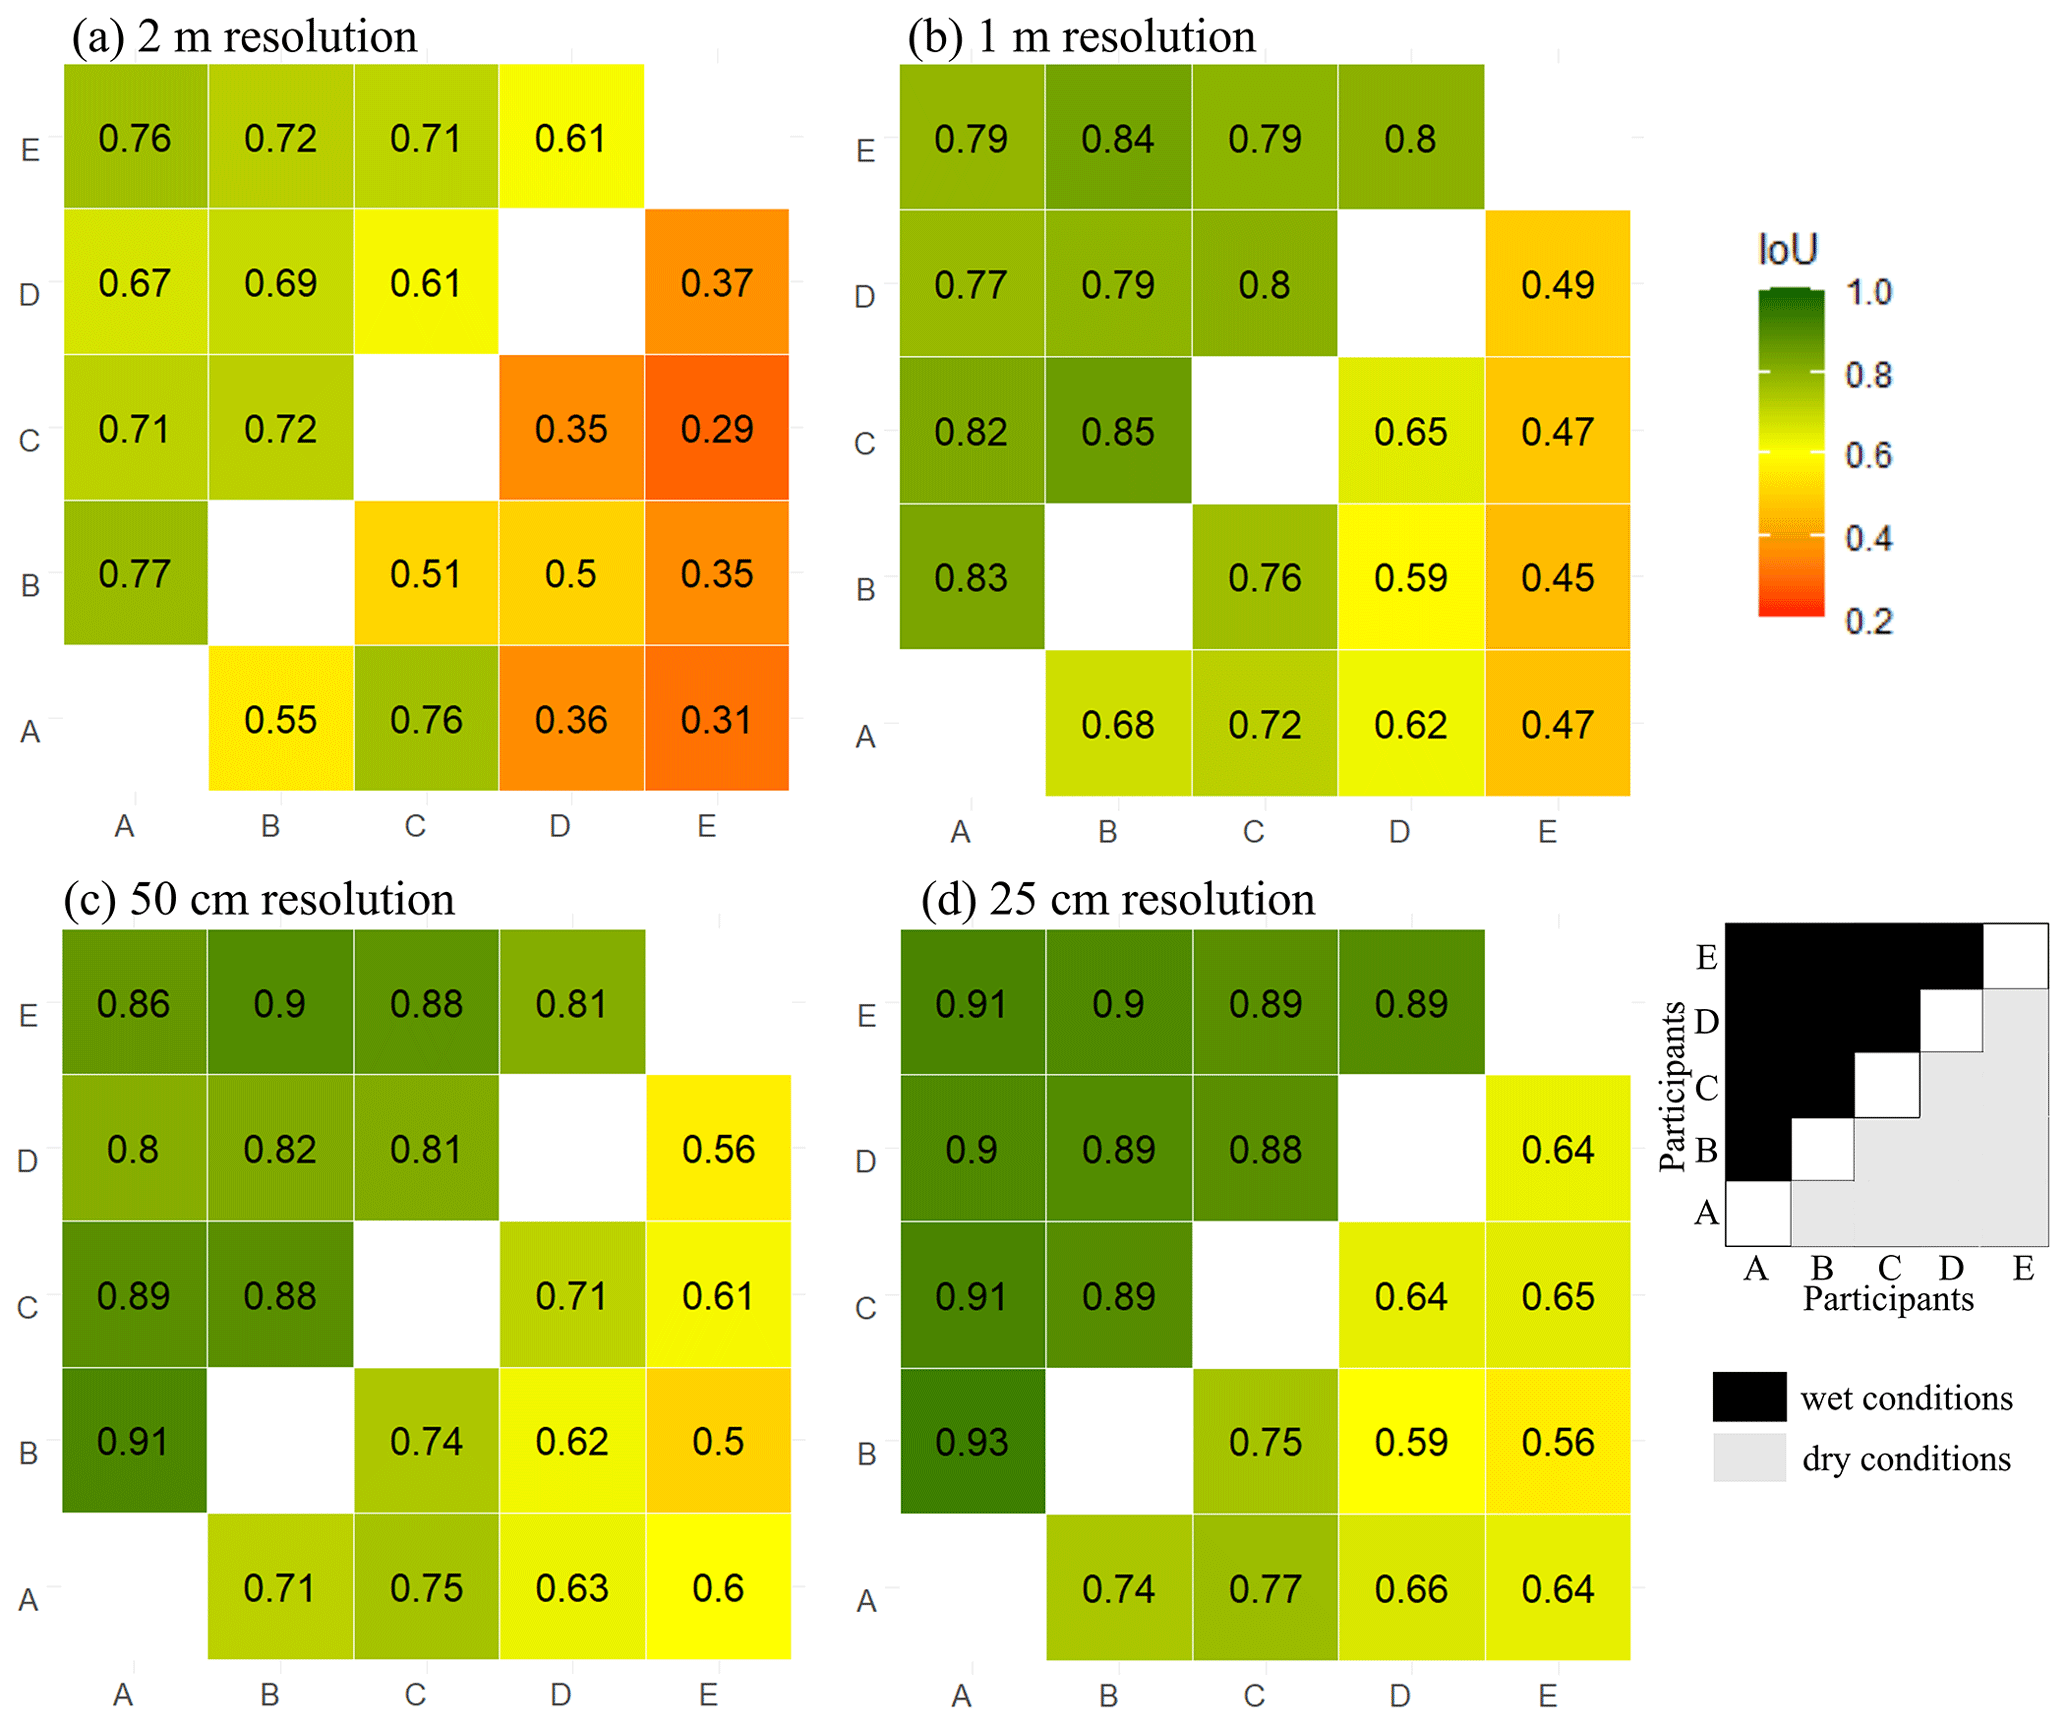
Figure 8IoUpairwise for dry- (below diagonal) and wet-snow conditions (above diagonal). The letters A to E represent the different participants; the four tiles (a–d) represent the four resolutions.
One of the five participants had a lower pairwise agreement compared to the other four (for instance at 2 m resolution: IoUpairwise≤ 0.41 vs. IoUpairwise of 0.37–0.76), although this was not significant (Wilcoxon rank-sum test: 2 m resolution of p=0.088, 25 cm resolution of p=0.055). Considering the area classified as avalanche by three or more raters as the best approximation of a ground truth, the mean agreement with this mapping ranged between IoUref=0.64 and IoUref=0.80 (Table 6). Again the same participant had the lowest mean agreement.
We explored the reliability of estimates of avalanche size and detecting the outline of avalanches from images. The key findings are as follows.
-
The agreement rate Pagree between any two size estimates was 0.53, resulting in a reliability rel of 0.72, while the agreement with the avalanche size considered correct was 0.74, with the most frequently chosen size of 0.66 (mode).
-
Significant differences were observed between Europe and North America, both for rating avalanche size and for weighing the factors determining avalanche size.
-
The mean overlapping proportion of any two avalanche mappings of IoUpairwise was 0.52 (study 2) and between 0.46 and 0.68 (study 3) and thus lower than the mean agreement with the reference of IoUref, which was 0.60 (study 2) and between 0.64 and 0.8 (study 3).
In the following, we discuss these results by considering definitions, the conclusiveness of the data for the task at hand and the competence of participants. Finally, we provide recommendations for practice.
5.1 Avalanche size estimation
Our results show that it is difficult to achieve consistent size estimates of avalanches: in only 53 % of the cases did any two size estimates agree, and in 66 % of the cases an individual estimate agreed with the most frequent size among the respondents (mode). It showed, however, that in most cases disagreements were comparably small with 92 % of individual estimates being either equal to the mode smode or equal to the second-most frequent neighboring size or, if considering intermediate sizes, that 74 % of the estimates were within one intermediate size class. Comparing our results to previous studies investigating agreement for avalanche size estimates (Table 7), the agreement rate with the most frequent size ranged from 62 % (Moner et al., 2013) to 84 % (Hafner et al., 2021). The high agreement rates in Jamieson et al. (2014) and Hafner et al. (2021) are probably related to the fact that these studies relied on a small number of experienced practitioners with a comparably similar background and training. In contrast, both the studies by Moner et al. (2013) and our study included participants from numerous countries and thus respondents with different avalanche backgrounds, leading to a more diverse group of avalanche practitioners. Moreover, Moner et al. (2013) speculated that the changes introduced in the avalanche size definitions shortly before their survey may have lowered the agreement. The reliability of an individual size estimate in this study was 0.73, highlighting the uncertainty associated with these data. Thus, using size estimates by an individual as ground truth when developing or evaluating models, a perfect model can achieve more than 73 % accuracy only by chance if the errors a model makes are independent from the errors contained in the avalanche size labels.
Moner et al. (2013)Jamieson et al. (2014)Hafner et al. (2021)Table 7Comparing the agreement in the mode for avalanche size estimates with previous studies.
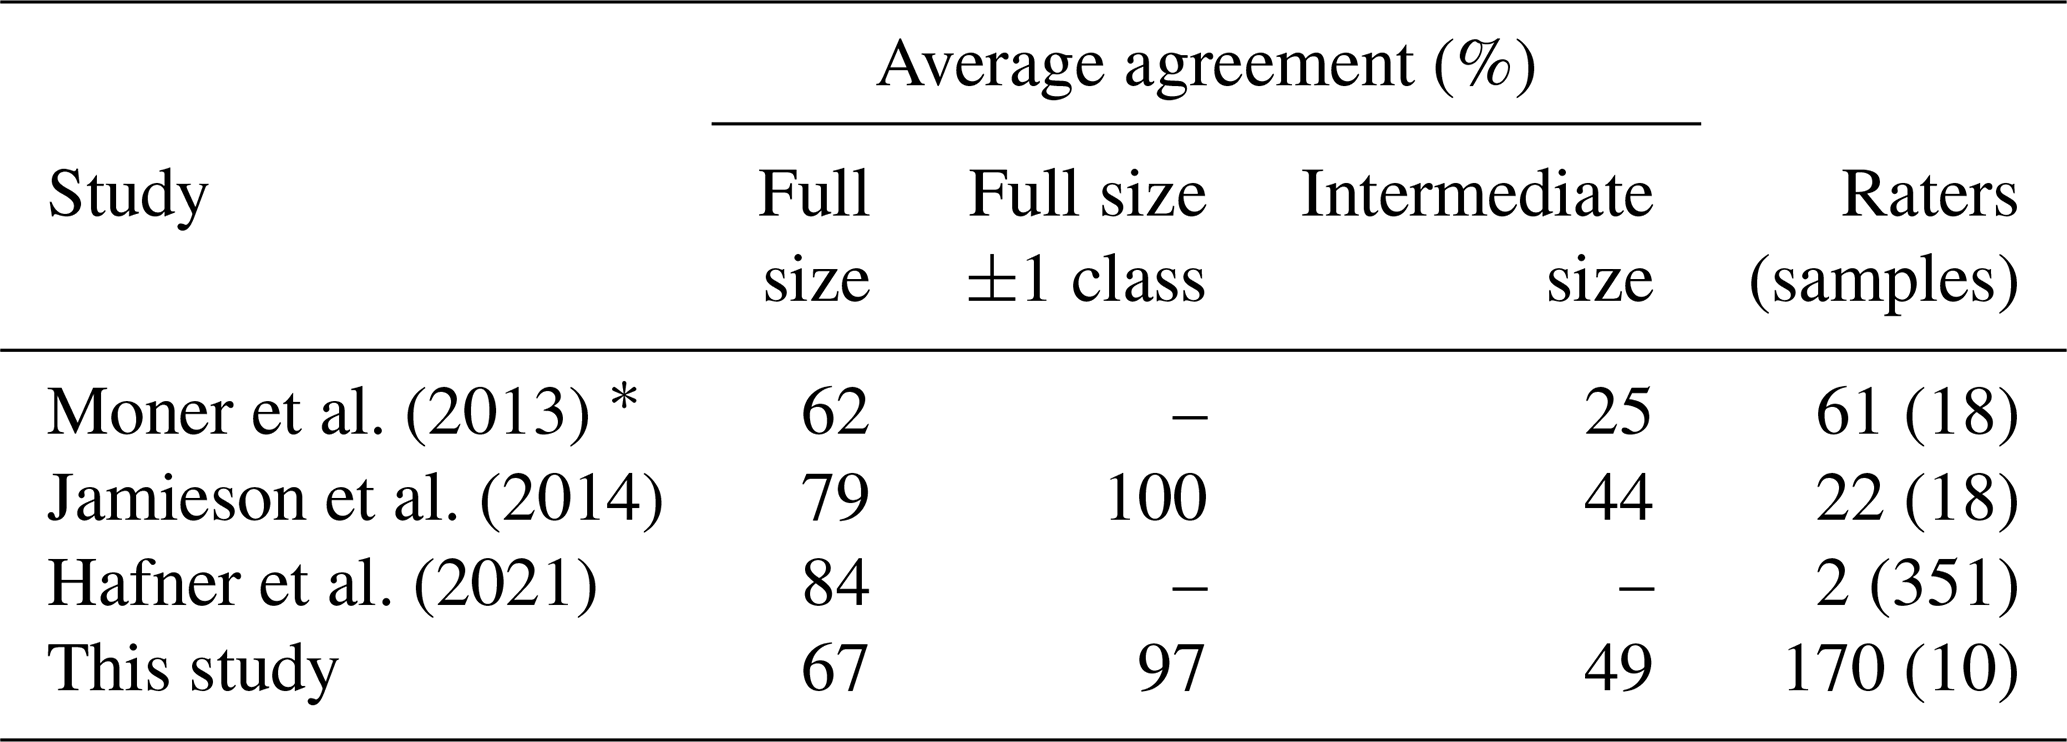
* European forecasters only; for the Canadian ones, see Jamieson et al. (2014).
In our survey, we found the lowest agreement with smode for the three largest avalanches () (avalanches in Fig. 2b, g and i). For these three avalanches, smode differed between Europe and North America. Jamieson et al. (2014) argued that practitioners have more experience with smaller avalanches (sizes 1, 2 and 3), which are much more frequent than larger avalanches, which may cause size estimates of large avalanches to be more variable and less accurate.
We noted systematic differences between size estimates provided by North Americans and by Europeans, with North Americans tending towards smaller sizes (Fig. 3). This might stem from differences in the European and the North American definitions (see Fig. 3): for the typical length the European definition provides a range, whereas in the North American definition a typical value is given. The European definition encompasses the North American values, describing typical length for the smaller avalanches, while it coincides with the upper bound for size 4 and provides only a minimum value for size 5. Another difference is that the North American definition includes typical mass, in line with the definition introduced by McClung and Schaerer (1980), while in Europe typical volume is defined. Combining deposit volume with density measurements or density estimates of the deposit, mass may be determined (mass = volume × density). For instance, calculating the mass of avalanches assuming a mean density of 390 kg m−3, measured from 95 avalanches at Rogers Pass, British Columbia (McClung and Schaerer, 1985), avalanches are almost 4 times larger in the European compared to the North American definition; 4 times larger corresponds approximately to a half size (e.g., for size 2 the mass according to the definition is 102=100 t; for size 2.5, it is 102.5=316 t). Consequently, the significant intercontinental differences may be, at least partially, attributed to the differing size class definitions.
We also observed differences in the importance ranking assigned to the factors determining avalanche size, with both the criteria runout and volume being considered more relevant for size estimation by North Americans compared to Europeans. This is particularly noteworthy as neither a description of runout nor an indication of volume are part of the North American size definitions (Table 1). We found the size-determining factor of destructive potential to be considered the least important by North Americans and the second-least important by Europeans. This is surprising as both the definitions in Europe and North America state that avalanche size is classified according to destructive potential (e.g., EAWS, 2023; CAA, 2023). Furthermore, this finding is also contradictory to that in the study by Moner et al. (2013), where destructive potential was the highest-rated factor. One possible reason for the low importance of destructive potential in our study might be related to the study design, where supplementary information about damage to property or people, beyond the photographs, was absent. Thus, destructive potential had to be inferred from avalanche properties like width, length and volume, which is arguably the normal situation when estimating avalanche size.
To find out if the way an avalanche is shown in an image influences size estimations, we included one avalanche twice, changing the perspective and zoom. Even though 78 % rated the avalanche in Fig. 2a and c the same, we observed a significant proportion of larger estimates in the close-up view. We suspect that this might be caused by the perception of the avalanche being larger when covering more area in the photograph. But our sample is small, and understanding the effect of perspective and area covered by avalanche would require further investigations with a more meaningful sample.
5.2 Avalanche mapping from oblique photographs (study 2) and from remotely sensed imagery (study 3)
Study 2 required participants to first find the location of the avalanche on the map, matching the topography visible in the images with the topography as shown on the map, before mapping was possible. The 10 experts, all very familiar with the study area, located the avalanches in the same place. This first step of the assignment would have been more difficult for someone that did not know the area well, possibly resulting in entirely different locations and hence mappings. Thus, the mean overlapping proportion of any two mappings (IoUpairwise), which was 0.52 in our study, may potentially be 0 if an avalanche is located in the wrong place. We therefore assume that an IoUpairwise of 0.52 may well describe the upper limit of agreement in mappings from oblique photographs.
Study 2 allowed for a comparison with a reference mapping using a methodology superior to the approach the 10 experts used. Thus, the agreement between experts' mapping and the reference mapping can be interpreted as the proportion correct and, hence, allows for assessing the experts' competence in mapping avalanche outlines. The overall proportion considered correct (IoUref) was 0.6, with a clear bias towards smaller mapped areas compared to the reference. The results showed that experts were not equally competent, with the proportion correct ranging from 0.4 to 0.8 (Table 4). The agreement between individual mappings and the reference mapping is larger than the agreement in the mappings between participants (IoUpairwise=0.52). This means that the reliability of individual mappings would be underestimated when relying on a measure like the agreement rate between domain experts. If competence is known, it would be possible to weigh individual mappings if two or more mappings were available, likely resulting in more reliable results. Overall, we consider the mapping of avalanches using oblique photographs a challenging task to perform consistently and accurately.
In study 3, five participants had to identify the avalanches in the remotely sensed imagery, for each of four image resolutions, before mapping them. In other words, whether a point is identified as an avalanche is a combination of existential and extensional uncertainty (Molenaar, 1998), addressing the following questions: is there an avalanche, and where are the boundaries? This uncertainty was lower with higher image resolution, and for illuminated compared to shaded parts of the image, it allowed participants to identify avalanche area more consistently and confirmed the findings of earlier work (Hafner et al., 2022). Moreover, snow conditions influenced agreement too, with higher agreement under wet-snow compared to dry-snow conditions (Fig. 8). We suspect that this difference is caused by the presence of liquid water in the case of a wet snowpack, which leads to more pronounced avalanche boundaries compared to dry-snow conditions.
Another important finding from these studies are the large differences in the areas mapped as an avalanche by the experts. For the six avalanches in study 2, the largest mapped area was between 2 and 4 times larger than the smallest mapped area (Table 5). For study 3, variations across resolutions were found to be smaller than the variations in IoUpairwise per resolution, suggesting individual experience and competence have a larger impact than the underlying spatial resolution. If avalanches would be classified automatically using area or by extracting width and length from the mapping (e.g., Schweizer et al., 2020), completely different size classes may result due to these variations. For instance, comparing the mappings of 4000 avalanches with the reported size estimate, Völk (2020) showed that the median area of size-2 avalanches was about 3 to 5 times larger than size-1 avalanches or that the mapped area of size-4 avalanches was about 7 times larger compared to size-3 avalanches (Völk, 2020, pp. 49 and 51). Comparing these values to the variation observed in the mappings by different experts in our study suggests that estimating avalanche size based on mapped area would, quite frequently, result in different size estimates.
5.3 Implications for practice
Several sources of error may impact the reliability of tasks involving human judgment and estimation. These are related to the data being suitable; the skill or competence of the rater interpreting the data; and, finally, the level of generalization (e.g., forcing avalanches into five size classes). In the context of size estimation and outline determination, low image resolution, lack of image context/reference objects and unfavorable illumination conditions such as shade or diffuse light may impact the conclusiveness of the data for the task to be performed and, hence, reliability. Similarly, differences in the raters' backgrounds and experiences may lead to different levels of competence in interpreting the data. Furthermore, variations in the perception and definition may result in systematic variations in size estimates or outlines. Moreover, the binary choice between an avalanche and no avalanche, when mapping avalanche outlines, does not allow for expressing uncertainty. This may lead to more pronounced differences in the avalanche area identified by participants. Addressing and being aware of these issues will improve the quality of avalanche size estimation and outline determination.
The results of this study indicate that size inventories from North America and Europe, different warning services within Europe, or simply different domain experts may systematically differ in their assessments. Consequently, transferability of size inventories between continents or different warning services may be limited. To achieve a common understanding and comparable size estimation, in particular for expert forecasters and for observers, we suggest a joint effort of the continental and national avalanche associations, together with avalanche forecasters and other avalanche practitioners, to develop training tools that help standardize the size estimations. An in-depth analysis of current protocols or training programs could be fruitful and serve as a first step in tackling this issue. One option might be training people in the “all observables approach” advocated by McClung and Schaerer (1980), which requires imagining the objects that might be destroyed in the track or start of the runout zone of an avalanche.
In the meantime, the uncertainty related to size estimates may be reduced taking into account second estimates and/or jointly deciding on the size in the case of disagreements (e.g., Hafner et al., 2021). Additionally, we recommend the use of intermediate sizes in the following way: first the (full) size class should be estimated. In a second step, the assessor may judge whether avalanche size is low or high or in the middle of the class (like suggested for evaluative social judgments by Goffin and Olson, 2011). If it was low or high, this would result in the intermediate sizes between the chosen and the upper or lower adjacent full size. Practically, this could mean that from a full size 2 the assessor may, in a second step, assign size 1.5 if the avalanche is at the lower end of size 2, assign 2.5 if it is at the upper end or keep a full size 2 if it is a “typical” avalanche for that size.
While the observed variations in avalanche outlines may partly be attributed to a different background and level of experience, we argue that it is partly caused by the lack of a common, precise definition of where to delimit an avalanche. We are not aware of any unambiguous, actionable guideline of where exactly to place the visible outline. Arguably, there is no “natural”, self-evident definition, especially for dry-snow avalanches. Consistency, in the sense of repeatability across expert annotators, can perhaps only be achieved through a generally agreed consensus that includes shared but, to some degree, arbitrary conventions. It appears that a standardization effort may be beneficial and that standardized training could go a long way towards reducing the spread between different experts and organizations, even if some causes of variability, e.g., lighting conditions after a large snowfall cannot easily be controlled and will remain.
If reliable mappings from photographs are required, we recommend second mappings, jointly deciding on the extent of the outline, using a monoplotting tool (e.g., Bozzini et al., 2013) or the overlay image capabilities of Google Earth. For remotely sensed imagery we advocate using a spatial resolution of 50 cm or finer for the detailed segmentation of specific avalanches, whereas a resolution of approximately 2 m seems to be sufficient to capture the overall avalanche activity over a larger region. Intermediate resolutions may provide a reasonable compromise between the precision of individual outlines and large-area coverage at a reasonable cost and immediacy. Recording the perceived uncertainty while mapping might help (Hafner et al., 2022) as well as using the area of agreement from several mappings or jointly discussing areas of disagreement. We generally recommend aiming for good illumination for mapping avalanches, especially under dry-snow conditions.
5.4 Limitations
In all three studies, we relied on comparably small sets of images: in study 1, the size survey, we aimed at a high response rate, which came at the cost of a smaller selection of different avalanche examples (10) since we did not want to introduce a bias by showing different images to different participants. The two mapping tasks (studies 2 and 3) were rather time-consuming and were, therefore, limited to few participants and to few examples. They may therefore be regarded as pilot studies, whose results should be interpreted with caution, keeping in mind the comparably small datasets and the potential particularities of the data. In particular, biases may be present due to the homogeneous sample from participants with a similar background and training, as well as due to the chosen oblique photos and remotely sensed data.
For study 1, we provided photographs but no maps and no additional information, for instance on damage which may have occurred. This certainly made the size estimation task somewhat more difficult, as we often suspect either that a map is available or that the person is familiar with the avalanche path, which may both help in estimating avalanche dimensions. We did not provide maps together with the photographs, as we wanted to avoid introducing a bias related to the (un)familiarity with a specific map design. We have, however, tried to compensate the lack of an accompanying map through the presence of reference objects (people, trees, ski lifts, etc.) in our example photographs to help participants determine the potential damage and volume/mass. Nevertheless, photographs in Fig. 2a and e lack recognizable reference objects, and the other photographs (Fig. 2) must be analyzed carefully to identify the ski tracks, people and houses. Agreement for avalanches next to clearly visible reference objects could therefore be higher than in our analysis.
For the avalanches mapped from oblique photographs (study 2), we speculate that study participants, being aware that their mappings will be analyzed in detail, may have paid more attention to finding the exact boundaries than during routine documentation work. We acknowledge that our sample size of six avalanche examples covers only a fraction of possible viewing angles, snow and avalanche conditions, and terrain characteristics. Furthermore, all participants were well acquainted with the study area and had extensive experience with mapping avalanches using oblique photos. Thus, we regard our results as a best-case scenario. Still, we believe that within the range of (fairly typical) conditions captured by our set of pictures, the evaluation is representative of avalanche outlines currently used in Switzerland. We encourage further research to ascertain the worldwide validity of the results.
Finally, we would like to point out that three of the authors were also involved as participants in the studies (one in study 1 and two in studies 2 and 3). Particularly in studies 2 and 3, with few participants, this may impact results favorably and suggests the presented findings should be treated as an upper bound.
We quantified uncertainty related to avalanche size estimation and avalanche outline determination, calculating the proportion of agreement between raters, the agreement with the most frequently chosen size and the agreement with the reference size. For avalanche outlines we investigated spatial agreement using the intersection over union between individual mappings as well as compared to a reference. Like in Van Coillie et al. (2014) the amount of variation depends on the type of task presented to the operator: we showed that it is difficult to consistently estimate avalanche sizes, and our analyses revealed significant differences between North American and European experts. The mapping of avalanches either from oblique photographs or from remotely sensed imagery proved to be a challenging task resulting in large intra-rater variabilities: some experts showed consistently larger deviations from the reference data. In most extreme case this resulted in the deviation being 2 to 4 times larger than the smallest mapped avalanche area. For the mapping from remotely sensed imagery, individual experience and competence proved to have a larger impact than the underlying spatial resolution. Snow conditions also influenced agreement, with higher agreement under wet-snow compared to dry-snow conditions. For both mapping tasks our samples were fairly homogeneous and the sample size was rather small, limiting the generalizability of our results. Nevertheless, they shed light on the uncertainty underlying avalanche outlines for the first time. We strongly encourage further investigations into agreement between avalanche outlines to paint a more complete picture of the variation in the currently widely used and generated datasets.
Our findings indicate that the reliability of human estimates as a reference or ground truth for avalanche-related tasks needs to be questioned and critically assessed. Since these data are used as ground truth, for instance, for the validation of numerical avalanche simulations (e.g., Wever et al., 2018) or for training models estimating avalanche size from snowpack simulations (e.g., Mayer et al., 2023), efforts should be made to obtain at least an approximate idea on the reliability of labels used when depending on them. Specifically efforts to average out unsystematic error and those requiring justification for the choice to endorse the analytic process (Stewart, 2001; Hagafors and Brehmer, 1983) may help to achieve more reliable results for the avalanche-related tasks presented in this paper. This could be achieved by relying on a superior method to obtain a ground truth or otherwise independent estimates of several experts to allow, for example, choosing the most frequent size.
Besides suggesting more precise definitions and training protocols, our results call for automation. Modern image analysis algorithms, often based on machine learning (like Hafner et al., 2022, in the context of avalanche mapping from SPOT 6 or 7 – Satellite pour l'Observation de la Terre – imagery), are by no means perfect, but they rival human performance and offer consistent, repeatable results. Our reliability study may serve as a baseline to relate the outputs of such automatic methods to human expert performance. Even though the models cannot erase the inter-observer variability and will only learn to reproduce the outlines they are trained with, they can help to generate reproducible and comparable results.
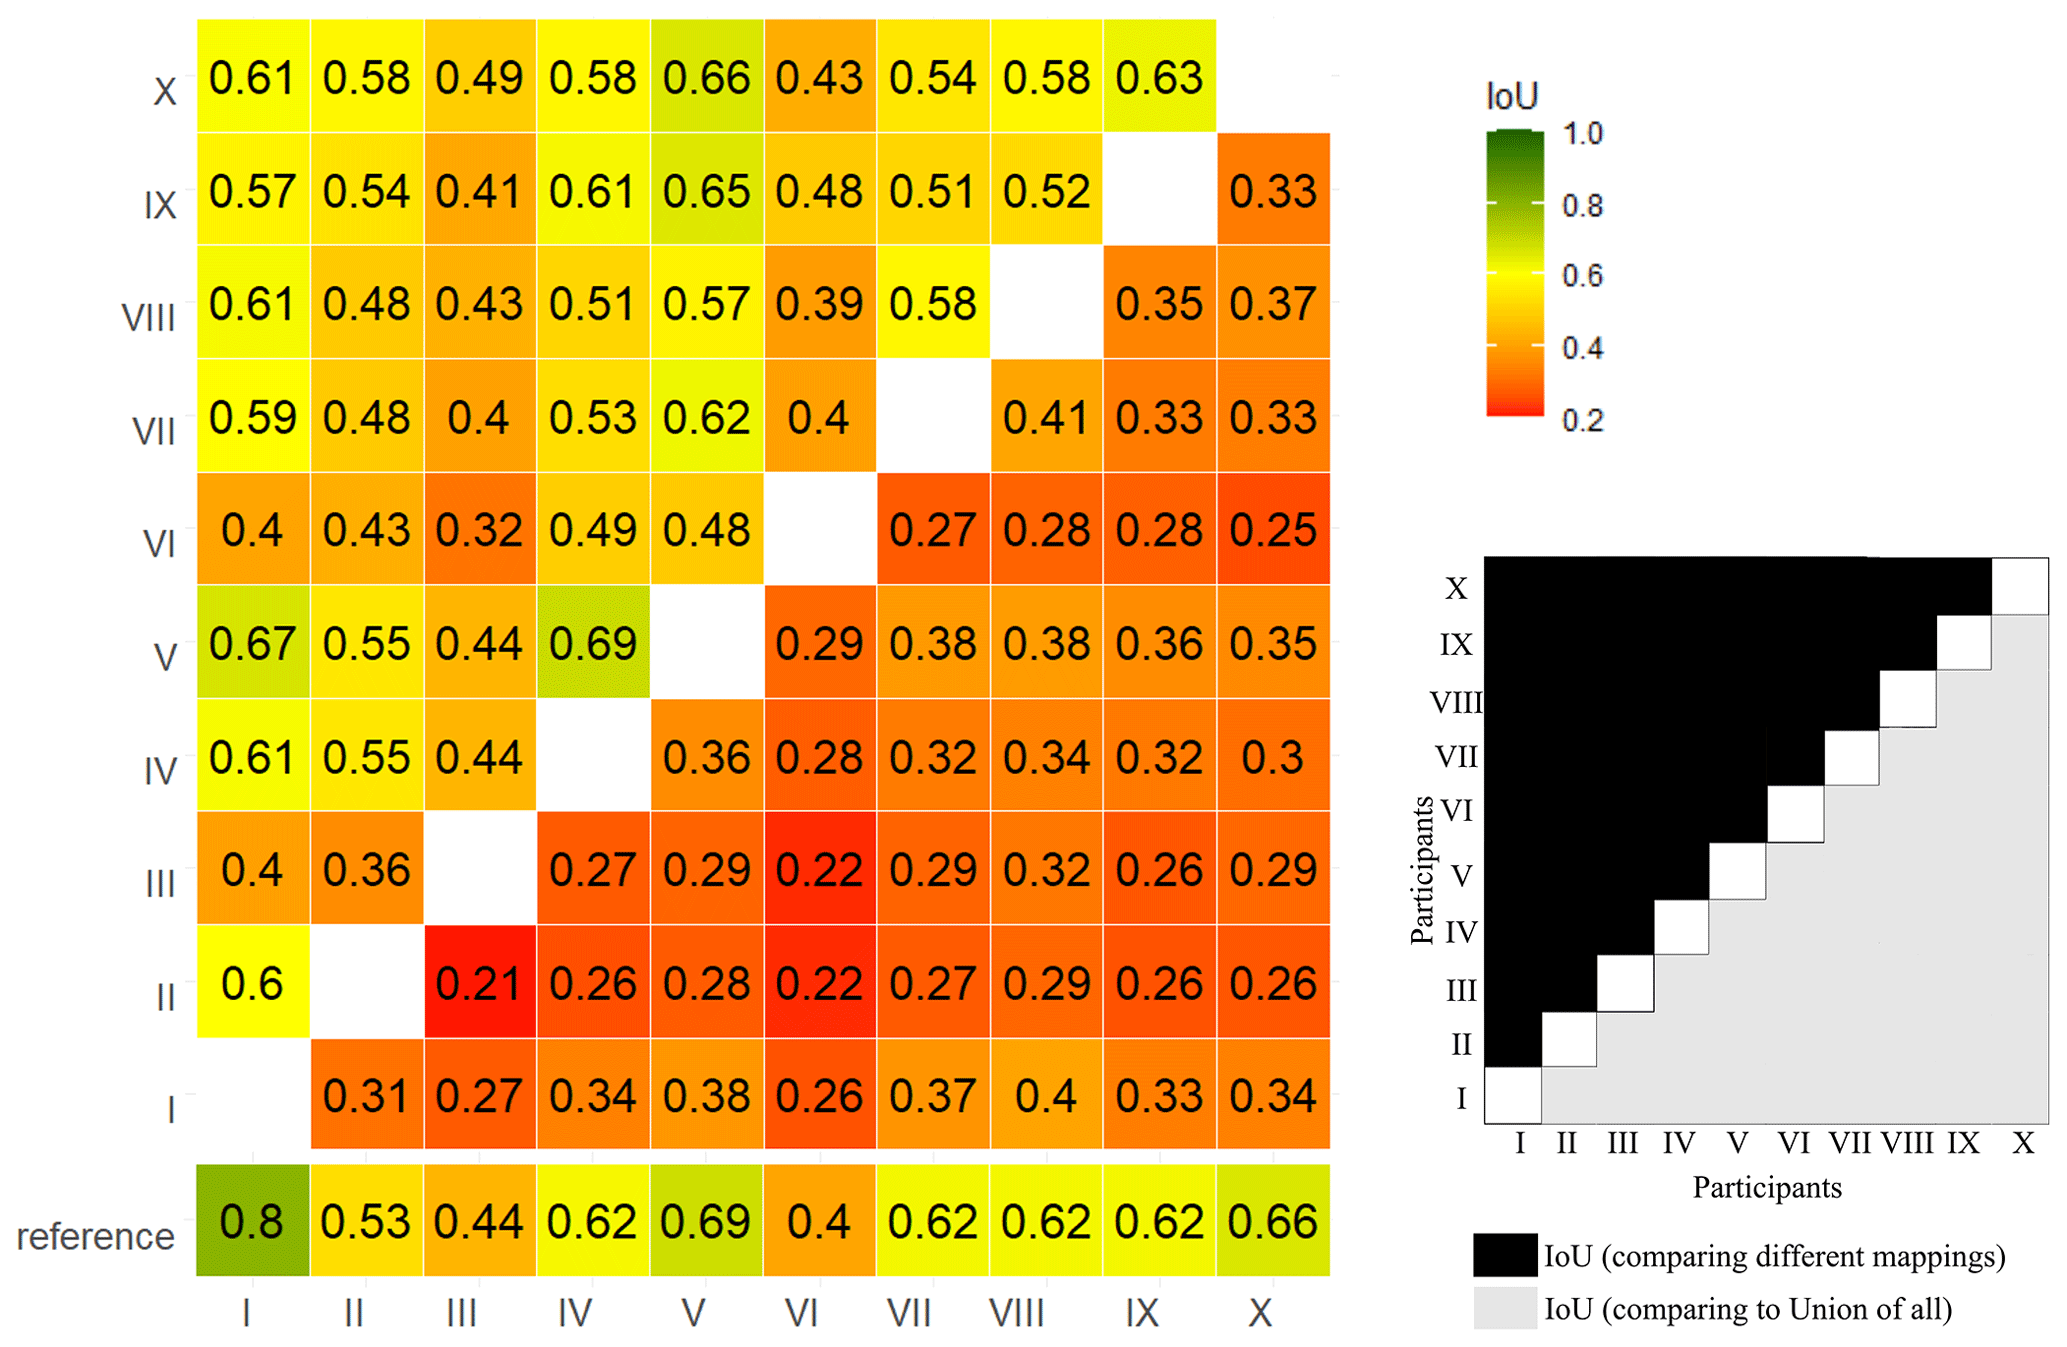
Figure A1IoU for all expert pairs for the mapping from oblique photographs. The numbers I to X represent the different expert participants.
The survey results, used oblique photographs and remotely sensed imagery as well as all mapped avalanche outlines are available on EnviDat (https://doi.org/10.16904/envidat.423, Hafner, 2023).
The supplement related to this article is available online at: https://doi.org/10.5194/nhess-23-2895-2023-supplement.
EDH designed the size survey with input from FT, initiated and coordinated the avalanche mappings, performed the analyses in close collaboration with the co-authors, and wrote the paper draft. FT and EDH were part of the team of experts mapping from photographs. EDH and YB were part of the team of experts mapping from remotely sensed imagery. FT delivered the necessary input from the avalanche warning service, critically reviewed the results, and heavily contributed to the analysis and writing of the paper. All co-authors reviewed and complemented the manuscript.
At least one of the (co-)authors is a member of the editorial board of Natural Hazards and Earth System Sciences.
Publisher’s note: Copernicus Publications remains neutral with regard to jurisdictional claims in published maps and institutional affiliations.
We thank Alessio Krenger, Jessica Munch and Tatjana Scherrer for helping with the translation of the surveys into Italian and French. We are grateful for the large number of avalanche forecasters from North America and Europe who took the time to fill out our survey. We thank Silke Griesser, Mark Schaer, Laura Stephan, Lukas Stoffel, Thomas Stucki, Jürg Trachsel and Kurt Winkler for taking part in the avalanche mapping from photographs. We are thankful for the contribution of Leon Bührle, Lucien Oberson and Christina Salzmann in the mapping of all visible avalanches for all four resolutions in the airplane and drone data. We are grateful to Gwendolyn Dasser for the valuable and constructive feedback, which helped to improve the paper. We thank Ivan Moner and Brian Lazar for the critical questions, suggestions and comments in their reviews.
The acquisition of the data used in study 3 has been partially supported by the Swiss National Science Foundation (SNF; grant no. 200021_172800).
This paper was edited by Pascal Haegeli and reviewed by Ivan Moner and Brian Lazar.
American Avalanche Association: Snow, Weather and Avalanches: Observation Guidelines for Avalanche Programs in the United States, 4th edn., ISBN 979-8-218-05765-7, 2022. a
Ardizzone, F., Cardinali, M., Carrara, A., Guzzetti, F., and Reichenbach, P.: Impact of mapping errors on the reliability of landslide hazard maps, Nat. Hazards Earth Syst. Sci., 2, 3–14, https://doi.org/10.5194/nhess-2-3-2002, 2002. a
Bianchi, F. M., Grahn, J., Eckerstorfer, M., Malnes, E., and Vickers, H.: Snow Avalanche Segmentation in SAR Images With Fully Convolutional Neural Networks, IEEE J. Sel. Top. Appl., 14, 75–82, https://doi.org/10.1109/JSTARS.2020.3036914, 2021. a, b
Birkeland, K. and Greene, E.: Accurately Assessing Avalanche Size: The Ins and Outs of the R- and D- scales, The Avalanche Review, 29, 27/32, https://avalanche.org/wp-content/uploads/2018/08/11_TAR_BirkelandGreene.pdf (last access: 5 January 2023), 2011. a
Bowler, N. E.: Explicitly Accounting for Observation Error in Categorical Verification of Forecasts, Mon. Weather Rev., 134, 1600–1606, https://doi.org/10.1175/MWR3138.1, 2006. a
Bozzini, C., Conedera, M., and Krebs, P.: A New Monoplotting Tool to Extract Georeferenced Vector Data and Orthorectified Raster Data from Oblique Non-Metric Photographs, International Journal of Heritage in the Digital Era, 1, 499–518, https://doi.org/10.1260/2047-4970.1.3.499, 2012. a, b
Bozzini, C., Conedera, M., and Krebs, P.: A new tool for facilitating the retrieval and recording of the place name cultural heritage, The International Archives of the Photogrammetry, Remote Sensing and Spatial Information Sciences, XL-5/W2, 115–118, https://doi.org/10.5194/isprsarchives-XL-5-W2-115-2013, 2013. a, b, c
Brardinoni, F., Scotti, R., Sailer, R., and Mair, V.: Evaluating sources of uncertainty and variability in rock glacier inventories, Earth Surf. Proc. Land., 44, 2450–2466, https://doi.org/10.1002/esp.4674, 2019. a, b
Bühler, Y., Hafner, E. D., Zweifel, B., Zesiger, M., and Heisig, H.: Where are the avalanches? Rapid SPOT6 satellite data acquisition to map an extreme avalanche period over the Swiss Alps, The Cryosphere, 13, 3225–3238, https://doi.org/10.5194/tc-13-3225-2019, 2019. a, b, c
Bühler, Y., Bebi, P., Christen, M., Margreth, S., Stoffel, L., Stoffel, A., Marty, C., Schmucki, G., Caviezel, A., Kühne, R., Wohlwend, S., and Bartelt, P.: Automated avalanche hazard indication mapping on a statewide scale, Nat. Hazards Earth Syst. Sci., 22, 1825–1843, https://doi.org/10.5194/nhess-22-1825-2022, 2022. a
CAA: Avalanche Size, https://www.avalanche-center.org/Education/glossary/avalanche-size.php (last access: 4 January 2023), 2023. a
Canadian Avalanche Association: Observation guidelines and recording standards for weather, snowpack and avalanches, https://cdn.ymaws.com/www.avalancheassociation.ca/resource/resmgr/standards_docs/OGRS2016web.pdf (last access: 25 August 2023), 2016. a
Cronbach, L. J.: Test “reliability”: Its meaning and determination, Psychometrika, 12, 1–16, https://doi.org/10.1007/bf02289289, 1947. a
EAWS: Standards: Avalanche Size, https://www.avalanches.org/standards/avalanche-size/ (last access: 8 May 2023), 2023. a, b, c, d
Eckerstorfer, M., Bühler, Y., Frauenfelder, R., and Malnes, E.: Remote sensing of snow avalanches: Recent advances, potential, and limitations, Cold Reg. Sci. Technol., 121, 126–140, https://doi.org/10.1016/j.coldregions.2015.11.001, 2016. a
Eckerstorfer, M., Malnes, E., and Müller, K.: A complete snow avalanche activity record from a Norwegian forecasting region using Sentinel-1 satellite-radar data, Cold Reg. Sci. Technol., 144, 39–51, https://doi.org/10.1016/j.coldregions.2017.08.004, 2017. a, b
Galli, M., Ardizzone, F., Cardinali, M., Guzzetti, F., and Reichenbach, P.: Comparing landslide inventory maps, Geomorphology, 94, 268–289, https://doi.org/10.1016/j.geomorph.2006.09.023, 2008. a, b
Goffin, R. D. and Olson, J. M.: Is It All Relative?: Comparative Judgments and the Possible Improvement of Self-Ratings and Ratings of Others, Perspect. Psychol. Sci., 6, 48–60, https://doi.org/10.1177/1745691610393521, 2011. a
Hafner, E. D.: Data reliability study: avalanche size estimates and outlines, Envidat [data set], https://doi.org/10.16904/envidat.423, 2023. a
Hafner, E. D., Techel, F., Leinss, S., and Bühler, Y.: Mapping avalanches with satellites – evaluation of performance and completeness, The Cryosphere, 15, 983–1004, https://doi.org/10.5194/tc-15-983-2021, 2021. a, b, c, d, e
Hafner, E. D., Barton, P., Daudt, R. C., Wegner, J. D., Schindler, K., and Bühler, Y.: Automated avalanche mapping from SPOT 6/7 satellite imagery with deep learning: results, evaluation, potential and limitations, The Cryosphere, 16, 3517–3530, https://doi.org/10.5194/tc-16-3517-2022, 2022. a, b, c, d, e, f, g
Hagafors, R. and Brehmer, B.: Does having to justify one's judgments change the nature of the judgment process?, Organ. Behav. Hum. Perf., 31, 223–232, https://doi.org/10.1016/0030-5073(83)90122-8, 1983. a
Hendrikx, J., Owens, I., Carran, W., and Carran, A.: Avalanche activity in an extreme maritime climate: The application of classification trees for forecasting, Cold Reg. Sci. Technol., 43, 104–116, 2005. a
Jamieson, B., Beglinger, R., and Wilson, D.: Case study of a large snow avalanche in the Selkirk Mountains and reflections on the Canadian size classification, Geohazards 6, 6th Canadian GeoHazards Conference, Kingston, ON, Canada, 15–18 June 2014, 2014. a, b, c, d, e, f
Korzeniowska, K., Bühler, Y., Marty, M., and Korup, O.: Regional snow-avalanche detection using object-based image analysis of near-infrared aerial imagery, Nat. Hazards Earth Syst. Sci., 17, 1823–1836, https://doi.org/10.5194/nhess-17-1823-2017, 2017. a
Lampert, T., Stumpf, A., and Gancarski, P.: An empirical study into annotator agreement, ground truth estimation, and algorithm evaluation, IEEE T. Image Process., 25, 2557–2572, 2016. a, b, c
Lato, M. J., Frauenfelder, R., and Bühler, Y.: Automated detection of snow avalanche deposits: segmentation and classification of optical remote sensing imagery, Nat. Hazards Earth Syst. Sci., 12, 2893–2906, https://doi.org/10.5194/nhess-12-2893-2012, 2012. a, b
Levandowsky, M. and Winter, D.: Distance between sets, Nature, 234, 34–35, 1971. a
Mayer, S. I., Techel, F., Schweizer, J., and van Herwijnen, A.: Prediction of natural dry-snow avalanche activity using physics-based snowpack simulations, EGUsphere [preprint], https://doi.org/10.5194/egusphere-2023-646, 2023. a, b
McClung, D. M. and Schaerer, P. A.: Snow avalanche size classification, Avalanche Workshop, Vancouver, 3–5 November 1980, 12–27, https://arc.lib.montana.edu/snow-science/objects/issw-1980-012-030.pdf (last access: 11 November 2022), 1980. a, b, c, d, e
McClung, D. M. and Schaerer, P. A.: Characteristics of Flowing Snow and Avalanche Impact Pressures, Ann. Glaciol., 6, 9–14, https://doi.org/10.3189/1985AoG6-1-9-14, 1985. a
Molenaar, M.: An introduction to the theory of spatial object modelling for GIS, Research Monographs in Geographic Information Systems, Taylor and Francis, United Kingdom, ISBN 0-7484-0775-8, 1998. a
Moner, I., Orgué, S., Gavaldà, J., and Bacardit, M.: How big is big: the results of the avalanche size classification survey, International Snow Science Workshop ISSW, Grenoble, 7–11 October 2023, 2013. a, b, c, d, e, f, g
Paul, F., Barrand, N. E., Baumann, S., Berthier, E., Bolch, T., Casey, K. A., Frey, H., Joshi, S. P., Konovalov, V., Le Bris, R., Mölg, N., Nosenko, G., Nuth, C., Pope, A., Racoviteanu, A., Rastner, P., Raup, B., Scharrer, K., Steffen, S., and Winsvold, S. H.: On the accuracy of glacier outlines derived from remote-sensing data, Ann. Glaciol., 54, 171–182, https://doi.org/10.3189/2013AoG63A296, 2013. a
R Core Team: R: A Language and Environment for Statistical Computing, R Foundation for Statistical Computing, Vienna, Austria, https://www.R-project.org/ (last access: 25 August 2023), 2021. a
Schweizer, J., Mitterer, C., Techel, F., Stoffel, A., and Reuter, B.: On the relation between avalanche occurrence and avalanche danger level, The Cryosphere, 14, 737–750, https://doi.org/10.5194/tc-14-737-2020, 2020. a, b, c, d
Sovilla, B., Schaer, M., and Rammer, L.: Measurements and analysis of full-scale avalanche impact pressure at the Vallée de la Sionne test site, Cold Reg. Sci. Technol., 51, 122–137, https://doi.org/10.1016/j.coldregions.2007.05.006, 2008. a
Stewart, T. R.: Principles of forecasting: a handbook for researchers and practitioners, chap. Improving reliability of judgemental forecasts, Kluwer Academic Publisher, 81–106, https://doi.org/10.1007/978-0-306-47630-3_5, 2001. a, b, c, d, e, f, g
swisstopo: SWISSIMAGE – Das digitale Orthofotomosaik der Schweiz, https://www.swisstopo.admin.ch/de/geodata/images/ortho/swissimage10.html (last access: 16 February 2023), 2020a. a, b
swisstopo: Swiss Map Raster- Produktdokumentation, https://www.swisstopo.admin.ch/content/swisstopo-internet/de/swisstopo/documents.download/swisstopo-internet/de/documents/karto-documents/shop/SMRProduktdokumentation_D.pdf (last access: 16 February 2023), 2020b. a
Techel, F.: On consistency and quality in public avalanche forecasting: a data-driven approach to forecast verification and to refining definitions of avalanche danger, Ph.D thesis, Department of Geography, University of Zurich, Zurich Switzerland, https://doi.org/10.13140/RG.2.2.23044.76163, 2020. a
Techel, F., Mayer, S., Pérez-Guillén, C., Schmudlach, G., and Winkler, K.: On the correlation between a sub-level qualifier refining the danger level with observations and models relating to the contributing factors of avalanche danger, Nat. Hazards Earth Syst. Sci., 22, 1911–1930, https://doi.org/10.5194/nhess-22-1911-2022, 2022. a
U.S. Department of Agriculture: Snow avalanches: a handbook of forecasting and control measures, Agricultural Handbook, 194, 84 pp., https://naldc.nal.usda.gov/download/CAT87208423/pdf (last access: 11 November 2022), 1961. a, b
Van Coillie, F. M., Gardin, S., Anseel, F., Duyck, W., Verbeke, L. P., and De Wulf, R. R.: Variability of operator performance in remote-sensing image interpretation: the importance of human and external factors, Int. J. Remote Sens., 35, 754–778, https://doi.org/10.1080/01431161.2013.873152, 2014. a
Vickers, H., Eckerstorfer, M., Malnes, E., Larsen, Y., and Hindberg, H.: A method for automated snow avalanche debris detection through use of synthetic aperture radar (SAR) imaging, Earth and Space Science, 3, 446–462, https://doi.org/10.1002/2016ea000168, 2016. a
Völk, M. S.: Analyse der Beziehung zwischen Lawinenauslösung und prognostizierter Lawinengefahr: Quantitative Darstellung einer regionalen Lawinenaktivität am Beispiel Davos (CH), Master thesis, Leopold-Franzens-Universität Innsbruck, 2020. a, b, c
Weller, S. and Mann, N.: Assessing rater performance without a “gold standard” using consensus theory, Med. Decis. Making, 17, 71–79, https://doi.org/10.1177/0272989X9701700108, 1997. a
Wever, N., Vera Valero, C., and Techel, F.: Coupled snow cover and avalanche dynamics simulations to evaluate wet snow avalanche activity, J. Geophys. Res.-Earth, 123, 1772–1796, https://doi.org/10.1029/2017JF004515, 2018. a, b
Wong, K., Paritosh, P., and Bollacker, K.: Are ground truth labels reproducible? An empirical study, in: Proceedings of ML Evaluation Standards Workshop at ICLR 2022, 25–29 April 2022, 1–12, https://ml-eval.github.io/assets/pdf/GroundTruthReproducibilityICLRSubmitted.pdf (last access: 25 August 2023), 2022. a, b