the Creative Commons Attribution 4.0 License.
the Creative Commons Attribution 4.0 License.
 | 25 Jan 2023
Using principal component analysis to incorporate multi-layer soil moisture information in hydrometeorological thresholds for landslide prediction: an investigation based on ERA5-Land reanalysis data
Nunziarita Palazzolo
David J. Peres
Enrico Creaco
Antonino Cancelliere
A key component for landslide early warning systems (LEWSs) is constituted by thresholds providing the conditions above which a landslide can be triggered. Traditionally, thresholds based on rainfall characteristics have been proposed, but recently, the hydrometeorological approach, combining rainfall with soil moisture or catchment storage information, is becoming widespread. Most of the hydrometeorological thresholds proposed in the literature use the soil moisture from a single layer (i.e., depth or depth range). On the other hand, multi-layered soil moisture information can be measured or can be available from reanalysis projects as well as from hydrological models. Approaches using this multi-layered information are lacking, perhaps because of the need to keep the thresholds simple and two-dimensional. In this paper, we propose principal component analysis (PCA) as an approach for deriving two-dimensional hydrometeorological thresholds that use multi-layered soil moisture information. To perform a more objective assessment we also propose a piecewise linear equation for the identification of the threshold's shape, which is more flexible than traditional choices (e.g., power law or bilinear). Comparison of the receiver operating characteristic (ROC) (true skill statistic, TSS) of thresholds based on single- and multi-layered soil moisture information also provides a novel tool for identifying the significance of multi-layered information on landslide triggering in a given region. Results for Sicily island, considering the ERA5-Land reanalysis soil moisture data (available at four different depth layers), corroborate the advantages of the hydrometeorological approach gained in spite of the coarse spatial resolution and the limited accuracy of reanalysis data. Specifically, the TSS of traditional precipitation intensity–duration thresholds is equal to 0.5, while those of the proposed hydrometeorological thresholds is significantly higher (TSS=0.71). For the analyzed region, however, multi-layered information seems not to be relevant, as performances in terms of TSS are similar to those obtained with single-layer soil moisture at the upper depths, namely 0–7 and 7–28 cm, which can imply that in Sicily landslide phenomena are mainly influenced by soil moisture in most shallow soil layers.
- Article
(2144 KB) - Full-text XML
- BibTeX
- EndNote


The impact of landslides triggered by rainfall is constantly increasing due to landscape modifications, i.e., urbanization, deforestation, land changes, and the abandonment of rural areas (Roccati et al., 2019). Landslides can cause serious damage to man-made structures and land, as well as loss of natural resources and lives. The role of landslide risk in human well-being is highlighted by the fact that more than 4800 landslide occurrences were documented from 2004 to 2016, with over 55 000 reported fatalities at a global scale (Froude and Petley, 2018). Furthermore, landslides triggered by rainfall have been identified as the cause of approximately 90 % of fatalities globally (Haque et al., 2016; Sultana, 2020), and, from an economic point of view, annual losses were estimated to total USD 20 billion (Sim et al., 2022).
Over the last decades, an increasing number of studies also focused on the potential effects of climate change on landslide phenomena (McInnes et al., 2007; Dijkstra and Dixon, 2010; Crozier, 2010), pointing out that there are some unresolved issues, such as the abundance, activity, frequency, and return period of landslides in response to the projected climate change (Gariano and Guzzetti, 2016; Peres and Cancelliere, 2018). In light of these considerations and, after recent catastrophic landslides worldwide, there is high interest from scholars and civil protection agencies in the development of landslide early warning systems (LEWSs), which can serve as an aid in predicting possible slope movements and thus as a risk mitigation tool (Roccati et al., 2020; Highland and Bobrowsky, 2008; Chae et al., 2017).
Landslide-triggering thresholds are a key component of LEWSs. In general, empirical rainfall thresholds, which relate the occurrence of landslides to rainfall event characteristics such as intensity, duration, total amounts, or a combination thereof, are commonly applied for the majority of regional LEWSs (Guzzetti et al., 2007, 2008; Segoni et al., 2018a; Aleotti, 2004). When information on non-triggering rainfall is also available, thresholds can be determined as the best classifiers based on the confusion matrix (Berti et al., 2012; Staley et al., 2013; Peres and Cancelliere, 2014, 2021; Postance et al., 2018). In the last decade, there has been an increasing interest in the development of hydrometeorological thresholds that consider rainfall characteristics and subsurface hydrological variables, such as soil moisture content and catchment storage information (Uwihirwe et al., 2022; Mirus et al., 2018a, b; Thomas et al., 2018; Segoni et al., 2018b; Wicki et al., 2020, 2021; Bogaard and Greco, 2018, 2016; Reder and Rianna, 2021; Marino et al., 2020; Palau et al., 2021; Conrad et al., 2021). These studies demonstrate improvements of the prediction performances with the hydrometeorological approach, with respect to the traditional precipitation-based thresholds, even if not all climatic areas have been explored, so further applications are still useful. Furthermore, none of the previous studies take into account the possibility to exploit the information from a soil moisture profile or multi-layered soil moisture information, corresponding to several depths or depth ranges. This is most likely because thresholds have to be kept simple, i.e., two-dimensional, for being effectively communicated to decision makers.
In the present work, we propose an approach that allows taking into account the multi-layer soil moisture information within hydrometeorological thresholds while keeping these two-dimensional thanks to a statistical technique named principal component analysis (PCA) (Jolliffe, 2002). This technique allows us to find the linear combination between soil moisture at different depth layers which retains as much as possible the information content of the multiple layers together, capitalizing on the presence of correlation between the soil moisture at different depths. The proposed approach is also intended to test whether multi-layer soil moisture information may provide better predictive performance than the single-layer one by comparing the relative prediction performances in terms of receiver operating characteristic (ROC) indices, such as the well-known true skill statistic (TSS). We carry out our investigation using observed precipitation in combination with ERA5-Land reanalysis soil moisture data, available at four different depth layers with a (≅9 km) resolution (Hersbach et al., 2020). Recent studies proved that the main climate variables (i.e., soil moisture, temperature, precipitation) obtained from third-generation atmospheric and reanalysis datasets (i.e., ERA5 project) have a reasonable accuracy in reproducing in situ measurements (Dorigo et al., 2011; Li et al., 2020; Beck et al., 2021), though accuracy issues still remain significant. The case study of the Sicily region is used to test the proposed methodology.
The paper is organized as follows. First, the procedure for the dataset creation and description of the methodology leading to the proposed approach to implement multi-layer soil moisture data in hydrometeorological thresholds are presented in the “Material and methods” section. Then, the “Study area” section describes the relevant features of the study area, namely the Sicily island (southern Italy). Next, the results and discussion concerning the performance obtained in correspondence with all identified rainfall-triggering thresholds are presented in the “Results and discussion” section. Finally, conclusions are drawn in the last section.
2.1 Dataset construction
The construction of the rainfall and landslide events dataset is a key step that involves different types of data (i.e., observed landslides, rainfall events, and reanalysis data of soil moisture). As schematically illustrated in Fig. 1, in the first step the FraneItalia project (Calvello and Pecoraro, 2018) is employed to collect information regarding the observed landslides, as it is a thorough spatiotemporal inventory of historical landslides that have impacted the Italian territory since 2010, including both occurrences that resulted in fatalities and occurrences that did not.

The first classification criterion by the FraneItalia catalog is based on the number of landslides triggered by the same rainfall event in a given geographic area. Specifically, single landslide events (SLEs) and areal landslide events (ALEs) are distinguished for records referring to single or multiple landslides, respectively. Both SLEs and ALEs are then categorized into one of three classes in relation to their impacts, in order to track whether a landslide occurrence resulted in casualties or missing people (C1, very severe), injured people and evacuations (C2, severe), or no one was physically harmed (C3, minor). The data on occurrence location, the date the landslide occurred, the source of information, and the number of landslides for ALEs are further details that have also been included in the catalog, together with the onset and duration of the landslide occurrence and its consequences.
Thanks to this accurate level of detail, it is possible to filter only the landslide events triggered by rainfall, which are precisely those to take into consideration in our study.
The CTRL-T (Calculation of Thresholds for Rainfall-induced Landslides-Tool) code (Melillo et al., 2018) is subsequently used for the identification of the rainfall events that were more likely to be responsible for the observed slope failures. Specifically, CTRL-T automatically and objectively reconstructs rainfall events and the triggering conditions responsible for the failure using a set of adjustable parameters to account for different morphological and climatic settings. Briefly, the tool consists of distinct modules with specific purposes. Among these, one module operates the reconstruction of rainfall events in term of duration (D, in h) and cumulated event rainfall (E, in mm) using a continuous hourly rainfall time series and setting several climate and spatial parameters such as the warm period in a year (CW), the cold period in a year (CC), the resolution of the rain gauge (GS), the instrumental sensitivity of the rain gauge and the minimum value exceeding which the isolated hourly measurements are considered relevant (ER), and the radius of the buffer to assign each landslide to the closest rain gauge (RB). Furthermore, in order to account for seasonality (i.e., different evapotranspiration rates in different periods of the year), additional rainfall parameters can be set by the user, namely the dry interval separating isolated rainfall measurements (P1); the time periods used to remove irrelevant amounts of rainfall, (P2), and (P3); and the minimum dry period separating two rainfall events (P4). The readers are referred to Melillo et al. (2018) for more detailed information on these parameters. A further module instead performs the selection of the rain gauge representative for the landslide. Once the maximum allowed distance between a landslide and a rain gauge is defined as a circle of radius RB specified by the user, if more than one rain gauge is located within the circle, then the rainfall events from each rain gauge are weighted based on the rain gauge–landslide distance and the rainfall event characteristics (cumulated rainfall and duration). More specifically, given the multiple rainfall conditions (MRCs) that are most likely responsible for the slope failures as pair of rainfall event duration (DL) and cumulated event rainfall (EL), or a set of two or more pairs, each MRC is assigned a weight to select the representative rain gauge and the rainfall conditions associated with the landslide. The weight is proportional to the inverse square distance between the rain gauge and the landslide (d−2), the cumulated rainfall (EL), and the rainfall mean intensity ():
Thus, among all the identified MRCs, those with the highest weights w are defined as the maximum probability rainfall conditions (MPRCs), and these reconstructed rainfall conditions were assumed as the triggering rainfall events. Lastly, Fig. 2, depicts how the duration of a triggering rainfall event is defined. Specifically, when a landslide occurs during a dry period the whole event that preceded it is considered as a triggering rainfall event; otherwise, just the rainfall that occurred before the landslide occurrence is taken into account.
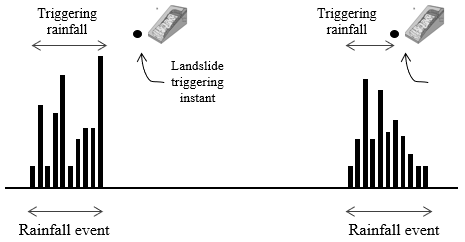
Figure 2Sketch illustrating how the duration of a triggering rainfall event is defined (adapted from Peres et al., 2018).
As shown in Fig. 1, the last step for the dataset set-up consists of the association of soil moisture data to the beginning of each rainfall event, both triggering and non-triggering ones. In this regard, the ERA5-Land reanalysis dataset is used. It provides the volume of water ϑ [m3 m−3] at four distinct soil depths levels (i.e., 0–7, 7–28, 28–100, and 100–289 cm). The ERA5-Land soil moisture data are provided at the hourly scale as grid data with a horizontal resolution of . Thus, being at the same temporal resolution of rainfall time series, the soil moisture values representative of the closest cell to the rain gauge that recorded the rainfall event are associated, without delay, to the considered event.
2.2 Principal component analysis
Principal component analysis (Jolliffe, 2002) is a multivariate technique that analyzes a data table in which observations are described by several intercorrelated quantitative dependent variables to extract the important information from the table and to represent it as a set of new orthogonal variables called principal components (Abdi and Williams, 2010).
Precisely, the data are transformed according to a new coordinate system having the x axis, known as the first principal axis, characterized by the highest data variation. Along the successive axes (e.g., the second principal axis, the third principal axis, and so on), the data are characterized by increasingly lower variation. Each succeeding principal component explains the maximum amount of variance feasible with the requirement that it is orthogonal to the previous principal components. In practice, identifying the eigenvalues and eigenvectors of the covariance matrix is the formal mathematical equivalent of solving the PCA problem. The direction along which the data have the highest variance is the eigenvector, while the related eigenvalue is a quantification of the variance in the data along the corresponding eigenvector. Accordingly, the first principal component is the eigenvector with the greatest eigenvalue, followed by the eigenvector with the second-highest eigenvalue, and so on. Thus, the so computed principal components are employed for the projection of the data into the new coordinate space (Kherif and Latypova, 2019).
Practically, in our study, θ (Eq. 2) represents the soil moisture data table for which to compute the principal components, specified as an n-by-p matrix. Rows correspond the total number n of the considered rainfall events (i.e., observations), and the number of columns to the four depths levels at which the initial soil moisture data are provided (i.e., variables).
A instead represents the principal component loadings (i.e., coefficients) table, specified as a p-by-p matrix. The rows of matrix A are called the eigenvectors, and these specify the orientation of the principal components relative to the original variables.
Thus, the principal components (Si) for the generic ith row are given by a linear combination of the variables θ and A, namely
with .
In matrix notation, the transformation of the original variables to the principal components is written as
2.3 Thresholds' identification
First, we identify the traditional rainfall intensity–duration power-law thresholds. The ID threshold has the form of a power law , where I [mm h−1] represents the rainfall intensity, i.e., the average precipitation rate over the considered period; D [h] represents the duration of the rainfall event; α is the intercept parameter; and β is the slope parameter. After reconstructing the rainfall events with the methodology explained for the dataset creation, and after calculating the main variables (i.e., mean rainfall intensity and duration), an optimization tool (i.e., the MATLAB® particle swarm optimization toolbox) is used with the aim to search for the best possible α and β curve parameters able to maximize the true skill statistic (TSS) index objective function (Eq. 11), which is based on the confusion matrix or the receiver operating characteristics (ROCs). The confusion matrix is expressed in terms of the count of true positives (TPs), true negatives (TNs), false positives (FPs), and false negatives (FNs) (Peirce, 1884) (Table 1).
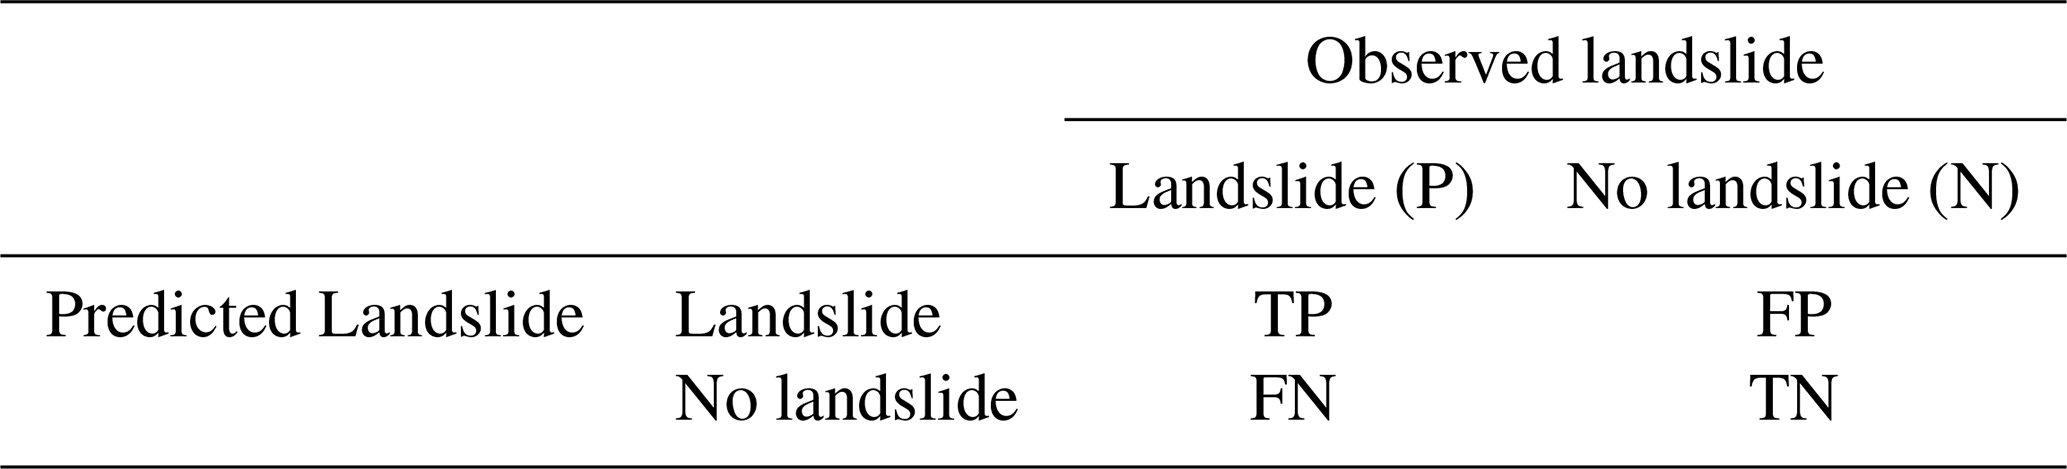
As a function of the variables reported in Table 1, the three reference standard ROC indices – namely, true positive rate, false positive rate, and true skill statistic – are listed below (Eqs. 9–11):
The highest performances correspond to TSS=1 when the model produces no false or missing predictions.
Afterwards, the analysis is focused on the identification of the hydrometeorological threshold trough a novel parametric equation that represents the lower boundary between triggering and non-triggering rainfall events on the basis of the mean rainfall intensity and the reanalysis of soil moisture values. In this context, we propose a piecewise linear equation as a reliable relationship able to well classify the events on the semi-log plane:
where I and ϑ correspond to rainfall intensity and to soil moisture values, respectively. This parametric form of the threshold has been devised based on the visual inspection of the scatter plot of triggering and non-triggering events (i.e., heuristically) and corroborated by comparison with other relationships proposed in the literature – specifically, the power law and the simple bilinear (as opposed to a linear or more complex power or high-degree polynomial) (Uwihirwe et al., 2022; Thomas et al., 2019; Mirus et al., 2018b). x0, x1, y0, and y1 are the threshold's parameters that must be estimated. In this regard, these parameters are computed by adopting the same objective function and optimization procedure as those used for the identification of the parameters of the power-law ID threshold, i.e., the TSS objective function (Eq. 11) and the MATLAB® particle swarm global optimization toolbox. Therefore, Eq. (12) is used to derive the hydrometeorological thresholds employing single- and multi-layer soil moisture data, respectively. Specifically, the mean rainfall intensity (I) and the soil moisture at each of the four depth levels (ϑ1, ϑ2, ϑ3, ϑ4) available from the ERA5-Land reanalysis data are used for the single-layer approach, while the mean rainfall intensity (I) together with the first principal component of soil moisture, i.e., the linear combination of soil moisture at the four depths corresponding to the minimum information loss (highest explained variance), are used for the multi-layer approach. The TSS values obtained in the applications considering soil moisture, both single- and multi-layered, (hereinafter indicated as TSSpar) are being compared to one another, as well as to the TSS value obtained for the power-law ID threshold (hereinafter TSSpl).
The study area selected for our study is the island of Sicily (southern Italy, 37.75∘ N, 14.25∘ E) which, with an area of ∼25 700 km2, is the largest island of the Mediterranean Sea. A hilly morphology (62 %) dominates the landscape in the island, while the rest is characterized by a mountainous and flat morphology, especially in the eastern part of the island around Catania. The terrain average elevation is about 400 m above sea level, ranging from 0 to 3320 m on the peak of the Etna volcano. Geologically, the Sicily island arose during the Neogene, when the European and African plates converged. Thus, Sicily stands out for its complex geological and lithological features which, cooperatively with anthropic activities (e.g., changes in land use, management of forest), have generated a wide range of different types of soil (Venturella, 2004).
The climate is warm-temperate, with hot and dry summers, especially on the southern coasts, and higher and more frequent precipitation during the colder winter months, in the mountainous internal areas (Pumo et al., 2019). Mean annual precipitation ranges between 700 and 800 mm, and autumn and winter are the rainiest seasons. The most severe rainfall events frequently hit the eastern side of the island and, specifically, the eastern side of the Etna volcano and the flanks of the Peloritani mountains, with the greatest precipitation peaks on the Ionian side (Gariano et al., 2015). On the other hand, south Sicily is distinguished by lower precipitation than the mean values recorded in the rest of the region, since it is located at a lower height and is exposed to the hot and dry African winds (Alecci and Rossi, 2007).
Figure 3 shows the geographical context of Sicily, the rain gauge locations for the period 2009–2018 (Distefano et al., 2022), and the observed landslide locations. In more detail, 207 landslide events were retrieved by the FraneItalia database from 2010 to 2018 and, for each of them, longitude–latitude coordinates (WGS84 datum), together with the initiation time, were retrieved.
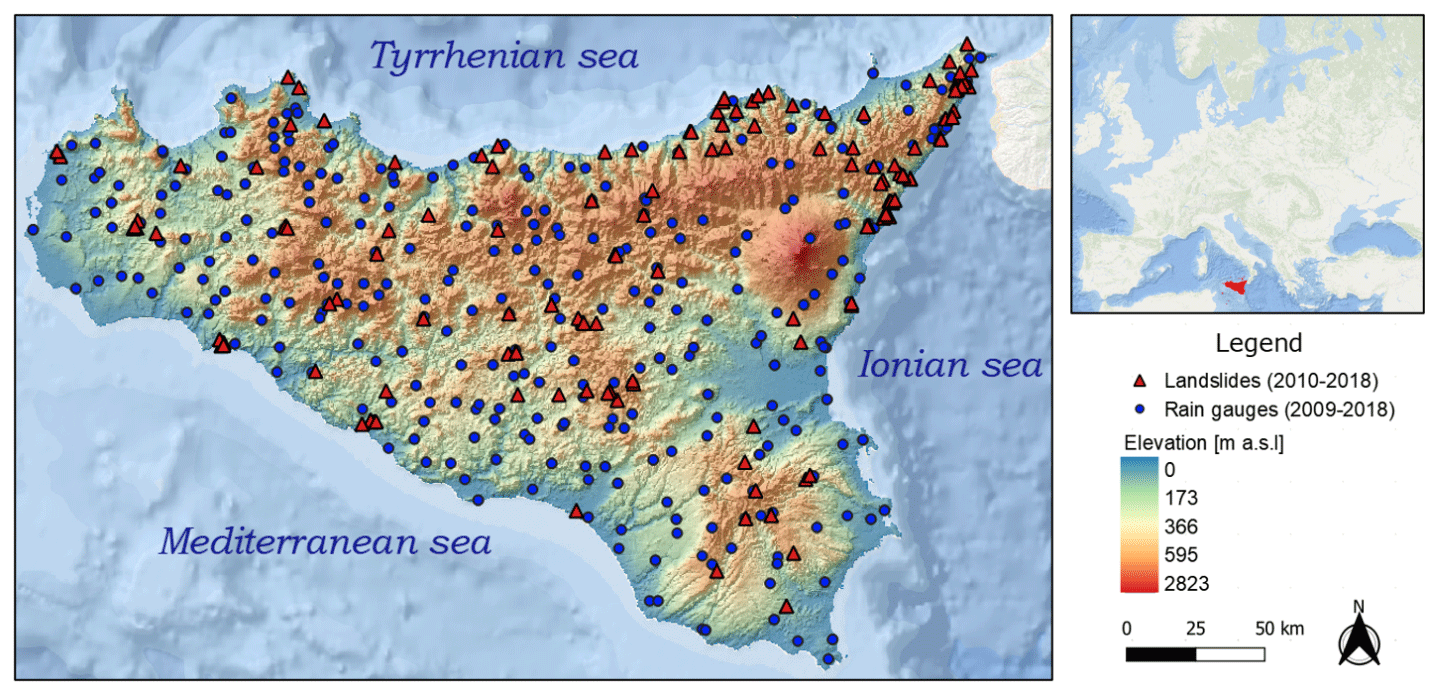
Figure 3Elevation map of the study area (Sicily region), showing the location of the rain gauges and landslide occurrences (credit to http://www.sinanet.isprambiente.it/it/sia-ispra/download-mais, last access: 13 January 2023, and ESRI, 2020).
Concerning the observed rainfall measurements, we consulted the data provided by the regional water observatory (Osservatorio delle Acque, OdA), the SIAS (Sicilian Agro-meteorological Information Service), and the Regional Civil Protection Department (DRPC), namely the three main gauging networks installed in Sicily.
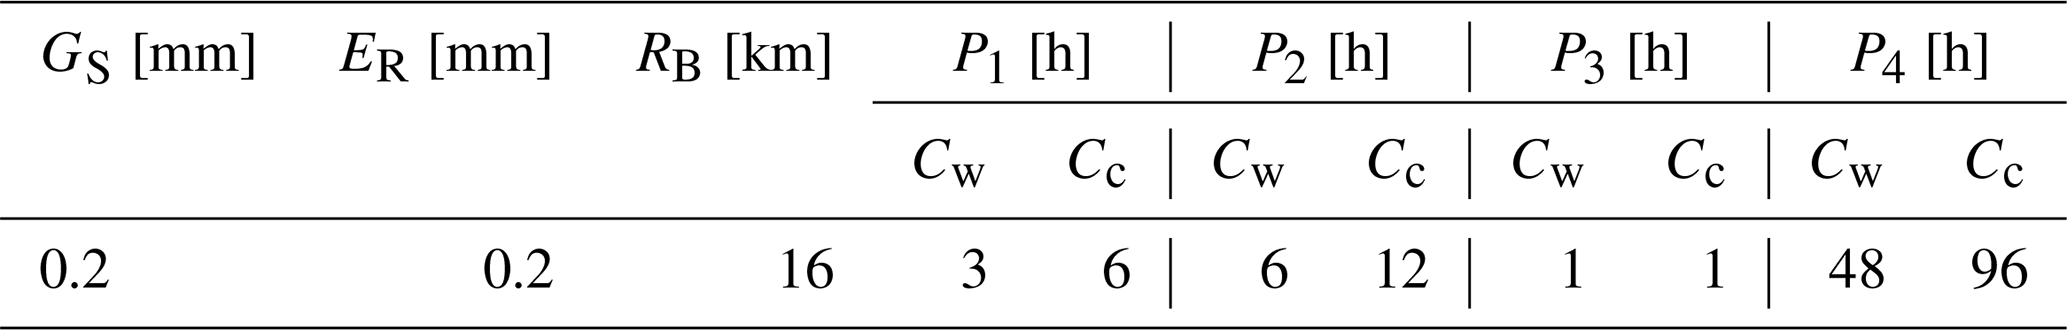
This enabled an hourly time series to be reconstructed for the precipitation over the period 2009–2018. As previously explained in Sect. 2.1, using these continuous rainfall time series, the rainfall events were identified using the CTRL-T research code. For the calibration of these regional parameters required by CTRL-T, we referred to a previous application of the algorithm to the Sicily island (Melillo et al., 2015). Specifically, according to this approach, the dry period (no rain) has been set equal to 48 h (P4,warm) between April and October (warm season, Cw), while it has been set equal to 96 h (P4,cold) from November to March (cold season, Cc). Indeed, in line with Köppen (1936) and Trewartha (1968), it is reasonable to assume that in Sicily, due to the Mediterranean climate, the warm period is longer than the cold one. The rain gauge sensitivity GS has been set equal to 0.2 mm, while the rain gauge search radius RB has been established equal to 16 km. Table 2 summarizes adopted values for mentioned CTRL-T parameters.
Table 2CTRL-T parameters for the reconstruction of the rainfall events used in the present study.
4.1 Principal component analysis
An explorative analysis was carried out, to investigate the correlation between the four soil moisture depths (ϑ1, ϑ2, ϑ3, ϑ4). The plot shown in Fig. 4 represents the correlation matrix between all pairs of variables, together with the Pearson's correlation coefficients.
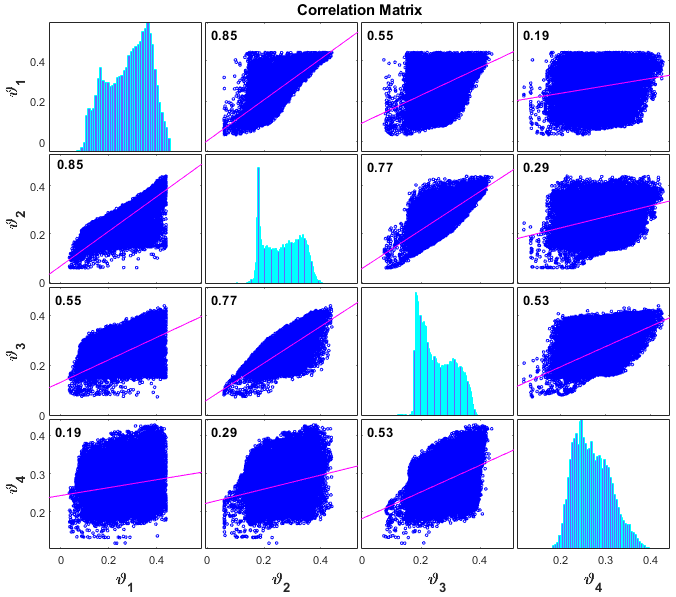
Figure 4Correlation matrix between the four soil moisture level depths (ϑ1, ϑ2, ϑ3, ϑ4). Each off-diagonal subplot contains a scatterplot of a pair of variables with a least-squares reference line, the slope of which is equal to the displayed Pearson correlation coefficient. Each diagonal subplot contains the distribution of a variable as a histogram.
Overall, all the four soil moisture depths are related to each other. Specifically, the diagonal subplot between the upper two depth levels ϑ1 and ϑ2 has the highest correlation, with a Pearson correlation coefficient equal to 0.85. This suggests that PCA can be adopted in order to find out the linear combination expressing the correlation between the involved soil moisture variables.
The preliminary step, required when PCA is performed, is to center the data on the mean values of each variable, namely by subtracting the mean. This step allows the cloud of data to be centered on the origin of the principal components, but it affects neither the spatial relationships of the data, nor the explained variance along the variables. At this stage, it was possible to proceed with PCA and, according to Eqs. (4)–(7), the four principal components of soil moisture were defined as follows:
The loading values of each principal component are intended as the weights aij (Eq. 3); therefore, the higher the value of the weight, the larger the contribution of a variable to the component associated with the weight. The sign of a loading indicates whether a variable and a principal component are positively or negatively correlated. Here, although overall slightly large loadings correspond to the first principal component, none of the four variables has a strong relationship with a particular principal component.
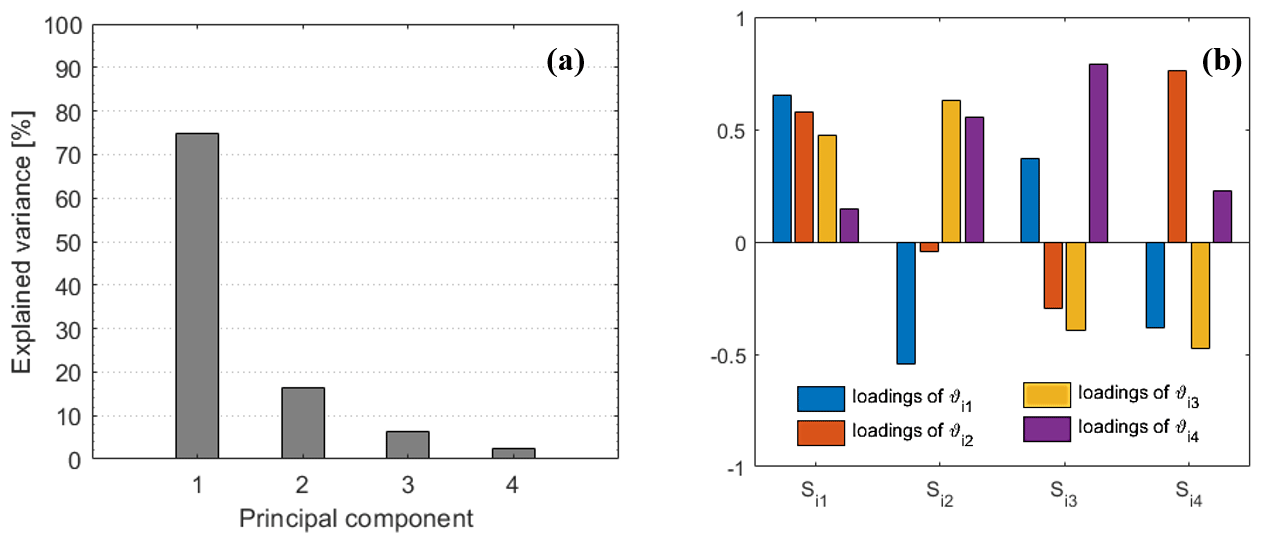
Figure 5(a) Total variance explained by each principal component; (b) estimated loadings for each principal component Si.
Figure 5a shows the scree plot representing the total percentage of variance explained by each of the four principal components. The chart reveals the decreasing rate at which variance is explained by additional principal components. Figure 5b represents a grouped bar plot indicating the estimated loadings corresponding to each of four principal components as reported at Eqs. (13)–(16).
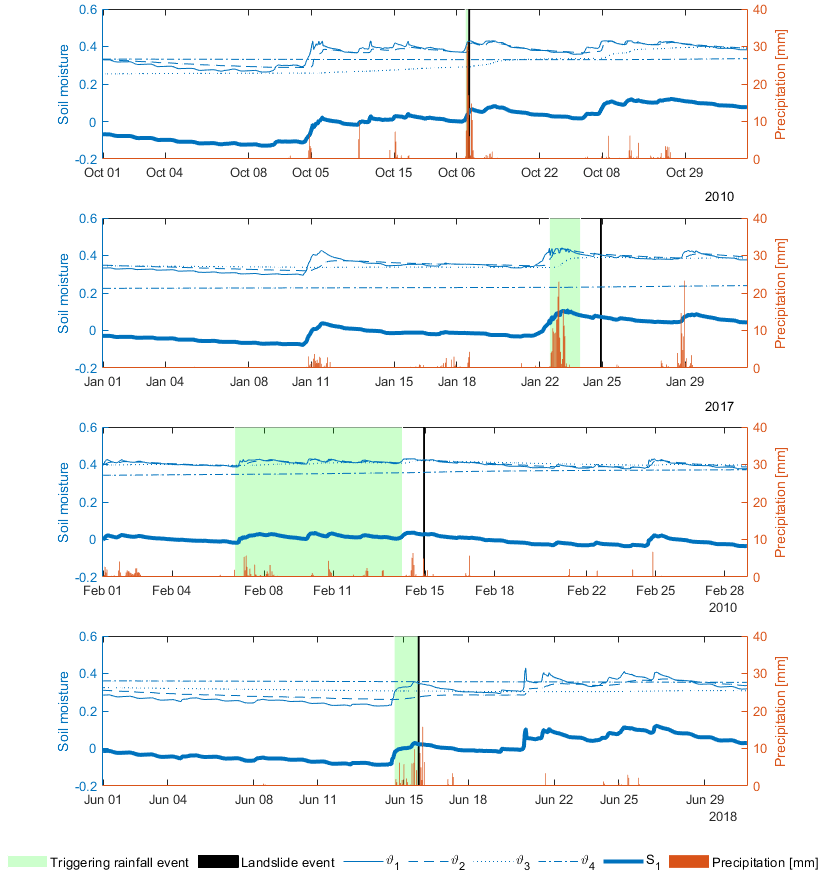
Figure 6Panel showing four different triggering rainfall events. For each of them the precipitation time series together with the soil moisture time series (ϑ1, ϑ2, ϑ3, ϑ4) are reported, as well as the first principal component of soil moisture S1 and the timing of each landslide.
Because dimensionality reduction is a goal of PCA, several criteria can be considered for determining how many principal components should be examined and how many should be ignored (Rencher, 1998). A few of the criteria that can be considered include the following: (i) ignore principal components at the point at which the next principal component offers little increase in the total explained variation; (ii) ignore the last principal component whose explained variations are all roughly equal; (iii) include all principal components up to a predetermined total explained variation. In our study, the third criterion was applied considering a threshold value of 75 %. Therefore, only the first principal component was considered as it guaranteed the desired explained variation of about 75 %.
4.2 Threshold identification
CTRL-T tool reconstructed 144 landslide events out of the 207 landslides retrieved by the FraneItalia database. Four different triggering rainfall events, representing a range of triggering conditions, were selected within the database, and the precipitation time series together with the soil moisture time series are plotted in Fig. 6.
As expected, the upper two soil moisture layers are those that are most similar to precipitation trends, as well as the first principal component of soil moisture S1, computed using Eq. (13). Overall, a greater variability in soil moisture values can be observed in correspondence with ϑ1 and ϑ2, which assume maximum values about equal to 0.4 in correspondence with all the analyzed triggering rainfall events.
First, the power-law ID threshold maximizing TSS was identified (Fig. 7). In particular, the plot shows the triggering events as red points, while the non-triggering events, since there are a very large number, are better represented by a color map indicating the relative frequency of non-triggering rainfall events, following a plotting technique inspired by Leonarduzzi et al. (2017).
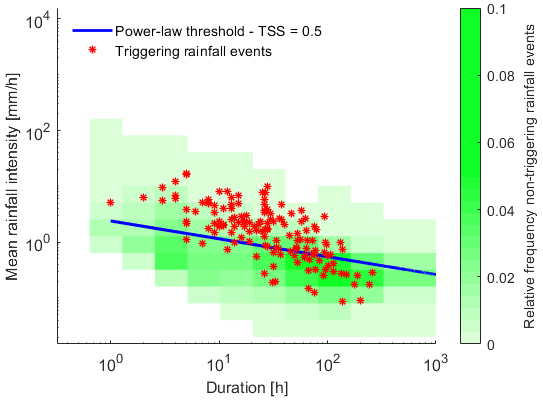
Figure 7Traditional power-law threshold on the log–log plane between observed mean rainfall intensity (I) and duration (D).
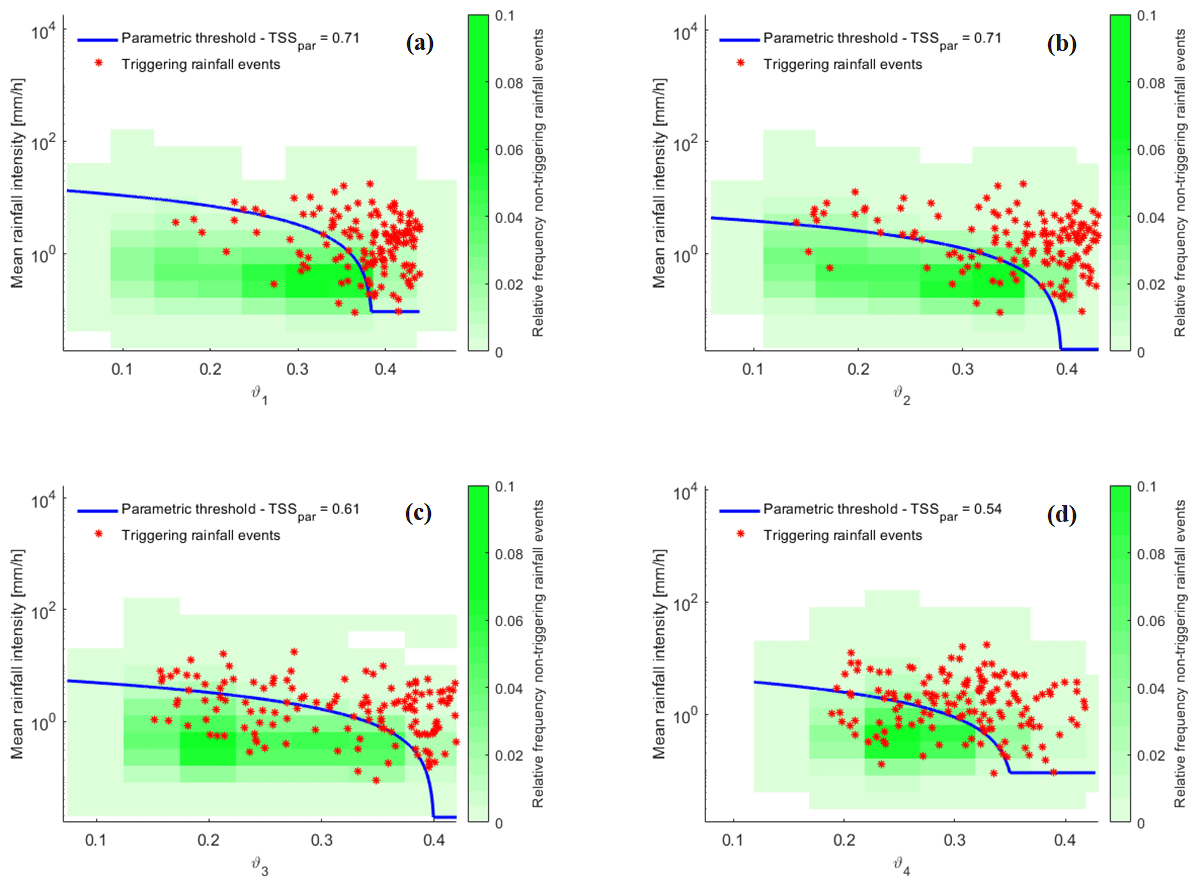
Figure 8Parametric thresholds on the semi-log plane between mean rainfall intensity and soil moisture at the four distinct depths: (a) ϑ1 0–7 cm; (b) ϑ2 7–28 cm; (c) ϑ3 28–100 cm; (d) ϑ4 100–289 cm.
For this threshold a TSSpl=0.50, corresponding to a TPRpl=0.76 and FPRpl=0.26, is obtained. Figure 8 shows the obtained thresholds when the mean rainfall intensity and the soil moisture at each of the four depth levels are considered. As can be seen, especially in correspondence with the upper two depths (i.e., 0–7, 7–28 cm), the triggering rainfall events are located, for the most part, on the upper right side of the graph, suggesting that the equation proposed for the identification of the thresholds (Eq. 12) well fits this trend. Furthermore, at all depths taken into consideration, there is a noticeable clustering of the highest relative frequency values of non-triggering rainfall events below the related parametric threshold. All four identified thresholds have better performance than the ID threshold. Specifically, higher TSS values were obtained for the first two depths, with a TSSpar equal to 0.71, while significantly lower values of TSSpar (0.61 and 0.54) are obtained with the third and fourth soil moisture level, respectively.
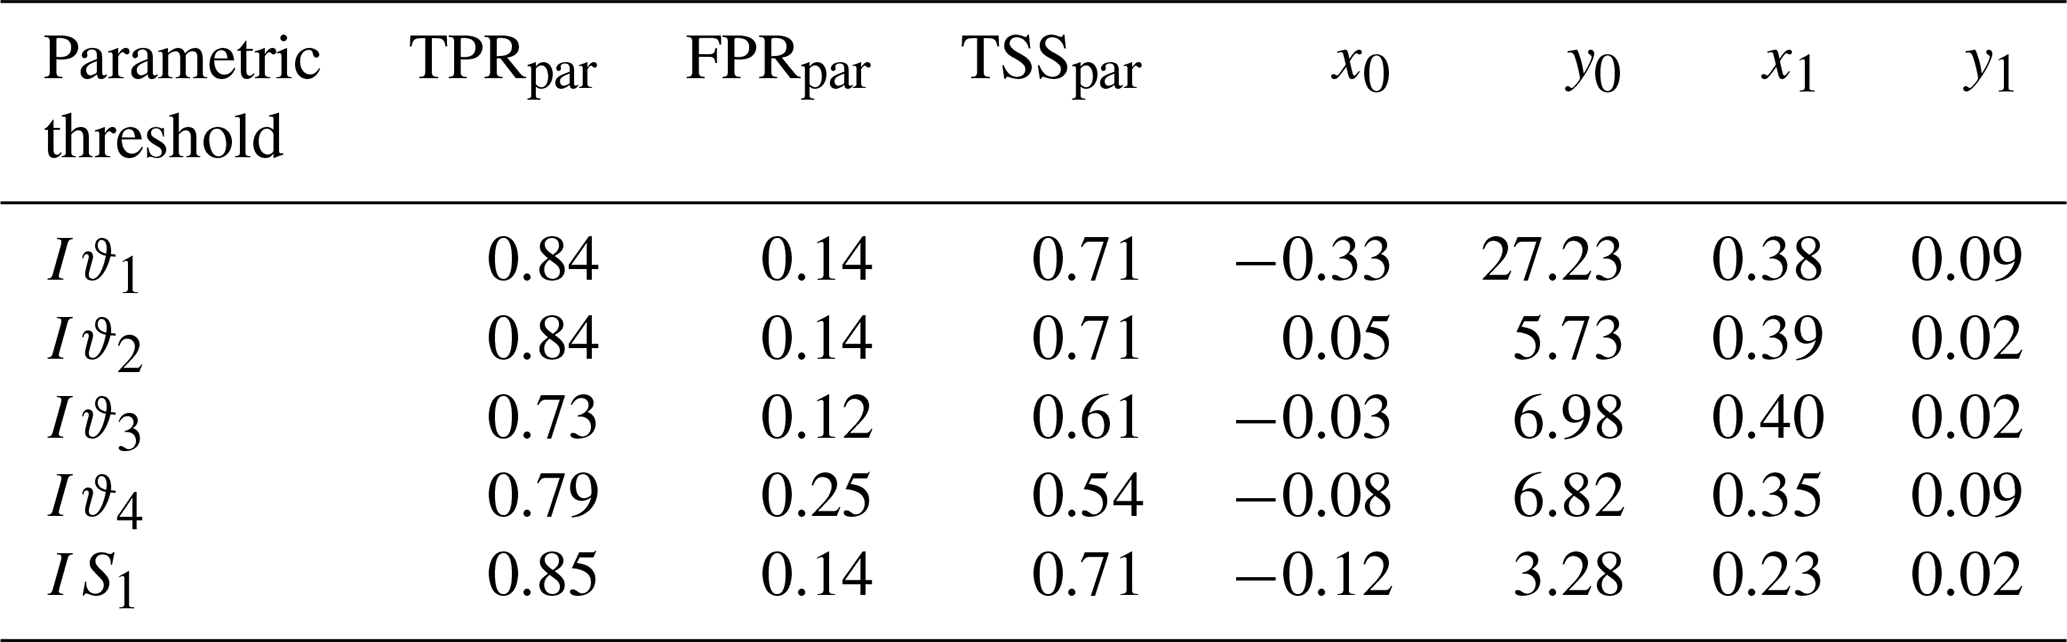
Table 3TSS values in correspondence with each analyzed scenario and parameters (x0, y0, x1, y1) estimated for the parametric thresholds.
Moving to the multi-layer approach, the optimal parametric threshold identified using the mean rainfall intensity and first principal component of soil moisture is presented in Fig. 9. In this case, a TSSpar=0.71 was obtained.

Figure 9Parametric threshold on the semi-log plane between observed mean rainfall intensity (I) and first principal component of soil moisture (S1).
Table 3 summarizes the TSS values in correspondence with the analyzed thresholds, together with the values of parameters (Eq. 12) estimated for the parametric thresholds.
Overall, the results relative to the hydrometeorological thresholds corroborate other studies showing their better predictive performance when compared to the traditional ID threshold. For the specific case study of Sicily, thresholds based on multi-layered soil moisture information have similar predictive performances to thresholds based on single-layered information. This points out that the two shallowest depth layers are of the greatest relevance for landslide triggering in Sicily. This may not be the case for other case study areas, and the proposed approach of comparing multi- vs. single-layer information allows us to define which layers of soil are most relevant in controlling landslide triggering in a given region.
In this study, a framework based on PCA aimed at introducing multi-layer soil moisture information within hydrometeorological threshold identification has been proposed. Our investigation, relative to Sicily, corroborates previous studies showing higher performances for hydrometeorological thresholds compared to the traditional ID power-law thresholds. Specifically, a significant improvement of performances was found with hydrometeorological thresholds, leading to TSS values of up to 0.71, which were much higher than those obtained with the traditional approach (TSS=0.50). The application of PCA to soil moisture data at various depths turned out to be a valuable approach to include multi-layer soil moisture information while keeping the thresholds two-dimensional, though for the case study region, multi-layer information seemed not so relevant, as performances corresponding to the two uppermost layers are similar to those corresponding to the PCA combination of all four layers. Comparison of prediction performances relative to thresholds based on multi- versus single-layer soil moisture information provides a mean to assess which soil depth intervals retain the most relevant information for improving thresholds' predictive performances. This represents a strategic tool supporting decision-making in LEWSs development. Finally, it is worth mentioning that our investigation considered ERA5-Land soil moisture data, whose actual use for landslide prediction is limited by the fact that they are made available with a delay of some weeks from real time. However, this delay is expected to be significantly reduced in the near future in light of the increasing computational capabilities. In this regard, the valuable improvements, gained despite the inherent uncertainty of reanalysis data, further encourage the installation of monitoring networks for direct in situ soil moisture measurements with enhanced spatial and temporal resolutions, as with these observations even higher improvements are to be expected. Future developments of this research will consider other geographical regions in order to further explore the role of multi-layer soil moisture.
The FraneItalia landslides catalog is available at https://doi.org/10.17632/zygb8jygrw.2 (Calvello and Pecoraro, 2018). Rainfall measurements are available at the website of the Servizio Informativo Agrometeorologico Siciliano (SIAS) (http://www.sias.regione.sicilia.it/, SIAS, 2023) and at the Osservatorio delle Acque (http://www.bio.isprambiente.it/annalipdf/, ISPRA, 2023). Reanalysis soil moisture data are available from https://doi.org/10.24381/cds.e2161bac (Muñoz Sabater, 2021).
Conceptualization was done by NP, DJP, EC, and AC; formal analysis by NP and DJP; investigation by NP and DJP; methodology by NP and DJP; coding by NP and DJP; supervision by DJP, EC, and AC; writing the original draft by NP and DJP; and the writing, review, and editing by NP, DJP, EC, and AC. All authors have read and agreed to the published version of the paper.
At least one of the (co-)authors is a member of the editorial board of Natural Hazards and Earth System Sciences. The peer-review process was guided by an independent editor, and the authors also have no other competing interests to declare.
Publisher's note: Copernicus Publications remains neutral with regard to jurisdictional claims in published maps and institutional affiliations.
This article is part of the special issue “Hydro-meteorological extremes and hazards: vulnerability, risk, impacts, and mitigation”. It is a result of the European Geosciences Union General Assembly 2022, Vienna, Austria, 23–27 May 2022.
The authors acknowledge Francesco Marra (handling editor) and the anonymous referees for their valuable comments. Support from the Italian MIUR and the University of Pavia is acknowledged within the program Dipartimenti di Eccellenza 2023–2027. Nunziarita Palazzolo's doctoral program was offered by the University of Pavia.
Nunziarita Palazzolo is supported by post-doctoral contract “Eventi idrologici estremi e resilienza ai cambiamenti climatici”, funded within the activities of the research project “LIFE SimetoRES – Urban adaption and community learning for a RESilient Simeto Valley” – grant agreement no. LIFE17CCA/IT/000115 – CUP C65H18000550006. This research was partially carried out within the project HydrEx – Hydrological extremes in a changing climate – Piano di incentivi per la ricerca di Ateneo (Pia.ce.ri.), 2020–2022, Università di Catania, and the Ministero dell’Università e della Ricerca (Programma Operativo Nazionale Ricerca e Innovazione 2014–2020 – Progetto “reCITY – Resilient City Everyday Revolution” – grant agreement no. ARS01_00592 – CUP B69C21000390005). APCs were funded by “Fondi di Ateneo 2020–2022, Università di Catania, linea Open Access”.
This paper was edited by Francesco Marra and reviewed by two anonymous referees.
Abdi, H. and Williams, L. J.: Principal component analysis, WIREs Comput. Stat., 2, 433–459, https://doi.org/10.1002/WICS.101, 2010.
Alecci, S. and Rossi, G.: Controllo di qualità dei dati pluviometrici ed analisi delle serie temporali, Siccità. Anal. Monit. e mitigazione. Appl. Sicil. Nuova Ed. Bios, Cosenza, Italy, ISBN 978-99-6093-027-9, 2007.
Aleotti, P.: A warning system for rainfall-induced shallow failures, Eng. Geol., 73, 247–265, https://doi.org/10.1016/j.enggeo.2004.01.007, 2004.
Beck, H. E., Pan, M., Miralles, D. G., Reichle, R. H., Dorigo, W. A., Hahn, S., Sheffield, J., Karthikeyan, L., Balsamo, G., Parinussa, R. M., van Dijk, A. I. J. M., Du, J., Kimball, J. S., Vergopolan, N., and Wood, E. F.: Evaluation of 18 satellite- and model-based soil moisture products using in situ measurements from 826 sensors, Hydrol. Earth Syst. Sci., 25, 17–40, https://doi.org/10.5194/hess-25-17-2021, 2021.
Berti, M., Martina, M. L. V., Franceschini, S., Pignone, S., Simoni, A., and Pizziolo, M.: Probabilistic rainfall thresholds for landslide occurrence using a Bayesian approach, J. Geophys. Res.-Earth, 117, 1–20, https://doi.org/10.1029/2012JF002367, 2012.
Bogaard, T. and Greco, R.: Invited perspectives: Hydrological perspectives on precipitation intensity-duration thresholds for landslide initiation: proposing hydro-meteorological thresholds, Nat. Hazards Earth Syst. Sci., 18, 31–39, https://doi.org/10.5194/nhess-18-31-2018, 2018.
Bogaard, T. A. and Greco, R.: Landslide hydrology: from hydrology to pore pressure, WIREs Water, 3, 439–459, https://doi.org/10.1002/wat2.1126, 2016.
Calvello, M. and Pecoraro, G.: FraneItalia: a catalog of recent Italian landslides, Geoenviron. Disast., 5, 13, https://doi.org/10.1186/s40677-018-0105-5, 2018.
Calvello, M. and Pecoraro, G.: FraneItalia: a catalog of recent Italian landslides (version 2.0), Mendeley Data [data set], https://doi.org/10.17632/zygb8jygrw.2 2020.
Chae, B.-G., Park, H.-J., Catani, F., Simoni, A., and Berti, M.: Landslide prediction, monitoring and early warning: a concise review of state-of-the-art, Geosci. J., 21, 1033–1070, https://doi.org/10.1007/s12303-017-0034-4, 2017.
Conrad, J. L., Morphew, M. D., Baum, R. L., and Mirus, B. B.: HydroMet: A new code for automated objective optimization of hydrometeorological thresholds for landslide initiation, Water, 13, 1752, https://doi.org/10.3390/w13131752, 2021.
Crozier, M. J.: Deciphering the effect of climate change on landslide activity: A review, Geomorphology, 124, 260–267, https://doi.org/10.1016/J.GEOMORPH.2010.04.009, 2010.
Dijkstra, T. A. and Dixon, N.: Climate change and slope stability in the UK: challenges and approaches, Q. J. Eng. Geol. Hydroge., 43, 371–385, https://doi.org/10.1144/1470-9236/09-036, 2010.
Distefano, P., Peres, D. J., Scandura, P., and Cancelliere, A.: Brief communication: Introducing rainfall thresholds for landslide triggering based on artificial neural networks, Nat. Hazards Earth Syst. Sci., 22, 1151–1157, https://doi.org/10.5194/nhess-22-1151-2022, 2022.
Dorigo, W. A., Wagner, W., Hohensinn, R., Hahn, S., Paulik, C., Xaver, A., Gruber, A., Drusch, M., Mecklenburg, S., van Oevelen, P., Robock, A., and Jackson, T.: The International Soil Moisture Network: a data hosting facility for global in situ soil moisture measurements, Hydrol. Earth Syst. Sci., 15, 1675–1698, https://doi.org/10.5194/hess-15-1675-2011, 2011.
ESRI: “Ocean” [basemap], Scale Not Given, “World Ocean Base map”, https://services.arcgisonline.com/arcgis/rest/services/Ocean/World_Ocean_Reference/MapServer (last access: 16 January 2023) 2020.
Froude, M. J. and Petley, D. N.: Global fatal landslide occurrence from 2004 to 2016, Nat. Hazards Earth Syst. Sci., 18, 2161–2181, https://doi.org/10.5194/nhess-18-2161-2018, 2018.
Gariano, S. L. and Guzzetti, F.: Landslides in a changing climate, Earth-Sci. Rev., 162, 227–252, https://doi.org/10.1016/J.EARSCIREV.2016.08.011, 2016.
Gariano, S. L., Brunetti, M. T., Iovine, G., Melillo, M., Peruccacci, S., Terranova, O., Vennari, C., and Guzzetti, F.: Calibration and validation of rainfall thresholds for shallow landslide forecasting in Sicily, southern Italy, Geomorphology, 228, 653–665, https://doi.org/10.1016/j.geomorph.2014.10.019, 2015.
Guzzetti, F., Peruccacci, S., Rossi, M., and Stark, C. P.: Rainfall thresholds for the initiation of landslides in central and southern Europe, Meteorol. Atmos. Phys., 98, 239–267, https://doi.org/10.1007/s00703-007-0262-7, 2007.
Guzzetti, F., Peruccacci, S., Rossi, M., and Stark, C. P.: The rainfall intensity-duration control of shallow landslides and debris flows: An update, Landslides, 5, 3–17, https://doi.org/10.1007/s10346-007-0112-1, 2008.
Haque, U., Blum, P., da Silva, P. F., Andersen, P., Pilz, J., Chalov, S. R., Malet, J.-P., Auflič, M. J., Andres, N., Poyiadji, E., Lamas, P. C., Zhang, W., Peshevski, I., Pétursson, H. G., Kurt, T., Dobrev, N., García-Davalillo, J. C., Halkia, M., Ferri, S., Gaprindashvili, G., Engström, J., and Keellings, D.: Fatal landslides in Europe, Landslides, 13, 1545–1554. https://doi.org/10.1007/s10346-016-0689-3, 2016.
Hersbach, H., Bell, B., Berrisford, P., Hirahara, S., Horányi, A., Muñoz-Sabater, J., Nicolas, J., Peubey, C., Radu, R., Schepers, D., Simmons, A., Soci, C., Abdalla, S., Abellan, X., Balsamo, G., Bechtold, P., Biavati, G., Bidlot, J., Bonavita, M., De Chiara, G., Dahlgren, P., Dee, D., Diamantakis, M., Dragani, R., Flemming, J., Forbes, R., Fuentes, M., Geer, A., Haimberger, L., Healy, S., Hogan, R. J., Hólm, E., Janisková, M., Keeley, S., Laloyaux, P., Lopez, P., Lupu, C., Radnoti, G., de Rosnay, P., Rozum, I., Vamborg, F., Villaume, S., and Thépaut, J. N.: The ERA5 global reanalysis, Q. J. Roy. Meteor. Soc., 146, 1999–2049, https://doi.org/10.1002/qj.3803, 2020.
Highland, L. M. and Bobrowsky, P.: The landslide Handbook – A guide to understanding landslides, US Geol. Surv. Circ., 1–147, https://doi.org/10.3133/cir1325, 2008.
ISPRA – Istituto Superiore per la Protezione e la Ricerca Ambientale: Annali idrologici Storici, http://www.bio.isprambiente.it/annalipdf/, last access: 16 January 2023.
Jolliffe, I. T.: Principal component analysis for special types of data, Springer, New York, 338–372, https://doi.org/10.1007/0-387-22440-8_13, 2002.
Kherif, F. and Latypova, A.: Principal component analysis, Mach. Learn. Methods Appl. to Brain Disord., 209–225, https://doi.org/10.1016/B978-0-12-815739-8.00012-2, 2019.
Köppen, V. P.: Das geographische System der Klimate, in: Handbuch der Klimatologie, Band 5, Teil C, edited by: Köppen, W. and Geiger, R., Berlin, Gebrüder Bornträger, 44 pp., 1936 (in German).
Leonarduzzi, E., Molnar, P., and McArdell, B. W.: Predictive performance of rainfall thresholds for shallow landslides in Switzerland from gridded daily data, Water Resour. Res., 53, 6612–6625, https://doi.org/10.1002/2017WR021044, 2017.
Li, M., Wu, P., and Ma, Z.: A comprehensive evaluation of soil moisture and soil temperature from third-generation atmospheric and land reanalysis data sets, Int. J. Climatol., 40, 5744–5766, https://doi.org/10.1002/joc.6549, 2020.
Marino, P., Peres, D. J., Cancelliere, A., Greco, R., and Bogaard, T. A.: Soil moisture information can improve shallow landslide forecasting using the hydrometeorological threshold approach, Landslides, 17, 2041–2054, https://doi.org/10.1007/s10346-020-01420-8, 2020.
McInnes, R., Jakeways, J., Fairbank, H., and Mathie, E.: Landslides and Climate Change: Challenges and Solutions, in: Proceedings of the International Conference on Landslides and Climate Change, Ventnor, Isle of Wight, UK, 21–24 May 2007, CRC Press, https://doi.org/10.1201/NOE0415443180, 2007.
Melillo, M., Brunetti, M. T., Peruccacci, S., Gariano, S. L., and Guzzetti, F.: An algorithm for the objective reconstruction of rainfall events responsible for landslides, Landslides, 12, 311–320, https://doi.org/10.1007/s10346-014-0471-3, 2015.
Melillo, M., Brunetti, M. T., Peruccacci, S., Gariano, S. L., Roccati, A., and Guzzetti, F.: A tool for the automatic calculation of rainfall thresholds for landslide occurrence, Environ. Modell. Softw., 105, 230–243, https://doi.org/10.1016/j.envsoft.2018.03.024, 2018.
Mirus, B. B., Becker, R. E., Baum, R. L., and Smith, J. B.: Integrating real-time subsurface hydrologic monitoring with empirical rainfall thresholds to improve landslide early warning, Landslides, 15, 1909–1919, https://doi.org/10.1007/s10346-018-0995-z, 2018a.
Mirus, B. B., Morphew, M. D., and Smith, J. B.: Developing Hydro-Meteorological Thresholds for Shallow Landslide Initiation and Early Warning, Water, 10, 1274, https://doi.org/10.3390/W10091274, 2018b.
Muñoz Sabater, J.: ERA5-Land hourly data from 1950 to present, Copernicus Climate Change Service (C3S) Climate Data Store (CDS) [data set], https://doi.org/10.24381/cds.e2161bac, 2021.
Palau, R. M., Hürlimann, M., Berenguer, M., and Sempere-Torres, D.: Towards the use of hydrometeorological thresholds for the regional-scale LEWS of Catalonia (NE Spain), EGU General Assembly 2021, online, 19–30 April 2021, EGU21-8221, https://doi.org/10.5194/egusphere-egu21-8221, 2021.
Peirce, C. S.: The numerical measure of the success of predictions, Science, 4, 453–454, https://doi.org/10.1126/science.ns-4.93.453-a, 1884.
Peres, D. J. and Cancelliere, A.: Derivation and evaluation of landslide-triggering thresholds by a Monte Carlo approach, Hydrol. Earth Syst. Sci., 18, 4913–4931, https://doi.org/10.5194/hess-18-4913-2014, 2014.
Peres, D. J. and Cancelliere, A.: Modeling impacts of climate change on return period of landslide triggering, J. Hydrol., 567, 420–434, https://doi.org/10.1016/j.jhydrol.2018.10.036, 2018.
Peres, D. J. and Cancelliere, A.: Comparing methods for determining landslide early warning thresholds: potential use of non-triggering rainfall for locations with scarce landslide data availability, Landslides, 18, 3135–3147, https://doi.org/10.1007/s10346-021-01704-7, 2021.
Peres, D. J., Cancelliere, A., Greco, R., and Bogaard, T. A.: Influence of uncertain identification of triggering rainfall on the assessment of landslide early warning thresholds, Nat. Hazards Earth Syst. Sci., 18, 633–646, https://doi.org/10.5194/nhess-18-633-2018, 2018.
Postance, B., Hillier, J., Dijkstra, T., and Dixon, N.: Comparing threshold definition techniques for rainfall-induced landslides: A national assessment using radar rainfall, Earth Surf. Proc. Land., 43, 553–560, https://doi.org/10.1002/ESP.4202, 2018.
Pumo, D., Carlino, G., Blenkinsop, S., Arnone, E., Fowler, H., and Noto, L. V.: Sensitivity of extreme rainfall to temperature in semi-arid Mediterranean regions, Atmos. Res., 225, 30–44, https://doi.org/10.1016/j.atmosres.2019.03.036, 2019.
Reder, A. and Rianna, G.: Exploring ERA5 reanalysis potentialities for supporting landslide investigations: a test case from Campania Region (Southern Italy), Landslides, 18, 1909–1924, https://doi.org/10.1007/S10346-020-01610-4, 2021.
Rencher, A. C.: Multivariate statistical inference and applications, Wiley-Interscience, ISBN 10 0471571512, 1998.
Roccati, A., Faccini, F., Luino, F., Ciampalini, A., and Turconi, L.: Heavy rainfall triggering shallow landslides: A susceptibility assessment by a GIS-approach in a Ligurian Apennine catchment (Italy), Water, 11, 605, https://doi.org/10.3390/w11030605, 2019.
Roccati, A., Paliaga, G., Luino, F., Faccini, F., and Turconi, L.: Rainfall threshold for shallow landslides initiation and analysis of long-term rainfall trends in a mediterranean area, Atmosphere, 11, 1367, https://doi.org/10.3390/atmos11121367, 2020.
Segoni, S., Piciullo, L., and Gariano, S. L.: A review of the recent literature on rainfall thresholds for landslide occurrence, Landslides, 15, 1483–1501, https://doi.org/10.1007/s10346-018-0966-4, 2018a.
Segoni, S., Rosi, A., Lagomarsino, D., Fanti, R., and Casagli, N.: Brief communication: Using averaged soil moisture estimates to improve the performances of a regional-scale landslide early warning system, Nat. Hazards Earth Syst. Sci., 18, 807–812, https://doi.org/10.5194/nhess-18-807-2018, 2018b.
SIAS – Servizio Informativo Agrometeorologico Siciliano (Sicilian Agro-meteorological Information Service): Dati meteorologici (Meteorological data), SIAS [data set], http://www.sias.regione.sicilia.it/, last access: 16 January 2023.
Sim, K. B., Lee, M. L., and Wong, S. Y.: A review of landslide acceptable risk and tolerable risk, Geoenviron. Disast., 9, 3, https://doi.org/10.1186/s40677-022-00205-6, 2022.
Staley, D. M., Kean, J. W., Cannon, S. H., Schmidt, K. M., and Laber, J. L.: Objective definition of rainfall intensity-duration thresholds for the initiation of post-fire debris flows in southern California, Landslides, 10, 547–562, https://doi.org/10.1007/s10346-012-0341-9, 2013.
Sultana, N.: Analysis of landslide-induced fatalities and injuries in Bangladesh: 2000–2018, Cogent Soc. Sci. 6, 1737402, https://doi.org/10.1080/23311886.2020.1737402, 2020.
Thomas, M. A., Mirus, B. B., and Collins, B. D.: Identifying Physics-Based Thresholds for Rainfall-Induced Landsliding, Geophys. Res. Lett., 45, 9651–9661, https://doi.org/10.1029/2018GL079662, 2018.
Thomas, M. A., Collins, B. D., and Mirus, B. B.: Assessing the Feasibility of Satellite-Based Thresholds for Hydrologically Driven Landsliding, Water Resour. Res., 55, 9006–9023, https://doi.org/10.1029/2019WR025577, 2019.
Trewartha, G. T.: An introduction to climate, 4th edn., McGraw-Hill, New York, 408 pp., ISBN 10 0070651523, 1968.
Uwihirwe, J., Riveros, A., Wanjala, H., Schellekens, J., Sperna Weiland, F., Hrachowitz, M., and Bogaard, T. A.: Potential of satellite-derived hydro-meteorological information for landslide initiation thresholds in Rwanda, Nat. Hazards Earth Syst. Sci., 22, 3641–3661, https://doi.org/10.5194/nhess-22-3641-2022, 2022.
Venturella, G.: Climatic and pedological features of Sicily, Bocconea, 17, 47–53, 2004.
Wicki, A., Lehmann, P., Hauck, C., Seneviratne, S. I., Waldner, P., and Stähli, M.: Assessing the potential of soil moisture measurements for regional landslide early warning, Landslides, 17, 1881–1896, https://doi.org/10.1007/s10346-020-01400-y, 2020.
Wicki, A., Jansson, P.-E., Lehmann, P., Hauck, C., and Stähli, M.: Simulated or measured soil moisture: which one is adding more value to regional landslide early warning?, Hydrol. Earth Syst. Sci., 25, 4585–4610, https://doi.org/10.5194/hess-25-4585-2021, 2021.