the Creative Commons Attribution 4.0 License.
the Creative Commons Attribution 4.0 License.
 | 20 Jan 2023
Comparison of estimated flood exposure and consequences generated by different event-based inland flood inundation maps
Joseph L. Gutenson
Ahmad A. Tavakoly
Mohammad S. Islam
Oliver E. J. Wing
William P. Lehman
Chase O. Hamilton
Mark D. Wahl
T. Christopher Massey
The flooding brought about by compound coastal flooding events can be devastating. Before, during, and immediately following these events, flood inundation maps (FIMs) can provide essential information to emergency management. However, there are a number of frameworks capable of estimating FIMs during flood events. In this article, we evaluate FIMs derived from three such frameworks in the context of Hurricane Harvey. Our analysis reveals that each of the three FIM frameworks provides different FIMs that differ in their level of accuracy. Each of the three FIMs also produces different exposure and consequence estimates because of their spatial differences. This investigation highlights the need for a centralized means of vetting and adjudicating multiple FIMs during compound flood events empowered by the ability to distribute FIMs as geographic information system (GIS) services and coalesce FIMs into a common operating picture. Furthermore, we provide evidence that the ability to produce multi-model estimates of FIMs to create probabilistic FIMs may provide a better product than the use of a lone FIM.
- Article
(3527 KB) - Full-text XML
- BibTeX
- EndNote


Each year, tropical storms devastate portions of the coastal United States. From 1980–2020, tropical storms accounted for USD 945.9 billion in damages with an average of USD 21.5 billion in damages per event (Fast Facts, 2021). Tropical storms bring strong winds and heavy rainfall that are the primary drivers of compound flooding. Strong winds and high tide create storm surge, pushing coastal waters inland and inundating land that is typically dry. Inland, heavy rainfall leads to direct runoff and saturation excess runoff from the land surface into inland waterbodies. The combination of inland runoff and storm surge creates compound coastal flooding. Recent studies highlight how the combination of inland drainage and coastal surge is important in properly estimating compound floods (Gori et al., 2020; Loveland et al., 2021).
In order to inform emergency managers and the public at large, agencies such as the National Oceanic and Atmospheric Administration's (NOAA's) National Weather Service (NWS), the U.S. Army Corps of Engineers (USACE), the Federal Emergency Management Agency (FEMA), and the U.S. Geological Survey (USGS) produce authoritative flood inundation map (FIM) estimates for inland, coastal, and compound flood events. FIMs help emergency managers communicate situational awareness, devise response plans, and inform decision makers (NWS, 2012; IWRSS, 2013; Maidment, 2017; Longenecker et al., 2020). However, FIMs from each agency are typically different in terms of resolution and chosen hydraulic model. Further, non-authoritative FIMs can also be originate from a number of sources outside of the Integrated Water Resources Science and Services (IWRSS) consortium and the rest of the US federal enterprise. The disparate origins of FIMs can create unnecessary confusion and conflicted decision-making for decision makers.
A number of frameworks and methodologies exist to create accurate FIMs. For inland fluvial flooding, NOAA's National Water Center (NWC) co-developed and implemented the height above nearest drainage (HAND) inundation model that uses Manning's equation to precompute inundation libraries to couple with hydrologic forecasts from the National Water Model (NWM) (Liu et al., 2018; Zheng et al., 2018; Viterbo et al., 2020). The HAND methodology requires a minimal number of input data that are available over large geographic scales. Alternatively, USACE developed the AutoRoute model that functions in a similar manner to the NWC's HAND implementation, requiring minimal inputs, which makes it capable of producing flood inundation maps over continental-scale geographic extents (Follum, 2013; Follum et al., 2016, 2020; Tavakoly et al., 2021). HAND and/or AutoRoute perform well as first-order approximations of fluvial flooding (Afshari et al., 2018; Johnson et al., 2020). However, these low-complexity models do possess less skill when compared to higher-fidelity hydraulic models (Hocini et al., 2021). One of the more notable limitations of steady-state inland models such as HAND and AutoRoute is in coastal watersheds. HAND and AutoRoute are fluvial-only flood models, and their FIMs do not inherently contain the pluvial or coastal components of flooding. Further, coastal watersheds tend to have minimal topographic relief where one-dimensional (1D) models, such as HAND and AutoRoute, traditionally struggle to produce accurate flood inundation maps. Low topographic relief tends to create backwater effects that AutoRoute cannot account for (Follum et al., 2016, 2020). Further, where topographic relief is low, HAND can be sensitive to errors in the underlying terrain (Johnson et al., 2020). Thus, steady-state hydraulic models, such as HAND and AutoRoute, tend to have limited effectiveness in providing FIMs during compound coastal floods in coastal watersheds. However, non-operational alternative HAND approaches for coastal flooding in low-lying areas exist (Jafarzadegan et al., 2022).
For coastal flooding, NOAA's National Hurricane Center (NHC) produces FIMs that estimate coastal flooding from storm surge using the Sea, Lake, and Overland Surges from Hurricanes (SLOSH) model (Jelesnianski et al., 1984; Experimental Potential Storm Surge Flooding Map, 2022). The Coastal Emergency Risks Assessment (CERA) team creates coastal-flooding-only FIMs using the ADvanced CIRCulation (ADCIRC) model (Luettich et al., 1992; About, 2022). However, these modeling frameworks do not currently include a coupling with inland runoff.
In response to the limitations of existing fluvial and coastal FIM frameworks, Wing et al. (2019) use the Fathom-US large-scale hydraulic modeling framework (Wing et al., 2017) to perform FIM estimation for Hurricane Harvey. The Wing et al. (2017) framework can account for coastal, fluvial, and pluvial flooding. Wing et al. (2019) compare the Fathom-US flood inundation results to the NWC HAND methodology. Wing et al. (2019) find that the Fathom-US framework is more accurate than the NWC HAND methodology for the Hurricane Harvey simulations due to better representation of the complex physics that occur during compound coastal floods. The Fathom-US FIM framework represents a continental approach to FIM development that integrates the primary mechanisms that drive flooding and exists outside of the US federal enterprise.
Beyond the large-scale modeling frameworks such as NWC HAND or Fathom-US, there are local-scale compound flood models in data-rich environments that can have higher spatiotemporal resolution and are capable of producing FIMs that combine coastal, fluvial, and pluvial flooding. For example, the USACE Modeling, Mapping, and Consequences (MMC) Production Center will work with local USACE districts and divisions to create and distribute FIMs during flood events using existing Corps Water Management System (CWMS) model frameworks or will develop new FIM frameworks on the fly (Winders et al., 2018). The simulation times of these frameworks can be a hindrance in their ability to produce a timely FIM. However, these models can provide a benchmark for what is achievable with increased model fidelity and resolution. Further, we may be able to more effectively utilize these high-fidelity simulations for FIMs through surrogate modeling techniques (Bass and Bedient, 2018; Zahura et al., 2020; Contreras et al., 2020; Kyprioti et al., 2021), similarly to how NWC HAND and Fathom-US utilize a precomputed riverine hydraulics in those implementations (Zheng et al., 2018; Wing et al., 2019).
This paper investigates if different inland flood inundation mapping frameworks produce substantially different FIMs during compound coastal flood events. We evaluate and quantify the differences by using a Hurricane Harvey case study where a recently developed local-scale framework exists and compare this to the AutoRoute and Fathom-US frameworks. Hurricane Harvey is a now infamous compound flood event brought about by a combination of wet antecedent conditions, heavy inland rainfall, and sustained high water levels at the coast (Valle-Levinson et al., 2020). Given differences in the accuracy and resolution of model inputs, the assumption is that the local-scale framework produces a more accurate FIM than the continental-scale FIM frameworks produce. Further, given that AutoRoute cannot account for backwater effects, we expect it to be the least accurate FIM framework. Our comparison of the three frameworks centers on the spatial differences in each FIM and if those differences lead to differences in estimated exposure and consequences. To our knowledge, this is the first evaluation of FIMs produced with different FIM frameworks that seeks to evaluate differences in the FIMs by examining both the spatial differences in the FIMs and the estimated exposure and consequences from those FIMs.
We center our analysis on the Clear Creek watershed, south of Houston, Texas. As part of a recent effort by League City, Texas, Freese and Nichols, Inc. developed a local-scale FIM framework for the Clear Creek area (Freese and Nichols, Inc., 2021), making the region an ideal study domain to test multiple FIM frameworks. Figure 1 demonstrates the location of the Clear Creek watershed that covers an area of roughly 698.91 km2. The region has a history of repeated flooding, including flooding during Hurricane Harvey, and is subject to rapid development and urbanization (Brody et al., 2018).
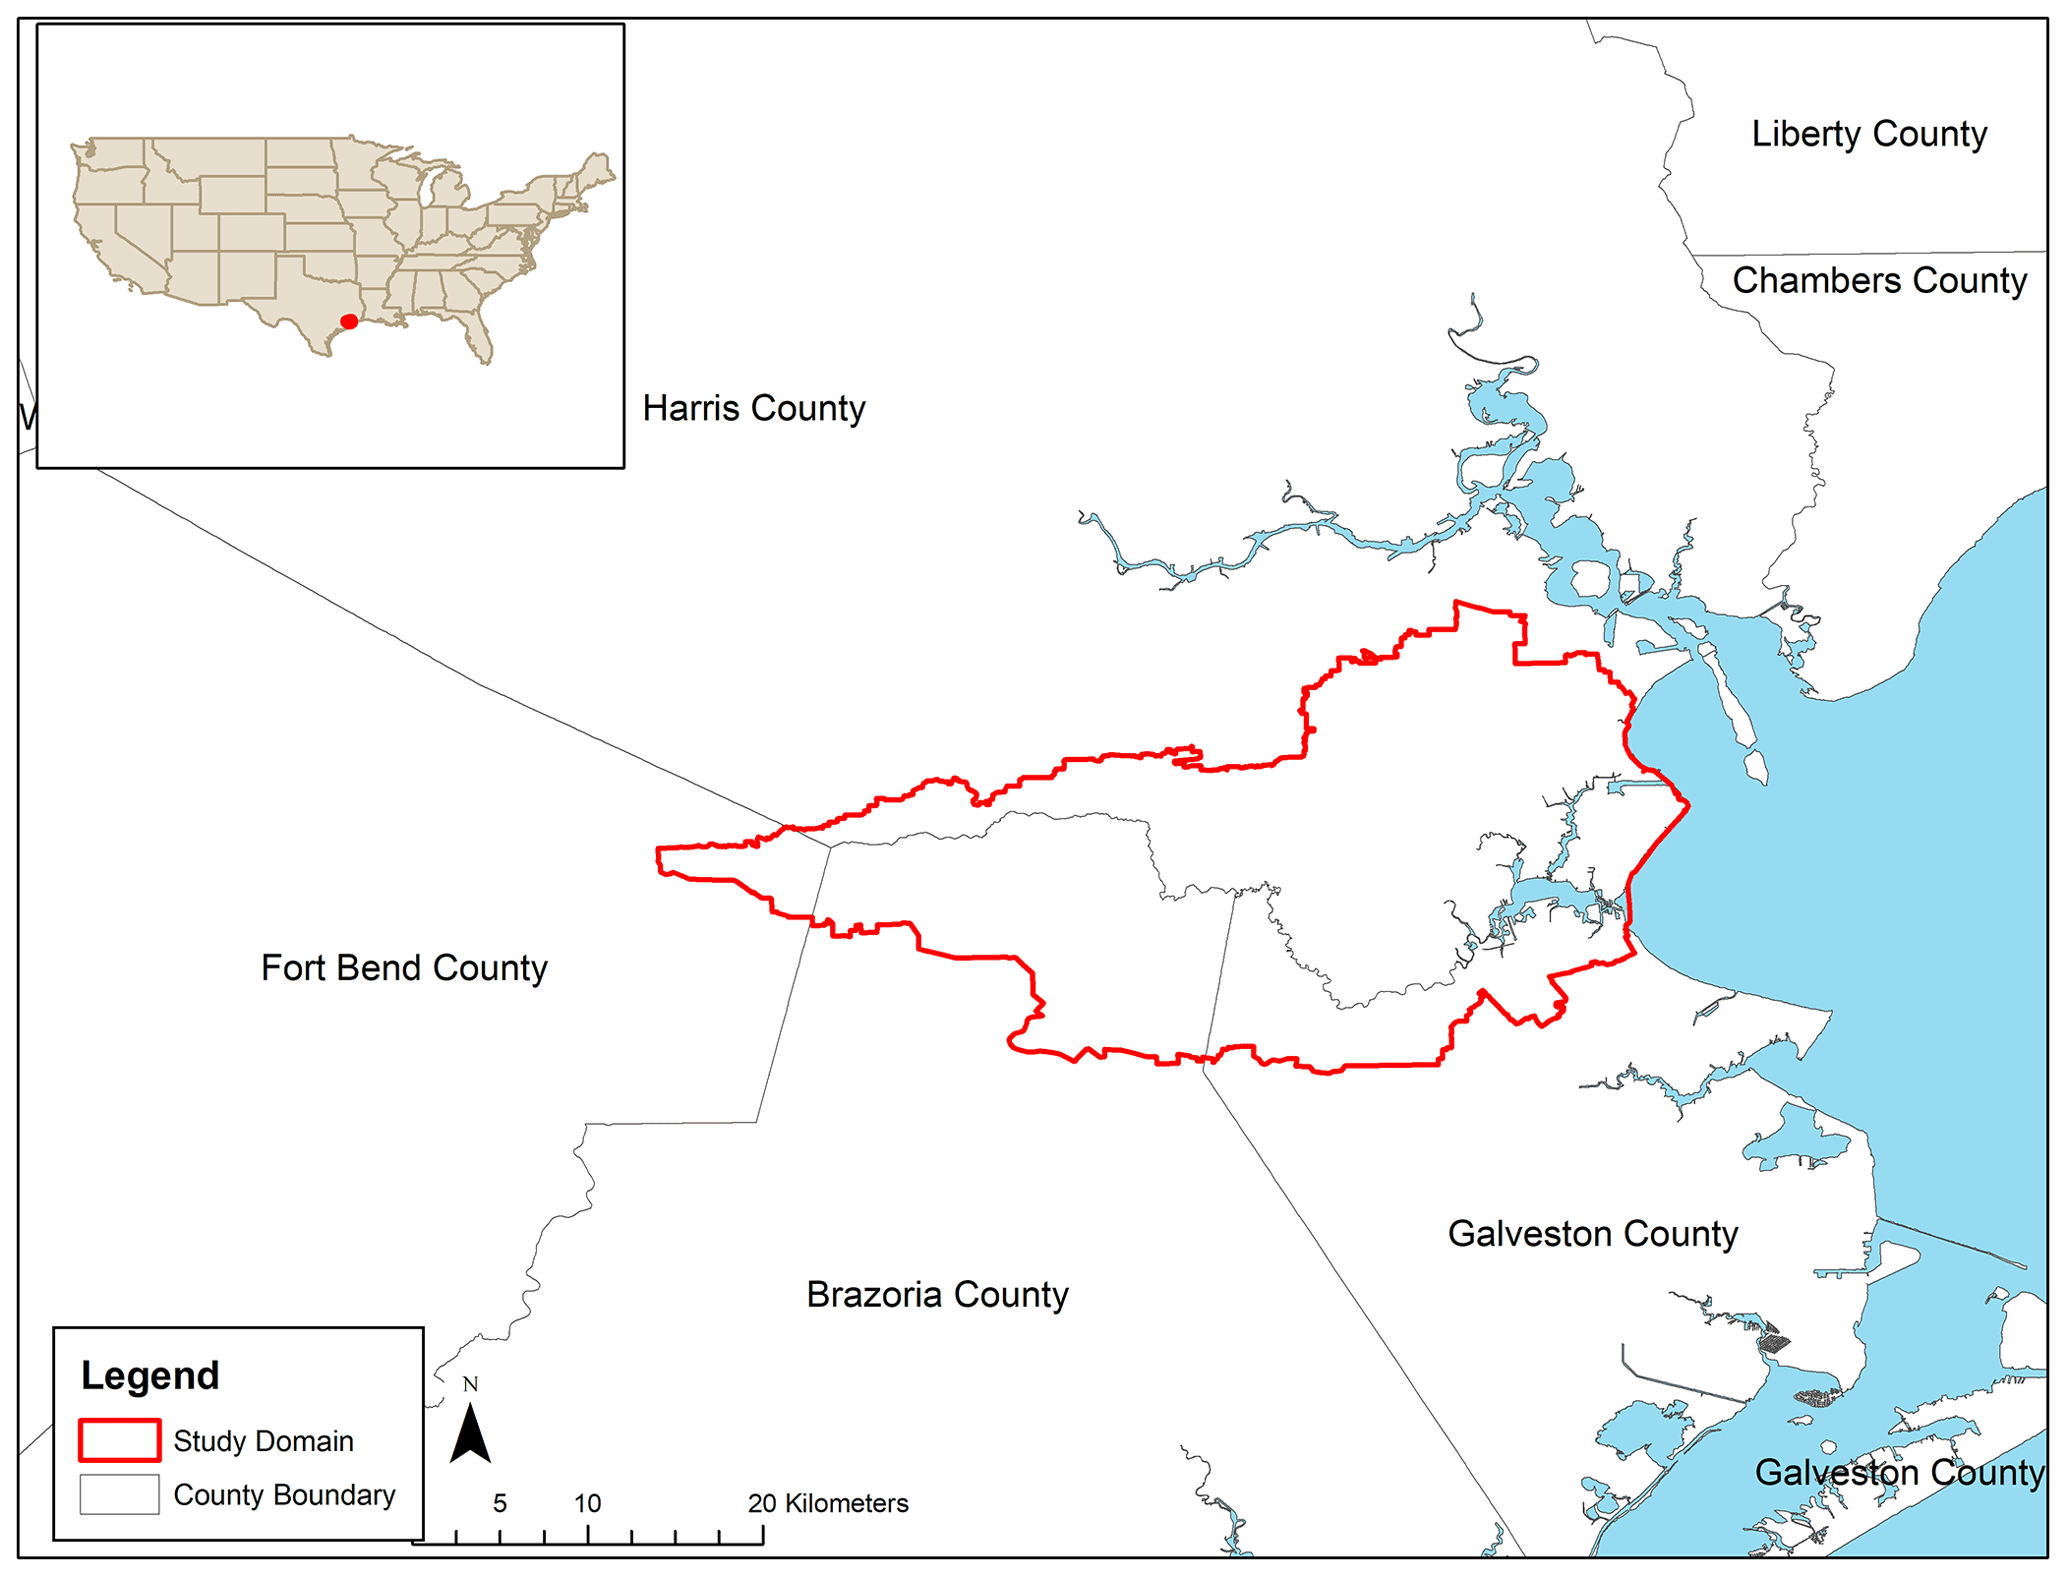
Figure 1The Clear Creek watershed test domain for this study spans portions of four counties in Texas. Sources of the background imagery include Esri, TomTom, the U.S. Department of Commerce, and the Census Bureau.
2.1 Modeling-framework configurations
We performed our analysis by creating maximum-inundation-extent FIMs produced by three frameworks in the study domain: the previously mentioned local-scale Hydrologic Engineering Center River Analysis System (HEC-RAS) framework, the AutoRoute framework, and the Fathom-US framework. Figure 2 illustrates the inputs for each modeling framework. This section describes each framework in detail and spells out the abbreviations present in Fig. 2. We utilized only observed meteorological and coastal data to ensure that limitations in forecast skill are not present.
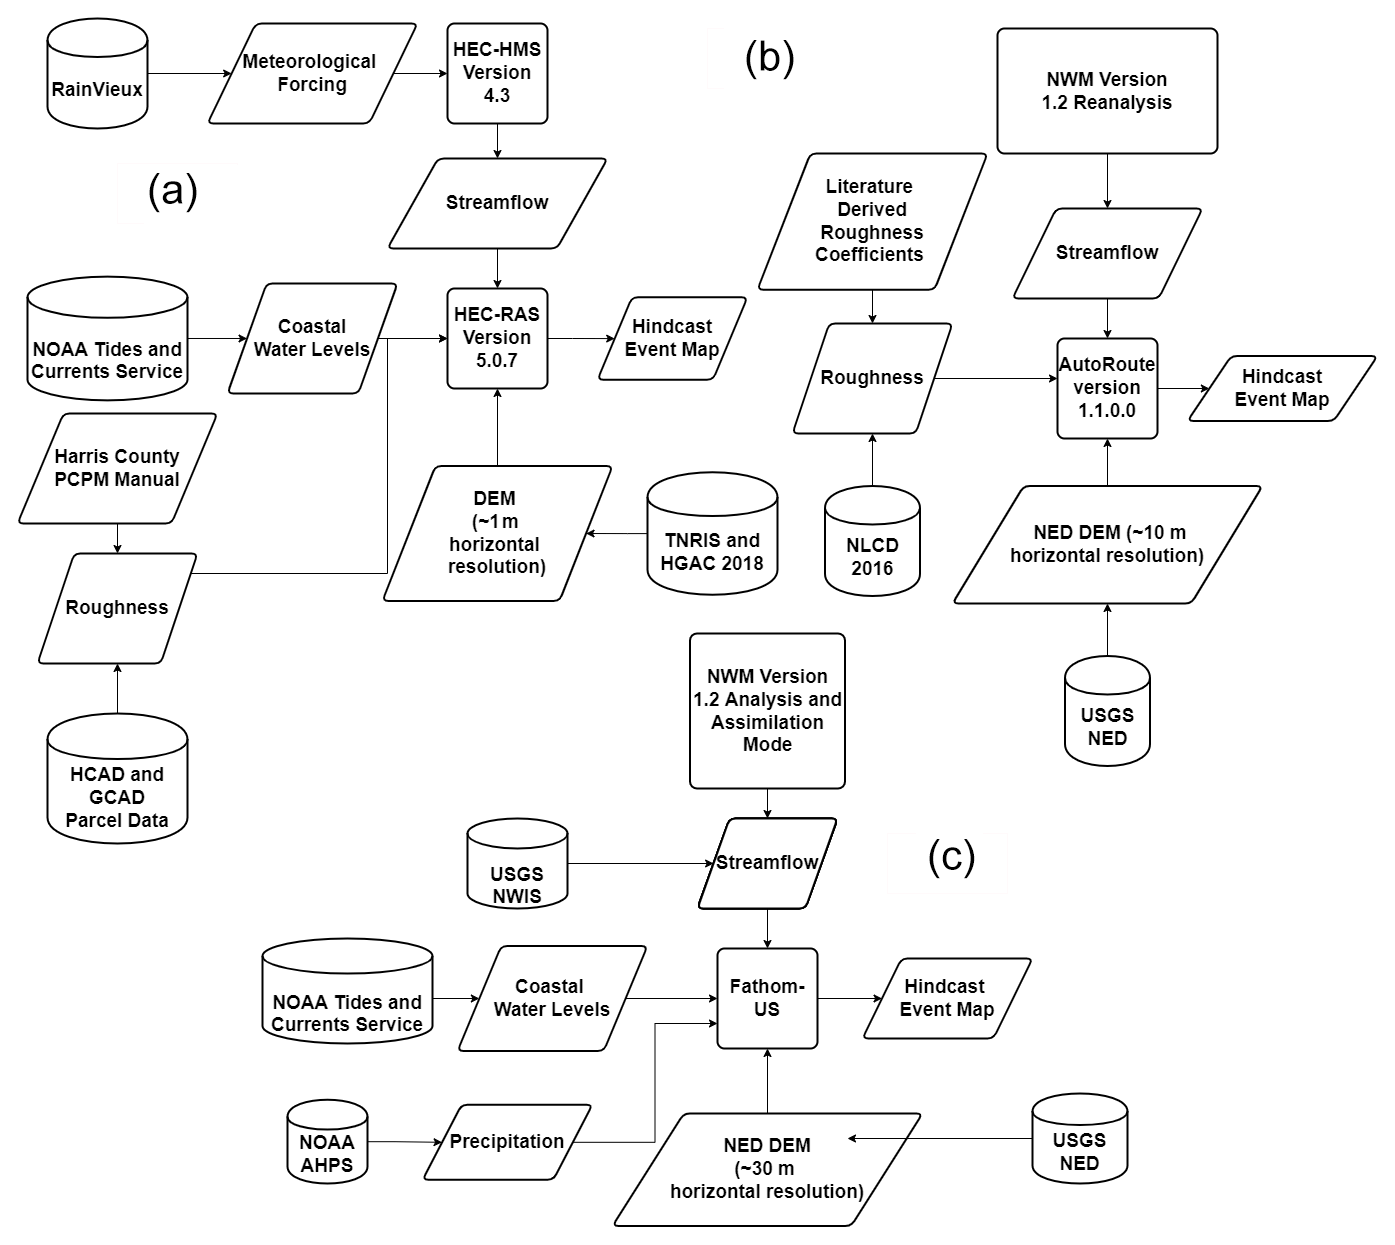
Figure 2System flowchart for each of the FIM modeling frameworks that we compare in this study: (a) HEC-RAS modeling framework, (b) AutoRoute modeling framework, and (c) Fathom-US modeling framework.
As part of the flood mitigation plan for Lower Clear Creek and Dickinson Bayou, League City, Texas, contracted the construction of a HEC-RAS FIM framework to identify areas of concern in Lower Clear Creek and Dickinson Bayou (Freese and Nichols, Inc., 2021). In the HEC-RAS framework, the USACE Hydrologic Engineering Center Hydrologic Modeling System (HEC-HMS) version 4.3 model (Hydrologic Modeling System, 2018) simulates rainfall–runoff processes within the watershed. RainVieux radar- and gauge-derived precipitation data force the HEC-HMS model (RainVieux, 2022). HEC-RAS version 5.0.7 (HEC-RAS River Analysis System, 2019) simulates hydrodynamics conditions by utilizing one-dimensional (1D) unsteady routing in the main stem of Clear Creek and two-dimensional (2D) diffusive wave routing in the overland and tributaries of Clear Creek. The HEC-RAS 2D grid has an average horizontal cell resolution of about 3589 m2. Internal boundary conditions within the HEC-RAS model link HEC-HMS runoff estimates with the HEC-RAS simulation. The HEC-RAS model has a one-way coupling with the coast via downstream boundary conditions along the coast forced with a head value derived from nearby tidal gauge readings from NOAA's Tides and Currents dataset (NOAA Tides & Currents, 2021). Lidar data obtained from the Texas Natural Resources Information System (TNRIS) and Houston-Galveston Area Council (HGAC) of governments provide the HEC-RAS model with an approximately 1 m horizontal resolution terrain (StratMap, 2023). The Harris County Policy, Criteria, and Procedures Manual (PCPM) provides the 1D roughness coefficients. These 1D roughness coefficient values are consistent with recognized and accepted engineering standards. Land use estimates derived from Galveston Central Appraisal District (GCAD) and Harris County Appraisal District (HCAD) parcel data and early calibration/testing efforts by the contracted model developer estimate roughness coefficients for all 2D areas. Hurricane Harvey and the 2016 Tax Day floods (Nielsen and Schumacher, 2020) calibrate the hydrologic and hydraulic components of the HEC-RAS framework (Freese and Nichols, 2021).
Across the same domain and for the same tropical storm, we develop an AutoRoute estimate of the FIM using the AutoRoute framework. We do not calibrate the AutoRoute framework for Hurricane Harvey, but the methodology we employ, the AutoRAPID approach (Follum et al., 2016), has been repeated for several flood event studies. We acquire streamflow forcing data from NWM version 1.2 via Amazon Web Services (NOAA, 2018). The maximum discharge simulated by the NWM then pairs with the associated National Hydrography Dataset Plus (NHDPlus) version 2.0 medium-resolution stream reach shapefile (US EPA, 2019a). For topography, we acquire arcsec (∼9 m) horizontal resolution National Elevation Dataset (NED) digital elevation model (DEM) data (Gesch et al., 2002, 2010) for the study area. The 2016 collection of the National Land Cover Database (NLCD; Yang et al., 2018) and literature-derived roughness coefficients as described in Follum et al. (2016, 2020) provide estimates of surface roughness. Because the chosen DEM does not contain bathymetry, we implement the simple bathymetric estimation methodology within AutoRoute (Follum et al., 2020) by using the gauge-adjusted Enhanced Unit Runoff Method (EROM) mean annual flows (US EPA, 2019b). The setup of the AutoRoute framework is a representative workflow for implementing a large-scale, steady-state hydraulic model for FIM development.
The Fathom-US framework accounts for fluvial, pluvial, and storm surge flooding within one comprehensive framework. Wing et al. (2017, 2019) provide the specifications of the model setup. Observed precipitation data from NOAA's Advanced Hydrologic Prediction Service (AHPS) feed into the Fathom-US model to account for pluvial flooding. NWM version 1.2 analysis and assimilation streamflow estimates and USGS National Water Information System (NWIS) streamflow produce fluvial flooding. The Fathom-US model simulates interactions between inland and coastal waters by using streamflow data from the combination of the NWM and NWIS and observed water levels from the NOAA Tides and Currents service. The observed NOAA Tides and Currents data are input as a downstream boundary condition into the Fathom-US framework at oceanic computation cells, just offshore from coastal flood defenses (Wing et al., 2019).
Although the list of FIM frameworks we analyze in this work is not exhaustive, the sample of FIM frameworks effectively highlights if differences in FIMs are substantial enough to create differences in estimated exposure and consequences. Differences in estimated exposure and consequences provide evidence that a centralized vetting and adjudication process is necessary for FIMs during flood events.
2.2 Evaluation methods
We perform two layers of analysis in our assessment to ascertain key differences between each of the three FIMs. We summarize the analysis of FIM in the Fig. 3 flowchart. The first analysis makes use of U.S. Geological Survey (USGS) high-water-mark (HWM) data collected following the devastation of Hurricane Harvey (Watson et al., 2018) and distributed by the USGS Flood Event Viewer (2021). The USGS did not produce an estimated inundation map for Clear Creek during Hurricane Harvey, so our comparison focuses on the location and water surface elevation (WSE) observed at HWMs. We assess locational accuracy for each FIM by determining the fraction of HWMs that are within the flood extents of the FIM.
In Eq. (1), Nw is the number of HWMs that are within the flooded extent of each FIM and N designates the number of HWMs.
Following the methodology outlined by Wing et al. (2021), we assess the estimated WSE from each framework by estimating error and bias.
In Eqs. (2) and (3), WSEmod designates the WSE at the inundated pixel nearest to each HWM location modeled by each FIM framework, and WSEobs designates the WSE observed at each HWM location.
The second analysis provides a comparison of exposure and consequence estimates from each FIM. To perform our exposure and consequence analysis, we utilize the go-consequences model and the National Structure Inventory (NSI) (USACE, 2021a, b, c). The NSI is a point-based structural inventory describing structures and structure occupancy throughout the United States. The NSI supports the assessment of consequences to structures resulting from natural and non-natural disasters by providing point-based estimates of a building's characteristics such as occupancy type, depreciated replacement cost, content value, and number of people (population) within the structure (USACE, 2021c). The go-consequences model uses the NSI to compute building damage and population exposure from flooding. It uses a water depth estimate at NSI point locations and uses the same default depth–damage functions as those used within the HEC Flood Impact Analysis (HEC-FIA) software and assigned by the USACE Economic Guidance Memorandum 04-01 (USACE, 2003). In this instance, our flood damage assessment does not adjust damage to account for brackish water damage (USACE, 2021b). To visualize the resulting point damage and exposure estimates, we used the point damage locations and their associated dollar damage and building population counts to construct kernel density maps in ArcGIS version 10.8 (Esri, 2022). The kernel density plots can provide a “hotspot” analysis for comparison to collected Federal Emergency Management Agency (FEMA) flood insurance claim locations (Arctur, 2021). We generate the kernel density maps using a 1 km search radius and output the resulting raster at 1 km horizontal resolution. This study does not pursue a direct comparison between NSI–go-consequences and observed exposure and consequence estimates either spatially or quantitatively. Direct comparison between NSI–go-consequences estimates and observations is problematic for a number of reasons. First, personally identifiable information (PII) limitations prevent FEMA from sharing disaggregated flood insurance claims with the authors. Second, there are complexities associated with flood insurance claims that make their use as a comparison metric difficult. Flood insurance uptake is approximately 25 %–100 % within our study area, varying significantly by county (Shao et al., 2017), and thus, flood insurance claims are likely unrepresentative of the total flood damage from Hurricane Harvey. However, even with 100 % insurance uptake, matching point observations of flood damage reported in flood insurance claims with NSI–go-consequences point estimates of flood damage is still problematic because the NSI does not necessarily have attributes, such as structure value, that match an individual building's insurance policy coverage. Furthermore, flood insurance coverage is truncated on the lower end by deductibles where losses are not recorded because no claim is made and on the upper end by policy caps where losses in excess of the policy may be truncated to the payout rather than the actual loss. Converting point estimates of exposure and damage to a kernel density map does allow us to visually reference if our estimated spatial pattern of exposure and damage matches our approximation of reality (e.g., insurance claim locations), allowing for an indirect comparison.
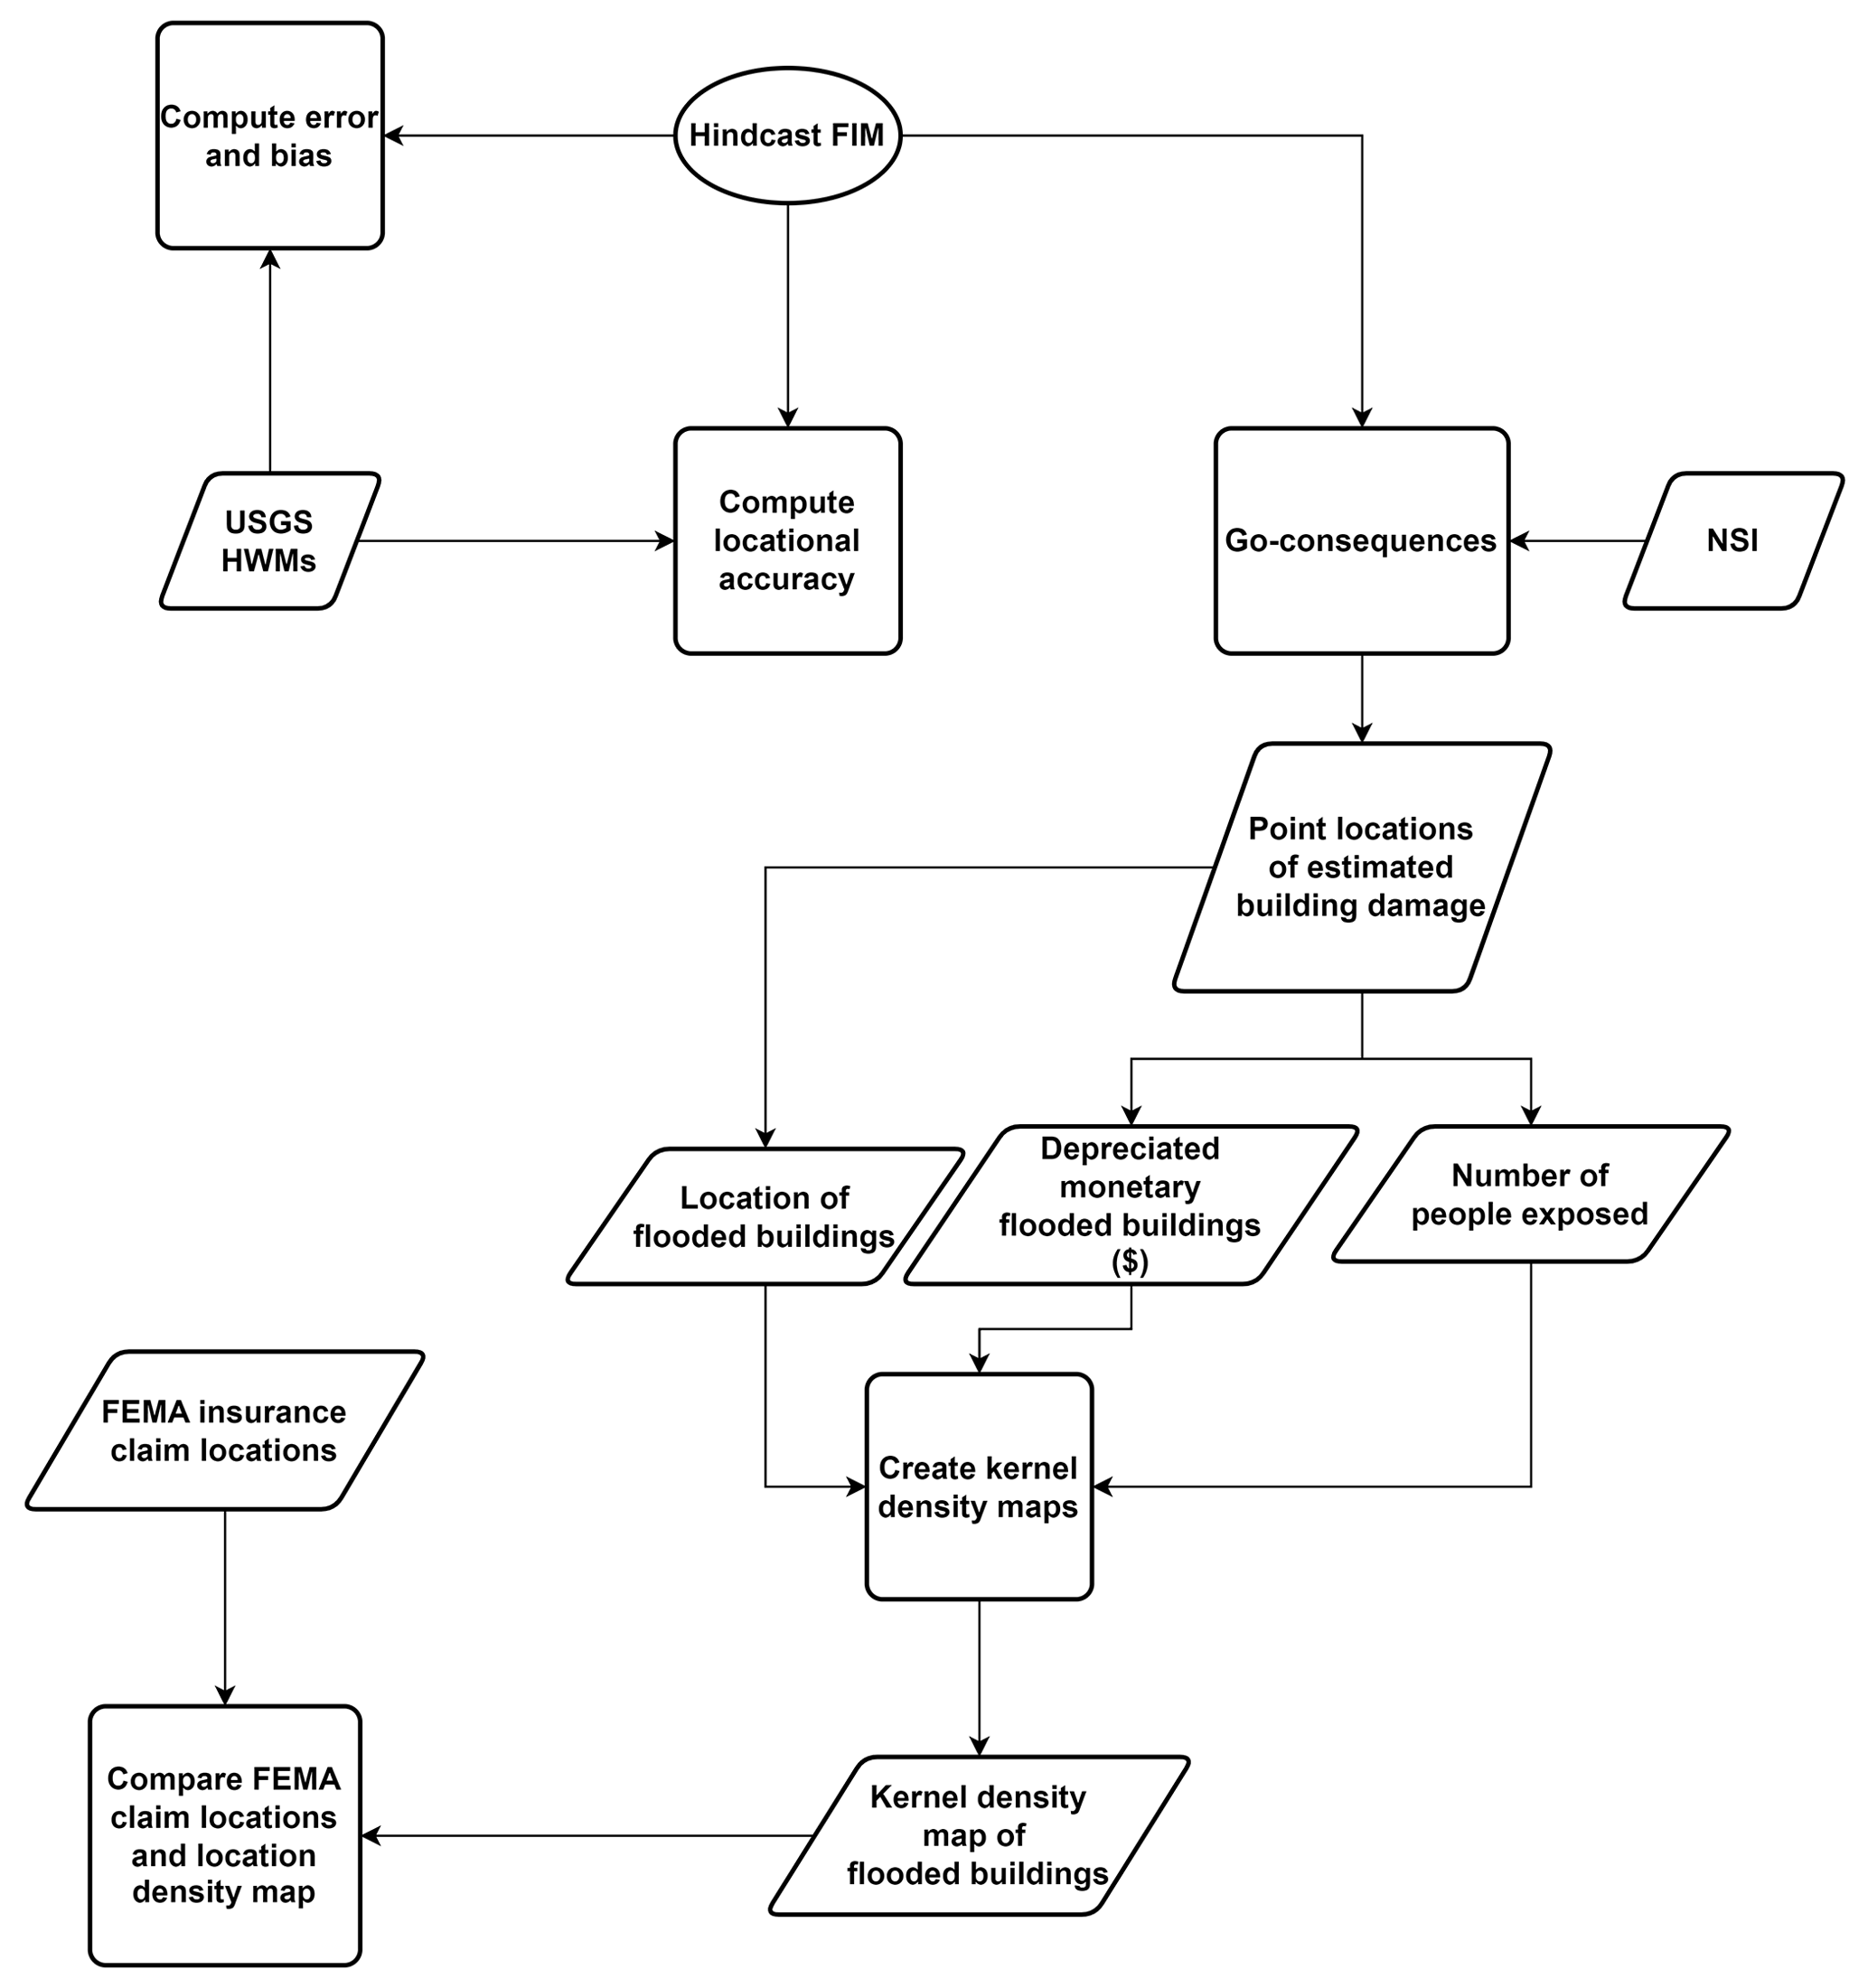
Figure 3Flow diagram describing the two-pronged evaluation process undertaken to examine the spatial differences in each FIM and the differences in exposure and consequences estimated by each FIM. The dollar symbol denotes US dollars.
3.1 Simulation comparison
We first compare the results from the HEC-RAS, AutoRoute, and Fathom-US frameworks to observed HWMs by estimating locational accuracy. HWMs designate locations where floodwater reaches a given location and leaves behind evidence of floodwater presence in the form of mud lines, seed lines, etc. (Koenig et al., 2016). The USGS quantifies the uncertainty in the HWM WSE measurements they collect. In our study domain, the USGS considers 53 % of HWMs in the study area poor quality, 34 % fair quality, and 13 % good quality. What these qualitative descriptors translate into quantitatively is an average of ±9 cm of uncertainty in the study domain HWM WSEs. All HWMs examined were sourced from either riverine (86 % of HWMs) or coastal (14 % of HWMs) flooding.
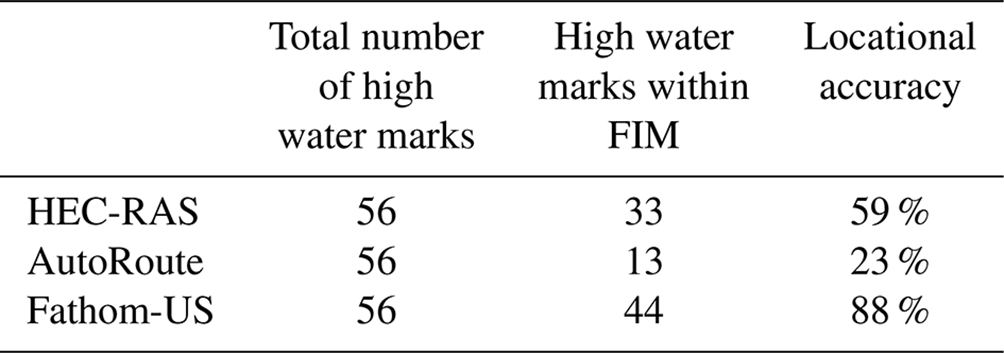
Each model's FIM should contain each HWM within its extent. Table 1 is an assessment of locational accuracy for each model under the assumption that the maximum inundation extent should contain the HWM locations. Interestingly, we can see that the Fathom-US model is more accurate at intersecting HWM locations within the inundation extent than both the AutoRoute and the HEC-RAS model. This result contradicts our assumption that the HEC-RAS model will be more accurate given the higher level of terrain resolution and calibration/validation performed upon the model.
Table 1Locational accuracy of each modeling-framework FIM based on the number of HWMs within the FIM flood extent.
However, expressing model skill in terms of locational accuracy has limited viability, given that the model could inundate the entire study area and achieve 100 % accuracy. Indeed, comparing the results from HEC-RAS, AutoRoute, and Fathom-US maximum water surface elevations (WSEs) to observed HWM WSEs reveals a different outcome. Figure 4 illustrates scatterplots comparing each FIM's WSE to HWM WSE observations, and Table 2 summarizes the error and bias of each framework. The orange line in all Fig. 4 plots is the desired 1:1 relationship between observation and model results, and the dotted line is the line of the best fit from a least-squares regression analysis. In Fig. 4 and Table 2, we see that the HEC-RAS framework produces more precise and accurate WSE estimates than both the AutoRoute and the Fathom-US frameworks with points tightly packed along the dotted regression line that aligns well with a 1:1 line and lower error value. The HEC-RAS framework is biased toward underestimation with a bias of −0.32 m, particularly at lower WSEs. The Fathom-US framework tends to overestimate WSE, with the regression line falling to the right of the 1:1 line and a positive bias of 0.60 m. The AutoRoute framework has a less consistent tendency than the HEC-RAS and Fathom-US frameworks. With only 23 % of HWM locations falling within the inundated area, AutoRoute appears to underestimate inundated area. However, the AutoRoute FIM is biased toward significant overestimation with large overpredictions illustrated in Fig. 4. Injecting each USGS HWM's WSE measurement uncertainty into our error analysis, we find that USGS measurement uncertainty in the HWM WSEs translates into an average of about a ±1 cm difference in errors reported in Table 2. Overall, the performance of the HEC-RAS and Fathom-US frameworks is better than that of the AutoRoute framework. We expected the AutoRoute FIM to underperform in this scenario given the relatively simple numerical scheme that includes a steady-state assumption, a lack of pluvial flooding, and a lack of contribution of coastal water levels into the FIM.
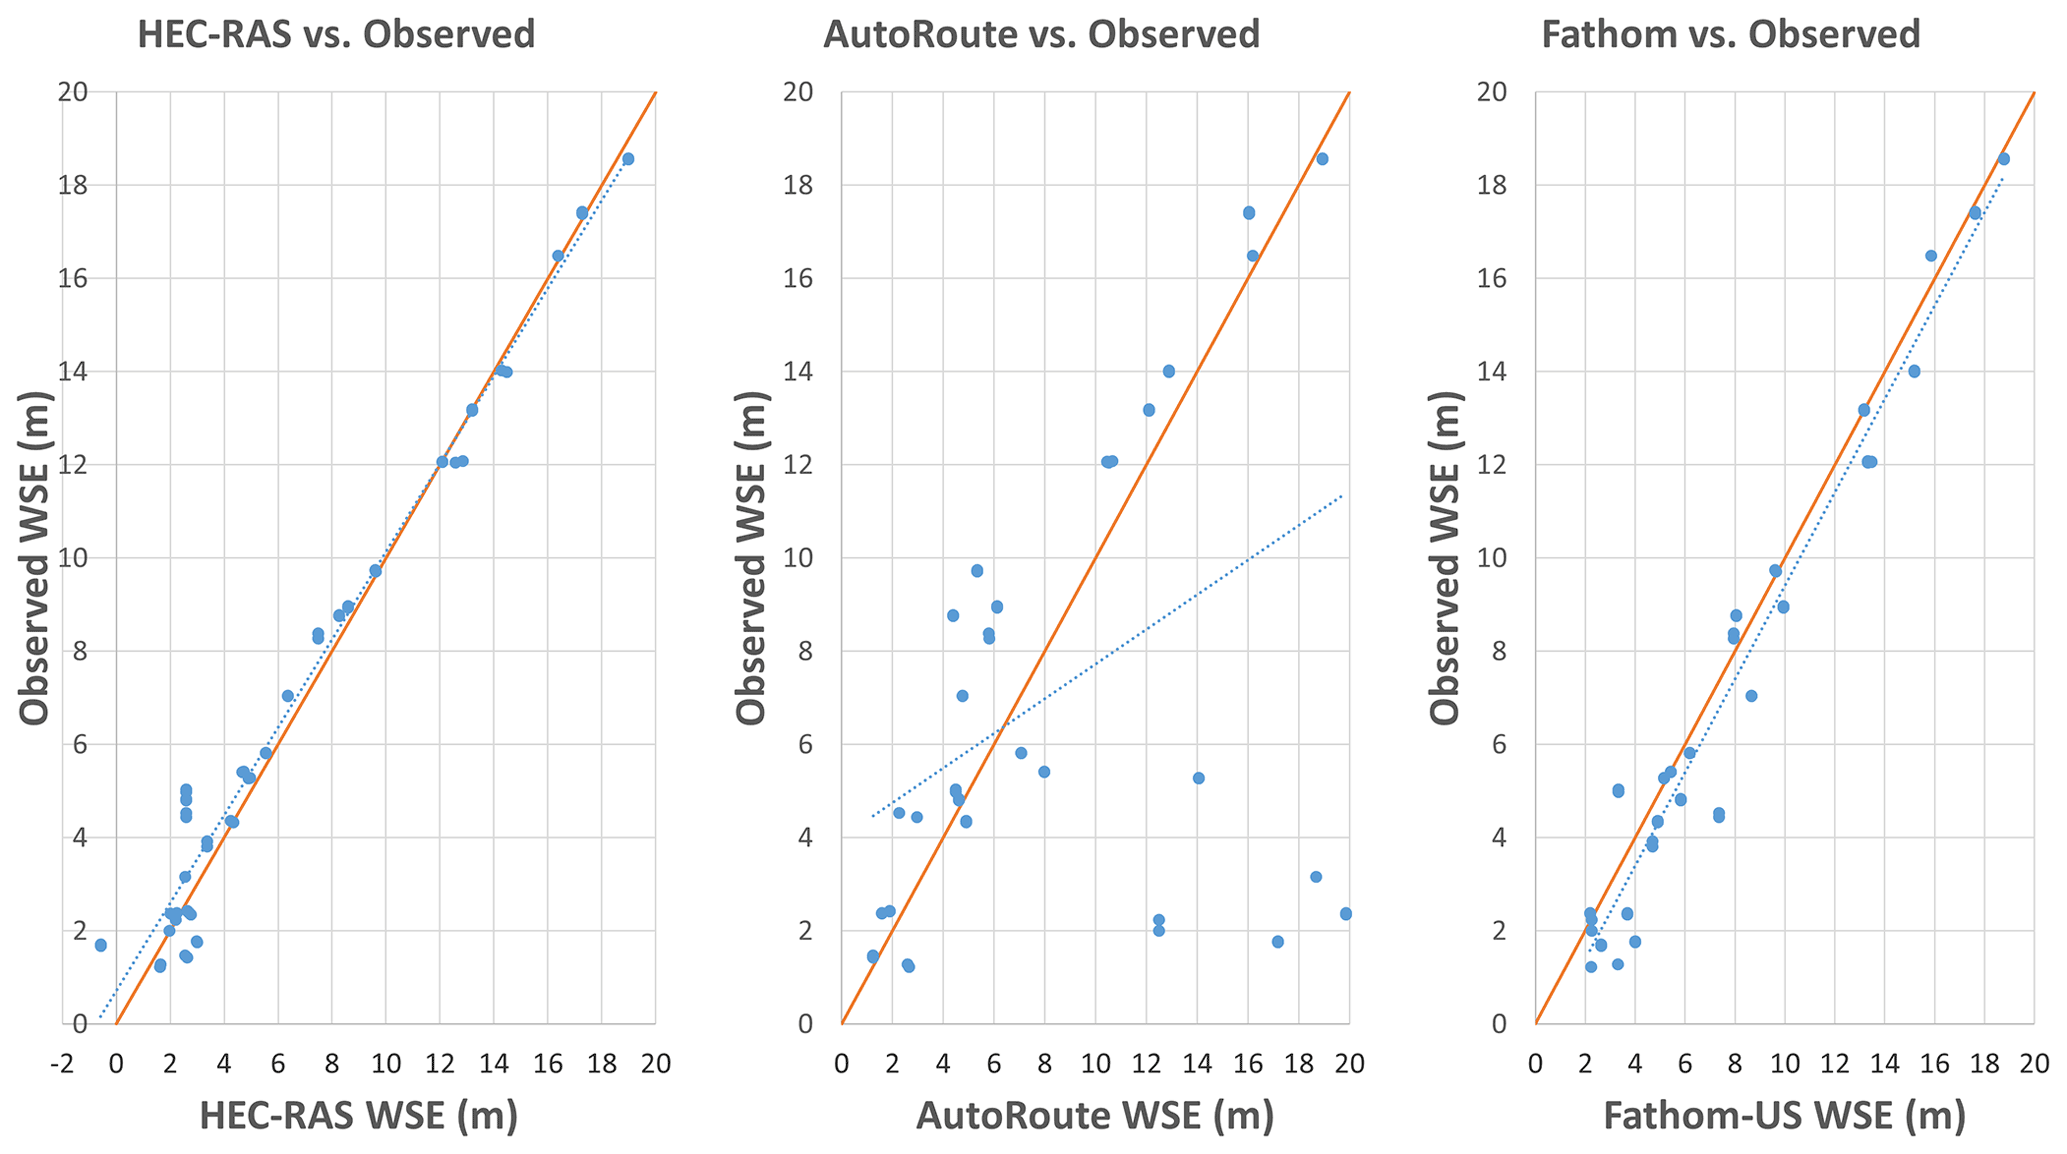
Figure 4Scatterplot comparing simulated and observed WSEs for Hurricane Harvey. Here, each blue dot represents an observed HWM location, the orange line represents a 1:1 perfect fit, and the dotted blue line is the line of best fit between the observed and simulated WSE at the HWM locations.
Table 2Error and bias computed for each FIM framework using observed HWM WSE.
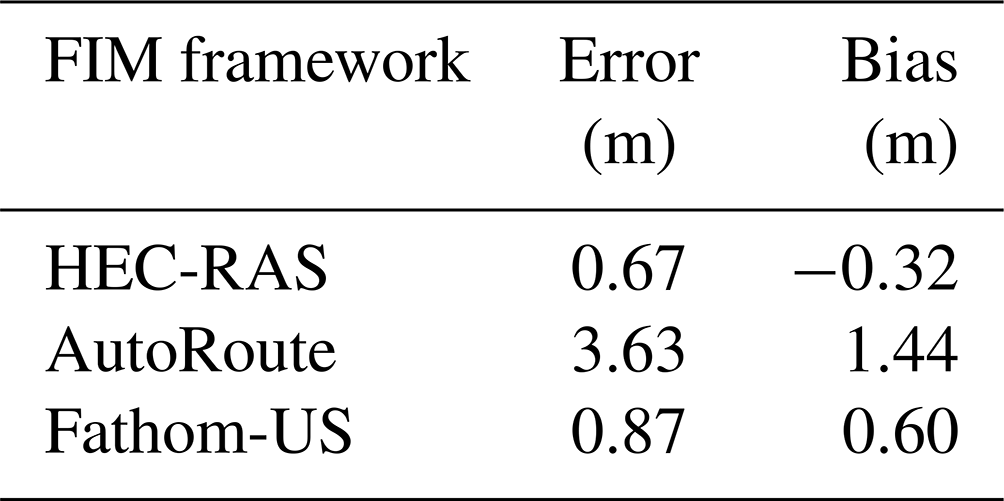
Figure 5 illustrates the FIMs created by HEC-RAS, AutoRoute, and Fathom-US along with HWM WSE comparisons with observations for each FIM. HWMs colored in shades of grey are locations where the FIM overpredicts WSE; those colored red represent underprediction by each FIM; locations colored white are within ±0.5 m for the FIM WSE. The HEC-RAS and Fathom-US FIMs are more similar to one another than the AutoRoute FIM is to either. However, we do see that the HEC-RAS framework underestimates WSE in the northeast section of the study area, while the Fathom framework overestimates WSE and estimates greater inundation extents in the northeast when compared to the HEC-RAS framework. The AutoRoute framework underestimates WSE inland and overestimates WSE closer to the coast. Overall, we see that the FIMs created by each framework are unique to the framework in terms of both model error and overall flood inundation.

Figure 5Maps comparing FIMs from each modeling framework and differences between simulated and observed WSE: (a) HEC-RAS, (b) AutoRoute, and (c) Fathom-US. Each point location is an observed USGS HWM location, and the colors represent the magnitude of difference between observed and simulated WSE. The blue region represents the flood inundation depths for each FIM.
3.2 Causes of framework differences and uncertainty
In general, we see the HEC-RAS, AutoRoute, and Fathom-US frameworks generate spatially different FIMs and that each is an imperfect representation of reality. The HEC-RAS FIM appears to underestimate WSE and only captures 59 % of HWMs within its flood extent. The Fathom-US FIM not only captures a higher proportion of HWMs in its extent than the other two frameworks but also appears to overestimate WSE and has greater error and bias than the HEC-RAS framework FIM. The AutoRoute FIM WSE is a mix of underestimation and overestimation of WSE. As expected, the magnitudes of error, in terms of WSE, are generally higher for the AutoRoute and Fathom-US models than the HEC-RAS results as they are both large-scale frameworks. The HEC-RAS and Fathom-US results appear to be a more accurate representation of flooding than those of the AutoRoute framework. Here we explore the major drivers of differences and uncertainty among the estimated FIMs.
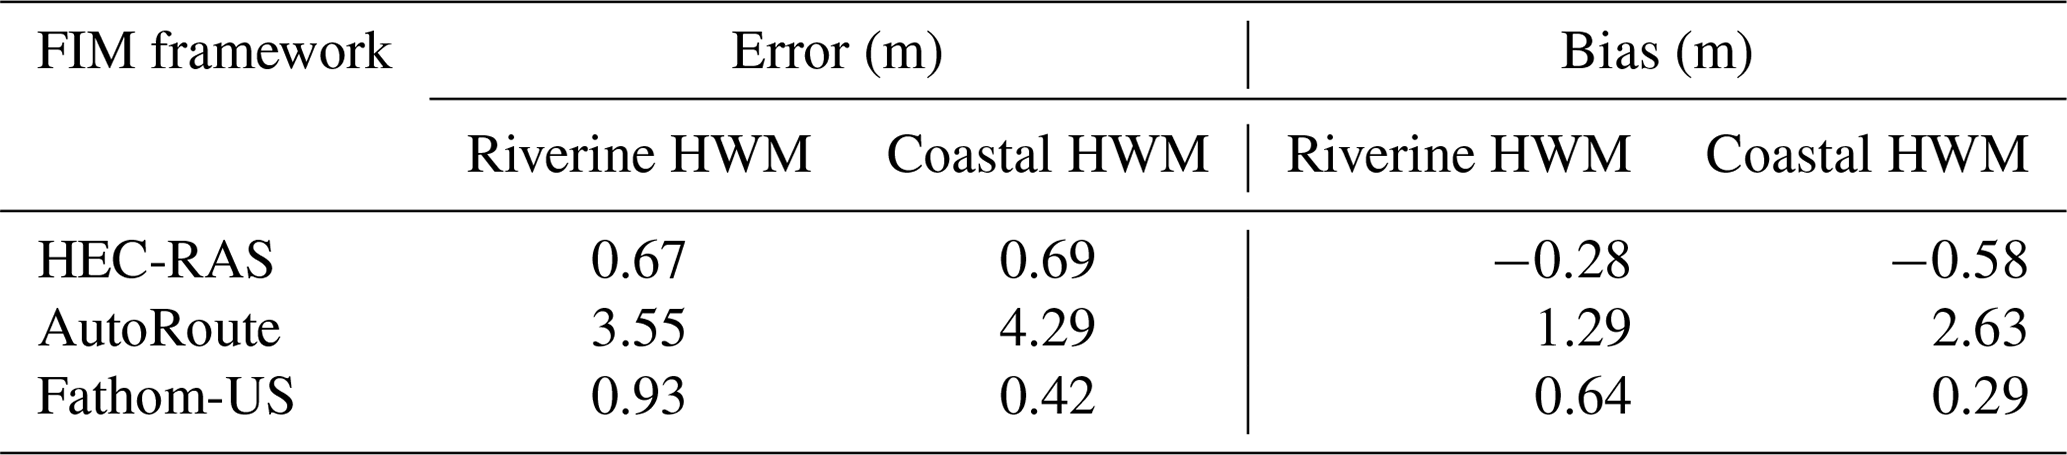
One of the major differences of the AutoRoute framework from the HEC-RAS and Fathom-US frameworks is the missing coastal component of the FIM. AutoRoute has proven capable in a variety of inland scenarios (Follum et al., 2016, 2020) and when compared to higher-resolution inland models (Afshari et al., 2018). However, it appears that the simplified physics in our AutoRoute simulation do not effectively accommodate the complex physical interactions that occur during this compound coastal flood. In our case study, the AutoRoute FIM underpredicts WSE but is also prone to large outliers of overestimation in WSE estimation. Table 3 describes the WSE HWM error and bias after we split the data between riverine and coastal HWMs. As we expected, the HEC-RAS and Fathom-US frameworks outperform the AutoRoute framework in terms of error, particularly at coastal HWMs. HEC-RAS and AutoRoute WSEs are more accurate at riverine HWMs than at coastal HWMs, while Fathom-US is more accurate at coastal HWMs. At both riverine and coastal HWMs, HEC-RAS WSEs are biased low, further explaining why the HEC-RAS FIM inundates fewer HWMs. Interestingly, Fathom-US WSE outperforms HEC-RAS in terms of error and bias at coastal HWMs. Fathom-US also outperforms its own corresponding riverine HWM WSEs with error and bias approximately half of what is found at riverine HWMs. While our hypothesis holds that AutoRoute is the least capable framework for producing a FIM in a compound coastal flood, the results add further complexity to declaring whether HEC-RAS or Fathom-US produces a more accurate FIM.
Table 3Error and bias computed for each FIM framework using observed HWM WSE divided into riverine and coastal HWMs.
Unlike AutoRoute, the HEC-RAS and Fathom-US frameworks employ a similar physical fidelity in their respective numerical schemes. The main difference in these simulations is the geographic resolution and vertical accuracy of the DEMs. The HEC-RAS framework uses a ∼1 m DEM resolution with an average National Standard for Spatial Data Accuracy (NSSDA) absolute vertical accuracy of about 0.02 m (AECOM, 2018). The Fathom-US model simulating at around a ∼30 m DEM resolution has an average NSSDA absolute vertical accuracy of 3.04 m (Gesch et al., 2014). The greater accuracy and higher resolution of the DEM within the HEC-RAS framework likely comprise one of the main drivers of, overall, less error and bias in HEC-RAS FIM WSE as compared to the Fathom-US FIM WSE. The Fathom-US DEM has a lower vertical accuracy, which is likely one of the major drivers in the difference between the Fathom-US and HEC-RAS FIMs. The horizontal resolution of the DEM will also play a role in the accuracy of FIMs, particularly when the domain is an urban catchment, unless small-scale influences on the hydraulic conditions are present in the DEM (Wing et al., 2017, 2019; Domeneghetti et al., 2021). We consider our study area a densely urbanized watershed (Bass and Bedient, 2018).
One of the more apparent differences between the HEC-RAS and Fathom-US frameworks is the omission of HEC-HMS internal boundary conditions in the northeast corner of the watershed. The name of this region is Armand Bayou. The HEC-HMS runoff for Armand Bayou enters the HEC-RAS model near the pour point of Armand Bayou and not in a distributed manner throughout the Armand Bayou watershed. The Armand Bayou watershed is under analysis in a separate study by the USACE Galveston District, and the Clear Creek HEC-RAS model only considers the total runoff coming into the Clear Creek domain from Armand Bayou. When developing a FIM with different frameworks, the user should understand the parameterizations made by the modeler. In this instance, the application of runoff from Armand Bayou enters the HEC-RAS framework. However, because the runoff is not applied in a distributed manner throughout the watershed, an underrepresentation of modeled inundation occurs upstream of Armand Bayou's pour point, effectively removing pluvial and fluvial flooding from the region.
3.3 Implications of model differences
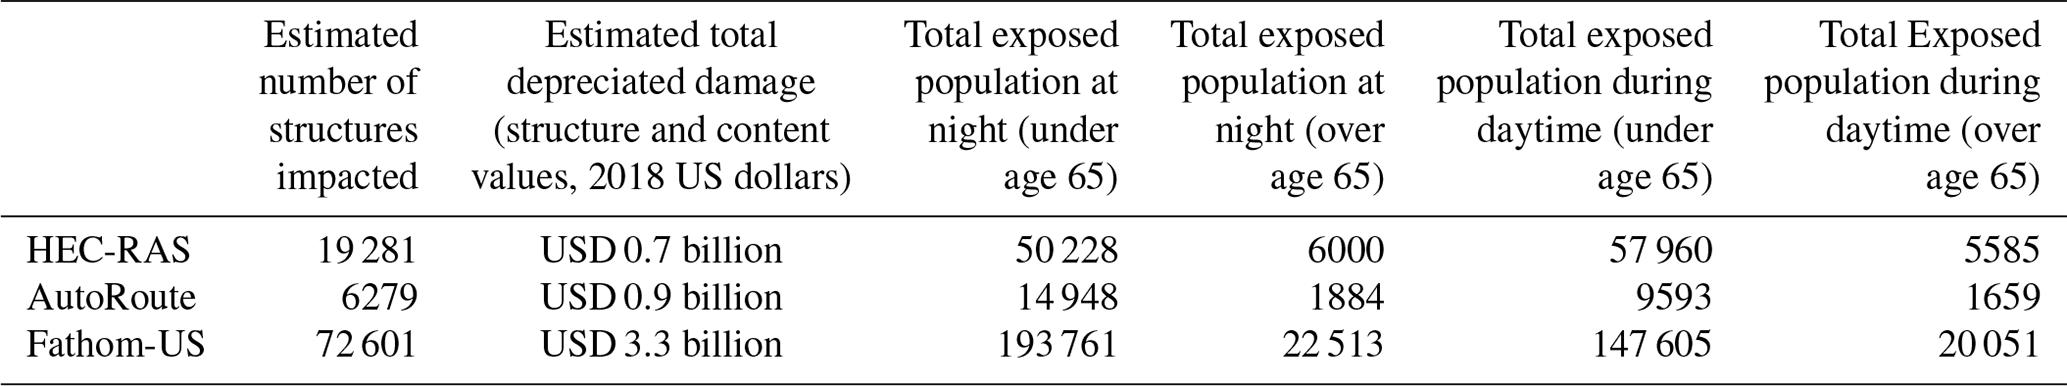
As expected, each of the three modeling frameworks we consider estimates different FIMs in terms of spatial composition. The differences in FIMs translate into different estimates of consequences and exposure. Table 4 summarizes the consequence and exposure differences estimated using each FIM. We see that generally higher WSE and full inclusion of Armand Bayou in the northeast section of the study domain in the Fathom-US model translate into larger consequence and exposure estimates. The Fathom-US FIM estimates that floodwater from Harvey inundated approximately 39 % of all buildings in the study domain, while HEC-RAS and AutoRoute FIMs estimate 10 % and 3 % of all buildings in the study domain, respectively, were inundated with floodwaters. Interestingly, there is not a general trend of increasing estimates of exposure that lead to increases in our estimates of dollar damage. AutoRoute inundates 6279 structures while estimating USD 0.9 billion in damage, while HEC-RAS inundates 19 281 structures while estimating USD 0.7 billion in damage. Exploring this result, when HEC-RAS and AutoRoute inundate the same buildings, AutoRoute estimates USD 0.3 billion more in damage than HEC-RAS. The only explanation in this difference in damage is a higher water depth, as go-consequences uses the same location and depth–damage function for these buildings. We then turn our attention to buildings where only the HEC-RAS FIM estimates damage, where the sum total of damage is USD 0.5 billion and the average water depth is 1.1 m. Likewise, for only structures where AutoRoute FIM estimates inundation and damage, the sum total is USD 0.3 billion and the average water depth is 3.8 m. Thus, AutoRoute estimates more damage than HEC-RAS because of a tendency to estimate a higher water depth at building locations. These results indicate that the differences in each FIM produce different estimates of both exposure and consequences.
Table 4Consequence and exposure estimates for Clear Creek during Hurricane Harvey estimated using each FIM and the go-consequences software.
We use the locations of the buildings impacted, the damage to those buildings, and the number of people within those buildings from each FIM go-consequences analysis to construct a kernel density map (Fig. 6) where we see a spatial pattern that matches the tabular values in Table 4. The HEC-RAS framework estimates that the highest density of exposure and consequences will be in the western and southern portions of the study domain. As stated before, the HEC-RAS framework omits distributed internal boundary conditions in the Armand Bayou watershed in the northeast portion of the study area, due to the modeling assumptions. The AutoRoute framework estimates that the highest density of exposure and consequences will occur in pockets throughout the study domain. The Fathom-US framework mimics the spatial pattern of the HEC-RAS framework but broadens estimates of exposure and consequences throughout the entire study domain and in particular in the northeast section that the HEC-RAS framework omits. Overall, the kernel densities portrayed in Fig. 6 match well the magnitudes of consequences and exposure portrayed in Table 4. Thus, exposure estimates produced by each FIM differ both in their magnitude and in their spatial pattern.
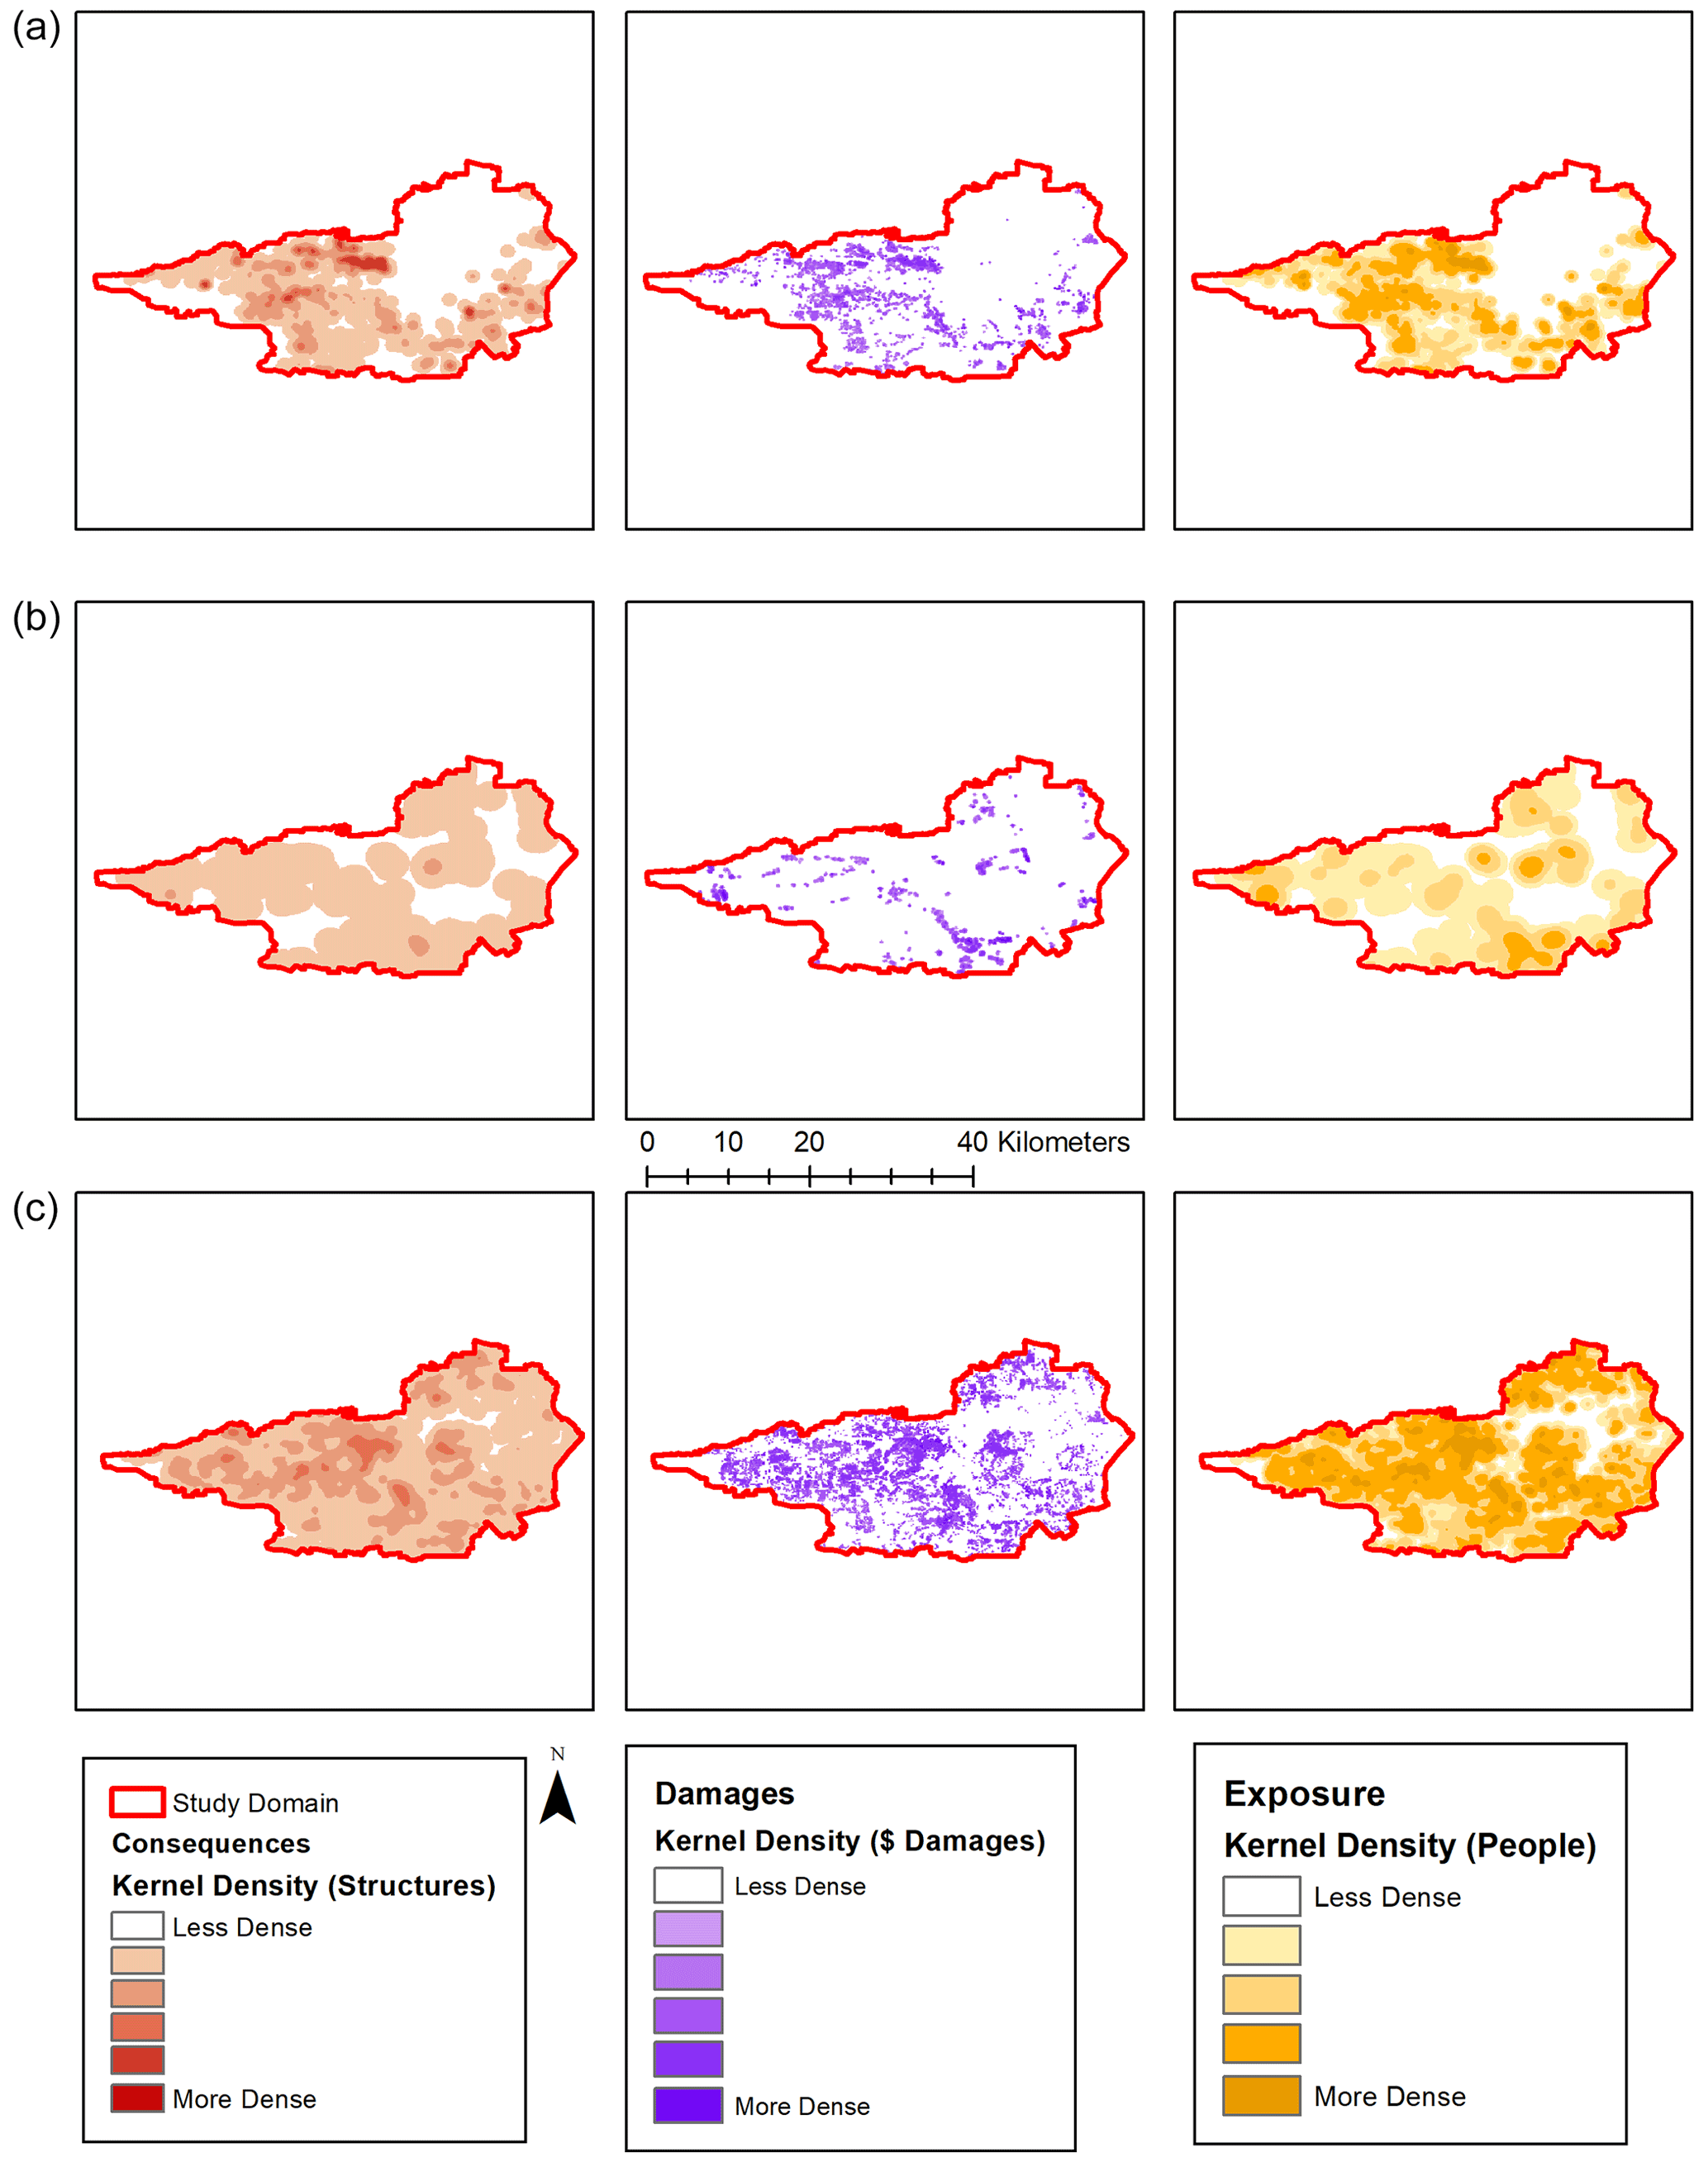
Figure 6Kernel density maps of NSI buildings, damage, and people per square kilometer impacted by each FIM: (a) HEC-RAS, (b) AutoRoute, and (c) Fathom-US. The kernel density maps are derived from go-consequences point output for each FIM modeling framework. The dollar symbol denotes US dollars.
The FIMs produced by each framework are different in terms of their spatial composition, and each estimates different consequences and exposures to the floodwaters. We may assume that the FIM produced by HEC-RAS is the most accurate given the better fit between observed and simulated WSE (Fig. 4 and Table 2). However, the HEC-RAS framework is not without error, has a lower locational accuracy than the Fathom-US framework (Table 1), and does not intend to represent flood inundation in the northeast section of the study region (Armand Bayou). Furthermore, as we compare FEMA flood insurance claim locations from Hurricane Harvey (Arctur, 2021) to each FIM, we find evidence that the HEC-RAS framework FIM does indeed exclude flooding in the northeast portion of the study area. Figure 7 compares the location of FEMA insurance claims for structures in the area of interest and the estimate of buildings per square kilometer from Fig. 6. Figure 7 illustrates that both the HEC-RAS and the Fathom-US frameworks do well in identifying hotspots of buildings impacted by flooding in the western and southern portions of the study area. However, the HEC-RAS framework excludes impacted areas in the northeast portion of the study area, while the Fathom-US framework correctly identifies those locations. The AutoRoute FIM does not appear to perform well in identifying the spatial pattern of exposed buildings.
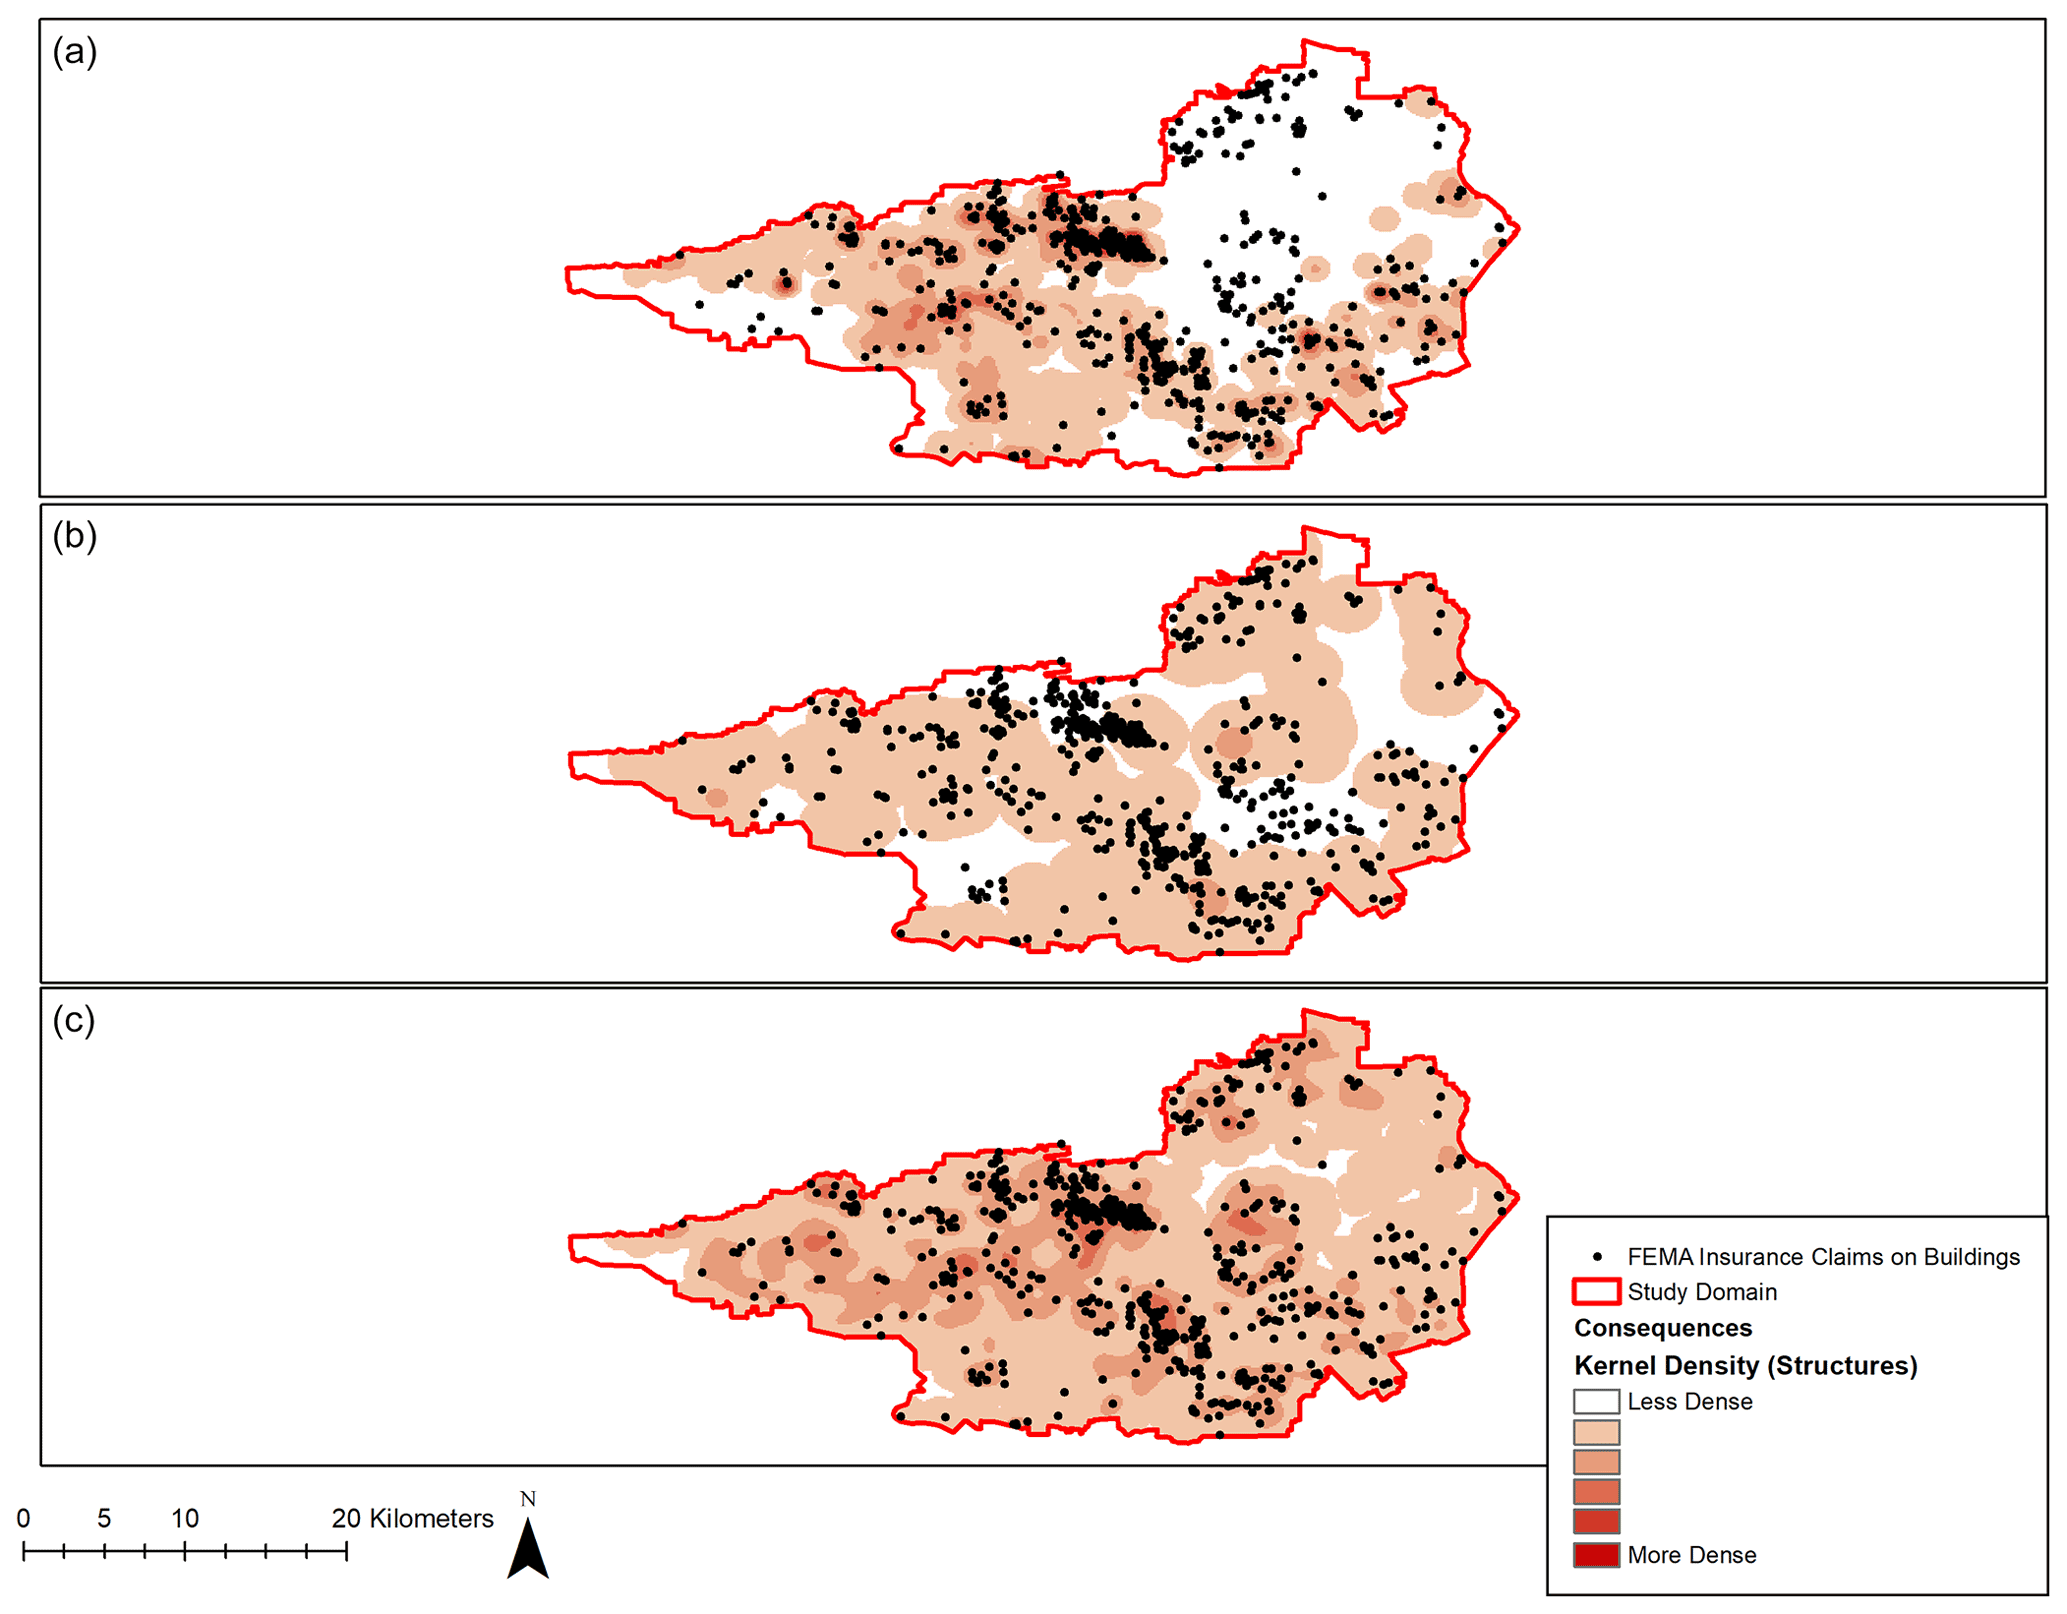
Figure 7Comparison of the location of FEMA flood insurance claims and kernel density maps developed using go-consequences results for each FIM: (a) HEC-RAS, (b) AutoRoute, and (c) Fathom-US.
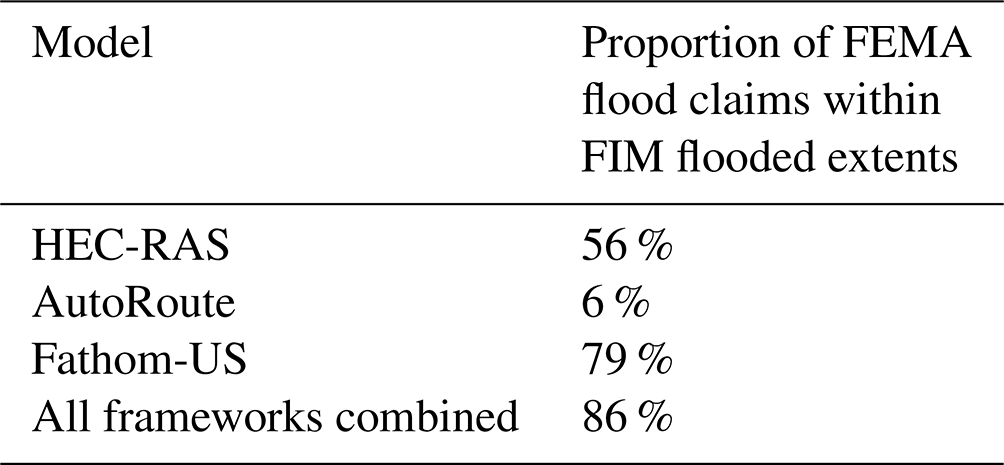
When we calculate the proportion of FEMA insurance claims falling within each FIM's flood inundation extent (Table 5), we see that none of the frameworks capture all FEMA claims and the results mirror Table 1, with the proportion of insurance claims within each FIM aligning with the proportion of HWMs within each FIM. However, if we sum all FEMA claims that fall within at least one of the three FIMs, we capture a slightly greater portion of FEMA insurance claims. This result, in combination with the finding that even our local-scale HEC-RAS framework does not capture as many HWM locations within its FIM as the continental-scale Fathom-US framework, may further illustrate the importance of using multiple sources for FIMs of flood events. The combination of these FIM sources can produce a probabilistic or composite FIM that better highlights overall risk for emergency responders and the public. Thus, we find utility in having multiple FIM sources, as it appears the combination of FIM sources better estimates overall exposure than one FIM alone.
Table 5Proportion of FEMA insurance claims within the FIM for a combination of all three FIM modeling frameworks.
3.4 How to improve FIM creation techniques
Efforts are ongoing to coordinate FIM creation at the federal level. The three frameworks discussed in our study are not the only techniques available to create FIMs during flood events. As previously mentioned, the NWC produces HAND-derived FIMs using the NWM (Viterbo et al., 2020). The US Department of Homeland Security (DHS) contracts the Pacific Northwest National Laboratory (PNNL) to construct FIMs with the Rapid Infrastructure Flood Tool (RIFT) model (Judi et al., 2010; PNNL, 2017; Li et al., 2019). NOAA's NWS and the USGS host multiple FIM libraries (NWS, 2022; USGS Flood Event Viewer, 2021). There are likely other entities capable of producing FIMs throughout the world. Our case study highlights how the three FIM frameworks we consider are different, are imperfect, and can lead to different estimates of flood exposure and consequences. Thus, there is a need to reconcile and adjudicate multiple FIMs to ensure consistency in decision-making efforts during flood events. In response to this need, the IWRSS consortium has set out operational plans for coordinating FIM production through the Integrated Flood Inundation Mapping (iFIM) effort (Mason et al., 2020). The iFIM group confers before, during, and after major flood events in order to promote awareness of the various FIM creation efforts. The iFIM effort is in its infancy, gathering together personnel and resources to understand the where and when of FIM production. However, this is a necessary first step in building cohesion in developing appropriate FIMs. In our current context, the iFIM group would have been aware that the HEC-RAS framework should not be representative of the northeast section of the study domain and that the AutoRoute framework generally performs poorly in low-gradient coastal watersheds. This adjudication process would have likely led to the iFIM group promoting the Fathom-US framework for use in the northeast section of the study region and the HEC-RAS framework in the rest of the study area as the most appropriate FIMs.
To empower the iFIM group, additional steps to enable interoperability and sharing of maps across multiple levels and divisions of government will also be necessary. From a practical perspective, this means developing data services to share among the different agencies. NOAA's NWS, USACE, and the USGS all provide access to FIMs through geographic information system (GIS) services during flood events. The next step will be the engagement of other federal entities and those that fall outside of the federal agencies. Metadata, sufficient to empower the vetting process, should accompany new and existing GIS FIM services. The metadata should include details on the composition of the framework (e.g., Fig. 2) such as the meteorological forcing used, DEM resolution and age, model spatial and temporal resolution, inclusion of coastal boundary conditions, and a descriptive narrative from the modeler that can convey to the user appropriate specifics regarding the FIM. Simply exposing these FIMs as GIS services and allowing the iFIM group to import them within a common operating picture will empower the FIM adjudication and promotion process.
The iFIM intends to promote the most appropriate FIM for a given flood event and location. However, as we have seen with this case study of Clear Creek during Hurricane Harvey, a single FIM estimate can be problematic for compound coastal flooding given that all chosen modeling frameworks produce an imperfect assessment of reality. As Table 5 displays, our combination of all three FIMs encompasses a greater proportion of FEMA flood claims than one location alone. Thus, we have some initial evidence to suggest that the delivery of a multi-model FIM should be the preferred methodology for FIM delivery.
However, a chosen FIM framework highlights only one aspect of the uncertainty within FIM creation. This assessment has not considered the uncertainty associated with the use of numerical weather prediction (NWP) models. Even with gains in NWP forecast skill, the use of ensemble prediction remains key to understanding the uncertainty when predicting chaotic weather systems. Ensemble prediction entails the perturbation of initial conditions and model numerical schemes to create a range of possible meteorological conditions (Palmer, 2017). Thus, the delivery of an ensemble, multi-model probabilistic FIM should be the preferred methodology to deliver a FIM in order to convey uncertainty to decision makers. The result of such a system would be a multi-model ensemble-based probabilistic FIM, similar to that proposed by Zarzar et al. (2018). This move from deterministic FIM estimates into probabilistic FIMs is the path that the NHC has taken with its storm surge processes and products. Though the NHC relies upon only one model, SLOSH, it recognizes the significance of meteorological uncertainty within storm surge FIMs and creates only probabilistic products for public consumption. The NHC's Probabilistic Tropical Storm Surge (P-Surge)-derived Potential Storm Surge Flood Map represents reasonable worst-case-scenario FIMs at any location given the range of meteorological uncertainty (Potential Storm Surge Flooding Map, 2016). In general, expansion of the full expression of knowledge uncertainties, extending beyond model selection and NWP forcing into areas such as coefficient determination for hydraulic structures, should generally benefit the portrayal of event-based flood risk in FIMs.
Two of the large-scale frameworks (Fathom-US and AutoRoute) we employ here have the potential to generate timely probabilistic FIMs using hydrometeorological ensemble forecasts (Wing et al., 2019). However, to take advantage of hydrometeorological ensemble forecasts within local-scale frameworks, such as our HEC-RAS example, we must effectively reduce model runtime. The setup and runtime of these local frameworks may affect the timeliness of FIM creation, which is crucial during emergency operations (Follum et al., 2016; Longenecker et al., 2020; Gutenson et al., 2021). However, local-scale frameworks offer high-fidelity, high-resolution products that can improve a probabilistic FIM. One means to reduce model runtime for local-scale models is to develop and train surrogate models that can dramatically reduce the computational runtime of high-fidelity, high-resolution modeling while delivering similar results (Zahura et al., 2020; Contreras et al., 2020; Kyprioti et al., 2021). In fact, Bass and Bedient (2018) have already developed such a surrogate modeling approach to create a FIM within our study area that loosely couples inland and coastal models, forcing both with a full range of potential tropical-cyclone characteristics. Recently, Jafarzadegan et al. (2022) demonstrated a new methodology for replicating high-fidelity hydrodynamic model output by using a revised version of the HAND methodology that accounts for the height above and distance to the nearest drainage feature and is computationally efficient enough for FIM construction during flood events. This revised HAND methodology could function as a form of surrogate modeling for timely FIM creation. However, accurately training surrogate models for compound hazards is not trivial, given the need to expose the surrogate technique to numerous pre-existing simulations that account for the multitude of physical interactions, initial conditions, etc. that expand beyond tropical-cyclone forcing.
Improvements in numerical schemes and input data might also provide improvements in FIM creation. In their review of the literature, Santiago-Collazo et al. (2019) determine that 96 % of the literature they analyze presents compound coastal flood inundation modeling strategies that employ one-way coupling. By one-way coupling, we mean where outputs from one model (e.g., inland) are fed into another model (e.g., coastal) by way of internal or external boundary conditions and no feedback occurs between the coupled models. The HEC-RAS and Fathom-US frameworks discussed here are examples of one-way coupling strategies as the models insert coastal surge into both frameworks via downstream head boundary conditions. Santiago-Collazo et al. (2019) advocate for the use of more robust coupling strategies to account for the complex interaction between inland runoff and storm surge, such as loosely coupled, tightly coupled, or fully coupled modeling strategies. In addition, utilizing hydraulic modeling techniques that solve the full mass and momentum equations may improve resulting FIM estimates. An ongoing, Texas General Land Office-led, regional flood study effort is evaluating whether the accuracy of HEC-RAS models can change due to the usage of diffusion or dynamic wave hydraulic formulations within HEC-RAS simulations. This study will provide insight into the effect that not solving the full mass balance and momentum equations has on estimated FIMs in Texas. Further, FIM improvement will undoubtedly occur as improvements to the widespread availability of critical input datasets occur. For instance, the USGS collection of improved DEM data is steadily decreasing vertical and relative DEM errors (Gesch et al., 2014).
In this paper, we compare three different FIM creation frameworks for a small coastal watershed, Clear Creek, near Houston, Texas, during Hurricane Harvey. These frameworks are the HEC-RAS framework, the AutoRoute framework, and the Fathom-US framework.
We estimate the maximum flood inundation raster from each FIM framework and consider this our FIM. We then compare each framework's FIM to USGS HWMs in two ways. First, we assess whether the FIM contains each HWM within the estimated flood extent. Second, we compare observed WSE from the USGS HWM to estimated WSE in the FIM. Our analysis indicates that FIM accuracy can vary based upon either of these assessments. The Fathom-US framework not only contains the most HWMs but also tends to overestimate WSE and have a higher WSE error and bias. The HEC-RAS framework not only contains fewer HWMs but also tends to have more accurate WSE. The AutoRoute framework is the least accurate of the three, appears to underestimate flood extent, and highlights how simplified flood inundation mapping methods are not ideal for representing compound coastal flooding. Our analysis illustrates that no one FIM is infallible and each is subject to the uncertainties present in the model's numerical scheme, the model inputs (e.g., terrain), and the model's configuration.
We then estimate the exposure and consequences of each FIM using the NSI and go-consequences. We find quantitative and spatial differences in the exposure and consequences produced by each FIM. The differences we find between each FIM, such as a lower location accuracy in the local HEC-RAS framework, further illustrate why a single FIM is not preferable during emergency events. We compare the locations of exposure estimates to the locations of FEMA flood claims. Visually (Fig. 7), simulated exposure estimates compare favorably to our approximate observations. The results lend credence to our ability to utilize accurate FIMs, the NSI, and go-consequences and produce a relatively accurate exposure assessment for a flood event. Thus, the combination may be a useful tool set for evaluating the impacts of flood events before, during, and after they happen.
Our study highlights the need to rectify and adjudicate the various FIMs created during flood events. In response to this need, IWRSS formed the iFIM to perform interagency comparison and consolidation of FIMs. GIS web services will empower the iFIM, and adding additional FIMs to the iFIM common operating picture will improve the FIM selection and discovery process.
Large-scale FIM creation techniques, such as AutoRoute and Fathom-US, may be capable of operating in real time during flood events. To develop FIMs properly for compound floods and beyond, future research should focus on means to reduce runtime in local-scale models that offer high-fidelity numerical schemes and high-resolution input data. Surrogate modeling may offer such an approach, but the difficulties in training a multivariate surrogate model are not trivial. Decreased runtimes may offer the ability to instantiate multiple model simulations while not compromising model fidelity. This would make possible probabilistic FIMs for compound coastal floods that capitalize on the fidelity and resolution of local-scale models.
The presented HWM data are accessible at https://stn.wim.usgs.gov/FEV/ (last access: 20 January 2022; USGS Flood Event Viewer, 2021).
JLG and AAT conceptualized the study. JLG designed the study and conducted the experiments. JLG drafted the manuscript. MSI and OEJW assisted with data collection and preparation. WPL and COH assisted with model setup and implementation. MSI, OEJW, MDW, and TCM provided comments and feedback on the manuscript draft.
The contact author has declared that none of the authors has any competing interests.
Publisher’s note: Copernicus Publications remains neutral with regard to jurisdictional claims in published maps and institutional affiliations.
This project was funded by U.S. Army Engineer Research and Development Center (ERDC) collaborative research between ERDC's Coastal and Hydraulics Laboratory and NOAA's National Water Center and the U.S. Army Corps of Engineers National Regional Sediment Management Program. We appreciate all the input that our reviewers provided.
This research has been supported by the U.S. Army Corps of Engineers (Regional Sediment Management (RSM) Program and National Water Center (NWC) collaborative research).
This paper was edited by Kai Schröter and reviewed by two anonymous referees.
About: See the Storm Surge in Real-Time, About, https://coastalrisk.live/about/, last access: 20 January 2022.
AECOM: 2018 Coastal Texas LiDAR Final QA/QC Report, Statement of Work #580-18-SOW0051, https://prd-tnm.s3.amazonaws.com/StagedProducts/Elevation/metadata/TX_CoastalRegion_2018_A18/TX_Coastal_B1_2018/reports/thrid-party-QAQC/2018CoastalTexasLiDAR_FinalQAQCReport_20181221.pdf (last access: 4 January 2023), 2018.
Afshari, S., Tavakoly, A. A., Rajib, M. A., Zheng, X., Follum, M. L., Omranian, E., and Fekete, B. M.: Comparison of new generation low-complexity flood inundation mapping tools with a hydrodynamic model, J. Hydrol., 556, 539–556, https://doi.org/10.1016/j.jhydrol.2017.11.036, 2018.
Bass, B. and Bedient, P.: Surrogate modeling of joint flood risk across coastal watersheds, J. Hydrol., 558, 159–173, https://doi.org/10.1016/j.jhydrol.2018.01.014, 2018.
Brody, S. D., Sebastian, A., Blessing, R., and Bedient, P. B.: Case study results from southeast Houston, Texas: identifying the impacts of residential location on flood risk and loss, J. Flood Risk Manag., 11, S110–S120, https://doi.org/10.1111/jfr3.12184, 2018.
Contreras, M. T., Gironás, J., and Escauriaza, C.: Forecasting flood hazards in real time: a surrogate model for hydrometeorological events in an Andean watershed, Nat. Hazards Earth Syst. Sci., 20, 3261–3277, https://doi.org/10.5194/nhess-20-3261-2020, 2020.
Domeneghetti, A., Leonardi, A., Wing, O. E. J., Carisi, F., and Brath, A.: The role of small-scale topographic features on inundation dynamics: potential impacts on large-scale investigations, EGU General Assembly 2021, online, 19–30 Apr 2021, EGU21-9093, https://doi.org/10.5194/egusphere-egu21-9093, 2021.
Esri: Kernel Density, ArcMap 10.8, ArcMap, https://desktop.arcgis.com/en/arcmap/latest/tools/spatial-analyst-toolbox/kernel-density.htm, last access: 10 February 2022.
Fast Facts: Hurricane Costs, NOAA, https://coast.noaa.gov/states/fast-facts/hurricane-costs.html#:~:text=Of%20the%20258%20U.S.%20weather,6%2C593%20between%201980%20and%202020, last access: 19 September 2021.
Follum, M. L.: AutoRoute Rapid Flood Inundation Model, U.S. Army Engineer Research and Development Center, ERDC/CHL CHETN-IV-88, 12 pp., 2013.
Follum, M. L., Tavakoly, A. A., Niemann, J. D., and Snow, A. D.: AutoRAPID: A Model for Prompt Streamflow Estimation and Flood Inundation Mapping over Regional to Continental Extents, J. Am. Water Resour. As., 53, 280–299, https://doi.org/10.1111/1752-1688.12476, 2016.
Follum, M. L., Vera, R., Tavakoly, A. A., and Gutenson, J. L.: Improved accuracy and efficiency of flood inundation mapping of low-, medium-, and high-flow events using the AutoRoute model, Nat. Hazards Earth Syst. Sci., 20, 625–641, https://doi.org/10.5194/nhess-20-625-2020, 2020.
Freese and Nichols, Inc.: Lower Clear Creek and Dickinson Bayou Flood Mitigation Plan Hydraulic Technical Memorandum Final Report: Appendix C, City of League City, 27 pp., 2021.
Gesch, D., Oimoen, M., Greenlee, S., Nelson, C., Steuck, M., and Tyler, D.: The National Elevation Dataset: photogrammetric engineering and remote sensing, Journal of the American Society for Photogrammetry and Remote Sensing, 68, 5–11, 2002.
Gesch, D., Evans, G., Mauck, J., Hutchinson, J., and Carswell Jr., W. J.: The National Map – Elevation, U.S. Geological Survey (USGS), Fact Sheet 2009-3053, 4 pp., https://pubs.usgs.gov/fs/2009/3053/ (last access: 4 January 2023), 2010.
Gesch, D. B., Oimoen, M. J., and Evans, G. A.: Accuracy Assessment of the U.S. Geological Survey National Elevation Dataset, and Comparison with Other Large-Area Elevation Datasets-SRTM and ASTER, U.S. Geological Survey (USGS), Open-File Report 2014-1008, 10 pp., https://pubs.er.usgs.gov/publication/ofr20141008 (last access: 4 January 2023), 2014.
Gori, A., Lin, N., and Smith, J.: Assessing Compound Flooding From Landfalling Tropical Cyclones on the North Carolina Coast Water Resources Research, Water Resour. Res., 56, e2019WR026788, https://doi.org/10.1029/2019WR026788, 2020.
Gutenson, J. L., Tavakoly, A. A., Massey, T. C., Savant, G., Tritinger, A. S., Owensby, M. B., Wahl, M. D., and Islam, M. S.: Investigating Modeling Strategies to Couple Inland Hydrology and Coastal Hydraulics to Better Understand Compound Flood Risk, in: Planning a Resilient Future along America's Freshwaters – Selected Papers from the World Environmental and Water Resources Congress, Online, 64–75, 7–11 June 2021.
HEC-RAS River Analysis System: Release Notes, U.S. Army Corps of Engineers (USACE), Manual, 27 pp., https://www.hec.usace.army.mil/software/hec-ras/documentation/HEC-RAS_5.0.7_Release_Notes.pdf (last access: 4 January 2023), 2019.
Hydrologic Modeling System (HEC-HMS): Release Notes, U.S. Army Corps of Engineers (USACE), Manual, 23 pp., https://www.hec.usace.army.mil/software/hec-hms/documentation/HEC-HMS_Release_Notes_4.3.pdf (last access: 4 January 2023), 2018.
Hocini, N., Payrastre, O., Bourgin, F., Gaume, E., Davy, P., Lague, D., Poinsignon, L., and Pons, F.: Performance of automated methods for flash flood inundation mapping: a comparison of a digital terrain model (DTM) filling and two hydrodynamic methods, Hydrol. Earth Syst. Sci., 25, 2979–2995, https://doi.org/10.5194/hess-25-2979-2021, 2021.
IWRSS (Integrated Water Resources Science and Services): Requirements for the National Flood Inundation Mapping Services, IWRSS, Report, 66 pp., https://water.usgs.gov/osw/iwrss/IWRSS_FIM_Requirements_Report_09-2013.pdf (last access: 4 January 2023), 2013.
Jafarzadegan, K., Muñoz, D. F., Moftakhari, H., Gutenson, J. L., Savant, G., and Moradkhani, H.: Real-time coastal flood hazard assessment using DEM-based hydrogeomorphic classifiers, Nat. Hazards Earth Syst. Sci., 22, 1419–1435, https://doi.org/10.5194/nhess-22-1419-2022, 2022.
Jelesnianski, C. P., Chen, J., Shaffer, W. A., and Gilad, A. J.: Slosh – a Hurricane Storm Surge Forecast Model, in: Oceans Conference Record, Washington, DC, USA, 10–12 September 1984, IEEE, 314–317, https://doi.org/10.1109/oceans.1984.1152341, 1984.
Johnson, J. M., Munasinghe, D., Eyelade, D., and Cohen, S.: An integrated evaluation of the National Water Model (NWM)-Height Above Nearest Drainage (HAND) flood mapping methodology, Nat. Hazards Earth Syst. Sci., 19, 2405–2420, https://doi.org/10.5194/nhess-19-2405-2019, 2020.
Judi, D. R., Burian, S. J., and McPherson, T. N.: Two-Dimensional Fast-Response Flood Modeling: Desktop Parallel Computing and Domain Tracking, J. Comput. Civil Eng., 25, 184–191, https://doi.org/10.1061/(asce)cp.1943-5487.0000064, 2011.
Koenig, T. A., Bruce, J. L., O'Connor, J., McGee, B. D., Holmes, R. R., Hollins, R., Forbes, B. T., Kohn, M. S., Schellekens, M. F., Martin, Z. W., and Peppler, M. C.: Identifying and Preserving High-Water Mark Data, Techniques and Methods 3–A24, U. S. Geological Survey (USGS), 47 pp., https://doi.org/10.3133/tm3A24, 2016.
Kyprioti, A. P., Taflanidis, A. A., Nadal-Caraballo, N. C., and Campbell, M.: Storm hazard analysis over extended geospatial grids utilizing surrogate models, Coast. Eng., 168, 103855, https://doi.org/10.1016/j.coastaleng.2021.103855, 2021.
Li, X., Rakowski, C. L., McPherson, T. N., Judi, D., and Coleman, A. M.: Pitfalls of Validating Extreme Event Flood Models: The experience of RIFT for Hurricane Florence, American Geophysical Union (AGU) Fall Meeting 2019, San Fransisco, CA, 9–13 December 2019, https://ui.adsabs.harvard.edu/abs/2019AGUFM.H12B..07L/abstract (last access: 4 January 2023), 2019.
Liu, Y. Y., Maidment, D. R., Tarboton, D. G., Zheng, X., and Wang, S.: A CyberGIS Integration and Computation Framework for High-Resolution Continental-Scale Flood Inundation Mapping, J. Am. Water Resour. As., 54, 770–784, https://doi.org/10.1111/1752-1688.12660, 2018.
Longenecker, H. E., Graeden, E., Kluskiewicz, D., Zuzak, C., Rozelle, J., and Aziz, A. L.: A rapid flood risk assessment method for response operations and nonsubject-matter-expert community planning, J. Flood Risk Manag., 13, e12579, https://doi.org/10.1111/jfr3.12579, 2020.
Loveland, M., Kiaghadi, A., Dawson, C. N., Rifai, H. S., Misra, S., Mosser, H., and Parola, A.: Developing a Modeling Framework to Simulate Compound Flooding: When Storm Surge Interacts With Riverine Flow, Frontiers in Climate, 2, 609610, https://doi.org/10.3389/fclim.2020.609610, 2021.
Luettich, R. A., Westerink, J. J., and Scheffner, N. W.: ADCIRC: An Advanced Three-Dimensional Circulation Model for Shelves Coasts and Estuaries, Report 1: Theory and Methodology of ADCIRC-2DDI and ADCIRC-3DL, Dredging Research Program, Technical Report DRP-92-6, https://erdc-library.erdc.dren.mil/jspui/handle/11681/4618, 1992.
Maidment, D. R.: Conceptual Framework for the National Flood Interoperability Experiment, J. Am. Water Resour. As., 53, 245–257, https://doi.org/10.1111/1752-1688.12474, 2017.
Mason, R., Gutenson, J., Sheeley, J., and Lehman, W.: What's New (And What Does it Mean) – Technology edn., in: Interagency Flood Risk Management Program Workshop, St. Louis, MO, 25–28 February 2020.
National Hurricane Center (NHC): Experimental Potential Storm Surge Flooding Map, NHC, https://www.nhc.noaa.gov/experimental/inundation/, last access: 20 January 2022.
Nielsen, E. R. and Schumacher, R. S.: Dynamical mechanisms supporting extreme rainfall accumulations in the Houston “tax day” 2016 flood, Mon. Weather Rev., 148, 83–109, https://doi.org/10.1175/MWR-D-19-0206.1, 2020.
NOAA (National Oceanic and Atmospheric Administration): NOAA National Water Model Reanalysis Model Data on AWS, AWS [data set], https://docs.opendata.aws/nwm-archive/readme.html (last access: 4 January 2023), 2018.
NOAA Tides & Currents: https://tidesandcurrents.noaa.gov/, last access 19 September 2021.
NWS (National Weather Service): Service Assessment: The Missouri/Souris River Floods of May–August 2011, NWS, 68 pp., https://www.weather.gov/media/publications/assessments/Missouri_floods11.pdf (last access: 4 January 2023), 2012.
NWS: Inundation Mapping Locations, NWS, https://water.weather.gov/ahps/inundation.php, last access: 20 January 2022.
Palmer, T.: The primacy of doubt: Evolution of numerical weather prediction from determinism to probability, J. Adv. Model. Earth Sy., 9, 730–734, https://doi.org/10.1002/2017MS000999, 2017.
PNNL (Pacific Northwest National Laboratory): PNNL flood modeling helps DHS during busy hurricane season, PNNL, https://www.pnnl.gov/news/release.aspx?id=4466 (last access: 4 January 2023), 2017.
Potential Storm Surge Flooding Map: https://www.nhc.noaa.gov/surge/inundation/ (last access: 4 January 2023), 2016.
RainVieux: http://vflo.vieuxinc.com/rainvieux.html, last access: 20 January 2022.
Santiago-Collazo, F. L., Bilskie, M. V., and Hagen, S. C.: A comprehensive review of compound inundation models in low-gradient coastal watersheds, Environ. Modell. Softw., 119, 166–181, https://doi.org/10.1016/j.envsoft.2019.06.002, 2019.
Shao, W., Xian, S., Lin, N., Kunreuther, H., Jackson, N., and Goidel, K.: Understanding the effects of past flood events and perceived and estimated flood risks on individuals' voluntary flood insurance purchase behaviour, Water Res., 108, 391–400, https://doi.org/10.1016/j.watres.2016.11.021, 2017.
StratMap: Elevation – Lidar, TNRIS, https://tnris.org/stratmap/elevation-lidar/, last access: 4 January 2023.
Tavakoly, A. A., Gutenson, J. L., Lewis, J. W., Follum, M. L., Rajib, A., LaHatte, W. C., and Hamilton, C. O.: Direct Integration of Numerous Dams and Reservoirs Outflow in Continental Scale Hydrologic Modeling, Water Resour. Res., 57, e2020WR029544, https://doi.org/10.1029/2020WR029544, 2021.
USACE (U. S. Army Corps of Engineers): Generic Depth-Damage Relationships for Residential Structures with Basements, Economic Guidance Memorandum (EGM) 04-01, 17 pp., https://planning.erdc.dren.mil/toolbox/library/EGMs/egm04-01.pdf (last access: 4 January 2023), 2003.
USACE (U. S. Army Corps of Engineers): Go-consequences, Github [code], https://github.com/USACE/go-consequences (last access: 4 January 2023), 2021a.
USACE (U. S. Army Corps of Engineers): Go-tc-consequences, Github [code], https://github.com/HydrologicEngineeringCenter/go-tc-consequences (last access: 4 January 2023), 2021b.
USACE (U. S. Army Corps of Engineers): NSI Documentation, https://www.hec.usace.army.mil/confluence/nsi/technicalreferences/2019/technical-documentation (last access: 4 January 2023), 2021c.
US EPA (U.S. Environmental Protection Agency): Get NHDPlus (National Hydrography Dataset Plus) Data, US EPA [data set], https://www.epa.gov/waterdata/get-nhdplus-national-hydrography-dataset-plus-data (last access: 4 January 2023), 2019a.
US EPA (U.S. Environmental Protection Agency): NHDPlus Version 2: User Guide, https://edap-ow-data-commons.s3.amazonaws.com/NHDPlusV21/Documentation/NHDPlusV2_User_Guide.pdf (last access: 4 January 2023), 2019b.
U.S. Federal Emergency Management Administration (FEMA): Harvey Damage Assessments and Claims, HydroShare [data set], https://www.hydroshare.org/resource/a52d209d46eb42578be0a7472c48e2d5/ (last access: 4 January 2023), 2021.
USGS Flood Event Viewer: https://stn.wim.usgs.gov/FEV/ (last access: 20 January 2022), 2021.
Valle-Levinson, A., Olabarrieta, M., and Heilman, L: Compound flooding in Houston-Galveston Bay during Hurricane Harvey, Sci. Total Environ., 747, 141272, https://doi.org/10.1016/j.scitotenv.2020.141272, 2020.
Viterbo, F., Mahoney, K., Read, L., Salas, F., Bates, B., Elliott, J., Cosgrove, B., Dugger, A., Gochis, D., and Cifelli, R.: A multiscale, hydrometeorological forecast evaluation of national water model forecasts of the May 2018 Ellicott City, Maryland, Flood, J. Hydrometeorol., 21, 475–499, https://doi.org/10.1175/JHM-D-19-0125.1, 2020.
Watson, K. M., Harwell, G. R., Wallace, D. S., Welborn, T. L., Stengel, V. G., and McDowell, J. S.: Characterization of Peak Streamflows and Flood Inundation of Selected Areas in Southeastern Texas and Southwestern Louisiana from the August and September 2017 Flood Resulting from Hurricane Harvey, U.S. Geological Survey, Scientific Investigations Report 2018-5070, 44 pp., https://doi.org/10.3133/sir20185070, 2018.
Winders, C., Wyckoff, R., Fischer, M., Hoben, R., Carey, M., and Brunner, G.: Modeling, Mapping, and Consequences (MMC) Production Center, Flood Inundation Mapping (FIM) Cadre Supporting the 2017 Hurricane Events, Flood Risk Management (FRM) Newsletter, 11, 4–7, https://operations.erdc.dren.mil/Flood/pdfs/FRM-1804.pdf (last access: 4 January 2023), 2018.
Wing, O. E. J., Bates, P. D., Sampson, C. C., Smith, A. M., Johnson, K. A., and Erickson, T. A.: Validation of a 30 m resolution flood hazard model of the conterminous United States, Water Resour. Res., 53, 7968–7986, https://doi.org/10.1002/2017WR020917, 2017.
Wing, O. E. J., Sampson, C. C., Bates, P. D., Quinn, N., Smith, A. M., and Neal, J. C.: A flood inundation forecast of Hurricane Harvey using a continental-scale 2D hydrodynamic model, Journal of Hydrology X, 4, 100039, https://doi.org/10.1016/j.hydroa.2019.100039, 2019.
Wing, O. E. J., Smith, A. M., Marston, M. L., Porter, J. R., Amodeo, M. F., Sampson, C. C., and Bates, P. D.: Simulating historical flood events at the continental scale: observational validation of a large-scale hydrodynamic model, Nat. Hazards Earth Syst. Sci., 21, 559–575, https://doi.org/10.5194/nhess-21-559-2021, 2021.
Yang, L., Jin, S., Danielson, P., Homer, C., Gass, L., Bender, S. M., Case, A., Costello, C., Dewitz, J., Fry, J., Funk, M., Granneman, B., Liknes, G. C., Rigge, M., and Xian, G.: A new generation of the United States National Land Cover Database: Requirements, research priorities, design, and implementation strategies, ISPRS J. Photogramm., 146, 108–123, https://doi.org/10.1016/j.isprsjprs.2018.09.006, 2018.
Zahura, F. T., Goodall, J. L., Sadler, J. M., Shen, Y., Morsy, M. M., and Behl, M.: Training Machine Learning Surrogate Models From a High-Fidelity Physics-Based Model: Application for Real-Time Street-Scale Flood Prediction in an Urban Coastal Community, Water Resour. Res., 56, e2019WR027038, https://doi.org/10.1029/2019WR027038, 2020.
Zarzar, C. M., Hosseiny, H., Siddique, R., Gomez, M., Smith, V., Mejia, A., and Dyer, J.: A Hydraulic MultiModel Ensemble Framework for Visualizing Flood Inundation Uncertainty, J. Am. Water Resour. As., 54, 807–819, https://doi.org/10.1111/1752-1688.12656, 2018.
Zheng, X., Tarboton, D. G., Maidment, D. R., Liu, Y. Y., and Passalacqua, P.: River Channel Geometry and Rating Curve Estimation Using Height above the Nearest Drainage, J. Am. Water Resour. As., 54, 785–806, https://doi.org/10.1111/1752-1688.12661, 2018.