the Creative Commons Attribution 4.0 License.
the Creative Commons Attribution 4.0 License.
 | 20 Jul 2023
The role of thermokarst evolution in debris flow initiation (Hüttekar Rock Glacier, Austrian Alps)
Thomas Wagner
Karl Krainer
Michael Avian
Marc Olefs
Klaus Haslinger
Gerfried Winkler
A rapid sequence of cascading events involving thermokarst lake outburst, local rock glacier front failure, debris flow development, and river blockage hit Radurschl Valley (Ötztal Alps, Tyrol) on 13 August 2019. Compounding effects from permafrost degradation and drainage network development within the rock glacier initiated the complex process chain. The debris flow dammed the main river of the valley, impounding a water volume of 120 000 m3 that was partly drained by excavation to prevent a potentially catastrophic outburst flood. We present a systematic analysis of destabilizing factors to deduce the failure mechanism. The identification and evaluation of individual factors reveals a critical combination of topographical and sedimentological disposition, climate, and weather patterns driving the evolution of a thermokarst drainage network. Progressively changing groundwater flow and storage patterns within the frozen sediment accumulation governed the slope stability of the rock glacier front. Our results demonstrate the hazard potential of active rock glaciers due to their large amount of mobilizable sediment, dynamically changing internal structure, thermokarst lake development, and substantial water flow along a rapidly evolving channel network.
- Article
(8551 KB) - Full-text XML
-
Supplement
(50074 KB) - BibTeX
- EndNote


Climate change and its adverse effects on slope stability rapidly alter patterns of landslide occurrence and the balance between destabilizing and resisting forces (Gariano and Guzzetti, 2016; Adler et al., 2022). Landslide engineers and decision makers face a delicate challenge since data-driven hazard assessment methods are at risk of losing predictive power as boundary conditions change at timescales that are short compared to typically available landslide records (Haeberli and Whiteman, 2015; Patton et al., 2019). In this context, a process-based understanding of potential failure mechanisms is indispensable for identifying landslide hazard at sites considered stable under past conditions (Evans and Delaney, 2015; Schauwecker et al., 2019). This is especially true for debris flows initiating in permafrost-affected terrain due to the rapid alteration of slope stability in their initiation zones, their ability to traverse great distances at high velocities, and their high-impact forces (Petley, 2012; Dowling and Santi, 2014). Hence failure in remote areas which are typically characterized by data scarcity and incomplete monitoring has the potential to dramatically affect people and infrastructure far from debris flow initiation (Haque et al., 2016, 2019).
The European Alps are affected by severe increases in surface air temperature (∼ 0.3 ∘C per decade, exceeding global warming rates), altering snow cover dynamics and driving permafrost thaw (Beniston et al., 2018; Olefs et al., 2020; Fox-Kemper et al., 2021). The increasing frequency of high-intensity precipitation events amplifies the likelihood of landslides (Ranasinghe et al., 2021). Slope stability decreases as subsurface liquid water content, ice ductility, and permeability increase in response to permafrost degradation (Patton et al., 2019; Hock et al., 2019). Moreover, glacier retreat enhances the accumulation of loose, unstable sediment at high elevations (Deline et al., 2015; Hock et al., 2019). These changing environmental conditions alter the geotechnical and hydraulic ground properties and modify the characteristics and seasonality of landslides accordingly (Stoffel and Huggel, 2012; Gariano and Guzzetti, 2016; Patton et al., 2019). The consecutive variation in process chains and cascading events makes them especially difficult to predict under a changing climate, with potentially catastrophic consequences downstream (Deline et al., 2015).
The large sediment accumulations provided by active rock glaciers, i.e., distinct ice-debris accumulations slowly creeping downhill, pose a serious hazard in terms of landslide initiation. Thermo-hydro-mechanical processes determine the deformation characteristics of rock glaciers, with plastic deformation governed by permafrost ice content and temperature, while discrete shear failure is commonly initiated by elevated pore-water pressures along the failure surface (Arenson and Springman, 2005; Krainer et al., 2015; Kofler et al., 2021). Common deformation rates are on the order of decimeters to meters per year, accelerating across the European Alps in response to climate change (Hock et al., 2019; Marcer et al., 2021). Previous research demonstrated that hydrological processes fundamentally control the style and rate of rock glacier kinematics (Ikeda et al., 2008; Buchli et al., 2013, 2018; Cicoira et al., 2019). However, while the impact of thermokarst evolution on the storage and release of water in these landforms is well documented, its role in debris flow initiation at rock glacier fronts remains largely unknown (Krainer and Mostler, 2002; Winkler et al., 2018; Jones et al., 2019; Kainz, 2022).
Active rock glaciers constitute multi-hazard elements (Kappes et al., 2012; Gallina et al., 2016) in that they induce a spectrum of mass movement processes ranging from occasional rockfall to debris flow events, potentially involving complex chain processes (Burger et al., 1999; Kummert and Delaloye, 2018; Kummert et al., 2018). Debris flows initiated by destabilizing rock glacier fronts occur most frequently in response to heavy rainfall (e.g., Krainer et al., 2012; Marcer et al., 2020; Kofler et al., 2021). However, intense snowmelt, rain-on-snow events, and exceptionally warm periods have also been discerned as triggering factors (Lugon and Stoffel, 2010; Bodin et al., 2017; Kummert et al., 2018). Regardless of the detailed initiation process, the mechanics of debris flows require excessive amounts of water, capable of transporting the mobilized debris down the flow path (Soeters and van Westen, 1996).
The aim of this paper is to explore the destabilizing factors leading to the local failure of an active rock glacier front in the high-mountain Hüttekar cirque in the Austrian Alps. We analyze the cascading processes involving thermokarst lake outburst, debris flow, and river blockage. By evaluating a set of potential contributing factors and assessing critical factor combinations, we develop a consistent conception explaining debris flow initiation at the rock glacier front. Similarities and differences with respect to documented debris flows at other rock glacier fronts are analyzed, and conclusions are drawn regarding hazard potential.
The study site comprises the highest areas of Radurschl Valley, a valley in the western Ötztal Alps constituting a headwater tributary to the Inn River (Fig. 1). The landscape is characterized by rugged terrain including steep slopes and crests, interrupted by relatively flat domains covered by talus, moraines, and periglacial sediments. The area shows an exceptionally high rock glacier density (56 % areal coverage), as well as small remnants of cirque glaciers in its uppermost parts.
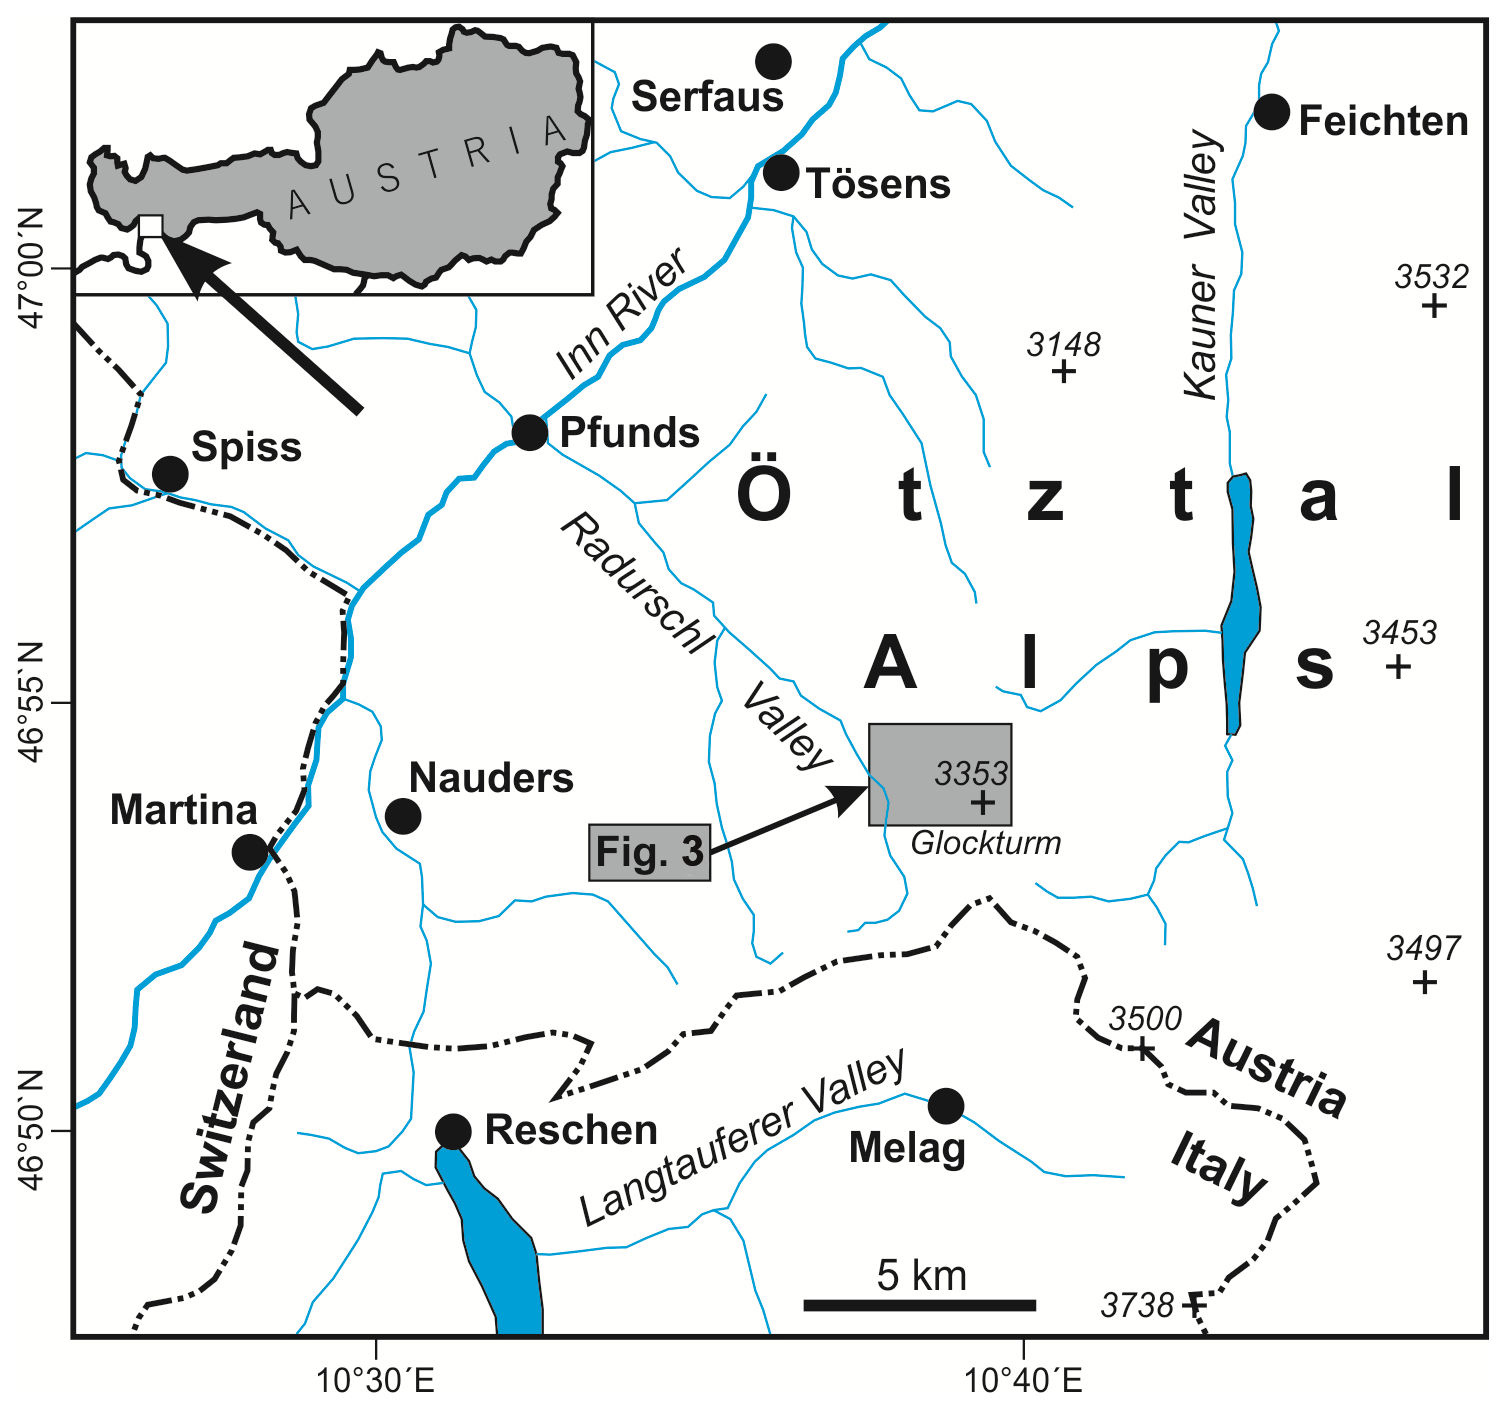
Figure 1Location map of Hüttekar cirque in the Ötztal Alps, Tyrol (Austria).
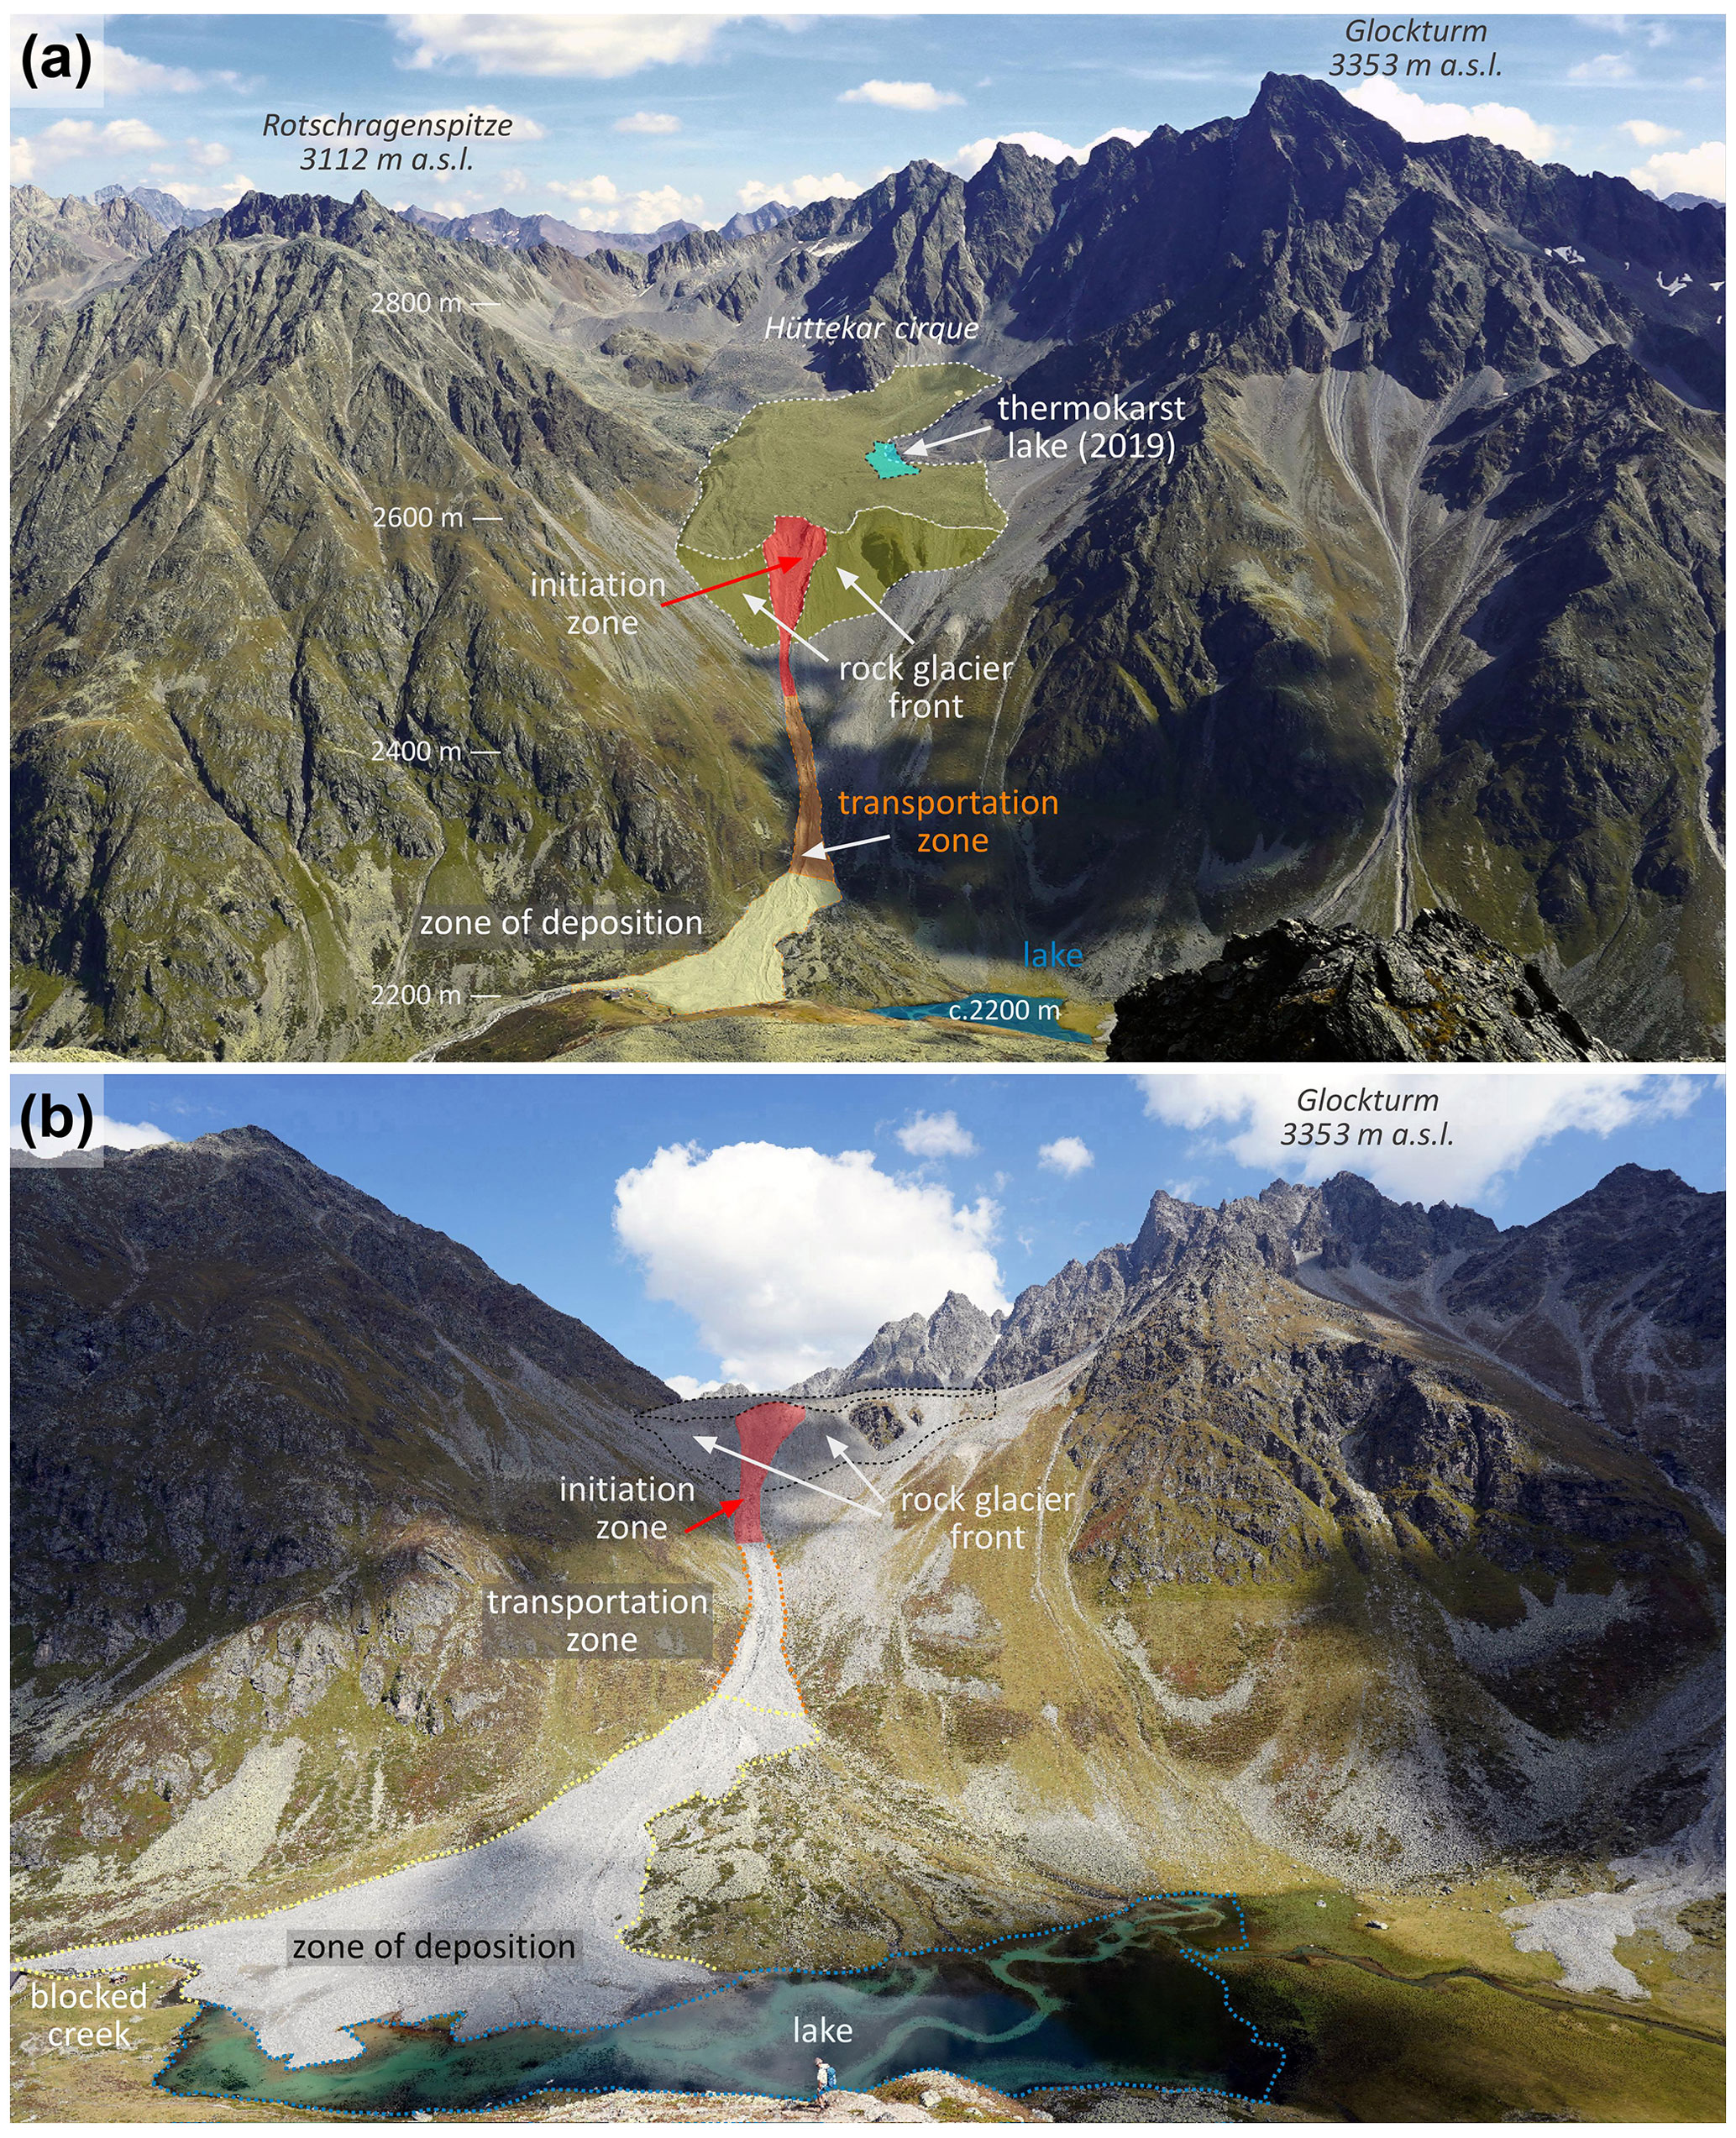
Figure 2(a) Illustration of Hüttekar cirque, Hüttekar Rock Glacier, the debris flow, and the impounded lake (view is towards the east). The debris flow was initiated at the steep front of Hüttekar Rock Glacier (highlighted), caused by rapid drainage of a thermokarst lake that existed between 1 June and 13 August 2019 (former position indicated). The debris flow path sections are outlined and labeled according to Hungr (2005). (b) Debris flow morphology 2 years after its initiation. The progressively enlarging initiation zone eroded already significant parts of the steep rock glacier front. The transport zone is characterized by a set of levees along a narrow channel. The former flow path of the blocked river is still clearly visible below the lake surface. The channel draining the lake was excavated to prevent a potentially catastrophic outburst following river blockage in August 2019 (photographs: Rudolf Philippitsch, 14 September 2021).
The specific cirque under consideration is Hüttekar cirque, a small (2.8 km2) headwater catchment encircled by ragged rock walls except to the west, where it steeply descends to Radurschl Valley (Fig. 2; 46∘54′ N, 10∘39′ E). Its altitude ranges from 2387 to 3353 m a.s.l. (above sea level), including a relatively flat valley bottom between 2600 and 2700 m a.s.l. (mean catchment altitude 2870 m a.s.l.). The terrain is composed of bedrock (38 %), mainly exposed in the highest parts. Talus and debris slopes (17 %) dominate along the valley sides, while the lower parts are covered by moraine deposits (12 %) and four rock glaciers (27 %). Two small, north-facing cirque glaciers (Glockturmferner, Hüttekarferner; 6 %) are situated at mean altitudes of 2853 and 3029 m a.s.l., respectively (Fig. 3).
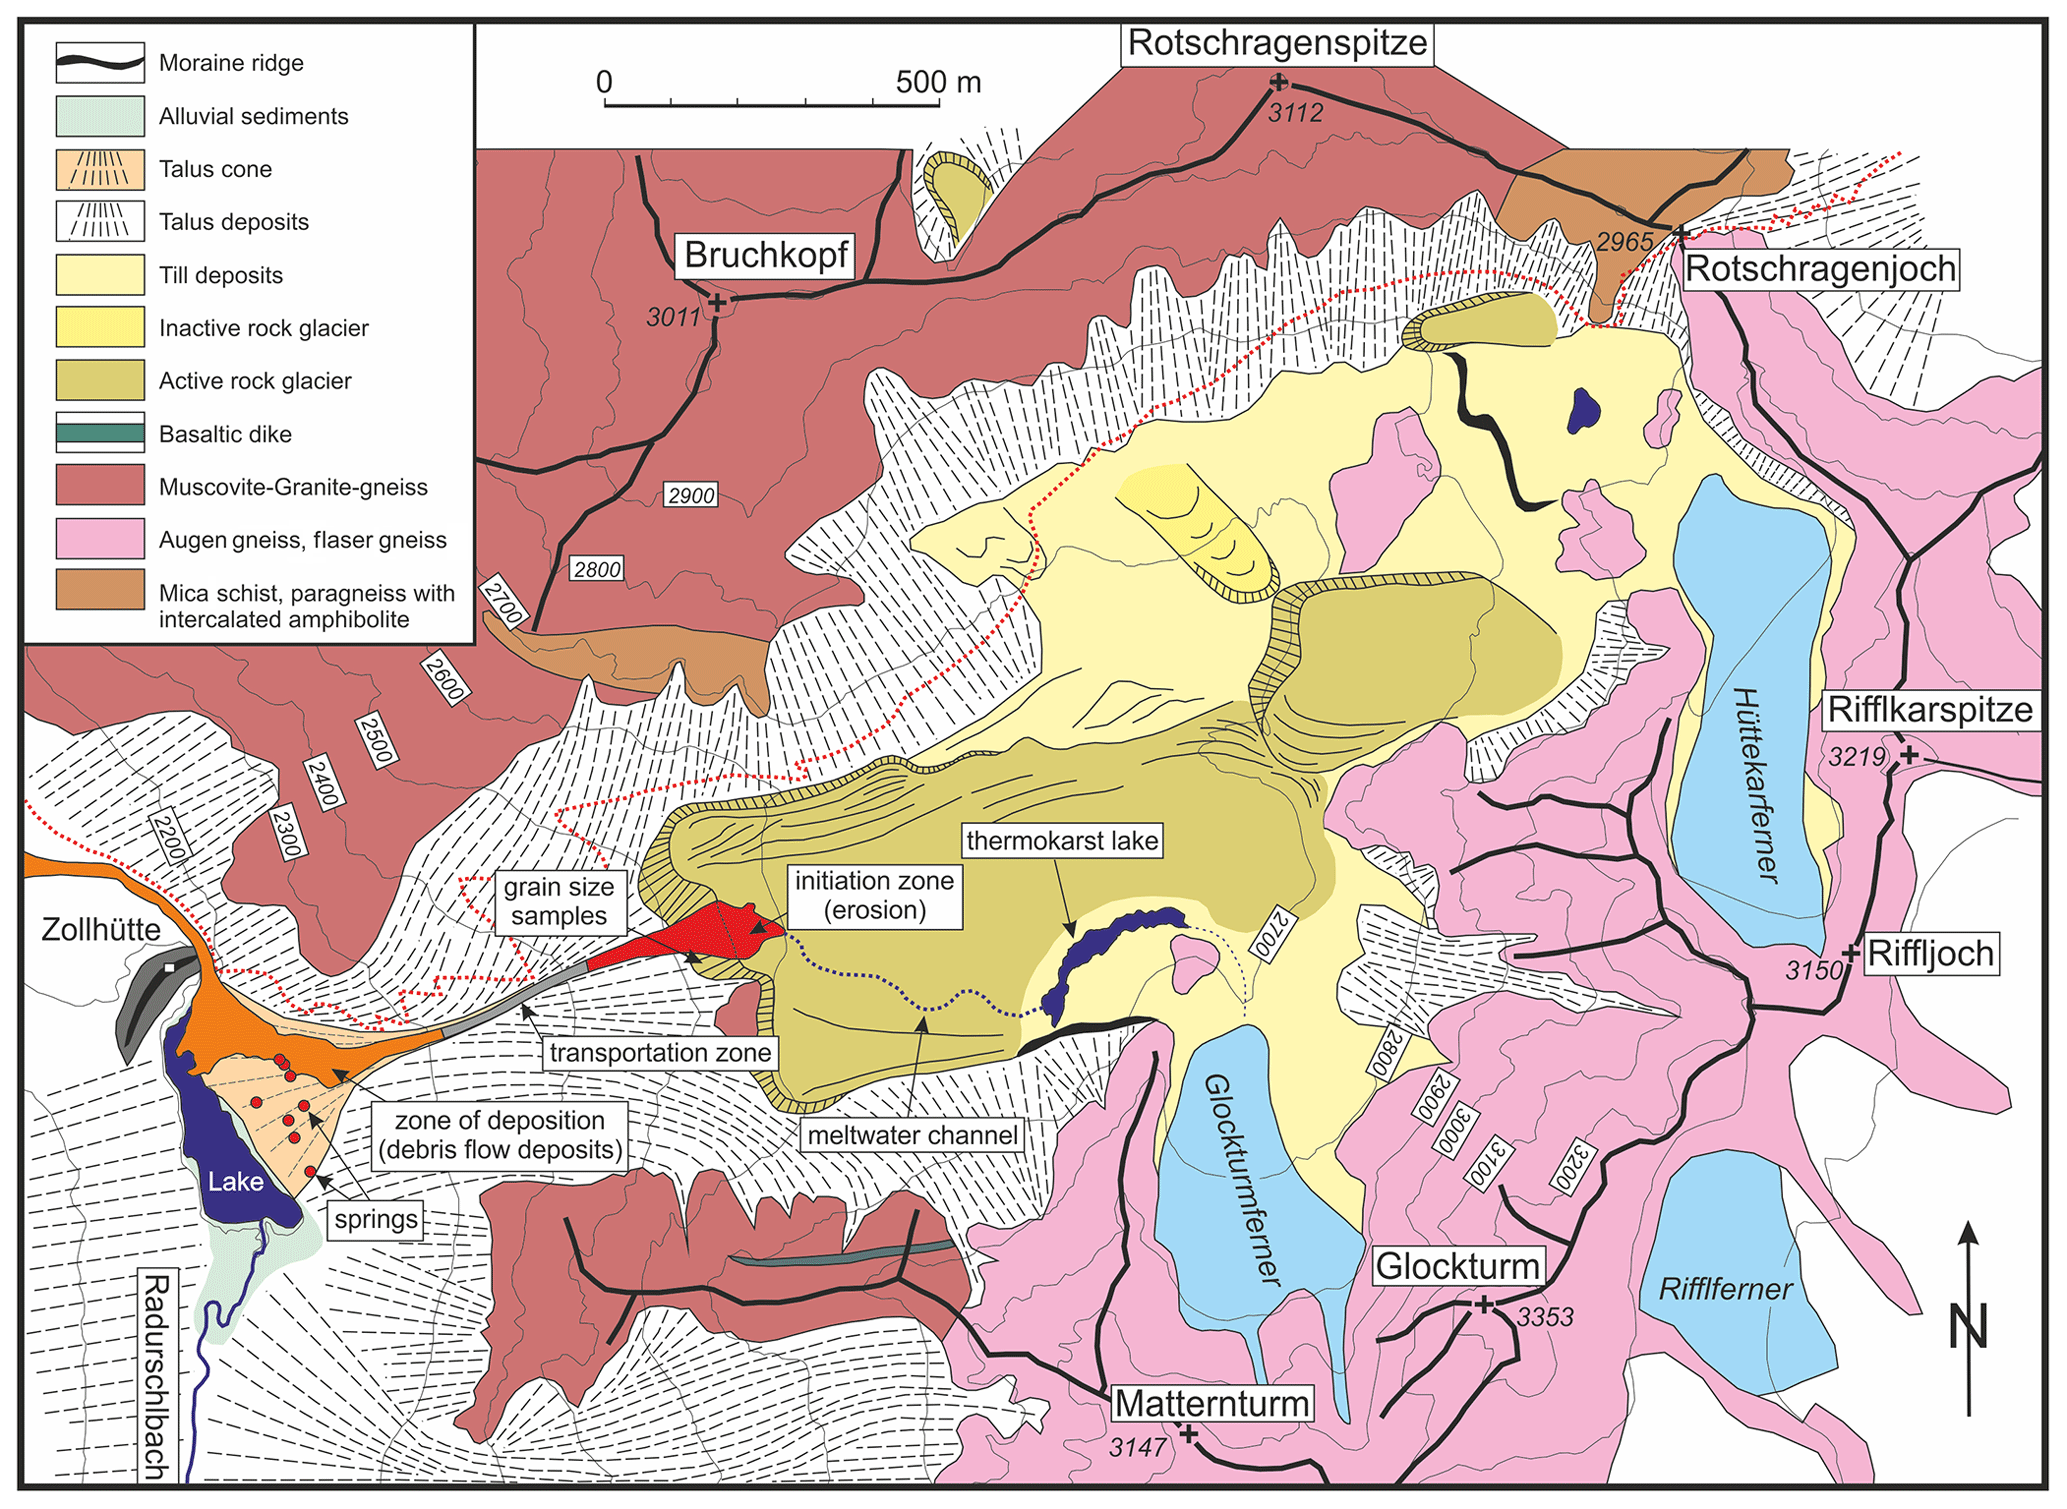
Figure 3Geological–geomorphological map, compiled using the most recent geological map provided by the Geological Survey of Austria (Moser, 2012). It is complemented by ortho-images and a high-resolution digital terrain model (DTM) derived from airborne laser scanning data (Government of the Province of Tyrol, 2021a). The map is based on comprehensive field mapping (2019–2022).
The bedrock lithology is composed of metamorphic rocks of the Ötztal–Stubai complex (Ötztal–Bundschuh nappe system; Hoinkes and Thöni, 1993; Schmid et al., 2004). The mountain ridges bordering the cirque to the south and to the east are dominated by orthogneiss (augen gneiss and flaser gneiss), the ridge to the north and northwest exhibits muscovite–granite–orthogneiss (Fig. 3). At Rotschragenjoch and south of Bruchkopf, paragneiss and mica schist with thin intercalations of amphibolite are exposed.
Table 1Long-term (1976–2019) mean monthly air temperature and precipitation in Hüttekar cirque. Values are calculated based on the continuously updated SPARTACUS dataset (Spatiotemporal Reanalysis Dataset for Climate in Austria), as described in Hiebl and Frei (2016, 2018).
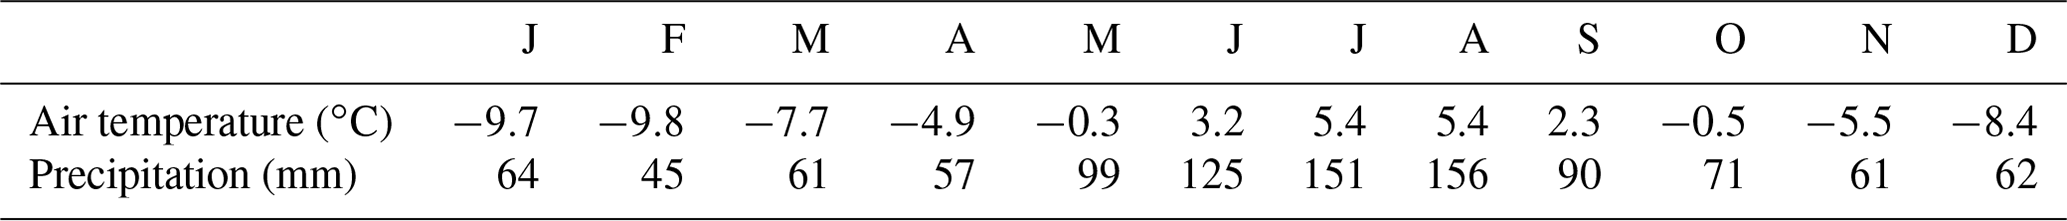
The local climate is influenced by the dry, inner-alpine conditions prevailing in the Ötztal Alps (Isotta et al., 2014). With respect to long-term (1976–2019) averages across Austria, annual precipitation is moderate (1042 mm) and mean annual air temperature is low (−2.5 ∘C), reflecting the high altitude of Hüttekar cirque and its central position close to the main chain of the Alps (corresponding areal averages across Austria are 1077 mm and 6.6 ∘C, respectively). Monthly precipitation reaches its maximum in August and its minimum in February, with the respective months corresponding to the highest and lowest mean air temperature (Table 1). The dry climatic conditions and the local elevation distribution promote the development of rock glaciers. The equilibrium line altitude of glaciers, rising from ∼ 3100 to ∼ 3300 m a.s.l. during the 20th century, is located within the steep summit region (Žebre et al., 2021). These unfavorable conditions for cirque glacier development allow rock glaciers to cover the extensive flat terrain above the lower permafrost boundary, ranging from ∼ 2400 to ∼ 2600 m a.s.l. (Kerschner, 1982; Ribis, 2017).
The largest rock glacier in this cirque, Hüttekar Rock Glacier, is 1408 m long and up to 493 m wide, covering an area of 0.5 km2 in the lowermost parts of the cirque (Fig. 3 and Fig. S1 in the Supplement). Its gently sloping surface is characterized by distinct furrows and ridges, while the steep front rests on top of a slope above Radurschl Valley. Rock glacier debris is composed of orthogneiss derived from the Glockturm massif. In the southeast, the lower, debris-covered parts of Glockturmferner transition into the rock glacier rooting zone. The exact boundary between debris-covered glacier and rock glacier is not known. Massive ice is frequently visible beneath a ∼ 1–2 m thick debris layer in a shallow depression at the southeastern edge of the rock glacier, close to the suspected transition zone. The debris layer consists of poorly sorted boulders with individual blocks measuring up to 4 m, arranged in a loose, clast-supported structure. The blocky surface layer covers a finer-grained layer dominated by poorly sorted gravel and sand that is exposed along the rock glacier front. The unfrozen domain of this heterogeneous debris layer increases irregularly in thickness towards the rock glacier front, reaching a maximal thickness of ∼ 5–10 m.
A small meltwater current from Glockturmferner infiltrates into the rock glacier rooting zone. Water flowing along the permafrost table is visible and audible between boulders at several places in the southern part of the rock glacier. These water currents follow distinct channels that can be traced below the boulders covering the rock glacier surface. Where visible between the boulders, the channels are up to 1 m wide and 20 cm deep (Fig. S1). Surface waterbodies in Hüttekar cirque are restricted to small meltwater lakes and currents in immediate vicinity to the two cirque glaciers. The absence of surface creeks in the lower parts of Hüttekar cirque indicates that it is drained exclusively by subsurface flow, emerging as a group of small springs at the toe of the slope descending to Radurschl Valley (Figs. 3 and S1). The exact number and position of these springs varies during the year, but they are constrained to the sedimentary cone covering the toe of the slope, as evident from 23 field surveys between 2019 and 2022 covering all months. Spring discharge of individual outlets is < 1 L s−1, and electrical conductivity ranges from 60 to 75 µS cm−1, as indicated by repeated measurements during these surveys.
A debris flow eroded the steep slope bordering Hüttekar cirque to the west (Fig. 2; classification according to Hungr et al., 2014). The event description given below is based on witness reports by Josef Waldner (staff of the nearby hut Hohenzollernhaus) and Gerhard Schaffenrath (local shepherd). In addition, the debris flow was documented during several field surveys as well as two helicopter flights by Roman Außerlechner, Thomas Figl, and Werner Thöny (Geological Survey of Tyrol) on 14 and 26 August 2019.
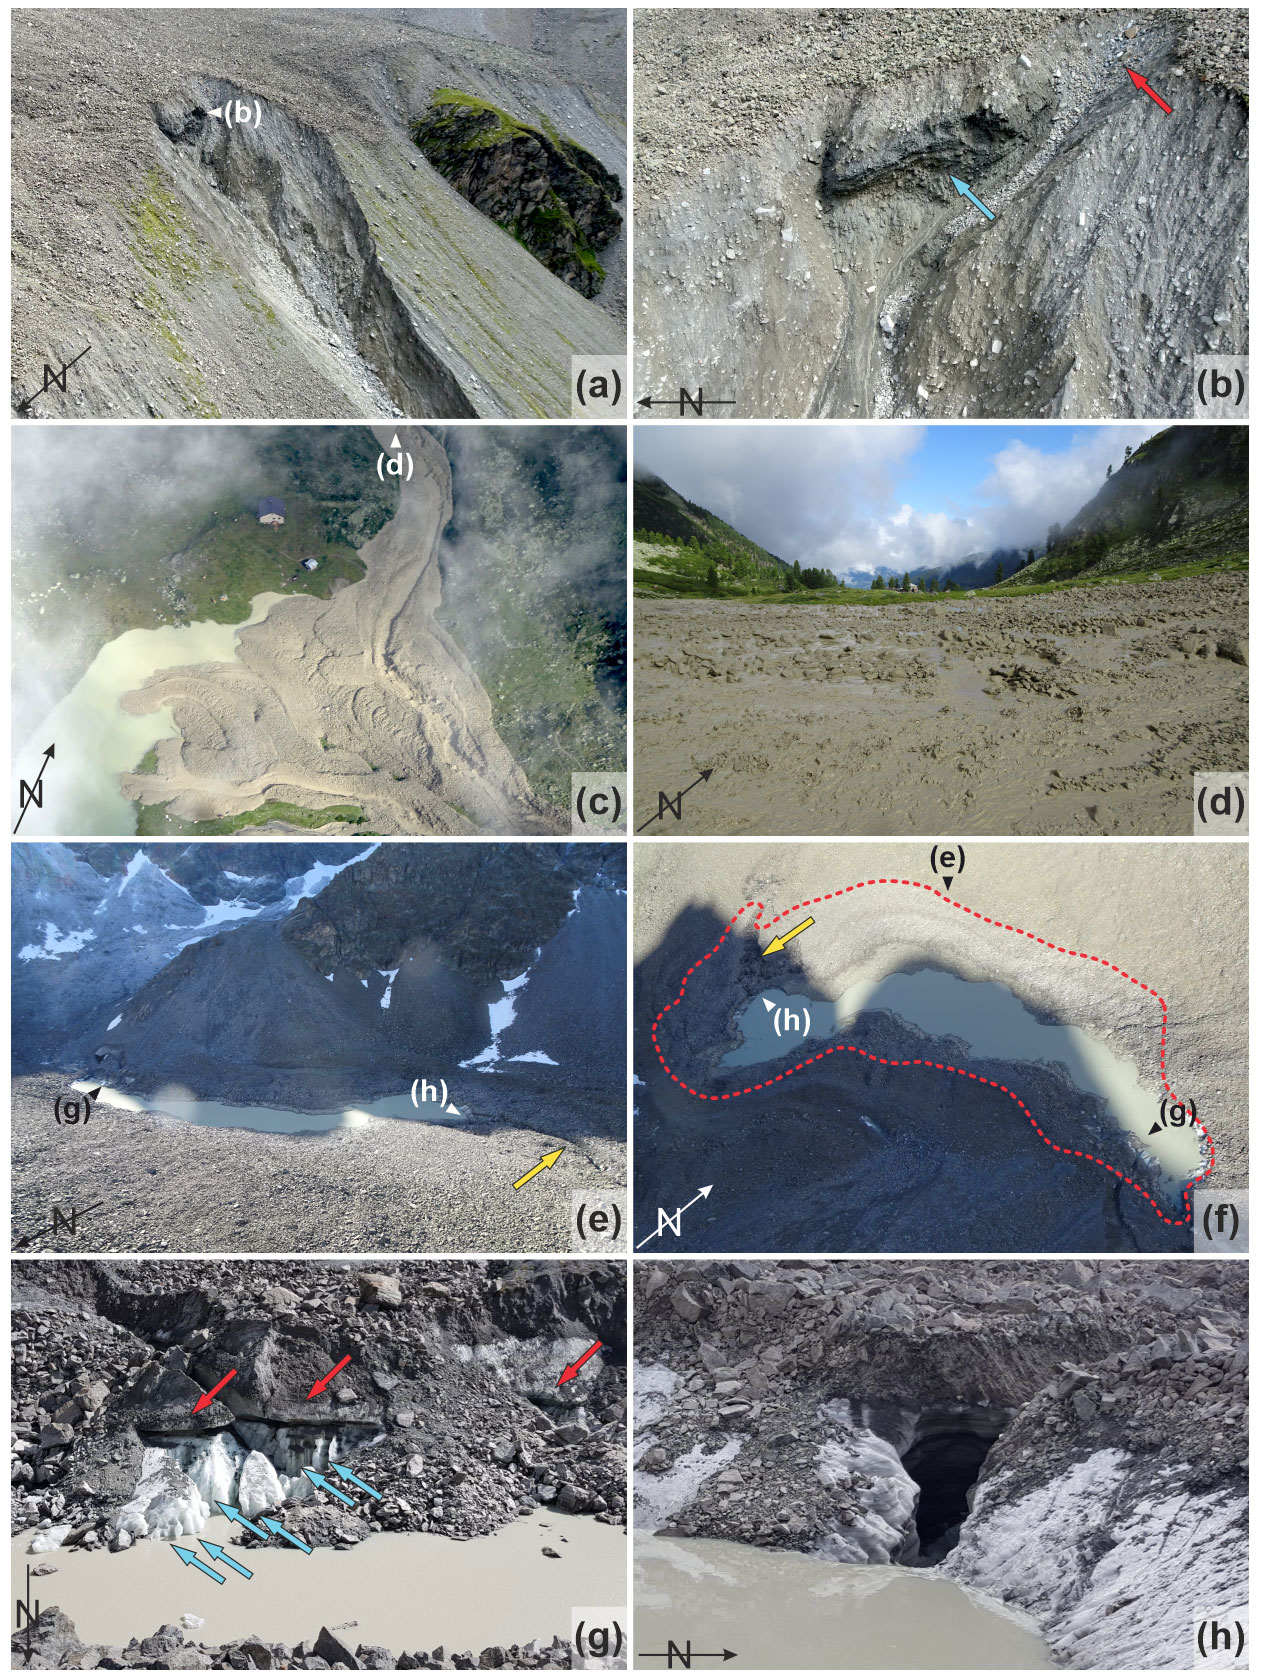
Figure 4Images documenting the debris flow event that initiated on 13 August 2019. (a) Debris flow initiation zone at the steep front of Hüttekar Rock Glacier. (b) Ice-cemented debris (blue arrow) exposed in the main scarp. Linear retrogressive erosion indicates concentrated water flow (red arrow). (c) Debris flow deposits blocking Radurschlbach. (d) Debris flow material. (e) Thermokarst lake and drainage channel (yellow arrow) on Hüttekar Rock Glacier. (f) Extent of thermokarst lake on 14 August 2019 and maximum extent 1 d earlier (dashed line). The channel connecting the lake to the debris flow initiation zone is indicated by the yellow arrow. (g) Impermeable ice underlying the thermokarst lake. Blue arrows indicate vertical convexities attributed to thermal convection of water during the lake development. Red arrows indicate undercutting of the ice along the lake shoreline, promoted by thermal convection. (h) Thermokarst channel eroded into the frozen rock glacier core, facilitating rapid drainage of the thermokarst lake. Photographs were taken on 13 August 2019 (g–h) by Josef Waldner, as well as on 14 August 2019 (c–f) and 26 August 2019 (a–b) by Roman Außerlechner, Thomas Figl, and Werner Thöny.
Following a moderate precipitation event, destabilization initiated on 13 August 2019, mobilizing a debris volume of several thousand cubic meters from the steep rock glacier front (Fig. 4a). The debris flow started at 03:00 CEST (central European summer time, UTC+2), and the main event lasted until about 12:00 CEST, followed by reduced debris flow activity that persisted until the next day. Slope failure initiated along an irregularly shaped rupture in ice-cemented debris, exposed at the main scarp (Fig. 4b). Accelerating and disintegrating, the transported mass evolved into a debris flow following a narrow channel down the steep slope below the rock glacier front (Figs. 2, 3, S2). About 200 m below the initiation zone, the material spread out and formed a fan of 33 000 m2, thereby damming the river Radurschlbach at an elevation of 2200 m a.s.l. (Figs. 4c, d, S1, and S2). Consequently, a lake covering an area of ∼ 60 000 m2 developed in Radurschl Valley, causing the downstream riverbed to fall dry temporarily (Figs. 4c, S1, and S2). Excavation of a drainage channel lowered the mean water depth from 2 to 1 m during the following days to prevent a potentially catastrophic outburst. Subsequently, a dam was constructed on the debris fan to restrain future debris flows from damming Radurschlbach again.
Based on in situ observations, aerial photographs, and several surveys conducted before and after the debris flow event, a total volume of 40 000–50 000 m3 of mobilized sediment is estimated, providing a rough indication of the event magnitude. The quoted water depths are reconstructed from in situ observations and reviewed by mapping the maximum lake before and after channel excavation, as well as corresponding volume calculations employing a high-resolution (1 × 1 m) digital terrain model (DTM) based on airborne laser-scanning data acquired 1 year before debris flow occurrence (Government of the Province of Tyrol, 2021a).
During the same night as the debris flow initiation, a thermokarst lake on top of Hüttekar Rock Glacier started draining ∼ 350 m behind the debris flow initiation zone and emptied almost completely during the following day, as indicated by local observations (Figs. 3, 4e, f, Supplementary Video). The thermokarst lake had started to develop coincidently with the sudden onset of intense snowmelt in early June 2019 within a shallow depression where massive ice within the rock glacier prevented drainage (Fig. 4g). In the stage of its largest extent, the thermokarst lake was approximately 300 m long, up to about 150 m wide, and 4–5 m deep, comprising an estimated water volume of ∼ 150 000 m3.
Effective drainage occurred through a large crevasse (width ∼ 1.5 m, height ∼ 2 m) that formed in association with the debris flow initiation (Fig. 4h). The crevasse was part of a newly formed channel system connecting the thermokarst lake to that part of the rock glacier front that failed, constituting the debris flow initiation zone. While the exact vertical position of this channel system is not known, clearly discernible and precisely confined collapse structures indicate the trace of this channel network along the rock glacier surface (Figs. S1 and S3). Large amounts of water were rapidly transferred to the debris flow initiation zone where retrogressive linear erosion indicates that concentrated water flow emerged at the main scarp (Fig. 4b). During the following months, erosion of loose sediment in the vicinity of the debris flow initiation zone persistently modified its shape and continues to widen it until today. The depression storing the former thermokarst lake never filled again but still shows distinct morphology (Figs. S1 and S3).
During the decades preceding the debris flow event, thermokarst lakes had never been observed before on Hüttekar Rock Glacier despite frequent visits by hikers, hunters, shepherds, and staff of Hohenzollernhaus (Josef Waldner, personal communication, 2020). In line with these observations, publicly available remote sensing data and historical maps of Hüttekar cirque do not exhibit any indications of thermokarst lake development on Hüttekar Rock Glacier before June 2019 (evident from Sentinel-2 satellite imagery provided by Copernicus and processed by Sentinel Hub, Sentinel Hub, 2020; historical ortho-images, Government of the Province of Tyrol, 2021b; historical laserscans, Government of the Province of Tyrol, 2021c; and historical maps, Government of the Province of Tyrol, 2021d).
The inherent stability of the slope determines its response to changes affecting the balance of driving and resisting forces (Crozier, 2010). A systematic identification of factors promoting slope instability is conducted by differentiating (Glade and Crozier, 2005)
-
predisposing factors (inducing a static setting that enhances the destabilizing impact of dynamic factors),
-
preparatory factors (dynamic factors shifting the slope towards a state susceptible to failure), and
-
triggering factors (dynamic factors initiating failure).
We evaluate the impact of individual factors on slope stability and identify critical factor combinations to reconstruct the failure mechanism. The chosen methods aim at maximizing comparability to earlier studies on debris flow initiation at active rock glacier fronts. All analyzed data and employed software are freely available, and the respective links are provided in the “Data availability” section.
4.1 Predisposing factor analysis
An unfavorable topographical setting is a necessary precondition for rock glacier front failure. The impact of morphometric factors including slope angle, length, and curvature is evaluated using the high-resolution DTM mentioned above (Government of the Province of Tyrol, 2021a). Morphometric analyses are conducted applying SAGA GIS 2.1.4 (Conrad et al., 2015a, b). Slope angle and downslope curvature calculations (Freeman, 1991) are performed using a smoothed (cubic convolution resampling to 10 × 10 m) DTM to detect the fundamental topographical features.
The spatial permafrost distribution is estimated by utilizing the Alpine Permafrost Index Map, providing a static proxy for potential permafrost occurrence and its spatial coherence (Boeckli et al., 2012a, b). While the dynamic effect of climate change is not considered explicitly by the index map, permafrost degradation is expected to intensify close to the lower permafrost boundary (Marcer et al., 2019). The local influence of topography on the energy available for permafrost degradation is assessed by calculating the potential incoming solar radiation based on the DTM. Calculations of mean annual solar radiation under clear-sky conditions are performed employing GRASS GIS 8.0 (Landa et al., 2022) module r.sun (Hofierka et al., 2007), assuming an average surface albedo of 0.2.
The grain size distribution of the rock glacier front material is inspected by wet-sieving four samples taken in 2009, 50 m southwest of the later debris flow initiation zone (position indicated in Fig. 3). Due to the heterogeneous structure of the rock glacier, these samples are not representative of the grain size composition of the entire rock glacier. However, considering the proximity of the sampling locations to the subsequent debris flow initiation zone, as well as the dangerous sampling conditions at active rock glacier fronts in general, we consider these samples reasonable approximations of the grain size composition of the debris flow source material.
4.2 Preparatory factor analysis
Time series of ortho-images are used to quantify rock glacier surface displacement rates and the evolution of surface features indicating destabilization (including cracks, crevasses, and scarps; Avian et al., 2007; Roer et al., 2008; Delaloye et al., 2013; Marcer et al., 2019). The analyzed ortho-images exhibit a spatial resolution of 20 cm and are provided as Fig. S3 (Government of the Province of Tyrol, 2021b). In the observation period 1970–2020, 200 prominent blocks, geometrically well distributed on the rock glacier surface, are visually identified at every ortho-image epoch to approximate the horizontal surface displacement rates at the respective location within single periods (1970–2003–2007–2010–2020; Avian et al., 2009; Kummert and Delaloye, 2018). Additionally, the position of the rock glacier front line (top of the erosional slope) is mapped at every epoch. Visual detectability within optical imagery is approximately half of a pixel size (in this case 10 cm). Assessed surface displacement rates cover at least 3 years; thus minimum rates of 3–4 cm a−1 are detectable.
The hydrometeorological conditions preceding the debris flow are contextualized by comparing them to past conditions. The long-term evolution of air temperature and precipitation in Hüttekar cirque is evaluated using the gridded (1 × 1 km) SPARTACUS dataset (Spatiotemporal Reanalysis Dataset for Climate in Austria; Hiebl and Frei, 2016, 2018). The dataset is continuously updated by GeoSphere Austria. Daily precipitation totals and 24 h mean air temperature data observed from 1976 to 2019 are extracted and averaged across Hüttekar cirque. The averaging domain corresponds to the Hüttekar Rock Glacier catchment as specified by Wagner et al. (2020a). We calculate the annual positive degree day sum (daily mean air temperature > 0 ∘C) as a proxy for available melting energy, as well as the precipitation due to very wet days (> 95th percentile), which reflects the annual magnitude of heavy precipitation events (Klein Tank et al., 2009; Cuffey and Paterson, 2010). The impact of these climate indices is assessed by comparing their respective values during summer 2019 (1 June–13 August, failure date) to previous years (1976–2019). To estimate changes in their central tendency, trend direction and rate of change are evaluated using the nonparametric seasonal Mann–Kendall test and Theil–Sen slope, respectively (Hirsch et al., 1982; Hirsch and Slack, 1984). Calculations are performed employing R packages “rkt” 1.6 (Marchetto, 2021) and “climdex.pcic” 1.1 (Bronaugh, 2020), implemented in R 4.2.0 (R Core Team, 2022).
For each winter season, the cumulated snowmelt volume in Hüttekar cirque is calculated and compared to the 2018/19 season. The rate of snowmelt is approximated by the respective seasonal average during the time span between maximal snow volume and complete ablation of the winter snow cover, in an analogous way to Kofler et al. (2021). Snow cover development is assessed using the spatially distributed, physically based snow cover model SNOWGRID (Olefs et al., 2013). The model employs a simple two-layer scheme, considering settling, the heat and liquid water content of the snow cover, snowline depression effects, and the energy added by rain. Snow density, snow water equivalent, snow temperature, liquid water content, bottom liquid water flux, and surface albedo are calculated at hourly resolution. The model employs a 100 × 100 m bilinear interpolation of the INCA dataset (Integrated Nowcasting through Comprehensive Analysis; Haiden et al., 2011) in combination with schemes for radiation and cloudiness based on ground measurements, satellite products, and high-quality solar and terrestrial radiation data (Olefs et al., 2013, 2016). The resulting snow cover data are routinely evaluated and validated by GeoSphere Austria using more than 50 station measurements of snow depth, additional measurements regarding snow depth and snow water equivalent (five stations along with more than 200 individual measurements), snow depth measurements employing laser sensors, winter mass balance measurements of glaciers within the model domain, spatial validation of snow cover extent using satellite-based fractional snow cover area provided by MODIS, and cumulative runoff data (Olefs et al., 2020).
The total volume and average rate of ice melt are calculated for each year between ablation of the snow cover and 13 August (failure date), based on the surface energy balance for the respective glacier (Hock, 2005; Cuffey and Paterson, 2010). Ice melt rates are calculated at hourly intervals by evaluating radiative, turbulent, and advective energy fluxes per glacier derived from INCA, assuming a constant glacier surface temperature of 0 ∘C (considered a reasonable approximation for the ablation zones of temperate glaciers during the summer season; Cuffey and Paterson, 2010). Shortwave net radiation is calculated by evaluating global radiation, accounting for the reflective and shadowing influences of topography as outlined in Sect. 4.1. Atmospheric conditions influencing longwave radiation are considered following Greuell et al. (1997) and Oerlemans (2000). Sensible and latent heat fluxes are calculated by the parameterization of the respective transport processes based on turbulence similarity (Cuffey and Paterson, 2010). The rainfall heat flux is estimated assuming that rainfall temperature approaches the near-surface air temperature. Physical specifications and plausibility evaluation are provided in Appendix A.
4.3 Triggering factor analysis
In order to evaluate the impact of the rainfall event immediately preceding the debris flow on 13 August 2019, rainfall time series are extracted from INCA at hourly resolution, averaged across the potential contributing area (Hüttekar cirque), and discretized into single events by defining a minimum of 24 h between individual events (Nikolopoulos et al., 2015; Marra et al., 2016). The inclusion of 12 weather stations at a distance < 25 km from Hüttekar cirque, in combination with C-band radar measurements and Meteosat Second Generation satellite products, allows reliable identification of event characteristics at the study site. Calculations are performed employing the R package “IETD” 1.0 (Duque, 2020), implemented in R 4.2.0 (R Core Team, 2022). The resulting ensemble of rainfall event duration, volume, and average intensity is analyzed by conducting a frequency analysis. The severity of individual events is assessed employing the frequentist approach developed by Brunetti et al. (2010) and Peruccacci et al. (2012). The rainfall event characteristics immediately preceding the slope failure are compared to earlier events hitting Hüttekar cirque, as well as to regional critical rainfall thresholds for debris flow initiation (Nikolopoulos et al., 2015; Marra et al., 2016).
The breakthrough of thermokarst channels within the rock glacier is facilitated by a positive feedback mechanism of energy transfer along the channel system inducing ice melt and channel enlargement, which in turn increases discharge and accelerates channel growth (Huggel et al., 2004; Clague and O'Connor, 2015). Dimensional analysis indicates that the energy provided by the upstream waterbody governs expansion rates of the drainage system (Clarke, 1982, 2003; Cuffey and Paterson, 2010). The prediction of the specific channel system evolution is impossible without exact knowledge of its geometry and hydraulic properties. However, the estimation of the thermokarst lake energy budget represents a measure of the total energy available for thermokarst development. Undercutting and vertical pipe structures eroded into the ice along the lake shoreline provide field evidence for thermal convection (Fig. 4g), promoting energy turnover and melting of ice beneath the lake while constraining the surface water temperature to < 4 ∘C due to negative thermal expansion (Haeberli et al., 2001; Kääb and Haeberli, 2001; Werder et al., 2010). Rapid transfer of energy exchanged at the lake surface to the ice sealing the lake bottom keeps the water at roughly constant temperature, thus allowing for an assessment of the lake energy balance based on INCA data (physical specifications are provided in Appendix A). The spatiotemporal evolution of the thermokarst lake on Hüttekar Rock Glacier is deduced by combining Sentinel-2 multi-spectral satellite data and the latest (2018) available DTM, characterizing the lake surface area dynamics and corresponding water volume development (modified Copernicus data 2020 processed by Sentinel Hub, 2020; Government of the Province of Tyrol, 2021a). Due to the dynamic nature of the rock glacier surface, volume estimates are considered rough estimates that fail to account for water stored in the pore space and potential intra-permafrost channels.
5.1 Predisposing factors
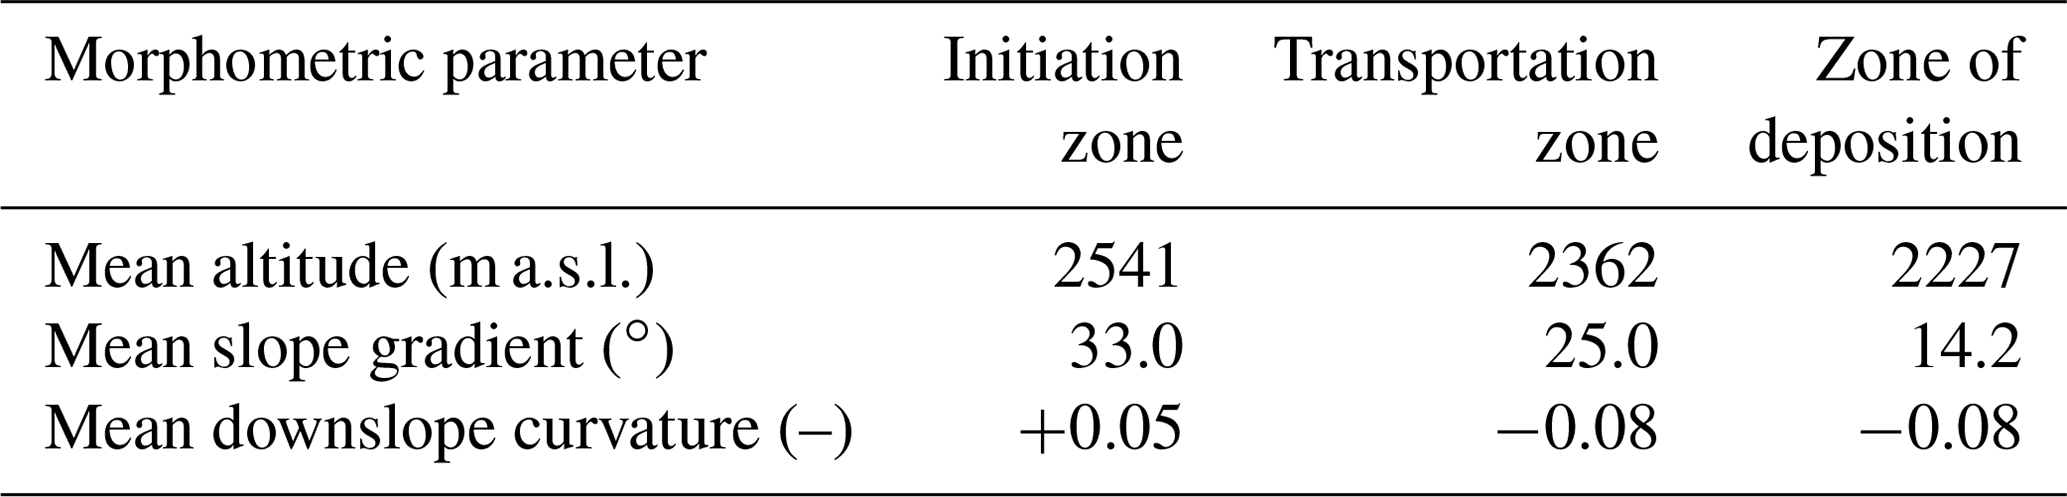
Morphometric analysis of the study area reveals several features promoting debris flow development. The slope (900 m long and 400 m in elevation difference) bordering Hüttekar cirque to the west shows a very steep, convex top and a steep, concave main part (Fig. 5a, b). Prior to landslide initiation, the prospective initiation zone was characterized by steep slope angle and convex downslope curvature (Table 2). It formed a part of the 400 m wide and 100 m high rock glacier front, bounded to the top by a distinct erosional edge separating it from the flat rock glacier surface. The steep rock glacier front (35∘ on average) exhibited a roughly homogeneous appearance, except for two bedrock outcrops in its southern part. A direct comparison of this area before and after the debris flow event is provided in Fig. S4.
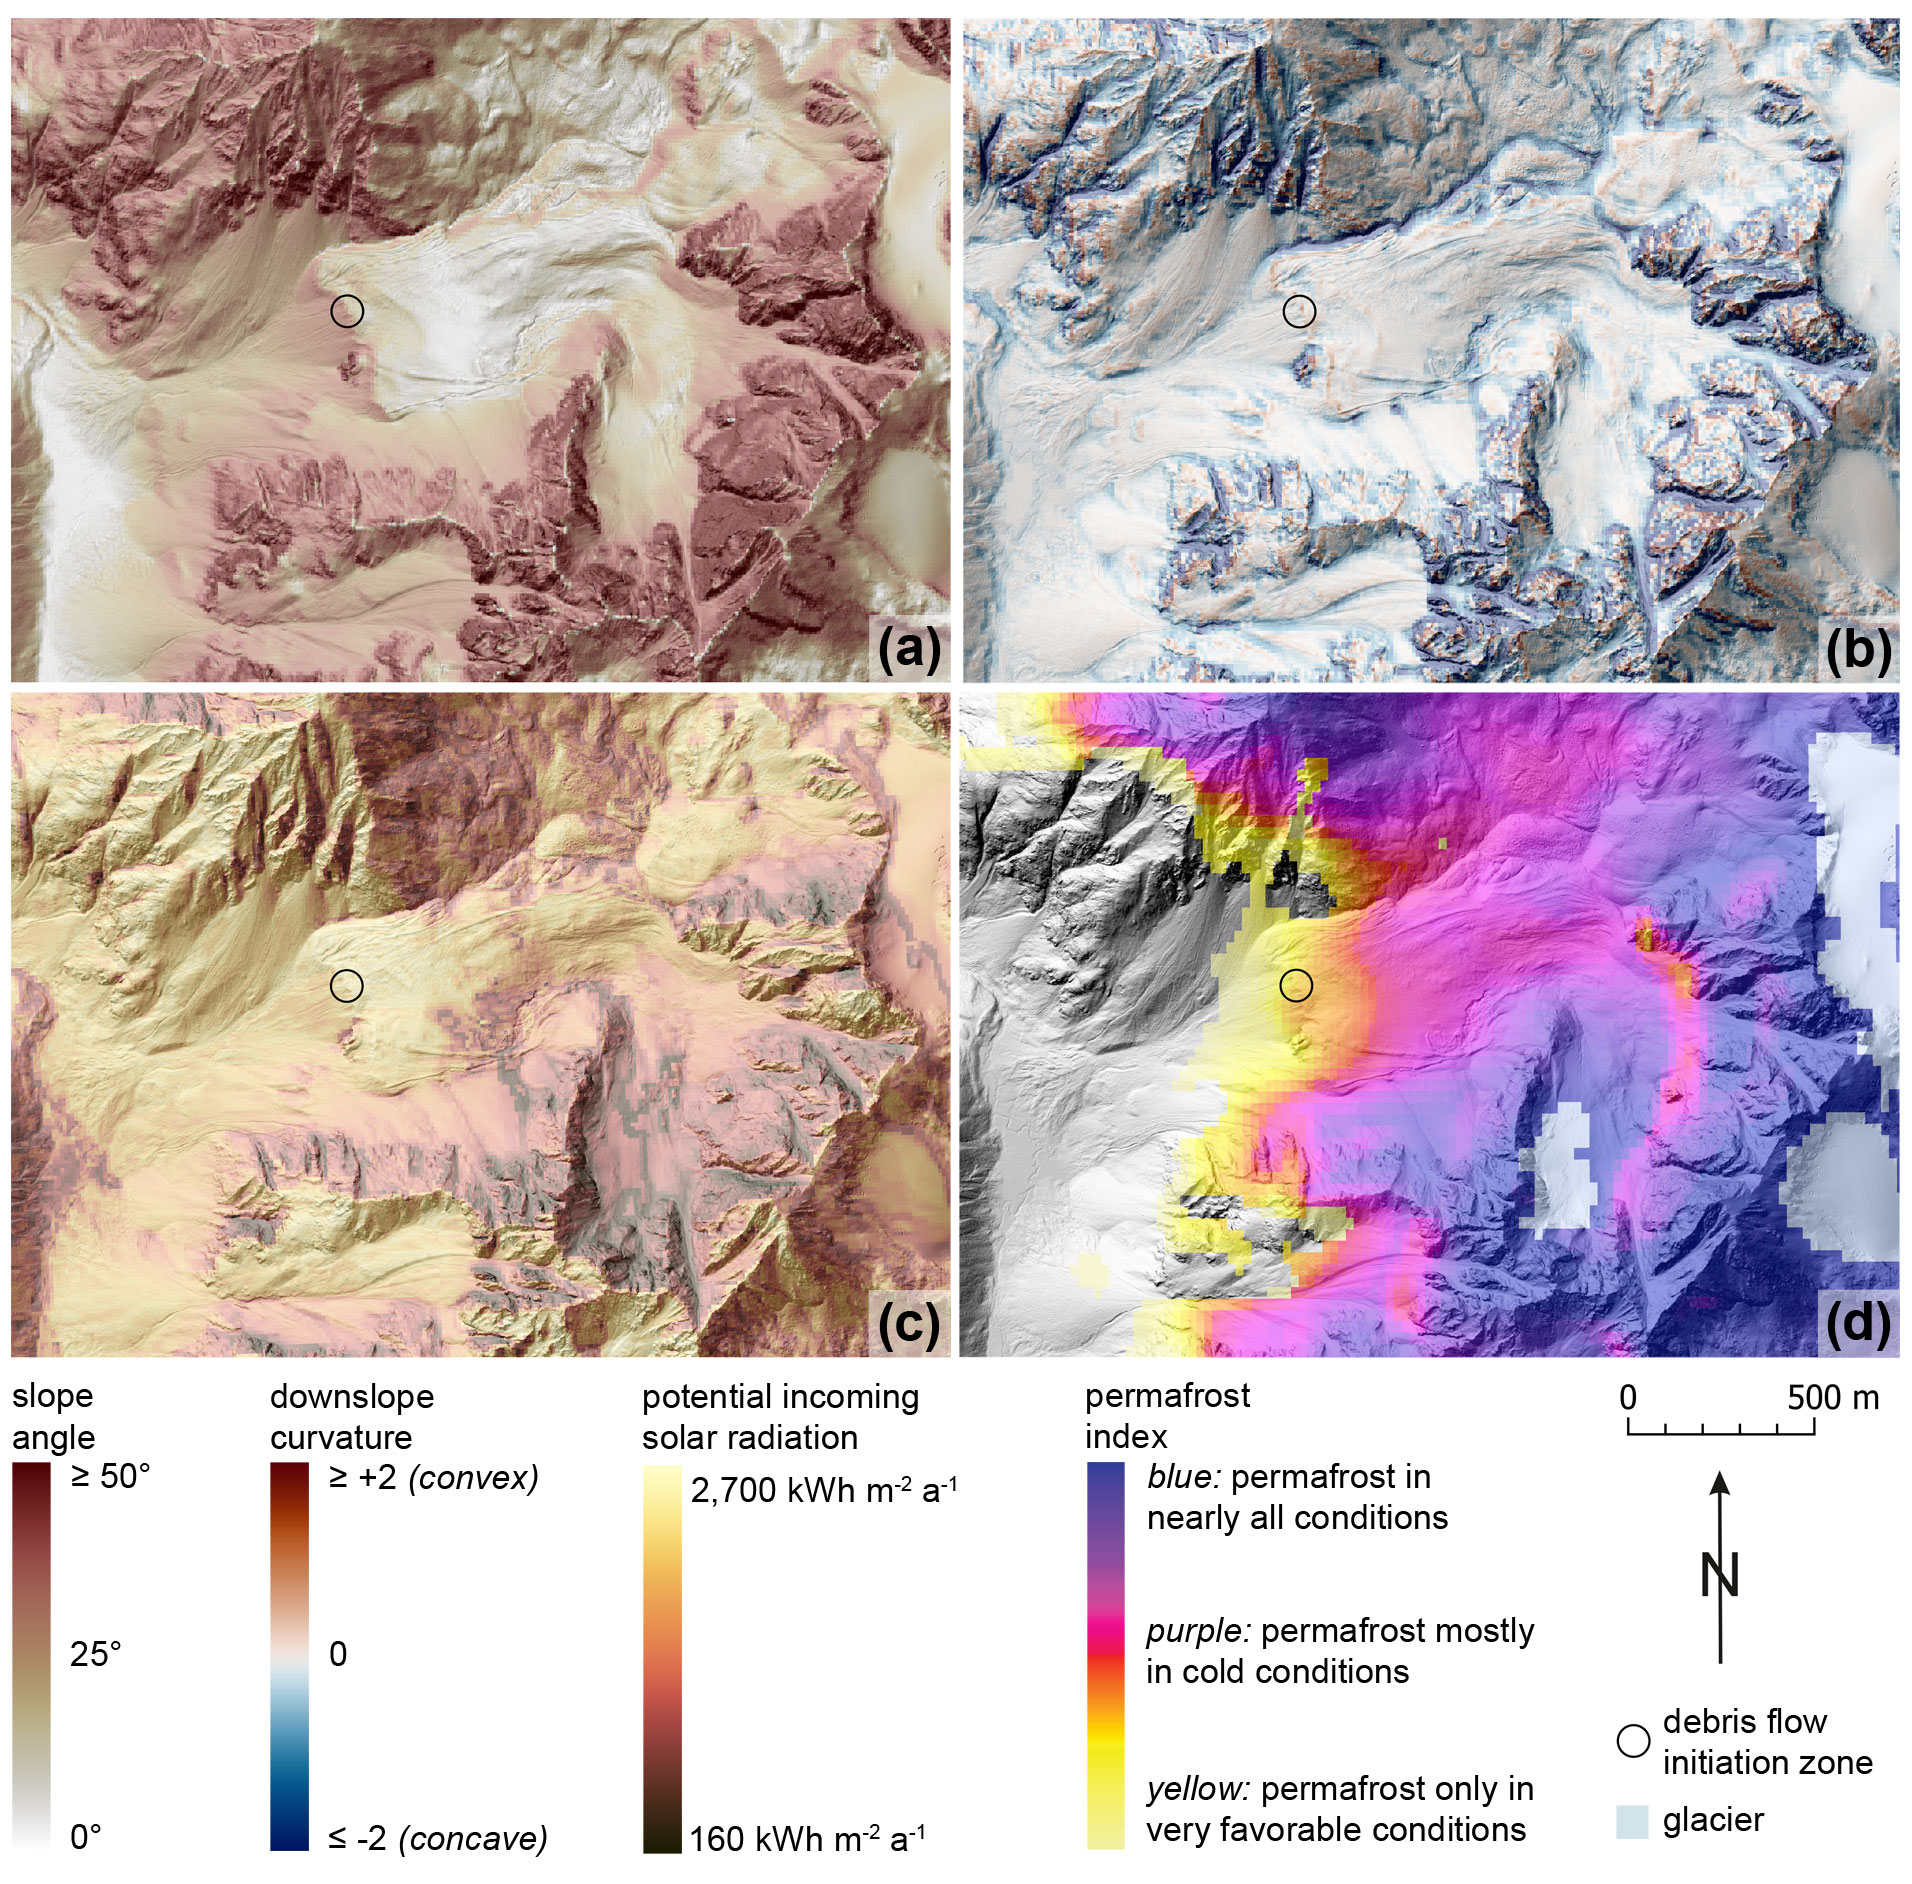
Figure 5Spatial distribution of predisposing factors across Hüttekar cirque prior to debris flow initiation. (a) Slope angle, indicating that the debris flow initiated in steep terrain (33∘). (b) Downslope curvature, demonstrating that convex topography prevailed in the initiation zone before the debris flow event (+0.05). (c) Potential incoming solar radiation, illustrating the high-energy environment characterizing the debris flow initiation zone (2135 kWh m−2 a−1). (d) Permafrost index, indicating that the debris flow initiated close to the lower permafrost boundary (Boeckli et al., 2012a). Terrain analyses are based on a high-resolution DTM acquired 1 year before debris flow occurrence by the Government of the Province of Tyrol (2021a). Perceptually uniform and color-vision-deficiency-friendly color maps are provided by Crameri (2018).
Table 2Morphometric analysis based on a high-resolution DTM acquired 1 year before debris flow occurrence by the Government of the Province of Tyrol (2021a). Results are given as averages across the debris flow initiation zone, transportation zone, and zone of deposition (indicated in Fig. 3).
Sieve analyses of the rock glacier front material (Fig. 6) show that gravel (64 %) and sand (25 %) are the dominating grain sizes, while the amount of clay and silt is very low (< 1 %). Detailed results are provided in Table S1. The samples are extremely poorly sorted (sorting value 4.4 after Folk and Ward, 1957). Loose deposits of sediments exhibiting similar grain size distributions are well known to respond to shearing in a contractive manner and constitute characteristic debris flow material (Iverson, 1997; Savage and Baum, 2005). Experimental investigations of similarly composed source material confirm these observations, identifying a contractive response to shearing and pore pressure diffusion timescales exceeding the duration of debris flow motion as major prerequisites for mobilization (dashed lines in Fig. 6; Major, 1996; Iverson, 1997).
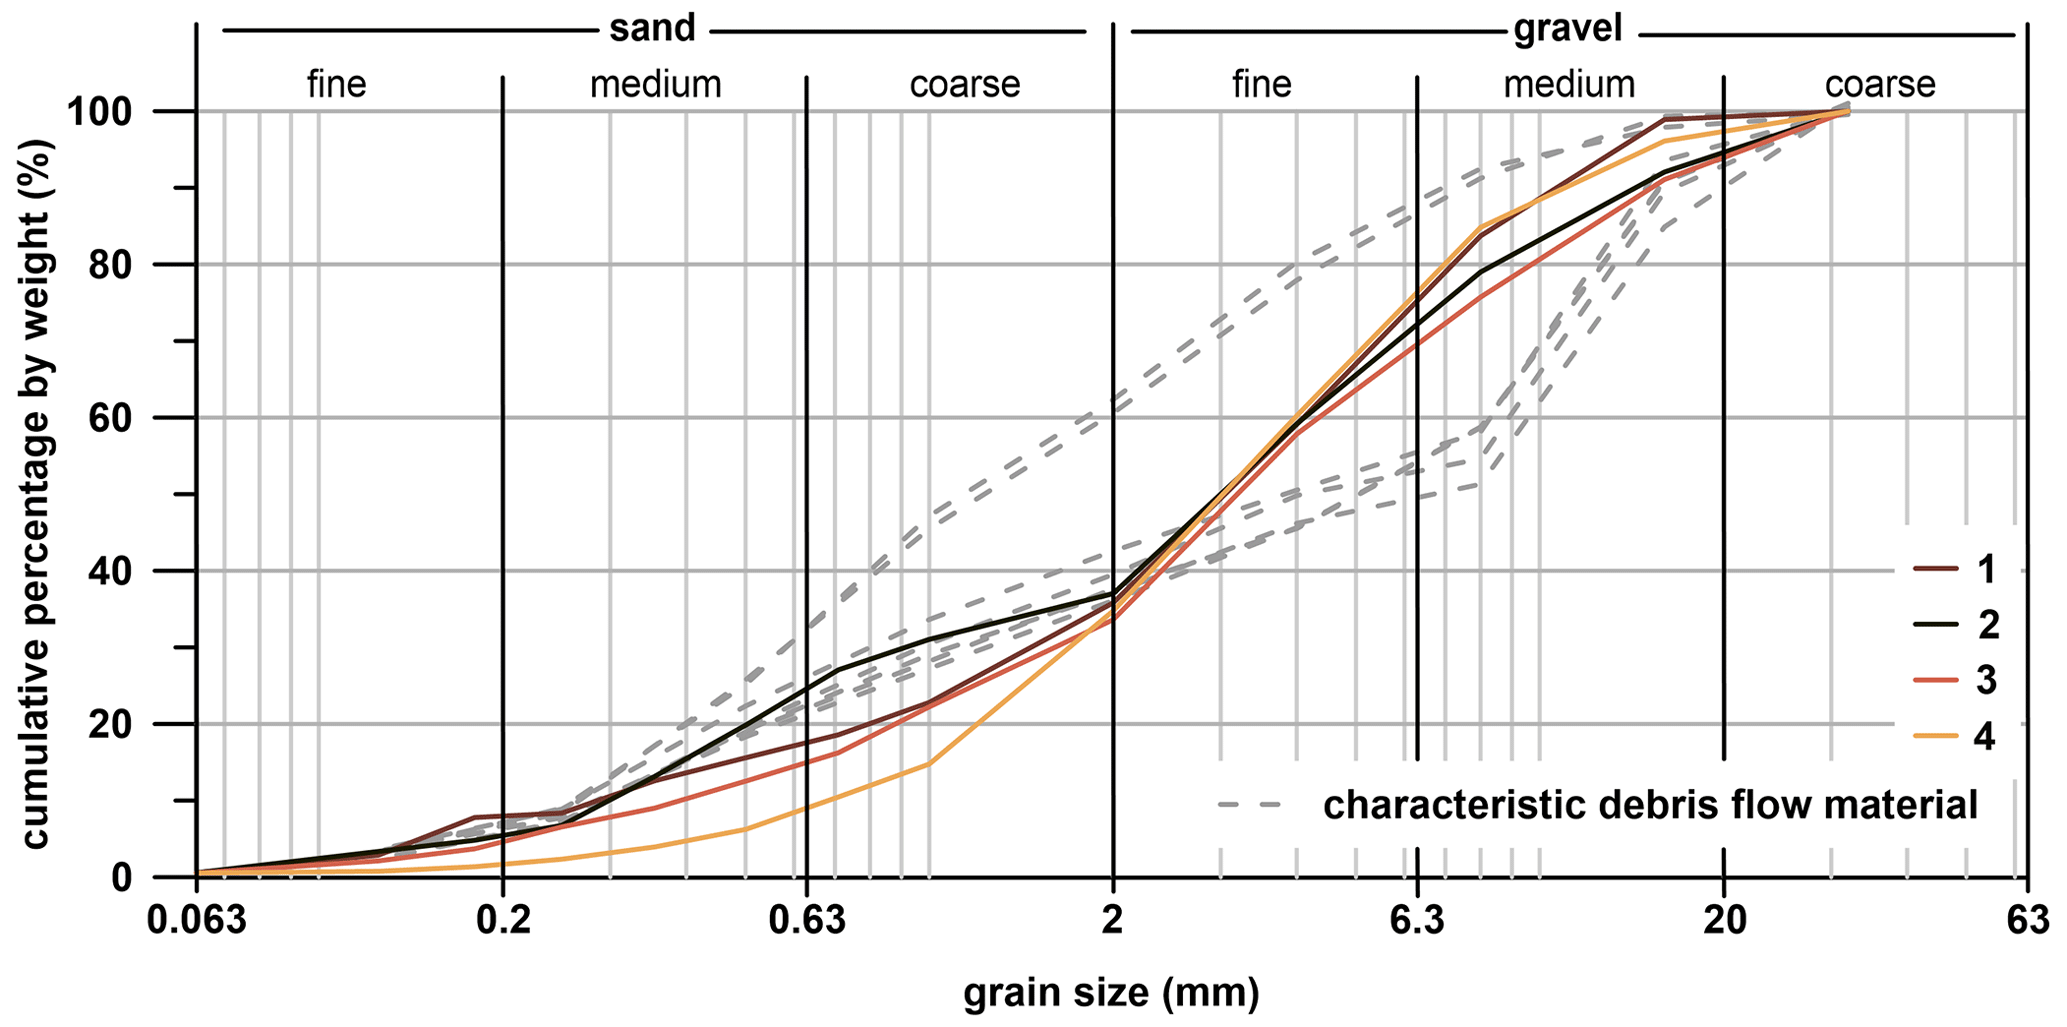
Figure 6Grain size distributions of material composing the rock glacier front. The corresponding sampling locations are 50 m southwest of the debris flow initiation zone, as indicated in Fig. 3. Dashed grey lines represent source compositions of a set of experimentally investigated debris flows showing contractive shear response and undrained failure (USGS debris flow flume; Major, 1996; Iverson, 1997; Iverson et al., 1997). Classification according to ISO 14688-1 (International Organization for Standardization, 2017).
The 80 m wide and 200 m long debris flow initiation zone eroded into the rock glacier front exposes its internal structure. The irregular, concave niche exhibits steep flanks that are up to 30 m high and composed of loose, poorly sorted sediment (Figs. 4a, b, S1–S4). Its top represents the terminus of a collapse structure network connecting it to the former position of the thermokarst lake (Figs. S1, S3, and S4), with linear erosion features indicating the concentrated emergence of water. After the debris flow initiation, frozen material was exposed immediately below the top (Figs. 4a, b, and S2). Assessment of thermal ground conditions indicates that the debris flow initiation zone is subject to a high-energy environment. Potential incoming solar radiation reaches 2135 kWh m−2 a−1 (Fig. 5c). The Alpine Permafrost Index Map indicates that the initiation zone is located at the lower permafrost boundary, with permafrost preserved only in very favorable conditions (Fig. 5d).
The channel below the rock glacier front is less steep and concave (Table 2). The debris fan was already comparatively flat before the 2019 debris flow (Table 2). Irregular micromorphology, depositional levees, and boulder trains document earlier debris flows (Figs. 2, 5, S2; Soeters and van Westen, 1996; Pack, 2005; Hungr et al., 2014).
Collectively, the convex morphology and exposed position, strong potential radiation, and unfavorable permafrost index are conducive to an advanced stage of permafrost degradation, increased water contents, and large amounts of unfrozen, loose sediment susceptible to mobilization (Marcer et al., 2019).
5.2 Preparatory factors
Analysis of multi-temporal ortho-images indicates roughly constant, moderate surface displacement rates (Fig. S5). The kinematics of the rock glacier surface show mean annual displacement rates of the 200 prominent blocks ranging from 1–50 cm a−1 (mean: 15 cm a−1) in the observation period of 1970–2020. Data for individual blocks and summary statistics are provided in Table S2. The position of the rock glacier front fluctuates non-directionally (amplitude 3–7 m), indicating that steady erosion of the front approximately balances rock glacier movement. The absence of surface discontinuities and the constant surface displacement rates do not indicate general destabilization of the rock glacier before the 2019 debris flow. However, after the debris flow, a cluster of collapse structures connecting the shallow depression that hosted the thermokarst lake and the debris flow initiation zone is clearly recognizable (Fig. S3).
Table 3Climate analysis highlighting the warm and moderately dry conditions prevailing during summer 2019, preceding the debris flow. In addition, air temperature and positive degree day sum show a strong long-term trend, promoting permafrost degradation in Hüttekar cirque. Angle brackets indicate average values, and insignificant trends (at the α=0.05 level) are given in rounded brackets.
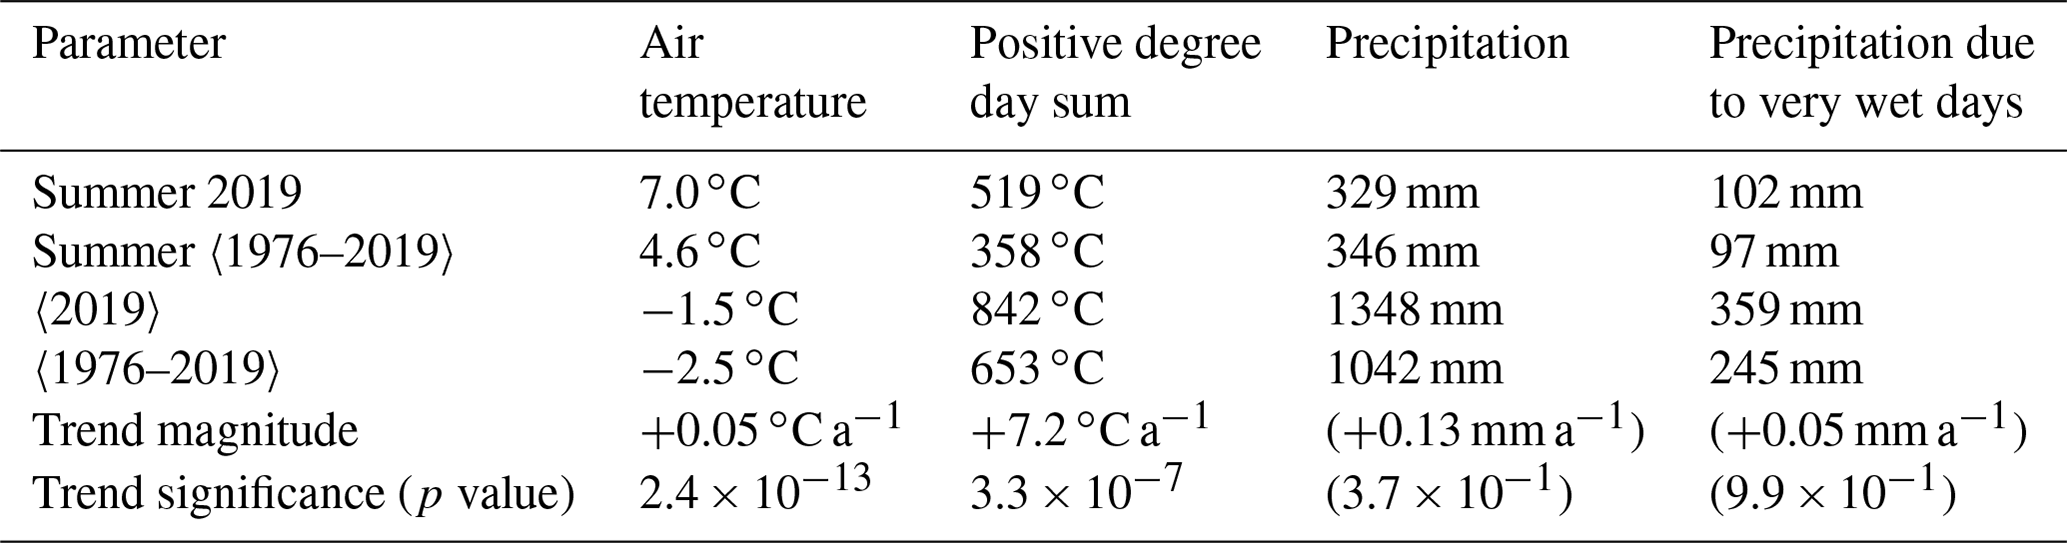
The months preceding the debris flow were characterized by warm and dry conditions, on top of an exceptionally strong long-term trend of increasing air temperature in Hüttekar cirque (Table 3). In 2019, the summer months show exceptionally high air temperatures compared to the long-term average (+2.4 ∘C). The high positive degree day sum (+161 ∘C) reflects the large amount of energy available for melting (Table 3). Total precipitation is moderately low (−17 mm) and slightly concentrated on very wet days (+5 mm) with respect to the long-term average (Table 3). The climate data record shows significantly increasing air temperature (+0.05 ∘C a−1, exceeding corresponding trends at the global and European Alps scale; +0.02 and +0.03 ∘C a−1, respectively; Hock et al., 2019) and positive degree day sum (+7.2 ∘C a−1). In contrast, neither total precipitation nor precipitation due to very wet days increases significantly during the 43 years preceding the debris flow (at the α=0.05 level).
Figure 7 depicts the interannual comparison of snowmelt, ice melt, and rainfall (normalized to catchment area). The winter season preceding the debris flow was characterized by a prominent snow cover, almost monotonically gaining volume until 29 May 2019. The late onset of snowmelt is responsible for the unusually high peak, followed by high solar exposure and extraordinarily warm air temperatures driving rapid ablation in June. The high rates of meltwater production caused widespread flooding in Tyrol despite the fact that June 2019 was a particularly dry month (Hydrological Service of Tyrol, 2019; Hübl and Beck, 2020). Intense snowmelt and ice melt rates in Hüttekar cirque reflect the strong atmospheric energy input in 2019 (11.2 and 2.7 mm d−1, respectively; Fig. 7b).
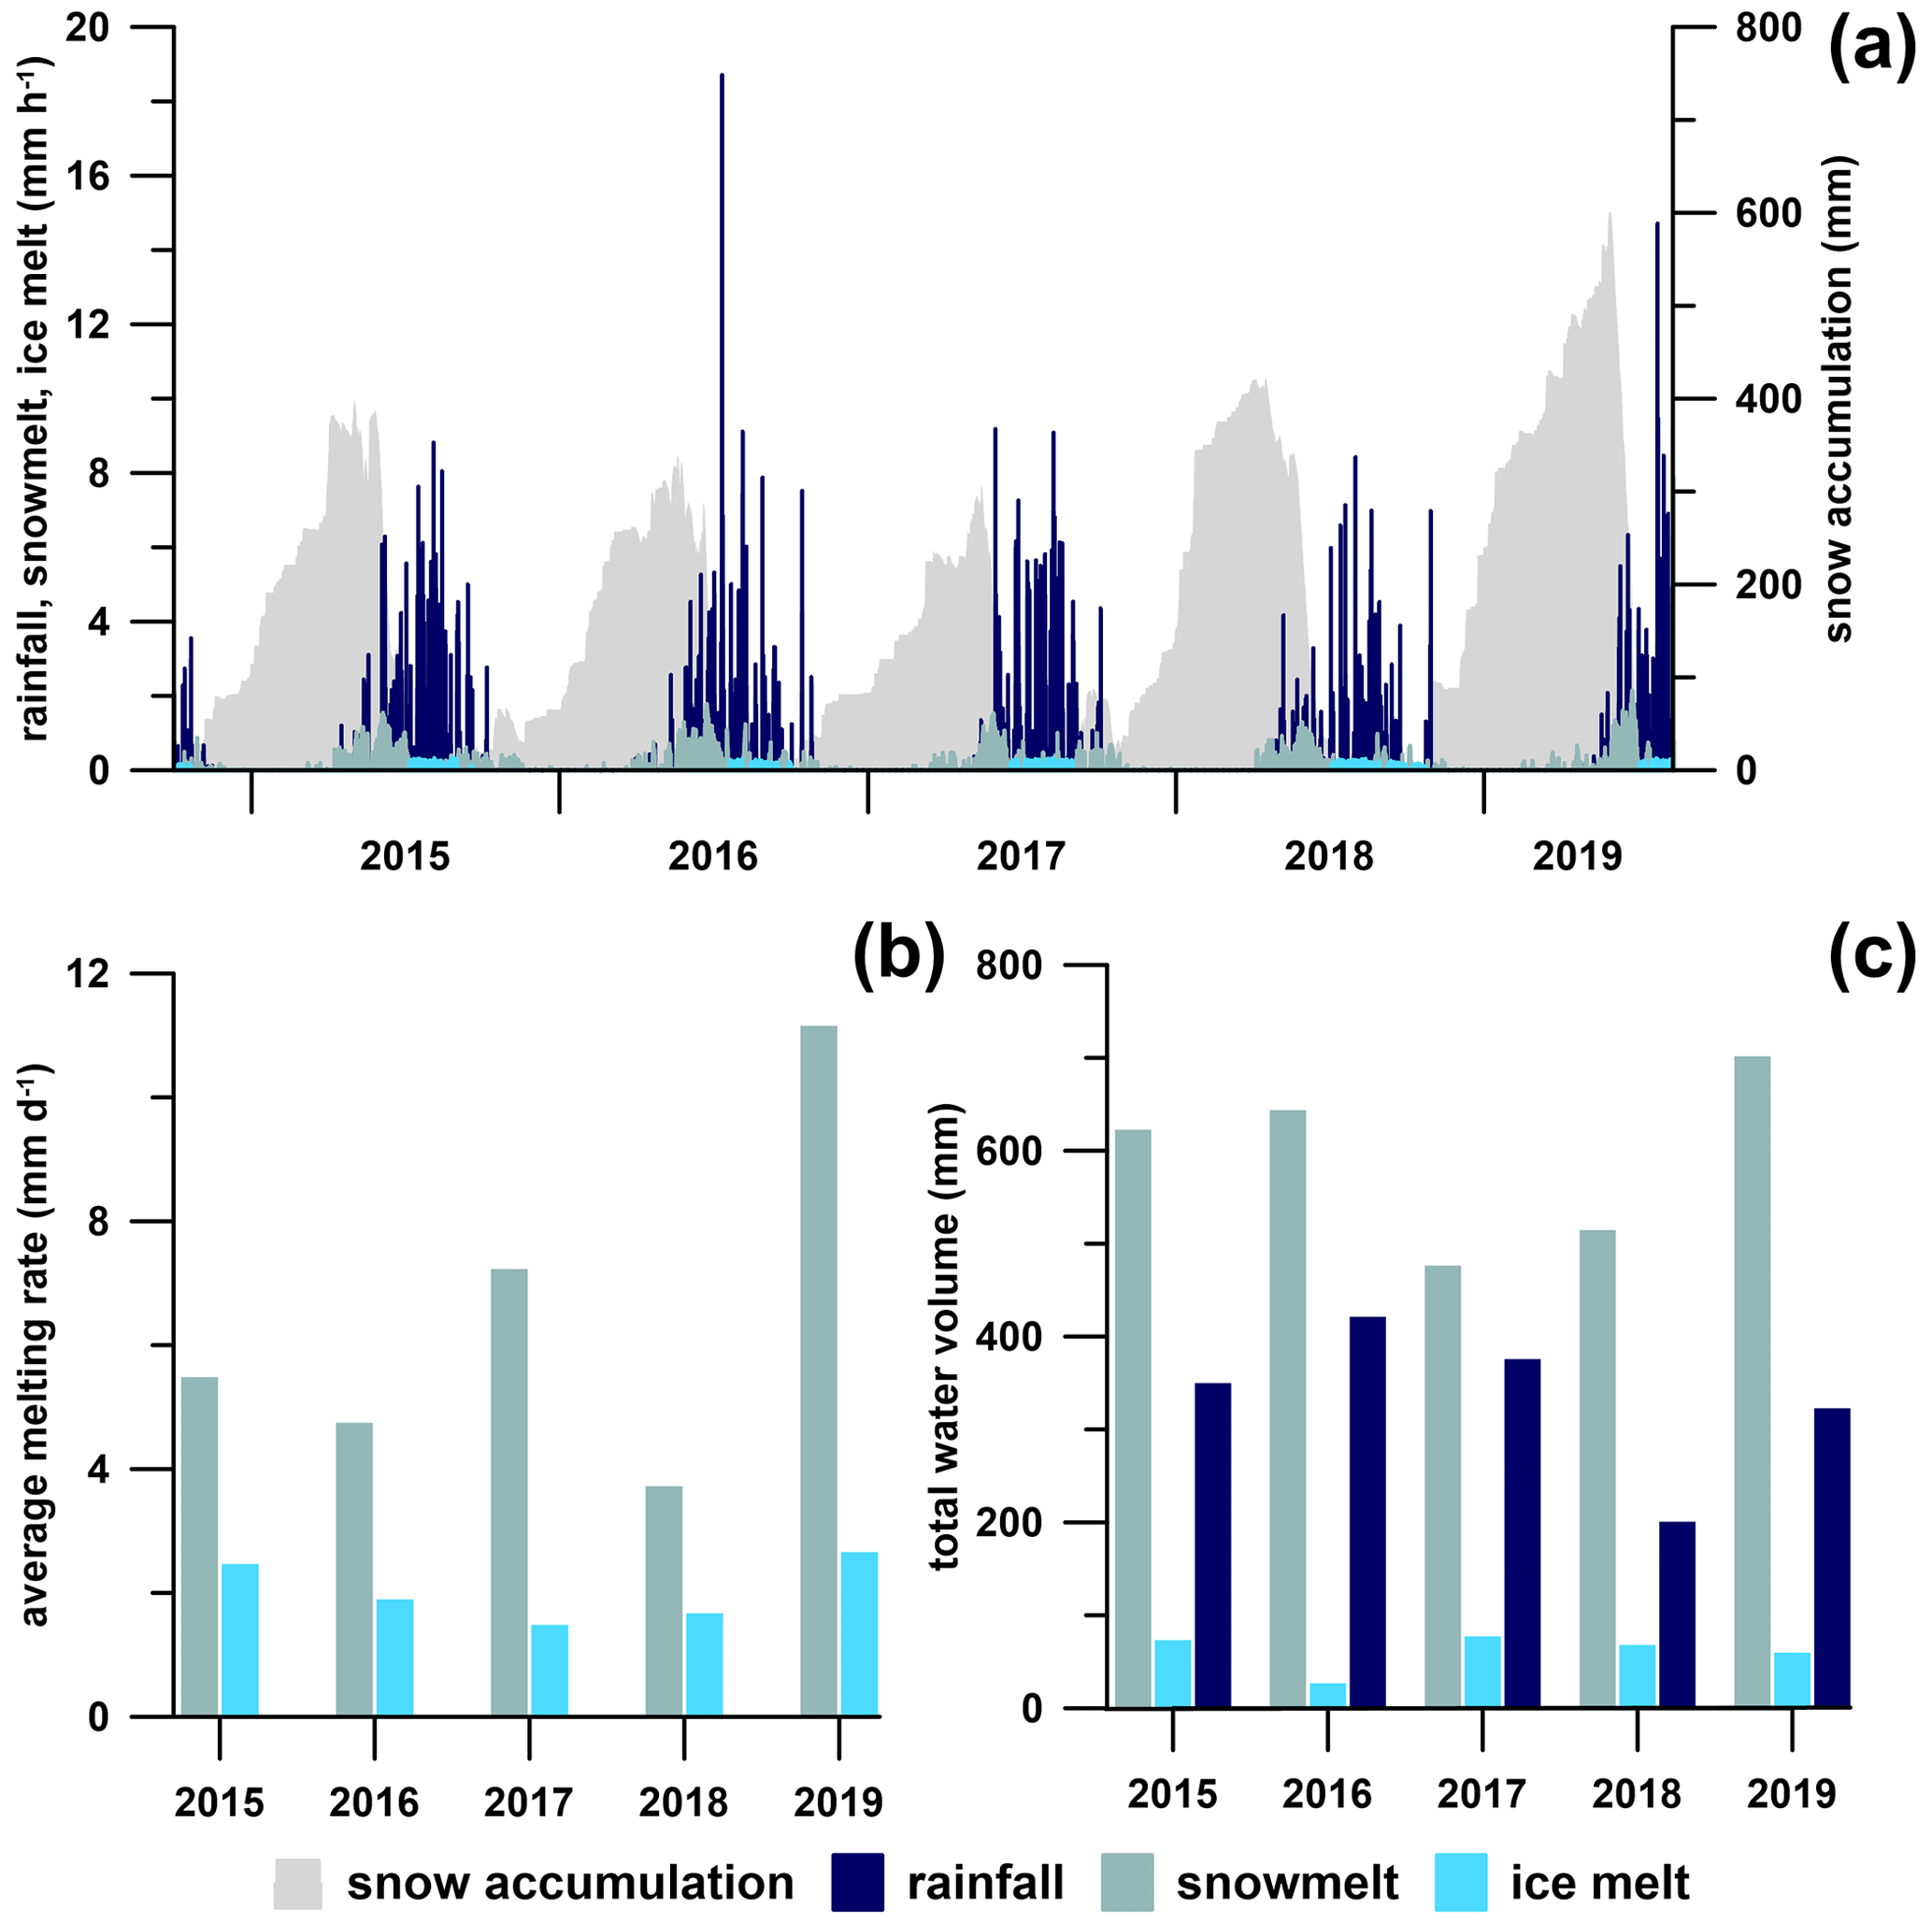
Figure 7(a) Time series of rainfall, snowmelt, and ice melt in Hüttekar based on INCA (Haiden et al., 2011) and SNOWGRID (Olefs et al., 2013). The snow cover dynamics in spring 2019 differ from the preceding years by the late and rapid snowmelt. (b) Average snowmelt and ice melt rates for individual years. Spring 2019 is characterized by exceptionally high snowmelt rates. (c) Total water volumes (between 1 January and 13 August) per year, attributed to rainfall, snowmelt, and ice melt. Despite the different snow cover dynamics in spring 2019, the total meltwater volume exceeds the respective volume of the preceding years only slightly.
In contrast to the high intensity of the melting processes, comparing total volumes of snowmelt, ice melt, and rainfall indicates inconspicuous overall conditions in 2019 (Fig. 7c). As a first-order approximation, we compare cumulative volumes between 1 January and 13 August 2019 (failure date) to earlier years (consistently totalized from 1 January to 13 August), acknowledging that the relatively short record precludes statistically substantiated conclusions. Compared to the 4 years before 2019 (for which continuous SNOWGRID data are available), the total snowmelt volume exceeds the 5-year average by 19 %, while both the total ice melt volume and rainfall volume are slightly below this average (−3 % and −2 %, respectively). The rapid snowmelt efficiently eliminated the snow cover in Hüttekar cirque so that snowmelt ceased on 22 July 2019, i.e., 22 d before the debris flow initiated.
The combination of large amounts of snow available for melting and abnormally warm and dry weather conditions resulted in rapid and extensive meltwater production, thus favoring the ponding of meltwater on the surface of Hüttekar Rock Glacier. The continuously high atmospheric energy input promoted the subsequent development of the thermokarst lake from 3 June to 13 August 2019 described in Sect. 5.3. Summarizing, major hydrometeorological factors distinguishing 2019 from earlier years are the rapid and late snowmelt, the high-energy environment during the summer months, and the storage of water in the newly formed thermokarst lake.
5.3 Triggering factors
The rainfall event preceding the debris flow lasted for 74 h at an average intensity of 0.54 mm h−1 (total rainfall volume 40 mm). The frequency analysis shows that 12 % of earlier rainfall events hitting Hüttekar cirque exceeded it in severity (Fig. 8). The event did not cross the regional critical rainfall thresholds for debris flow initiation with respect to intensity–duration (Fig. 8a; Nikolopoulos et al., 2015) and volume–duration (Fig. 8b; Marra et al., 2016), although these are regarded as conservative estimates (Wieczorek and Guzzetti, 2000; Guzzetti et al., 2007). These characteristics distinctly contrast with the rainfall events preceding well documented debris flows from other rock glacier fronts in the European Alps. Those occurred most often in response to heavy rainfall (Fig. 8): the Ritigraben event on 24 September 1993 (Lugon and Stoffel, 2010), the Murfreit event on 2 July 2003 (Krainer et al., 2012), the Hintergrat and Similaungrube events both on 13 August 2014 (Kofler et al., 2021), and the Lou event on 14 August 2015 (Marcer et al., 2020). In contrast, the rainfall event preceding the debris flow at Hüttekar Rock Glacier was neither especially intense nor especially persistent.
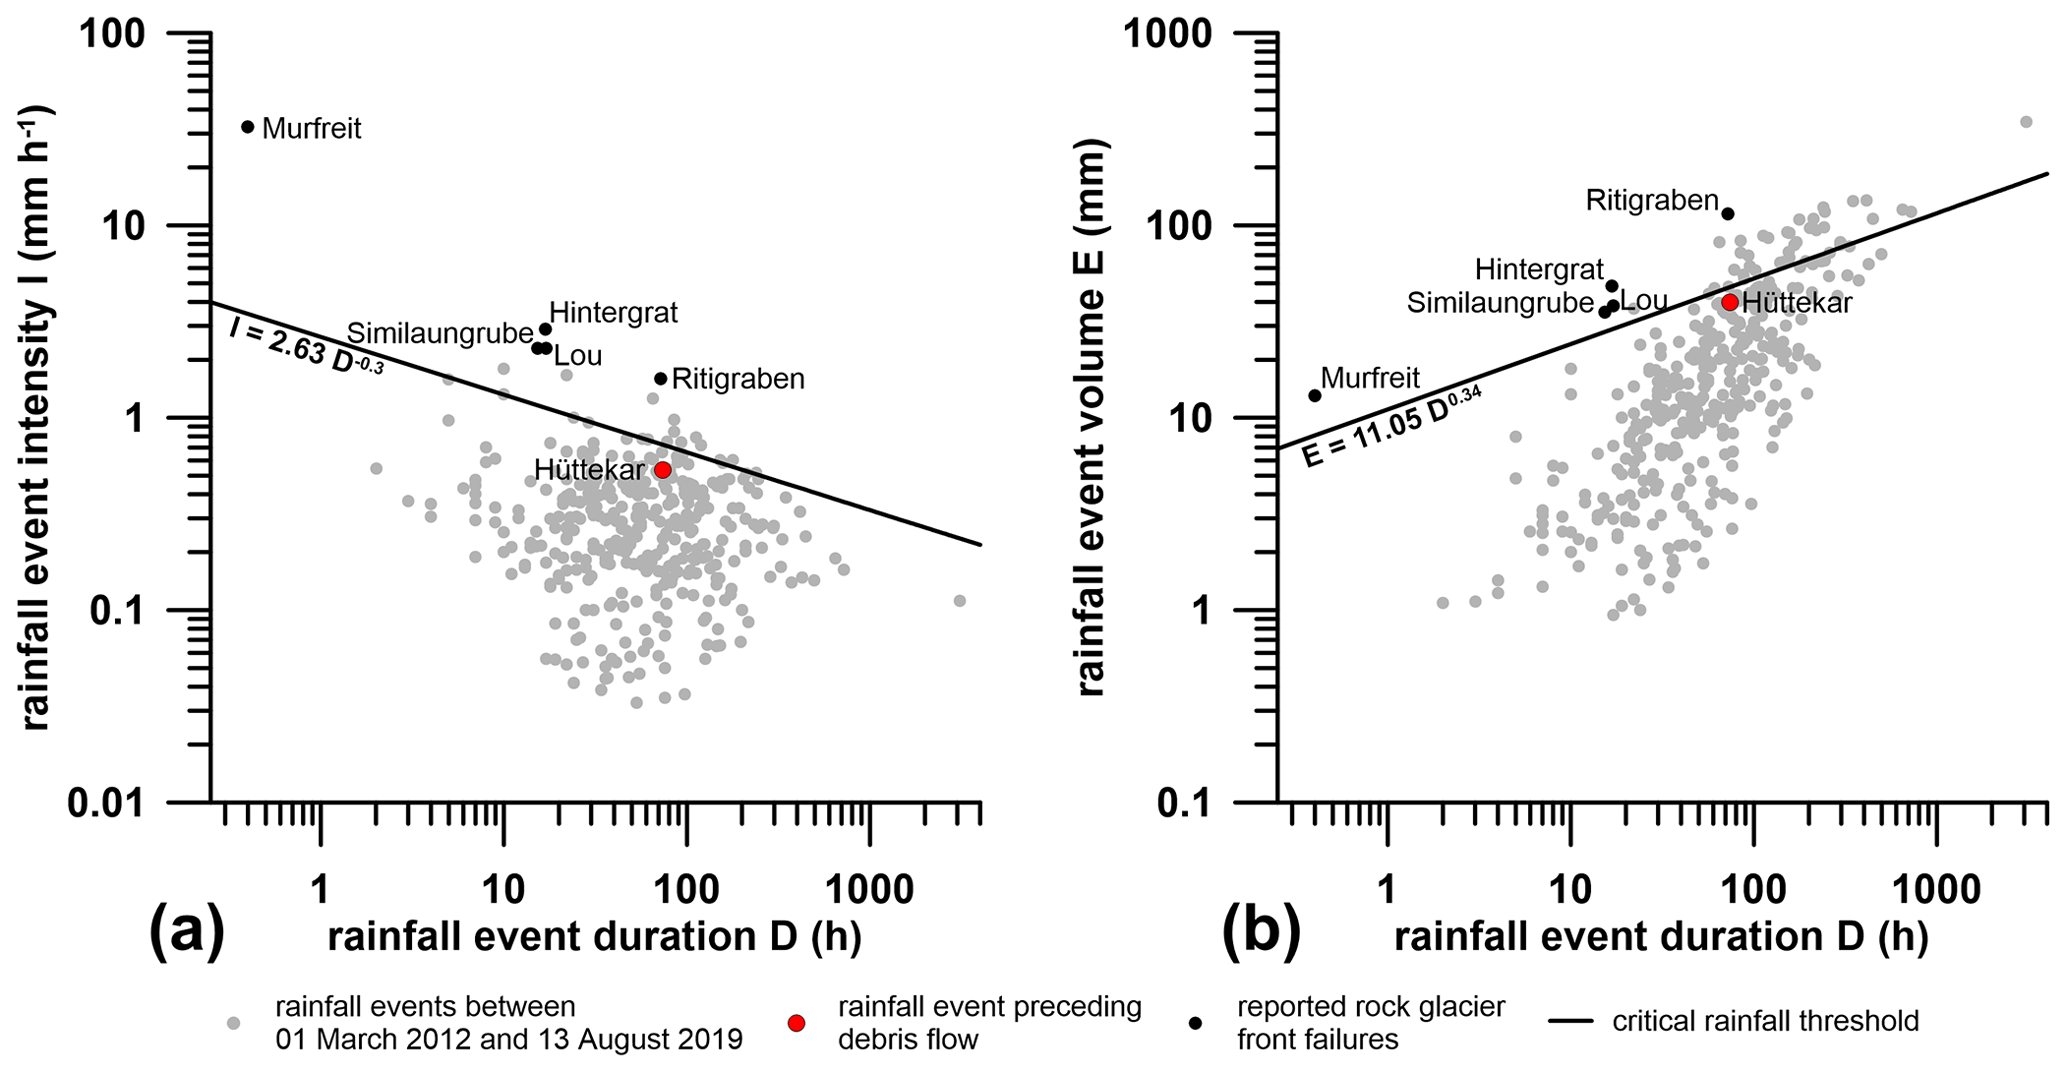
Figure 8Rainfall event frequency analysis with respect to (a) rainfall intensity I vs. rainfall event duration D and (b) rainfall event volume E vs. rainfall event duration D based on INCA (note logarithmic scale). Regional thresholds describing minimum conditions for rainfall-induced debris flows are based on Nikolopoulos et al. (2015) and Marra et al. (2016), with equations given below the corresponding lines (thresholds are representative of the summer season). Characteristics of triggering rainfall events are based on Lugon and Stoffel (2010), Krainer et al. (2012), Kofler et al. (2021), and Marcer et al. (2020).
Table 4Thermokarst lake development based on INCA (Haiden et al., 2011), Sentinel-2 satellite data (Sentinel Hub, 2020), and the most recent (2018) high-resolution DTM of the rock glacier surface (Government of the Province of Tyrol, 2021a).
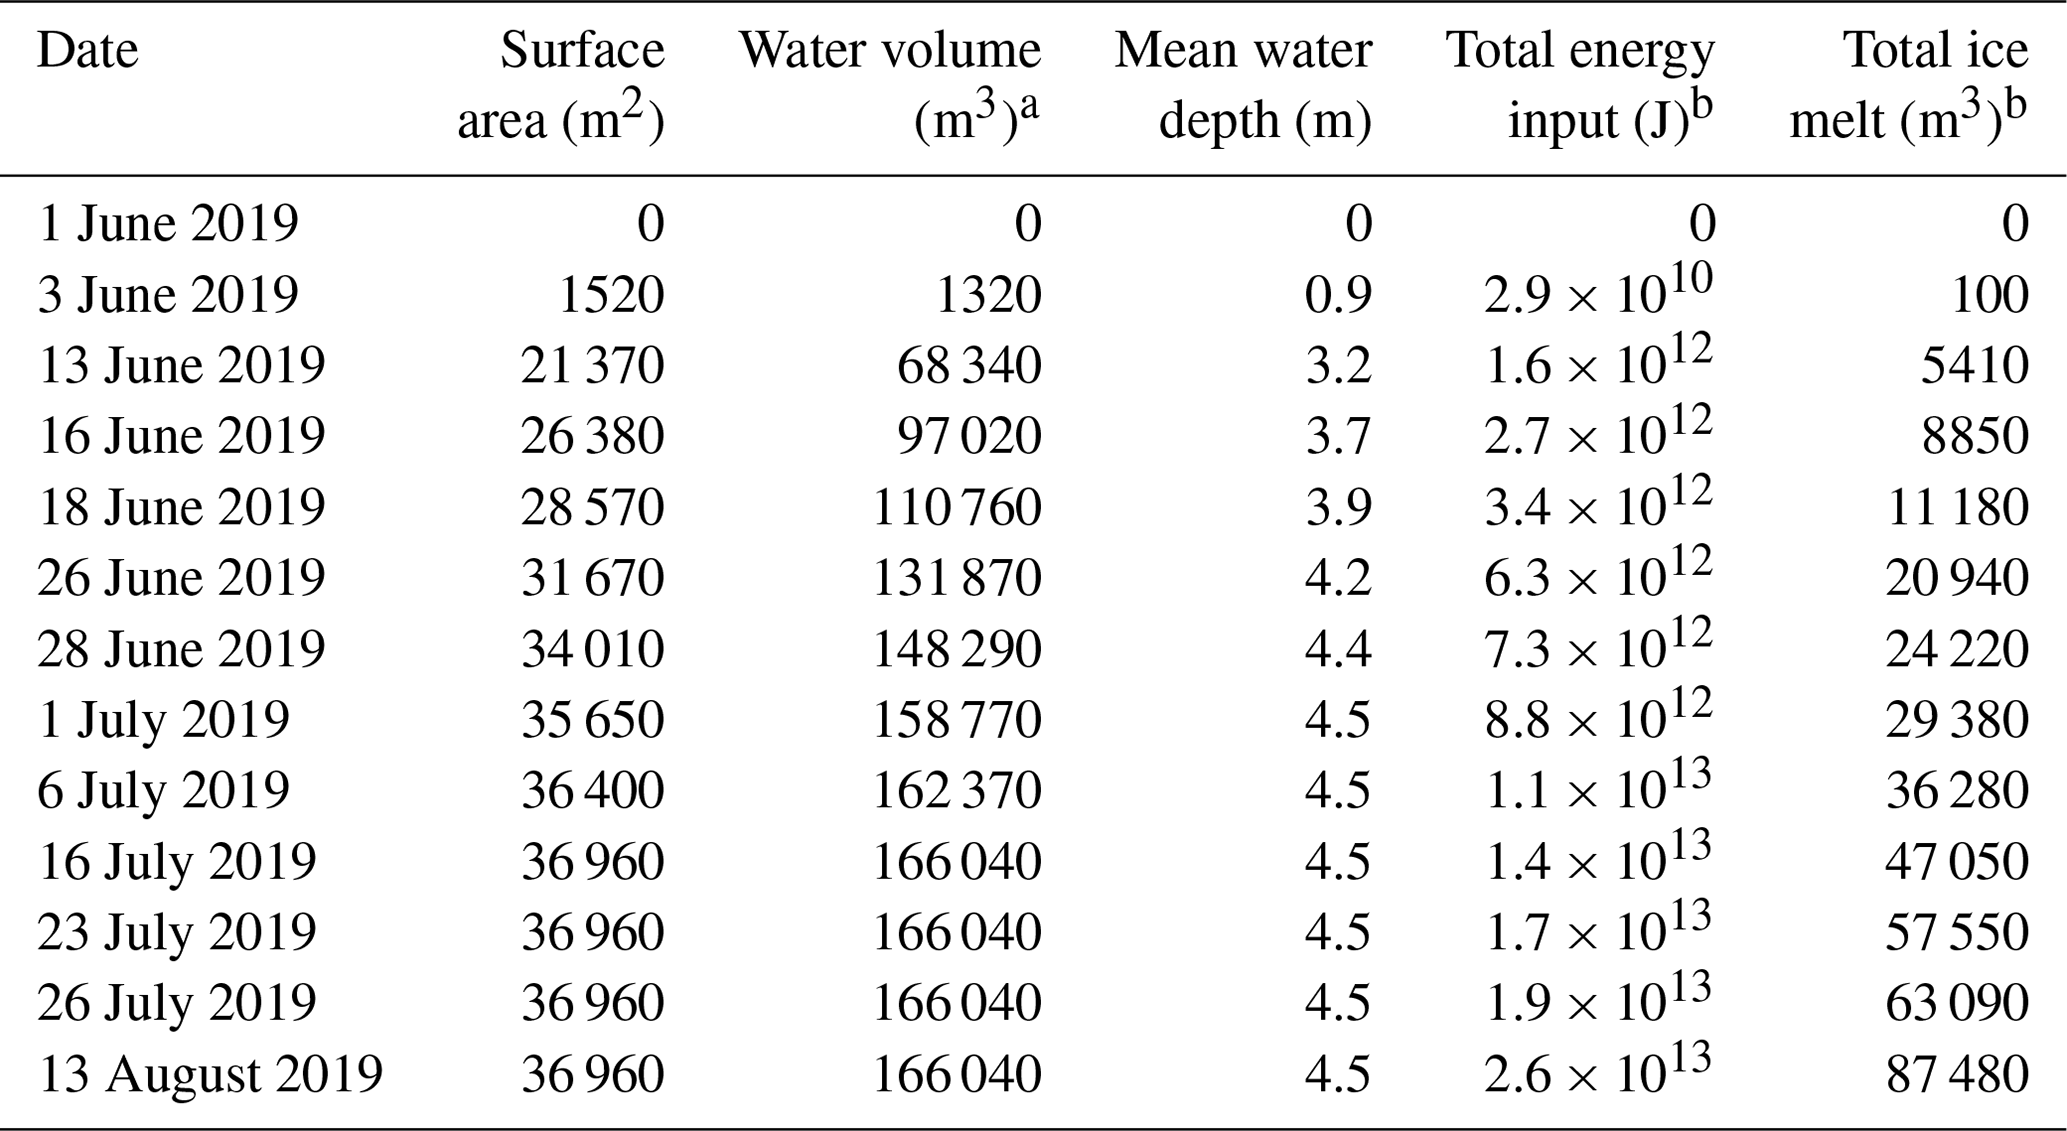
a Estimate based on DTM (2018). b Since 1 June 2019.
Field observations as well as satellite data analysis detect the rapid evolution and drainage of the thermokarst lake that formed on the rock glacier surface before the debris flow. Sentinel-2 satellite imagery indicates water pooling in the depression on 3 June 2019, when snow still covered large parts of the rock glacier catchment (520 mm average snow water equivalent based on SNOWGRID). The lake gained most of its volume during the intense snowmelt period in June (Fig. 7a). Linear interpolation of the lake surface area between the cloud-free satellite imagery dates enables the calculation of the total energy input to the lake (Table 4). While the lake surface area stayed constant after the beginning of July, the energy input was considerable thereafter, suggesting that large amounts were transferred to the subsurface, allowing for extensive ice melt beneath the surface.
The thermokarst lake evolved over a period of 10 weeks and drained within 1 d through a newly formed channel, indicating that the timescale of thermokarst breakthrough is shorter than the summer season. The total amount of ice melt preceding the failure sums to ∼ 87 000 m3 (corresponding energy input 2.6 × 10¹³ J). The impact of energy available for thermokarst evolution is emphasized by dividing this value by the distance to the debris flow initiation zone (∼ 350 m) and assuming a channel of circular cross section, resulting in an upper-bound estimate of 18 m for the channel diameter. While only a fraction of this energy was actually involved in channel development, the resulting order of magnitude clearly demonstrates the potential of thermokarst evolution for triggering the lake outburst during the course of a single summer season. Dividing the latest lake water volume estimate (∼ 166 000 m3) by the drainage time (∼ 1 d) indicates a drainage rate on the order of a few cubic meters per second, supplying a substantial amount of water to the debris flow initiation zone.
Unfavorable topographical and sedimentological predisposition put the rock glacier front in a state susceptible to debris flow initiation. Its steep slope angle supports shear stress and sensitivity to liquefaction while lowering shear strength (Iverson et al., 1997). The convex top induces extensive deformation patterns favoring the development of tensional stresses (Delaloye et al., 2013; Marcer et al., 2019). Rock glacier creep balancing erosion rates at the rock glacier front, in combination with a high-energy environment favoring permafrost degradation, provides a large accumulation of loose, unfrozen sediment. The eroded material is available for subsequent mobilization down the adjacent steep slope, inhibiting the formation of a stabilizing debris accumulation at the toe of the rock glacier front (Kummert and Delaloye, 2018).
Debris slides within saturated, loose sediment responding in a contractive way to shear deformation are prone to mobilize into debris flows (Savage and Baum, 2005). The collapse of the soil structure and crushing of particles drive the development of transient excess pore-water pressures in parts of the deforming mass, which reacts by disintegration and acceleration (Iverson and Major, 1986; Iverson et al., 1997; Sassa and Wang, 2005). Within the displaced mass, the rates of excess pore-water-pressure generation and dissipation critically depend on strain rate, bulk density, and grain size distribution (Iverson, 1997, 2005). Once saturated, poorly sorted sand and gravel such as the Hüttekar Rock Glacier material (Fig. 6) are susceptible to undrained deformation and attendant pore-water-pressure coevolution. Since these features document the compositional propensity of the rock glacier front to debris flow mobilization, the remaining issues requiring clarification concern potential sources of water capable of saturating the rock glacier front material at the initiation zone.
The relative timescales for pore-space contraction and pore-water-pressure diffusion govern the persistence of high pore-water pressures (Iverson and LaHusen, 1989; Iverson, 1997). The diffusion timescale of Hüttekar Rock Glacier debris is relatively short (on the order of ∼ 20 s, estimated from similar material investigated at the USGS debris flow flume; Fig. 6; Iverson, 1997). Sustaining pore-water pressures high enough to keep debris flow surges in motion therefore requires rapid and persistent delivery of large amounts of water (on the order of a few m3 s−1).
The hydrometeorological conditions preceding the debris flow determine the critical amount of water necessary to initiate failure (Crozier, 2010). Frequency analysis of rainfall events hitting Hüttekar cirque indicates that the event immediately preceding the debris flow was not exceptionally severe, falling below the critical threshold for failure initiation (Fig. 8). Regarding the moderately dry hydrometeorological conditions during summer 2019, these observations suggest that the storm immediately preceding the event could not provide the large amounts of water necessary to initiate the debris flow. Considering the coincident thermokarst lake outburst, following exceptionally warm weeks characterized by considerable energy input promoting melting processes and permafrost degradation (Tables 3 and 4), a multiple trigger mechanism is regarded as being plausible instead.
The key issue in terms of debris flow mechanics is the rate of water transport to the initiation zone. Field evidence suggests that water flowed in a concentrated way along a newly formed channel network from the thermokarst lake to the rock glacier front (Figs. 4e, f, h, S1, S3, and S4). The rapid development of this efficient drainage network was facilitated by the short timescale of advective heat transport along the meltwater channels. Driven by thermal convection, the establishment of such a channel system was possible within several weeks, despite the considerable distance of ∼ 350 m. The energy provided by the thermokarst lake strikingly exceeded the latent heat of fusion necessary for channel evolution. Once established, this channel network had the capability to transport large amounts of water from the thermokarst lake to the debris flow initiation zone within a short time. Water flow velocities along these highly permeable flow paths may reach up to several centimeters per second (Tenthorey, 1992; Krainer and Mostler, 2002; Buchli et al., 2013; Wagner et al., 2021), providing sufficient water to the debris flow to keep the deforming sediment saturated.
In contrast to many hazardous glacial lakes evolving over timescales of years to decades (Haeberli, 1983; Mölg et al., 2021), the thermokarst lake in Hüttekar cirque unfolded its destructive power already 10 weeks after its formation. Rapid drainage emptied it without apparent prior indications of an outburst flood. The decisive factor in terms of hazard assessment is that thermokarst development and channel breakthrough happened within an extremely short timescale (on the order of weeks), driven by the high-energy input during summer 2019. The failure mechanism involved drainage channel enlargement as well as collapse of the rock glacier front, demonstrating that thermokarst development and slope failure operated synergistically. The large amounts of debris provided by the rock glacier favored the evolution of the outburst flood into a debris flow.
Subsequently, the hazard cascade triggered in Hüttekar cirque was expanded by an additional element when the displaced mass reached and blocked Radurschlbach, impounding a voluminous (∼ 120 000 m3) lake that threatened a large area downstream. Acknowledging that landslide dams frequently fail within a short period (hours to months) after their formation and that common failure mechanisms are capable of triggering severe outburst floods, the prediction and instant detection of these events in remote areas are crucial for risk assessment and reduction in mountainous areas (Clague and Evans, 1994; Ermini and Casagli, 2003; Schaub, 2015).
This issue will likely gain importance as climate change alters the conditions in prospective debris flow initiation zones. With respect to thermokarst evolution, the key issue is the expected increase in available melting energy that is closely linked to rising air temperatures. Previous research showed that the development of thermokarst features, including lakes and channel networks, is highly sensitive to thermal ground conditions and their response to climate change (Kääb and Haeberli, 2001). Consequently, we expect the establishment of these features in areas currently characterized by permafrost. Our study shows that such channel systems might develop within weeks and subsequently are able to transfer large amounts of water within a short time. It is this hardly predictable short-term development of thermokarst features that challenges the evaluation of slope stability under a warming mountain climate. Once established, these channel networks are capable of rapidly concentrating water at points of converging channels. This process threatens slope stability irrespective of the specific trigger mechanisms by adding additional weight while simultaneously decreasing shear strength (Johnson and Sitar, 1990; Chowdhury et al., 2010). Its hazardous role is underpinned by concentrated water outflow in debris flow initiation zones documented at several other rock glacier fronts (Kummert et al., 2018; Marcer et al., 2020; Kofler et al., 2021). While this study is the first one to explicitly assess its rate and magnitude in this specific context, we argue that similar processes might support localized failure mechanisms of active rock glacier fronts in a wide range of settings.
The 2019 Hüttekar debris flow impounded the main river of Radurschl Valley, threatening the downstream community and infrastructure by dam breakthrough. The local rock glacier front failure was caused by an upstream thermokarst lake outburst and mobilized into a catastrophic debris flow displacing 40 000–50 000 m3 of sediment within several hours. Analyzing a comprehensive set of potential destabilizing factors reveals critical combinations of environmental influences that govern hazard characteristics in this complex periglacial setting. Evaluating the topographical and sedimentological context, quantifying rock glacier movement rates preceding the failure, and analyzing climate and weather signals demonstrate the capability of rapid thermokarst evolution to induce highly hazardous situations at short timescales.
The observed failure differs from rock glacier front failures documented so far. Rapid thermokarst lake development and the evolution of a drainage system within the rock glacier primarily caused the debris flow. The fact that a comparable thermokarst lake had never been observed before on Hüttekar Rock Glacier and that the outburst occurred only 10 weeks after its formation implies that comparable lake formation and outburst are hardly predictable. As climate change progresses, this mechanism will likely gain importance due to accelerated permafrost degradation and increased energy available for thawing, altering ground properties and increasing the likelihood of thermokarst lake formation (Kääb and Haeberli, 2001; Patton et al., 2019). Since many rock glacier fronts exhibit grain size distributions similar to the Hüttekar Rock Glacier (Johnson, 1992; Haeberli and Vonder Mühll, 1996; Arenson et al., 2002; Krainer et al., 2010, 2012), they pose widespread hazard elements in mountainous regions, with significantly increased risk if rivers or infrastructure pass potential runout zones of debris flows.
In combination with challenges regarding hazard detection and prediction in remote areas, this complicates integrated multi-hazard assessment (Kappes et al., 2012; Gallina et al., 2016). In this context, the combination of several raster datasets comprising terrain models, satellite imagery, and gridded climate and weather variables proved to be a valuable tool for assessing the individual impact of destabilizing factors in complex mountainous terrain.
The observed debris flow mechanism is the most frequent one in colluvium, which covers most of the surface in mountainous terrain (Turner, 1996). Thus, we suggest that the results obtained in this study apply not only to rock glaciers but to a wide range of colluvium in mountainous, permafrost-affected landscapes, with accordingly wide implications. Including rapid thermokarst evolution in landslide hazard assessment will likely gain importance as climate change progresses, altering the boundary conditions for periglacial landslides across the European Alps and mountain ranges around the world. The developed process-based understanding of the analyzed hazard cascade including thermokarst lake outburst, rock glacier front failure, debris flow evolution, and river blockage provides a benchmark for multi-hazard identification.
Ice ablation rates m, given as ice water equivalent (m s−1), are calculated using a surface energy balance approach (Cuffey and Paterson, 2010):
where Qr is net radiation (W m−2), Qh is the sensible heat flux (W m−2), Qe is the latent heat flux (W m−2), Qp is the heat flux associated with precipitation (W m−2), λf is the latent heat of fusion (3.34 × 10⁵ J kg−1), and ρw is the density of water (kg m−3) at 273.15 K. Equation (A1) assumes the glacier surface stays at 273.15 K and neglects transfer of heat within the glacier, both assumptions considered reasonable approximations for the ablation zones of temperate glaciers during the summer season (Hock, 2005; Cuffey and Paterson, 2010). For the operational purposes of this study, estimates of the individual energy flux contributions aim at evaluating their variation between different years rather than yielding precise absolute values. Net radiation is calculated according to Cuffey and Paterson (2010):
where Qs is incoming shortwave radiation (W m−2), Ta is air temperature (K), Ts is surface temperature (K), α is broadband surface albedo (–), ϵa is atmospheric emissivity (–), ϵs is surface emissivity (–), and σ is the Stefan–Boltzmann constant (5.67 × 10⁻⁸ W m−2 K−4). As a first approximation, ϵs≈0.95 for ice and water, while α≈0.4 and α≈0.06 for ice and water, respectively (Cuffey and Paterson, 2010). Incoming shortwave radiation is given by the superposition of direct and diffuse radiation, accounting for cloudiness (INCA) and the shadowing effect of surrounding terrain, as well as by shortwave radiation reflected by the surrounding terrain (α≈0.2, GRASS GIS 8.0; Hofierka et al., 2007). Atmospheric emissivity is parameterized as outlined by Greuell et al. (1997) and Oerlemans (2000). Sensible and latent heat fluxes are calculated by the parameterization of the respective transport processes based on turbulence similarity assuming a roughness length of 10−2 m (Brutsaert, 2005; Brock et al., 2006; Cuffey and Paterson, 2010). The sensible heat flux is given by
where ca is the specific heat capacity of air at constant pressure (1006 J kg−1 K−1), Ch is the heat transfer coefficient (Stanton number) (–), u is wind speed (m s−1), and ρa is air density (kg m−3). The latent heat flux is obtained using
where Ce is the water vapor transfer coefficient (Dalton number) (–), xa is the specific humidity of air (–), xs is the specific humidity at the surface (–), and λv is the latent heat of vaporization (2.5 × 10⁶ J kg−1). The heat flux associated with precipitation is estimated assuming that the rain droplet temperature Td approaches the near-surface air temperature:
where cw is the specific heat capacity of water at 0 ∘C and constant pressure (4219 J kg−1 K−1), and P is the precipitation intensity (m s−1).
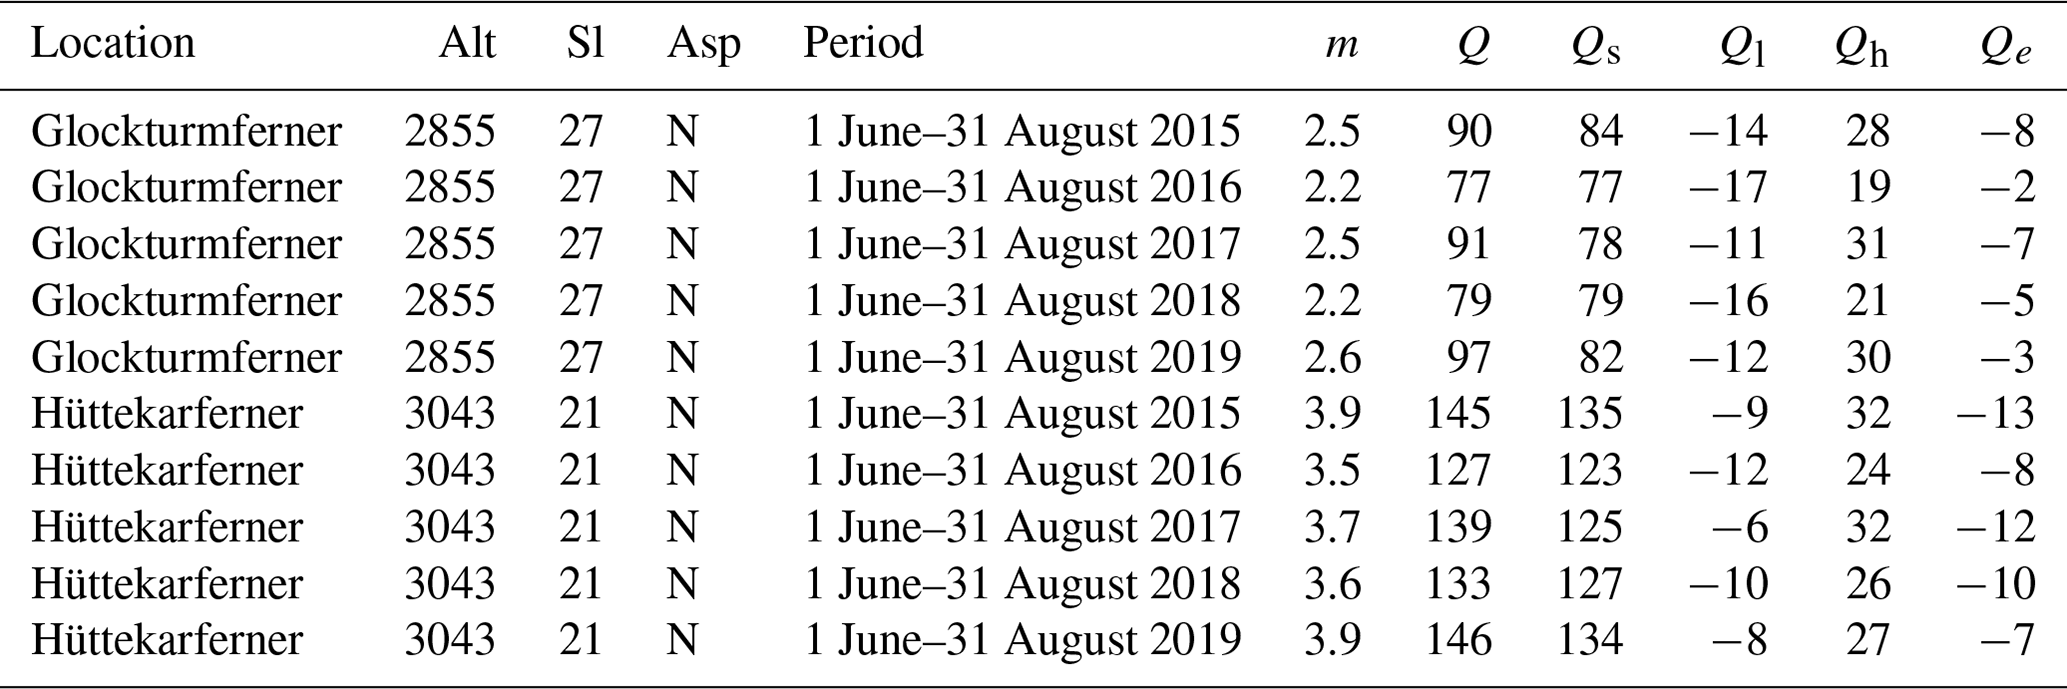
Glacial meltwater infiltrates directly from Glockturmferner and indirectly from Hüttekarferner into Hüttekar Rock Glacier (Fig. 3). The plausibility of the calculated ablation rates for both glaciers is evaluated by comparing them to a set of glacier ablation rates and associated energy flux contributions across the European Alps (Table A1). The results obtained for Hüttekarferner and Glockturmferner (Table A2) fall within the range given by this sample, reflecting the northward exposition and steep slope of both glaciers by comparatively smaller total ablation rates.
Table A1Ablation rates and energy flux contributions measured and calculated at various glaciers across the European Alps (Escher-Vetter, 1985; Greuell and Oerlemans, 1989; van de Wal et al., 1992; Greuell et al., 1995, 1997; Arnold et al., 1996; Oerlemans, 2000; Brock et al., 2000; Klok and Oerlemans, 2002; Oerlemans and Klok, 2002; Willis et al., 2002; Brock et al., 2006; Oerlemans et al., 2009). Values represent averages taken over the outlined period (altitude Alt (m a.s.l.); slope Sl (∘); aspect Asp; measured ice ablation rate m (cm d−1), given as water equivalent assuming an ice density of 900 kg m−3; total energy flux density Q (W m−2); net shortwave radiation Qs (W m−2); net longwave radiation Ql (W m−2); sensible heat flux Qh (W m−2); latent heat flux Qe (W m−2); Austria AT; and Switzerland CH). The (small) precipitation heat flux is rarely reported and thus not included.
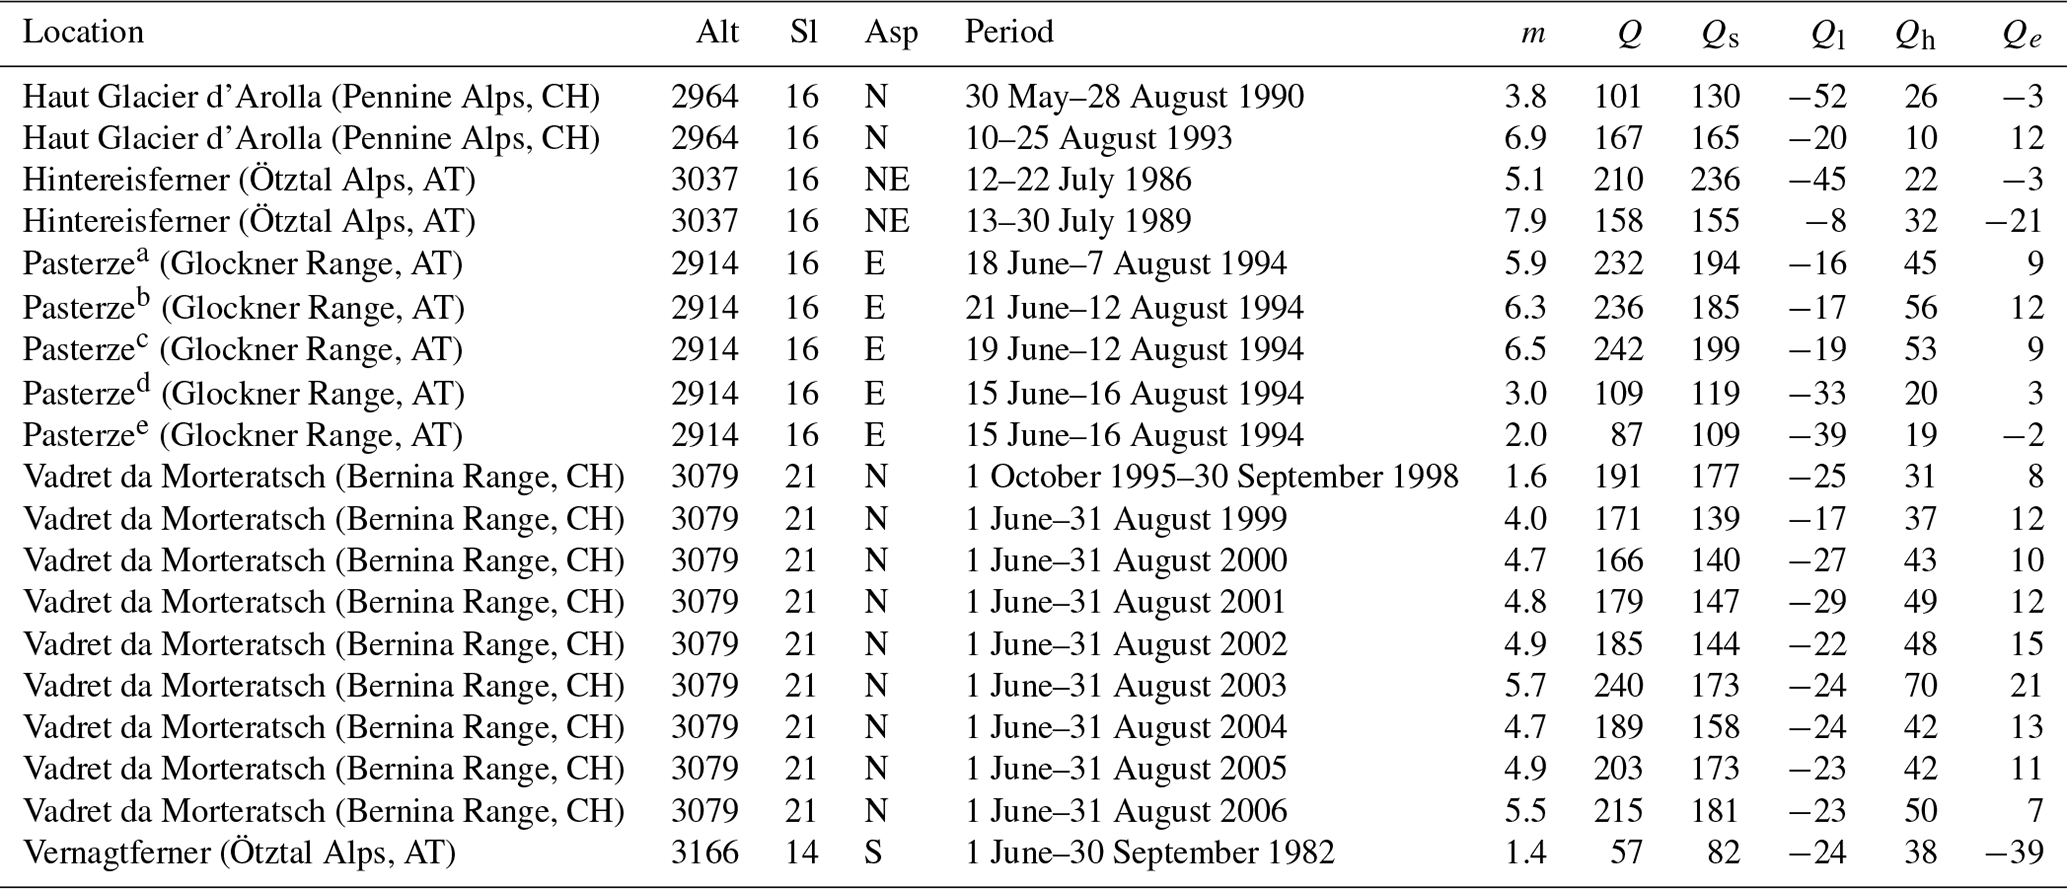
a Weather station at 2205 m a.s.l. b Weather station at 2310 m a.s.l. c Weather station at 2420 m a.s.l. d Weather station at 2945 m a.s.l. e Weather station at 3225 m a.s.l.
Table A2Ablation rates and energy flux contributions calculated in this study. Values represent averages taken over the outlined period (altitude Alt (m a.s.l.); slope Sl (∘); aspect Asp; measured ice ablation rate m (cm d−1), given as water equivalent assuming an ice density of 900 kg m−3; total energy flux density Q (W m−2); net shortwave radiation Qs (W m−2); net longwave radiation Ql (W m−2); sensible heat flux Qh (W m−2); and latent heat flux Qe (W m−2)).
Meteorological datasets, including the Spatiotemporal Reanalysis Dataset for Climate in Austria (SPARTACUS; https://data.hub.zamg.ac.at/dataset/spartacus-v2-1d-1km; Geosphere Austria, 2020a) and the Integrated Nowcasting through Comprehensive Analysis Dataset (INCA; https://data.hub.zamg.ac.at/dataset/inca-v1-1h-1km; Geosphere Austria, 2020b), are continuously updated and provided by GeoSphere Austria. The government of the province of Tyrol provides the digital terrain model (https://www.data.gv.at/katalog/de/dataset/land-tirol_tirolgelnde; Government of the Province of Tyrol, 2021a), current and historical ortho-images (https://www.data.gv.at/katalog/de/dataset/land-tirol_orthofototirol; Government of the Province of Tyrol, 2021b), historical laser scans (https://lba.tirol.gv.at/public/karte.xhtml; Government of the Province of Tyrol, 2021c), and historical maps (https://hik.tirol.gv.at/; Government of the Province of Tyrol, 2021d). Sentinel-2 multispectral satellite data are provided by Copernicus and processed by Sentinel Hub and are freely available from https://www.sentinel-hub.com/ (Sentinel Hub, 2020). The Alpine Permafrost Index Map is freely available from https://doi.org/10.1594/PANGAEA.784450 (Boeckli et al., 2012a). The rock glacier inventory and corresponding rock glacier catchment inventory are freely available from https://doi.org/10.1594/PANGAEA.921629 (Wagner et al., 2020b). The employed software is freely available from https://sourceforge.net/projects/saga-gis/ (SAGA GIS; Conrad et al., 2015b), https://doi.org/10.5281/zenodo.5913049 (GRASS GIS; Landa et al., 2022), https://grass.osgeo.org/grass80/manuals/r.sun.html (GRASS GIS module “r.sun”; Hofierka et al., 2007), https://cran.r-project.org/ (R; R Core Team, 2022, https://cran.r-project.org/web/packages/climdex.pcic/ (R package “climdex.pcic”; Bronaugh, 2020), https://cran.r-project.org/web/packages/IETD/ (R package “IETD”; Duque, 2020), and https://cran.r-project.org/web/packages/rkt/ (R package “rkt”; Marchetto, 2021). Grain size analysis results, surface velocity data, and additional photographs are provided in the Supplement.
Video documentation of the rapidly draining thermokarst lake, recorded on 13 August 2019 11:20 CEST by Josef Waldner, is available in the Supplement. The supplement related to this article is available online at: https://doi.org/10.5194/nhess-23-2547-2023-supplement.
SS, TW, KK, and GW designed the study and prepared the initial draft. Formal analysis, methodology development, data collection, and visualization were performed by SS, TW, KK, MA, and MO. MA, MO, and KH edited and complemented the manuscript draft. GW managed and coordinated the project, including the funding acquisition.
The contact author has declared that none of the authors has any competing interests.
Publisher’s note: Copernicus Publications remains neutral with regard to jurisdictional claims in published maps and institutional affiliations.
We thank Catherine Bertrand and two anonymous referees for their constructive feedback and helpful comments. We also thank Josef Waldner and Gerhard Schaffenrath for witness reports, local information, discussion, and photographs. Additional photographs and information were kindly provided by Roman Außerlechner, Thomas Figl, Werner Thöny (Geological Survey of Tyrol), Rudolf Philippitsch, Magdalena Seelig, Danny F. Minahan, Ainur Kokimova, Samuel Kainz, and Irène Apra. This research was funded by the Austrian Federal Ministry of Agriculture, Forestry, Regions, and Water Management and the federal provinces of Vorarlberg, Tyrol, Salzburg, Styria, and Carinthia within the DaFNE project RG-AlpCatch. The authors acknowledge the financial support of the University of Graz.
This research has been supported by the Austrian Federal Ministry of Agriculture, Forestry, Regions, and Water Management (grant no. DaFNE 101561), the Karl-Franzens-Universität Graz (Open Access Publication Fund), the Amt der Steiermärkischen Landesregierung (grant no. DaFNE 101561), the Amt der Kärntner Landesregierung (grant no. DaFNE 101561), the Salzburger Landesregierung (grant no. DaFNE 101561), the Land Tirol (grant no. DaFNE 101561), and the Amt der Vorarlberger Landesregierung (grant no. DaFNE 101561).
This paper was edited by Mario Parise and reviewed by Catherine Bertrand and two anonymous referees.
Adler, C., Wester, P., Bhatt, I., Huggel, C., Insarov, G. E., Morecroft, M. D., Muccione, V., and Prakash, A.: Cross-Chapter Paper 5: Mountains, in: Climate Change 2022: Impacts, Adaptation, and Vulnerability, Intergovernmental Panel on Climate Change, Cambridge University Press, https://doi.org/10.1017/9781009325844.022, 2022. a
Arenson, L., Hoelzle, M., and Springman, S.: Borehole deformation measurements and internal structure of some rock glaciers in Switzerland, Permafrost Periglac., 13, 117–135, https://doi.org/10.1002/ppp.414, 2002. a
Arenson, L. U. and Springman, S. M.: Mathematical descriptions for the behaviour of ice-rich frozen soils at temperatures close to 0 ∘C, Can. Geotech. J., 42, 431–442, https://doi.org/10.1139/T04-109, 2005. a
Arnold, N. S., Willis, I. C., Sharp, M. J., Richards, K. S., and Lawson, W. J.: A distributed surface energy-balance model for a small valley glacier. I. Development and testing for Haut Glacier d'Arolla, Valais, Switzerland, J. Glaciol., 42, 77–89, https://doi.org/10.3189/S0022143000030549, 1996. a
Avian, M., Kaufmann, V., and Lieb, G. K.: Recent and Holocene dynamics of a rock glacier system: The example of Langtalkar (Central Alps, Austria), Norsk Geogr. Tidsskr., 59, 149–156, https://doi.org/10.1080/00291950510020637, 2007. a
Avian, M., Kellerer-Pirklbauer, A., and Bauer, A.: LiDAR for monitoring mass movements in permafrost environments at the cirque Hinteres Langtal, Austria, between 2000 and 2008, Nat. Hazards Earth Syst. Sci., 9, 1087–1094, https://doi.org/10.5194/nhess-9-1087-2009, 2009. a
Beniston, M., Farinotti, D., Stoffel, M., Andreassen, L. M., Coppola, E., Eckert, N., Fantini, A., Giacona, F., Hauck, C., Huss, M., Huwald, H., Lehning, M., López-Moreno, J.-I., Magnusson, J., Marty, C., Morán-Tejéda, E., Morin, S., Naaim, M., Provenzale, A., Rabatel, A., Six, D., Stötter, J., Strasser, U., Terzago, S., and Vincent, C.: The European mountain cryosphere: a review of its current state, trends, and future challenges, The Cryosphere, 12, 759–794, https://doi.org/10.5194/tc-12-759-2018, 2018. a
Bodin, X., Krysiecki, J.-M., Schoeneich, P., Le Roux, O., Lorier, L., Echelard, T., Peyron, M., and Walpersdorf, A.: The 2006 Collapse of the Bérard Rock Glacier (Southern French Alps), Permafrost Periglac., 28, 209–223, https://doi.org/10.1002/ppp.1887, 2017. a
Boeckli, L., Brenning, A., Gruber, A., and Noetzli, J.: Alpine permafrost index map, PANGAEA [data set], https://doi.org/10.1594/PANGAEA.784450, 2012a. a, b, c
Boeckli, L., Brenning, A., Gruber, S., and Noetzli, J.: Permafrost distribution in the European Alps: calculation and evaluation of an index map and summary statistics, The Cryosphere, 6, 807–820, https://doi.org/10.5194/tc-6-807-2012, 2012b. a
Brock, B. W., Willis, I. C., Sharp, M. J., and Arnold, N. S.: Modelling seasonal and spatial variations in the surface energy balance of Haut Glacier d'Arolla, Switzerland, Ann. Glaciol., 31, 53–62, https://doi.org/10.3189/172756400781820183, 2000. a
Brock, B. W., Willis, I. C., and Sharp, M. J.: Measurement and parameterization of aerodynamic roughness length variations at Haut Glacier d'Arolla, Switzerland, J. Glaciol., 52, 281–297, https://doi.org/10.3189/172756506781828746, 2006. a, b
Bronaugh, D.: PCIC Implementation of Climdex Routines: R package “climdex.pcic”, Comprehensive R Archive Network (CRAN) [code], https://cran.r-project.org/web/packages/climdex.pcic/ (last access: 28 June 2022), 2020. a, b
Brunetti, M. T., Peruccacci, S., Rossi, M., Luciani, S., Valigi, D., and Guzzetti, F.: Rainfall thresholds for the possible occurrence of landslides in Italy, Nat. Hazards Earth Syst. Sci., 10, 447–458, https://doi.org/10.5194/nhess-10-447-2010, 2010. a
Brutsaert, W.: Hydrology: An Introduction, Cambridge University Press, Cambridge, https://doi.org/10.1017/CBO9780511808470, 2005. a
Buchli, T., Merz, K., Zhou, X., Kinzelbach, W., and Springman, S. M.: Characterization and Monitoring of the Furggwanghorn Rock Glacier, Turtmann Valley, Switzerland: Results from 2010 to 2012, Vadose Zone J., 12, 1–15, https://doi.org/10.2136/vzj2012.0067, 2013. a, b
Buchli, T., Kos, A., Limpach, P., Merz, K., Zhou, X., and Springman, S. M.: Kinematic investigations on the Furggwanghorn Rock Glacier, Switzerland, Permafrost Periglac., 29, 3–20, https://doi.org/10.1002/ppp.1968, 2018. a
Burger, K. C., Degenhardt, J. J., and Giardino, J. R.: Engineering geomorphology of rock glaciers, Geomorphology, 31, 93–132, https://doi.org/10.1016/S0169-555X(99)00074-4, 1999. a
Chowdhury, R., Bhattacharya, G., and Flentje, P.: Geotechnical slope analysis, CRC Press, Boca Raton, ISBN 9780415469746, 2010. a
Cicoira, A., Beutel, J., Faillettaz, J., and Vieli, A.: Water controls the seasonal rhythm of rock glacier flow, Earth Planet. Sc. Lett., 528, 115844, https://doi.org/10.1016/j.epsl.2019.115844, 2019. a
Clague, J. J. and Evans, S. G.: Formation and failure of natural dams in the Canadian Cordillera, Geol. Surv. of Can., Ottawa, Ont., Bulletin 464, ISBN 0-660-15496-X, 1994. a
Clague, J. J. and O'Connor, J. E.: Glacier-Related Outburst Floods, in: Snow and Ice-Related Hazards, Risks, and Disasters, edited by: Haeberli, W., Whiteman, C., and Shroder Jr., J. F., Elsevier, Amsterdam, 487–519, ISBN 9780123948496, 2015. a
Clarke, G. K. C.: Glacier Outburst Floods From “Hazard Lake”, Yukon Territory, and the Problem of Flood Magnitude Prediction, J. Glaciol., 28, 3–21, https://doi.org/10.3189/S0022143000011746, 1982. a
Clarke, G. K. C.: Hydraulics of subglacial outburst floods: New insights from the Spring–Hutter formulation, J. Glaciol., 49, 299–313, https://doi.org/10.3189/172756503781830728, 2003. a
Conrad, O., Bechtel, B., Bock, M., Dietrich, H., Fischer, E., Gerlitz, L., Wehberg, J., Wichmann, V., and Böhner, J.: System for Automated Geoscientific Analyses (SAGA) v. 2.1.4, Geosci. Model Dev., 8, 1991–2007, https://doi.org/10.5194/gmd-8-1991-2015, 2015a. a
Conrad, O., Bechtel, B., Bock, M., Dietrich, H., Fischer, E., Gerlitz, L., Wehberg, J., Wichmann, V., and Boehner, J.: System for Automated Geoscientific Analyses (SAGA) v. 2.1.4. Sourceforge [code], https://sourceforge.net/projects/saga-gis/ (last access: 28 June 2022), 2015b. a, b
Crameri, F.: Scientific colour maps: perceptually uniform and colour-vision deficiency friendly, Zenodo [code], https://doi.org/10.5281/zenodo.1243862, 2018. a
Crozier, M. J.: Deciphering the effect of climate change on landslide activity: A review, Geomorphology, 124, 260–267, https://doi.org/10.1016/j.geomorph.2010.04.009, 2010. a, b
Cuffey, K. M. and Paterson, W. S. B.: The Physics of Glaciers, 4th edn., Elsevier Butterworth Heinemann, Burlington, MA, ISBN 9780123694614, 2010. a, b, c, d, e, f, g, h, i, j
Delaloye, R., Morard, S., Barboux, C., Abbet, D., Gruber, V., Riedo, M., and Gachet, S.: Rapidly moving rock glaciers in Mattertal, in: Mattertal – ein Tal in Bewegung, edited by: Graf, C., Eidgenössische Forschungsanstalt für Wald, Schnee und Landschaft (WSL), Birmensdorf, 21–31, ISBN 9783905621532, 2013. a, b
Deline, P., Gruber, S., Delaloye, R., Fischer, L., Geertsema, M., Giardino, M., Hasler, A., Kirkbride, M., Krautblatter, M., Magnin, F., McColl, S., Ravanel, L., and Schoeneich, P.: Ice Loss and Slope Stability in High-Mountain Regions, in: Snow and Ice-Related Hazards, Risks, and Disasters, edited by: Haeberli, W., Whiteman, C., and Shroder Jr., J. F., Elsevier, Amsterdam, 521–561, ISBN 9780123948496, 2015. a, b
Dowling, C. A. and Santi, P. M.: Debris flows and their toll on human life: A global analysis of debris-flow fatalities from 1950 to 2011, Nat. Hazards, 71, 203–227, https://doi.org/10.1007/s11069-013-0907-4, 2014. a
Duque, L. F.: Inter-Event Time Definition: R package “IETD”, Comprehensive R Archive Network (CRAN) [code], https://cran.r-project.org/web/packages/IETD/ (last access: 28 June 2022), 2020. a, b
Ermini, L. and Casagli, N.: Prediction of the behaviour of landslide dams using a geomorphological dimensionless index, Earth Surf. Proc. Land., 28, 31–47, https://doi.org/10.1002/esp.424, 2003. a
Escher-Vetter, H.: Energy Balance Calculations for the Ablation Period 1982 at Vernagtferner, Oetztal Alps, Ann. Glaciol., 6, 158–160, 1985. a
Evans, S. G. and Delaney, K. B.: Catastrophic Mass Flows in the Mountain Glacial Environment, in: Snow and Ice-Related Hazards, Risks, and Disasters, edited by: Haeberli, W., Whiteman, C., and Shroder Jr., J. F., Elsevier, Amsterdam, 563–606, ISBN 9780123948496, 2015. a
Folk, R. L. and Ward, W. C.: Brazos River bar [Texas]; a study in the significance of grain size parameters, J. Sediment. Res., 27, 3–26, https://doi.org/10.1306/74D70646-2B21-11D7-8648000102C1865D, 1957. a
Fox-Kemper, B., Hewitt, H. T., Xiao, C., AÐalgeirsdóttir, G., Drijfhout, S. S., Edwards, T. L., Golledge, N. R., Hemer, M., Kopp, R. E., Krinner, G., Mix, A., Notz, D., Nowicki, S., Nurhati, I. S., Ruiz, L., Sallée, J.-B., Slangen, A. B. A., and Yu, Y.: Ocean, Cryosphere and Sea Level Change, in: Climate Change 2021: The Physical Science Basis. Contribution of Working Group I to the Sixth Assessment Report of the Intergovernmental Panel on Climate Change, edited by: Masson-Delmotte, V., Zhai, P., Pirani, A., Connors, S. L., Péan, C., Berger, S., Caud, N., Chen, Y., Goldfarb, L., Gomis, M. I., Huang, M., Leitzell, K., Lonnoy, E., Matthews, J. B. R., Maycock, T. K., Waterfield, T., Yelekçi, O., Yu, R., and Zhou, B., Cambridge University Press, https://doi.org/10.1017/9781009157896.011, 2021. a
Freeman, T. G.: Calculating catchment area with divergent flow based on a regular grid, Comput. Geosci., 17, 413–422, 1991. a
Gallina, V., Torresan, S., Critto, A., Sperotto, A., Glade, T., and Marcomini, A.: A review of multi-risk methodologies for natural hazards: Consequences and challenges for a climate change impact assessment, J. Environ. Manage., 168, 123–132, https://doi.org/10.1016/j.jenvman.2015.11.011, 2016. a, b
Gariano, S. L. and Guzzetti, F.: Landslides in a changing climate, Earth-Sci. Rev., 162, 227–252, https://doi.org/10.1016/j.earscirev.2016.08.011, 2016. a, b
Geosphere Austria: Spatiotemporal Reanalysis Dataset for Climate in Austria (SPARTACUS) v2.1, Geosphere Austria Data Hub [data set], https://data.hub.zamg.ac.at/dataset/spartacus-v2-1d-1km (last access: 28 June 2022), 2020a. a
Geosphere Austria: Integrated Nowcasting through Comprehensive Analysis Dataset (INCA), Geosphere Austria Data Hub [data set], https://data.hub.zamg.ac.at/dataset/inca-v1-1h-1km (last access: 28 June 2022), 2020b. a
Glade, T. and Crozier, M. J.: The Nature of Landslide Hazard Impact, in: Landslide Hazard and Risk, edited by: Glade, T., Anderson, M., and Crozier, M. J., John Wiley & Sons, Chichester, 43–74, ISBN 9780471486633, 2005. a
Government of the province of Tyrol: Digital terrain model, Government of the province of Tyrol [data set], https://www.data.gv.at/katalog/de/dataset/land-tirol_tirolgelnde (last access: 28 June 2022), 2021a. a, b, c, d, e, f, g, h
Government of the province of Tyrol: Current and historical orthoimagery of Tyrol, Government of the province of Tyrol [data set], https://www.data.gv.at/katalog/de/dataset/land-tirol_orthofototirol (last access: 28 June 2022), 2021b. a, b, c
Government of the province of Tyrol: Historical digital terrain models, Government of the province of Tyrol [data set], https://lba.tirol.gv.at/public/karte.xhtml (last access: 28 June 2022), 2021c. a, b
Government of the province of Tyrol: Historical maps of Tyrol, Government of the province of Tyrol [data set], https://hik.tirol.gv.at/, (last access: 28 June 2022), 2021d. a, b
Greuell, W. and Oerlemans, J.: Energy Balance Calculations on and near Hintereisferner (Austria) and an Estimate of the Effect of Greenhouse Warming on Ablation, in: Glacier Fluctuations and Climatic Change, edited by: Oerlemans, J., Glaciology and Quaternary Geology, Springer, Dordrecht, 305–323, ISBN 9780792301103, 1989. a
Greuell, W., van den Broeke, M., Knap, W., Reijmer, C., Smeets, P., and Struijk, I.: PASTEX (PASTerze EXperiment): Field report on a glacio-meteorological experiment on the Pasterze (Austria), Institute for arine and Atmospheric Research, Utrecht University, Amsterdam, the Netherlands and Faculty of Earth Sciences, Vrije Universiteit, Amsterdam, the Netherlands, https://www.projects.science.uu.nl/iceclimate/documents/Pasterze_1994.pdf (last access: 28 June 2022), 1995. a
Greuell, W., Knap, W. H., and Smeets, P. C.: Elevational changes in meteorological variables along a midlatitude glacier during summer, J. Geophys. Res., 102, 25941–25954, https://doi.org/10.1029/97JD02083, 1997. a, b, c
Guzzetti, F., Peruccacci, S., Rossi, M., and Stark, C. P.: Rainfall thresholds for the initiation of landslides in central and southern Europe, Meteorol. Atmos. Phys., 98, 239–267, https://doi.org/10.1007/s00703-007-0262-7, 2007. a
Haeberli, W.: Frequency and Characteristics of Glacier Floods in the Swiss Alps, Ann. Glaciol., 4, 85–90, https://doi.org/10.3189/S0260305500005280, 1983. a
Haeberli, W. and Vonder Mühll, D.: On the characteristics and possible origins of ice in rock glacier permafrost, Z. Geomorphol., Supplementary Issues, 104, 43–57, 1996. a
Haeberli, W. and Whiteman, C.: Snow and Ice-Related Hazards, Risks, and Disasters: A General Framework, in: Snow and Ice-Related Hazards, Risks, and Disasters, edited by: Haeberli, W., Whiteman, C., and Shroder Jr., J. F., Elsevier, Amsterdam, 1–34, ISBN 9780123948496, 2015. a
Haeberli, W., Kääb, A., Vonder Mühll, D., and Teysseire, P.: Prevention of outburst floods from periglacial lakes at Grubengletscher, Valais, Swiss Alps, J. Glaciol., 47, 111–122, 2001. a
Haiden, T., Kann, A., Wittmann, C., Pistotnik, G., Bica, B., and Gruber, C.: The Integrated Nowcasting through Comprehensive Analysis (INCA) System and Its Validation over the Eastern Alpine Region, Weather Forecast., 26, 166–183, https://doi.org/10.1175/2010WAF2222451.1, 2011. a, b, c
Haque, U., Blum, P., da Silva, P. F., Andersen, P., Pilz, J., Chalov, S. R., Malet, J.-P., Auflič, M. J., Andres, N., Poyiadji, E., Lamas, P. C., Zhang, W., Peshevski, I., Pétursson, H. G., Kurt, T., Dobrev, N., García-Davalillo, J. C., Halkia, M., Ferri, S., Gaprindashvili, G., Engström, J., and Keellings, D.: Fatal landslides in Europe, Landslides, 13, 1545–1554, https://doi.org/10.1007/s10346-016-0689-3, 2016. a
Haque, U., da Silva, P. F., Devoli, G., Pilz, J., Zhao, B., Khaloua, A., Wilopo, W., Andersen, P., Lu, P., Lee, J., Yamamoto, T., Keellings, D., Wu, J.-H., and Glass, G. E.: The human cost of global warming: Deadly landslides and their triggers (1995–2014), Sci. Total Environ., 682, 673–684, https://doi.org/10.1016/j.scitotenv.2019.03.415, 2019. a
Hiebl, J. and Frei, C.: Daily temperature grids for Austria since 1961 – concept, creation and applicability, Theor. Appl. Climatol., 124, 161–178, https://doi.org/10.1007/s00704-015-1411-4, 2016. a, b
Hiebl, J. and Frei, C.: Daily precipitation grids for Austria since 1961 – development and evaluation of a spatial dataset for hydroclimatic monitoring and modelling, Theor. Appl. Climatol., 132, 327–345, https://doi.org/10.1007/s00704-017-2093-x, 2018. a, b
Hirsch, R. M. and Slack, J. R.: A Nonparametric Trend Test for Seasonal Data With Serial Dependence, Water Resour. Res., 20, 727–732, https://doi.org/10.1029/WR020i006p00727, 1984. a
Hirsch, R. M., Slack, J. R., and Smith, R. A.: Techniques of Trend Analysis for Monthly Water Quality Data, Water Resour. Res., 18, 107–121, 1982. a
Hock, R.: Glacier melt: a review of processes and their modelling, Prog. Phys. Geogr., 29, 263–391, 2005. a, b
Hock, R., Rasul, G., Adler, C., Cáceres, B., Gruber, S., Hirabayashi, Y., Jackson, M., Kääb, A., Kang, S., Kutuzov, S., Milner, A., Molau, U., Morin, S., Orlove, B., and Steltzer, H.: High Mountain Areas, in: IPCC Special Report on the Ocean and Cryosphere in a Changing Climate, Intergovernmental Panel on Climate Change, 131–202, https://doi.org/10.1017/9781009157964.004, 2019. a, b, c, d
Hofierka, J., Suri, M., and Huld, T.: Solar irradiance and irradiation model: GRASS GIS 8.0 module “r.sun”, Geographic Resources Analysis Support System (GRASS) [code], https://grass.osgeo.org/grass80/manuals/r.sun.html (last access: 28 June 2022), 2007. a, b, c
Hoinkes, G. and Thöni, M.: Evolution of the Ötztal-Stubai, Scarl-Campo and Ulten Basement Units, in: Pre-Mesozoic Geology in the Alps, edited by: Raumer, J. F. and Neubauer, F., Springer Berlin Heidelberg, Berlin, Heidelberg, 485–494, ISBN 9783642846427, 1993. a
Hübl, J. and Beck, M.: Ereignisdokumentation 2019, Federal Ministry of Agriculture, Regions and Tourism, Vienna, Austria, IAN Report 209, 2020. a
Huggel, C., Haeberli, W., Kääb, A., Bieri, D., and Richardson, S.: An assessment procedure for glacial hazards in the Swiss Alps, Can. Geotech. J., 41, 1068–1083, https://doi.org/10.1139/t04-053, 2004. a
Hungr, O.: Classification and terminology, in: Debris-flow Hazards and Related Phenomena, edited by: Jakob, M. and Hungr, O., Springer-Verlag Berlin Heidelberg, 9–24, ISBN 3540207260, 2005. a
Hungr, O., Leroueil, S., and Picarelli, L.: The Varnes classification of landslide types, an update, Landslides, 11, 167–194, 2014. a, b
Hydrological Service of Tyrol: Hydrological summary, Government of the province of Tyrol, Innsbruck, Austria, https://www.tirol.gv.at/umwelt/wasserwirtschaft/wasserkreislauf/hydrologische-uebersichten/ (last access: 28 June 2022), 2019. a
Ikeda, A., Matsuoka, N., and Kääb, A.: Fast deformation of perennially frozen debris in a warm rock glacier in the Swiss Alps: An effect of liquid water, J. Geophys. Res., 113, F01021, https://doi.org/10.1029/2007JF000859, 2008. a
International Organization for Standardization: ISO 14688-1:2017 Geotechnical investigation and testing – Identification and classification of soil – Part 1: Identification and description, https://doi.org/10.31030/2748424, 2017. a
Isotta, F. A., Frei, C., Weilguni, V., Perčec Tadić, M., Lassègues, P., Rudolf, B., Pavan, V., Cacciamani, C., Antolini, G., Ratto, S. M., Munari, M., Micheletti, S., Bonati, V., Lussana, C., Ronchi, C., Panettieri, E., Marigo, G., and Vertačnik, G.: The climate of daily precipitation in the Alps: Development and analysis of a high-resolution grid dataset from pan-Alpine rain-gauge data, Int. J. Climatol., 34, 1657–1675, https://doi.org/10.1002/joc.3794, 2014. a
Iverson, R. M.: The physics of debris flows, Rev. Geophys., 35, 245–296, 1997. a, b, c, d, e, f
Iverson, R. M.: Debris-flow mechanics, in: Debris-flow Hazards and Related Phenomena, edited by: Jakob, M. and Hungr, O., Springer-Verlag Berlin Heidelberg, 105–134, ISBN 3540207260, 2005. a
Iverson, R. M. and LaHusen, R. G.: Dynamic Pore-Pressure Fluctuations in Rapidly Shearing Granular Materials, Science, 246, 796–799, 1989. a
Iverson, R. M. and Major, J. J.: Groundwater Seepage Vectors and the Potential for Hillslope Failure and Debris Flow Mobilization, Water Resour. Res., 22, 1543–1548, https://doi.org/10.1029/WR022i011p01543, 1986. a
Iverson, R. M., Reid, M. E., and LaHusen, R. G.: Debris-flow mobilization from landslides, Annu. Rev. Earth Pl. Sc., 25, 85–138, https://doi.org/10.1146/annurev.earth.25.1.85, 1997. a, b, c
Johnson, K. A. and Sitar, N.: Hydrologic conditions leading to debris-flow initiation, Can. Geotech. J., 27, 789–801, https://doi.org/10.1139/t90-092, 1990. a
Johnson, P. G.: Micro-relief on a Rock Glacier, Dalton Range, Yukon, Canada, Permafrost Periglac., 3, 41–47, 1992. a
Jones, D. B., Harrison, S., Anderson, K., and Whalley, W. B.: Rock glaciers and mountain hydrology: A review, Earth-Sci. Rev., 193, 66–90, https://doi.org/10.1016/j.earscirev.2019.04.001, 2019. a
Kääb, A. and Haeberli, W.: Evolution of a High-Mountain Thermokarst Lake in the Swiss Alps, Arct. Antarct. Alp. Res., 33, 385–390, 2001. a, b, c
Kainz, S.: Characterizing Groundwater Flow Dynamics and Storage Capacity in an Active Rock Glacier, Springer Fachmedien, Wiesbaden, https://doi.org/10.1007/978-3-658-37073-2, 2022. a
Kappes, M. S., Keiler, M., von Elverfeldt, K., and Glade, T.: Challenges of analyzing multi-hazard risk: A review, Nat. Hazards, 64, 1925–1958, https://doi.org/10.1007/s11069-012-0294-2, 2012. a, b
Kerschner, H.: Zeugen der Klimageschichte im oberen Radurschltal: Alte Gletscherstände und Blockgletscher in der Umgebung des Hohenzollernhauses, Zeitschrift des Deutschen und Österreichischen Alpenvereins, 107, 23–27, 1982. a
Klein Tank, A. M. G., Zwiers, F. W., and Zhang, X.: Guidelines on analysis of extremes in a changing climate in support of informed decisions for adaptation, no. 72 in World Climate Data and Monitoring Programme (WCDMP), World Meteorological Organization (WMO), Geneva, https://library.wmo.int/index.php?lvl=notice_display&id=138 (last access: 12 July 2023), 2009. a
Klok, E. J. and Oerlemans, J.: Model study of the spatial distribution of the energy and mass balance of Morteratschgletscher, Switzerland, J. Glaciol., 48, 505–518, https://doi.org/10.3189/172756502781831133, 2002. a
Kofler, C., Mair, V., Gruber, S., Todisco, M. C., Nettleton, I., Steger, S., Zebisch, M., Schneiderbauer, S., and Comiti, F.: When do rock glacier fronts fail? Insights from two case studies in South Tyrol (Italian Alps), Earth Surf. Proc. Land., 46, 1311–1327, https://doi.org/10.1002/esp.5099, 2021. a, b, c, d, e, f
Krainer, K. and Mostler, W.: Hydrology of Active Rock Glaciers: Examples from the Austrian Alps, Arct. Antarct. Alp. Res., 34, 142–149, https://doi.org/10.1080/15230430.2002.12003478, 2002. a, b
Krainer, K., Lang, K., and Hausmann, H.: Active Rock Glaciers at Croda Rossa/Hohe Gaisl, Eastern Dolomites (Alto Adige/South Tyrol, Northern Italy), Geogr. Fis. Dinam. Quat., 33, 25–36, http://hdl.handle.net/20.500.12708/167230, 2010. a
Krainer, K., Mussner, L., Behm, M., and Hausmann, H.: Multi-disciplinary investigation of an active rock glacier in the Sella Group (Dolomites; Northern Italy), Austrian J. Earth Sc., 105, 48–62, 2012. a, b, c, d
Krainer, K., Bressan, D., Dietre, B., Haas, J. N., Hajdas, I., Lang, K., Mair, V., Nickus, U., Reidl, D., Thies, H., and Tonidandel, D.: A 10 300-year-old permafrost core from the active rock glacier Lazaun, southern Ötztal Alps (South Tyrol, northern Italy), Quaternary Res., 83, 324–335, https://doi.org/10.1016/j.yqres.2014.12.005, 2015. a
Kummert, M. and Delaloye, R.: Mapping and quantifying sediment transfer between the front of rapidly moving rock glaciers and torrential gullies, Geomorphology, 309, 60–76, https://doi.org/10.1016/j.geomorph.2018.02.021, 2018. a, b, c
Kummert, M., Delaloye, R., and Braillard, L.: Erosion and sediment transfer processes at the front of rapidly moving rock glaciers: Systematic observations with automatic cameras in the western Swiss Alps, Permafrost Periglac., 29, 21–33, https://doi.org/10.1002/ppp.1960, 2018. a, b, c
Landa, M., Neteler, M., Metz, M., Petrasova, A., glynnc, Hamish, B., Petras, V., huhabla, Cho, H., Delucchi, L., Pietro, Barton, M., Zigo, T., Chemin, Y., Nartišs, M., ostepok, Kudrnovsky, H., Lennert, M., Larsson, N., Blumentrath, S., Kladivova, L., Kyngesburye, W., aghisla, Andrea, V., Jacobson, D., Ovsienko, D., Di Leo, M., Mitasova, H., Tawalika, C., and Haedrich, C.: GRASS GIS 8.0.0, Zenodo [code], https://doi.org/10.5281/zenodo.5913049, 2022. a, b
Lugon, R. and Stoffel, M.: Rock-glacier dynamics and magnitude–frequency relations of debris flows in a high-elevation watershed: Ritigraben, Swiss Alps, Global Planet. Change, 73, 202–210, https://doi.org/10.1016/j.gloplacha.2010.06.004, 2010. a, b, c
Major, J. J.: Experimental studies of deposition by debris flows: process, characteristics of deposits, and effects of pore-fluid pressure, Dissertation, University of Washington, Seattle, http://hdl.handle.net/1773/6722, 1996. a, b
Marcer, M., Serrano, C., Brenning, A., Bodin, X., Goetz, J., and Schoeneich, P.: Evaluating the destabilization susceptibility of active rock glaciers in the French Alps, The Cryosphere, 13, 141–155, https://doi.org/10.5194/tc-13-141-2019, 2019. a, b, c, d
Marcer, M., Ringsø Nielsen, S., Ribeyre, C., Kummert, M., Duvillard, P.-A., Schoeneich, P., Bodin, X., and Genuite, K.: Investigating the slope failures at the Lou rock glacier front, French Alps, Permafrost Periglac., 31, 15–30, https://doi.org/10.1002/ppp.2035, 2020. a, b, c, d
Marcer, M., Cicoira, A., Cusicanqui, D., Bodin, X., Echelard, T., Obregon, R., and Schoeneich, P.: Rock glaciers throughout the French Alps accelerated and destabilised since 1990 as air temperatures increased, Communications Earth & Environment, 2, 383, https://doi.org/10.1038/s43247-021-00150-6, 2021. a
Marchetto, A.: Mann-Kendall Test, Seasonal and Regional Kendall Tests: R package “rkt”, Comprehensive R Archive Network (CRAN) [code], https://cran.r-project.org/web/packages/rkt/ (last access: 28 June 2022), 2021. a, b
Marra, F., Nikolopoulos, E. I., Creutin, J. D., and Borga, M.: Space–time organization of debris flows-triggering rainfall and its effect on the identification of the rainfall threshold relationship, J. Hydrol., 541, 246–255, https://doi.org/10.1016/j.jhydrol.2015.10.010, 2016. a, b, c, d
Mölg, N., Huggel, C., Herold, T., Storck, F., Allen, S., Haeberli, W., Schaub, Y., and Odermatt, D.: Inventory and evolution of glacial lakes since the Little Ice Age: Lessons from the case of Switzerland, Earth Surf. Proc. Land., 46, 2551–2564, https://doi.org/10.1002/esp.5193, 2021. a
Moser, M.: GEOFAST 1 : 50 000. Zusammenstellung ausgewählter Archivunterlagen der Geologischen Bundesanstalt: Blatt 172 Weißkugel, GeoSphere Austria, Vienna, Austria, ID 900028483, 2012. a
Nikolopoulos, E. I., Borga, M., Marra, F., Crema, S., and Marchi, L.: Debris flows in the eastern Italian Alps: seasonality and atmospheric circulation patterns, Nat. Hazards Earth Syst. Sci., 15, 647–656, https://doi.org/10.5194/nhess-15-647-2015, 2015. a, b, c, d
Oerlemans, J.: Analysis of a 3 year meteorological record from the ablation zone of Morteratschgletscher, Switzerland: Energy and mass balance, J. Glaciol., 46, 571–579, https://doi.org/10.3189/172756500781832657, 2000. a, b, c
Oerlemans, J. and Klok, E. J.: Energy Balance of a Glacier Surface: Analysis of Automatic Weather Station Data from the Morteratschgletscher, Switzerland, Arct. Antarct. Alp. Res., 34, 477–485, https://doi.org/10.1080/15230430.2002.12003519, 2002. a
Oerlemans, J., Giesen, R. H., and van den Broeke, M. R.: Retreating alpine glaciers: Increased melt rates due to accumulation of dust (Vadret da Morteratsch, Switzerland), J. Glaciol., 55, 729–736, https://doi.org/10.3189/002214309789470969, 2009. a
Olefs, M., Schöner, W., Suklitsch, M., Wittmann, C., Niedermoser, B., Neururer, A., and Wurzer, A.: SNOWGRID – A new operational snow cover model in Austria, in: Proceedings of International Snow Science Workshop, Grenoble-Chamonix, France, 7–11 October 2013: a merging of theory and practice, edited by: Bouvet, F. N., Ruand, Y., and Lambert, R., ANENA, IRSTEA, Météo-France, Paris, France, 38–45, https://hal.inrae.fr/hal-02599446/document, 2013. a, b, c
Olefs, M., Baumgartner, D. J., Obleitner, F., Bichler, C., Foelsche, U., Pietsch, H., Rieder, H. E., Weihs, P., Geyer, F., Haiden, T., and Schöner, W.: The Austrian radiation monitoring network ARAD – best practice and added value, Atmos. Meas. Tech., 9, 1513–1531, https://doi.org/10.5194/amt-9-1513-2016, 2016. a
Olefs, M., Koch, R., Schöner, W., and Marke, T.: Changes in Snow Depth, Snow Cover Duration, and Potential Snowmaking Conditions in Austria, 1961–2020 – A Model Based Approach, Atmosphere, 11, 1330, https://doi.org/10.3390/atmos11121330, 2020. a, b
Pack, R. T.: Application of airborne and spaceborne remote sensing methods, in: Debris-flow Hazards and Related Phenomena, edited by: Jakob, M. and Hungr, O., 275–290, Springer-Verlag Berlin Heidelberg, ISBN 3540207260, 2005. a
Patton, A. I., Rathburn, S. L., and Capps, D. M.: Landslide response to climate change in permafrost regions, Geomorphology, 340, 116–128, https://doi.org/10.1016/j.geomorph.2019.04.029, 2019. a, b, c, d
Peruccacci, S., Brunetti, M. T., Luciani, S., Vennari, C., and Guzzetti, F.: Lithological and seasonal control on rainfall thresholds for the possible initiation of landslides in central Italy, Geomorphology, 139–140, 79–90, https://doi.org/10.1016/j.geomorph.2011.10.005, 2012. a
Petley, D.: Global patterns of loss of life from landslides, Geology, 40, 927–930, https://doi.org/10.1130/G33217.1, 2012. a
Ranasinghe, R., Ruane, A. C., Vautard, R., Arnell, N., Coppola, E., Cruz, F. A., Dessai, S., Islam, A. S., Rahimi, M., Ruiz Carrascal, D., Sillmann, J., Sylla, M. B., Tebaldi, C., Wang, W., and Zaaboul, R.: Climate Change Information for Regional Impact and for Risk Assessment, in: Climate Change 2021: The Physical Science Basis. Contribution of Working Group I to the Sixth Assessment Report of the Intergovernmental Panel on Climate Change, edited by: Masson-Delmotte, V., Zhai, P., Pirani, A., Connors, S. L., Péan, C., Berger, S., Caud, N., Chen, Y., Goldfarb, L., Gomis, M. I., Huang, M., Leitzell, K., Lonnoy, E., Matthews, J. B. R., Maycock, T. K., Waterfield, T., Yelekçi, O., Yu, R., and Zhou, B., Cambridge University Press, https://doi.org/10.1017/9781009157896.014, 2021. a
R Core Team: R: A language and environment for statistical computing, Comprehensive R Archive Network (CRAN), https://cran.r-project.org/(last access: 28 June 2022), 2022. a, b, c
Ribis, M.: Geologisch-hydrogeologische und hydrochemische Untersuchungen in Permafrostbereichen der Ötztaler Alpen (Tirol, Österreich), Dissertation, Leopold-Franzens-Universität, Innsbruck, ID AC11365577, 2017. a
Roer, I., Haeberli, W., Avian, M., Kaufmann, V., Delaloye, R., Lambiel, C., and Kääb, A.: Observations and Considerations on Destabilizing Active Rock Glaciers in the European Alps, in: Proceedings of the 9th International Conference on Permafrost, Fairbanks, Alaska, 29 June–2 July 2008, edited by: Kane, D. L. and Hinkel, K. M., University of Alaska Fairbanks, Fairbanks, 1505–1510, ISBN 9780980017922, 2008. a
Sassa, K. and Wang, G. K.: Mechanism of landslide-triggered debris flows: Liquefaction phenomena due to the undrained loading of torrent deposits, in: Debris-flow Hazards and Related Phenomena, edited by: Jakob, M. and Hungr, O., Springer-Verlag Berlin Heidelberg, 81–104, ISBN 3540207260, 2005. a
Savage, W. and Baum, R.: Instability of steep slopes, in: Debris-flow Hazards and Related Phenomena, edited by: Jakob, M. and Hungr, O., Springer-Verlag Berlin Heidelberg, 53–80, ISBN 3540207260, 2005. a, b
Schaub, Y.: Outburst floods from high-mountain lakes: risk analysis of cascading processes under present and future conditions, Dissertation, Universität Zürich, Zürich, https://www.zora.uzh.ch/id/eprint/120918/ (last access: 28 June 2022), 2015. a
Schauwecker, S., Gascón, E., Park, S., Ruiz-Villanueva, V., Schwarb, M., Sempere-Torres, D., Stoffel, M., Vitolo, C., and Rohrer, M.: Anticipating cascading effects of extreme precipitation with pathway schemes – Three case studies from Europe, Environ. Int., 127, 291–304, https://doi.org/10.1016/j.envint.2019.02.072, 2019. a
Schmid, S. M., Fügenschuh, B., Kissling, E., and Schuster, R.: Tectonic map and overall architecture of the Alpine orogen, Eclogae Geol. Helv., 97, 93–117, 2004. a
Sentinel Hub: Modified Sentinel-2 multi-spectral satellite data, produced from European Space Agency remote sensing data provided by Copernicus, images processed by Sentinel Hub, Sinergise Laboratory for geographical information systems Ltd., Ljubljana, Slovenia, https://www.sentinel-hub.com/ (last access: 28 June 2022), 2020. a, b, c, d
Soeters, R. and van Westen, C. J.: Slope Instability Recognition, Analysis, and Zonation, in: Landslides, edited by Turner, A. K. and Schuster, R. L., Transportation Research Board Special Report, National Academy of Sciences, Washington, 129–177, ISBN 0309061512, 1996. a, b
Stoffel, M. and Huggel, C.: Effects of climate change on mass movements in mountain environments, Prog. Phys. Geogr., 36, 421–439, https://doi.org/10.1177/0309133312441010, 2012. a
Tenthorey, G.: Perennial névés and the hydrology of rock glaciers, Permafrost Periglac., 3, 247–252, https://doi.org/10.1002/ppp.3430030313, 1992. a
Turner, A. K.: Colluvium and Talus, in: Landslides, edited by Turner, A. K. and Schuster, R. L., Transportation Research Board Special Report, National Academy of Sciences, Washington, 525–554, ISBN 0309061512, 1996. a
van de Wal, R. S. W., Oerlemans, J., and van der Hage, J. C.: A study of ablation variations on the tongue of Hintereisferner, Austrian Alps, J. Glaciology, 38, 319–324, https://doi.org/10.3189/S0022143000002203, 1992. a
Wagner, T., Pleschberger, R., Kainz, S., Ribis, M., Kellerer-Pirklbauer, A., Krainer, K., Philippitsch, R., and Winkler, G.: The first consistent inventory of rock glaciers and their hydrological catchments of the Austrian Alps, Austrian J. Earth Sc., 113, 1–23, https://doi.org/10.17738/ajes.2020.0001, 2020a. a
Wagner, T., Ribis, M., Kellerer-Pirklbauer, A., Krainer, K., and Winkler, G.: The Austrian rock glacier inventory RGI_1 and the related rock glacier catchment inventory RGCI_1 in ArcGis (shapefile) format, PANGAEA [data set], https://doi.org/10.1594/PANGAEA.921629, 2020b. a
Wagner, T., Kainz, S., Krainer, K., and Winkler, G.: Storage–discharge characteristics of an active rock glacier catchment in the Innere Ölgrube, Austrian Alps, Hydrol. Process., 35, e14210, https://doi.org/10.1002/hyp.14210, 2021. a
Werder, M. A., Bauder, A., Funk, M., and Keusen, H.-R.: Hazard assessment investigations in connection with the formation of a lake on the tongue of Unterer Grindelwaldgletscher, Bernese Alps, Switzerland, Nat. Hazards Earth Syst. Sci., 10, 227–237, https://doi.org/10.5194/nhess-10-227-2010, 2010. a
Wieczorek, G. F. and Guzzetti, F.: A review of rainfall thresholds for triggering landslides, in: Mediterranean Storms, edited by European Geosciences Union, Editoriale Bios, Cosenza, Italy, 407–414, ISBN 9788877402967, 2000. a
Willis, I. C., Arnold, N. S., and Brock, B. W.: Effect of snowpack removal on energy balance, melt and runoff in a small supraglacial catchment, Hydrol. Process., 16, 2721–2749, https://doi.org/10.1002/hyp.1067, 2002. a
Winkler, G., Wagner, T., Krainer, K., Ribis, M., and Hergarten, S.: Hydrogeology of Rock Glaciers - Storage Capacity and Drainage Dynamics – An Overview, in: Novel methods and results of landscape research in Europe, Central Asia and Siberia, edited by: Sychev, V. G. and Mueller, L., FGBNU VNII agrochimii, Moskau, 329–334, 2018. a
Žebre, M., Colucci, R. R., Giorgi, F., Glasser, N. F., Racoviteanu, A. E., and Del Gobbo, C.: 200 years of equilibrium-line altitude variability across the European Alps (1901–2100), Clim. Dynam., 56, 1183–1201, https://doi.org/10.1007/s00382-020-05525-7, 2021. a