the Creative Commons Attribution 4.0 License.
the Creative Commons Attribution 4.0 License.
 | 17 Jul 2023
Meteotsunami in the United Kingdom: the hidden hazard
Clare Lewis
Tim Smyth
David Williams
Jess Neumann
Hannah Cloke
This paper examines the occurrence and seasonality of meteotsunami in the United Kingdom (UK) to present a revised and updated catalogue of events that have occurred since 1750. Previous case studies have alluded to a summer prevalence and rarity of this hazard in the UK. We have verified and classified 98 events using a developed set of identification criteria. The results have revealed a prominent seasonal pattern of winter events which are related to mid-latitude depressions with precipitating convective weather systems. A geographical pattern has also emerged, highlighting three “hotspot” areas at the highest risk from meteotsunami. The evidence reviewed and new data presented here show that the hazard posed by meteotsunami has been underestimated in the UK.
- Article
(3261 KB) - Full-text XML
-
Supplement
(362 KB) - BibTeX
- EndNote


Meteotsunami or meteorological tsunami are globally occurring progressive shallow water waves with a period of between 2 and 120 min which results from an air–sea interaction. They tend to be initiated by sudden pressure changes and wind stress from moving atmospheric systems with sources including convective clouds, cyclones, squalls, thunderstorms, atmospheric gravity waves and strong mid-tropospheric winds (Vilibić and Šepić, 2017). The atmospheric pressure changes are typically only a few millibars over a few tens of minutes, which corresponds to only a few centimetres of sea level change occurring in a process known as the inverse barometer effect (for example, a 3 mbar pressure jump will produce a 30 cm ocean wave). The atmospheric disturbance transfers energy into the ocean, initiating and amplifying a water wave which travels at the same speed as the atmospheric wave, in a process known as Proudman resonance (Proudman, 1929). When the water wave reaches the coastline and shallower water, it becomes a multi-resonant phenomena and is further amplified through coastal resonances. For example, if the wave reaches the entrance of a semi-enclosed basin, it can induce an oscillation in the basin known as harbour resonance. However, if the wave reaches a beach-type environment and the along-shore component of the disturbance equals the phase speed of the edge wave, this is a process known as Greenspan resonance (Monserrat et al., 2006). The resultant waves can elevate the coastal water level and can substantially increase flow velocities with the potential for rip currents (Linares et al., 2019). Due to the rapid onset and unexpected nature of meteotsunami waves, they have the potential to cause destruction, injuries and even fatalities (Sibley et al., 2016). For a global perspective and overview of meteotsunami observations, we recommend Pellikka et al. (2020) for observations in Finland, Šepić et al. (2018) for the Adriatic, Bechle et al. (2016) for seasonality of meteotsunami in the Great Lakes, Pattiaratchi and Wijeratne (2015) for observations in southwest Australia, and Monserrat et al. (2006) for a general overview of the mechanisms of meteotsunami.
Meteotsunami research and monitoring are more advanced in the Mediterranean, on the East Coast of the USA and in the Great Lakes due to the higher number of recorded events in these locations. In contrast, events in the UK appear to be rare and are believed to be less devastating, meaning that research has been limited to date.
The two principal factors contributing to this belief are the following:
-
The current (since 1993) 15 min sampling interval that is used at UK tide gauges is incapable of detecting waves with periods of between 2 and 120 min. This means that many events go unobserved; wave heights are underestimated; or meteotsunami are mischaracterised as seiches, tsunami or surge.
-
Until recently, research has suggested that UK meteotsunami are generated by precipitating convective weather systems associated with hot weather. Such mesoscale convective systems may be associated with synoptic “Spanish plume” events. These synoptic events are more prevalent between May and October (Haslett et al., 2009; Tappin et al., 2013; Sibley, 2012; Sibley et al., 2016; Thompson et al., 2020), leading to the belief that meteotsunami occurrence is a summertime phenomenon. However, it is now emerging that embedded convection within winter frontal systems may also be responsible for a sizeable proportion of these waves (Williams et al., 2021).
Several issues have resulted from the untested assumption that meteotsunami events (1) are low frequency and (2) predominantly occur in summer, which has been combined with (3) the lack of high-resolution temporal data. Firstly, there is no central database of UK events. Secondly, there is no standardised methodology of meteotsunami identification. Thirdly, there is no government or regional policy in place to cover impacts from a meteotsunami event. There is a misconception of the risk posed by meteotsunami, especially for coastal areas that are already at risk from storm impacts associated with pluvial hazards (extreme precipitation) and fluvial hazards (high levels of river discharge). In the future, the overall level of risk is likely to be greatly exacerbated by rising sea levels and an intensification of storm frequency and severity (Vilibić et al., 2018; Masselink et al., 2015).
As stated by Šepić et al. (2015), the assessment of meteotsunami should become the standard in coastal hazard assessments; event cataloguing is a prerequisite for any coastal hazard assessment, especially in identifying the geographical areas that have experienced meteotsunami and the frequency of exposure.
The aim of this paper is to compile, update and extend the existing list of UK meteotsunami to include winter events, as well as to highlight the occurrence, frequency and spatial distribution of events. Where seasonality was alluded to in Williams et al. (2021), their study was principally focused on meteotsunami in northwest Europe from 2010 to 2017. This paper will further their study by focusing on UK waters only and will add new events up to the end of 2022. The methodology fulfils this aim by applying a set of developed identification criteria to the re-assessment of fragmented historical accounts and to the analysis of tide gauge and atmospheric data to identify new events. The outcome also highlights the potential element of winter compound hazard risk which may occur when meteotsunami waves arrive at the coast in short succession or concurrently with other storm-associated hazards.
We propose the following research questions:
-
What standardised criteria should be used to identify meteotsunami?
-
Have events occurred which were ignored or misidentified?
-
In which regions of the UK and in what months do meteotsunami occur most frequently?
-
What are the atmospheric variables that can be correlated with meteotsunami events?
This section outlines the data sources and identification criteria used to fulfil the objective of cataloguing and characterising UK meteotsunami. We have extrapolated as many quantitative data as possible to verify the event with the standardised criteria and to then arrange the results into tabular form to allow ease of use (Table 1).
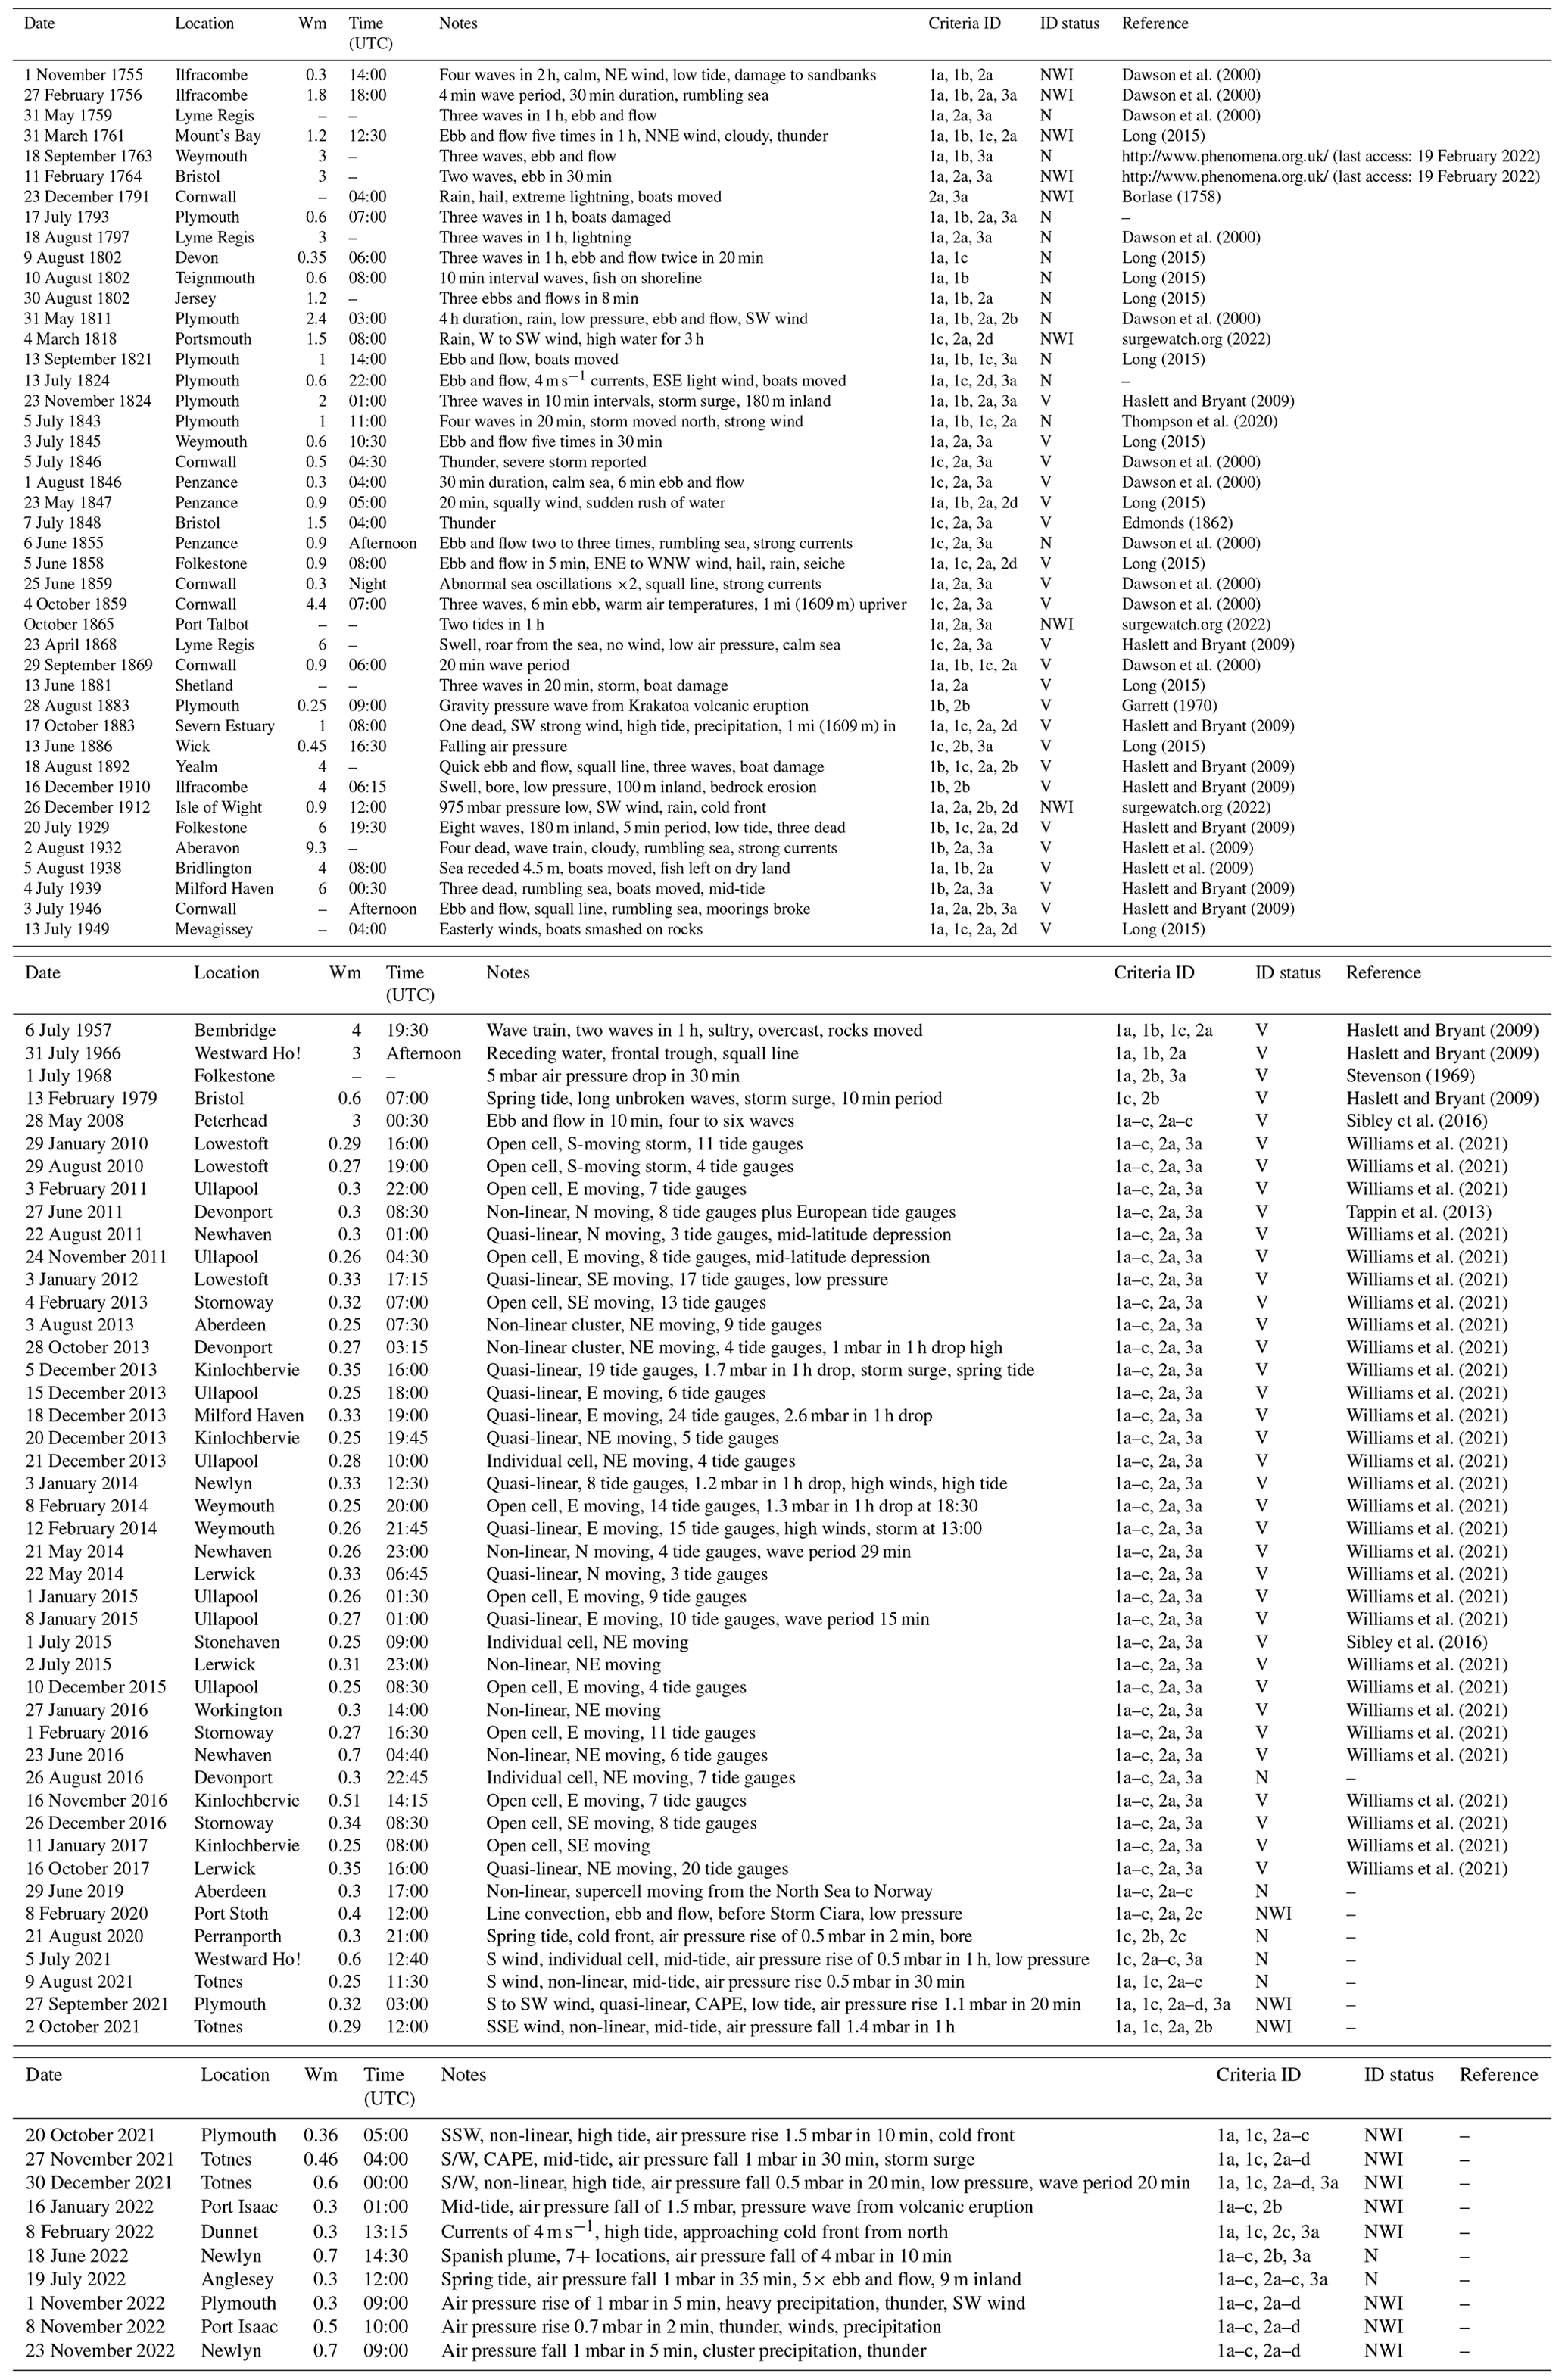
Table 1Descriptions and references for events that can be identified as UK meteotsunami events from 1750 to 2022. The years 1750 to 2009 are principally derived from historical sources and 2010 to 2022 are principally derived from instrumental data. The threshold criteria outlined in the Methodology section were used to verify previous (V) or identify new (N) events, including new winter events (NWI). The terms in the “Criteria ID” column correspond to the labelling of criteria in Sect. 2.1.1–2.1.3. (Wm represents maximum wave height in metres; CAPE denotes convective available potential energy.)
2.1 Meteotsunami identification criteria
As there are currently no fixed criteria for what qualifies as a meteotsunami, in this paper we bring together various aspects used by other researchers in the field into one standardised system. Figure 1 displays a visual representation of the commonly used criteria, which we explain in more detail in Sect. 2.1.1–2.1.2. The methodologies that have been previously used by researchers and studies have variations, with some using qualitative methods that base events on eyewitness accounts (Haslett and Bryant, 2009; Haslett et al., 2009) and others using quantitative data from sea level and atmospheric observations (Tappin et al., 2013; Sibley et al., 2016). For the purpose of this paper, we have classified meteotsunami as atmospherically induced sea level oscillations having at least one sea level and one atmospheric characteristic. This allows for the distinguishing of meteotsunami from other types of waveform and is applicable to either qualitative accounts or quantitative data.
2.1.1 Sea level criteria (Category 1)
The sea level criteria are as follows:
- a.
Periods of sea level disturbance range between 2 and 120 min (Fig. 1).
- b.
Wave heights exceed 0.20 m. This threshold is within the peak thresholds of 0.2 and 0.3 m as used by other researchers in the field such as Williams et al. (2021), Dusek et al. (2019), Bechle et al. (2016), Šepić et al. (2012) and Monserrat et al. (2006). A 0.3 m water elevation may not appear to be dangerous, but a meteotsunami in 2003 in New Zealand caused a fully laden oil tanker to be grounded through strong currents (Goring, 2009). Lynett et al. (2014) also state that any wave over 0.3 m will start to float vehicles regardless of flow velocity and is enough to sweep people off their feet. These thresholds comprise a tried-and-tested set of characteristics that reflect meteotsunami, especially those in UK waters. A threshold of 0.2 m was chosen to be used as the lower end as this is more suitable for distinguishing a greater number of events that may have been missed at the higher-end threshold (0.3 m). Any anomaly below 0.2 m would not be large enough to allow for accurate verification and for its separation from any other water disturbances. (Figure 1a illustrates the meteotsunami wave height criteria in the data as recorded on 27 June 2011.)
- c.
A wave disturbance registers at two or more locations or tide gauge stations (Williams et al., 2021; Kim et al., 2021).
2.1.2 Atmospheric criteria (Category 2)
The atmospheric criteria are as follows:
- a.
A convective weather system at the time of the wave event is present, displaying high radar reflectivity with precipitation rates exceeding 2 mm h−1, initiated over the sea. (Figure 1 represents the radar reflectivity of the various convective weather systems present during four different meteotsunami events.)
- b.
There is an atmospheric pressure of 1005 mbar or less with a rapid change of ±1 mbar in 30 min or a 3 mbar fall over 3 h or less (Monserrat et al., 2006). (Figure 1 illustrates this distinct air pressure change as recorded during the 28 October 2013 event.)
- c.
Convective available potential energy (CAPE) shows an unstable vertical profile of the atmosphere that leads to convective activity (Williams et al., 2019). (Figure 1 displays a radiosonde ascent showing sufficient CAPE to produce the event that occurred on 1 July 2015 at Stonehaven, east Scotland.) Even though CAPE is a bulk atmospheric measurement and meteotsunami are localised, if this element is present in conjunction with the other indicators, it supports the presence of convective activity, which aids in the generation of meteotsunami.
- d.
There is a change in wind speed exceeding 10 m s−1 (anything under this is too weak for a meteotsunami to be generated) and/or a drop in air temperature of 1.5 ∘C in 30 min (Figure 1 demonstrates this increase in wind speed as recorded during the 28 October 2013 event.)
2.1.3 Geological criteria (Category 3)
There is one geological criterion, described as follows:
- a.
There is an absence of any other explanation or data to imply an alternative source trigger, for example, the presence of seismic triggers within the continental shelf area which would produce a geological tsunami wave. However, there is one exception to this rule which, for the purpose of this paper, we include as a meteotsunami trigger, i.e. volcanic eruptions. This was demonstrated on 28 August 1883 (Krakatoa) and recently on 16 January 2021 (Hunga Tonga–Hunga Ha'apai), when wave anomalies occurred and were the product of air pressure waves created by the eruptions. It may be argued that they should not be classed as meteotsunami waves. However, for the purpose of this catalogue, we are classifying them as meteotsunami as they are sourced from air pressure disturbances which couple with water waves and have a wave period of 2 to 120 min. The force of the Hunga Tonga–Hunga Ha'apai explosions sent a shockwave through the atmosphere that circled the globe three times. The resultant pressure wave travelled at close to the speed of sound and as a result coupled with ocean waves to create a meteotsunami which was detected as far away as Portugal and the UK (Burt, 2022).
To ease the interpretation of results, the UK coastline has been partitioned into six coastal regions based on the National Tidal and Sea Level Facility (National Tidal and Sea Level Facility, 2022) tide gauge network (Table S1 in the Supplement). The data are also separated into two seasons (each comprising 6 months) that divide up the calendar year at the spring and autumn equinoxes (Haigh et al., 2016). April to September inclusive is referred to throughout this paper as “summer”, and October to March is referred to as “winter”. Finally, due to the nature of the data, two time series of meteotsunami are referred to throughout this paper, one based primarily on historical eyewitness accounts due to a lack of high-frequency instrumentation (the years 1750 to 2009 CE) and one based on and verified by quantitative instrumental data (the years 2010 to 2022 CE).
2.2 Historical record (1750 to 2009)
To gain a complete understanding of these events we follow Long (2015) and Haslett and Bryant (2008), who dated their historic tsunami catalogues back to approximately 1000 CE. We noted that any events preceding 1750 CE were vaguely recorded, making validation problematic, so we opted to date our catalogue back to 1750. References to meteotsunami-like events in historical accounts tend to be based on descriptions of the state of the water at the coast with a lack of instrumental tidal data. There is a lack of or limited weather data, so tracing back the atmospheric source is not straightforward. It is only in the last few decades that meteorological data with sufficient resolution have been readily available. With tide gauge data, prior to 1993 the resolution was hourly, and it was not until 1996 that all the current tide gauge sites became fully operational. Therefore, we have used 2009 as the upper limit of the historical record. The historical reports tend to be derived from newspaper articles, parish records, harbourmaster records and eyewitness accounts. Although there is reason to be sceptical of these accounts as they afford a level of biased review and sensationalism, they do still hold value in terms of a societal viewpoint and may help to fill in any gaps (Haslett and Bryant, 2009; Haslett et al., 2009).
There are certain characteristics that can be flagged up in a historical account to verify whether it refers to a meteotsunami event or not. To illustrate this, we can highlight the historical account for the event of 23 May 1847, where we can look at a letter from Robert Blight of Penzance dated 24 May and published in the Royal Cornwall Gazette on 28 May. The full extract can be found in Extract S1 in the Supplement of this paper and in Long (2015, p. 26).
The changes in the atmosphere during the day were very remarkable. In the morning, about six o'clock, we had a breeze from the southeast; by eight, it was a perfect calm; between ten o'clock and two, the mercury sunk several degrees; about three in the afternoon a breeze sprung up suddenly from the west, and the sky, as suddenly, became overcast … It is very probable that all these changes, and even the agitation of the sea, were produced by electricity.
In this particularly detailed account (Extract S1), we can identify six of the nine criteria, including a drawback and sudden inrush of water, accompanied by a rumbling noise and the water being higher than expected at 2.4 m (8 ft) (criteria 1a and 1d), all indicating a tsunami-like event. The key to the identification of a meteotsunami is in the atmospheric portion of the account; what started out as a calm morning featured a change in wind speed and direction, veering from southeasterly in the morning to westerly in the afternoon (criterion 2d). This variable wind was accompanied by a drop in temperature (criterion 2d), and finally, there was mention of the presence of a storm in terms of overcast sky, threatening rain and lightning (criterion 2a). As such, we identify this wave as a meteotsunami by applying both our oceanographic and our atmospheric criteria to the historic account.
2.3 Tide gauge analysis for the 2010-to-2022 record
To identify meteotsunami from 1 January 2010 to 31 December 2022, we use data records that are available at higher frequencies, meaning meteotsunami are more distinctly observable. The information for this portion of the catalogue is sourced from the British Oceanographic Data Centre (BODC) website (https://www.bodc.ac.uk, last access: 1 March 2023) and the Intergovernmental Oceanographic Commission (IOC) website (https://ioc-sealevelmonitoring.org/, last access: 8 July 2023, Sea Level Monitoring Facility, 2023), where data are displayed from the “Class A” network of tide gauges owned and funded by the Environment Agency (EA). We also use the post-processed data of Williams et al. (2021), where the raw sea level tide gauge data have been high-pass-filtered to isolate high-frequency disturbances. This removes periods of over 120 min and separates out the tidal components. In this way any signals in the tsunami frequency band (2 to 120 min) are isolated from the sea level elevations. Any remaining signals larger than the background noise are then identified and checked against our threshold criteria to verify events as potential meteotsunami. Apart from the standard processing to remove any erroneous spikes outside of the parameters, a visual quality control was carried out, where a 7 d plot of the data was evaluated to highlight any clear artificial spikes or gaps. Also, any data points that had no accompanying air pressure changes were also excluded from any further analysis.
2.4 Atmospheric data analysis for the 2010-to-2022 record
The times of the potential meteotsunami events are noted from the tide gauge data, and they are then linked to specific precipitating convective atmospheric systems by using the meteorological C-band radar network, which is pre-processed by the UK Met Office before download (Met Office, 2003). The convective systems highlighted by the radar are classified into four distinct types (as shown in Fig. 1). These are (1) open cells which are situated behind the cold front of cyclonic weather, usually where cold dry air passes over the warm sea, creating shallow convection; (2) quasi-linear systems which tend to be multi-cellular and linearly organised with high CAPE, heavy precipitation and strong winds (this type of weather feature is sometimes called squall lines and can occur within synoptic Spanish plume events); (3) isolated, small, short-duration (<1 h) thunderstorm cells; and (4) non-linear clusters which are large, circular, long-lived clusters of precipitation and thunderstorm cells.
The atmospheric ascent soundings are obtained from the University of Wyoming website (http://weather.uwyo.edu/upperair/sounding.html, University of Wyoming, 2022) with the UK stations at Camborne (station number: 03808) and Lerwick (station number: 03005) being used. Soundings are available for 00:00 and 12:00 UTC on each day, and if a CAPE value of greater than 0 occurs, then this shows a marginally unstable atmosphere leading to convective activity. Finally, the synoptic charts allow for verification of the storm system, including the location of the pressure centres and fronts at the time of the meteotsunami wave event.
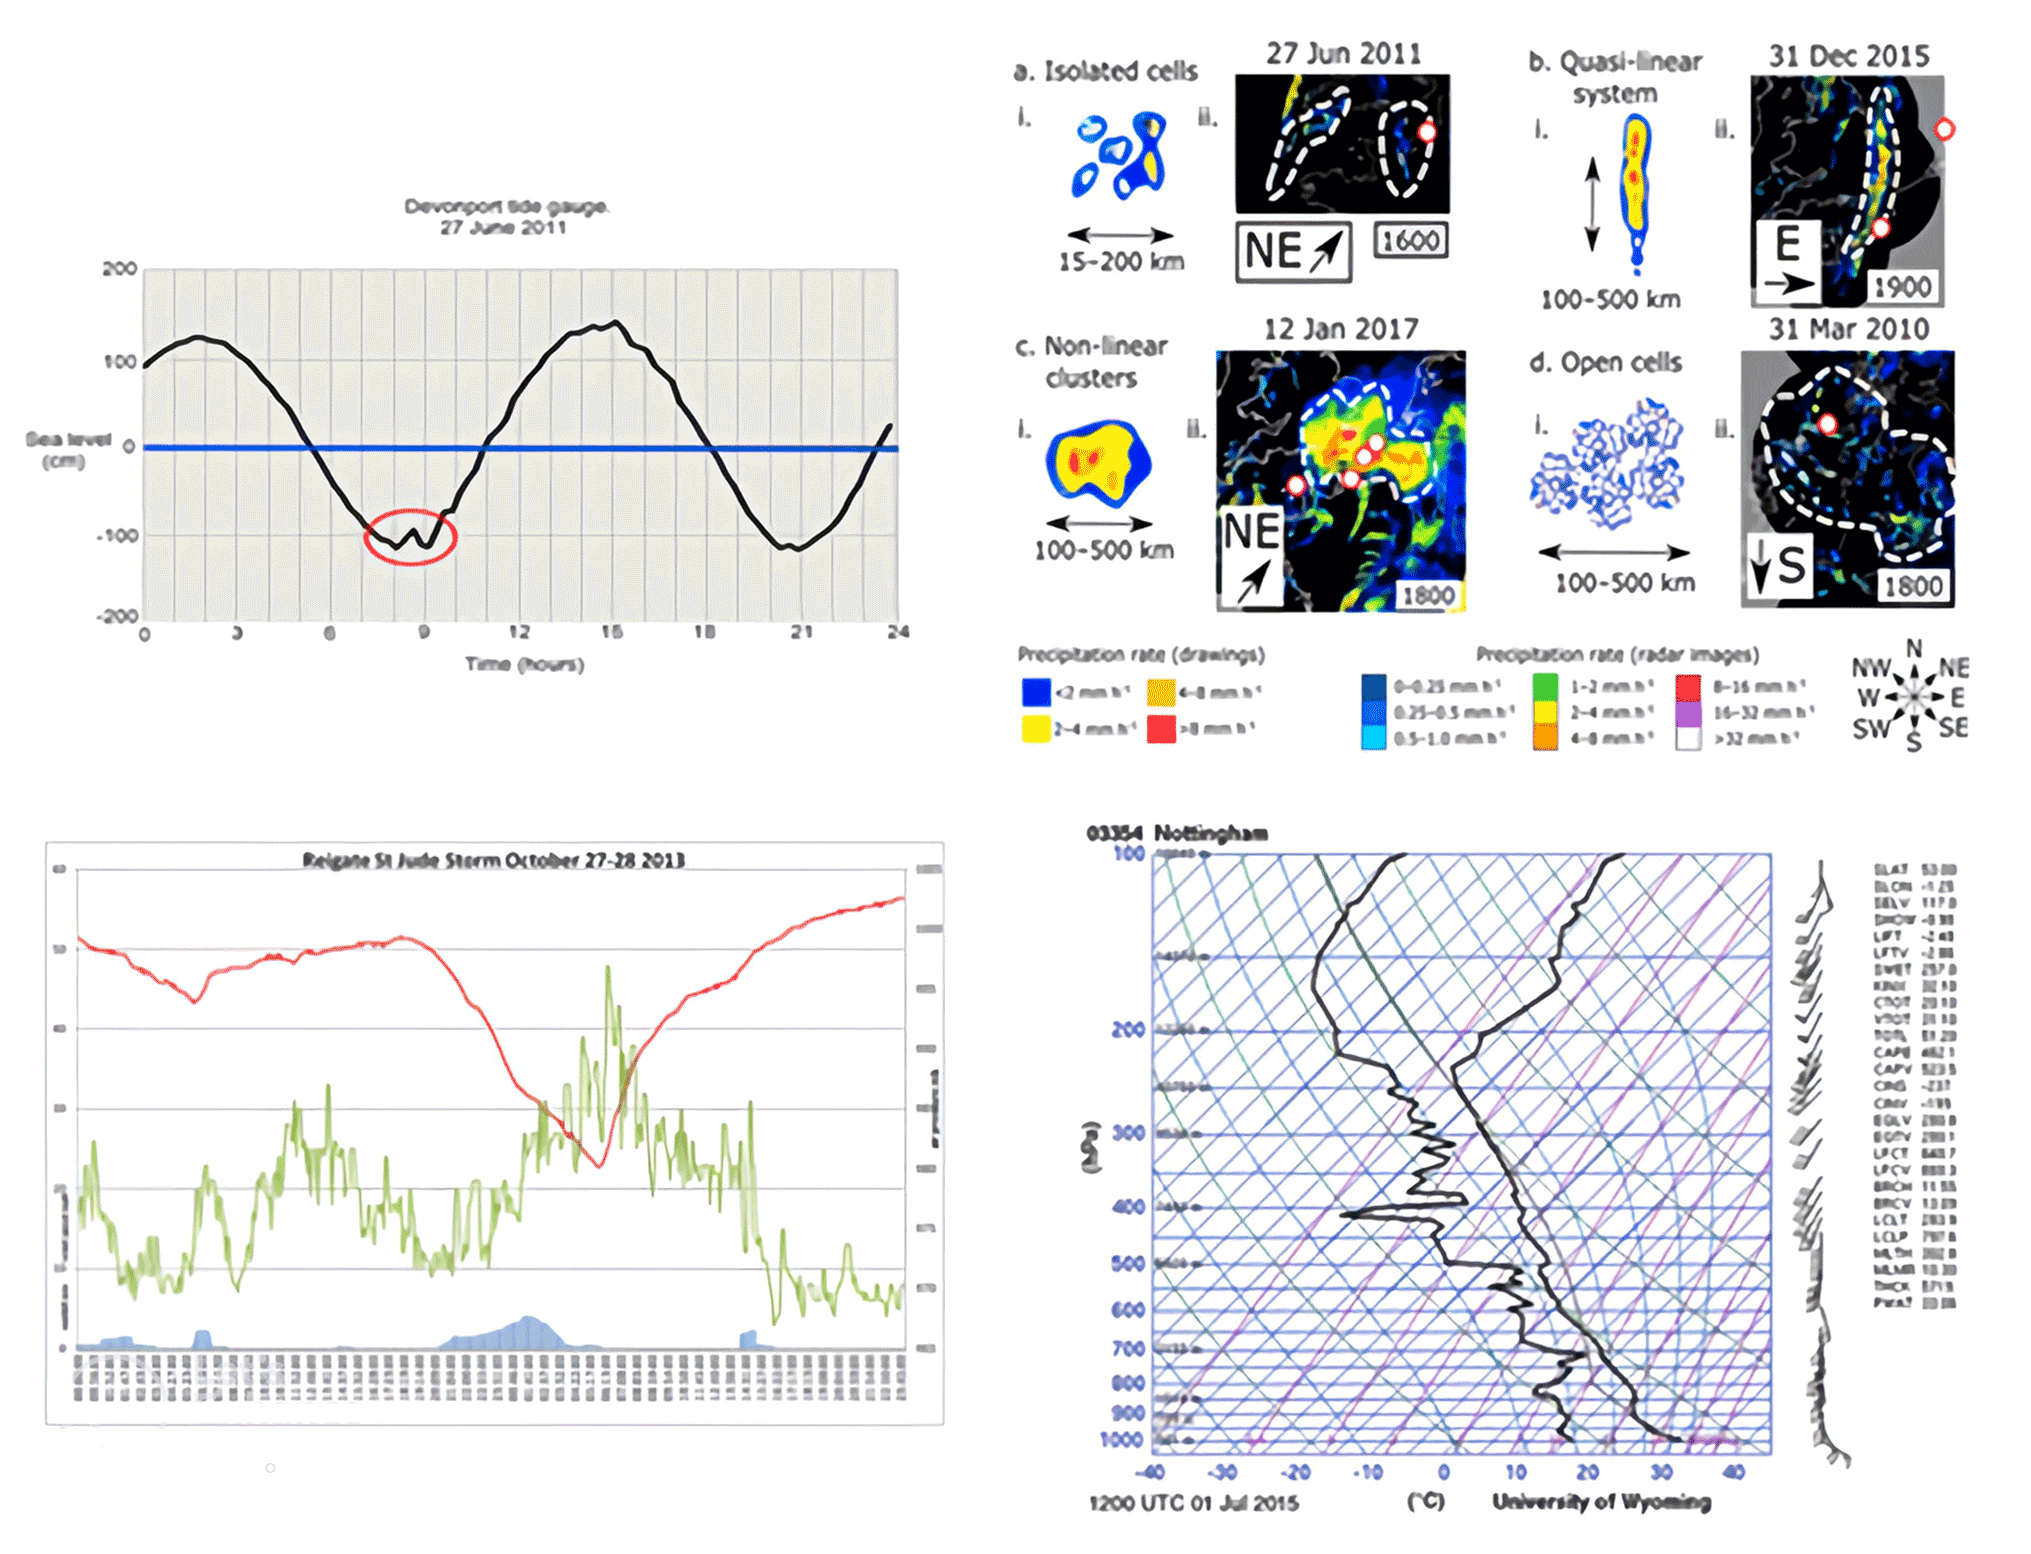
Figure 1Top left: Devonport tide gauge for 27 June 2011 showing a distinct sea level disturbance at 09:30 UTC as highlighted with a red circle. This is a representative of criterion 1b. The timing of this 0.25 m rise and fall corresponds with the arrival of the meteotsunami event at that specific location. Top right: the four different types of convective activity as shown in radar reflectivity identifying meteotsunami events, a representation of criterion 2a. Orange and red in the images show high precipitation rates (>4 mm h−1), with idealised images shown on the left and actual examples taken from UK events on the right. All show the date, time and direction of the storm as well as the location of the tide gauges (white dots). Image by Williams et al. (2021) licensed under Creative Commons – Attribution 4.0 International – CC BY 4.0. Bottom left: the atmospheric pressure, wind speed and precipitation at Reigate during the 27 to 28 October 2013 storm associated with a meteotsunami. This is a representation of criteria 2b and 2d. The graph shows atmospheric pressure (red line) of less than 1005 mbar and falling as the atmospheric disturbance moved over the area, with a corresponding rising wind speed of 9 m s−1 (green line) and precipitation (blue bars). Reproduced with the kind permission of Simon Collins, https://rgsweather.wordpress.com/ (Reigate Grammar School Weather Station, 2022). Bottom right: the Nottingham radiosonde ascent at 12:00 UTC on 1 July 2015 during a meteotsunami event in the North Sea. This is a representation of criterion 2c, which indicates sufficient CAPE (462.1 J kg−1) to provide high base convective activity, with the cloud base at an approximate height of 3000 m and cloud top at 11 000 m (http://weather.uwyo.edu/upperair/sounding.html, last access: 19 December 2022).
In this section we highlight the seasonal occurrence and distribution of UK meteotsunami events in both the historical record and the more recent instrumental-data record. This is augmented by the identification of trigger systems associated with the events where available. It is prudent to note here that the catalogue cannot be considered complete, and this is signified by dashes (i.e. –) in the columns where data or information either is unavailable or has not been located.
3.1 Historical record (1750 to 2009)
We identify 98 events as meteotsunami occurring in UK waters between January 1750 and December 2022 (Table 1), with 48 of these occurring within the historical record (1750 to 2009). This record shows that 67 % of documented meteotsunami occur in summer (April–September), with 44 % of documented meteotsunami occurring in July and August. The single year experiencing the most documented events was 1802 CE, numbering three, and the decade experiencing the most documented events was the 1840s, with six in total. The presence of a storm and/or characteristics of convective activity (thunder and lightning) at the time of the wave event was noted for 42 of the 48 events (91 %) in the historical record. There was also a defined southwest prevalence of meteotsunami in historical documents, with Devon, Cornwall and Somerset recording a combined total of 29 events. Within the historical record we have identified four new events and reclassified four tsunami events, three storm surge events and nine events of unknown origin as meteotsunami. Seven of these occurred within winter months (Table 1).
3.2 Seasonal and locational frequency of UK meteotsunami events (2010 to 2022)
Meteotsunami have been thought to be a rare phenomenon in the UK, and it has been thought that when they do occur, it tends to be in the summer months due to the more abundant convective activity (Haslett et al., 2009; Tappin et al., 2013; Sibley et al., 2016; Thompson, 2020). However, of the 98 identified meteotsunami events verified in this paper, 50 have been interpreted as occurring since 2010, with 33 (66 %) of those occurring during the winter months and 9 of these winter events identified as new. We find that not only are UK meteotsunami more common in occurrence than previous research indicates, but also they are a year-round phenomenon, as exhibited in Table 1 and Figs. 2 and 3.
The historical section of the catalogue shows an estimated return period of 5.4 years. This return period considerably decreases for the instrumental-data section, where the UK return period reduces to an estimated 0.25 years. With an average of four events per year, we can see that certain years have experienced above-average numbers and high proportions of winter events, with seven winter events out of eight in 2013, four out of seven in 2021 and five out of seven in 2022. Figure 3 displays the seasonal distribution of these events, with 34 % of meteotsunami recorded in December and January and no events being recorded in March or April. Following statistical analysis, the recorded maximum wave amplitude for each event resulted in a mean wave height of 0.33 m for winter and 0.35 m for summer. With a t-test score of 0.30 and a p value of 0.07, the tests indicate a similarity between the two sample sets, where the difference between seasonal wave heights is considered not statistically significant.
Summarising the results from the catalogue in its entirety, we suggest that there are three “hotspot” regions where meteotsunami events appear to be most frequent: (1) northwest Scotland, (2) Wales and (3) the southwest UK. Up until 2009, Penzance in the southwest UK had experienced the most meteotsunami with eight in total. Then from 2010, Kinlochbervie in northwest Scotland experienced a maximum wave height of 0.51 m during the 16 November 2016 event. This same location was exposed to 14 separate meteotsunami events in the 12 years from 2010 to 2022. Harbour-style geomorphology appears to be more susceptible to meteotsunami resonance, being associated with 71 % of the events with beach environments comprising the remaining 29 %.
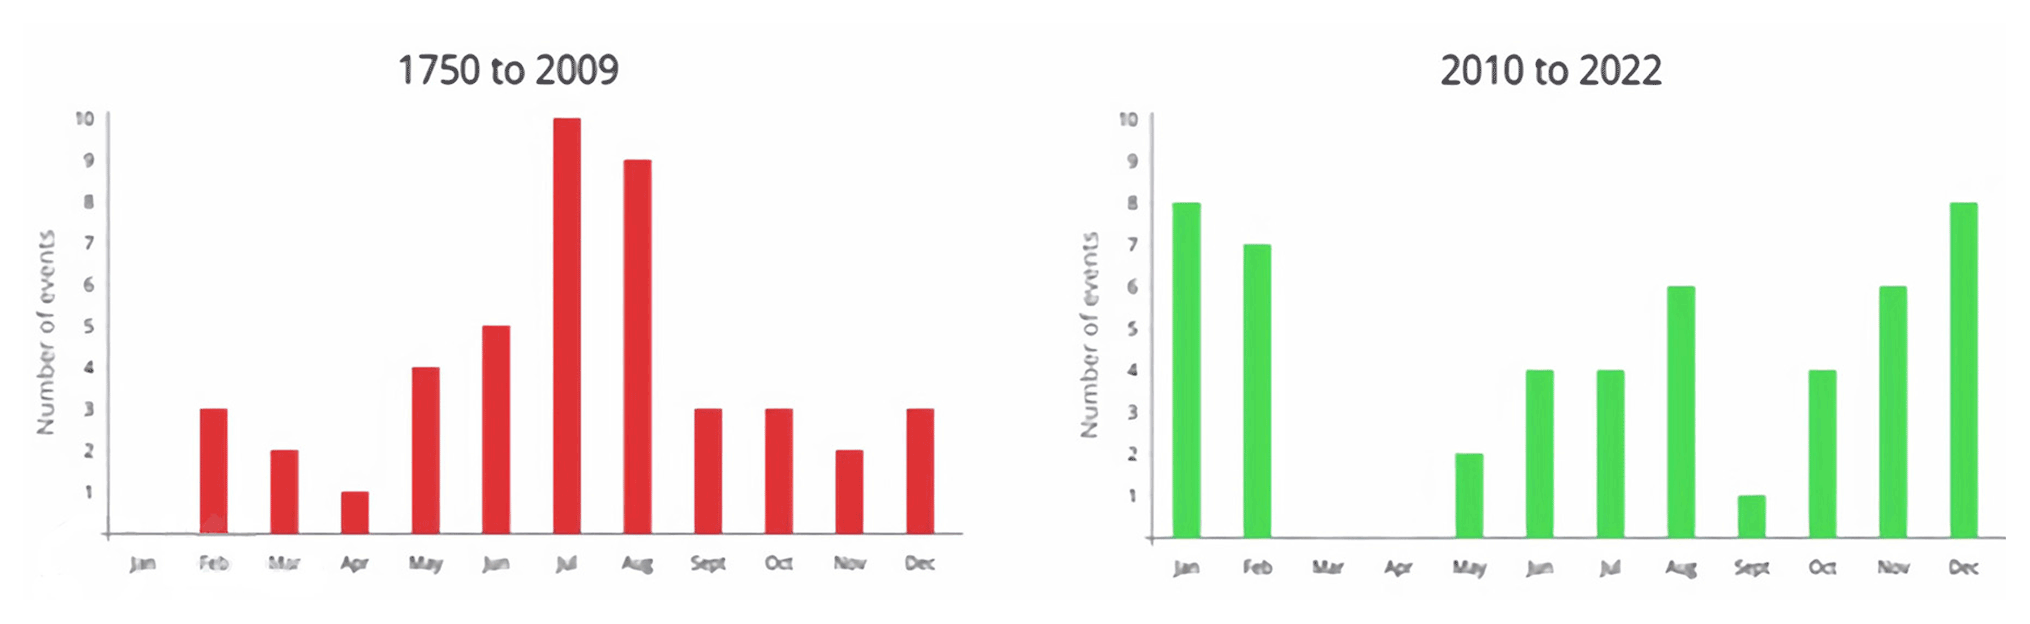
Figure 2Seasonal distribution of UK meteotsunami events, historical record (1750 to 2009) and current record (2010 to 2022).
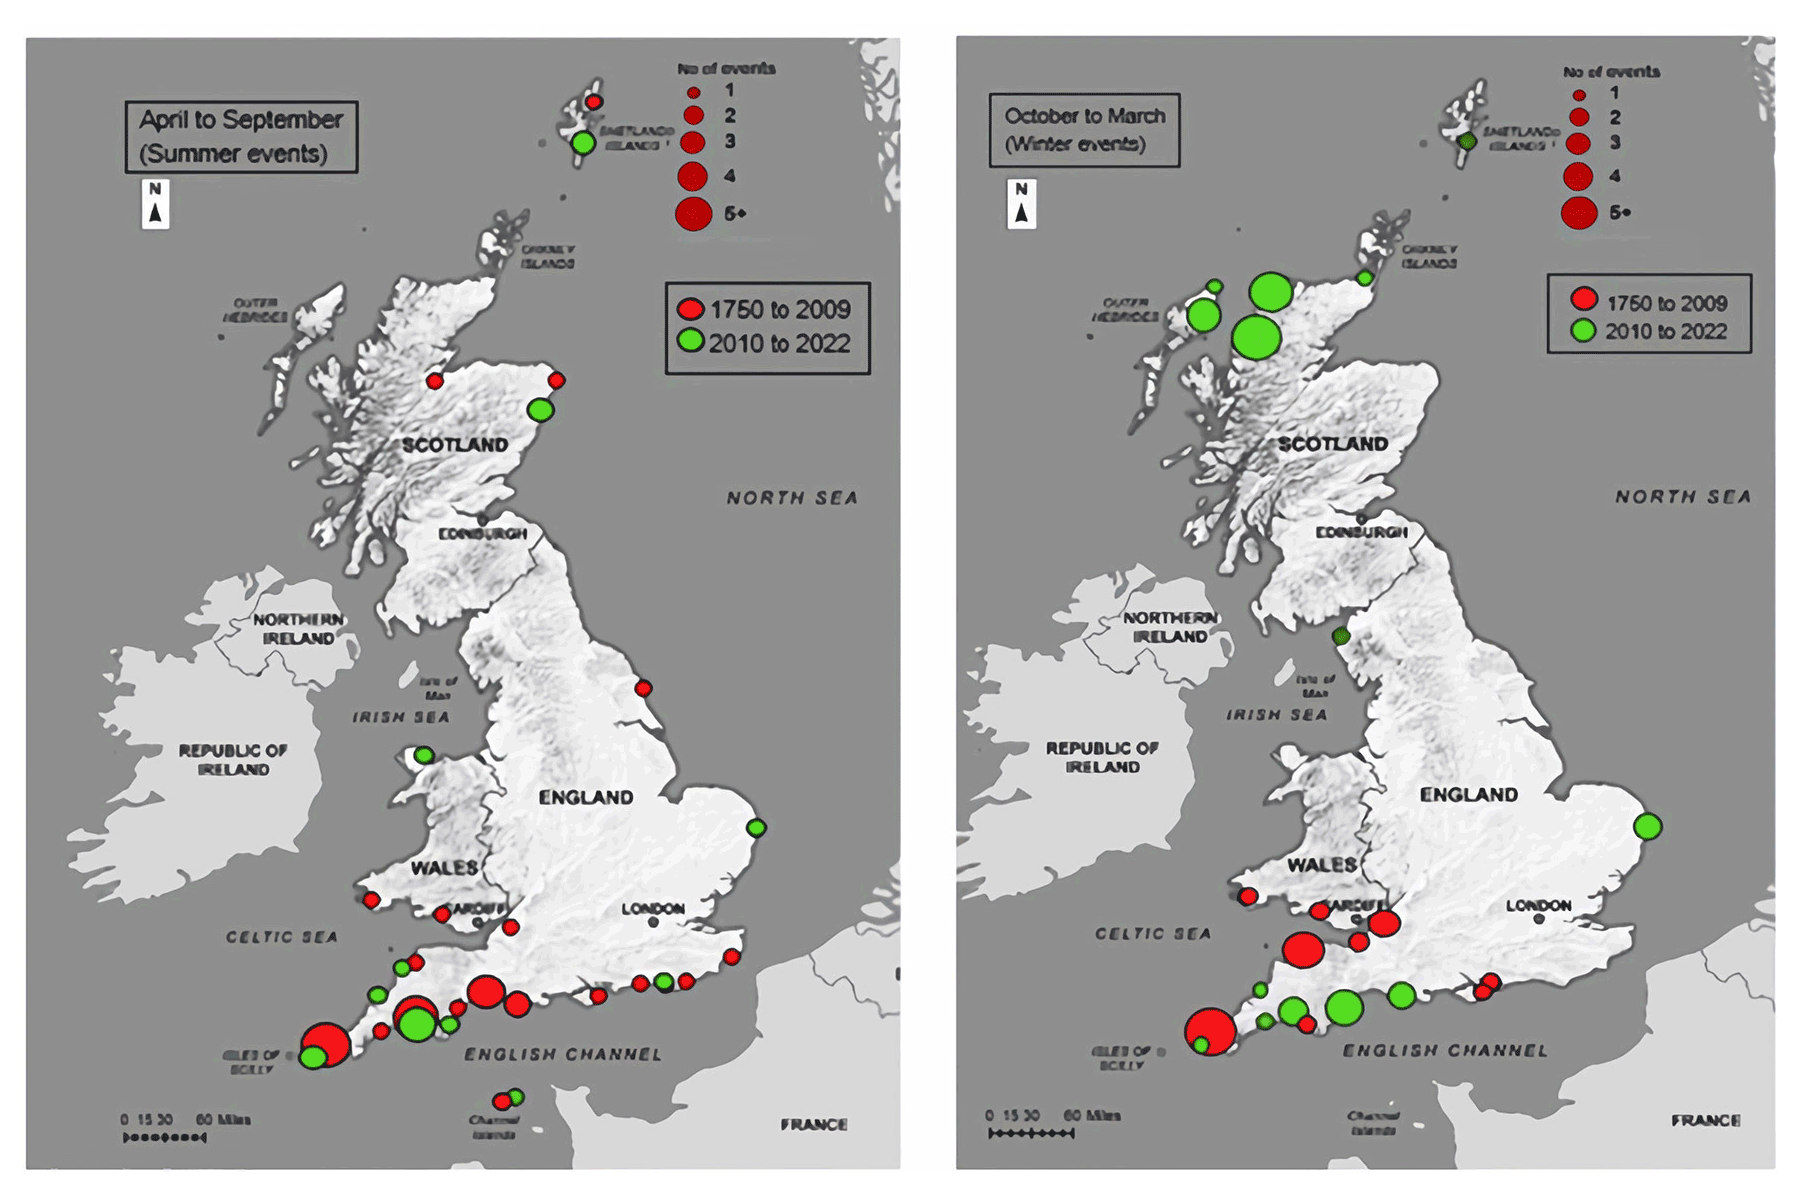
Figure 3Seasonal and locational distribution of maximum wave heights from 1750 to 2022. Numbers of events at specific locations are represented by dot size as shown in the key. Base map: © Crown copyright 2022. Distributed under the Open Government Licence (OGL). Note that, regarding the scale, 1 mi is 1.609 km.
3.3 Relationship between meteotsunami and winter storms
In this section, we highlight two specific meteotsunami events that occurred in two consecutive winter seasons. These two events have been picked as they are new events to the catalogue, and they represent a typical winter meteotsunami hidden in the associated storm data. The winter of 2021/22 saw seven sequential named storms with five verifiable meteotsunami events, one of which was on 20 October 2021. The winter of 2022/23 saw three likely/numerically verifiable meteotsunami events, one of which was 1 November 2022. Both meteotsunami events were low profile, localised in nature and hidden within larger-scale heavily precipitating low-pressure systems.
3.3.1 Event 1: 20 October 2021
Two low-pressure systems developed in the Atlantic Ocean and propagated eastwards towards the southwest UK. The first system which was detected as a mature echo signature on radar contained a sharp cold front (squall) which moved into Cornwall at approximately 04:00 UTC (criterion 2a and Fig. 4) with a simultaneous leading air pressure rise of 1.6 mbar over 4 min followed by a sharp 2 ∘C air temperature drop (criteria 2b and 2d and Fig. 4). A flattish ridge between this first system and the second system named Aurore by Météo-France led to a yellow rainfall warning being issued in the UK. At 16:00 UTC the second system with a low-pressure centre of 992 mbar moved into the Isles of Scilly and propagated across Cornwall and Devon; it contained a heavily precipitating non-linear system with convective activity and strong winds (31+ m s−1) rapidly veering from west to south (criterion 2d). This system initiated a sharp air pressure rise of 0.5 mbar over 2 min which coincided with a high tide. Both low-pressure systems initiated a series of meteotsunami waves that tracked eastwards along the coast of Cornwall, Devon and Dorset. Wave anomalies were recorded in Plymouth at 16:45 UTC with a maximum wave height of 0.36 m; Totnes at 17:00 UTC; and Port Isaac, Weymouth and the Isle of Wight at 18:00 UTC before dissipating (criteria 1b and 1c).
3.3.2 Event 2: 1 November 2022
A series of low-pressure systems over the Atlantic Ocean swept into the southwest UK on 1 November, the first one with its centre over Cornwall at 00:00 UTC followed by a second low-pressure system arriving along the southwest coast at approx. 06:00 UTC that then moved northeast up over the UK.
This synoptic situation was complicated by a series of associated cold fronts followed by low-pressure troughs. A quasi-linear precipitation system with its associated convective cells developed in the vicinity (criteria 2a and 2c, Fig. 4). The arrival of the storm feature was detected in surface observations with a sharp air pressure rise of 1 mbar in 35 min (Fig. 4) that coincided with a series of unpredictable meteotsunami waves which reached a maximum wave height of 0.3 m (criterion 2b). The waves tracked along the southwest UK alongside the movement of the cold fronts, the heavily precipitating cells and the convective activity, where they were recorded at five tide gauge sites along the southwest coast at Port Isaac, St Mary's, Newlyn, Plymouth and Totnes (criterion 1c). The first series of wave anomalies occurred at 09:00 UTC, coinciding with a high tide, followed by a second set of wave anomalies at 16:00 UTC, coinciding with a low tide.
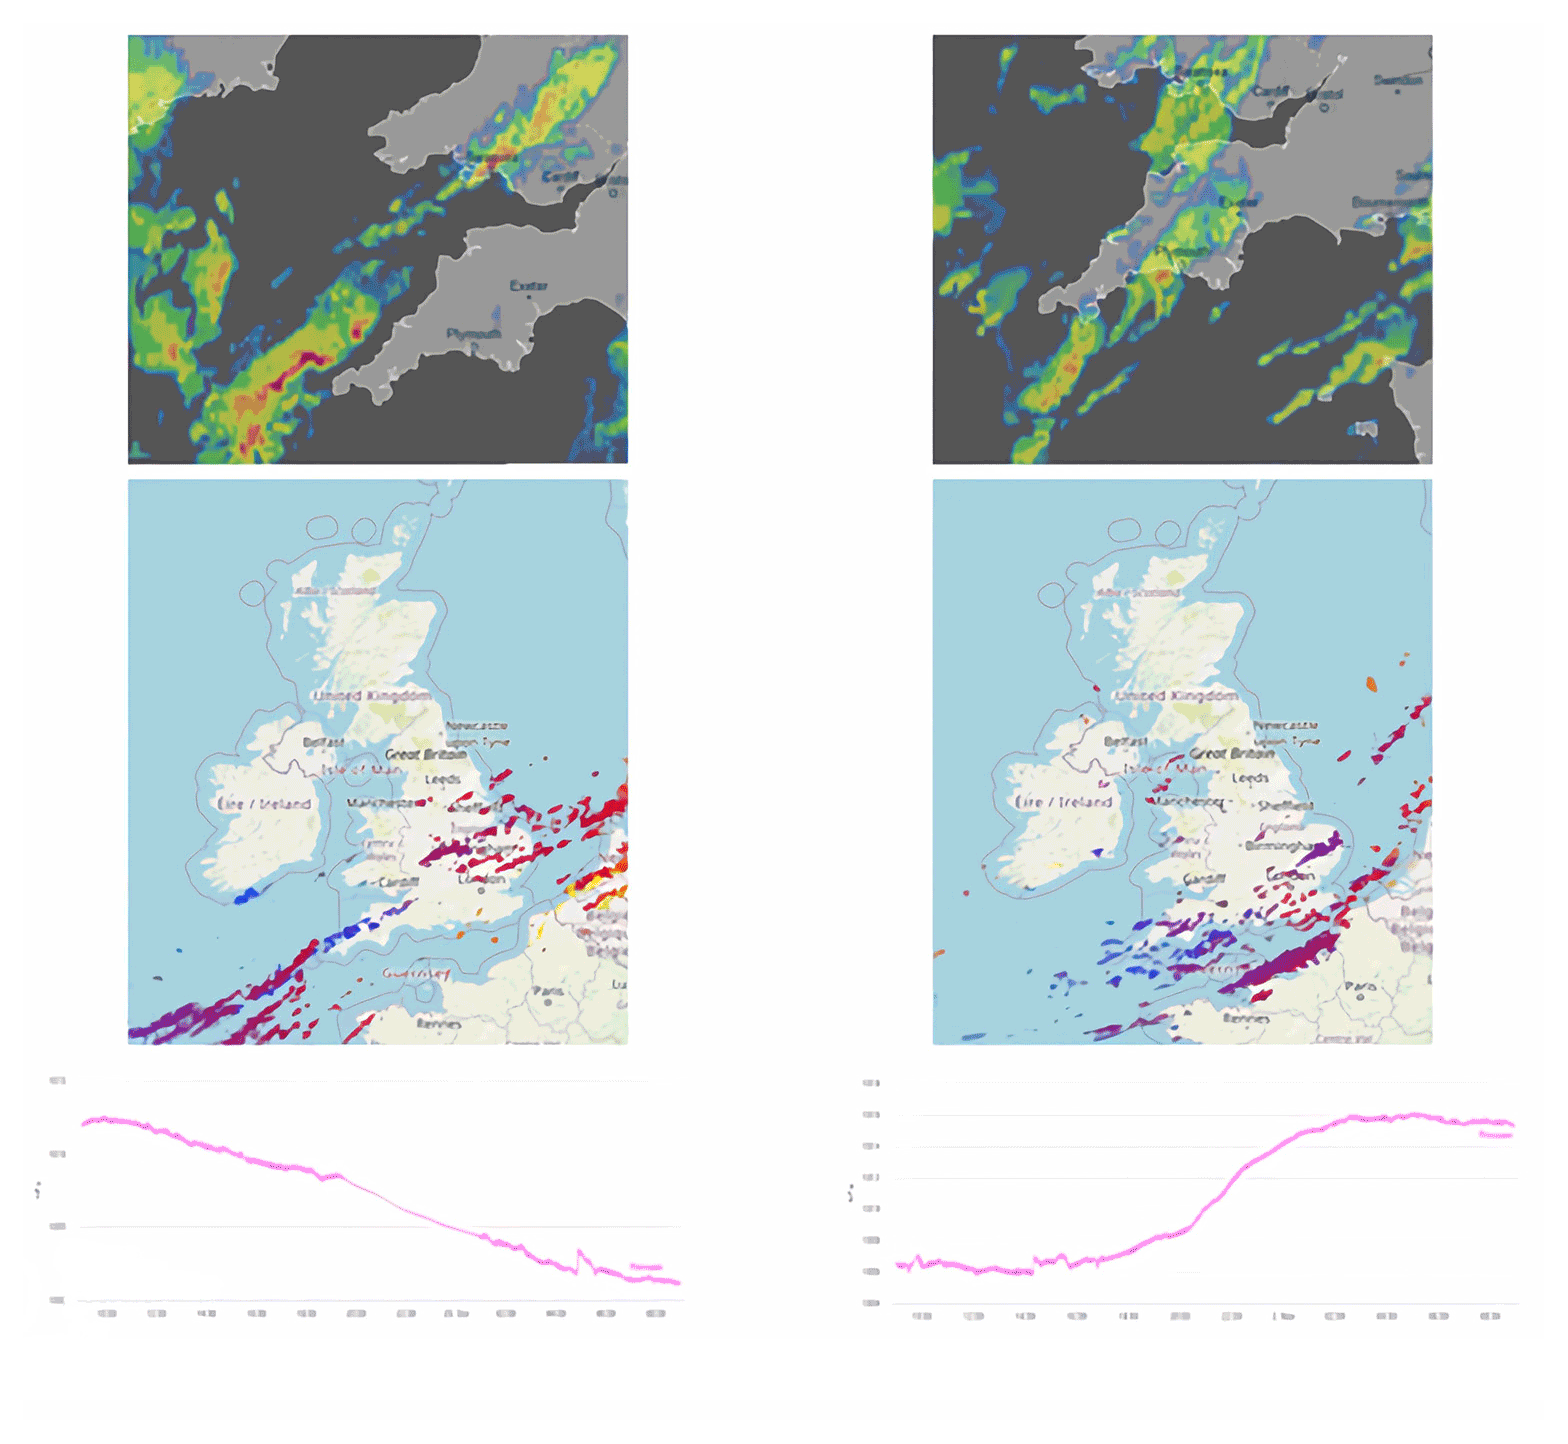
Figure 4The relationships between criteria of two winter meteotsunami events: the 20 October 2021 event on the left and 1 November 2022 event on the right, with the rain radar (top), lightning (middle) and air pressure (bottom). All images are open source. Rain radar: © Ventusky 2023 (https://www.ventusky.com/?p=54.4;-5.9;4&l=radar&t=20230313/1100&w=off, last access: 12 July 2023, Ventusky weather, 2023); lightning: lightningmaps.org (2023) CC BY-SA 4.0, lightning data by Blitzortung.org and contributors; air pressure: © D. J. Harris (2023) (http://starlingsroost.ddns.net/weather/ukobs/ukgraphs.php, last access: 12 July 2023).
The aim of this paper was to introduce a revised, enhanced and current UK catalogue of meteotsunami events, including the highlighting of the seasonal occurrence, frequency and spatial distribution of this hazard. This aim was set as there are no standardised identification criteria and no up-to-date single catalogue of UK meteotsunami. This scenario has led to the misconception that these events are non-hazardous, are rare and tend to occur more frequently in the summer months.
4.1 The updated UK meteotsunami catalogue
With the identification criteria we have laid out in this paper we have verified 98 events in UK waters since 1750, of which 38 are new events containing 7 new winter events in the historical record (1750 to 2009) and 8 new winter events in the modern record (2010 to 2022).
It was found that a selection of historical events were misidentified in accounts as abnormal coastal flooding, non-tsunami, storm surge or of unknown origin. This was extended by an analysis of current data (since 2010), which allowed us to add a total of 38 new events to the catalogue, of which 15 occurred within winter months; these are highlighted in Table 1 as new (N), new winter (NWI) or verified (V) events.
The misidentified events were discovered after an attempt to highlight characteristics that match those listed in the methodology, in particular characteristics that suggested a tsunami-like phenomenon but with any associated storm-like activity or air pressure fluctuations. If the account was found to contain a lack of evidence or information to suggest a meteotsunami, it was rejected. An event occurring on 13 February 1979 was highlighted as a meteotsunami by Haslett and Bryant (2009) but was contested by Thompson et al. (2020) as being a surge caused by a winter Atlantic storm due to its seasonal placement. In their 2020 paper, Thompson et al. (2020) appear not to class Atlantic storm systems as sources of meteotsunami. They state that, from April to October, thunderstorms generate meteotsunami and, from November to March, storms generate low-pressure swells and surges. Our paper has matched descriptions in historical accounts with the criteria laid out in the methodology, and we agree with Haslett and Bryant (2009) and Haslett et al. (2009) that the 1979 winter event was a meteotsunami. This result was determined by the similarities in the pressure profile, geographical distribution and speed of anomaly to the known meteotsunami event of 26 June 2011.
In addition to the 1979 event, there were further events found that were previously labelled as meteotsunami which, according to our criteria, we found to be of alternative origin (tsunami) or to have insufficient detail or collaborative evidence to solidify a conclusion. These include the events presented in Long (2021), dated 14 October 1862 (found to be a tsunami due to an alternative source trigger), 15 August 1895 (insufficient information) and 11 May 1912 (found to be a tidal bore), and another tidal bore dated 17 May 1964 presented in Haslett and Bryant (2009) and Haslett et al. (2009).
The event of 31 March 1761, which was labelled as a tsunami by both Long (2015) and Thompson et al. (2020), was found to be a winter meteotsunami due to tsunami-like waves being experienced not only along the southwest UK coast but also in Loch Ness in Scotland, with the mention of a calm sea before the arrival of thunderstorms.
4.2 Seasonal and geographical patterns of UK meteotsunami
The historical record (1750 to 2009) has been found to support previous studies such as Haslett and Bryant (2009) and Haslett et al. (2009) that have alluded to the positive correlation between thunderstorms and meteotsunami waves, with 71 % of summer events displaying reports of convective activity. Our results have highlighted a summer prevalence of events, with 48 % of them peaking in July and August, which reflects Thompson et al. (2020). This prevalence has been based principally on a reliance on eyewitness reports and the volume of persons present at the shoreline during these months.
These summer events tend to be associated with heat waves and so-called Spanish plumes as in the 27 June 2011 and the 18 June 2022 events along the southwest UK coast. This is where warm air moves northwards from the European continent and Iberia, during which mesoscale convective weather tends to occur. In the summer, CAPE is at its highest and over land due to warm 2 m air temperatures over landmasses (Holley et al., 2014). These types of weather event consist of single cells or clusters of small, short-duration (<1 h) thunderstorms and squall lines with more than one convective cell (Sibley, 2012; Tappin et al., 2013).
The element of risk during the summer occurs when the meteotsunami wave can become fully disconnected from its source disturbance. This effect can be particularly apparent if the meteotsunami interacts with the continental slope, where the wave can arrive hours after the original storm has dissipated or moved on. This delayed arrival of wave disturbances can surprise people who are subsequently back out on the water or near the water's edge, believing the storm has passed. This scenario was experienced during the 5 July 2021 event that occurred at Westward Ho! (north Devon), when just after midday BST a small yet powerful wave unexpectedly progressed 50 m up the beach, inundating many beachgoers.
Previous studies have suggested that winter wave anomalies such as meteotsunami are “less” likely than storm waves and surge, and winter data have not previously been interrogated for this reason. However, the present-day record (2010 to 2022) appears to contradict this, with a winter prevalence of 66 % of events peaking in December and January and with a tendency towards October and November in the 2021/22 winter season.
The results also show a geographical pattern to UK meteotsunami, with a large proportion of events occurring along the southwest UK and northwest Scotland coast in the winter, aligning with the dominant weather direction of west to east from the Atlantic Ocean, and along the southern UK coast in the summer, aligning with Spanish plumes bringing warm air polewards from the Equator with southerly winds up and along the English Channel. The geographical pattern also reflects the influence of local bathymetry, with harbours (e.g. Penzance, Plymouth, Stornoway and Port Talbot), bays (e.g. Kinlochbervie and Port Stoth) and river mouths (e.g. river Yealm and river Dart) containing conditions more favourable to meteotsunami initiation and amplification via resonance and seiching.
To further the concept presented in Williams et al. (2021), we selected two recent winter meteotsunami events and highlighted the meteotsunamigenic criteria. It has been indicated from the results that the combination of a mid-latitude depression with frontal and convective weather moving across the UK may be important in the generation of this hazard. Results have shown that, during these winter storms, convective elements are likely to be embedded around heavy rainfall (Fig. 4a and b) and strong winds associated with the cold front, leading to the potential for meteotsunami waves. This winter synoptic situation is a product of the combination of the cold maritime Arctic air being introduced into the rear side of the cold front passing over relatively warm water. The risk of flooding can be exacerbated due to surface water from precipitation as the front crosses a landmass (Masselink et al., 2015).
The results highlighted an average maximum wave height of 0.3 m, which may not seem “dangerous”, but this hazard is not purely about this single factor. The key that makes meteotsunami a potential hazard is the rapid onset of the wave (sometimes referred to as a “wall of water”) and the associated strong currents.
4.3 Constraints and limitations
Identifying meteotsunami events in winter tends to be more difficult as the waves can be hidden and overshadowed by the wave characteristics of the trigger storms and may be missed unless looking specifically at the data. We strongly consider this overshadowing to mean that many of these winter meteotsunami are not reported, and this may have been the issue in previous research where certain winter events were identified as either storm waves or surges instead of meteotsunami. As we have seen, there is a short observational record available for meteotsunami and there is evidence for severe under-recording of such events. Even though the 2010-to-2022 record has shown significant improvements in recording completeness, the current 15 min sampling interval is still too coarse. This was highlighted when certain events in the catalogue such as those on 2 October 2021, 20 October 2021, 27 November 2021 and 19 July 2022 were uncovered in the 1 min tide gauge data that were not so easy to locate in the 15 min data. This creates an issue whereby many events with a wave period of under 15 min may be potentially missed. We recommend a reduction of the sampling interval to 1 to 5 min to yield more data and to be able to draw a complete conclusion for this hazard.
Another limitation of this study linked to the sampling frequency was the treatment of wind-driven waves, which can induce infra-gravity waves of a similar wave period to meteotsunami (2 to 5 min). We did initially consider the wind and swell peak period and wave height; however, we discovered that the detection of infra-gravity waves from low-frequency tide gauge data is uncertain and was deemed to be beyond the scope of this study. To perform such an analysis and to be confident in our results, we would require 1 min per 2 Hz of data for a spectral analysis. However, it may be prudent to explore this aspect in future work.
We noted that historical accounts are not optimum for identifying and analysing meteotsunami due to their anecdotal nature, and as such the number of events represented here may be dramatically underestimated. Data before 2008 are not readily available and records are spatially sparse, which leads to incomplete data coverage and does not allow for a robust statistical analysis.
The placement of tide gauges used to provide data also affects results. The siting of UK tide gauges tends to be biased towards populated areas with harbours and river mouths for asset protection and is ideal for the capture of the resonant component of the meteotsunami wave. However, events in less populated areas may have been missed due to this placement. We suggest potential tide gauge locations (based on the occurrence rate of previous events) could include beach or estuary locations around Devon and Cornwall such as Mevagissey or Perranporth and the north of Scotland such as Dunnet or Port Stoth.
4.4 What does this mean for the future?
The next few decades are likely to see sea level rise push mean and extreme water levels upwards, which will subsequently increase the level of risk by bringing the height of the storm tide closer to the flood stage (Masselink et al., 2015). At many UK locations, flood defences are at the design threshold of current storm surge levels; they are not designed or built for a sudden, prolonged water flow as seen in meteotsunami (Lazarus et al., 2021). A question that has arisen from this paper is whether the winter seasons of 2013/14 and 2021/22 are outliers or whether this clustering of storms and meteotsunami will be a commonplace scenario in the future. Currently, we can detect and forecast mid-latitude depressions 9 to 10 d in advance (Penn State, 2019); knowing this, we can incorporate warnings of potential meteotsunami activity into forecasts. However, due to the localised nature of meteotsunami, the risk level in each coastal area needs to be considered on its own merits. The risks connected with a single meteotsunami event in two different bays can be quite different. One bay may suffer from inundation and flooding, whereas another bay may be impacted by strong currents. This paper provides a valuable insight into the frequency, seasonality and spatial distribution of what was a hidden hazard in the UK. These new data will need to be incorporated and taken into consideration when coastal management strategies and defences are adjusted for the future.
Meteotsunami may well have some role to play in coastal storm impacts; however, the relative contribution of meteotsunami to storm surge in the aftermath of a storm and the full extent of the risk remain unknown, and determining them is beyond the scope of this work. It is also difficult to determine if the frequency and intensity of either low-pressure winter storms or winter meteotsunami are on the increase. We invite a closer and more robust scrutiny of this hazard with a year-round perspective, bearing in mind that no solid conclusions can be drawn without high-frequency, long-term and continuous monitoring of this hazard.
Until recently it was thought that meteotsunami in the UK were rare and only occurred at certain times of the year; this misconception has led to a lack of provision in coastal management strategies and an underestimation of the frequency of this hazard. Motivated by coastal safety, this paper tests the hypothesis by presenting a new chronological catalogue dated from 1750 to 2022 containing 98 UK meteotsunami with highlighted seasonal and geographical aspects. Using a standardised set of identification criteria developed for this study, we have verified 60 previously listed events and presented 38 new events, of which 15 were found to occur in the winter (Table 1).
Results demonstrate that meteotsunami are not restricted to the summer months and are more common than initially thought. The modern record (2010 to 2022) is short and has far more winter meteotsunami, whereas the relatively long historical record (1750 to 2009) means that most meteotsunami in our total occurred in the summer, which confirms the results of Thompson et al. (2020) and Haslett and Bryant (2009). During the summer months (April to September inclusive), there is a trend towards the southern UK with a 71 % positive correlation between meteotsunami events and summer convective weather systems, which can occur within synoptic Spanish plume settings as suggested by Sibley (2012). During the winter months (October to March inclusive), our results demonstrate a clustering around the southwest UK and northwest Scotland with a positive correlation between meteotsunami and the passage of mid-latitude depressions where convective elements are embedded in the associated cold fronts and low-pressure troughs. Subsequently meteotsunami impacts can become hidden by being superimposed on top of the storm's impacts. The meteotsunami waves are further exacerbated by the localised nature of resonance characteristics, in particular harbours and bays, which can create highly dangerous situations. The immutable nature and rapid onset of this hazard mean that even a sole meteotsunami event can create changes in the water level and flow velocity that have the potential to cause injury, loss of life and damage to assets.
Increased knowledge of this hazard can be made more easily accessible through a central catalogue such as the one presented in this paper and through the provision of higher-frequency monitoring to detect future trends. What was thought to be a “hidden” and rare event in historical records may soon become a common hazard.
Data supporting this study is publically available from: Tidal data: British Oceanongraphic data Centre: https://www.bodc.ac.uk/data/ (National Oceanography Centre, 2023) National Tidal and Sea Level Facility: https://ntslf.org/data/uk-network-real-time (University of Liverpool, 2023) Sea level monitoring Facility: https://www.ioc-sealevelmonitoring.org/list.php (UNESCO, 2023). Weather data: Starlings roost: http://starlingsroost.ddns.net/weather/ukobs/ukgraphs.php (D.J. Harris, 2023). Lightning maps: https://www.lightningmaps.org/#m=oss;t=2;s=0;o=0;b=;y=50.7086;x=-1.0547;z=4;ts=0 (lightningmaps.org, 2023). Rainfall data: https://catalogue.ceda.ac.uk/uuid/f91b2c5399c5bf689e29bb15ab45da8a (CEDA Archive, 2018). Ventusky: https://www.ventusky.com/?p=54.4;-5.9;4&l=radar&t=20230313/1100&w=off (Vetusky, 2023) CAPE. University of Wyoming: http://weather.uwyo.edu/upperair/sounding.html (University of Wyoming, 2022).
The supplement related to this article is available online at: https://doi.org/10.5194/nhess-23-2531-2023-supplement.
CL designed and executed the study and prepared the original draft. DW pre-processed and provided data from 2010 to 2017 and reviewed and edited the text. TS, JN and HC supervised the project, provided advice, and edited and provided feedback on the manuscript.
The contact author has declared that none of the authors has any competing interests.
We would like to thank the two anonymous reviewers for their contribution to the improve ment of the paper.
Publisher’s note: Copernicus Publications remains neutral with regard to jurisdictional claims in published maps and institutional affiliations.
This paper was edited by Rachid Omira and reviewed by two anonymous referees.
Bechle, A. J., Wu, C. H., Kristovich, D. A. R., Anderson, E. J., Schwab, D. J., and Rabinovich, A. B.: Meteotsunamis in the Laurentian Great Lakes, Sci. Rep.-UK, 6, 37832, https://doi.org/10.1038/srep37832, 2016.
Borlase, W.: The natural history of Cornwall, Oxford, 53–54, https://archive.org/details/naturalhistoryc00borl (last acces: 12 July 2023), 1758.
British Oceanographic Data Centre: https://www.bodc.ac.uk/, last access: 19 February 2022.
Burt, S.: Multiple airwaves crossing Britain and Ireland following the eruption of Hunga Tongaa.fiHunga Ha'apai on 15 January 2022. Volcanic airwaves crossing Britain and Ireland, January 2022, Weather, 77, 76–81, https://doi.org/10.1002/wea.4182, 2022.
CEDA Archive: 5 km Resolution UK Composite Rainfall Data from the Met Office Nimrod System, Dataset [data set], https://catalogue.ceda.ac.uk/uuid/f91b2c5399c5bf689e29bb15ab45da8a (last access: 13 July 2023), 2018.
D.J. Harris: Starlings Roost Weather, July 12th 2023 0400Z to July 13th 2023 0400Z, http://starlingsroost.ddns.net/weather/ukobs/ukgraphs.php (last access: 12 July 2023), 2018.
Dawson, A. G., Musson, R. M. W., Foster, I. D. L., and Brunsden, D.: Abnormal historic sea-surface fluctuations, SW England, Mar. Geol., 170, 59–68, https://doi.org/10.1016/S0025-3227(00)00065-7, 2020.
Dusek, G., DiVeglio, C., Licate, L., Heilman, L., Kirk, K., Paternostro, C., and Miller, A.: A meteotsunami climatology along the U.S. East Coast, B. Am. Meteorol. Soc., 100, 1329–1345, https://doi.org/10.1175/BAMS-D-18-0206.1, 2019.
Edmonds, R.: On extraordinary agitations of the sea not produced by winds or tides, Transactions of the Devonshire Association, 3, 144–152, https://devonassoc.org.uk/publications/transactions/contents/ (last access: 8 July 2023), 1869.
Goring, D.: Meteotsunami resulting from the propagation of synoptic-scale weather systems, Phys. Chem. Earth, Parts A/B/C, 34, 1009–1015, https://doi.org/10.1016/j.pce.2009.10.004, 2009.
Haigh, I., Wadey, M., Wahl, T.: Spatial and temporal analysis of extreme sea level and storm surge events around the coastline of the UK, Scientific Data, 3, 160107, https://doi.org/10.1038/sdata.2016.107, 2016.
Haslett, S. K. and Bryant, E. A.: Historic tsunami in Britain since AD 1000: a review, Nat. Hazards Earth Syst. Sci., 8, 587–601, https://doi.org/10.5194/nhess-8-587-2008, 2008.
Haslett, S. K. and Bryant, E. A.: Meteorological Tsunamis in Southern Britain: An Historical Review, Geogr. Rev., 99, 146–163, https://doi.org/10.1111/j.1931-0846.2009.tb00424.x, 2009.
Haslett, S. K., Mellor, H. E., and Bryant, E. A.: Meteo-tsunami hazard associated with summer thunderstorms in the United Kingdom, Phys. Chem. Earth, Parts A/B/C, 34, 1016–1022, https://doi.org/10.1016/j.pce.2009.10.005 2009.
Holley, D. M., Dorling, S. R., Steele, C. J., and Earl, N.: A climatology of convective available potential energy in Great Britain, Int. J. Climatol., 34, 3811–3824, https://doi.org/10.1002/joc.3976, 2014.
Kim, M.-S., Woo, S.-B., Eom, H., and You, S. H.: Occurrence of pressure-forced meteotsunami events in the eastern Yellow Sea during 2010–2019, Nat. Hazards Earth Syst. Sci., 21, 3323–3337, https://doi.org/10.5194/nhess-21-3323-2021 2021.
Lazarus, E., Aldabet, S., Thompson, C., Hill, C., Nicholls, R., French, J., Brown, S., Tompkins, E., Haigh, I., Townend, I., and Penning-Rowsell, E.: The UK needs an open data portal dedicated to coastal flood and erosion hazard risk and resilience, Anthropocene Coasts, 4, 137–146, https://doi.org/10.1139/anc-2020-0023, 2021.
lightningmaps.org: Lightning maps [data set], https://www.lightningmaps.org/#m=oss;t=2;s=0;o=0;b=;y=50.7086;x=-1.0547;z=4, last access: 1 March 2023.
Linares, Á., Wu, C. H., Bechle, A. J, Anderson, E. J., and Kristovich, D. A. R.: Unexpected rip currents induced by a meteotsunami, Sci. Rep.-UK, 9, 2105, https://doi.org/10.1038/s41598-019-38716-2, 2019.
Long, D.: A catalogue of tsunamis reported in the UK, British Geological Association, Internal Report IR/15/043, 63 pp., https://nora.nerc.ac.uk/id/eprint/513298/1/IR_15_043 BGS Tsunami catalogue update.pdf (last access: 8 July 2023), 2015.
Long, D.: Comment on: Thompson et al 2020. UK meteotsunamis: a revision and update on events and their frequency, Weather, 76, 137–139, https://doi.org/10.1002/wea.3934, 2021.
Lynett, P. J., Borrero, J., Son, S., Wilson, R., and Miller, K.: Assessment of the tsunami induced current hazard, Geophys. Res. Lett., 41, 2048–2055, https://doi.org/10.1002/2013GL058680, 2014.
Masselink, G., Scott, T., Poate, T., Russell, P., Davidson, M., and Conley, D.: The extreme 2013/2014 winter storms: hydrodynamic forcing and coastal response along the southwest coast of England, Earth Surf. Proc. Land., 41, 378–391, https://doi.org/10.1002/esp.3836, 2015.
MET Office: 5 km Resolution UK Composite Rainfall Data from the Met Office Nimrod System, NCAS British Atmospheric Data Centre [data set], https://catalogue.ceda.ac.uk/uuid/f91b2c5399c5bf689e29bb15ab45da8a (last access: 8 July 2023), 2003.
Monserrat, S., Vilibić, I., and Rabinovich, A. B.: Meteotsunamis: atmospherically induced destructive ocean waves in the tsunami frequency band, Nat. Hazards Earth Syst. Sci., 6, 1035–1051, https://doi.org/10.5194/nhess-6-1035-2006, 2006.
National Oceanography Centre: Search the data, British Oceanongraphic data Centre [data set], https://www.bodc.ac.uk/data/, 2023.
National Tidal and Sea Level Facility (NTSLF): https://ntslf.org/, last access: 19 February 2022.
Pattiaratchi, C. B. and Wijeratne, E. M. S.: Are meteotsunamis an underrated hazard? Philosophical Transactions of the Royal Society: Mathematical and Engineering Sciences 373, 20140377, https://doi.org/10.1098/rsta.2014.0377, 2015.
Pellikka, H., Laurila, T. K., Boman, H., Karjalainen, A., Björkqvist, J.-V., and Kahma, K. K.: Meteotsunami occurrence in the Gulf of Finland over the past century, Nat. Hazards Earth Syst. Sci., 20, 2535–2546, https://doi.org/10.5194/nhess-20-2535-2020 2020.
Penn State: Predictability limit: Scientists find bounds of weather forecasting, ScienceDaily, https://sciencedaily.com/releases/2019/04/190415154722.htm (last access: 20 August 2022), 2019.
Phenomena.org.uk: A Chronology of Remarkable Natural Phenomena Eighteenth Century 1761–1770 [data set], http://www.phenomena.org.uk/page29/page38/page38.html (last access: 12 July 2023), 2023.
Proudman, F. R. S.: The Effects on the Sea of Changes in Atmospheric Pressure, Geophysical Supplements to the Monthly Notices of the Royal Astronomical Society, 2, 197–209, https://doi.org/10.1111/j.1365-246X.1929.tb05408.x 1929.
Reigate Grammar School Weather Station: The birth and impact of the St Jude day storm: October 2013, https://rgsweather.wordpress.com/2013/10/29/st-jude-causes-and-impacts-of-the-october-storm-27-28-2013/, last access: 19 February 2022.
Sea Level Monitoring Facility: https://ioc-sealevelmonitoring.org/, last access: 1 March 2023.
Šepić, J., Vilibić, I., and Strelec Mahović, N.: Northern Adriatic meteorological tsunamis: observations, link to the atmosphere, and predictability, J. Geophys. Res., 117, C02002, https://doi.org/10.1029/2011JC007608, 2012.
Šepić, J., Vilibić, I., Rabinovich, A., and Monserrat, S.: Widespread tsunami-like waves of 23–27 June in the Mediterranean and Black Seas generated by high-altitude atmospheric forcing, Sci. Rep.-UK, 5, 11682, https://doi.org/10.1038/srep11682, 2015.
Šepić, J., Vilibić, I., Rabinovich, A., and Tinti, S.: Meteotsunami (“Marrobbio”) of 25–26 June 2014 on the Southwestern Coast of Sicily, Italy, Pure Appl. Geophys., 175, 1573–1593, https://doi.org/10.1007/s00024-018-1827-8, 2018.
Sibley, A.: Thunderstorms from a Spanish Plume event on 28 June 2011, Weather, 67, 143–152, https://doi.org/10.1002/wea.1928, 2012.
Sibley, A., Cox, D., Long, D., Tappin, D. R., and Horsburgh, K. J.: Meteorologically generated tsunami-like waves in the North Sea on 1/2 July 2015 and 28 May 2008, Weather, 71, 68–74, https://doi.org/10.1002/wea.2696, 2016.
Starlings roost weather: http://starlingsroost.ddns.net/weather/stats.php?type=day&field=&date=2023-03-05, last access: 1 March 2023.
Stevenson, C. M.: The dust fall and severe storms of 1 July 1968, Weather, 66, 125–127, https://doi.org/10.1002/wea.780, 2011.
surgewatch.org: Surge Watch database: A database of UK coastal flood events, SurgeWatch [data set], https://www.surgewatch.org/, last access: 19 February 2022.
Tappin, D. R., Sibley, A., Horsburgh, K. J., Daubord, C., Cox, D., and Long, D.: The English Channel `tsunami' of 27 June 2011 – a probable meteorological source, Weather, 68, 144–152, https://doi.org/10.1002/wea.2061, 2013.
Thompson, J., Renzi, E., Sibley, A., and Tappin, D.: UK meteotsunamis: a revision and update on events and their frequency, Weather, 75, 281–287, https://doi.org/10.1002/wea.3741, 2020.
UNESCO: Sea level monitoring Facility, Status at 2023-07-13 05:45 GMT: 1188 stations listed ordered by code [data set], https://www.ioc-sealevelmonitoring.org/list.php (last access: last access: 12 July 2023), 2023.
University of Liverpool: National Tidal and Sea Level Facility, Real-time data – UK National Tide Gauge Network [data set], https://ntslf.org/data/uk-network-real-time (last access: last access: 12 July 2023), 2023.
University of Wyoming: [data set], http://weather.uwyo.edu/upperair/sounding.html, last access: 19 February 2022.
Ventusky: Ventusky weather [data set], https://www.ventusky.com/?p=54.4;-5.9;4&l=radar&t=20230313/1100&w=off, last access: 1 March 2023.
Vilibić, I. and Šepić, J.: Global mapping of non-seismic sea level oscillations at tsunami timescales, Scientific Rep.-UK, 7, 40818, https://doi.org/10.1038/srep40818, 2017.
Vilibić, I., Šepić, J., Dunić, N., Sevault, F., Monserrat, S., and Jordà, G.: Proxy-based assessment of strength and frequency of meteotsunamis in future climate, Geophys. Res. Lett., 45, 10501–10508, https://doi.org/10.1029/2018GL079566, 2018.
Williams, D. A., Horsburgh, K. J., Schultz, D. M., and Hughes, C. W.: Examination of generation mechanisms for an English Channel Meteotsunami: Combining observations and modelling, J. Phys. Oceanogr., 49, 103–120, https://doi.org/10.1175/JPO-D-18-0161.1, 2019.
Williams, D. A., Schultz, D. M., Horsburgh, K. J., and Hughes, C. W.: An 8-yr meteotsunami climatology across northwest Europe: 2010–2017, J. Phys. Oceanogr., 1145–1160, https://doi.org/10.1175/JPO-D-20-0175.1, 2021.
hotspotregions that experience these events.