the Creative Commons Attribution 4.0 License.
the Creative Commons Attribution 4.0 License.
 | 26 Jun 2023
The potential of open-access data for flood estimations: uncovering inundation hotspots in Ho Chi Minh City, Vietnam, through a normalized flood severity index
Leon Scheiber
Mazen Hoballah Jalloul
Christian Jordan
Jan Visscher
Hong Quan Nguyen
Torsten Schlurmann
Hydro-numerical models are increasingly important to determine the adequacy and evaluate the effectiveness of potential flood protection measures. However, a significant obstacle in setting up hydro-numerical and associated flood damage models is the tedious and oftentimes prohibitively costly process of acquiring reliable input data, which particularly applies to coastal megacities in developing countries and emerging economies. To help alleviate this problem, this paper explores the usability and reliability of flood models built on open-access data in regions where highly resolved (geo)data are either unavailable or difficult to access yet where knowledge about elements at risk is crucial for mitigation planning. The example of Ho Chi Minh City, Vietnam, is taken to describe a comprehensive but generic methodology for obtaining, processing and applying the required open-access data. The overarching goal of this study is to produce preliminary flood hazard maps that provide first insights into potential flooding hotspots demanding closer attention in subsequent, more detailed risk analyses. As a key novelty, a normalized flood severity index (INFS), which combines flood depth and duration, is proposed to deliver key information in a preliminary flood hazard assessment. This index serves as an indicator that further narrows down the focus to areas where flood hazard is significant. Our approach is validated by a comparison with more than 300 flood samples locally observed during three heavy-rain events in 2010 and 2012 which correspond to INFS-based inundation hotspots in over 73 % of all cases. These findings corroborate the high potential of open-access data in hydro-numerical modeling and the robustness of the newly introduced flood severity index, which may significantly enhance the interpretation and trustworthiness of risk assessments in the future. The proposed approach and developed indicators are generic and may be replicated and adopted in other coastal megacities around the globe.
- Article
(8248 KB) - Full-text XML
- Companion paper
-
Supplement
(11947 KB) - BibTeX
- EndNote


With more than half a million deaths between 1980 and 2009 and nearly 3 billion people affected, flood events are doubtlessly the most common and impactful natural disasters worldwide (Hong et al., 2018; Hallegatte et al., 2013; Doocy et al., 2013). Climate change is expected to significantly amplify the probability of extreme flood events over the next decades, especially in Southeast Asia, where the number of coastal cities is disproportionately high (Hanson et al., 2011). This trend is especially worrisome since half of the people living in cities with at least 100 000 inhabitants are not farther than 100 km from the coast (Barragán and Andrés, 2015). Some of these cities are also subjected to uncontrolled urban sprawl (Phung, 2016; Kontgis et al., 2014; Huong and Pathirana, 2013; Storch, 2011), which exacerbates the risk of disaster-induced damages and losses due to the combination of increased exposure and vulnerability (IPCC, 2022). To respond to this problem, local decision-makers require a sound understanding of the complex interplay of underlying natural processes and oftentimes hidden socio-economic drivers that dictate the feasibility and effectiveness of possible adaptation strategies (Beven, 2011; Thorne et al., 2015). This knowledge can be advanced through the application of hydro-numerical models, which are increasingly becoming the preferred option for inundation mapping (Dasallas et al., 2022). These, in turn, rely on information about prevailing environmental constraints, such as the topography and hydro-meteorological conditions (Quan et al., 2020; Nkwunonwo et al., 2020; Kim et al., 2019; Ozdemir et al., 2013).
With respect to Southeast Asia, many national institutions still refrain from making this crucial input data available for various (technical or political) reasons (Kim et al., 2018; Hamel and Tan, 2021; Liu et al., 2020), which complicates numerical studies, especially for independent parties. Not only is the acquisition of these data sets prohibitively costly, but they also often lack the required spatial and temporal coverage needed for proper derivation of boundary conditions and model setup. Furthermore, it is often the case that such data are badly described and lack the necessary metadata. However, relevant information is increasingly published, either in connection with scientific articles or in freely accessible repositories (Di Baldassarre and Uhlenbrook, 2012; René et al., 2014). An increasing number of online media articles, open climate models and code repositories further add to this trend. Accordingly, several studies have recently discussed the possibility and implications of deriving modeling inputs from open-access data sources. This includes local hydrological and meteorological boundary conditions, such as rainfall intensities (Zhao et al., 2021) and sea level rise scenarios (Brown et al., 2016), as well as topographic elevation models (Schellekens et al., 2014; Sanders, 2007). In addition, the expansion of social media applications continuously improves the potential to validate the results of urban flood models (Wang et al., 2018; Feng et al., 2020). Increasing efforts are being made to build models based in part on open-access data in regions where data are scarce (Mehta et al., 2022; Trinh and Molkenthin, 2021; Pandya et al., 2021; Ekeu-wei and Blackburn, 2020), including models capable of mapping urban inundation during or shortly after an extreme event by leveraging data generated from social media (Guan et al., 2023). However, all aforementioned attempts still relied partially on locally sourced, non-open-access data. In fact, to date, no study is known to utilize an urban surface runoff model which is exclusively built on freely available data, although this would be a worthwhile target to illustrate the necessity as well as the benefits of comprehensive data accessibility. Even though such open-access data cannot always be the basis for flood maps that can be considered truth (especially when validation data are lacking), their potential usefulness should not be overlooked. Especially when the overarching goal is to improve system understanding (i.e., knowledge about the causalities between drivers and resulting impacts), generating flood estimation maps can open up opportunities to gain insights for subsequent decision-making processes regarding more detailed modeling for critical areas. Furthermore, no efforts are known for developing a simple flood severity index that combines flood depth and duration, both of which have a significant impact (Rättich et al., 2020). Such an index could deliver a more complete picture of the potential damages of flooding, even in the absence of extensive data necessary for a sophisticated damage model.
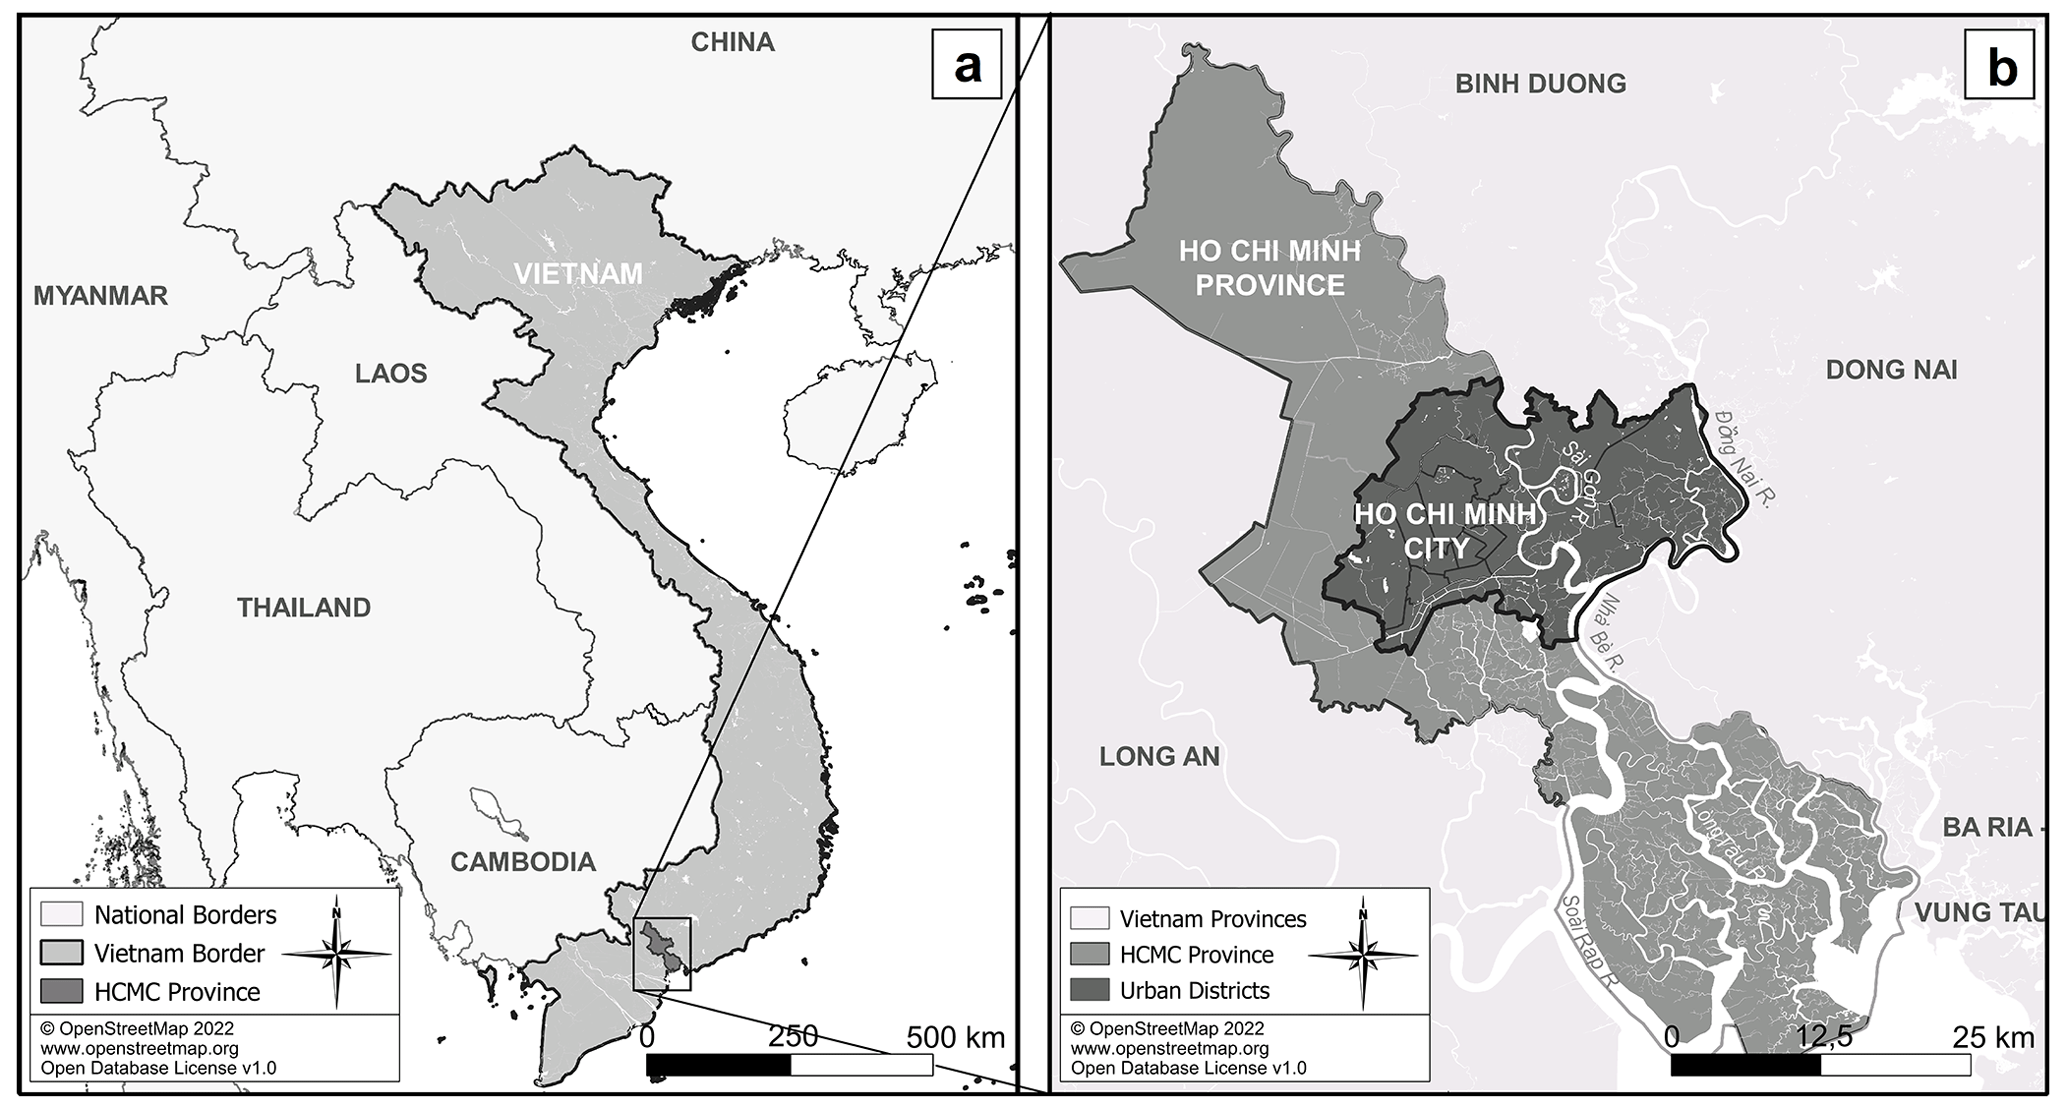
Figure 1Study area. (a) Location of the province of Ho Chi Minh City (HCMC) in southern Vietnam. (b) Location of the urban districts of HCMC (dark grey) in the greater province of HCMC (light grey). The flood model developed in this study covers the complete urban area, and, for this purpose, its domain comprises all local catchments contributing to the hydrology of this region (cf. Fig. 3).
Studying the metropolitan area of Ho Chi Minh City (HCMC, Fig. 1), Vietnam, a city that epitomizes the complex interplay of disaster risk components in an environment where accessibility to official data or capacities are limited (Kreibich et al., 2022), this paper explores if and by what means an urban flood model can be developed without acquiring any exclusive (geo)spatial or hydro-meteorological data. With the overarching goal of providing a methodology for researchers to build low-cost, low-effort and fully transparent hydro-numerical models for any part of the globe where either data are scarce or capacities and competence are limited, this paper investigates the usability and reliability of hydro-numerical models that are built exclusively on open-access data. The paper focuses on the methodological steps required to derive boundary conditions from cross-referencing several freely accessible and reliable sources. These include open-access satellite imagery, governmental and scientific databases, and data and information from open-access journal articles. Such low-cost, low-effort models are ideal for preliminary food hazard assessment in any flood risk analysis, especially in rapidly developing urban agglomerations where data are scarce and modeling expertise may be limited. Secondly, the paper introduces a new perspective on flood intensity by proposing a normalized index which integrates simulated flood depth and duration to paint a more complete picture of flood hazard while facilitating an estimation of damage potential, especially for cities located in low-elevation coastal zones (LECZs) where flow velocity due to pluvial flooding plays a secondary role. Both approaches are finally validated by contrasting the individual model components and resulting inundation hotspots with data from local partners. It, therefore, justifies the developed concept, accounts for the feasibility of the primary objective, and legitimates the call for open-access data and open science (Miedema, 2022) in the field of urban flood modeling at a worldwide scale. The presented methodology can be seen as an orientation for city planners and authorities from data-scarce regions, helping them to readily estimate where inundation hotspots with particularly high damage potential are located in a first flood hazard assessment. It allows them to focus, subsequently, on building more detailed damage models for the most heavily exposed city districts. Such detailed damage models usually require more extensive and expensive data collection (e.g., detailed topography, detailed time series for certain flood events, drainage networks, flood protection systems, land use, socio-economic vulnerability) and are indispensable for quantifying risk as a function of hazard, exposure and vulnerability. The methodology proposed in the following is especially beneficial in those situations where such highly resolved data are (still) missing, inaccessible or require significant resources.
There are generally two essential inputs that a hydro-numerical model needs to produce reliable results. These are elevation data including the hydraulic roughness as well as the model domain based on topographic boundaries (Fig. 2a) and, secondly, hydro-meteorological data, such as tidal water levels, river discharge and precipitation data depending on the investigated environment (Fig. 2b). The ensuing simulation results can be interpreted using model outputs like flood depth and duration, which can be combined into flood severity (Fig. 2c) as will be explained within this work. The acquisition, processing and implementation of the input as well as the processing of the output data require further methodological steps, which will be discussed in the following subsections. Regarding data acquisition, special attention needs to be given to the source, since it dictates the reliability and completeness of the data. Generally, the search priority of terrain data, as well as hydro-meteorological data, follows the same path: official sources at the top, followed by global repositories, peer-reviewed literature, grey literature (i.e., publicly available reports and assessments), and finally regional and global models. This workflow will be demonstrated in the following sections using the example of the HEC-RAS (Hydrologic Engineering Center River Analysis System) 2D model – a capable and freely available program by the U.S. Army Corps of Engineers (USACE) based on the 2D shallow-water equations – built for the metropolitan region of HCMC.
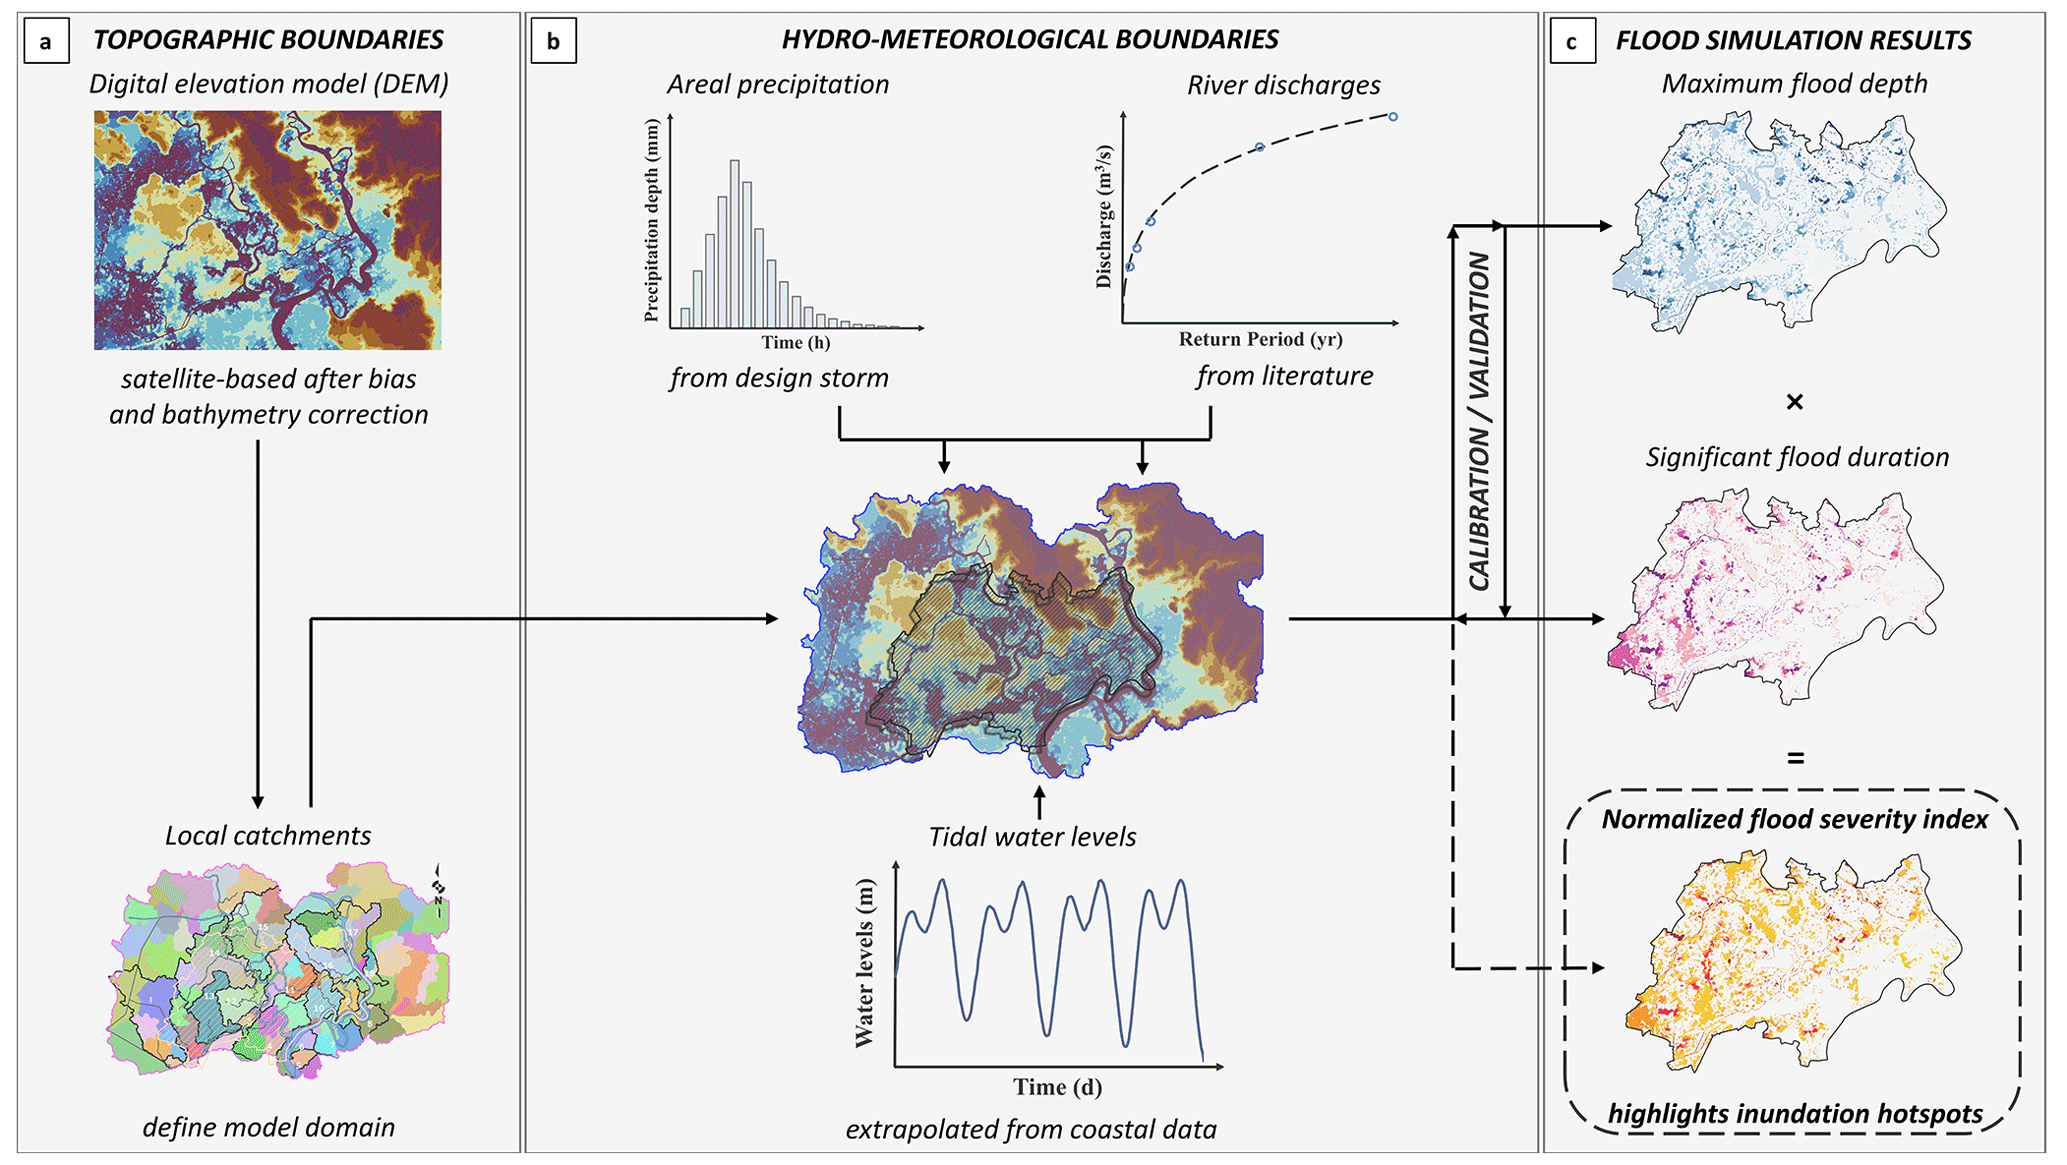
Figure 2Workflow. (a) The first panel shows the topographic data from which the local catchments can be determined that define the final model domain. (b) In the second step, hydro-meteorological time series are defined, which serve as boundary conditions for the numerical model. (c) Thirdly, simulation results are presented for the HCMC urban districts (hatched area in b) in terms of maximum flood depth, significant flood duration and the integrated form of a normalized flood severity index (INFS) that is to be defined within this work. Topographic data visualized using scientific color maps created by Crameri (2021). All other maps use colors for illustration purposes only.
2.1 Surface elevation data
2.1.1 Topographic data
For most parts of the world, accurate and reliable data on local topography are hard to acquire without significant financial efforts. Data from high-resolution light detection and ranging (lidar) are freely available only for the coastal USA, coastal Australia and parts of Europe but not for the majority of developing countries or emerging economies like Vietnam (Meesuk et al., 2015). This is particularly problematic when setting up urban surface runoff models, which heavily depend on terrain elevation. For the rest of the world, the only alternative to self-conducted measurements or unvalidated commercial digital elevation models (DEMs) (Planet Observer, 2017; Takaku and Tadono, 2017; Intermap, 2018), both of which are prohibitively costly (Hawker et al., 2018), is using open-access satellite-based DEMs. An example of such open-access DEMs is the highly popular Shuttle Radar Topography Mission (SRTM) (Hu et al., 2017; Sampson et al., 2016; Jarihani et al., 2015; Rexer and Hirt, 2014), which was acquired in 2000 and covers around 99.7 % of the global populated areas (Bright et al., 2011). However, these models have substantial vertical errors and relatively coarse resolutions. Accordingly, they cannot reflect micro-topographic features or infrastructure developments in relatively flat terrain (Gallien et al., 2011; Chu and Lindenschmidt, 2017). This is particularly evident for urban settings with a significant positive bias created by the backscatter of buildings and vegetation (Becek, 2014; Shortridge and Messina, 2011; Tighe and Chamberlain, 2009; LaLonde et al., 2010), making them unsuitable to resolve terrain features that actually control flood extents and dynamics (Schumann et al., 2014). In fact, the mean error in SRTM can reach up to 3.7 m when compared to lidar (Kulp and Strauss, 2019), significantly distorting simulated flood extents for coastal areas under considerable tidal influences. Furthermore, considerable problems may arise due to differences in geodetic referencing for various DEMs, which can lead to false absolute surface elevations (Minderhoud et al., 2019). An attempt to rectify these errors was undertaken by Kulp and Strauss (2018), who developed the novel CoastalDEM by using a neural network to perform a nonlinear, non-parametric regression analysis of SRTM errors, suggesting better performance and adequacy in urban environments. Another attempt at correcting a satellite-based DEM was done by Hawker et al. (2022), who created FABDEM (Forest And Buildings removed Copernicus DEM) by removing forests and buildings from Copernicus DEM (2019) through the use of machine learning. Although CoastalDEM and FABDEM have the ability to provide better elevation accuracy in urban settings, its plausibility still needs to be checked for each individual study area. This can be done through the inspection of terrain elevation at key locations, which can be either structures (canal banks, dikes, flood protection structures) or locations where flooding is frequently reported (hotspots), all the while taking the elevation data of other satellite DEMs like those of ALOS (2016; ALOS denotes Advanced Land Observing Satellite), ASTER (Advanced Spaceborne Thermal Emission and Reflection Radiometer), SRTM and Copernicus into account. Another issue with the freely available version of CoastalDEM is its resolution of 3 arcsec, whereas other open-access satellite-based DEMs are available in a 1 arcsec resolution. A list of available DEM data sets, their resolution and providing agencies is given in Table S1 of the Supplement to this article. To utilize an open-access satellite-based DEM in reliable flood simulations, several processing steps are necessary, which, for the case of HCMC, are summarized in Fig. S2. One solution to circumvent the limitation of vertical errors can be a height correction of SRTM based on CoastalDEM. To that end, an offset map representing the difference between SRTM and CoastalDEM is created and downscaled using a surface spline interpolation. This offset map is then added to SRTM, which results in a height-corrected, higher-resolution elevation model. Depending on the use case, the resulting elevation model can be further processed through the use of a 2D median filter to smooth out the surface and reduce noise (Ansari and Buddhiraju, 2018). Furthermore, filling algorithms can be used to counteract artifactual sinks and holes with no physical meaning that typically arise in remote sensing. These sinks and holes can be closed by a variety of methods. A comprehensive list of filling algorithms can be found in the works of Lindsay (2016). It is recommended to only use these after incorporating bathymetric data (Sect. 2.1.2) into the DEM to guarantee proper water routing (i.e., from higher-lying to lower-lying cells).
In the case of HCMC, the adequacy of these five elevation models was assessed by considering their terrain elevation at the inner-city canal banks that are well-known inundation hotspots. Only CoastalDEM delivered a plausible average terrain elevation of 0 m above mean sea level (a.m.s.l.) at this location, while all others returned average terrain elevations of +6 m and higher. As this level is far above storm surge peak water heights (FIM, 2013), the comparison suggests the best accuracy for CoastalDEM. An adequate representation of the canal bank elevations is especially important for flood modeling, since riparian areas are highly exposed to flooding through storm surges and because such events cause significant backwater effects that have a crucial impact on water drainage.
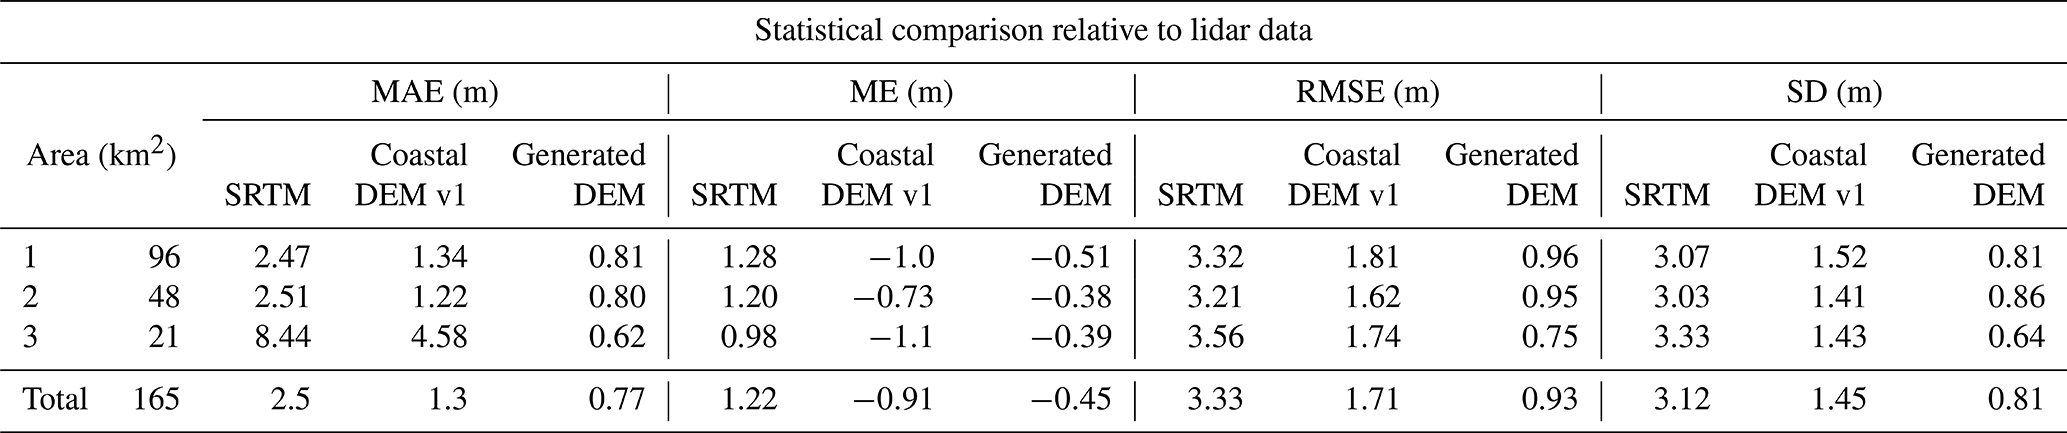
To evaluate the accuracy of the end result, a statistical comparison using the mean absolute error (MAE), the mean error (ME), the root mean square error (RMSE) and the standard deviation (SD) was made between SRTM, CoastalDEM v1 and the generated DEM, on the one hand, and lidar data from 2020 at three locations across HCMC on the other (Table 1). These locations, their extents and their corresponding lidar characteristics can be found in Sect. S3 to this article. The generated DEM shows a reduced error when compared to SRTM and CoastalDEM v1 vs. the lidar data set across all three areas. Specifically, the positive bias of SRTM is eliminated, all the while halving the negative bias of CoastalDEM v1 across all presented metrics. Although the ME of the generated DEM was calculated to be −0.45 m, it still offers a substantial improvement not only over SRTM (mean error of 1.22 m) and CoastalDEM v1 (mean error of −0.91 m) but also over all other DEMs presented in Table 1. The same applies for the absolute mean error, the RMSE and the SD of the error. A detailed comparison of all DEMs in Table 1 is provided in Sect. S4.
Table 1A statistical comparison of SRTM, CoastalDEM v1 and the generated DEM with lidar data across three areas in HCMC. A statistical comparison of SRTM, CoastalDEM v1 and the generated DEM with lidar data across three areas in HCMC. Elevation differences are expressed in terms of the mean absolute error (MAE), mean error (ME), root mean square error (RMSE) and standard deviation (SD), respectively.
2.1.2 Bathymetric data
An intrinsic drawback of satellite-based DEMs is the inability of the synthetic-aperture sensor (SAR) to determine the geometry of river beds (Farr et al., 2007). Additionally, the generated pixels include surrounding regions, resulting in greatly overestimated channel depths (Yan et al., 2015b). Therefore, bathymetric data from other sources have to be incorporated into any satellite-based DEM. The availability of reliable open-access bathymetric data, with a resolution sufficient for use in flood modeling, greatly differs between countries and is generally more difficult to acquire. In fact, the availability of such data is restricted even in many developed countries (Moramarco et al., 2019), oftentimes requiring expensive surveys that are limited to the local scale (Guan et al., 2023). To circumvent this problem, more extensive research for bathymetric data into peer-reviewed articles as well as engineering reports (grey literature) is recommended. Where such literature does not exist, river width and depth can be either approximated (Patro et al., 2009; Neal et al., 2012; Yan et al., 2015a), obtained from calculated global river width and depth databases (Yamazaki et al., 2014; Andreadis et al., 2013), or surveyed in waterways with unknown navigational depths.
In the example of HCMC, the hydrological situation is defined by two major streams (cf. Fig. S5), namely the Dong Nai River, which passes the urban districts at the eastern city boundary, and the Saigon River, which enters the urban area in the central north and flows into the larger Dong Nai in the central south. These waterbodies are fed by a complex network of artificial canals that drain the inner city. Both the natural and humanmade waterways have to be incorporated into the DEM. To that end, the bathymetry of the Dong Nai River can be approximated from a research article by Gugliotta et al. (2020), who digitized bathymetric maps originally prepared by the U.S. Army Corps of Engineers (USACE) in 1965. No open-access data exist for the Saigon River, thus requiring an assumption based on official navigation depths at different shipping terminals along the river. The Saigon bed elevation was approximated through interpolation between locations with known navigation depths (10.5 m b.m.s.l. (below m.s.l.) at Ben Nghe port, 8.5 m b.m.s.l. at Tan Thuan port, 6.5 m b.m.s.l. at Truong Tho port) (Ben Nhge Port Company Ltd., 2014; Trameco, 2014; Saigon Port Joint Stock Company, 2019) and extrapolation beyond the most upstream value with a slope of 0.1 %. This slope represents the average of the Saigon at its midsection (IGES, 2007) and was extended until the northern boundary of the model.
The results of a sensitivity analysis to quantify the impact of this assumption on the simulation results is presented in Sect. 3.2. For the inner-city canals, a survey conducted by the Japan International Cooperation Agency (JICA, 2001) determined the average depth of these canals to range between 1.82 and 3.82 m b.m.s.l. Given that neither detailed cross-sections nor profiles were available, all identified canals and channels were set to a depth of 3 m b.m.s.l. For the specific case of HCMC, the aforementioned processing steps lead to the final elevation model: a height-corrected, 2D median-filtered and filled SRTM topography with a 1 arcsec resolution that incorporates bathymetric data for all relevant waterbodies (cf. Fig. S2). Based on this model, various local flow catchments can be defined of which, however, not all contribute to pluvial flooding in the metropolitan area. Therefore, the perimeter of the flood model is set to include the 18 major urban catchments which contribute to flooding inside HCMC (Fig. 3). This allows for limiting simulations to the area of interest and hence decreasing computation times without affecting simulated flood depths. Although based on several case-specific simplifications, this methodology illustrates how free satellite-derived DEMs can readily be combined with public information on river bathymetries and finally produce a terrain model that can be used for hydro-numerical simulations.
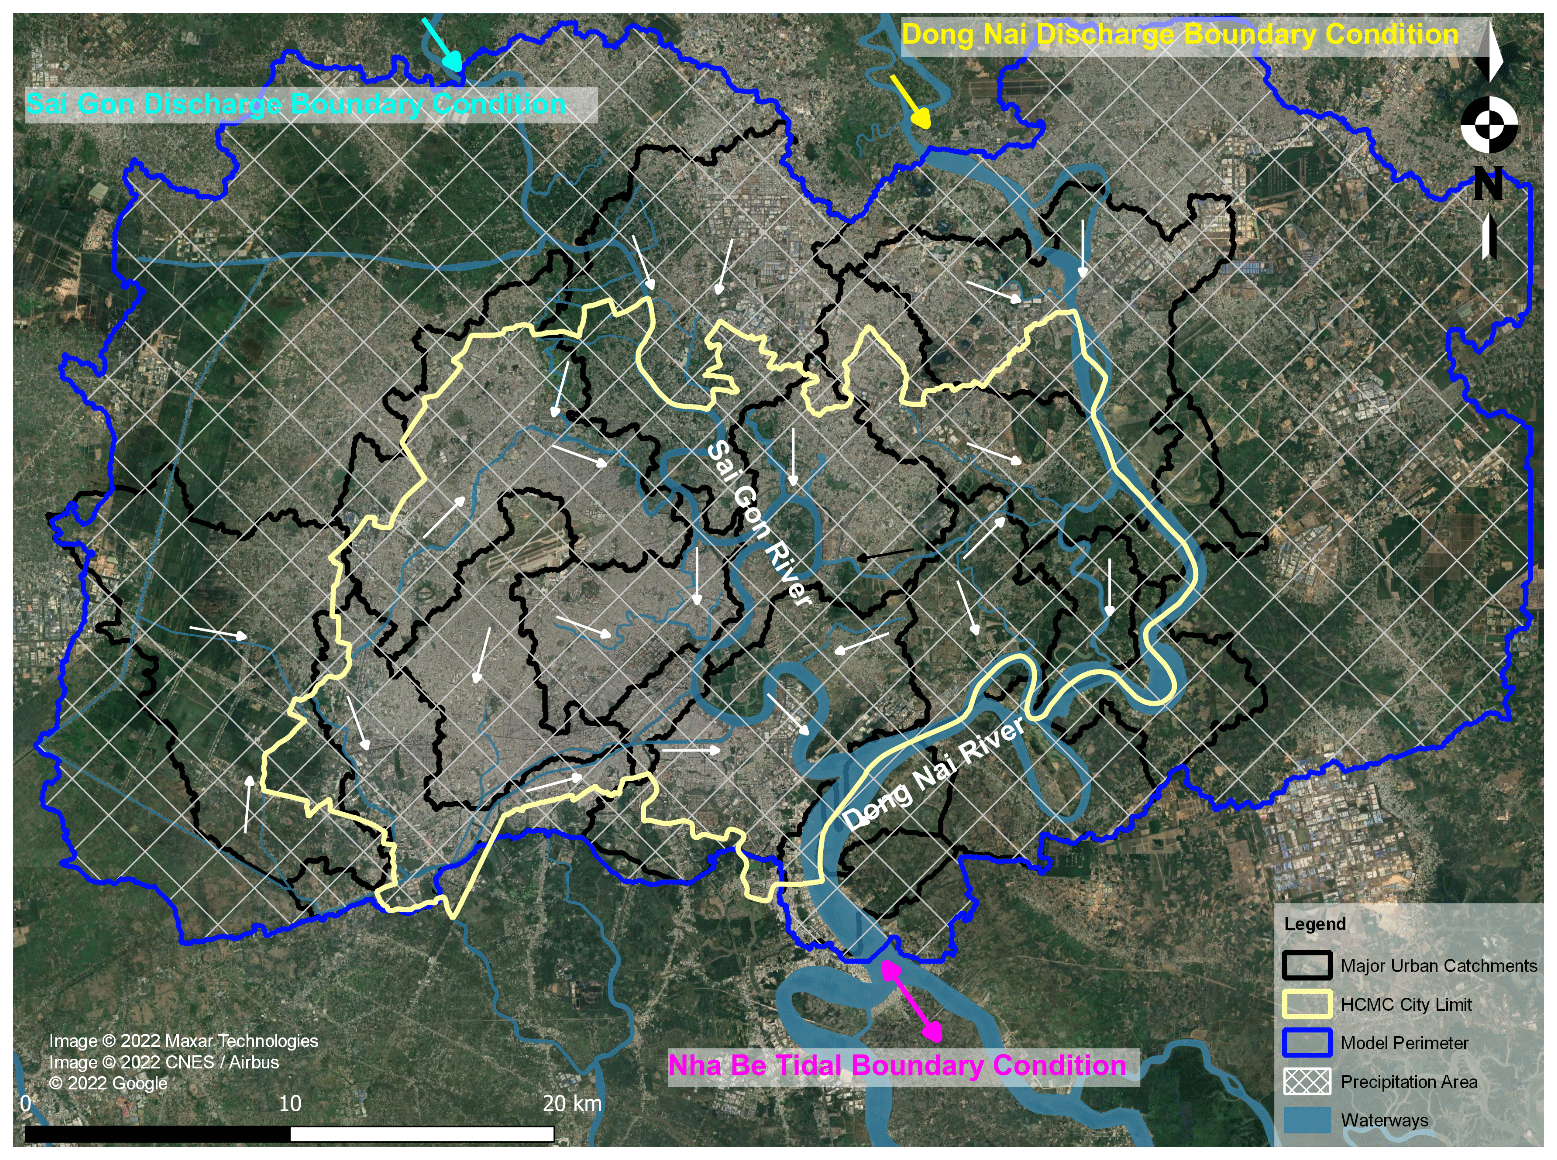
Figure 3Urban catchments. The hydrological makeup of HCMC where all of the local catchments that could be determined through the processed DEM are presented. On this basis, 18 major urban catchments were defined which contribute the greatest part to pluvial flooding within the city. The boundary of the hydro-numerical model equals the perimeter of these catchments in order to decrease computation times without affecting simulated flood depths.
2.1.3 Hydraulic roughness coefficient and model calibration
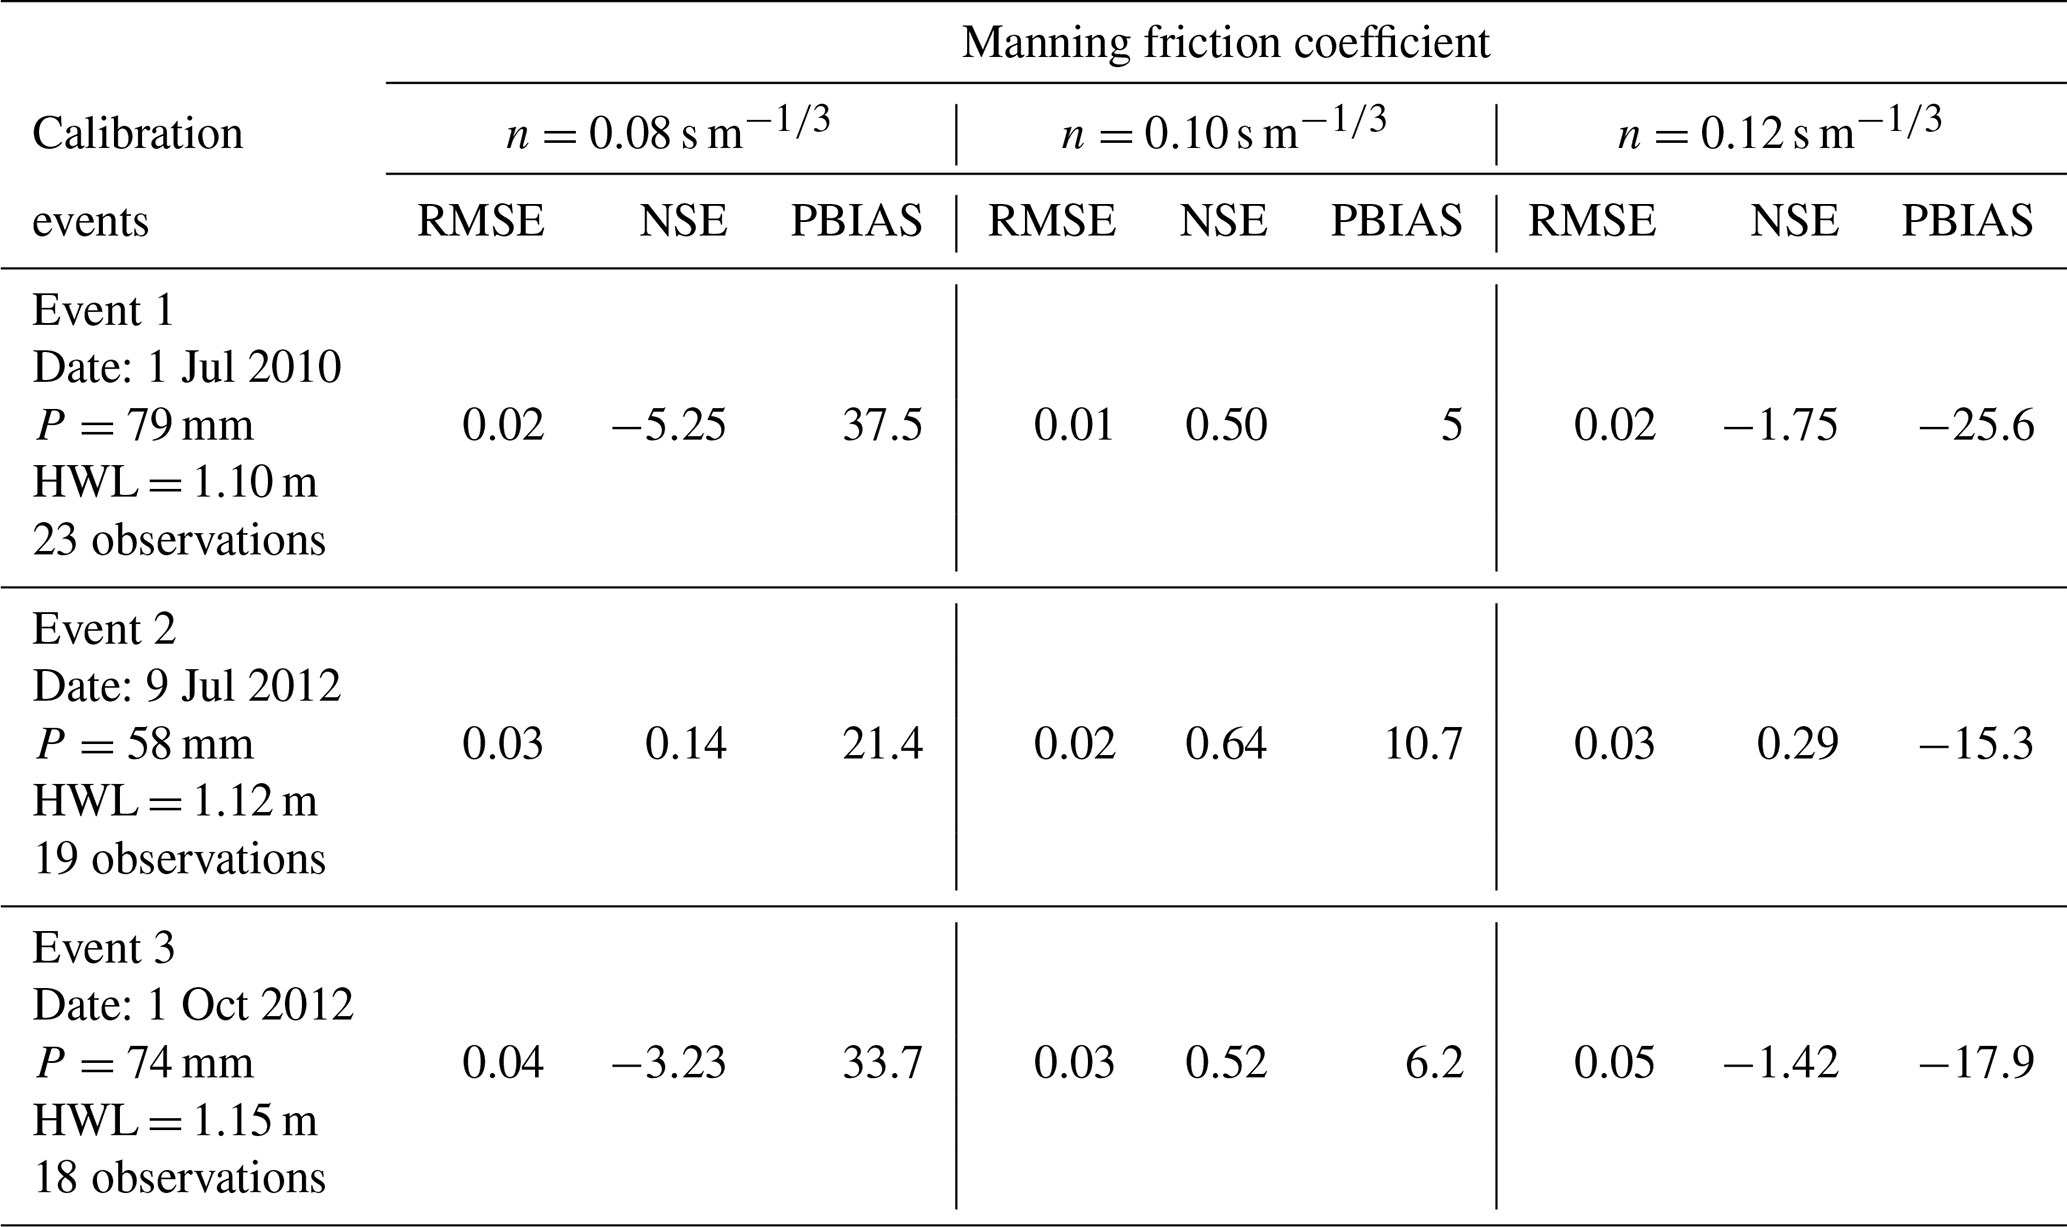
Due to the 1 arcsec resolution, buildings and extensive vegetation that significantly reduce the available cross-section for water routing are not represented as no-flow areas in the final DEM. Instead, an equivalent Manning friction coefficient was considered in the simulated hydraulic roughness, representing an additional macro-roughness effect that would be neglected if set to the value of, for example, concrete (Chen et al., 2012; Taubenböck et al., 2009; Vojinovic and Tutulic, 2009). HCMC, for instance, is a densely built urban city, whose surface is mostly composed of asphalt or concrete with very low roughness. To allow for this effect, a roughness coefficient range of 0.05 to 0.105 s m for urban environments has been proposed (Hejl, 1977), whereby specific values depend on the ratio of built-up to non-built-up areas. In order to determine the optimal Manning friction coefficient for the presented model (uniformly applied across the whole modeling domain), a calibration was undertaken using inundation depths and locations across HCMC provided by local partners for three severe rain events. The simulated flood depths for the respective boundary conditions (precipitation depth, P; high-water level, HWL) for inundation events on 1 July 2010, 9 July 2012 and 1 October 2012, respectively, are then compared at the observation points using the RMSE, the Nash–Sutcliffe efficiency (NSE) and the percentage bias (PBIAS) to assess the quality of the results (Table 2). Following this approach, the best results for the RMSE, NSE and PBIAS are obtained for a Manning friction coefficient of 0.10 s m, which corresponds to the higher bound of the proposed range for mimicking urban settings (Schlurmann et al., 2010). The achieved NSE values of 0.50 to 0.64 are particularly encouraging when compared to the calibration of the flood model by Le Binh et al. (2019) that achieved values of 0.51 to 0.89 using 2 m resolution lidar data. The presented model was validated, subsequently, for a Manning friction coefficient of 0.10 s m using a fourth, independent rain event. Detailed results of this validation are presented in Sect. 3.1.
Table 2Model calibration for different Manning friction coefficients focusing on reported inundations during three rain events (left column). Differences between simulated and observed inundation depths are expressed in terms of the root mean square error (RMSE), the Nash–Sutcliffe efficiency (NSE) and the percentage bias (PBIAS) (right columns).
2.2 Hydro-meteorological boundary conditions
As in the case of terrain and bathymetric data, the availability of data pertaining to hydro-meteorological boundary conditions varies widely depending on the region to be modeled. Nevertheless, an approach similar to that proposed for the elevation data can be adopted, whereby information and data originating from official sources have the highest priority, followed by open-source repositories, peer-reviewed literature, grey literature and regional models in descending order of importance. Generally, raw time series allow for an independent determination of intensities and return periods of extreme events by fitting the data to a probability function, e.g., Gumbel, Fréchet or Weibull distributions. A review of this methodological approach can be found in Hansen (2020). However, when there is consensus in the literature, when such time series with sufficient temporal resolution (i.e., daily or even monthly cumulative data) are absent or when an independent statistical analysis is not necessary, extreme values from the literature can be used. This process can be illustrated through the example of HCMC, where riverine, tidal and precipitation boundary conditions are needed. Nonetheless, given that the greatest problem for the inhabitants and authorities of HCMC is frequent, economically disrupting flooding due to the combination of heavy rain and high tidal water levels, the focus of this paper was put on precipitation, which is why the exemplary probabilistic analysis will only be shown for precipitation data. The methodology, however, can be applied to all other hydro-meteorological boundary data as well.
2.2.1 River discharge data
Discharge data are typically readily available, especially in the presence of reservoirs along a river. For the Saigon and the Dong Nai rivers, however, no open-access discharge data exist following the FAIR (findability, accessibility, interoperability, reuse) principles in data policy and stewardship (GO FAIR, 2016; Wilkinson et al., 2016; Mons et al., 2017), although both are regulated by upstream reservoirs. Nevertheless, singular extreme discharge rates and their respective return periods can be found in the additional material of a research article by Scussolini et al. (2017). Furthermore, long-term mean river discharges of 54 m3 s−1 for the Saigon and 890 m3 s−1 for the Dong Nai, respectively, were reported by Tran Ngoc et al. (2016), with the long-term mean river discharge of the Saigon River corresponding well to the net discharge of 30 and 65 m3 s−1 for 2017 and 2018 calculated by Camenen et al. (2021). Extreme values can be used to investigate fluvial flooding, while the average values are of use when investigating the influence of other flood drivers in isolation. Notwithstanding the indisputable temporal variability in river discharge in nature, stationary flow conditions can be assumed for the upstream boundaries of many flood models. Specifically, this holds for all settings in which other flood drivers with significantly higher rates of change exist, such as in coastal storm surge or rainfall runoff models (Sandbach et al., 2018). For the case of HCMC, it is assumed that both the lowland location of the model domain and officially operated reservoirs upstream of the Saigon and Dong Nai rivers justify this simplification.
2.2.2 Tidal data
Although an official gauge station exists at Nha Be (see location in Fig. 3), directly at the southern boundary of the HCMC model domain, the corresponding tidal time series are not publicly available. Nevertheless, data from about 300 tide gauge stations are obtainable from the public repository of the University of Hawaii Sea Level Center including a station in Vung Tau (Caldwell et al., 2015). This gauge is located around 70 km downstream of Nha Be at the South China Sea and documents the periods of 1986–2002 and 2007–2021 almost consistently. To extrapolate that time series to the southern boundary of the model, a linear increase in the water levels can be assumed: as Gugliotta et al. (2020) report, high and low water levels steadily increase with a scaling factor of 1.05 between Vung Tau and Nha Be. In order to validate this approach, official Nha Be tidal time series were compared to the publicly available Vung Tau tidal time series for the year 2016. In fact, after adjusting for a temporal phase shift of 1.8 h and adjusting the water levels by a factor of 1.05, a linear regression returns a coefficient of determination of R2=0.964 and an RMSE of 0.157 m with a p value of p<0.001. Extrapolated and observed tidal time series from Nha Be are juxtaposed in Fig. S6 in the Supplement. Especially the depicted quality estimates corroborate the findings of Gugliotta et al. (2020) in regards to the water level relation between Vung Tau and Nha Be all the while validating the proposed approach for water level extrapolation. A drawback of this approach is the inability to calculate the temporal phase shift in water stages and discharges between Vung Tau and Nha Be. The reconstructed tidal data can be analyzed probabilistically for the determination of extreme tidal water levels if needed. In the present study case, an 8 d time series representing mean tidal conditions is used as the southern boundary of the hydro-numerical model. The 8 d time frame was chosen for two purposes: first, to ensure a so-called spin-up time needed for the numerical stabilization of water levels, and, second, to allow for physically realistic routing and concentration of rainfall runoff within the model domain.
2.2.3 Precipitation data
In the example of HCMC, precipitation depths with return periods of 5 years and less vary greatly in the existing literature (Khiem et al., 2017; Quân et al., 2017; Loc et al., 2015; FIM, 2013; Nhat et al., 2006). In particular, the values for a 3 h duration, 2-year return period storm range from 28 to 45 mm h−1, requiring an independent statistical analysis. Daily precipitation time series for the Tan Son Hoa weather station in central HCMC spanning from 1960 to 2012 can be obtained from the repository of the National Oceanic and Atmospheric Administration (NOAA), which publishes quality-checked precipitation data for several weather stations across the globe (NOAA, 2022). To determine the daily extreme precipitation depth for return periods of 2 years and greater, the data are fitted to a Gumbel distribution where the mean and standard deviation σn of the Gumbel variate are taken as a function of the record length, which is equal to the number of years (n=28):
where is 0.5343 and σn is 1.1047 for n=28 (Selaman et al., 2007). Using the Cramér–von Mises criterion, an nω2 of 0.2831 is calculated, which satisfies testing for α=0.1 (Dyck, 1980). In contrast, the probability of occurrence for return periods of 2 years and less can be calculated by ranking the precipitation depth of the raw data using , where i is the rank of the data point and m is the total number of data points. Given the 24 h temporal resolution of the raw data, a scaling function is applied to determine the intensities for lower durations (Menabde et al., 1999):
where id,T is the intensity for duration d and return period T, PD,T is the precipitation depth to be scaled, and β is the scaling factor. Based on the literature average for HCMC, β is assumed to equal 0.854 (Khiem et al., 2017; Nhat et al., 2006). The ensuing intensity–duration–frequency (IDF) curves, which reflect the precipitation depth as a function of storm return period and duration, are presented in Fig. 4.
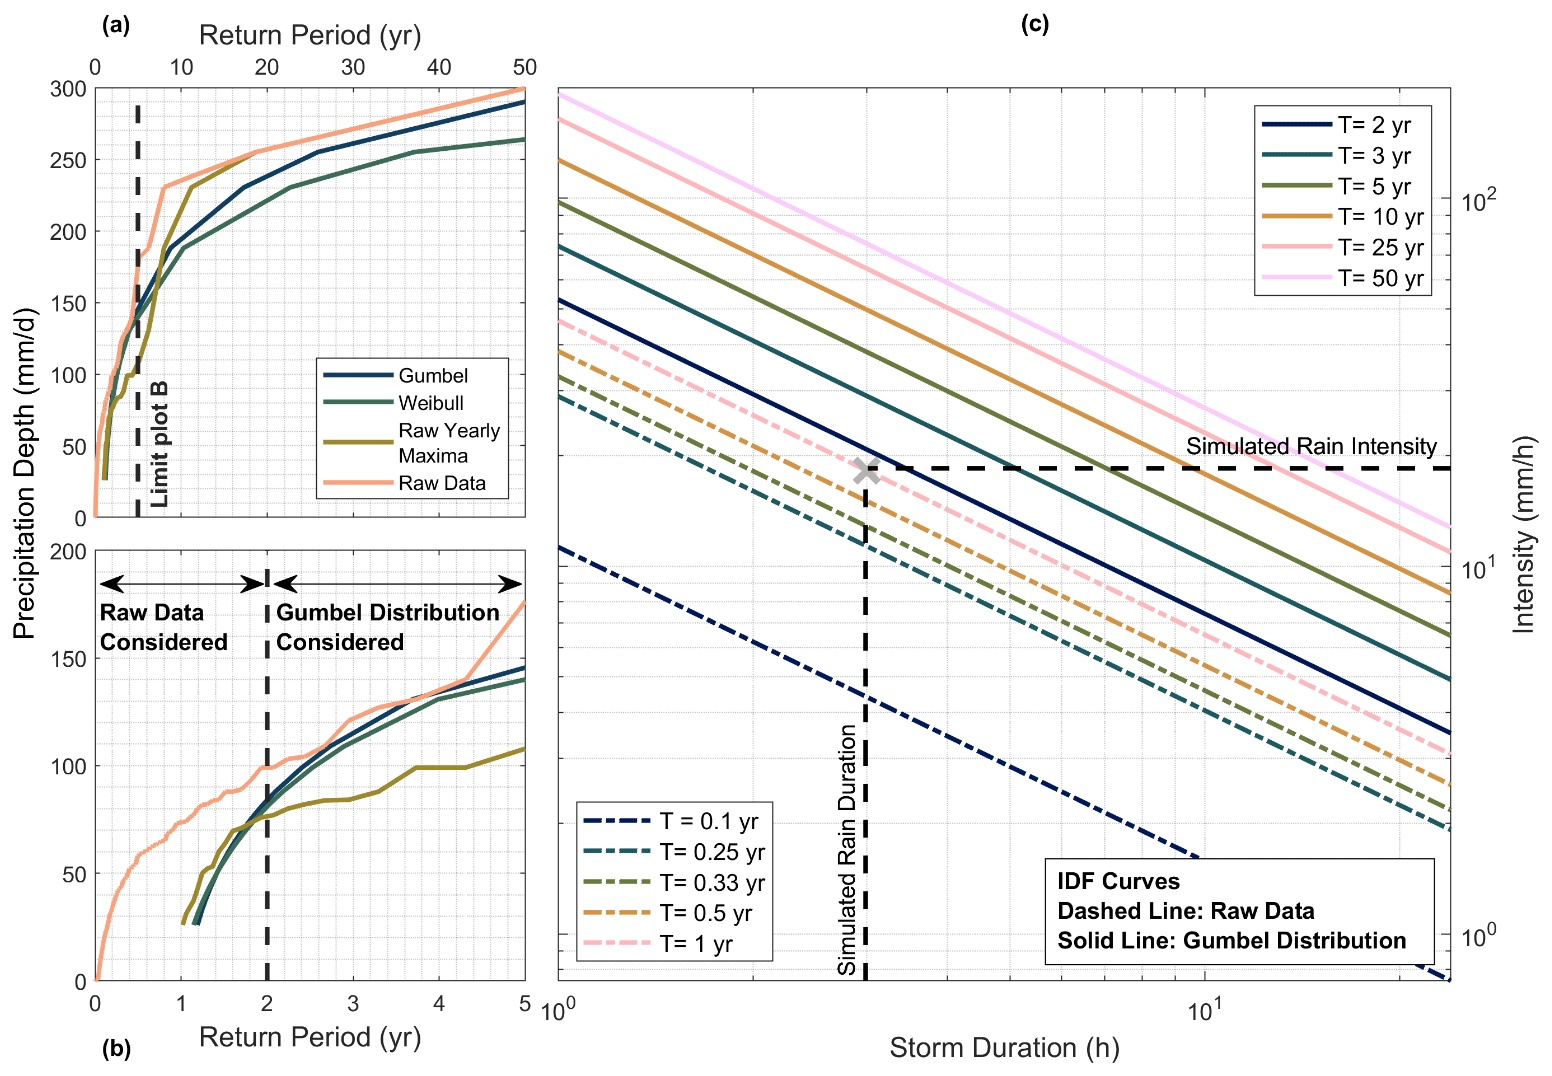
Figure 4Intensity–duration–frequency. Panel (a) depicts the return period of heavy-rain events plotted against the precipitation depths for the raw data, the raw yearly maxima, the Weibull distribution and the Gumbel distribution. Panel (b) zooms in on panel (a) for the return period of 5 years and less, showing for which return periods the probability of occurrence and the Gumbel distribution are taken into consideration. Panel (c) is the end result, showing the different IDF curves for return periods of 0.1 to 5 years. Data visualized using scientific color maps created by Crameri (2021).
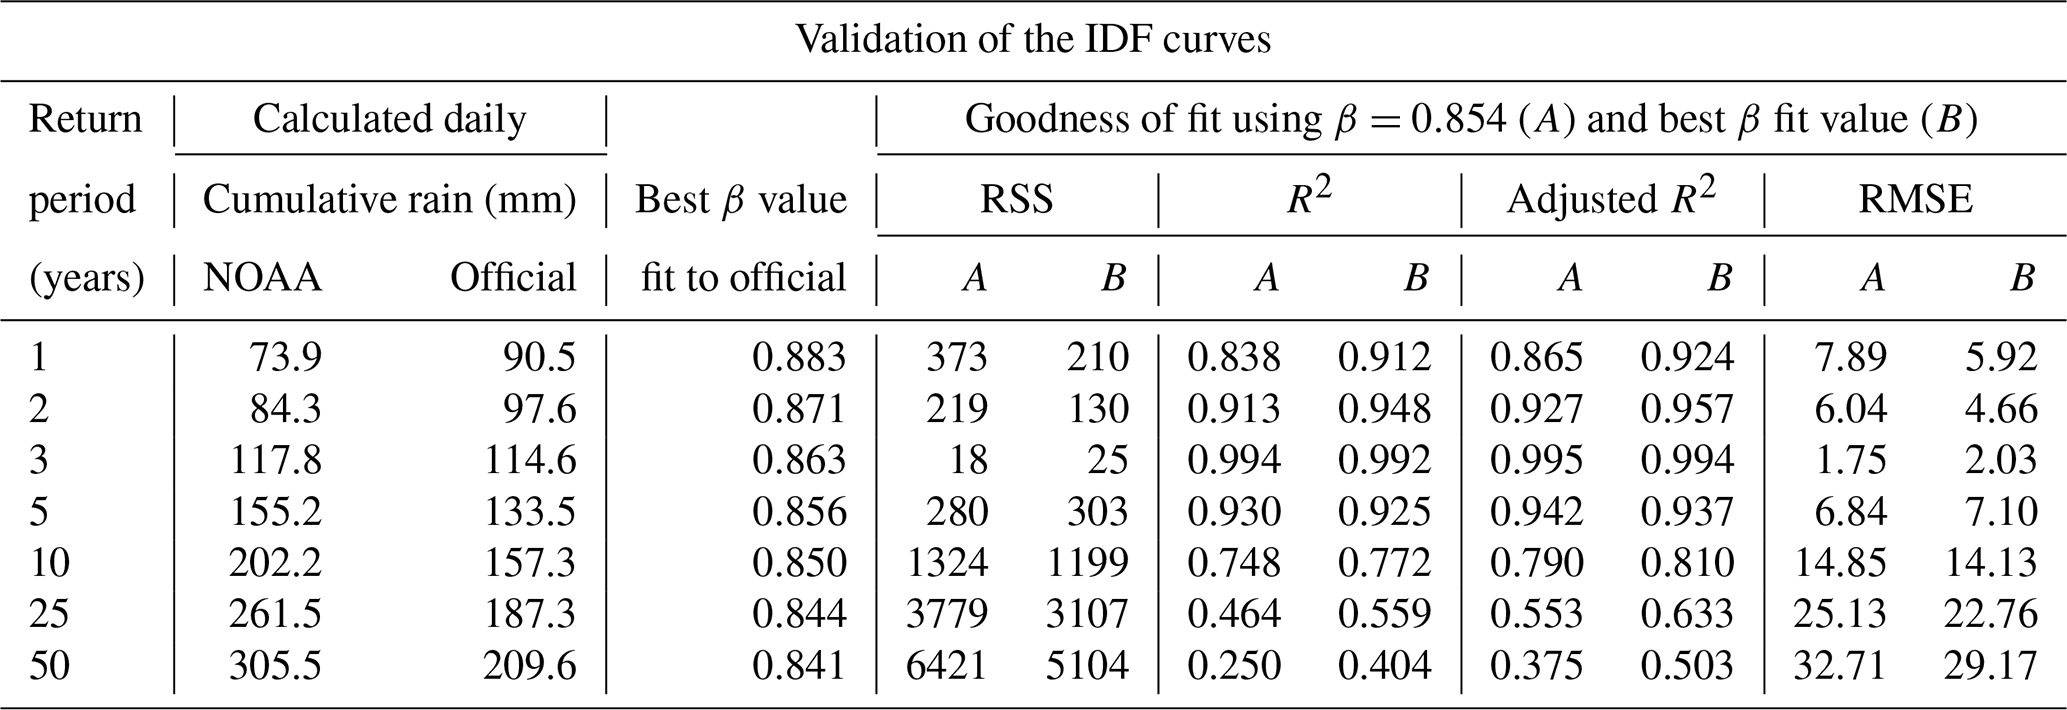
Using official hourly precipitation data for the Tan Son Hoa weather station over the same period, the performance of the NOAA time series as well as the adequacy of the temporal scaling factor β was evaluated (Table 3). The mean value of the daily yearly maximum precipitation is 94.7 and 104.3 mm, while the standard deviation is 69.13 and 40.64 mm for the NOAA and the official hourly precipitation data, respectively. The similarities and differences between the statistical results of both time series will be further discussed in Sect. 4.
Table 3A statistical comparison of the NOAA and official hourly precipitation data along with a measure of the goodness of fit using the average temporal scaling factor from literature as well as the temporal scaling factor fit to the official data. The goodness of fit is quantified in terms of the residual sum of squares (RSS), the coefficient of determination (R2), the adjusted R2 and the root mean square error (RMSE).
As for the creation of an adequate hyetograph, i.e., the development and representation of precipitation depth over time, numerous algorithms for the creation of a design storm are available (Balbastre-Soldevila et al., 2019). For rain events in HCMC, the linear–exponential synthetic storm of Watt et al. (1986) has been taken to create the hyetograph of a 3 h duration, 1-year return period (3h1y) rain event, since it matches the hyetograph according to decision 752/QD-TTg by the HCMC government. The simple example of deducing the river discharge, tidal water levels and precipitation hyetograph for HCMC illustrates how open data, even if not in the form of time series, can be utilized to define reasonable boundary conditions for an urban flood model.
2.3 Processing of flood simulation results
2.3.1 Use of difference plots
Ultimately, the presented methodology allows for setting up a hydro-numerical flood model that simulates surface runoff in a setting where urban features cannot be fully represented, e.g., exclusion of small-scale topographic elements like flood protection structures (artificial bank elevation, flood protection walls, etc.) or underground systems like technical details of a local stormwater drainage system. Given the regional scale of many models, however, it is assumed that the absence of the latter is compensated by the hydraulic efficiency of a smoothed and filled DEM, which guarantees that water always flows towards the lowest elevations driven by gravity, effectively mirroring the functions of a stormwater drainage system. Furthermore, there is significant evidence for the ineffectiveness of the stormwater drainage system in the particular case of HCMC (Le Dung et al., 2021; Nguyen, 2016). The local drainage system is not well maintained and has limited functionality (Nguyen et al., 2019). Drainage capacity is therefore strongly hampered in the case of storm events, which justifies its exclusion from the model representing a conservative approach.
In contrast, the absence of flood protection structures in the model has a significant impact on the runoff dynamics, whereby flooding can even occur in places where no inundation is plausible under normal conditions, i.e., no rain, mean tide and mean river flow. To counteract this effect, simulated water levels are corrected by taking the results of the regular conditions as a reference. This reference was defined based on flooding threshold values determined with local partners and information from grey literature like the JICA reports (JICA, 2001) as well as different media articles, whose URLs can be found in Sect. S7 of the Supplement. Accordingly, only the additional flooding (above regular inundations) is considered the actual level of flooding when simulating events with more intense conditions. In order to isolate the impacts of additional flooding, the results of the simulation under normal conditions are then subtracted from the results of simulations under more intense conditions occurring either in combination or in isolation.
In the HCMC example, the 3 h duration, 1-year return period rain event is taken for a detailed investigation. The reason for this choice is that these yearly recurring events are not usually put into focus when conducting flood simulations, although they bring about major economic losses that are comparable to and sometimes even greater than those from extreme flood events (ADB, 2010). In turn, the results of the simulation under long-term average tidal and riverine conditions are subtracted from the results of the simulation for a 3h1y rain event with mean tide and mean river discharge. These difference plots finally reflect the extents and dynamics of typical inundations induced by the isolated 3h1y rain event. This methodological approach can be easily applied to a variety of scenarios and corresponding simulations.
2.3.2 Flood intensity proxies
In urban flood modeling, the intensity of flooding in a predefined area is typically expressed in terms of maximum simulated flood depths. Although this is a good indicator for the exposure and scale of affected people during extreme events, it fails to provide an accurate estimate of projected damages or losses. This is especially important when taking into consideration that, particularly in coastal cities, certain flood depths can persist for a much longer time than others due to tidally induced backwater effects (Andimuthu et al., 2019). This flood duration, on the other hand, is very important when events of marginal intensity, i.e., high probability of occurrence, are investigated, since it can be an indicator for the persistence of economic and social disruption (Debusscher et al., 2020; Ismail et al., 2020; Feng et al., 2017; Wagenaar et al., 2016, 2017; Shrestha et al., 2016; Koks et al., 2015; Molinari et al., 2014; Thieken et al., 2005) in residential and industrial areas (Tang et al., 1992), as well as in an agricultural context (O'Hara et al., 2019). This effect can best be expressed through the creation of a “duration over threshold” map, which depicts how long a certain flood depth is exceeded. This threshold value can be adjusted according to the local constraints. In the case of HCMC, the threshold depth was set to 0.10 m, given that this value corresponds to the minimum reported flood depth provided by local partners.
In an attempt to combine the perspectives of flood intensity and duration, a simple two-parametric but more integrative proxy, namely the “normalized flood severity index (INFS)”, is defined and tested in this study. This proxy helps to identify areas where the combination of both time-independent maximum flood depth and the duration over threshold is at its maximum and where the largest flood impacts and, accordingly, the most severe damage potential can be expected. This is particularly useful when considering the high economic damage caused by less severe but more frequent urban floods that HCMC regularly suffers from (ADB, 2010). In order to increase the robustness of the dimensionless INFS against numerical divergence and artifacts, the normalization is based on the 95th (spatial) percentile of flood depth and duration. Depending on the specific case, however, this reference for normalization may be adjusted. The INFS at each grid cell (x,y) can be expressed as follows:
where dmax(x,y) refers to the maximum (temporal) simulated flood depth at the local cell with coordinates x and y and referring to the scenario-based flood duration over the predefined threshold of 0.10 m.
Due to its normalization, the application of the INFS is not restricted to singular analyses but can also be considered an indicator to express changes in flood severity due to changing boundary conditions. For example, when taking climate change scenarios into account, the INFS can be computed for a particular case and then normalized according to the base case without climate change effects.
Even in cases where topographic and hydro-meteorological data are sparse or hard to obtain, it should always be possible to gather the most essential boundary conditions and compose a basic hydro-numerical model following the aforementioned methodology. To showcase the applicability and performance of this approach, the following section provides information regarding the validation results for the exemplary surface runoff model of HCMC as well as a sensitivity analysis that scrutinizes the validity of the described assumptions concerning the local bathymetry. Subsequently, the simulation results are analyzed using the indicators and parameters defined in Sect. 2.3 to determine local flooding hotspots. Data on inundation depths and locations provided by local partners are used in a subsequent step to cross-check the performance of the latter and newly proposed flood intensity proxy, the INFS.
3.1 Model validation
Using a Manning friction coefficient of 0.10 s m, the validation of the model was accomplished by simulating a torrential rain event that occurred during the monsoon season on 14 June 2010. During this event, a total of 73 mm of rain fell on HCMC, while tidal water levels reached maximum heights of 1.15 m. Scattered across the city, flooding was reported for 25 observation points at street level. The maximum flood inundation depths were determined using the difference plot method described in Sect. 2.3. The simulated and reported flood depths at these observation points are listed in Table S8.1 of the Supplement. The performance of the validation run was quantified using the NSE, RMSE and PBIAS metrics, which were calculated to be 0.7, 0.03 m and 4 %, respectively. Additionally, Fig. 5b and c show that the simulated flood depths matched the observations at 62 % of all points (cf. Fig. 5a), while diverging by 5 and 10 cm at 33 % and 5 % of the observation points, respectively. The exact coordinates and locations of the observation points along with the accompanying street names are also included in Sect. S8 of the Supplement. The high resemblance of simulation results and observations underlines the validity of the employed methodology.
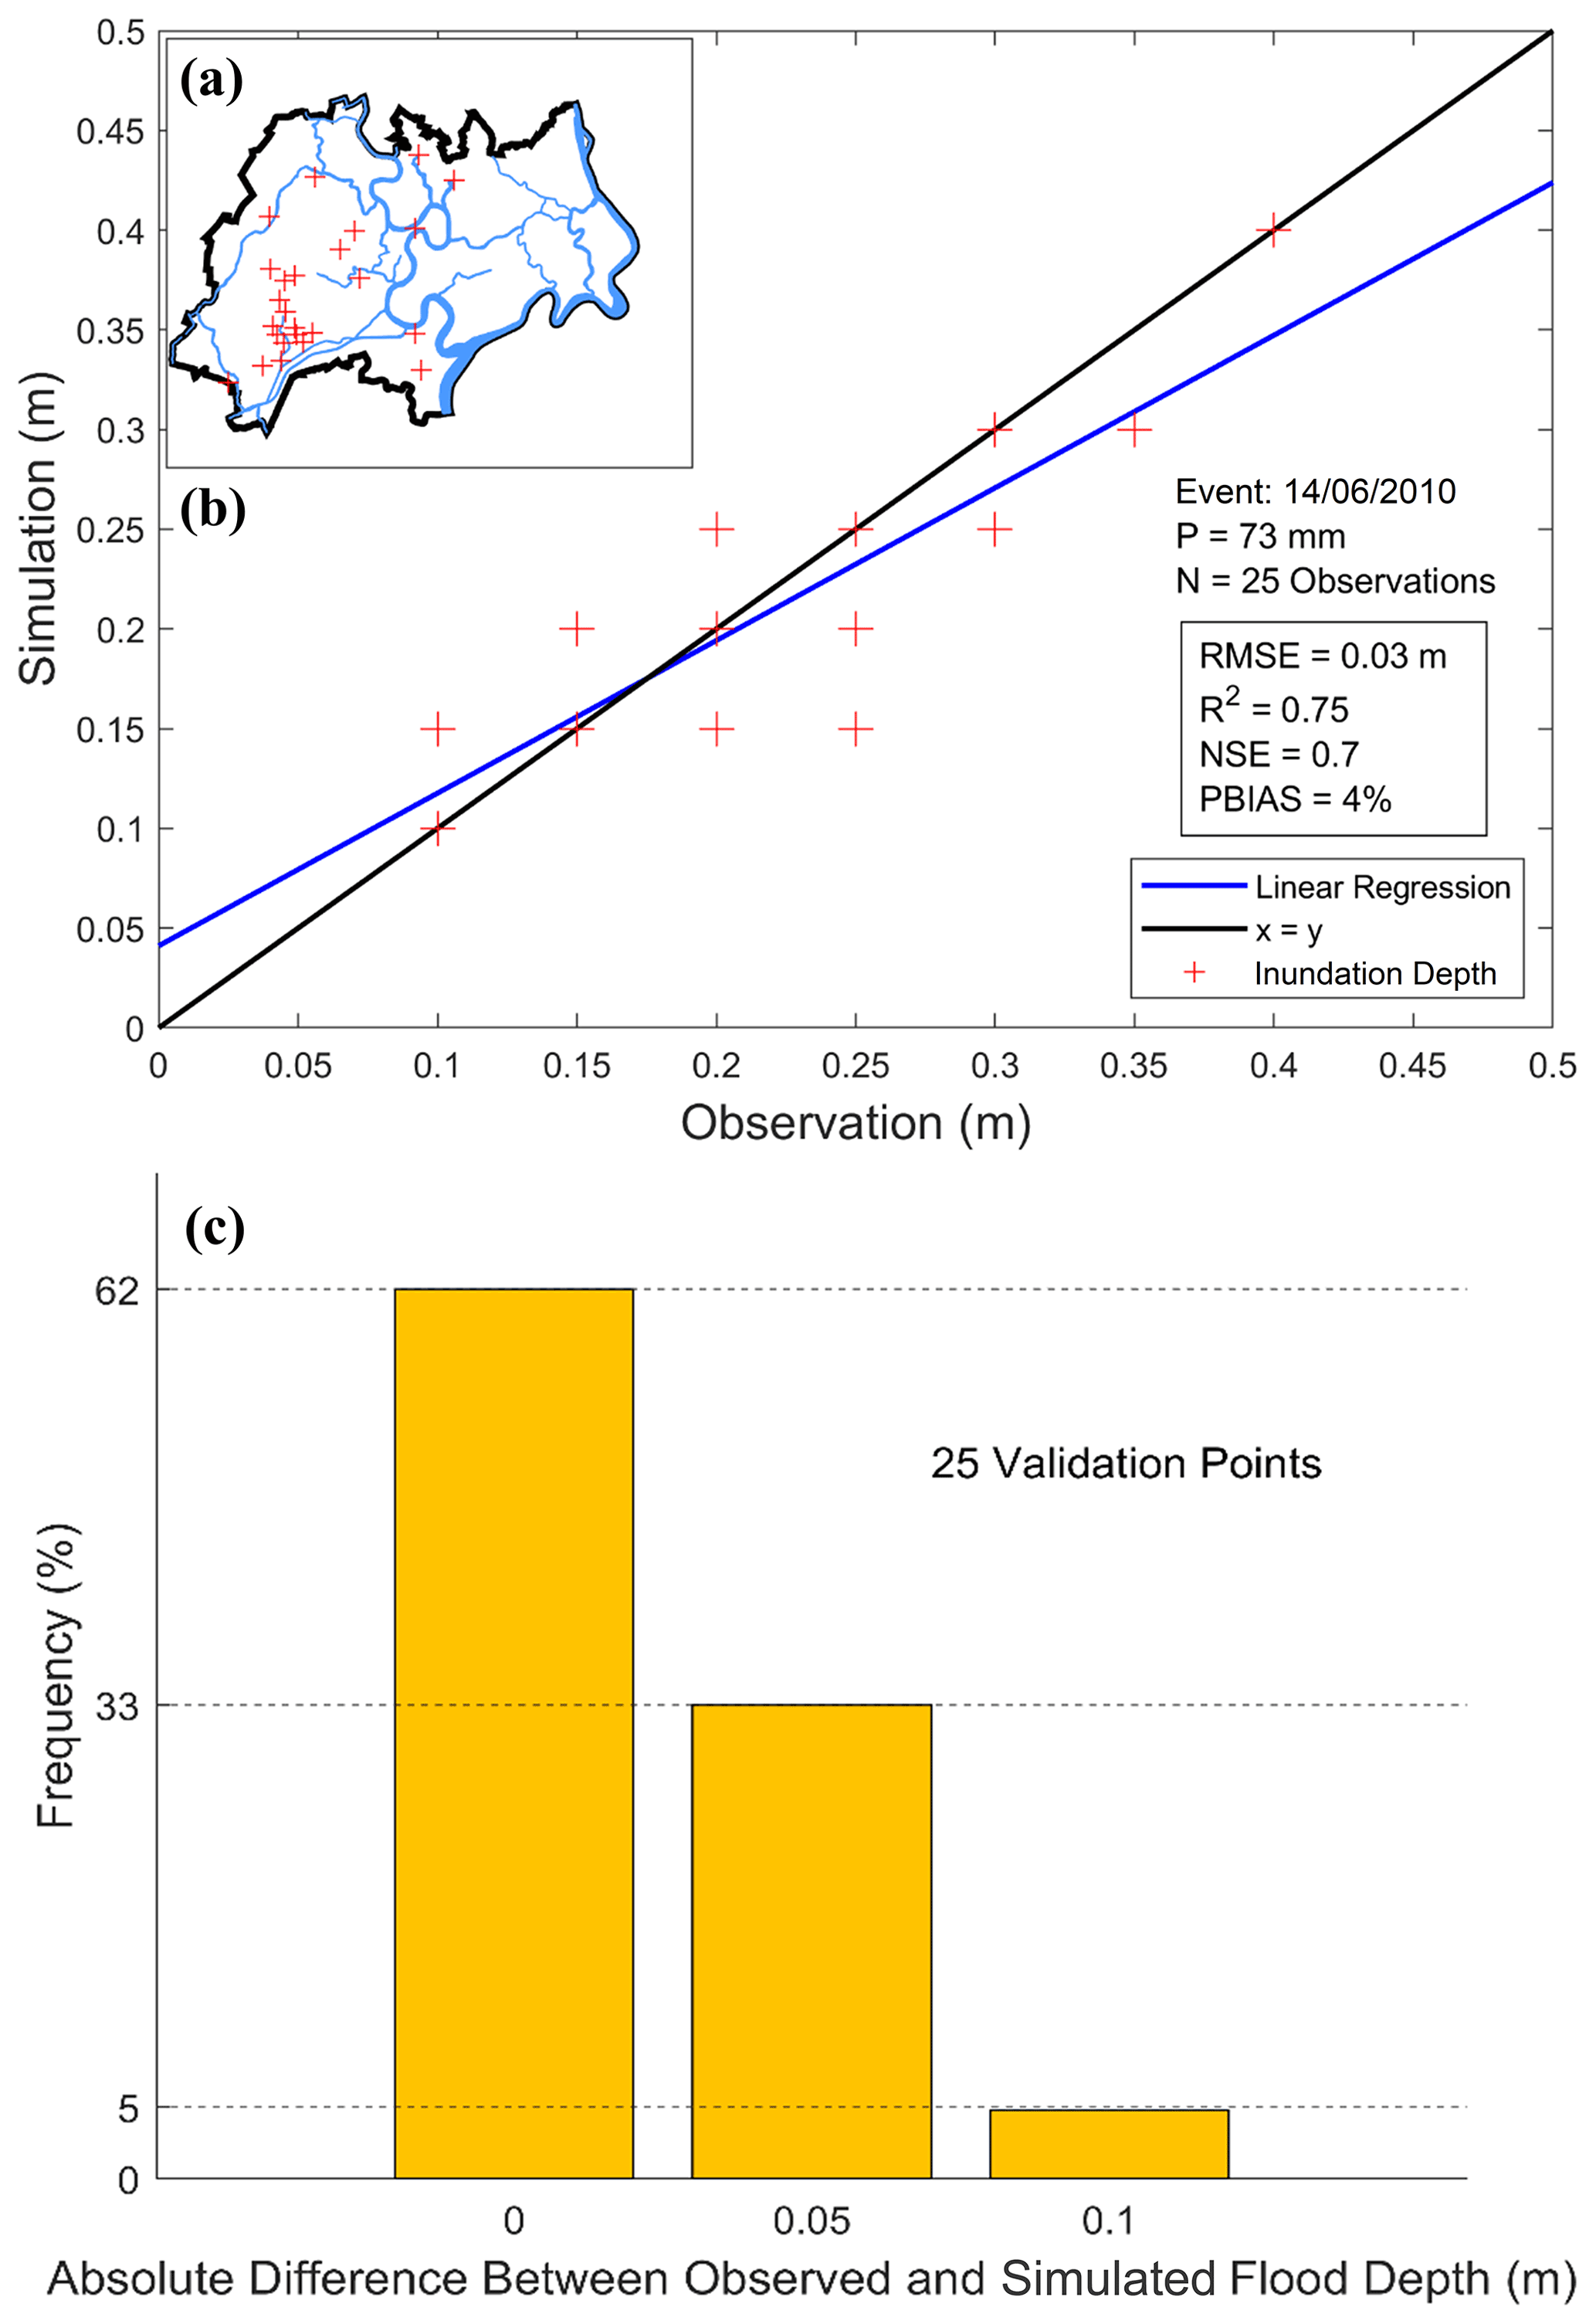
Figure 5Model validation. (a) Location of the 25 reported inundations (red crosses) that were used for validation. (b) Simulated flood depths plotted against the reported flood depths along with the linear regression (in blue) and the calculated R2, NSE, RMSE and PBIAS (bottom right). (c) Frequency of absolute vertical differences between the observed and simulated flood depths at the 25 observation points across HCMC.
3.2 Sensitivity analysis for the assumed riverbed elevation
Given that the Saigon bathymetry is approximated by assumptions that are solely based on the officially maintained fairway depth, it seems mandatory to assess the sensitivity of simulation results to variations in water depth in the Saigon River. The riverbed elevation is thus varied between 1.0- and 1.8-fold of the navigation depth in increments of 0.2. The results of this simulation are shown by longitudinal sections in Fig. 6. Specifically, the simulated water surface levels increase at points A (inner-city low point that is a known flooding hotspot), B (canal intersection where frequent flooding occurs) and C (outlet of the Ben Nghe canal) with increasing riverbed elevation. Nevertheless, the maximum nominal difference in the water surface levels is 7 cm at point A and 12 cm at both B and C. Comparing depths of 1.2 times and 1.8 times the fairway depth, this difference is 4 cm at point A, which can be considered negligible. Given the low sensitivity of the water surface level to the depth of the Saigon, employing the assumption stipulated in Sect. 2.1.1 is rendered sufficient for the flood model.
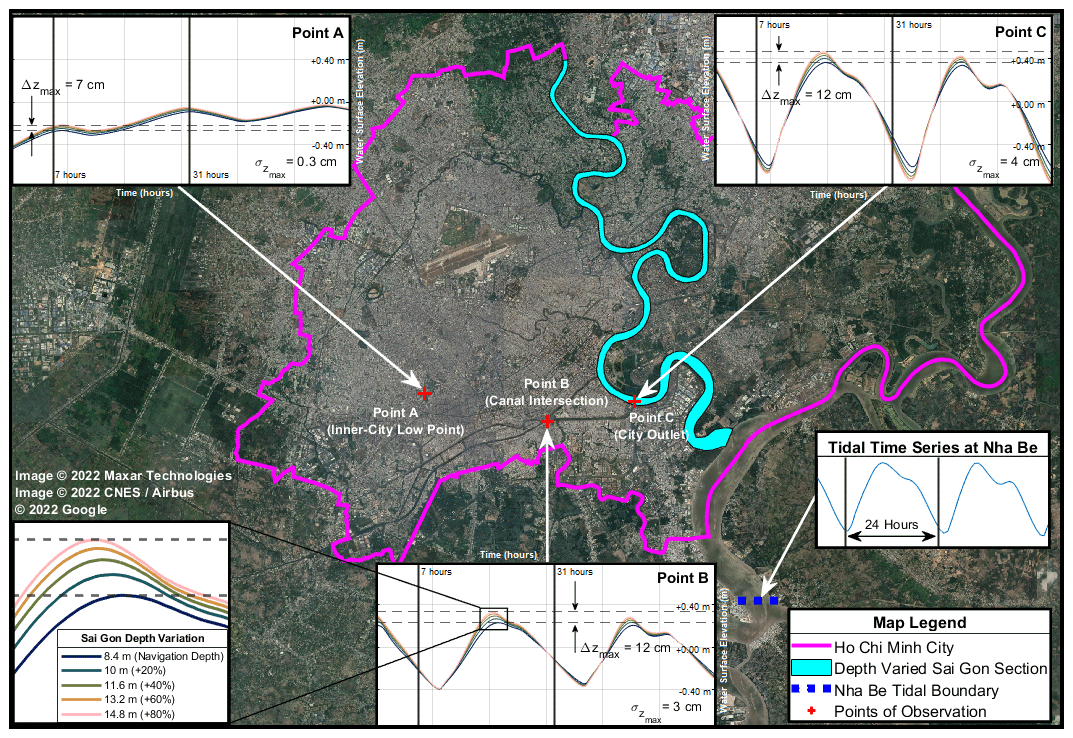
Figure 6Depth sensitivity. Impact of varying the depth of the Saigon River on simulated water depths at three different locations (point A: inner-city low point, point B: canal intersection, point C: city outlet). The zoom box in the lower-left corner highlights the maximum difference of 12 cm at a +80 % increase in the river depth. Data visualized using scientific color maps created by Crameri (2021).
3.3 Performance of the flood intensity proxies
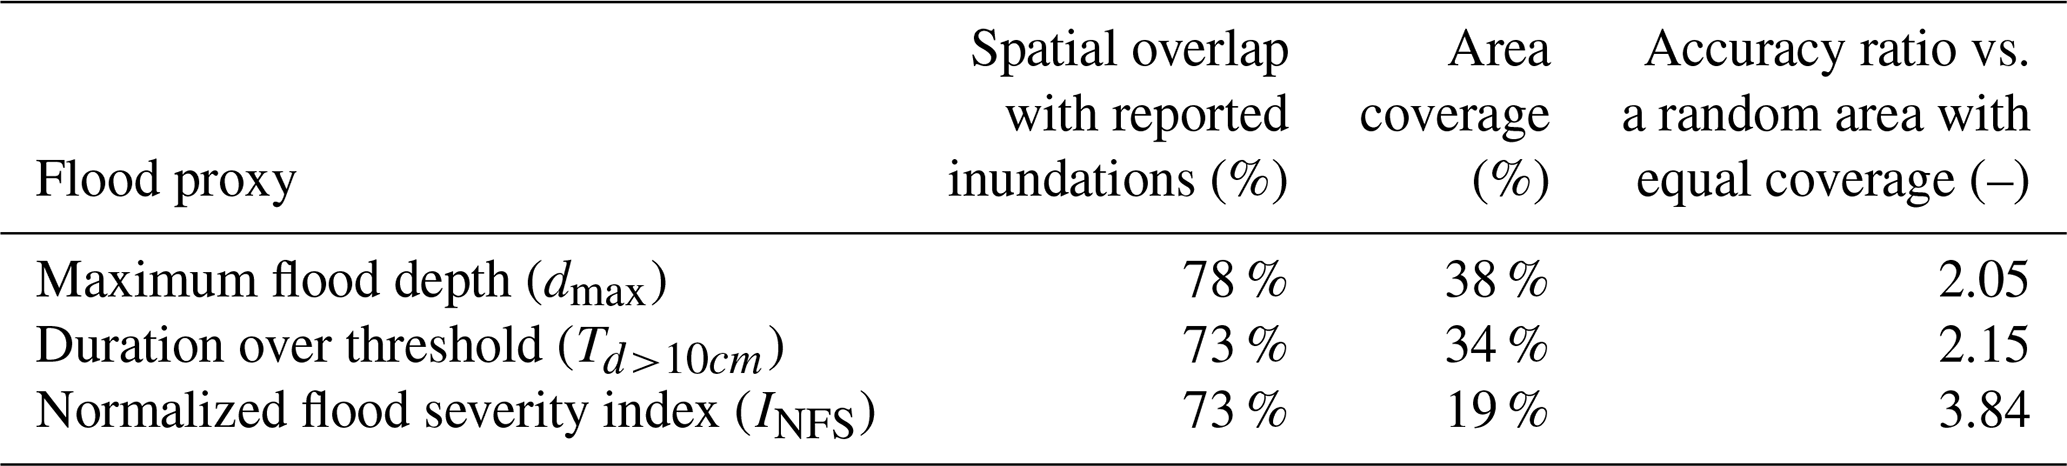
The 3 h duration, 1-year return period rain event with a precipitation depth of 54 mm can be investigated using the flood intensity proxies defined in Sect. 2.3.2. The choice of this particular precipitation event is explained in Sect. 2.3.1. Comparing Fig. 7a and b illustrates the similarities and differences between the maximum flood depth (dmax) and duration over threshold (Td>10 cm). As can be seen, a high dmax does not necessarily translate to a high Td>10 cm and vice versa as evident by the areas on the western bank of the Saigon River. At this location, a relatively high dmax but a relatively short Td>10 cm can be observed. This example epitomizes the usual shortcomings of using only one of the classical proxies for assessing flood damage potential. By combining these, however, inundation hotspots with significant damage potential can be discovered in the distribution of dimensionless INFS values (Fig. 7c). In particular, the locations of reported inundations where sustained flooding demonstrably occurred, as well as the INFS heat map, show considerable spatial overlapping. While the INFS only covers 19 % of the total area of HCMC, around 73 % of the reported inundations lie inside or within 100 m of the highlighted areas. These figures are opposed to 78 % and 73 % for the dmax and Td>10 cm that cover 38 % and 34 % of the area, respectively (Table 4). The small spatial extent of the INFS heat map, relative to the dmax and Td>10 cm maps, coupled with the relatively high coverage of reported flooding locations corroborates the usefulness of the proposed index in successfully localizing flooding hotspots and quantifying their spatial extents.
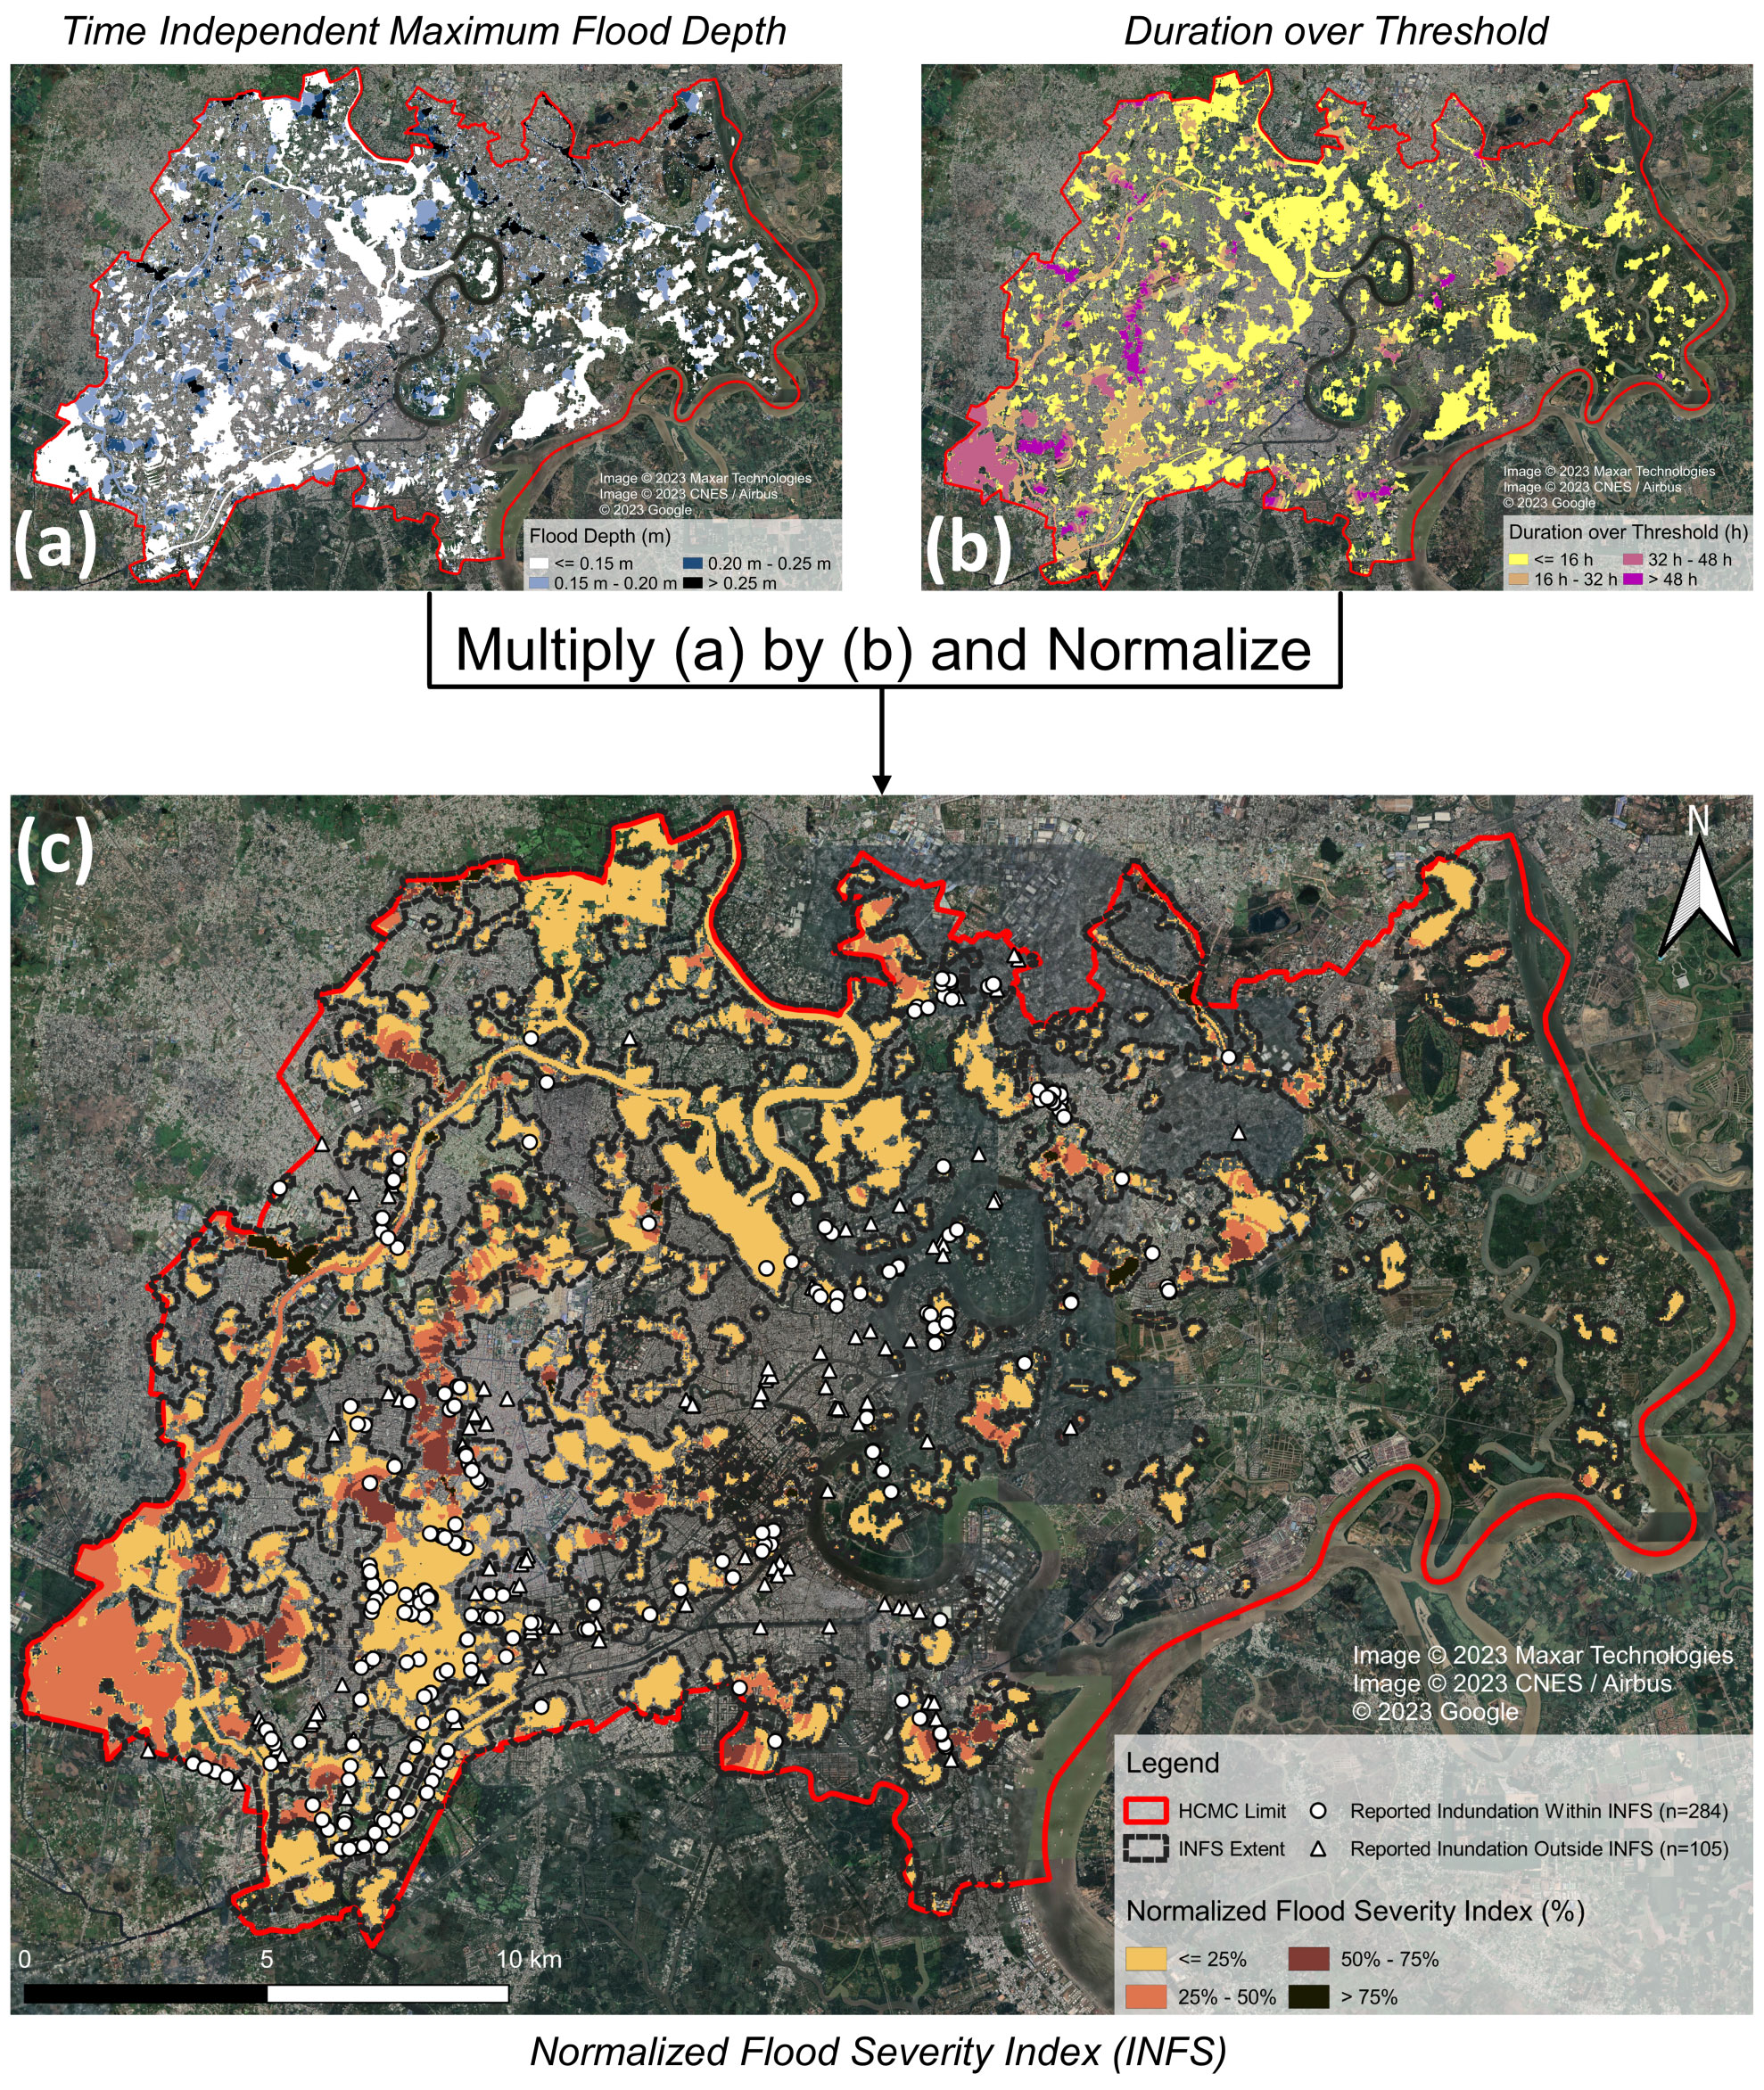
Figure 7Flood intensity. Panel (a) depicts the time-independent maximum flood depth in meters, while panel (b) depicts the duration over a threshold of 10 cm in hours. Panel (c) reveals the results of the INFS, whereby hotspots of this index (covering 19 % of HCMC) show a high spatial overlapping with the reported inundations (73 % inside or within 100 m). All data were visualized using scientific color maps created by Crameri (2021).
Table 4Performance of the different flood proxies in terms of the spatial overlapping with the locations of reported inundations.
Like in any other scientific discipline, every hydro-numerical model is subject to limitations. This applies particularly for a model which exclusively draws on freely available data as envisioned in the presented framework. In this case, each of the model inputs and outputs has to be evaluated in terms of its accuracy, reliability and significance. For instance, the topographic data come with a limited spatial resolution and uncertain vertical error. Significant differences between the available hydro-meteorological time series suggest a source of error as well. And, finally, the essential validation of modeling results, in many cases, has to be based on citizen and media reports whose scientific standards cannot be taken for granted. Although this has to be seen as a disadvantage compared to studies that have the privilege to build on official and high-resolution data, the majority of inherent limitations can still be rebutted and accepted if taken into account reasonably. Nevertheless, the only valid argument against infinitely increasing the level of detail of a model remains (acquisitional and computational) cost so that high-resolution data should always be incorporated where accessible.
4.1 Accuracy of elevation data
Since topographic data play a significant role in flood modeling, their validation is imperative. However, difficulties in this respect arise from the lack of ground truth data in many countries if local topographic surveys or lidar data are inaccessible. The only data close to ground truth in the case of HCMC are the JICA report from 2001 (JICA, 2001), in which various canal bank elevations can be found. Furthermore, there is a substantial difference between high-resolution lidar data and satellite-derived DEMs that cannot be closed independent of the amount of processing. As for the satellite DEMs, there exist a multitude of such models that need to be carefully considered for each specific task. Some more recently provided terrain and elevation models, like the Copernicus DEM, do offer advantages in terms of lower noise levels and resolution but do not represent the actual surface elevation in an urban environment, which is especially problematic in urban coastal agglomerations where flawed terrain heights can have a significant impact on flooding extents due to tidal effects. Even the assumption that CoastalDEM or FABDEM represents the actual surface elevation is vague in the context of Southeast Asian coastal cities. In fact, Vernimmen et al. (2020) calculated an average error for the Mekong Delta area in Vietnam of +1.23 m for SRTM and −1.35 m for CoastalDEM, concluding that SRTM generally overestimates surface elevation, while CoastalDEM underestimates it. Building on that approach, a comparison of the performance of the various DEMs in terms of representing the canal bank elevations reported by JICA (2001) can be undertaken for the Tau Hu–Ben Nghe canal (cf. Fig. S5), with the results shown in Table 5.
Table 5Absolute bank elevations for the Tau Hu–Ben Nghe canal according to ground truth data by JICA (2001) and from seven freely available satellite-based DEMs. The statistical ranges suggest an overestimation for SRTM, ALOS, ASTER, Copernicus DEM, CoastalDEM v2.1 and FABDEM as well as an underestimation for CoastalDEM v1.1, respectively. Depths above (+) and below (−) mean sea level.
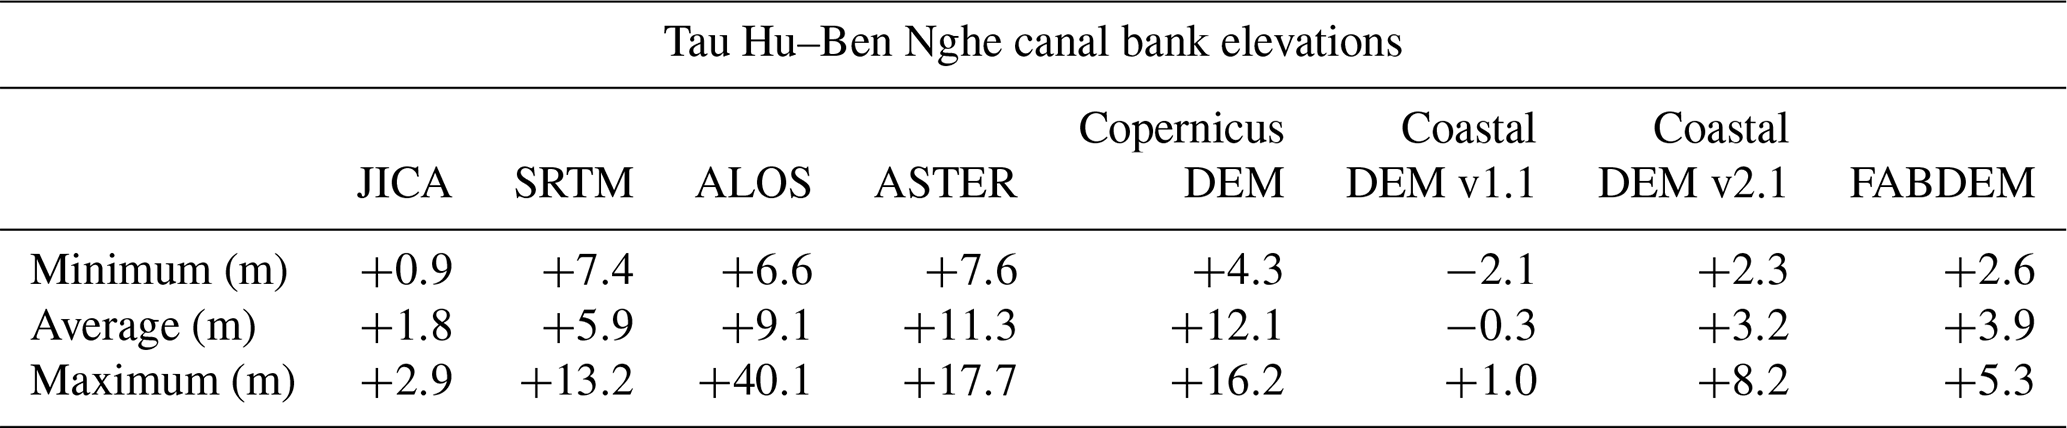
The findings in Table 5 are similar to those of Vernimmen et al. (2020), whereby the Tau Hu–Ben Nghe canal bank elevation is overestimated by +4.1 m on average in SRTM, while being underestimated by −2.1 m in the first version of CoastalDEM, thus corroborating the conclusions reached by Schumann and Bates (2018) on the inadequacy of most open-access DEMs for flood simulations, especially in urban environments. The newer version of CoastalDEM (CoastalDEM v2.1), with supposedly improved accuracy, overestimates the canal bank elevations and shows a great divergence from CoastalDEM v1.1, which highlights the difficulty of accurately representing topography in densely built environments even with the help of artificial intelligence.
The reliability of these findings was further reinforced by the comparison of SRTM, CoastalDEM and the generated DEM with three lidar areas presented in Sect. 2.1.1., which showed that SRTM overestimates the terrain by up to 1 m, while CoastalDEM v1.1 and the generated DEM tend to underestimate the terrain elevation by 1 and 0.5 m, respectively. This clearly shows that the proposed processing steps to leverage SRTM and CoastalDEM lead to a DEM with a smaller bias than the two original data sets. Furthermore, it is important to measure the amplitude of this bias with regards to other open-access DEMs (SRTM, ALOS, ASTER, Copernicus). The positive bias of these traditional DEMs can reach up to +7.5 m against the lidar data, rendering them completely unreliable for urban flood modeling purposes. This corroborates the conclusions made by Hawker et al. (2018) in regards to the limited usability of existing DEMs at the global scale. In this regard, the corrected DEM is far more reliable than any other open-access DEM and can confidently be used, especially in the outlined context of preliminary flood estimations.
Additionally, the topography of HCMC is affected by varying degrees of land subsidence, ranging from 0.3 to 5.3 cm yr−1 (Duffy et al., 2020). In some areas, peak values even reach 8.0 cm yr−1 (Ho Tong Minh et al., 2020), which further exacerbates the uncertainty in elevation. Nevertheless, in the presented workflow, the underestimation of CoastalDEM is successfully counteracted with the use of difference plots (cf. details in Sect. 2.3.1), through which only additional water levels (in excess of the normal conditions) are considered actual flooding. Backed up by the model calibration and validation, the joint use of the final (corrected) DEM and the difference plots delivers flood simulations that successfully reproduce known inundation hotspots in HCMC.
4.2 Sensitivity of boundary conditions
In terms of the roughness coefficient, the optimal value determined through model calibration matches the value of a more recent study by Beretta et al. (2018), who concluded that using a value of 0.10 in the absence of buildings had flood results similar to incorporating those elements. This reinforces the idea that replacing buildings with a higher (macro-)roughness coefficient could account for the obstruction effect seen during urban floods when only coarse elevation data are available. However, another method that was implemented by Taubenböck et al. (2009) and Schlurmann et al. (2010) lies in the usage of a building mask within the DEM as a replacement to mimic infrastructure footprints, thereby limiting flood flow dynamics to residual open spaces. Although this method may prove useful in the case of the resolution of the DEM being 10 m or higher, it might not be easily implemented at DEM resolutions of 30 m or coarser. In the present case, the elevated roughness coefficient offers an adequate solution to this problem that does not substantially alter the maximum flood depths and durations, especially when considering that buildings themselves are not impermeable yet basements can get flooded during rain events (Sandink, 2016).
Looking at the tidal data, the case of HCMC reveals a particular shortcoming of the proposed methodology, namely the temporal phase shift between the tidal time series at Vung Tau and Nha Be cannot be determined from one data set alone. However, it can be assumed that this relatively small phase shift (1.8 h in this case) has a negligible impact when investigating flooding or backwater effects during storm events given that the phase shift between the start of a rain event and high tidal water can be of much greater importance. Accordingly, sensitivity analyses have to show the worst-case scenario for each particular setting anyway.
Comparing the open-access daily precipitation time series with the official hourly precipitation time series at the Tan Son Hoa weather station shows a certain discrepancy between the two data sets, which becomes evident when comparing yearly mean values (94.7 mm vs. 104.3 mm) and standard deviations (69.13 mm vs. 40.64 mm) of the daily maxima, respectively. While the differences are reasonable especially for return periods of 5 years and less, the effect of this discrepancy, driven mainly by the big difference in the standard deviation, is accentuated for higher return period intensities. As for the temporal scaling factor β, the fitting to the hourly precipitation data reveals that β decreases with increasing return periods where a value of 0.858 corroborates the average calculated through literature. Taking into account the variation in β relative to the return period improved the goodness of fit for the temporal scaling function. However, it was not sufficient to offset the discrepancy between the two data series.
4.3 Significance of modeling results
In regards to the validation and calibration data, it is a well-known problem that reliable measurements of flood depth and extent during urban floods are hard to acquire (Wang et al., 2018). This study could fortunately rely on reported inundation depths and locations across HCMC that were provided by local partners. To remedy this limitation, it could be argued that existing surveillance cameras throughout cities could be used to monitor time-varying water levels during flooding (Muhadi et al., 2021), which can be done either manually (Liu et al., 2015) or automatically (Moy de Vitry et al., 2019; Feng et al., 2020), providing crucial validation data that could go a long way in helping urban flood models to become more accurate without additional costs. Furthermore, user-generated images can also offer an additional way of quantifying flooding (Ahmad et al., 2018), whose acquisition became much easier with the proliferation of social media (Chaudhary et al., 2020).
Open-access data do not usually offer the detail required to build models to estimate flood damage, which typically require extensive data, whose acquisition is oftentimes laborious and prohibitively costly. The INFS, presented in Sect. 2.3.2, combines flood depth and duration from a hydro-numerical model that may further be used as input of flood damage models. The comparison with inundation hotspots across HCMC, as documented by local partners, proved the usefulness of this indicator in estimating concentrated flood risk. Equal weighting was given for both flood depth and duration to ensure that the results are not biased, especially considering the lack of additional data clarifying whether flood depth or duration plays a bigger role in damage for a particular location. This weighting can be different depending on the case and the local composition of flood damage. Future users are, of course, free to change the weighting and adapt it to a specific use case.
One limitation of the INFS can be seen in the exclusion of flow velocity, which was shown to play a significant role in pedestrian casualties (Musolino et al., 2020). However, quantifying this component can only be done through highly resolved flood models for particular city districts where flow obstacles can be accurately represented. Furthermore, flow velocity demonstrably plays a secondary role in LECZs where urban or rural terrain is rather flat (Wagenaar et al., 2017; Amadio et al., 2019). In such settings, the impact of flow velocity is rather small when compared to those of flood depth and duration, particularly for estimating monetary loss (Kreibich et al., 2009) and even more so in the rainfall-runoff scheme presented here. Nevertheless, through the proposed methodology, open-access data can be leveraged to determine urban areas with high damage potential where the procurement of highly resolved data for a more detailed flood model is required. In these highly resolved models, even flow velocity can be considered to quantitatively determine the associated risk to pedestrians. Moreover, it can be argued that the INFS lacks the detail as well as the complexity of sophisticated flood damage models that are based on much more extensive and comprehensive data. However, the purpose of the INFS concept and demonstrated application is not to replace established flood damage estimations but rather to complement these by enhancing the basic interpretation of hydro-numerical results through the combination of flood depth and duration. This makes the INFS an effective tool in terms of a first estimation when striving to determine inundation hotspots by robust mathematical models with high damage potential that demand attention in terms of emergency efforts and/or relief. This tool enables stakeholders as well as researchers to narrow down the focus to those areas with the highest damage potential in order to advance adaptation schemes under climate change and its projected impacts to LECZs (Scheiber et al., 2023). Nevertheless, independent studies should apply the normalized flood severity index to other regions with comparable risk settings. The envisaged flood estimates may then be juxtaposed with sophisticated loss calculations, in order to further quantify the sensitivity and scrutinize the robustness of the proposed framework.
Hydro-numerical models are a powerful instrument for understanding the dynamics of urban flooding, assessing areas of exposure (flooding hotspots) and progressing possible mitigation strategies. In many settings, however, essential information about topographic, bathymetric and hydro-meteorological constraints is hard to acquire without substantial costs, rendering independent but trustworthy analyses and evaluation for adaptation measures difficult, especially when such studies are to be done at a wider scale. The present paper addresses this shortcoming and presents a methodology to create a surface runoff model which is capable of producing urban flood estimations for the exemplary case of HCMC, albeit solely based on open data sources according to the FAIR principles (GO FAIR, 2016). The process used to build this schematic yet flexible model can, at least partially, be used to simulate flood drivers in any urban setting. In addition, a newly proposed flood intensity proxy with a two-parametric representation of flood depth and duration, the normalized flood severity index (INFS), is defined as a means of localizing potential flood damage hotspots. The INFS uncovers flooding hotspots in HCMC, whereby 73 % of the more than 300 reported inundations were inside or within 100 m of the spatial extent of the INFS that, in turn, covered only 19 % of the total area of the city. The employed methodology for the model setup alongside the enhancement of the INFS is particularly helpful when trying to localize inundation hotspots where the procurement of highly resolved data for more detailed urban flood modeling is more worthwhile. The findings add to the current research in urban hydrological modeling and flood risk management and exemplify which opportunities lie in the continuously growing amount of freely available data. Finally, it hopefully encourages researchers to make their work accessible and thus contribute to independent and more equal science.
No code was used in this research. Details about the general processing of numerical data are provided in the methods section or can be inquired from the corresponding author.
The presented model setup is completely based on open-access data from third parties, which are clearly referenced in the text. In particular, we combined elevation data from CoastalDEM (https://go.climatecentral.org/coastaldem/; CoastalDEM, 2023) and SRTM (https://www.earthdata.nasa.gov/sensors/srtm; NASA, 2023) and compared it to other global terrain models, such as ALOS (https://doi.org/10.5069/G94M92HB; ALOS, 2016), ASTER (https://doi.org/10.5067/ASTER/ASTGTM.003; ASTER, 2019) and Copernicus DEM (https://doi.org/10.5270/ESA-c5d3d65; ESA, 2019). Moreover, we derived boundary conditions from analyzing time series of precipitation (https://www.ncdc.noaa.gov/cdo-web/; NOAA, 2022) and tidal water levels (https://doi.org/10.7289/v5v40s7w; Caldwell et al., 2015) provided by NOAA. Modeling outputs will be made available in a decision support tool in the context of the research project DECIDER (https://www.decider-project.org; DECIDER project, 2023). All other data can be requested from the corresponding author.
The supplement related to this article is available online at: https://doi.org/10.5194/nhess-23-2313-2023-supplement.
LS, MHJ and CJ developed the methodology for acquiring, processing and comparing the open-access data, which was then executed by MHJ. LS, MHJ and JV designed the hydro-numerical model finally set up and operated by MHJ. HQN provided the hydro-meteorological data required for validation. LS and MHJ developed the normalized flood severity index. LS and MHJ developed the underlying paper concept. MHJ and LS wrote the initial manuscript, while CJ, JV, HQN and TS edited and contributed to the final text. LS and MHJ contributed to the visualization of the results. JV and TS (co-)designed the overarching research project, were responsible for funding resources and provided guidance throughout the entire study.
The contact author has declared that none of the authors has any competing interests.
Publisher’s note: Copernicus Publications remains neutral with regard to jurisdictional claims in published maps and institutional affiliations.
This article is part of the special issue “Future risk and adaptation in coastal cities”. It is not associated with a conference.
The authors wish to express their gratitude towards Nguyen Quy from EPT Environment & Target Public Ltd for providing us with the locations and depths of reported inundations across a variety of flood events in Ho Chi Minh City that were necessary for the model validation. Moreover, sincere thanks go to both the editor at NHESS for handling the paper and four anonymous reviewers for their helpful comments.
This research has received funding from the DECIDER project sponsored by the German Federal Ministry of Education and Research (BMBF; grant no. 01LZ1703H).
This paper was edited by Liang Emlyn Yang and reviewed by four anonymous referees.
ADB: Ho Chi Minh City – Adaptation to Climate Change: Summary Report, Asian Development Bank, Manila, the Philippines, 1–36 pp., ISBN 978-971-561-893-9, 2010.
Ahmad, K., Sohail, A., Conci, N., and de Natale, F.: A Comparative Study of Global and Deep Features for the Analysis of User-Generated Natural Disaster Related Images, in: 2018 IEEE 13th Image, Video, and Multidimensional Signal Processing Workshop (IVMSP), Aristi Village, Zagorochoria, Greece, 6 October–6 December 2018, 1–5, https://doi.org/10.1109/IVMSPW.2018.8448670, 2018.
ALOS: OpenTopography: ALOS World 3D – 30 m [data set], https://doi.org/10.5069/G94M92HB, 2016.
Amadio, M., Scorzini, A. R., Carisi, F., Essenfelder, A. H., Domeneghetti, A., Mysiak, J., and Castellarin, A.: Testing empirical and synthetic flood damage models: the case of Italy, Nat. Hazards Earth Syst. Sci., 19, 661–678, https://doi.org/10.5194/nhess-19-661-2019, 2019.
Andimuthu, R., Kandasamy, P., Mudgal, B. V., Jeganathan, A., Balu, A., and Sankar, G.: Performance of urban storm drainage network under changing climate scenarios: Flood mitigation in Indian coastal city, Sci. Rep., 9, 7783, https://doi.org/10.1038/s41598-019-43859-3, 2019.
Andreadis, K. M., Schumann, G. J.-P., and Pavelsky, T.: A simple global river bankfull width and depth database, Water Resour. Res., 49, 7164–7168, https://doi.org/10.1002/wrcr.20440, 2013.
Ansari, R. A. and Buddhiraju, K. M.: Noise Filtering in High-Resolution Satellite Images Using Composite Multiresolution Transforms, PFG, 86, 249–261, https://doi.org/10.1007/s41064-019-00061-4, 2018.
ASTER: ASTER Global Digital Elevation Model V003, NASA Earth Data [data set], https://doi.org/10.5067/ASTER/ASTGTM.003, 2019.
Balbastre-Soldevila, R., García-Bartual, R., and Andrés-Doménech, I.: A Comparison of Design Storms for Urban Drainage System Applications, Water, 11, 757, https://doi.org/10.3390/w11040757, 2019.
Barragán, J. M. and de Andrés, M.: Analysis and trends of the world's coastal cities and agglomerations, Ocean Coast. Manage., 114, 11–20, https://doi.org/10.1016/j.ocecoaman.2015.06.004, 2015.
Becek, K.: Assessing Global Digital Elevation Models Using the Runway Method: The Advanced Spaceborne Thermal Emission and Reflection Radiometer Versus the Shuttle Radar Topography Mission Case, IEEE Trans. Geosci. Remote Sensing, 52, 4823–4831, https://doi.org/10.1109/TGRS.2013.2285187, 2014.
Ben Nhge Port Company Ltd.: Overview, Geographic Location, Ben Nghe Port Company Ltd., http://www.benngheport.com/about-us/overview.html (last access: 22 July 2022), 2014.
Beretta, R., Ravazzani, G., Maiorano, C., and Mancini, M.: Simulating the Influence of Buildings on Flood Inundation in Urban Areas, Geosciences, 8, 77, https://doi.org/10.3390/geosciences8020077, 2018.
Beven, K. J.: Rainfall-Runoff Modelling: The Primer, John Wiley & Sons, https://doi.org/10.1002/9781119951001, 2011.
Bright, E., Coleman, P., Rose, A., and Urban, M.: Landscan 2010, https://landscan.ornl.gov (last access: 10 June 2023), 2011.
Brown, S., Nicholls, R. J., Lowe, J. A., and Hinkel, J.: Spatial variations of sea-level rise and impacts: An application of DIVA, Clim. Change, 134, 403–416, https://doi.org/10.1007/s10584-013-0925-y, 2016.
Caldwell, P., Merrifield, M., and Thompson, P.: Sea level measured by tide gauges from global oceans – the Joint Archive for Sea Level holdings (NCEI Accession 0019568), Version 5.5, NOAA National Centers for Environmental Information [data set], https://doi.org/10.7289/v5v40s7w, 2015.
Camenen, B., Gratiot, N., Cohard, J.-A., Gard, F., Tran, V. Q., Nguyen, A.-T., Dramais, G., van Emmerik, T., and Némery, J.: Monitoring discharge in a tidal river using water level observations: Application to the Saigon River, Vietnam, The Sci. Total Environ., 761, 143195, https://doi.org/10.1016/j.scitotenv.2020.143195, 2021.
Chaudhary, P., D'Aronco, S., Leitão, J. P., Schindler, K., and Wegner, J. D.: Water level prediction from social media images with a multi-task ranking approach, ISPRS J. Photogramm., 167, 252–262, https://doi.org/10.1016/j.isprsjprs.2020.07.003, 2020.
Chen, A. S., Evans, B., Djordjević, S., and Savić, D. A.: A coarse-grid approach to representing building blockage effects in 2D urban flood modelling, J. Hydrol., 426–427, 1–16, https://doi.org/10.1016/j.jhydrol.2012.01.007, 2012.
Chu, T. and Lindenschmidt, K.-E.: Comparison and Validation of Digital Elevation Models Derived from InSAR for a Flat Inland Delta in the High Latitudes of Northern Canada, Can. J. Remote Sens., 43, 109–123, https://doi.org/10.1080/07038992.2017.1286936, 2017.
CoastalDEM: CoastalDEM®: New v2.1 release provides even better elevation data for flood risk assessment [data set], https://go.climatecentral.org/coastaldem/, last access: 20 June 2023.
ESA: Copernicus DEM – Global and European Digital Elevation Model (COP-DEM), Version 1, European Space Agency (ESA), https://doi.org/10.5270/ESA-c5d3d65, 2019.
Crameri, F.: Scientific colour maps, Zenodo, https://doi.org/10.5281/zenodo.5501399, 2021.
Dasallas, L., An, H., and Lee, S.: Developing an integrated multiscale rainfall-runoff and inundation model: Application to an extreme rainfall event in Marikina-Pasig River Basin, Philippines, J. Hydrol.-Reg. Stud., 39, 100995, https://doi.org/10.1016/j.ejrh.2022.100995, 2022.
Debusscher, B., Landuyt, L., and van Coillie, F.: A Visualization Tool for Flood Dynamics Monitoring Using a Graph-Based Approach, Remote Sens., 12, 2118, https://doi.org/10.3390/rs12132118, 2020.
DECIDER project: Decisions for the Design of Adaptation Pathways and the Integrative Development, Evaluation and Governance of Flood Risk Mitigation Strategies in Changing Urban-rural Systems (DECIDER) [data set], https://www.decider-project.org (last access: 20 June 2023), 2023.
Di Baldassarre, G. and Uhlenbrook, S.: Is the current flood of data enough? A treatise on research needs for the improvement of flood modelling, Hydrol. Process., 26, 153–158, https://doi.org/10.1002/hyp.8226, 2012.
Doocy, S., Daniels, A., Murray, S., and Kirsch, T. D.: The human impact of floods: a historical review of events 1980–2009 and systematic literature review, PLoS Curr., 5, PubMed-ID: 23857425, 1–27 pp., 2013.
Duffy, C. E., Braun, A., and Hochschild, V.: Surface Subsidence in Urbanized Coastal Areas: PSI Methods Based on Sentinel-1 for Ho Chi Minh City, Remote Sens., 12, 4130, https://doi.org/10.3390/rs12244130, 2020.
Dyck, S.: Angewandte Hydrologie, Teil 2: Der Wasserhaushalt der Fußgebiete, 2nd printing, Verlag für Bauwesen, Berlin, 1980.
Ekeu-wei, I. T. and Blackburn, G. A.: Catchment-Scale Flood Modelling in Data-Sparse Regions Using Open-Access Geospatial Technology, IJGI, 9, 512, https://doi.org/10.3390/ijgi9090512, 2020.
Farr, T. G., Rosen, P. A., Caro, E., Crippen, R., Duren, R., Hensley, S., Kobrick, M., Paller, M., Rodriguez, E., Roth, L., Seal, D., Shaffer, S., Shimada, J., Umland, J., Werner, M., Oskin, M., Burbank, D., and Alsdorf, D.: The Shuttle Radar Topography Mission, Rev. Geophys., 45, RG2004/2007, https://doi.org/10.1029/2005RG000183, 2007.
Feng, Y., Brubaker, K. L., and McCuen, R. H.: New View of Flood Frequency Incorporating Duration, J. Hydrol. Eng., 22, 4017051, https://doi.org/10.1061/(ASCE)HE.1943-5584.0001573, 2017.
Feng, Y., Brenner, C., and Sester, M.: Flood severity mapping from Volunteered Geographic Information by interpreting water level from images containing people: A case study of Hurricane Harvey, ISPRS J. Photogramm., 169, 301–319, https://doi.org/10.1016/j.isprsjprs.2020.09.011, 2020.
FIM: Ho Chi Minh City Flood and Inundation Management, Final report, volume 2: IFRM strategy annex 1: Analysis of flood and inundation hazards, Ho Chi Minh City, Vietnam, Internal Report, 2013.
Gallien, T. W., Schubert, J. E., and Sanders, B. F.: Predicting tidal flooding of urbanized embayments: A modeling framework and data requirements, Coast. Eng., 58, 567–577, https://doi.org/10.1016/j.coastaleng.2011.01.011, 2011.
GO FAIR: Fair Principles, https://www.go-fair.org/fair-principles/ (last access: 15 September 2022), 2016.
Guan, M., Guo, K., Yan, H., and Wright, N.: Bottom-up multilevel flood hazard mapping by integrated inundation modelling in data scarce cities, J. Hydrol., 617, 129114, https://doi.org/10.1016/j.jhydrol.2023.129114, 2023.
Gugliotta, M., Saito, Y., Ta, T. K. O., van Nguyen, L., Uehara, K., Tamura, T., Nakashima, R., and Lieu, K. P.: Sediment distribution along the fluvial to marine transition zone of the Dong Nai River System, southern Vietnam, Mar. Geol., 429, 106314, https://doi.org/10.1016/j.margeo.2020.106314, 2020.
Hallegatte, S., Green, C., Nicholls, R. J., and Corfee-Morlot, J.: Future flood losses in major coastal cities, Nat. Clim. Change, 3, 802–806, https://doi.org/10.1038/nclimate1979, 2013.
Hamel, P. and Tan, L.: Blue-Green Infrastructure for Flood and Water Quality Management in Southeast Asia: Evidence and Knowledge Gaps, Environ. Manage., 1–20, https://doi.org/10.1007/s00267-021-01467-w, 2021.
Hansen, A.: The Three Extreme Value Distributions: An Introductory Review, Front. Phys., 8, 604053, https://doi.org/10.3389/fphy.2020.604053, 2020.
Hanson, S., Nicholls, R., Ranger, N., Hallegatte, S., Corfee-Morlot, J., Herweijer, C., and Chateau, J.: A global ranking of port cities with high exposure to climate extremes, Clim. Change, 104, 89–111, https://doi.org/10.1007/s10584-010-9977-4, 2011.
Hawker, L., Bates, P., Neal, J., and Rougier, J.: Perspectives on Digital Elevation Model (DEM) Simulation for Flood Modeling in the Absence of a High-Accuracy Open Access Global DEM, Front. Earth Sci., 6, https://doi.org/10.3389/feart.2018.00233, 2018.
Hawker, L., Uhe, P., Paulo, L., Sosa, J., Savage, J., Sampson, C., and Neal, J.: A 30 m global map of elevation with forests and buildings removed, Environ. Res. Lett., 17, 24016, https://doi.org/10.1088/1748-9326/ac4d4f, 2022.
Hejl, L.: A Method for adjusting values of Manning's Roughness Coefficient for flooded urban areas, J. Res. U.S. Geol. Survey, 5, 541–545, 1977.
Hong, H., Tsangaratos, P., Ilia, I., Liu, J., Zhu, A.-X., and Chen, W.: Application of fuzzy weight of evidence and data mining techniques in construction of flood susceptibility map of Poyang County, China, The Sci. Total Environ., 625, 575–588, https://doi.org/10.1016/j.scitotenv.2017.12.256, 2018.
Ho Tong Minh, D., Ngo, Y.-N., Lê, T. T., Le, T. C., Bui, H. S., Vuong, Q. V., and Le Toan, T.: Quantifying Horizontal and Vertical Movements in Ho Chi Minh City by Sentinel-1 Radar Interferometry, https://www.preprints.org/manuscript/202012.0382/v2 (last access: 11 June 2023), Preprint, 2020.
Hu, Z., Peng, J., Hou, Y., and Shan, J.: Evaluation of Recently Released Open Global Digital Elevation Models of Hubei, China, Remote Sens., 9, 262, https://doi.org/10.3390/rs9030262, 2017.
Huong, H. T. L. and Pathirana, A.: Urbanization and climate change impacts on future urban flooding in Can Tho city, Vietnam, Hydrol. Earth Syst. Sci., 17, 379–394, https://doi.org/10.5194/hess-17-379-2013, 2013.
IGES: Sustainable Groundwater Management in Asian Cities: A final report of Research on Sustainable Water Management Policy, ISBN 4-88788-039-9, 69–71 pp., 2007.
Intermap: NextMap World 10, https://www.intermap.com/data/nextmap (last access: 13 January 2023), 2018.
IPCC: Climate Change 2022: Impacts, Adaptation, and Vulnerability: Contribution of Working Group II to the Sixth Assessment Report of the Intergovernmental Panel on Climate Change, edited by: Pörtner, H.-O., Roberts, D. C., Tignor, M., Poloczanska, E. S., Mintenbeck, K., Alegría, A., Craig, M., Langsdorf, S., Löschke, S., Möller, V., Okem, A., and Rama, B., Cambridge University Press, Cambridge, UK and New York, NY, USA, https://doi.org/10.1017/9781009325844, 1–3068 pp., 2022.
Ismail, M. S. N., Ghani, A. N. A., Ghazaly, Z. M., and Dafalla, M.: A study on the effect of flooding depths and duration on soil subgrade performance and stability, Int. J. Geotech., Construction Material and Environment (GEOMATE), 19, 182–187, https://doi.org/10.21660/2020.71.9336, 2020.
Jarihani, A. A., Callow, J. N., McVicar, T. R., van Niel, T. G., and Larsen, J. R.: Satellite-derived Digital Elevation Model (DEM) selection, preparation and correction for hydrodynamic modelling in large, low-gradient and data-sparse catchments, J. Hydrol., 524, 489–506, https://doi.org/10.1016/j.jhydrol.2015.02.049, 2015.
JICA: Detailed Design Study on HCMC Water Environment Improvement Project (Final Report), Japan International Cooperation Agency, Ho Chi Minh City, https://openjicareport.jica.go.jp/pdf/11650298.pdf (last access: 13 June 2023), 1–48 pp., 2001.
Khiem, M. V., Minh, H. T., and Linh, L. N.: Impact of Climate Change on Intensity-Duration-Frequency Curves in Ho Chi Minh City, J. Clim. Change Sci., (last access: 13 January 2023), 40–46 pp., 2017.
Kim, D., Sun, Y., Wendi, D., Jiang, Z., Liong, S.-Y., and Gourbesville, P.: Flood Modelling Framework for Kuching City, Malaysia: Overcoming the Lack of Data, Advances in Hydroinformatics, Springer Singapore, 559–568, 559–568, https://doi.org/10.1007/978-981-10-7218-5_39, 2018.
Kim, D.-E., Gourbesville, P., and Liong, S.-Y.: Overcoming data scarcity in flood hazard assessment using remote sensing and artificial neural network, Smart Water, 4, 2, https://doi.org/10.1186/s40713-018-0014-5, 2019.
Koks, E. E., Bočkarjova, M., de Moel, H., and Aerts, J. C. J. H.: Integrated Direct and Indirect Flood Risk Modeling: Development and Sensitivity Analysis, Risk analysis an official publication of the Society for Risk Analysis, 35, 882–900, https://doi.org/10.1111/risa.12300, 2015.
Kontgis, C., Schneider, A., Fox, J., Saksena, S., Spencer, J. H., and Castrence, M.: Monitoring peri-urbanization in the greater Ho Chi Minh City metropolitan area, Appl. Geogr., 53, 377–388, https://doi.org/10.1016/j.apgeog.2014.06.029, 2014.
Kreibich, H., Piroth, K., Seifert, I., Maiwald, H., Kunert, U., Schwarz, J., Merz, B., and Thieken, A. H.: Is flow velocity a significant parameter in flood damage modelling?, Nat. Hazards Earth Syst. Sci., 9, 1679–1692, https://doi.org/10.5194/nhess-9-1679-2009, 2009.
Kreibich, H., van Loon, A. F., Schröter, K., Ward, P. J., Mazzoleni, M., Sairam, N., Abeshu, G. W., Agafonova, S., AghaKouchak, A., Aksoy, H., Alvarez-Garreton, C., Aznar, B., Balkhi, L., Barendrecht, M. H., Biancamaria, S., Bos-Burgering, L., Bradley, C., Budiyono, Y., Buytaert, W., Capewell, L., Carlson, H., Cavus, Y., Couasnon, A., Coxon, G., Daliakopoulos, I., Ruiter, M. C. de, Delus, C., Erfurt, M., Esposito, G., François, D., Frappart, F., Freer, J., Frolova, N., Gain, A. K., Grillakis, M., Grima, J. O., Guzmán, D. A., Huning, L. S., Ionita, M., Kharlamov, M., Khoi, D. N., Kieboom, N., Kireeva, M., Koutroulis, A., Lavado-Casimiro, W., Li, H.-Y., LLasat, M. C., Macdonald, D., Mård, J., Mathew-Richards, H., McKenzie, A., Mejia, A., Mendiondo, E. M., Mens, M., Mobini, S., Mohor, G. S., Nagavciuc, V., Ngo-Duc, T., Thao Nguyen Huynh, T., Nhi, P. T. T., Petrucci, O., Nguyen, H. Q., Quintana-Seguí, P., Razavi, S., Ridolfi, E., Riegel, J., Sadik, M. S., Savelli, E., Sazonov, A., Sharma, S., Sörensen, J., Arguello Souza, F. A., Stahl, K., Steinhausen, M., Stoelzle, M., Szalińska, W., Tang, Q., Tian, F., Tokarczyk, T., Tovar, C., van Tran, T. T., van Huijgevoort, M. H. J., van Vliet, M. T. H., Vorogushyn, S., Wagener, T., Wang, Y., Wendt, D. E., Wickham, E., Yang, L., Zambrano-Bigiarini, M., Blöschl, G., and Di Baldassarre, G.: The challenge of unprecedented floods and droughts in risk management, Nature, 608, 80–86, https://doi.org/10.1038/s41586-022-04917-5, 2022.
Kulp, S. A. and Strauss, B. H.: CoastalDEM: A global coastal digital elevation model improved from SRTM using a neural network, Remote Sens. Environ., 206, 231–239, https://doi.org/10.1016/j.rse.2017.12.026, 2018.
Kulp, S. A. and Strauss, B. H.: New elevation data triple estimates of global vulnerability to sea-level rise and coastal flooding, Nat. Commun., 10, 4844, https://doi.org/10.1038/s41467-019-12808-z, 2019.
LaLonde, T., Shortridge, A., and Messina, J.: The Influence of Land Cover on Shuttle Radar Topography Mission (SRTM) Elevations in Low-relief Areas, Trans. GIS, 14, 461–479, https://doi.org/10.1111/j.1467-9671.2010.01217.x, 2010.
Le Binh, T. H., Umamahesh, N. V., and Rathnam, E. V.: High-resolution flood hazard mapping based on nonstationary frequency analysis: case study of Ho Chi Minh City, Vietnam, Hydrol. Sci. J., 64, 318–335, https://doi.org/10.1080/02626667.2019.1581363, 2019.
Le Dung, T., Le Phu, V., Lan, N. H. M., Tien, N. T. C., and Hiep, L. D.: Sustainable Urban Drainage System Model for The Nhieu Loc – Thi Nghe Basin, Ho Chi Minh City, IOP Conf. Ser.: Earth Environ. Sci., 652, 12012, https://doi.org/10.1088/1755-1315/652/1/012012, 2021.
Lindsay, J. B.: Efficient hybrid breaching-filling sink removal methods for flow path enforcement in digital elevation models, Hydrol. Process., 30, 846–857, https://doi.org/10.1002/hyp.10648, 2016.
Liu, J., Shao, W., Xiang, C., Mei, C., and Li, Z.: Uncertainties of urban flood modeling: Influence of parameters for different underlying surfaces, Environ. Res., 182, 108929, https://doi.org/10.1016/j.envres.2019.108929, 2020.
Liu, L., Liu, Y., Wang, X., Yu, D., Liu, K., Huang, H., and Hu, G.: Developing an effective 2-D urban flood inundation model for city emergency management based on cellular automata, Nat. Hazards Earth Syst. Sci., 15, 381–391, https://doi.org/10.5194/nhess-15-381-2015, 2015.
Loc, H. H., Babel, M. S., Weesakul, S., Irvine, K., and Duyen, P.: Exploratory Assessment of SUDS Feasibility in Nhieu Loc-Thi Nghe Basin, Ho Chi Minh City, Vietnam, British J. Environ. Clim. Change, 5, 91–103, https://doi.org/10.9734/BJECC/2015/11534, 2015.
Meesuk, V., Vojinovic, Z., Mynett, A. E., and Abdullah, A. F.: Urban flood modelling combining top-view LiDAR data with ground-view SfM observations, Adv. Water Resour., 75, 105–117, https://doi.org/10.1016/j.advwatres.2014.11.008, 2015.
Mehta, D. J., Eslamian, S., and Prajapati, K.: Flood modelling for a data-scare semi-arid region using 1-D hydrodynamic model: a case study of Navsari Region, Model. Earth Syst. Environ., 8, 2675–2685, https://doi.org/10.1007/s40808-021-01259-5, 2022.
Menabde, M., Seed, A., and Pegram, G.: A simple scaling model for extreme rainfall, Water Resour. Res., 35, 335–339, https://doi.org/10.1029/1998WR900012, 1999.
Miedema, F.: Open Science: the Very Idea, Springer Netherlands, Dordrecht, https://doi.org/10.1007/978-94-024-2115-6, XXII, 1–247 pp., 2022.
Minderhoud, P. S. J., Coumou, L., Erkens, G., Middelkoop, H., and Stouthamer, E.: Mekong delta much lower than previously assumed in sea-level rise impact assessments, Nat. Commun., 10, 3847, https://doi.org/10.1038/s41467-019-11602-1, 2019.
Molinari, D., Menoni, S., Aronica, G. T., Ballio, F., Berni, N., Pandolfo, C., Stelluti, M., and Minucci, G.: Ex post damage assessment: an Italian experience, Nat. Hazards Earth Syst. Sci., 14, 901–916, https://doi.org/10.5194/nhess-14-901-2014, 2014.
Mons, B., Neylon, C., Velterop, J., Dumontier, M., Da Silva Santos, L. O. B., and Wilkinson, M. D.: Cloudy, increasingly FAIR; revisiting the FAIR Data guiding principles for the European Open Science Cloud, ISU, 37, 49–56, https://doi.org/10.3233/ISU-170824, 2017.
Moramarco, T., Barbetta, S., Bjerklie, D. M., Fulton, J. W., and Tarpanelli, A.: River Bathymetry Estimate and Discharge Assessment from Remote Sensing, Water Resour. Res., 55, 6692–6711, https://doi.org/10.1029/2018WR024220, 2019.
Moy de Vitry, M., Kramer, S., Wegner, J. D., and Leitão, J. P.: Scalable flood level trend monitoring with surveillance cameras using a deep convolutional neural network, Hydrol. Earth Syst. Sci., 23, 4621–4634, https://doi.org/10.5194/hess-23-4621-2019, 2019.
Muhadi, N. A., Abdullah, A. F., Bejo, S. K., Mahadi, M. R., and Mijic, A.: Deep Learning Semantic Segmentation for Water Level Estimation Using Surveillance Camera, Appl. Sci., 11, 9691, https://doi.org/10.3390/app11209691, 2021.
Musolino, G., Ahmadian, R., Xia, J., and Falconer, R. A.: Mapping the danger to life in flash flood events adopting a mechanics based methodology and planning evacuation routes, J. Flood Risk Manage., 13, https://doi.org/10.1111/jfr3.12627, 2020.
NASA: Shuttle Radar Topography Mission (SRTM), NASA Earth Data [data set], https://www.earthdata.nasa.gov/sensors/srtm, last access: 20 June, 2023.
Neal, J., Schumann, G., and Bates, P.: A subgrid channel model for simulating river hydraulics and floodplain inundation over large and data sparse areas, Water Resour. Res., 48, W11506, https://doi.org/10.1029/2012WR012514, 2012.
Nguyen, H. Q., Radhakrishnan, M., Bui, T. K. N., Tran, D. D., Ho, L. P., Tong, V. T., Huynh, L. T. P., Chau, N. X. Q., Ngo, T. T. T., Pathirana, A., and Ho, H. L.: Evaluation of retrofitting responses to urban flood risk in Ho Chi Minh City using the Motivation and Ability (MOTA) framework, Sustain. Cities Soc., 47, 101465, https://doi.org/10.1016/j.scs.2019.101465, 2019.
Nguyen, Q. T.: The Main Causes of Land Subsidence in Ho Chi Minh City, Proc. Eng., 142, 334–341, https://doi.org/10.1016/j.proeng.2016.02.058, 2016.
Nhat, L. M., Tachikawa, Y., and Takara, K.: Establishment of Intensity-Duration-Frequency Curves for Precipitation in the Monsoon Area of Vietnam, Annuals of Disas. Prev. Res. Inst., 93–103, 2006.
Nkwunonwo, U. C., Whitworth, M., and Baily, B.: A review of the current status of flood modelling for urban flood risk management in the developing countries, Sci. African, 7, e00269, https://doi.org/10.1016/j.sciaf.2020.e00269, 2020.
NOAA: Climate Data Online, NOAA [data set], https://www.ncdc.noaa.gov/cdo-web/ (last access: 14 September 2022), 2022.
O'Hara, R., Green, S., and McCarthy, T.: The agricultural impact of the 2015–2016 floods in Ireland as mapped through Sentinel 1 satellite imagery, Irish J. Agr. Food Res., 58, 44–65, https://doi.org/10.2478/ijafr-2019-0006, 2019.
Ozdemir, H., Sampson, C. C., de Almeida, G. A. M., and Bates, P. D.: Evaluating scale and roughness effects in urban flood modelling using terrestrial LIDAR data, Hydrol. Earth Syst. Sci., 17, 4015–4030, https://doi.org/10.5194/hess-17-4015-2013, 2013.
Pandya, U., Patel, D. P., and Singh, S. K.: A flood assessment of data scarce region using an open-source 2D hydrodynamic modeling and Google Earth Image: a case of Sabarmati flood, India, Arab. J. Geosci., 14, 2200, https://doi.org/10.1007/s12517-021-08504-2, 2021.
Patro, S., Chatterjee, C., Singh, R., and Raghuwanshi, N. S.: Hydrodynamic modelling of a large flood-prone river system in India with limited data, Hydrol. Process., 23, 2774–2791, https://doi.org/10.1002/hyp.7375, 2009.
Phung, P.: Climate change adaptation planning under uncertainty in Ho Chi Minh City, Vietnam: a case study on institutional vulnerability, adaptive capacity and climate change governance, PhD, Planning and Stransport, University of Westminster, Westminster, https://westminsterresearch.westminster.ac.uk/ (last access: 13 June 2023), 1–323 pp., 2016.
Planet Observer: PlanetDEM 30 Plus, Planet Observer [data set], https://www.planetobserver.com/global-elevation-data (last access: 13 June 2023), 2017.
Quan, N. H., Hieu, N. D., van Thu, T. T., Buchanan, M., Canh, N. D., da Cunha Oliveira Santos, M., Luan, P. D. M. H., Hoang, T. T., Phung, H. L. T., Canh, K. M., and Smith, M.: Green Infrastructure Modelling for Assessment of Urban Flood Reduction in Ho Chi Minh city, in: CIGOS 2019, Innovation for Sustainable Infrastructure, edited by: Ha-Minh, C., van Dao, D., Benboudjema, F., Derrible, S., Huynh, D. V. K., and Tang, A. M., Springer Singapore, Singapore, 1105–1110, https://doi.org/10.1007/978-981-15-0802-8_177, 2020.
Quân, N. T., Nhi, P. T. T., and Khôi, D. N.: Xây dụng du'òng cong IDF mu'a c'c doan cho trm Tân So'n Hòa giai don 1980–2015 (in Vietnamese), Tap chi phat trien khoa hoc va cong nghe, https://www.researchgate.net/profile/Quan-Nguyen-74 (last access: 13 January 2023), 73–81 pp., 2017.
Rättich, M., Martinis, S., and Wieland, M.: Automatic Flood Duration Estimation Based on Multi-Sensor Satellite Data, Remote Sens., 12, 643, https://doi.org/10.3390/rs12040643, 2020.
René, J.-R., Djordjević, S., Butler, D., Madsen, H., and Mark, O.: Assessing the potential for real-time urban flood forecasting based on a worldwide survey on data availability, Urban Water J., 11, 573–583, https://doi.org/10.1080/1573062X.2013.795237, 2014.
Rexer, M. and Hirt, C.: Comparison of free high resolution digital elevation data sets (ASTER GDEM2, SRTM v2.1/v4.1) and validation against accurate heights from the Australian National Gravity Database, Aust. J. Earth Sci., 61, 213–226, https://doi.org/10.1080/08120099.2014.884983, 2014.
Saigon Port Joint Stock Company: Port Information, Saigon Port Joint Stock Company, http://csg.com.vn/thong-tin/ha-tang-trang-thiet-bi (last access: 22 July 2022), 2019.
Sampson, C. C., Smith, A. M., Bates, P. D., Neal, J. C., and Trigg, M. A.: Perspectives on Open Access High Resolution Digital Elevation Models to Produce Global Flood Hazard Layers, Front. Earth Sci., 3, 85, https://doi.org/10.3389/feart.2015.00085, 2016.
Sandbach, S. D., Nicholas, A. P., Ashworth, P. J., Best, J. L., Keevil, C. E., Parsons, D. R., Prokocki, E. W., and Simpson, C. J.: Hydrodynamic modelling of tidal-fluvial flows in a large river estuary, Estuarine, Coastal Shelf Sci., 212, 176–188, https://doi.org/10.1016/j.ecss.2018.06.023, 2018.
Sanders, B. F.: Evaluation of on-line DEMs for flood inundation modeling, Adv. Water Resour., 30, 1831–1843, https://doi.org/10.1016/j.advwatres.2007.02.005, 2007.
Sandink, D.: Urban flooding and ground-related homes in Canada: an overview, J. Flood Risk Manage., 9, 208–223, https://doi.org/10.1111/jfr3.12168, 2016.
Scheiber, L., David, C. G., Hoballah Jalloul, M., Visscher, J., Nguyen, H. Q., Leitold, R., Revilla Diez, J., and Schlurmann, T.: Low-regret climate change adaptation in coastal megacities – evaluating large-scale flood protection and small-scale rainwater detention measures for Ho Chi Minh City, Vietnam, Nat. Hazards Earth Syst. Sci., 23, 2333–2347, https://doi.org/10.5194/nhess-23-2333-2023, 2023.
Schellekens, J., Brolsma, R. J., Dahm, R. J., Donchyts, G. V., and Winsemius, H. C.: Rapid setup of hydrological and hydraulic models using OpenStreetMap and the SRTM derived digital elevation model, Environ. Model. Softw., 61, 98–105, https://doi.org/10.1016/j.envsoft.2014.07.006, 2014.
Schlurmann, T., Kongko, W., Goseberg, N., Natawidjaja, D. H., and Sieh, K.: Near-field tsunami hazard map Padang, West Sumatra: Utilizing high resolution geospatial data and reseasonable source scenarios, in: Coastal Engineering Proceedings: Proceedings of the International Conference on Coastal Engineering 32 (ICCE 2010), Management 26, Reston: American Society of Civil Engineers, https://doi.org/10.15488/1839, 2010.
Schumann, G. J.-P. and Bates, P. D.: The Need for a High-Accuracy, Open-Access Global DEM, Front. Earth Sci., 6, 225, https://doi.org/10.3389/feart.2018.00225, 2018.
Schumann, G. J.-P., Bates, P. D., Neal, J. C., and Andreadis, K. M.: Technology: Fight floods on a global scale, Nature, 507, 169, https://doi.org/10.1038/507169e, 2014.
Scussolini, P., van Tran, T. T., Koks, E., Diaz-Loaiza, A., Ho, P. L., and Lasage, R.: Adaptation to Sea Level Rise: A Multidisciplinary Analysis for Ho Chi Minh City, Vietnam, Water Resour. Res., 53, 10841–10857, https://doi.org/10.1002/2017WR021344, 2017.
Selaman, O. S., Said, S., and Ptuhena, F. J.: Flood Frequency Analysis for Sarawak Using Weibull, Grigorten And L-Moments Formula, J. The Inst. Eng., Malaysia, 68, 43–52, 2007.
Shortridge, A. and Messina, J.: Spatial structure and landscape associations of SRTM error, Remote Sens. Environ., 115, 1576–1587, https://doi.org/10.1016/j.rse.2011.02.017, 2011.
Shrestha, B. B., Okazumi, T., Miyamoto, M., and Sawano, H.: Flood damage assessment in the Pampanga river basin of the Philippines, J. Flood Risk Manage., 9, 355–369, https://doi.org/10.1111/jfr3.12174, 2016.
Storch, H.: Exploring the spatial-temporal linkages of climate response and rapid urban growth in Ho Chi Minh City, 47th ISOCARP Congress, 24–28 October 2011, Wuhan, China, http://www.isocarp.net/Data/case_studies/1927.pdf (last access: 13 January 2023), 1–8 pp., 2011.
Takaku, J. and Tadono, T.: Quality updates of “AW3D” global DSM generated from ALOS PRISM, in: 2017 IEEE International Geoscience and Remote Sensing Symposium (IGARSS), Fort Worth, TX, 23–28 July 2017, 5666–5669, 2017.
Tang, J. C. S., Vongvisessomjai, S., and Sahasakmontri, K.: Estimation of flood damage cost for Bangkok, Water Resour. Manage., 6, 47–56, https://doi.org/10.1007/BF00872187, 1992.
Taubenböck, H., Goseberg, N., Setiadi, N., Lämmel, G., Moder, F., Oczipka, M., Klüpfel, H., Wahl, R., Schlurmann, T., Strunz, G., Birkmann, J., Nagel, K., Siegert, F., Lehmann, F., Dech, S., Gress, A., and Klein, R.: ”Last-Mile” preparation for a potential disaster – Interdisciplinary approach towards tsunami early warning and an evacuation information system for the coastal city of Padang, Indonesia, Nat. Hazards Earth Syst. Sci., 9, 1509–1528, https://doi.org/10.5194/nhess-9-1509-2009, 2009.
Thieken, A. H., Müller, M., Kreibich, H., and Merz, B.: Flood damage and influencing factors: New insights from the August 2002 flood in Germany, Water Resour. Res., 41, W12430, https://doi.org/10.1029/2005WR004177, 2005.
Thorne, C. R., Lawson, E. C., Ozawa, C., Hamlin, S. L., and Smith, L. A.: Overcoming uncertainty and barriers to adoption of Blue-Green Infrastructure for urban flood risk management, J.f Flood Risk Manage., 11, S960–S972, https://doi.org/10.1111/jfr3.12218, 2015.
Tighe, M. and Chamberlain, D.: Accuray Comparsion of the SRTM, ASTER, NED, NEXTMAP USA Digital Terrain Model over Several USA Study Sites DEMs, Proceedings of the ASPRS/MAPPS 2009 Fall Conference, 16–19 November 2009, San Antonia, Texas, USA, https://www.asprs.org/a/publications/proceedings/sanantonio09/Tighe_2.pdf (last access: 13 June 2023), 1–12 pp., 2009.
Trameco S. A.: The infrastructure: Wharf and mining equipment, Trameco, http://www.tracomeco.com/10/66/Co-so-ha-tang.aspx (last access: 22 July 2022), 2014.
Tran Ngoc, T. D., Perset, M., Strady, E., Phan, T. S. H., Vachaud, G., Quertamp, F., and Gratiot, N.: Ho Chi Minh City growing with water related challenges, UNESCO, Paris, France, https://horizon.documentation.ird.fr/exl-doc/pleins_textes/divers17-07/010070478.pdf (last access: 13 June 2023), 1–29 pp., 2016.
Trinh, M. X. and Molkenthin, F.: Flood hazard mapping for data-scarce and ungauged coastal river basins using advanced hydrodynamic models, high temporal-spatial resolution remote sensing precipitation data, and satellite imageries, Nat. Hazards, 109, 441–469, https://doi.org/10.1007/s11069-021-04843-1, 2021.
Vernimmen, R., Hooijer, A., and Pronk, M.: New ICESat-2 Satellite LiDAR Data Allow First Global Lowland DTM Suitable for Accurate Coastal Flood Risk Assessment, Remote Sens., 12, 2827, https://doi.org/10.3390/rs12172827, 2020.
Vojinovic, Z. and Tutulic, D.: On the use of 1D and coupled 1D-2D modelling approaches for assessment of flood damage in urban areas, Urban Water J., 6, 183–199, https://doi.org/10.1080/15730620802566877, 2009.
Wagenaar, D. J., de Bruijn, K. M., Bouwer, L. M., and de Moel, H.: Uncertainty in flood damage estimates and its potential effect on investment decisions, Nat. Hazards Earth Syst. Sci., 16, 1–14, https://doi.org/10.5194/nhess-16-1-2016, 2016.
Wagenaar, D., de Jong, J., and Bouwer, L. M.: Multi-variable flood damage modelling with limited data using supervised learning approaches, Nat. Hazards Earth Syst. Sci., 17, 1683–1696, https://doi.org/10.5194/nhess-17-1683-2017, 2017.
Wang, Y., Chen, A. S., Fu, G., Djordjević, S., Zhang, C., and Savić, D. A.: An integrated framework for high-resolution urban flood modelling considering multiple information sources and urban features, Environ. Modell. Softw., 107, 85–95, https://doi.org/10.1016/j.envsoft.2018.06.010, 2018.
Watt, W. E., Chow, K. C. A., Hogg, W. D., and Lathem, K. W.: A 1-h urban design storm for Canada, Can. J. Civ. Eng., 13, 293–300, https://doi.org/10.1139/l86-041, 1986.
Wilkinson, M. D., Dumontier, M., Aalbersberg, I. J. J., Appleton, G., Axton, M., Baak, A., Blomberg, N., Boiten, J.-W., Da Silva Santos, L. B., Bourne, P. E., Bouwman, J., Brookes, A. J., Clark, T., Crosas, M., Dillo, I., Dumon, O., Edmunds, S., Evelo, C. T., Finkers, R., Gonzalez-Beltran, A., Gray, A. J. G., Groth, P., Goble, C., Grethe, J. S., Heringa, J., Hoen, P. A. C. 't, Hooft, R., Kuhn, T., Kok, R., Kok, J., Lusher, S. J., Martone, M. E., Mons, A., Packer, A. L., Persson, B., Rocca-Serra, P., Roos, M., van Schaik, R., Sansone, S.-A., Schultes, E., Sengstag, T., Slater, T., Strawn, G., Swertz, M. A., Thompson, M., van der Lei, J., van Mulligen, E., Velterop, J., Waagmeester, A., Wittenburg, P., Wolstencroft, K., Zhao, J., and Mons, B.: The FAIR Guiding Principles for scientific data management and stewardship, Sci. Data, 3, 160018, https://doi.org/10.1038/sdata.2016.18, 2016.
Yamazaki, D., O'Loughlin, F., Trigg, M. A., Miller, Z. F., Pavelsky, T. M., and Bates, P. D.: Development of the Global Width Database for Large Rivers, Water Resour. Res., 50, 3467–3480, https://doi.org/10.1002/2013WR014664, 2014.
Yan, K., Tarpanelli, A., Balint, G., Moramarco, T., and Di Baldassarre, G.: Exploring the Potential of SRTM Topography and Radar Altimetry to Support Flood Propagation Modeling: Danube Case Study, J. Hydrol. Eng., 20, 4014048, https://doi.org/10.1061/(ASCE)HE.1943-5584.0001018, 2015a.
Yan, K., Di Baldassarre, G., Solomatine, D. P., and Schumann, G. J.-P.: A review of low-cost space-borne data for flood modelling: topography, flood extent and water level, Hydrol. Process., 29, 3368–3387, https://doi.org/10.1002/hyp.10449, 2015b.
Zhao, W., Kinouchi, T., and Nguyen, H. Q.: A framework for projecting future intensity-duration-frequency (IDF) curves based on CORDEX Southeast Asia multi-model simulations: An application for two cities in Southern Vietnam, J. Hydrol., 598, 126461, https://doi.org/10.1016/j.jhydrol.2021.126461, 2021.