the Creative Commons Attribution 4.0 License.
the Creative Commons Attribution 4.0 License.
 | 20 Jan 2023
Scrutinizing and rooting the multiple anomalies of Nepal earthquake sequence in 2015 with the deviation–time–space criterion and homologous lithosphere–coversphere–atmosphere–ionosphere coupling physics
Lixin Wu
Jingchen Lu
Yifan Ding
Boqi Peng
Busheng Xie
The continuous increasing of Earth observations benefits geosciences and seismicity study but increases greatly the difficulties in understanding and discriminating multiple source data. Although the lithosphere–coversphere–atmosphere-ionosphere (LCAI) coupling paradigm and the deviation–time–space (DTS) criterion were presented for better searching for and understanding the potential seismic anomalies from multiple observations, the strict consistency of spatiotemporal characteristics and homologous physics of multiple-parameter seismic anomalies has not been investigated sufficiently. With the 2015 Nepal earthquake sequence being a typical case, the reported multi-parameter anomalies were systematically reviewed, and their space–time characteristics were summarized thoroughly in this study. Numerical simulation with refined geological structures in three-dimensional space revealed the inhomogeneous crustal stress field alteration (CSFA) along the faults and around the hypocenters of the 2015 Nepal earthquake sequence, which is expected to be the root of the seismic anomalies. The stress-activated positive charge carriers would have given rise to different responses near the ground surface (coversphere), including the microwave dielectric reduction, the additional infrared radiation, and the atmospheric ionization, which subsequently affected the physical properties of the atmosphere and the ionosphere and resulted in abnormal phenomena therein. Based on the DTS criterion and LCAI coupling paradigm, the seismic anomalies of the 2015 Nepal earthquakes were scrutinized strictly, and the retained anomalies were rooted carefully to the regional CSFA as well as its local blocking. Therefore, an integrated LCAI coupling framework with strict space–time correspondence and homologous physics in CSFA was proposed for the 2015 Nepal earthquake sequence. This research provides a definite philosophy as well as a practical solution for scrutinizing the rootable seismic anomalies from multi-parameter observations of earthquakes, which is of scientific meanings for searching earthquake precursors and reaching earthquake prediction.
- Article
(8024 KB) - Full-text XML
- BibTeX
- EndNote


Earthquakes are one of the major natural disasters impacting greatly on human life and social development. The geophysical processes of the gestation and occurrence of earthquakes, which are always accompanied by mass migration, energy release, and information exchange (Teng, 2001), are very complicated. Supported by increasing Earth observations, studies on earthquake perception, cognition, and prediction have achieved a lot during the past decades. The information acquisition of seismic/tectonic activity has developed from the ground stations with a limited number, uneven distribution, and discontinuous observation to the satellite platform with wide coverage, all-day, and all-weather capability (Shen et al., 2007; Shen, 2016; Jing et al., 2008). The continuous enrichment of satellite missions and enhancement of observation capability have given rise to the huge increment of data and information of seismicity and provided great possibility for searching seismic anomalies and earthquake precursors with collaborative analysis. However, the multiple-source observations on the information from beneath the Earth's surface, ground surface, atmosphere, and ionosphere, which occur before, during, and after the earthquake, have become extremely complex, which makes it tricky for researchers to judge the reliability of a single anomaly and to interpret the coupling mechanism of multiple anomalies.
Although the crustal stress field alteration (CSFA) is commonly considered as the intrinsic cause of seismic anomalies, there are many different opinions on how the atmosphere and ionosphere respond to CSFA. Great attempts have been devoted to searching for earthquake precursors and to exploring its mechanisms (Gokhberg et al., 1985; Liperovsky et al., 1992; Liperovskaya et al., 1994; Shalimov and Gokhberg, 1998; Sorokin and Chmyrev, 1998; Pulinets et al., 1994, 2000). Currently, the chain of seismic anomalies observed in multiple spheres has been frequently reported (Pulinets and Ouzounov, 2011; Wu et al., 2012a, 2016; Jing et al., 2019; Marchetti et al., 2020; Hayakawa et al., 2021; Qin et al., 2021; Jing and Singh, 2022). Two fundamental hypotheses or theories, being mostly recognized, were presented to interpret the phenomena of chain-like seismic anomalies that appeared in multiple geospheres including the lithosphere, coversphere, atmosphere, and ionosphere. One is the radon emission and decay, presented by Eurasian scientists such as Sergey Alexander Pulinets from Russia, who believes that tectonic activity would release radon gas trapped originally in the soil and crust rock, and the air ionization due to radon decay will give rise to multiple seismic anomalies; hence, the other abnormal perturbances in aerosol, atmospheric humidity, latent heat, ionospheric plasma etc. were considered to be physically homologous with radon emission and decay (Pulinets and Boyarchuk, 2004; Pulinets, 2009). The other is the activation and aggregation of positive holes (P-holes in brief), presented by American scientists with Friedemann Freund being the important initiator (Freund, 2002, 2011; Freund et al., 2009), who believes that the transition of P-holes from the hypocenter and its accumulation on the ground surface will change the Earth's electromagnetic field and ionize the air molecules at the ground–air interface, which subsequently gives rise to a variety of abnormal phenomena in the atmosphere and ionosphere (Freund et al., 2006, 2009; Freund, 2007; Kuo et al., 2011). The P-hole theory was initiated from rock loading experiments, which discovered that the dormant peroxy bond could be activated by deviatoric rock stress and acts as P-holes being able to transit from stressed rock to unstressed surface (Freund et al., 2006; Freund, 2002).
To explain synergically the seismic anomalies that appeared in the atmosphere and ionosphere above the seismogenic area, the lithosphere–atmosphere–ionosphere (LAI) coupling paradigm was firstly presented to interpret the correlations of multiple seismic anomalies, which helped to search for the potential mechanism of the earthquake precursor (Liperovsky et al., 2008; Pulinets and Ouzounov, 2011). Considering that the geo-part between the lithosphere and atmosphere (soil, desert, water, ice and snow, vegetation, etc.), called the coversphere, has a vital impact on satellite observations and on the upward propagation of signals from the lithosphere in the process of earthquake preparation, a lithosphere–coversphere–atmosphere (LCA) coupling paradigm was later presented (Wu et al., 2012a, b, 2016). Subsequently, the lithosphere–coversphere–atmosphere–ionosphere (LCAI) coupling paradigm, being the unity of LAI and LCA, has been presented and has become a basic and integrated paradigm for multi-parameter analysis of seismic anomalies (Zheng et al., 2014; Jing et al., 2019; Qin et al., 2021; Xiong et al., 2021). Meanwhile, inspired by the international consensus on the characteristics of seismic anomalies (Tronin, 2000; Dey and Singh, 2003; Genzano et al., 2009; Qin et al., 2012), a deviation–time–space (DTS) criterion was proposed (Wu et al., 2012a; Qin et al., 2013) to investigate the correlations and reliability of abnormal variation of multiple parameters. The DTS criterion contains three parts: deviation of the parameter was notable enough to act as a potential anomaly; the appearances of multiple anomalies behave quasi-synchronously in time; the scopes of the reported anomalies are geo-adjacent in space.
Nevertheless, sometimes we are not able to identify correctly the anomalies that seem to be related to an earthquake but have primal contradictions, such as contradictory effects or incorrect order of occurrence. A large earthquake usually causes numerous anomalies, which are assigned to different parameters and located in different spheres of the Earth. It is very challenging to screen out reliable anomalies from multiple parameters and explore their physical mechanisms. The joint employment of the DTS criterion and LCAI coupling paradigm is expected to be useful in scrutinizing potential seismic anomalies with strict spatiotemporal consistency and in rooting the seismic anomalies to CSFA with the same physical connotation, respectively.
The Mw 7.8 Gorkha, Nepal, earthquake in 2015 was the largest earthquake to strike the Himalayan arc in the past 70 years and the strongest aftershock recorded with a magnitude of Mw 7.3. The earthquake sequence attracted wide attention and a large number of publications, which provides us a good case of studying how to screen reliable seismic anomalies from diversified reports. In this study, we reviewed carefully the reported multiple seismic anomalies associated with the 2015 Nepal earthquakes and conducted a three-dimensional (3D) numerical simulation on the seismogenic process along the Himalayan. The root of the seismic anomalies was proved to be regional CSFA and local stress blocking. The reviewed seismic anomalies with physics homologous to the CSFA were strictly scrutinized and rooted to a special LCAI coupling chain, which shared the homologous physics as regional CSFA and behaved with a reasonable spatiotemporal pattern.
2.1 Nepal earthquake sequence and geology background
The 2015 Nepal earthquake sequence began with a destructive Mw 7.8 earthquake 80 km northwest of Kathmandu (depth =8.2 km) on 25 April, followed by a series of great aftershocks (see Fig. 1), including a great Mw 7.3 aftershock in Dolakha (depth =15 km) on 12 May. The earthquake sequence occurred in the front of the India–Eurasia collision belt, where there is an extremely active area of geomechanical energy accumulation and release; many strong and devastating earthquakes had occurred along the belt in history (Kumar et al., 2006; Shan et al., 2015). The Gorkha earthquake and Dolakha aftershock were believed to be caused by a sudden release of built-up crustal stress along the major faults (Avouac et al., 2015). The Mw 7.8 mainshock and the Mw 7.3 aftershock generated a 60 km-wide ×150 km-long rupture along the main Himalayan thrust (MHT) fault, with an average slip of 3.5 m and a local maximum slip being 7 m at about 15 km north of Kathmandu (Mencin et al., 2016).
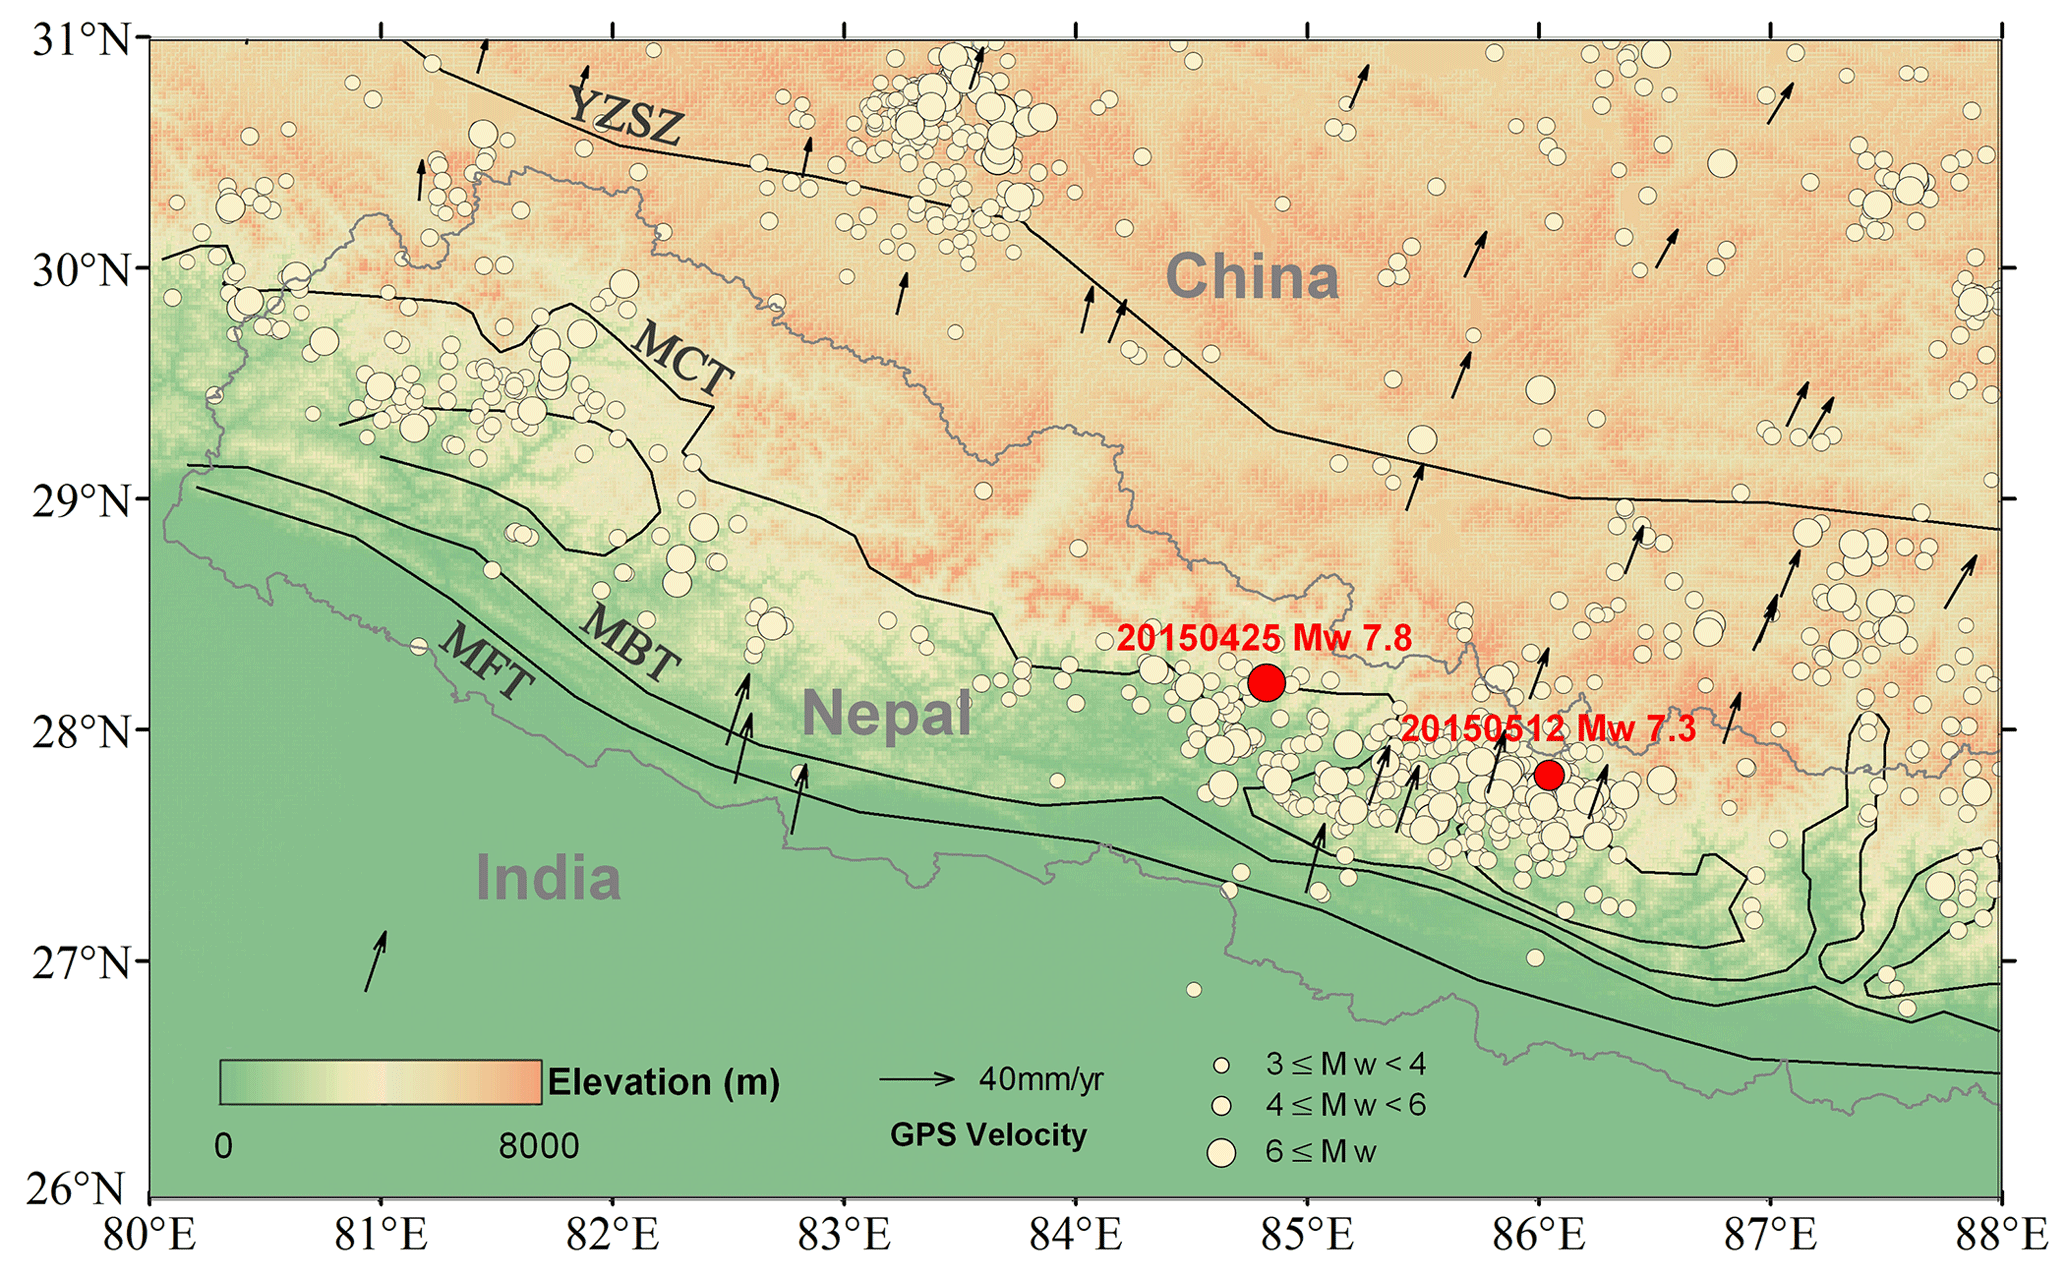
Figure 1The distribution of earthquakes with magnitudes greater than 3.0 in and nearby Nepal from 1912 to 2022 (from USGS). GPS velocity field refers to Su et al. (2015). Black arrows indicate the average velocities and directions of ground movement in 1990–2015 from GNSS observations (Kreemer et al., 2014; Zheng et al., 2017).
The Himalayan suture zone consists of several thrust faults (as in Fig. 1), including the Himalayan main frontal thrust fault (MFT), the main boundary thrust fault (MBT′, differentiated from the abbreviation of microwave brightness temperature, MBT), the main central thrust fault (MCT), and the detachment fault system in southern Tibet (Guo et al., 2009). The first three faults are exposed on the ground surface and merge into the MHT in the deep crust, the rupture of which was related to almost all the major earthquakes occurring on the Himalayan front fault (Bilham, 2004). The Himalayan seismic belt also has obvious segmental activity characteristics. The eastern segment is accompanied by extrusion and clockwise rotation, the middle segment is dominated by extrusion, while the western segment is accompanied by counter-clockwise rotation (Su et al., 2015). The Nepal earthquake sequence in 2015 mainly occurred at the transferring zone of the counter-clockwise rotation segment and clockwise rotation segment.
2.2 Materials and methods
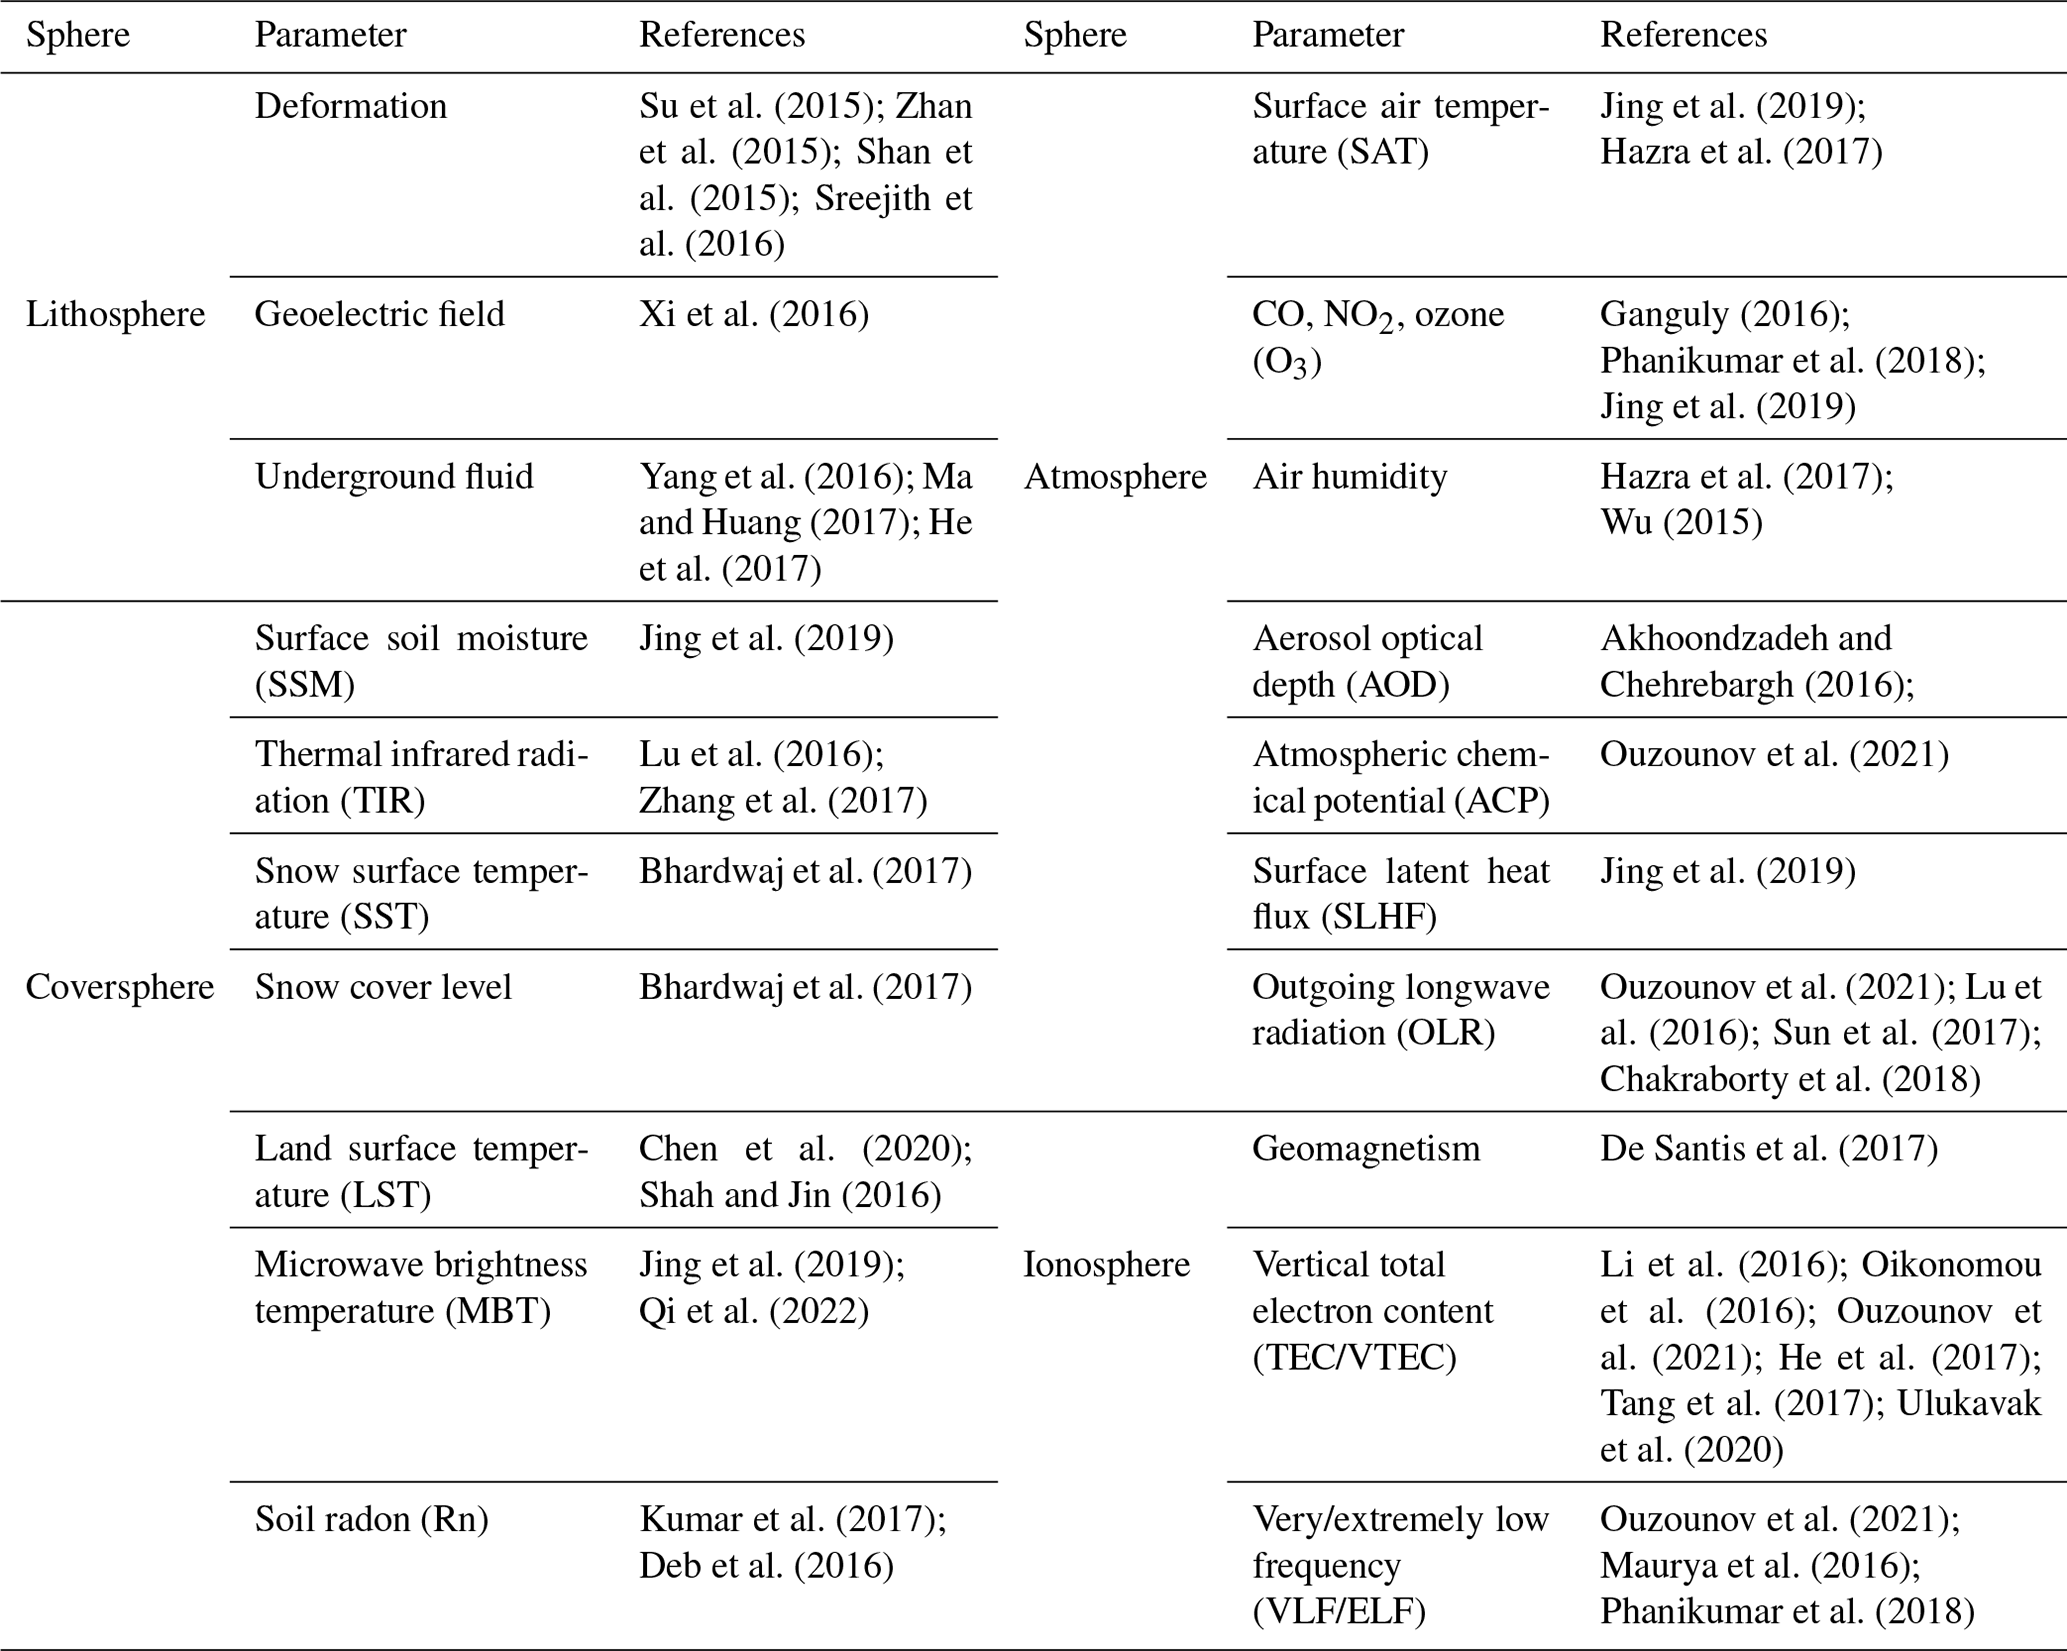
In general, the LCAI coupling analysis of a seismic event requires lots of observations of multiple parameters. There are various methods for data processing and different knowledge backgrounds for studying the diversified parameters. Since the 2015 Gorkha earthquake and Dolakha earthquake occurred years ago, many researchers with knowledge of remote sensing, seismology, and geophysics, respectively, have reported a large number of abnormal phenomena considered as seismicity-related, which can be acquired from literature so that the duplicated work on searching seismic anomalies can be avoided. A preliminary screening of these literature was firstly carried out; the basic criteria were referred to He et al. (2020), among which the most critical factors to be considered were the clear space–time information and the specific physical connotation. A total of more than 40 related pieces of literature were then sorted out, including 22 abnormal parameters as in Table 1.
Table 1Anomalous parameters in multiple geospheres reported on the 2015 Nepal earthquake sequence.
Although the general spatiotemporal features of multiple-parameter anomalies can be obtained after the preliminary screening, their spatiotemporal correlation and homologous physics still need to be strictly scrutinized and rooted. Only those reported anomalies behaving with spatiotemporal consistency and sharing the homologous physics in CSFA can be regarded as reliable seismic anomalies with potential earthquake precursor meanings. Eventually, an integrated LCAI coupling framework with a definite space–time–physics connotation will be retained after the strictly scrutinizing and physical rooting actions. The basic flow diagram of this study is shown in Fig. 2.
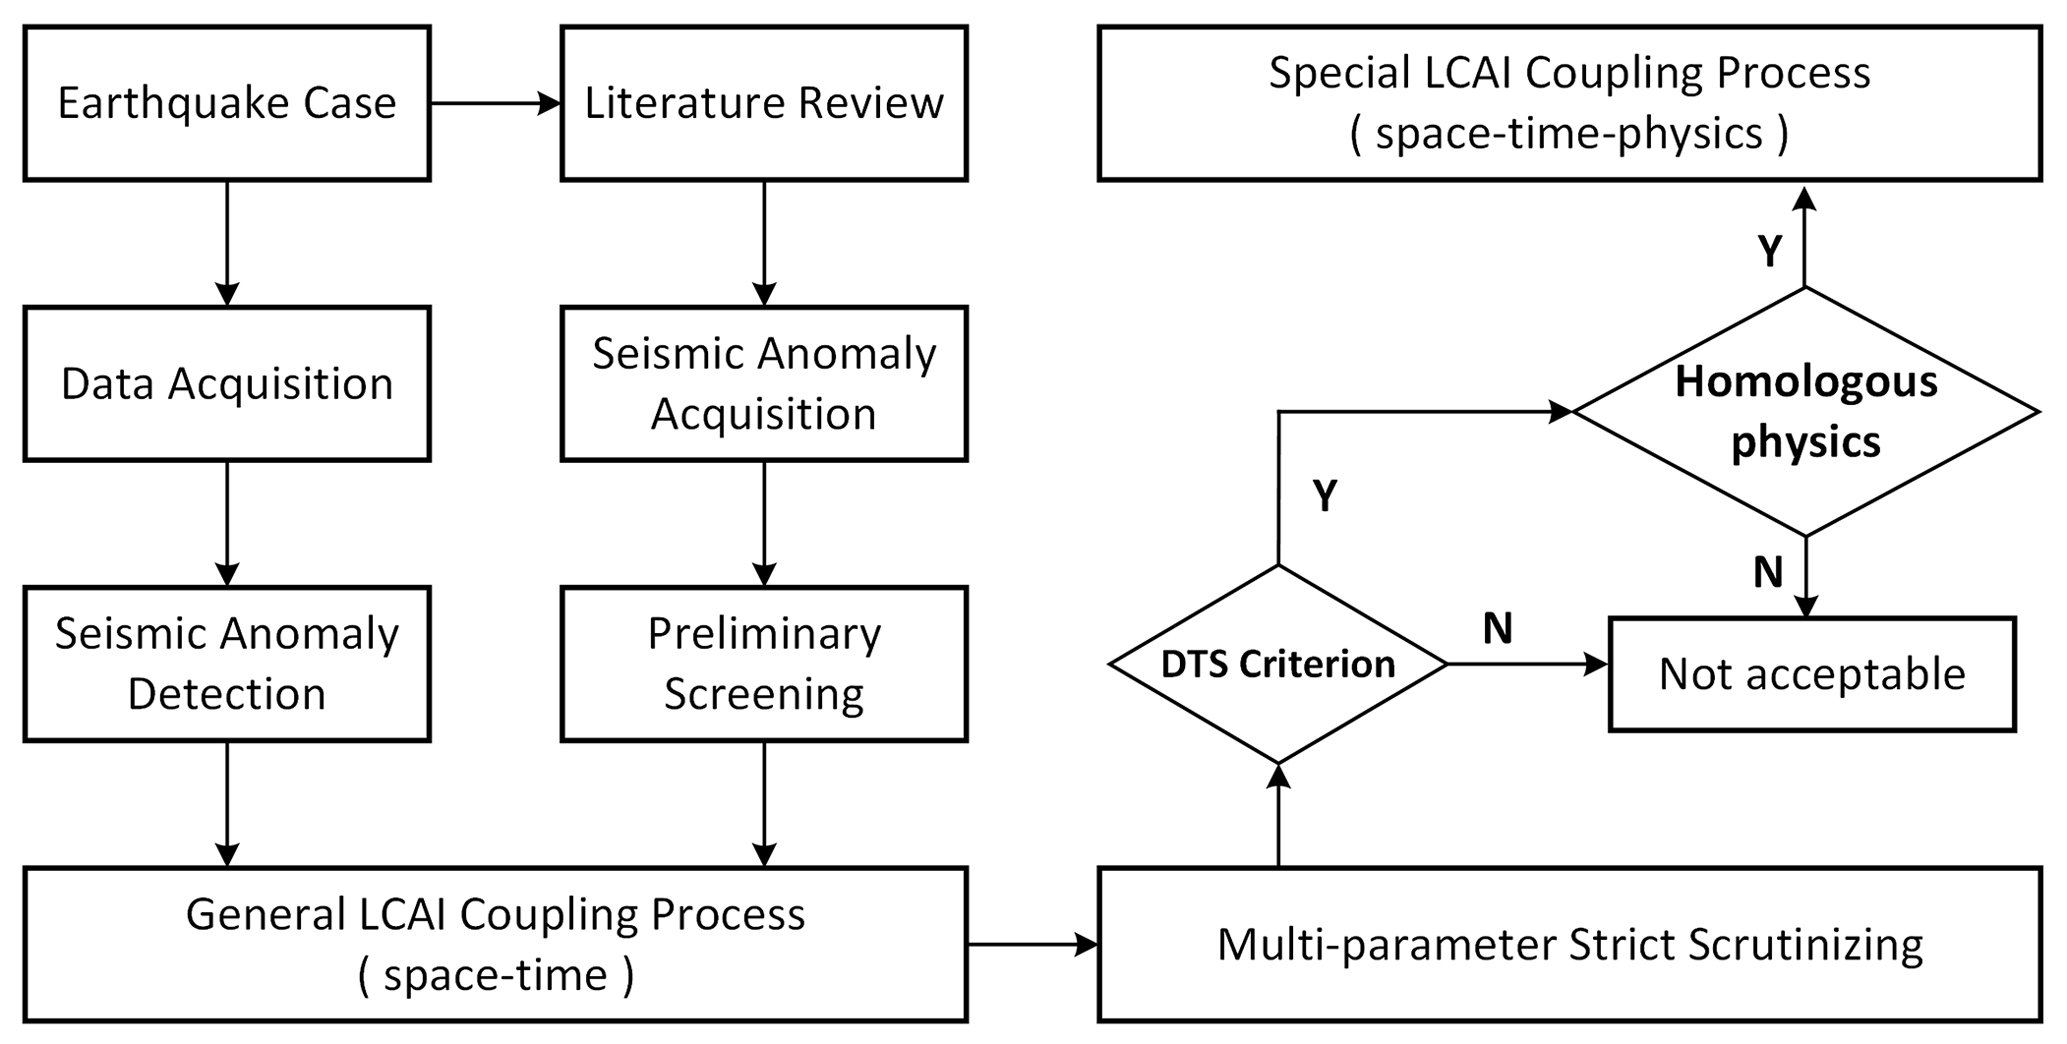
Figure 2The technical route of scrutinizing and rooting multiple seismic anomalies using the DTS criterion and homologous physics.
3.1 Brief description of an individual anomaly
For systematic summarization and clear comparison, the temporal characteristics and spatial distributions of all the reported seismic anomalies related to the Nepal earthquake sequence in 2015 are described in Figs. 3 and 4, respectively, in a classification of lithosphere, coversphere, atmosphere, and ionosphere.
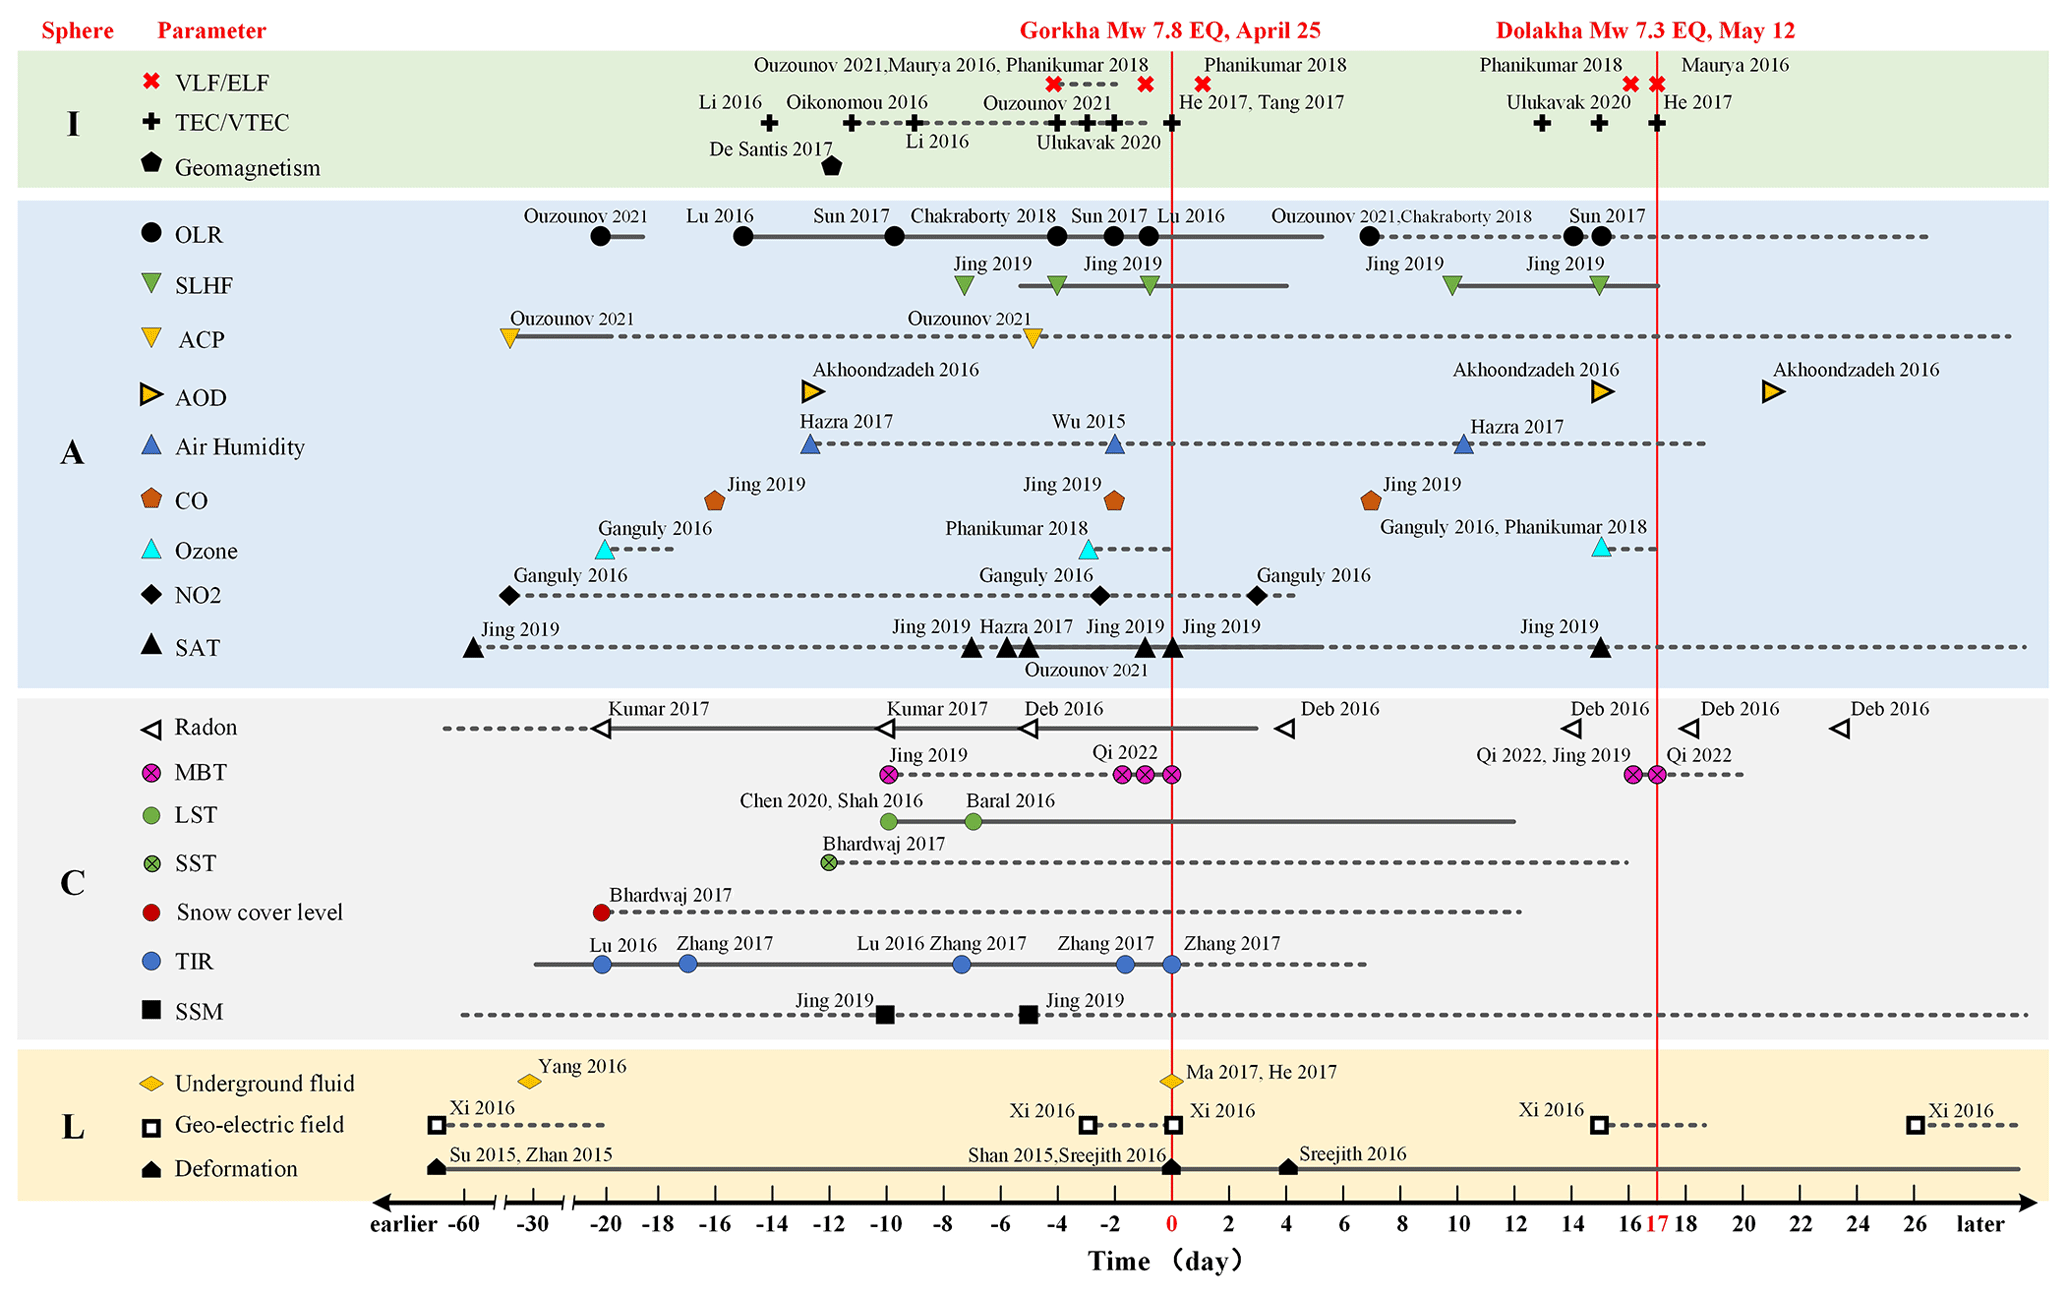
Figure 3The temporal distribution of multiple anomalies from the lithosphere up to the ionosphere before, during, and after the Gorkha earthquake and Dolakha earthquake in 2015. The dotted icon indicates that the anomaly occurred on a particular day, the solid line means the anomaly was persistent, while the dashed line means that the anomaly was fluctuant or intermittent.
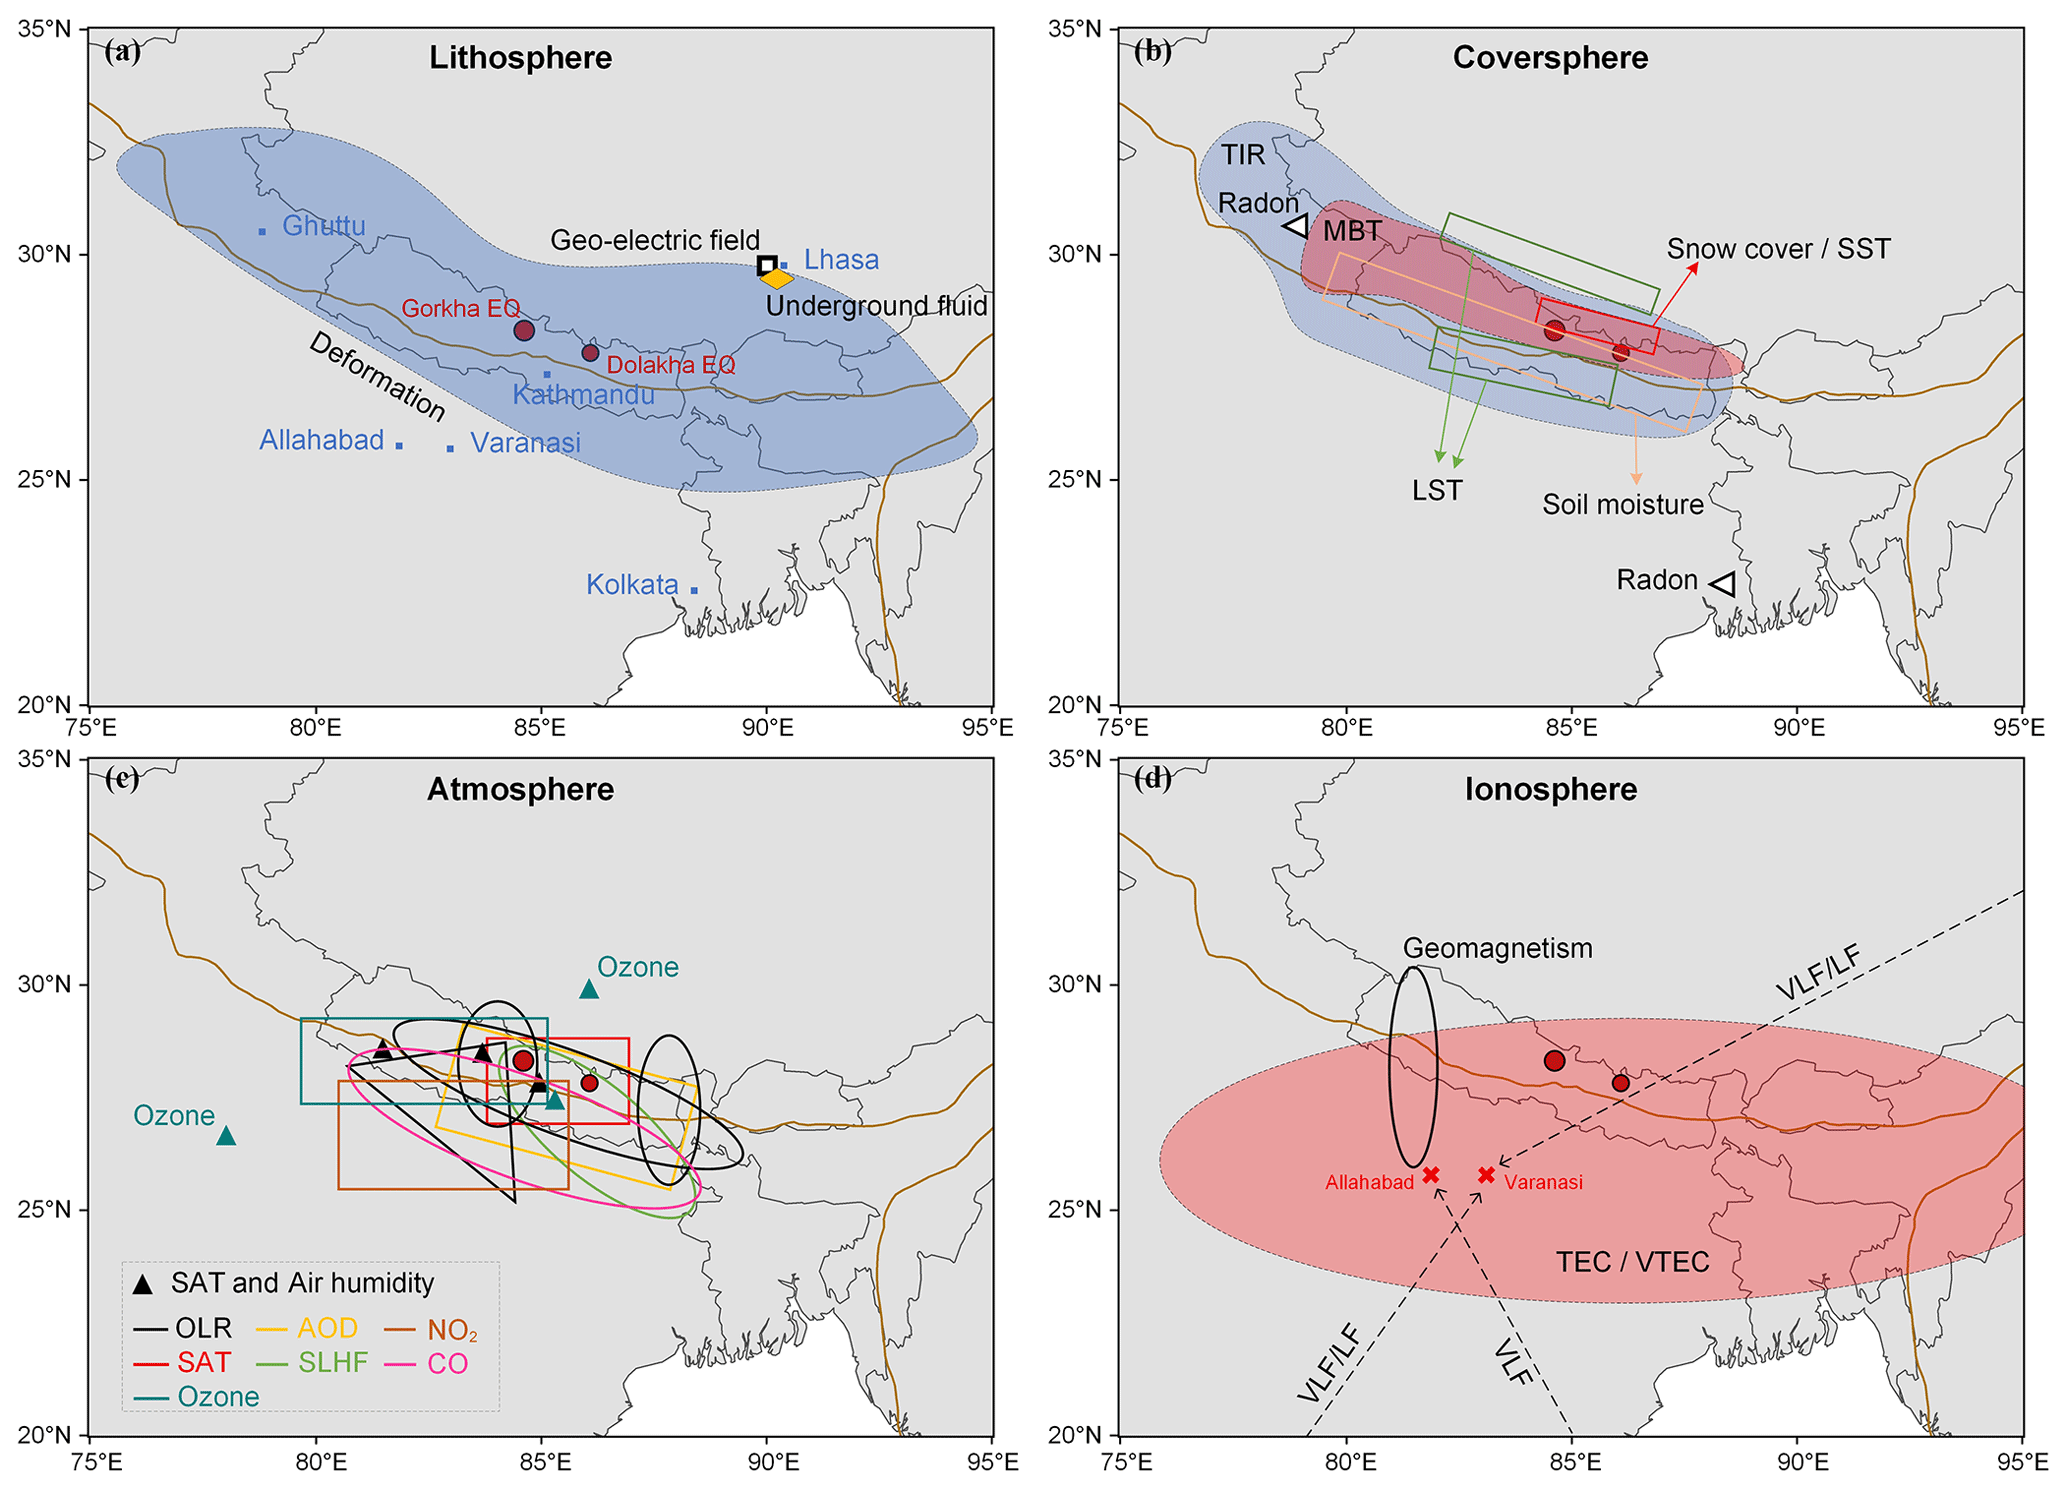
Figure 4The spatial distribution of multiple anomalies in four geospheres before, during, and after the Gorkha earthquake and Dolakha earthquake in 2015. The geographical locations of the stations were marked for the anomalies recorded by the ground station, and the areas of significant anomalies with detailed descriptions were marked for the anomalies observed by satellites. In Fig. 4a, the blue area only represents the long-term and large-scale deformation area, not the short-term deformation anomaly. In Fig. 4d, the red area represents the northern part of the conjugate ionospheric anomalies.
In the lithosphere (Figs. 3 and 4b), the GPS velocity field shows that the continuous extrusion deformation between the Indian plate and the Eurasian plate had been significantly enhanced since 2012 (Zhan et al., 2015), which reflected that the strengthened pushing effect of the Indian plate on the Qinghai–Tibet Plateau preceding the Gorkha earthquake. Coseismic displacement of the Gorkha earthquake and early postseismic (4–88 d after the mainshock) surface displacements were both detected by GPS and InSAR measurements (Shan et al., 2015; Sreejith et al., 2016). Observations of the geoelectric field in Lhasa station (29.1∘ N, 91.0∘ E) showed that a geoelectric anomaly had gradually appeared since June 2014 with the maximum variation exceeding 1000 mV km−1. The geoelectric field tended to be stable about 20 d before the mainshock, with the variations remaining below 100 mV km−1, and showed very small disturbances after the Dolakha earthquake (Xi et al., 2016). The temperature of underground water at Yushu seismic station (33.0∘ N, 97.0∘ E) showed that water temperature had broken the normal upward trend since early March 2015, with a change rate of 48 times that of the original, and reached the peak about 1 month before the Gorkha earthquake (Yang et al., 2016). Besides, coseismic underground water-level oscillation before and during the 2015 Nepal earthquakes were recorded in the Jingle well in Shanxi Province, China (38.4∘ N, 112.0∘ E; He et al., 2017) and another 159 wells throughout the Chinese mainland (Ma and Huang, 2017).
In the coversphere (Figs. 3 and 4b), SSM around the epicenter areas behaved abnormally 10 and 5 d before the Gorkha earthquake, which had been excluded from the contribution of rainfall (Jing et al., 2019). Significant TIR anomalies were found to be concentrated mainly to the west of the epicenter before the Gorkha earthquake by processing FY-2 satellite data (Lu et al., 2016; Zhang et al., 2017). TIR anomalies revealed by Zhang et al. (2017) started from middle March 2015, gradually strengthened until the mainshock, and then weakened afterwards. Lu et al. (2016) reported that TIR anomalies appeared in early April, peaked a week before the mainshock, then began to weaken and dissipate after the mainshock. Bhardwaj et al. (2017) found obvious departures in snow temperature 12 d before and in snow cover level 20 d before the Gorkha earthquake by using 16 years of MODIS data. Chen et al. (2020) reported that a strip of LST appearing to the north of the epicenters along the Himalayas cooled slowly before, reached a minimum during, and returned to normal after the Gorkha earthquake. Baral et al. (2016) found that distinct LST anomalies appeared about 150 km to the southwest of the epicenter on 18 April, which extended along the main Himalayan frontal thrust (MFT) until 23 April and dissipated one day before the Gorkha earthquake. LST was also found to significantly exceed the normal range around the epicenter 10 d before the Gorkha earthquake (Shah and Jin, 2016). Jing et al. (2019) reported that significant MBT anomalies appeared to the west of the epicenter 10 d before the mainshock. Positive MBT anomalies, reported by Qi et al. (2022), appeared shortly before, peaked on, and dissipated after the occurrence of the two major earthquakes, respectively, with the abnormal stripes distributing along the Himalayas, covering the epicenters of the forthcoming earthquakes. The 4-month simultaneous observations at two adjacent soil radon sites in Kolkata, India (22.6∘ N, 88.4∘ E) displayed two potential radon anomalies on 20 and 29 April (Deb et al., 2016). Observations in Ghuttu, India (30.5∘ N, 78.8∘ E) also showed obvious variations of soil radon concentration in early April 2015 and a sudden increase from 10 d before to 3 d after the Gorkha earthquake (Kumar et al., 2017).
In the atmosphere (Figs. 3 and 4c), Jing et al. (2019) reported that SAT from AIRS satellite over the epicentral and surrounding regions had behaved abnormally since 50 d before the mainshock. Afterwards, the SAT anomaly peaked on the dates 7 d and 1 d before the Gorkha earthquake, and 2 d prior to the Dolakha earthquake, respectively. Using NOAA surface data, Ouzounov et al. (2021) revealed that SAT anomalies appeared near the epicenters and peaked on the dates 5 d before the Gorkha earthquake and 7 d prior to the Dolakha earthquake, respectively. Using SAT data from three stations near the mainshock epicenter, Hazra et al. (2017) found obvious SAT anomalies occurring 5–7 d before the Gorkha earthquake, which lasted for >10 d. SLHF anomalies peaked on the date 1 d prior to the Gorkha earthquake and disappeared 4 d after, and then peaked on the date 3 d prior to the Dolakha earthquake and dissipated afterwards (Jing et al., 2019). Using FY-2E satellite data, Lu et al. (2016) uncovered that OLR anomalies started from 10 April, peaked on 24 April and then weakened, with the anomalous region being strip-shaped cross the Nepal. By analyzing the NOAA time series, Chakraborty et al. (2018) found that the OLR anomaly appearing around the epicenter started 3 d prior to the mainshock and disappeared gradually after the earthquake, while Ouzounov et al. (2021) found that the OLR anomaly peaked around 4–7 April and 2–3 May 2015. Investigating the OLR data observed by FY-2D and NOAA, Sun et al. (2017) found that the OLR anomaly occurred to the west of the future mainshock epicenters on 15 April, peaked on 24 April, dissipated subsequently, and reappeared 2 d before the Dolakha earthquake.
Inside the atmosphere, tropospheric columnar NO2 around the epicenter started increasing from 45 d before and peaked on the date 3 d after the Gorkha earthquake, and then oscillated in the next few months (Ganguly, 2016). Two enhancements of columnar O3 were observed in the same place about 20 d before the Gorkha earthquake and 2 d before the Dolakha earthquake, respectively, and then the amplitude of the O3 anomaly showed a downward trend (Ganguly, 2016). From 23–25 April and 10–12 May 2015, the vertical profiles of mesospheric O3 around the two epicenters had exceeded the normal threshold (Phanikumar et al., 2018). CO concentration (900 hPa) exhibited two abnormal enhancements in the southern region near the epicenters, 16 and 2 d before the Gorkha earthquake and 10 d before the Dolakha earthquake, respectively (Jing et al., 2019). Average atmospheric relative humidity from three meteorological stations near the mainshock epicenter reached minimal values 13 d before the Gorkha earthquake and 7 d before the Dolakha earthquake, respectively (Hazra et al., 2017). Wu et al. (2015) also reported a significant reduction in relative humidity at the Kathmandu weather station 2 d before the mainshock. Akhoondzadeh and Chehrebargh (2016) analyzed the AOD data derived from MODIS and found that a significant AOD anomaly at 550 nm appeared 13 d and 2 d prior to the Gorkha earthquake and Dolakha earthquake, respectively. Ouzounov et al. (2021) analyzed the ACP data from the GEOS-5 assimilation and suggested that ACP had behaved unusually on 11–12 March, 4–5 April, and 20 April 2015.
In the ionosphere (Figs. 3 and 4d), De Santis et al. (2017) found a very evident disturbance of the geomagnetic field on 14 April 2015 by analyzing the Swarm satellite data along the night orbital tracks. Investigating the daytime TEC time series over the seismogenic zones, Li et al. (2016) observed that the TEC had decreased 14 and 6 d before the Gorkha earthquake with a duration of 6–8 h. Oikonomou et al. (2016) detected some enhancements of ionospheric diurnal TEC variations appearing 1–11 d before the Gorkha earthquake. Ulukavak et al. (2020) suggested that the positive ionospheric TEC anomaly, observed on 22 (daytime) and 23 April (nighttime) 2015, might be related to the Gorkha earthquake in that the space weather conditions and geomagnetic activity were quiet in these days. Ouzounov et al. (2021) also found a strong nighttime negative TEC anomaly occurring on 21 April and a strong nighttime positive anomaly appearing on 24 April 2015. Besides, Tang and Yuan (2017) found significant ionospheric TEC fluctuations and multi-dimensional structures appearing around the Gorkha earthquake and coseismic ionospheric disturbances appearing to the northeast and northwest of epicenter about 10–20 min after the mainshock. VTEC rising before and dropping after the mainshock directly above the faults and VTEC enhancing 14 min about prior to the Dolakha earthquake were observed by using GPS observations (He and Heki, 2017). Nighttime VLF signal transmitted from Australia and received in Allahabad, India (25.4∘ N, 81.9∘ E) showed that fluctuation of VLF appeared 1 d before both the Gorkha earthquake and the Dolakha earthquake (Maurya et al., 2016; Phanikumar et al., 2018). VLF/LF signals in the nighttime transmitted from Sakhalin Island and received in Varanasi, India (25.3∘ N, 82.9∘ E) had exhibited significant depression from 21 to 23 April, while those transmitted from south India and received in Varanasi, India displayed obvious decrease from 20 to 24 April 2015 (Ouzounov et al., 2021).
3.2 Aggregative characteristics of multiple anomalies
As shown in Figs. 3 and 4, the parameters of the lithosphere, such as deformation, geoelectric field, and underground water temperature and level, could be the first to change on a long-term scale. The long-period surface deformation was mainly concentrated in the boundary zone between the Qinghai–Tibet Plateau and the Indian plate, which basically covered the whole Himalayan region as a stripe. The observation sites for geoelectric anomalies and underground fluids are located in Lhasa, Tibet, which is farther northeast of the epicenters but falls inside the primary deformation zone.
The anomalies in the coversphere mainly appeared 20 d before and lasted until more than 10 d after the Gorkha mainshock. A few parameters, such as MBT, appeared repeatedly before and disappeared after the Dolakha aftershock. These anomalies were mainly concentrated in a strip region along the southern foothills of the Himalayas. The TIR anomaly was the most extensive, while the other anomalies in the coversphere generally occurred inside the region of the TIR anomaly. Snow cover and snow surface temperature anomalies occurred at high altitudes close to the epicenter, while SSM anomalies and LST anomalies occurred at lower altitude regions. Stations for detecting radon gas in soil and in underground water were located in southeast India (Kolkata) and northwest India (Ghuttu), which was far away from the two epicenters.
In the atmosphere, the earliest anomalies were thermal parameters, such as SAT, OLR, and ACP, followed by other gas anomalies occurring within 20 d before the Gorkha earthquake. Most of the gas anomalies only lasted until the Dolakha earthquake, while the thermal parameter anomalies continued until more than 10 d after the Dolakha earthquake. Except for the ozone stations locating far away from the epicenters, the other atmospheric anomalies were generally distributed in the belt region to the south of the Himalayas. These atmospheric anomalies showed strong spatial aggregation and corresponded well to the union scope of seismic anomalies in the lithosphere and coversphere.
The ionospheric anomaly appeared 13 d before the Gorkha earthquake and displayed intermittent peak values. Its appearance was significantly later than that in the lower geospheres. From 3 d before the Gorkha earthquake to the coseismic day, significant ionospheric anomalies frequently appeared. Subsequently, electronic anomalies and electromagnetic anomalies appeared intensively 3 d before and on the date of the Dolakha shocking, and then disappeared. Due to the scattered distribution of GNSS stations and sparse orbits of electromagnetic satellites, the spatial range of ionospheric anomalies was relatively broad, which lead to some distant stations that also detected ionospheric anomalies and cannot be displayed in Fig. 4.
4.1 Numerical simulation of CSFA
It is well established that a tectonic earthquake is attributed to the gradual accumulation and localized concentration of crustal stress. The CSFA before the 2015 Gorkha earthquake in Nepal is critical to understand the observed seismic anomalies and unravel the corresponding LCAI coupling mechanisms. In this work, considering the hypocenters at a depth of approximately 15 km, a refined 3D geological model with detailed information of main faults and strata in the study area was constructed based on the existing data and reported studies (DeCelles et al., 1998, 2001; Lavé and Avouac, 2001; Avouac, 2003; Bollinger et al., 2004; Sapkota et al., 2013), which is shown in Fig. 5. The major tectonic faults in Nepal (including MFT, MBT′, MCT, and MHT) and the Yarlung Zangbo suture zone (YZSZ) to the north of the Nepal Himalayas are built in the 3D model. The surface topography was reconstructed by using DEM data (ASTER GDEMv3) with resolution downscaled to 500 m. By using a 3D finite element method (ANSYS software), the accumulation of equivalent stress (named also von Mises stress) caused by tectonic movement in the Nepal Himalayas over the last 500 years was numerically simulated referring to the average annual ground surface velocity fields from 1990 to 2015 (Gan et al., 2007; Ader et al., 2012; Kreemer et al., 2014; Zheng et al., 2017). The upper and lower parts of the Moho surface were considered to be elastic and viscoelastic, respectively (Zhao et al., 2017; Tian et al., 2020). The physical parameters used referred to existing studies (Castaldo et al., 2017; Zhao et al., 2017; Wang and Fialko, 2018; Tian et al., 2020), and the nonlinear frictional contact was applied to the faults with its friction coefficient being set as 0.4 (Luo and Liu, 2010). Self-weighing of elements was considered due to the large differences in surface topography in the Nepal Himalaya. The boundary conditions of the model were constrained by the velocity fields, and the bottom domain is free horizontally but fixed vertically.
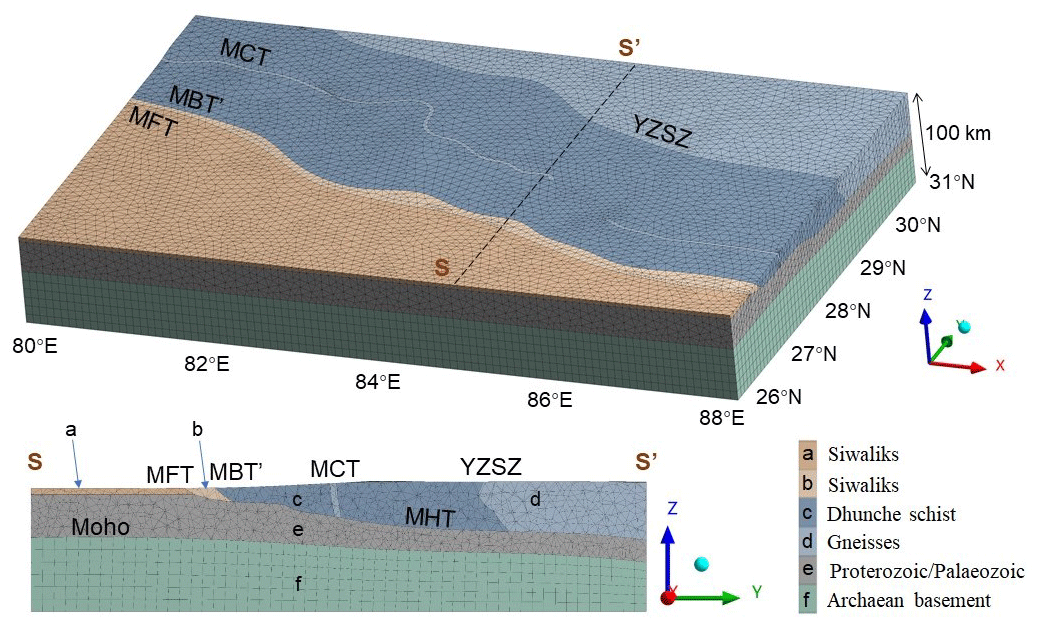
Figure 53D geometrical model of geological structure in Nepal and its nearby areas. MFT, MBT′, MCT, and MHT mean the same as before, while YZSZ means Yarlung Zangbo suture zone. The X axis is west–east, the Y axis is south–north, and the Z axis is bottom–top. For each domain, the density values (ρ), Young's Modulus (E), and Poisson's ratio (ν) were reported as ρ=2550 kg m−3, E=20 GPa, and ν=0.25 in strata a and b; ρ=2700 kg m−3, E=40 GPa, and ν=0.25 in strata c and d; ρ=2700 kg m−3, E=70 GPa, and ν=0.25 in strata e; ρ=2700 kg m−3, E=170 GPa, ν=0.25, and coefficient of viscosity =1020 Pa s−1 in strata f.
The equivalent stress (von Mises stress) suggests that the rock will yield if the second invariant of the deviatoric stress reaches some critical value (Jaeger et al., 2009), which could be used to reflect the crust stress background. An increment in the equivalent stress will accelerate the failure of the solid medium, while a decrement will prevent the solid medium from yielding. The 3D distribution of computed equivalent stress in the volume of the geological model was presented in Fig. 6a. Particularly, the computed equivalent stress on the ground surface (Fig. 6b) as well as that on the MHT structural surface (Fig. 6c) were sectioned and analyzed. In order to better show the equivalent stress change at different depths, the equivalent stress distribution in two specially selected sections (A and B) were shown in Fig. 6d and e, respectively.
Obviously, the stress field varied a lot with the tectonic structures (Fig. 6a). The high-stress build-up was mainly associated with the MBT′ and MCT and shaped with a narrow belt along the faults, which coincides with the belt-shaped seismicity illustrated in Fig. 1 and reported by Pandey and Rawat (1999). Particularly, remarkable stress accumulation, with a maximum stress of up to 90–120 MPa, appeared around the hypocenters of the 2015 Mw 7.8 mainshock and its largest aftershock (Mw 7.3; Fig. 6c), which might have reached the yield strength of local rock mass. In addition, both the magnitudes and areas of the concentrated stress on the ground surface (Fig. 6b) were relatively smaller than those on the MHT fault plane (Fig. 6c), suggesting an overall upward stress gradient between the MHT and ground surface. Figure 6e shows the maximum stress accumulation zone located at the depth of MHT. The stress distribution was relatively uniform with low values in the deep part under MHT, and the stress in the shallow part shows a clear trend decreasing from the MHT plane to ground surface (resulting an upward stress gradient), which can be observed in Sect. B (Fig. 6e). Moreover, the stress distributions in north-western Nepal are relatively lower than those at the southern and eastern regions, suggesting an overall northward stress gradient in Nepal. In short, the CSFA in the Nepal Himalayas was mainly determined by the tectonic structures and displayed an inhomogeneous spatial pattern in 3D space. It is expected that CSFA in the Nepal Himalayas was closely related to the multiple seismic anomalies before the occurrence of the 2015 Nepal earthquake sequence.
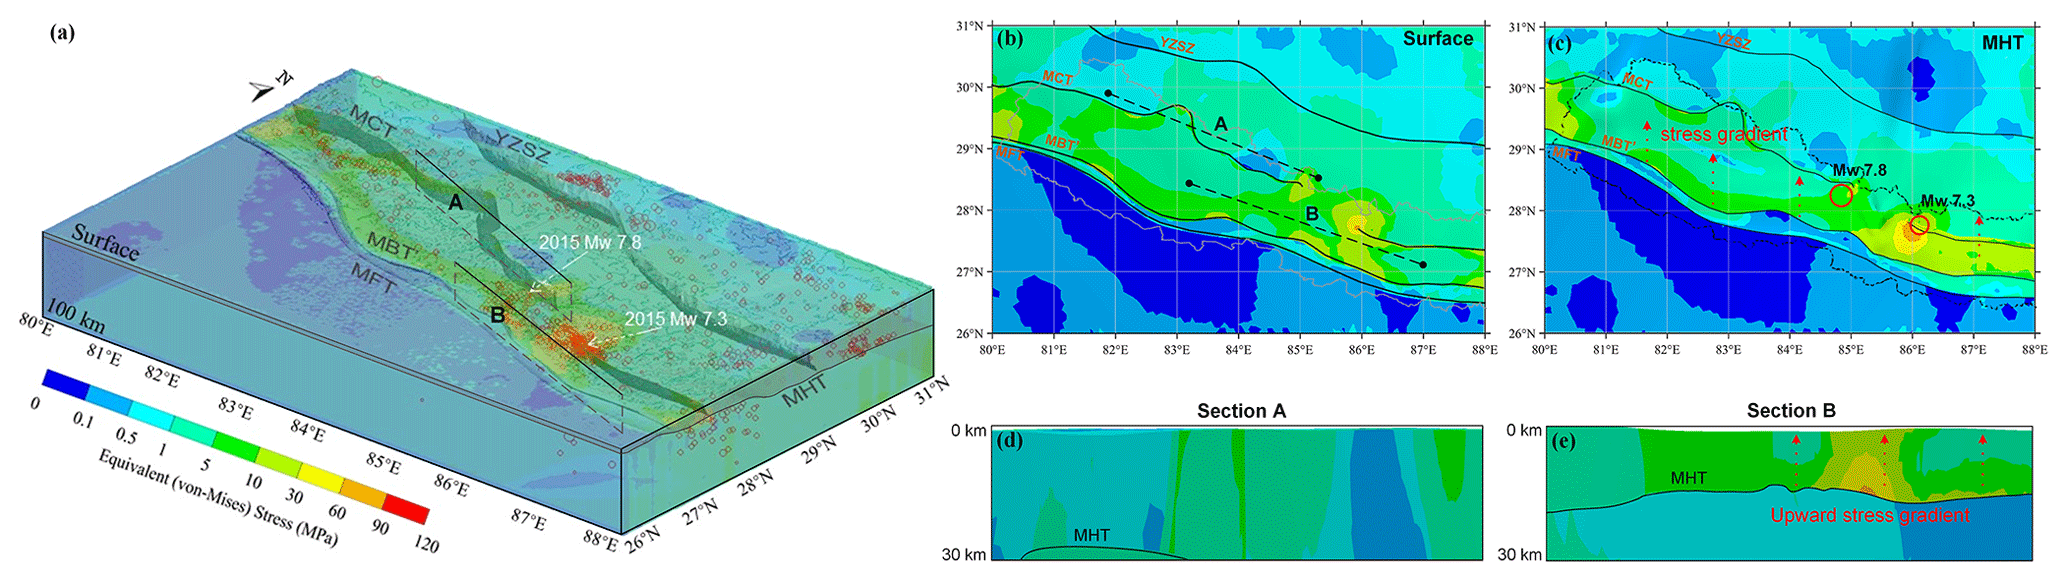
Figure 6The spatial distribution of equivalent stress in a 3D perspective (a), on the surface (b) and MHT (c), and on Sects. A (d) and B (e). Red circles in (a) represent the hypocenters of seismic activities (Mw≥3.0, 1921–2022) from USGS.
4.2 Response chains of CSFA
Rock mechanics have demonstrated that many physical properties of rocks, such as geological structure, physical temperature, acoustic emission, electric property, and even electromagnetic radiation, will change with the increasing of additional stress. Since most of them appeared or occurred remarkably before the final rock failure, the significant variations of local stress are considered as their sources or roots. However, the change in ground stress near the Earth's surface is merely in the order of several MPa (Liao et al., 2003; Yukutake et al., 2010; Hasegawa et al., 2012), which is substantially smaller than that at depths of 10–45 km, where approximately 85 % of destructive earthquakes occurred with considerable stress enhancement. Thus, how to understand the spatial gap between the observed anomalies near and above ground surface and the significant stress changes at the hypocenters (depth of 15 km) of the Nepal earthquake is very critical. In addition, an increase in seismicity rate was found 3–4 d prior to the mainshock of the 2015 Nepal earthquakes (Huang et al., 2016), which means that local stress had changed significantly during this period. However, the reported seismic anomalies associated with the Nepal earthquakes (Figs. 3 and 4) were generally observed or appeared several to tens of days before the occurrence of earthquakes; thus, the physical process without significant stress change is expected to be responsible for the anomalies. Therefore, a stress-associated physical process considering both the spatial and temporal gaps should be further explored.
In the previous study, the spatiotemporal evolution of MBT anomalies related to the 2015 Nepal earthquakes were uncovered in detail (Fig. 2 in Qi et al., 2022). The revealed MBT anomalies show a strong spatiotemporal correlation with seismic activity and a significant local topographic coincidence. A theoretical explanation for seismic MBT anomalies was proposed, i.e., “crustal stress enhancing–P-hole producing and flowing down stress gradients–surface P-hole accumulating–dielectric constant decreasing–microwave radiation increasing”. However, there still lacks direct evidence or intuitive presentation of how and where the P-hole was produced, along what routes the P-hole propagated, and where it accumulated on ground surface. Fortunately, the spatial distribution of the simulated crust stress in the study can perfect the theoretical response chain of CSFA, and the simulation results can be mutually confirmed with the MBT anomaly and P-hole theory.
Figure 6 shows that the crustal stress distribution on and above the MHT fault plane, especially corresponding to the Nepal, was highly concentrated and unevenly distributed. The volume between MCT and MBT′ belongs to the lesser Himalaya region, of which the geological lithology is basically composed of low-grade metamorphic and sedimentary rocks (Tater et al., 1983; Burrard et al., 1907). Some amphibolites, volcanic rocks, granites, and augen gneisses exist also within different strata (Dhital, 2015). Thus, as the crust stress builds up locally, the area of high-grade metamorphic rocks schist and gneisses (Fig. 5), which contains numerous peroxy bonds or oxygen defects (Freund, 2002, 2007), would have produced massive positive charge carriers (or positive holes, P-holes in brief; Freund, 2010). The activated P-holes are to flow out from the source area to upper portions of the crust with the stress gradients acting as the driving force (St-Laurent et al., 2006). The 3D distribution of uneven stress accumulation in Fig. 6a indicates that the regional stress gradient developed vertically from MHT to ground surface and horizontally from south to north, which determined that the produced P-holes were able to transmit upward and northward along the stress gradient from the hypocenter zone. Therefore, the ground surface above the high-stress concentration zone could be the core area of P-hole aggregation. Thus, the CSFA response chain of CSFA–P-hole producing and flowing down stress gradients–surface P-hole accumulating are supposed to have existed before the Nepal earthquake sequence in 2015.
In laboratory experiments, enhanced TIR radiation was observed on the free end of compressed rock using a spectra-radiometer, which was considered to be caused by P-hole recombination as it reaches to and recombines on the rock surface (Freund, 2007). Theoretical analysis and practical observation shows that continuous P-hole accumulation on ground surface will produce an additional electric field and lead to sequential anomalies in the atmosphere and ionosphere (Freund, 2011). In addition, the aggregation of P-holes in the shallow surface of rock volume is bound to generate a regional electric field (Freund, 2007), and the lattice ions in the rock volume will shift under the action of the additional electric field. Thus, the microwave dielectric constant of rock materials (Mao et al., 2020) gets reduced, which is also confirmed by laboratory observation of the dielectric change in non-stressed volume during rock loading (Mao et al., 2020, 2021). According to the microwave remote sensing physics, when the microwave dielectric of a substance decreases, its ability to radiate microwave energy will increase. Therefore, the MBT anomalies occurred with the same spatial pattern of P-hole aggregation on ground surface.
Therefore, as massive CSFA-activated P-holes migrate upward and reach ground surface or mountain peaks, there are at least three different response chains with homologous physics. The first is the change of microwave permittivity caused by the electric field enhancement in shallow rock volume, the second is the additional infrared radiation emitted during the recombination of P-holes on ground surface, and the third is the atmospheric ionization and sequential productions of atmospheric and ionospheric anomalies caused by atmospheric electric field (AEF) enhancement and upward ionic motion.
As shown in Figs. 3 and 4, the seismic anomalies that appeared in the four geospheres displayed an obvious upward evolution as the mainshock approached and also exhibited strong spatial aggregation and great correspondence to the seismogenic zone. Nevertheless, there still existed some inconsistency in the abnormal behaviors of different anomalies, such as the rise, fall, or fluctuation behaviors in time domain, and the distributions of different anomalies did not fully overlap each other in the space domain. In Sect. 4, CSFA is identified as the fundamental driver of the seismic anomalies and three potential stress response chains are presented. The reported multi-parameter seismic anomalies should be further scrutinized and rooted, only those anomalies matching perfectly with the homologous physics in CSFA and showing spatiotemporal consistency can be retained and considered as reliable seismic anomalies with potential earthquake precursor meanings.
The ionospheric anomalies appearing shortly before an earthquake are supposed to be potential precursors of an impending earthquake. However, the preseismic ionospheric anomalies are always characterized by large scopes and long distances away from the epicenters, even accompanied by a conjugate phenomenon. Although a significant ionospheric anomaly could be observed preceding an earthquake, it is difficult to determine the potential seismogenic area only depending on a single ionospheric parameter. By analyzing the spatiotemporal coincidence between the parameters in the same geosphere, including the ionosphere through the DTS criterion, the unreliable seismic anomalies can be eliminated. From the top down to the bottom, the anomalies with inconsistent physical mechanisms in different geospheres can be further excluded by analyzing the possible physical homology between the anomalies that appeared in adjacent geospheres through LCAI coupling mechanism. Therefore, the ionospheric anomaly can be rooted gradually down to the lithosphere and correlated with the CSFA firmly, and the potential seismogenic zone can be identified, even the locked-in areas of crustal stress can be roughly ascertained.
5.1 Ionospheric anomalies
The ionospheric anomalies before the 2015 Nepal earthquakes have been summarized in Sect. 3 and displayed in Fig. 4d. The transmission path of the reported VLF/ELF abnormal signals (Ouzounov et al., 2021; Phanikumar et al., 2018; Maurya et al., 2016) passed over the stress concentration area shown in the simulation results, and the moments of the VLF/ELF anomalies appearance were also concentrated in the very short moment before the mainshock. Therefore, the reported VLF/ELF disturbances can be preliminarily identified to satisfy the DTS criterion. However, it is generally considered that the upward drift of ions (driving by a CSFA-induced additional electric field) from the lower atmosphere to the interface of the upper atmosphere and lower ionosphere would form a vertical current and integrate into the global electrical circuit (Rycroft et al., 2008), hence impacting on the very low frequency (VLF) signals reflected by or transmitting thorough the ionosphere. Whether the reported VLF/ELF disturbances can be regarded as reliable earthquake precursor still requires further investigation of the spatiotemporal characteristics and physical homology of atmospheric parameters.
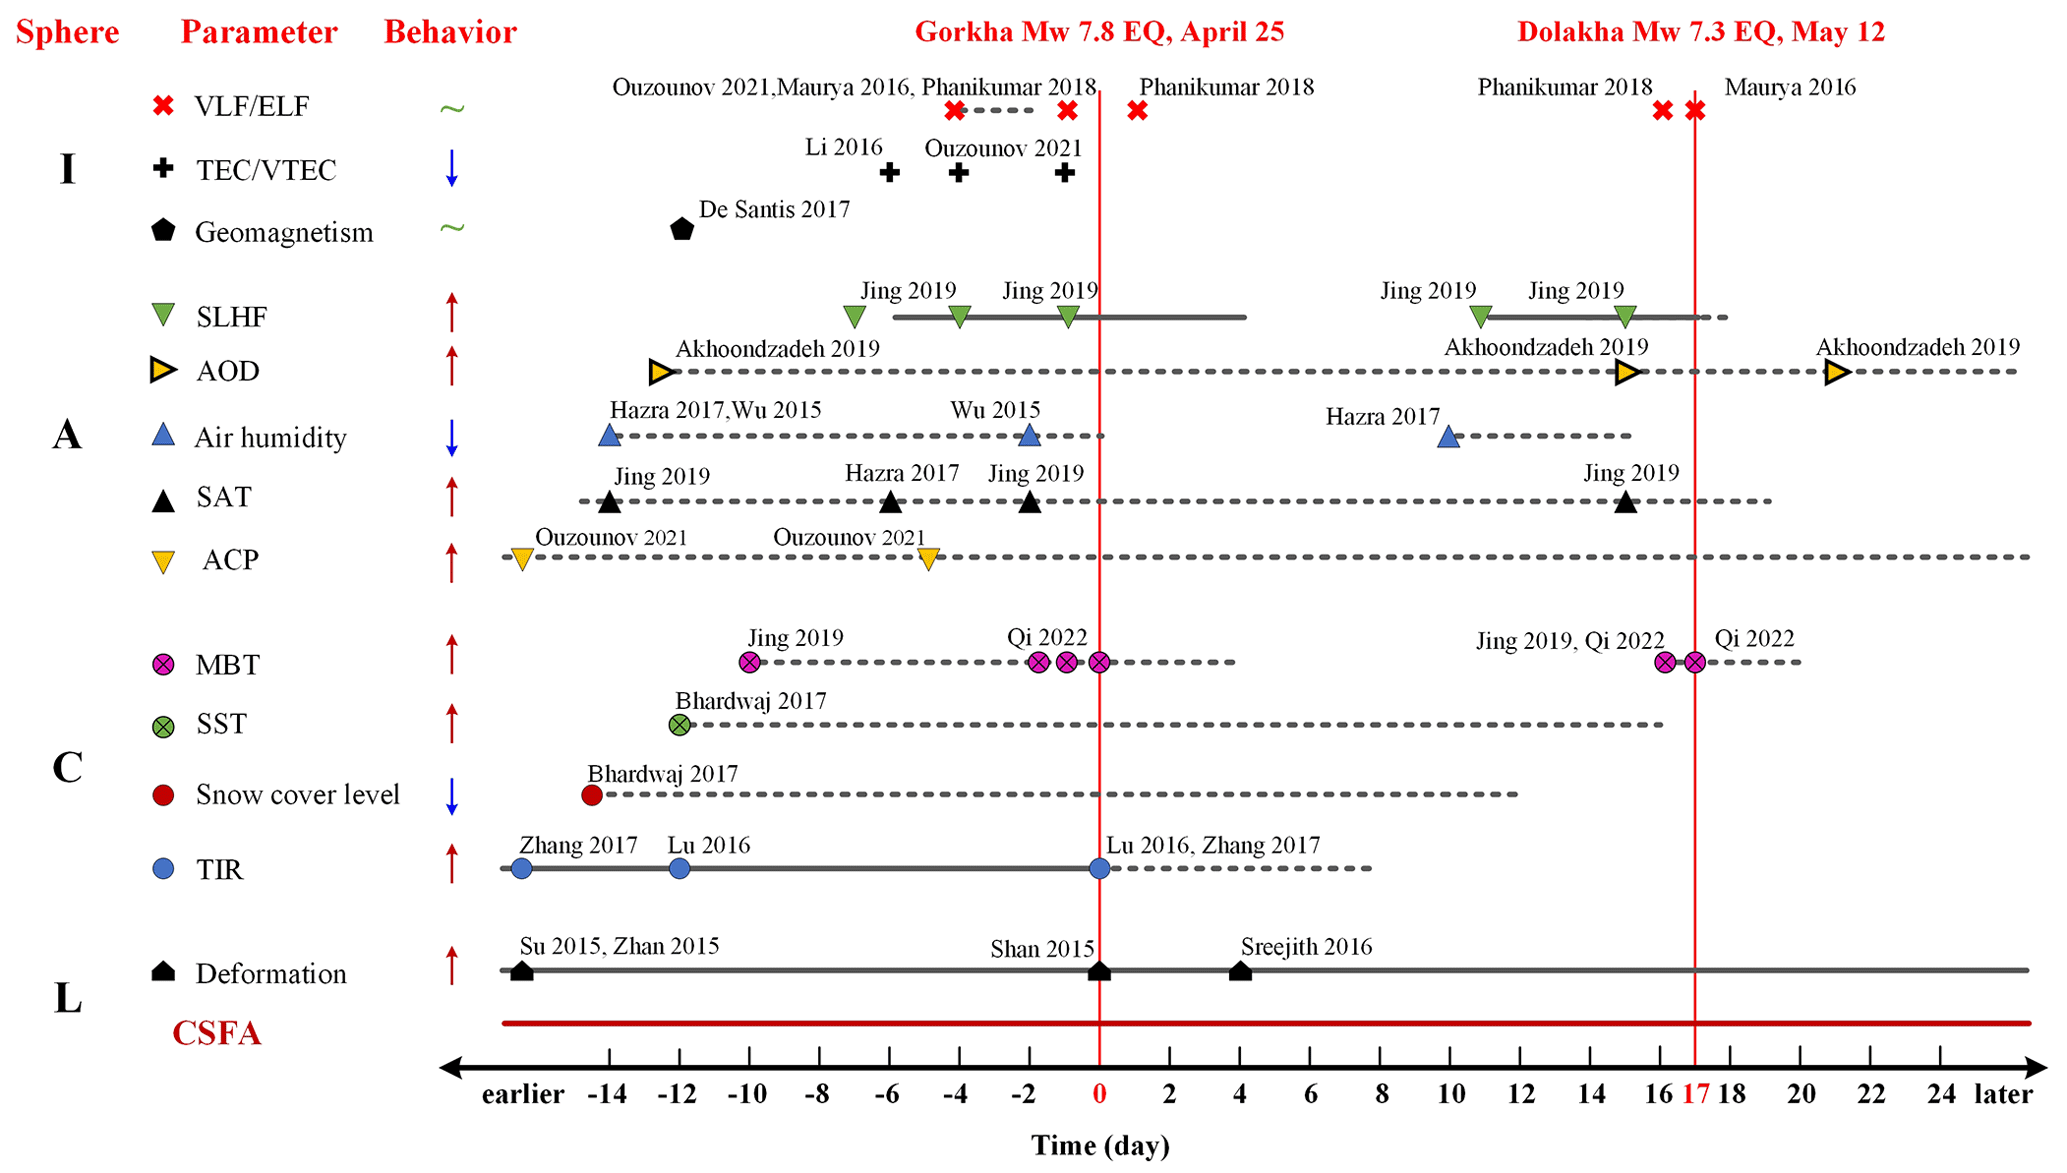
Figure 7The temporal distribution of screened seismic anomalies, which could be attributed to CSFA and stress-activated P-holes. ↑ denotes positive anomaly, while ↓ means negative anomaly, and ∼ represents fluctuating or discrete anomaly.
The reported TEC/VTEC anomalies exhibited typical conjugate distribution (Li et al., 2016; Ouzounov et al., 2021; Oikonomou et al., 2016), with the north part of the conjugated abnormal region appearing in the Nepal Himalayas (in Fig. 4d). We noticed the orbits of the satellites and the locations of GPS/GNSS stations, which were used for detecting TEC/VTEC anomalies, all passed over (He et al., 2017; Tang and Yuan, 2017) or located in the stress concentration zone (Tang and Yuan, 2017; Ulukavak et al., 2020). The abnormal geomagnetic signals detected by the Swarm mission (De Santis et al., 2017) appeared also near the west of the epicenter of Gorkha earthquake. Besides, these reported anomalies all appeared quite short before the major earthquakes. However, the additional vertical electric field and electrostatic action of accumulated charges at the ground-to-air interface would have caused the positive ions to move upward with fine particles of light mass and reduced the electron content in the bottom ionosphere, resulting in a negative TEC anomaly (Freund, 2011). Therefore, the negative TEC/VTEC anomaly (Li et al., 2016; Ouzounov et al., 2021) can be firstly retained. Like VLF/ELF anomalies, before the reported TEC/VTEC anomalies can be considered as a response of CSFA, the coupling mechanism between them and anomalies in lower altitude need to be further validated.
5.2 Atmospheric anomalies
ACP will change once the ionization process starts in the near-surface atmosphere. Therefore, it is reasonable that ACP anomalies (Ouzounov et al., 2021) appeared first among all the atmospheric anomalies before the Gorkha earthquake. The decrease of air humidity and the increase of AOD are twin seismic phenomena in the atmosphere. The occurrence of these two anomalies confirmed the increased concentration of nucleating particles in the lower layer of the atmosphere, which means that a large number of ionizations had been produced in the near-surface atmosphere and inevitably led to the rise of SAT (Jing et al., 2019; Hazra et al., 2017) and the drop of near-surface atmospheric electric field (unfortunately there is a lack of in situ observation). During the process of hydration or condensation, the phase of atmospheric molecules transitioned from a free state to a bound state, and additional latent heat was released (Jing et al., 2019). The atmospheric anomalies thus exhibited a scientifically correct temporal order as shown in Fig. 7. OLR reflects the total radiation energy (4–∞ µm) from the ground surface, atmosphere, and clouds (Ohring et al., 1983); its enhancement could not be definitely contributed by the thermal anomalies in the atmosphere. From this perspective, the anomaly of OLR before the 2015 Nepal earthquakes (Ouzounov et al., 2021; Lu et al., 2016; Sun et al., 2017; Chakraborty et al., 2018) cannot be attributed sufficiently to the coupling process in the atmosphere. The reported change of carbon and nitrogen gas (Ganguly 2016; Phanikumar et al., 2018; Jing et al., 2019) might be owing to the surface cracks caused by local CSFA but not directly correlated with any of the three response chains of CSFA, which tells that the carbon and nitrogen anomalies cannot be coupled to ionospheric anomalies. Besides, based on the temporal characteristics of atmospheric anomalies, the reported decrease of TEC 14 d before the mainshock (Li et al., 2016) should be denied because it occurred before the top atmospheric anomaly.
5.3 Coverspheric anomalies
TIR radiation was observed not only on the fracturing surface (3.6–14 µm; Wu et al., 2000, 2006a, b; Liu et al., 2004; Ma et al., 2008; Zhou et al., 2019) but also on the free end (8–12.5 µm; Freund, 2011) of the compressed rock using an infrared imager or spectra-radiometer in the laboratory, which could be attributed partly to a synergic physics (Liu et al., 2021) including the recombination of P-holes (Freund, 2007). TIR anomalies (Lu et al., 2016; Zhang et al., 2017) were the earliest to be observed by satellites (between 8–12.5 µm) before the Gorkha earthquake. The reported MBT anomalies were more concentrated than the TIR anomalies in space (Jing et al., 2019; Qi et al., 2022). In particular, positive abnormal MBT stripes not only behaved in temporal consistency with the repeated process of earthquake preparation and occurrence, but also exhibited a significant topographic consistency with the north–south elevation profile of the Himalayas (Qi et al., 2022). The recombination of P-holes might have started rightly and led to TIR anomalies as soon as it reached to ground surface, while the enhancement of MBT only appeared when and where the P-holes sufficiently accumulated as the major events approached. Hence the TIR anomaly could have occurred earlier than the MBT anomaly. Besides, the snow cover north near the Gorkha epicenter got an accelerated melting, which was attributed to the strengthened thermal gradient between the snow pack and charges layer and resulted in an increase in SST (Bhardwaj et al., 2017). The snow cover anomaly overlapped the MBT anomaly in space, which could be served as the responses of CSFA induced P-hole aggregation. All the anomalies mentioned above occurred in the high-stress concentration zone as is revealed by numerical simulation. Therefore, same as the atmospheric anomalies, they can all act as aftereffects of P-holes aggregation.
However, SSM increment at the epicenter regions (Jing, 2019) was contradicted by the positive thermal anomalies (such as the TIR and MBT anomalies). The positive LST anomaly (Shah and Jin, 2016; Baral et al., 2016) was far from the spatial aggregation zone where most anomalies clustered together, and the negative LST anomaly that appeared to the north of the epicenter (Chen et al., 2020) seemed to be related to the tensile behavior of local rock mass, rather than linked to the compressive stress. Therefore, we are unwilling to accept the reported SSM and LST anomalies as a seismic anomaly with homologous physics in CSFA. Radon emanation mainly occurred in Kolkata, India (22.6∘ N, 88.4∘ E) and Ghuttu, India (30.5∘ N, 78.8∘ E; see Fig. 4), which are 700 km away from the mainshock epicenter (Deb et al., 2016; Kumar et al., 2017) and obviously separated from the rest of the seismic anomalies. The reported radon emanation could be linked to the regional tectonic movement but not definitely to the very localized CSFA in the seismogenic zone.
5.4 Lithospheric anomalies
The pre-seismic and coseismic displacement fields observed by GPS and InSAR technology showed that the crustal deformation before the Nepal earthquakes was featured by a striped compression zone (Shan et al., 2015; Sreejith et al., 2016), which fit well with the simulated results in Fig. 6. The coincidence between the deformation and the high-stress concentration on the Earth's surface further indicates the reliability of the simulation results. According to the three response chains of CSFA, the upward migration of P-holes from the highly compressed seismogenic zone would have inevitably disturbed the amount of charged particles and the conductivity of ground soil or shallow rocks, thus changing the geoelectric field (Xi et al., 2016). However, we are not able to accept the reported geoelectric anomaly in the LCAI coupling in that the location of the geoelectric station is far away from where the seismic anomalies appeared in the coversphere and atmosphere. Although the variation of underground water anomalies, including temperature (Yang et al., 2016) and water-level (He et al., 2017; Ma and Huang 2017), might be caused by the CSFA, it might not directly interact with the compressive stress (Fig. 6) in that the observation location of underground water was almost separated from the principal compression region (Fig. 4a). Hence, the reported underground water anomalies are considered as non-homologous in this study.
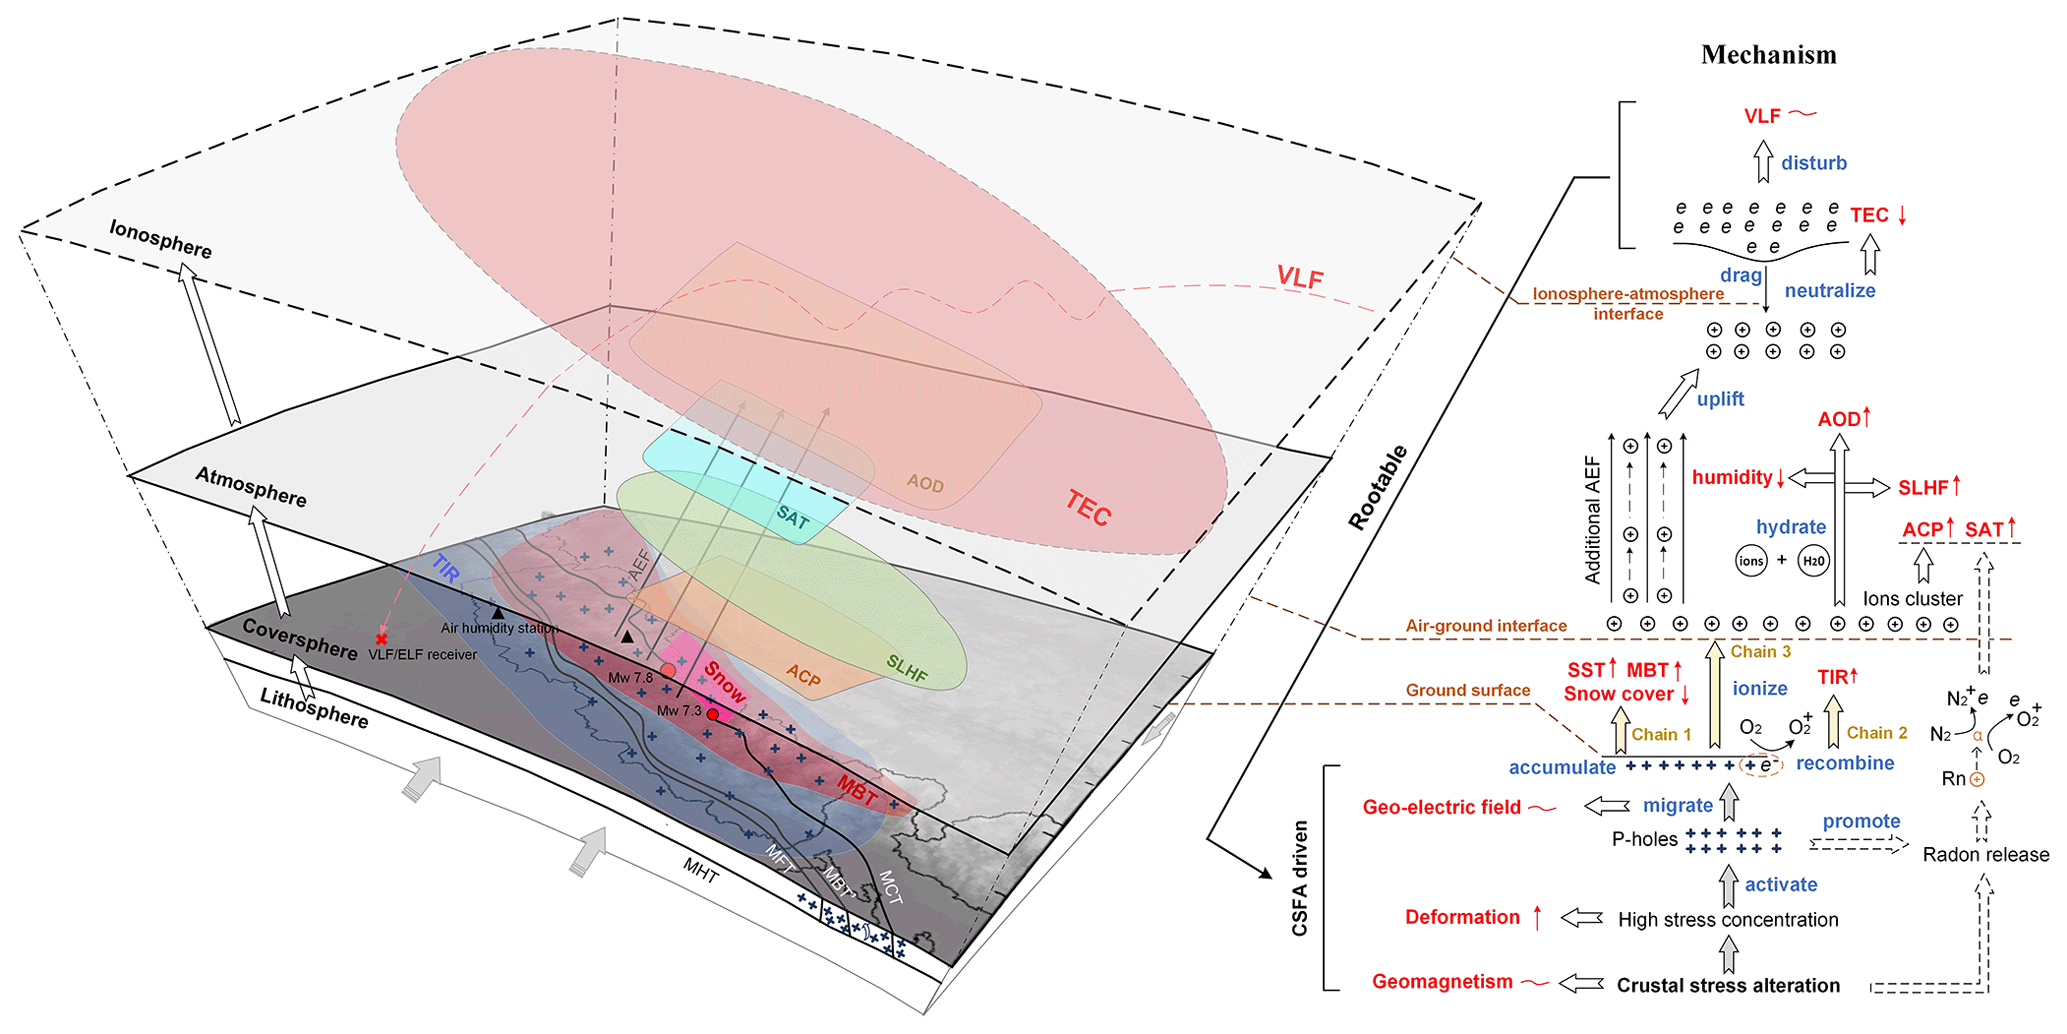
Figure 8The integrated framework of rootable seismic anomalies as well as the evolution of LCAI coupling in a 3D manifold space. Line arrows and dashed arrows mean that the coupling actions have been verified and not been proved, respectively.
5.5 Discussion on the homologous physics
Finally, the rootable seismic anomalies of multiple geospheres with homologous physics in CSFA as local crust stress accumulation are reached. The temporal process of the screened-out seismic anomalies being scientifically associated with the 2015 Nepal earthquake sequence is shown in Fig. 7. To better understand the spatiotemporal process of the LCAI coupling, the spatial evolution of the retained rootable seismic anomalies is visualized in a 3D manifold space (Fig. 8).
The 3D numerical simulation shows the detailed pattern of CSFA as well as a high degree of local stress concentration in the study area before the earthquake. The appearance of MBT anomalies indicates that the surface microwave dielectric did reduce, which confirms the existence of the first response chain of CSFA. Surface TIR anomalies indicated the existence of the second response chain, while the atmospheric and ionospheric anomalies confirmed the third response chain of CSFA, as in Fig. 8. The three stress response chains coexisted before the Nepal earthquake sequence in 2015, which shared the homologous physics in CSFA.
Freund (2002, 2011) and Freund et al. (2009) believe that P-holes are mobile and capable of flowing down stress gradients into an unstressed rock mass and finally accumulating on a distant rock surface, thus leading to sequential productions of anomalies in the atmosphere and ionosphere. Based on thorough investigation of geological and structural conditions, the 3D numerical simulation in this study uncovered the source, the path, and the destination of P-hole generation, transmission, and aggregation. Pulinets et al. (Pulinets and Boyarchuk, 2004; Pulinets, 2009) believe that the released radon gas due to CSFA will also give rise to multiple seismic anomalies. Unfortunately, there was no radon observation site found falling in the stress concentration zone given by the simulation results, and the radon-driven chain cannot be proved for the Nepal earthquakes in 2015. However, it does not mean that radon-induced seismic anomalies did not actually exist before the Nepal earthquakes sequence; it might work if available data are found in the stress concentration zone. Besides, in another of our studies, the hydrothermal anomalies before the 2009 L'Aquila earthquake in Italy showed evident quasi-synchronous features, which indicated a geosphere coupling process (Wu et al., 2016). No matter whether the seismic anomaly is caused by P-holes, or/and by the decay of radon, or by the hydrotherm, it could all be rooted to regional CSFA as well its local blocking. Since the existence of P-holes can stimulate the release of radon to a certain extent (Freund, 2010), the two theories are not isolated from each other but compatible with the CSFA-driven framework.
In this study, a large amount of literature on the seismic anomalies possibly related to the 2015 Nepal earthquake sequence was collected and reviewed carefully. A spatiotemporal diagram of the reported seismic anomalies was preliminarily constructed under the umbrella of the LCAI coupling paradigm, which exhibits an obvious temporal sequence of developing upward as the mainshock approaches and a strong spatial aggregation corresponding to the seismogenic zone.
By numerically simulating the equivalent stress accumulation over the past 500 years, inhomogeneous CSFA along the faults and around the hypocenters of the 2015 Nepal earthquake sequence are illustrated clearly. The joint analysis of crust stress simulation and tectonic environment shows that there existed a chain of CSFA–P-hole producing and flowing down stress gradients–surface P-hole accumulating before the Nepal earthquakes in 2015. The regional CSFA as well as its local blocking can be regarded as the root of seismic anomalies in the Nepal Himalayas. Three different stress response chains with homologous physics in CSFA were theoretically summarized, i.e., the decrease of microwave dielectric caused by electric field enhancement in shallow rock volume, the additional infrared radiation due to P-hole recombination on the ground surface, and the atmospheric ionization together with sequential anomalies caused by atmospheric electric field enhancement due to P-hole accumulation.
Accordingly, the preliminarily obtained spatiotemporal diagram of reported seismic anomalies was scrutinized and rooted retroactively with the homologous physics in CSFA. Finally, an integrated LCAI coupling framework with strict space–time coincidence and the homologous physics in CSFA was presented, and a synergic chain of CSFA–P-hole activation, migration and aggregation–seismic anomalies associated with the Nepal earthquakes in 2015 was proposed and verified. Furthermore, the spatiotemporal evolutions of the rootable seismic anomalies are visualized in a 3D manifold space to better understand the LCAI coupling process. This study and the results are of scientific importance for exploring earthquake precursors and for predicting earthquakes in the near future.
However, the change of near-surface vertical AEF, which is an important atmospheric parameter that could be directly respond to the P-hole aggregation on the ground surface and its subsequent electric effect, have not been reported after the 2015 Nepal earthquake sequence. The radon observation and the induced seismic anomaly in the local stress concentration area, which is very important to establish another coupling process related to CSFA, have not been reported so far for lack of effective observation sites. To further enhance the synergic method of LCAI coupling of homologous physics for scrutinizing seismic anomalies and searching earthquake precursors, some other parameters in the lithosphere being able to reflect the propagation of P-holes should be carefully investigated. Especially, the observation on vertical AEF as well as the investigation to its seismic disturbance should be fully addressed.
All data can be provided by the corresponding authors upon request.
LW, YQ, and WM designed the framework of the paper. YQ wrote the paper draft. LW and WM carried out the mechanical analysis and polished the paper. WM, YD, JL, BP, and BX completed the visualization. All authors have read and agreed to the published version of the paper.
The contact author has declared that none of the authors has any competing interests.
Publisher’s note: Copernicus Publications remains neutral with regard to jurisdictional claims in published maps and institutional affiliations.
We would like to thank the editors and reviewers for their hard work, whose rigorous scientific attitude has greatly improved the quality of this article.
This research has been supported by the Key Program of the National Natural Science Foundation of China (grant nos. 41930108 and 42101394) and the China Postdoctoral Science Foundation (grant no. 2021M693550).
This paper was edited by Filippos Vallianatos and reviewed by Angelo De Santis and one anonymous referee.
Ader, T., Avouac, J. P., Liu-Zeng, J ., Lyon-Caen, H., Bollinger, L., Galetzka, J., Genrich, J., Thomas, M., Chanard, K., Sapkota, S. N., Rajaure, S., Shrestha, P., Ding, L., and Flouzat, M.: Convergence rate across the Nepal Himalaya and interseismic coupling on the Main Himalayan Thrust: Implications for seismic hazard, J. Geophys. Res. Solid. Earth., 117, B4, https://doi.org/10.1029/2011JB009071, 2012.
Akhoondzadeh, M. and Chehrebargh, F. J.: Feasibility of anomaly occurrence in aerosols time series obtained from MODIS satellite images during hazardous earthquakes, Adv. Space. Res., 58, 890–896, https://doi.org/10.1016/j.asr.2016.05.046, 2016.
Avouac, J., Meng, L., Wei, S., Wang, T., and Ampuero, J.: Lower edge of locked Main Himalayan Thrust unzipped by the 2015 Gorkha earthquake, Nat. Geosci., 8, 708, https://doi.org/10.1038/NGEO2518, 2015.
Avouac, J. P.: Mountain building, erosion, and the seismic cycle in the Nepal Himalaya, Adv. Geophys., 46, 1–80, https://doi.org/10.1016/S0065-2687(03)46001-9, 2003.
Baral, S. S., Sharma, K., Saraf, A. K., Das, J., Singh, G., Borgohain, S., and Kar, E.: Thermal anomaly from NOAA data for the Nepal earthquake, Curr. Sci., 110, 150, 2016.
Bhardwaj, A., Singh, S., Sam, L., Bhardwaj, A., Martin-Torres, F. J., Singh, A., and Kumar, R.: MODIS-based estimates of strong snow surface temperature anomaly related to high altitude earthquakes of 2015, Remote Sens. Environ., 188, 1–8, https://doi.org/10.1016/j.rse.2016.11.005, 2017.
Bilham, R.: Earthquakes in India and the Himalaya: tectonics, geodesy and history, Ann. Geophys., 47, 839–858, https://doi.org/10.4401/ag-3338, 2004.
Bollinger, L., Avouac, J. P., Cattin, R., and Pandey, M. R.: Stress buildup in the Himalaya, J. Geophys. Res.-Sol. Ea., 109, 1–8, https://doi.org/10.1029/2003JB002911, 2004.
Burrard, S. G. and Hayden, H. H.: A Sketch of the Geography and Geology of the Himalaya Mountains and Tibet, 1st edn., Superintendent Government Printing, Calcutta, India, 1907.
Castaldo, R., De Novellis, V., Solaro, G., Pepe, S., Tizzani, P., De Luca, C., Bonano, M., Manunta, M., Casu, F., Zinno, I., and Lanari, R.: Finite element modelling of the 2015 Gorkha earthquake through the joint exploitation of DInSAR measurements and geologic-structural information, Tectonophysics, 714, 125–132, https://doi.org/10.1016/j.tecto.2016.06.037, 2017.
Chakraborty, S., Sasmal, S., Chakrabarti, S. K., and Bhattacharya, A.: Observational signatures of unusual outgoing longwave radiation (OLR) and atmospheric gravity waves (AGW) as precursory effects of May 2015 Nepal earthquakes, J. Geodyn., 113, 43–51, https://doi.org/10.1016/j.jog.2017.11.009, 2018.
Chen, S., Liu, P., Feng, T., Wang, D., Jiao, Z., Chen, L., Xu, Z., and Zhang, G.: Exploring Changes in Land Surface Temperature Possibly Associated with Earthquake: Case of the April 2015 Nepal Mw 7.9 Earthquake, ENTROPY, 22, 377, https://doi.org/10.3390/e22040377, 2020.
De Santis, A., Balasis, G., Pavon-Carrasco, F. J., Cianchini, G., and Mandea, M.: Potential earthquake precursory pattern from space: The 2015 Nepal event as seen by magnetic swarm satellites, Earth Planet. Sci. Lett., 461, 119–126, https://doi.org/10.1016/j.epsl.2016.12.037, 2017.
Deb, A., Gazi, M., and Barman, C.: Anomalous soil radon fluctuations - signal of earthquakes in Nepal and eastern India regions, J. Earth Syst. Sci., 125, 1657–1665, https://doi.org/10.1007/s12040-016-0757-z, 2016.
DeCelles, P. G., Gehrels, G. E., Quade, J., Ojha, T. P., Kapp, P. A., and Upreti, B. N.: Neogene foreland basin deposits, erosional unroofing, and the kinematic history of the Himalayan fold-thrust belt, western Nepal, Geol. Soc. Am. Bull., 110, 2–21, 1998.
DeCelles, P. G., Robinson, D. M., Quade, J., Ojha, T. P., Garzione, C. N., Copeland, P., and Upreti, B. N.: Stratigraphy, structure, and tectonic evolution of the Himalayan fold-thrust belt in western Nepal, Tectonics, 20, 487–509, https://doi.org/10.1029/2000TC001226, 2001.
Dey, S. and Singh, R. P.: Surface latent heat flux as an earthquake precursor, Nat. Hazards Earth Syst. Sci., 3, 749–755, https://doi.org/10.5194/nhess-3-749-2003, 2003.
Dhital, M. R.: Geology of the Nepal Himalaya: Regional Perspective of the Classic Collided Orogen, Springer, Berlin, Germany, https://doi.org/10.1007/978-3-319-02496-7, 2015.
Freund, F. T.: Charge generation and propagation in igneous rocks, J. Geodynamics, 33, 543–570, https://doi.org/10.1016/S0264-3707(02)00015-7, 2002.
Freund, F. T.: Pre-earthquake signals – Part I: Deviatoric stresses turn rocks into a source of electric currents, Nat. Hazards Earth Syst. Sci., 7, 535–541, https://doi.org/10.5194/nhess-7-535-2007, 2007.
Freund, F. T.: Toward a unified solid state theory for pre-earthquake signals, Acta Geophys., 58, 719–766, https://doi.org/10.2478/s11600-009-0066-x, 2010,
Freund, F. T.: Pre-earthquake signals: Underlying physical processes, J. Asian Earth Sci., 41. 383–400, https://doi.org/10.1016/j.jseaes.2010.03.009, 2011.
Freund, F. T., Takeuchi, A., and Lau, B.: Electric currents streaming out of stressed igneous rocks – a step towards understanding pre-earthquake low frequency EM emissions, Phys., Chem., Earth, 31, 389–396, https://doi.org/10.1016/j.pce.2006.02.027, 2006.
Freund, F. T., Kulahci, I. G., Cyr, G., Ling, J., Winnick, M., Tregloan-Reed., J. and Freund., M. M.: Air ionization at rock surfaces and pre-earthquake signals, J. Atmos. Solar-Terrestrial Phys., 71, 1824–1834, https://doi.org/10.1016/j.jastp.2009.07.013, 2009.
Gan, W. J., Zhang, P. Z., Shen, Z. K., Niu, Z. J., Wang, M., Wan, Y. G., Zhou, D. M., and Cheng, J.: Present-day crustal motion within the Tibetan Plateau inferred from GPS measurements, J. Geophys. Res.-Sol. Ea., 112, B8, https://doi.org/10.1029/2005JB004120, 2007.
Ganguly, N. D.: Atmospheric changes observed during April 2015 Nepal earthquake, J. Atmos. Sol.–Terr. Phy., 140, 16–22, https://doi.org/10.1016/j.jastp.2016.01.017, 2016.
Genzano, N., Aliano, C., Corrado, R., Filizzola, C., Lisi, M., Mazzeo, G., Paciello, R., Pergola, N., and Tramutoli, V.: RST analysis of MSG-SEVIRI TIR radiances at the time of the Abruzzo 6 April 2009 earthquake, Nat. Hazards Earth Syst. Sci., 9, 2073–2084, https://doi.org/10.5194/nhess-9-2073-2009, 2009.
Gokhberg, M. B., Buloshnikov, A. M., Gufeld, I. L. and Liperovsky, V. A.: Resonance phenomena at seismo-ionospheric interaction, Izv. AN SSSR, Fizika Zemli, 6, 5–8, 1985.
Guo, Z., Gao, X., Yao, H., Li, J., and Wang, W. M.: Midcrustal low-velocity layer beneath the central Himalaya and southern Tibet revealed by ambient noise array tomography, Geoche. Geophy. Geosys., 10, 5, https://doi.org/10.1029/2009GC002458, 2009.
Hasegawa, A., Yoshida, K., Asano, Y., Okada, T., Iinuma, T., and Ito, Y.: Change in stress field after the 2011 great Tohoku-Oki earthquake, Earth Planet. Sci. Lett., 355, 231–243, https://doi.org/10.1016/j.epsl.2012.08.042, 2012.
Hayakawa, M., Izutsu, J., Schekotov, A., Yang, S., Solovieva, M., and Budilova, E.: Lithosphere–Atmosphere–Ionosphere Coupling Effects Based on Multiparameter Precursor Observations for February–March 2021 Earthquakes (M∼7) in the Offshore of Tohoku Area of Japan, Geosciences, 11, 481, https://doi.org/10.3390/geosciences11110481, 2021.
Hazra, P., De, S. S., Paul, S., Guha, G., and Ghosh, A.: Thermal Anomalies Around the Time of Nepal Earthquakes M 7.8 April 25, 2015 And M 7.3 May 12, 2015, Int. J. Geotech. Eng., 8, 58–73, https://doi.org/10.4018/IJGEE.2017010104, 2017.
He, A., Fan, X., Zhao, G., Liu, Y., Singh, R., P., and Hu, Y.: Co–seismic response of water level in the Jingle well (China) associated with the Gorkha Nepal (Mw 7.8) earthquake, Tectonophysics, 714, 82–89, https://doi.org/10.1016/j.tecto.2016.08.019, 2017.
He, L. M. and Heki, K.: Ionospheric anomalies immediately before Mw 7.0–8.0 earthquakes, J. Geophys. Res.-Space Phys., 122, 8659–8678, https://doi.org/10.1002/2017JA024012, 2017.
He, M., Wu, L., Cui, J., Wang, W., Qi, Y., Mao, W., Miao, Z., Chen, B., and Sheng, X.: Remote sensing anomalies of multiple geospheres before the Wenchuan earthquake and its spatiotemporal correlations, Nat. Remote Sens. Bull., 24, 681–700, https://doi.org/10.11834/jrs.202020059, 2020.
Huang, H., Meng, L., Plasencia, M., Wang, Y., Wang, L., and Xu, M.: Matched-filter detection of the missing pre-mainshock events and aftershocks in the 2015 Gorkha, Nepal earthquake sequence, Tectonophysics, 714, 71–81, 10.1016/j.tecto.2016.08.018, 2017.
Jaeger, J. C., Cook, N. G. W., and Zimmerman, R.: Fundamentals of rock mechanics, 4th edn., John Wiley & Sons, ISBN: 978-0-632-05759-7, 2009.
Jing, F. and Singh, R. P.: Response of surface and atmospheric parameters associated with the Iran M 7.3 earthquake, IEEE J. Sel. Topics Appl. Earth Observ. Remote Sens., 15, 5841–5852, https://doi.org/10.1109/JSTARS.2022.3188003, 2022.
Jing, F., Shen, X. H., Hong, S. Y., and Ouyang, X. Y.: The application of remote sensing technology to earthquake science research, Remote Sens. Land Res., 28, 5–8, https://doi.org/10.6046/gtzyyg.2008.02.02, 2008.
Jing, F., Singh, R. P., and Shen, X.: Land–atmosphere–meteorological coupling associated with the 2015 Gorkha (M 7.8) and Dolakha (M 7.3) Nepal earthquakes, Geomat. Nat. Haz. Risk, 10, 1267–1284, https://doi.org/10.1080/19475705.2019.1573629, 2019.
Kreemer, C., Blewitt, G., and Klein, E. C.: A geodetic plate motion and Global Strain Rate Model, Geochem. Geophy. Geosy., 15, 3849–3889, https://doi.org/10.1002/2014GC005407, 2014.
Kumar, N., Chauhan, V., Dhamodharan, S., Rawat, G., Hazarika, D., and Gautam, P. K. R.: Prominent precursory signatures observed in soil and water radon data at multi-parametric geophysical observatory, Ghuttu for M-w 7.8 Nepal earthquake, Curr. Sci., 112, 907–909, 2017.
Kumar, S., Wesnousky, S. G., Rockwell, T. K., Briggs, R. W., Thakur, V. C., and Jayangondaperumal, R.: Paleoseismic evidence of great surface rupture earthquakes along the Indian Himalaya, J. Geophy. Res.-Sol. Ea., 111, B03304, https://doi.org/10.1029/2004JB003309, 2006.
Kuo, C. L., Huba, J. D., Joyce. G., and Lee, L. C.: Ionosphere plasma bubbles and density variations induced by pre-earthquake rock currents and associated surface charges, J. Geophys. Res.-Space Phys., 116, A10317, https://doi.org/10.1029/2011JA016628, 2011.
Lavé, J. and Avouac, J. P.: Fluvial incision and tectonic uplift across the Himalayas of central Nepal, J. Geophys. Res.-Sol. Ea., 106, 26561–26591, https://doi.org/10.1029/2001JB000359, 2001.
Li, W., Guo, J. Y., Yue, J. P., Yang, Y., Li, Z., and Lu, D. K.: Contrastive research of ionospheric precursor anomalies between Calbuco volcanic eruption on April 23 and Nepal earthquake on April 25, 2015, Adv. Space. Res., 57, 2141–2153, https://doi.org/10.1016/j.asr.2016.02.014, 2016.
Liao, C. T., Zhang, C. S., Wu, M. L., Ma, Y. S., and Ou, M. Y.: Stress change near the Kunlun fault before and after the Ms 8.1 Kunlun earthquake, Geophy. Res. Lett., 30, 2027, https://doi.org/10.1029/2003GL018106, 2003.
Liperovskaya, E. V., Pokhotelov, O. A., Oleynik, M. A., Alimov, O. A., Pavlova, S. S., and Kharimenko, M.: Some effects in the sporadic E-layer of the ionosphere before earthquakes, Fizika Zemli, 11, 86–88, 1994.
Liperovsky, V. A., Pokhotelov, O. A., and Shalimov, S. L.: Ionosfernye predvestniki zemletryasenii (Ionospheric Precursors of Earthquakes), Moscow, Nauka, 1992 (in Russian).
Liperovsky, V. A., Pokhotelov, O. A., Meister, C. V., and Liperovskaya, E. V.: Physical models of coupling in the lithosphere-atmosphere-ionosphere system before earthquakes, Geomagn. Aeronomy, 48, 795–806, https://doi.org/10.1134/S0016793208060133, 2008.
Liu, P. X., Liu, L. Q., Chen, S. Y., Chen, G. Q., and M, J.: An experiment on the infrared radiation of surficial rocks during deformation, Seismol Geol., 03, 502–511, https://doi.org/10.1007/BF02873097, 2004.
Liu, X. X., Wu, L. X., Zhang, Y. B., and Mao, W. F.: Localized Enhancement of Infrared Radiation Temperature of Rock Compressively Sheared to Fracturing Sliding: Features and Significance, Front. Earth Sci., 9, 767, https://doi.org/10.3389/feart.2021.756369, 2021.
Lu, X., Meng, Q. Y., Gu, X. F., Zhang, X. D., Xie, T., and Geng, F.: Thermal infrared anomalies associated with multi–year earthquakes in the Tibet region based on China's FY–2E satellite data, Adv. Space Res., 58, 989–1001, 2016.
Luo, G. and Liu, M.: Stress evolution and fault interactions before and after the 2008 Great Wenchuan earthquake, Tectonophysics, 491, 127–140, https://doi.org/10.1016/j.tecto.2009.12.019, 2010.
Ma, J., Ma, S. P., Liu, P. X., and Liu, L. Q.: Thermal field indicators for identifying active fault and its instability from laboratory experiments, Seismol. Geol., 30, 363–382, https://doi.org/10.3969/j.issn.0253-4967.2008.02.004, 2008 (in Chinese).
Ma, Y. and Huang, F.: Coseismic water level changes induced by two distant earthquakes in multiple wells of the Chinese mainland, Tectonophysics, 694, 57–68, https://doi.org/10.1016/j.tecto.2016.11.040, 2017.
Mao, W. F., Wu, L. X., Liu, S. J., Gao, X., Huang, J. W., Xu, Z. Y., and Qi, Y.: Additional microwave radiation from experimentally loaded granite covered with sand layers: Features and mechanisms, IEEE Trans. Geosci. Remote Sens., 58, 5008–5022, https://doi.org/10.1109/TGRS.2020.2971465, 2020.
Mao, W. F., Wu, L. X., Xu, Y. Y., Lu, J. C., and Qi, Y.: Change in Diorite Microwave Dielectric Property at the Free End Upon Compressive Stress Application to the Other End, IEEE. Trans. Geosci. Remote Sens., 60, 1–13, https://doi.org/10.1109/TGRS.2021.3125992, 2021.
Marchetti, D., De Santis, A., Shen, X. H., Campuzano, S. A., Perrone, L., Piscini, A., Di Giovambattista, R., Jin, S. G., Ippolito, A., Cianchini, G., Cesaroni, C., Sabbagh, D., Spogli, L., Zeren, Z. M., and Huang, J. P.: Possible Lithosphere-Atmosphere-Ionosphere Coupling effects prior to the 2018 Mw=7.5 Indonesia earthquake from seismic, atmospheric and ionospheric data., J. Asian Earth Sci., 188, 104097, https://doi.org/10.1016/j.jseaes.2019.104097, 2020.
Maurya, A. K., Venkatesham, K., Tiwari, P., Vijaykumar, K., Singh, R., Singh, A. K., and Ramesh, D. S.: The 25 Apr. 2015 Nepal earthquake: Investigation of precursor in VLF subionospheric signal, J. Geophys. Res.-Space Phys., 121, 10403–10416, https://doi.org/10.1002/2016JA022721, 2016.
Mencin, D., Bendick, R., Upreti, B. N., Adhikari, D. P., Gajurel, A. P., Bhattarai, R. R., Shrestha, H. R., Bhattarai, T. N., Manandhar, N., Galetzka, J., Knappe, E., Pratt-Sitaula, B., Aoudia, A., and Bilham, R.: Himalayan strain reservoir inferred from limited afterslip following the Gorkha earthquake, Nat. Geosci., 9, 533–537, https://doi.org/10.1038/NGEO2734, 2016.
Ohring, G. and Gruber, A.: Satellite Radiation Observations and Climate Theory, Adv. Geophys., 25, 237–304, https://doi.org/10.1016/S0065-2687(08)60175-2, 1983.
Oikonomou, C., Haralambous, H., and Muslim, B.: Investigation of ionospheric TEC precursors related to the M7.8 Nepal and M8.3 Chile earthquakes in 2015 based on spectral and statistical analysis, Nat. Hazards, 83, 97–116, https://doi.org/10.1007/s11069-016-2409-7, 2016.
Ouzounov, D., Pulinets, S., Davidenko, D., Rozhnoi, A., Solovieva, M., Fedun, V., Dwivedi, B. N., Rybin, A., Kafatos, M., and Taylor, P.: Transient Effects in Atmosphere and Ionosphere Preceding the 2015 M7.8 and M7.3 Gorkha-Nepal Earthquakes, Front. Earth Sci., 9, 757358, https://doi.org/10.3389/feart.2021.757358, 2021.
Pandey, P. and Rawat, R. S.: Some new observations on the Amritpur Granite Series, Kumaun Lesser Himalaya, India, Curr. Sci., 77, 296–299, 1999.
Phanikumar, D. V., Maurya, A. K., Kumar, K. N., Venkatesham, K., Singh, R., Sharma, S., and Naja, M.: Anomalous variations of VLF sub-ionospheric signal and Mesospheric Ozone prior to 2015 Gorkha Nepal Earthquake, Sci. Rep., 8, 1–9, https://doi.org/10.1038/s41598-018-27659-9, 2018.
Pulinets, S. A.: Lithosphere-atmosphere-ionosphere coupling (LAIC) model: Electromagnetic Phenomena Associated with Earthquakes, Transworld Research Network, Trivandrum, India, ISBN: 978-81-7895-297-0, 2009.
Pulinets, S. A. and Boyarchuk K. A.: Ionospheric Precursors of Earthquakes, 1st edn., Springer, Berlin, Germany, ISBN: 3-540-20839-9, 2004.
Pulinets, S. A. and Ouzounov D.: Lithosphere–atmosphere–ionosphere coupling (LAIC) model – An unified concept for earthquake precursors validation, J. Asian Earth Sci., 41, 371–382, https://doi.org/10.1016/j.jseaes.2010.03.005, 2011.
Pulinets, S. A., Legen'ka, A. D. and Alekseev, V. A.: Pre-earthquakes effects and their possible mechanisms, in: Dusty and Dirty Plasmas, Noise and Chaos in Space and in the Laboratory, edited by: Kikuchi, H., Plenum Publishing, New York, USA, 545–557, https://doi.org/10.1007/978-1-4615-1829-7, 1994.
Pulinets, S. A., Boyarchuk, K. A., Hegai, V. V., Kim, V. P., and Lomonosov, A. M.: Quasielectrostatic model of atmosphere-thermosphere-ionosphere coupling, Adv. Space Res., 26, 1209–1218, https://doi.org/10.1016/S0273-1177(99)01223-5, 2000.
Qi, Y., Wu, L., He, M., and Mao, W.: Spatio–temporally weighted twostep method for retrieving seismic MBT anomaly: May 2008 Wenchuan earthquake sequence being a case, IEEE J. Sel. Topics Appl. Earth Observ. Remote Sens., 13, 382–391, https://doi.org/10.1109/JSTARS.2019.2962719, 2020.
Qi, Y., Wu, L., Ding, Y., and Mao, W.: Microwave brightness temperature anomalies associated with the 2015 Mw 7.8 Gorkha and Mw 7.3 Dolakha earthquakes in Nepal, IEEE Trans. Geosci. Remote Sens., 60, 1–11, https://doi.org/10.1109/TGRS.2020.3036079, 2022.
Qin, K., Wu, L. X., De Santis, A., Meng, J., Ma, W. Y., and Cianchini, G.: Quasi-synchronous multi-parameter anomalies associated with the 2010–2011 New Zealand earthquake sequence, Nat. Hazards Earth Syst. Sci., 12, 1059–1072, https://doi.org/10.5194/nhess-12-1059-2012, 2012.
Qin, K., Wu, L., Zheng, S., and Liu, S.: A deviation-time-space thermal (DTS-T) method for global Earth observation system of systems (GEOSS)-based earthquake anomaly recognition: Criterions and quantify indices, Remote Sens., 5, 5143–5151, https://doi.org/10.3390/rs5105143, 2013.
Qin, K., Zheng, S., Wu, L., and Wang, Y.: Quasi-synchronous multi-parameter anomalies before Wenchuan and Yushu earthquakes in China, The European Phys. J. Spec. Top., 230, 263–274, https://doi.org/10.1140/epjst/e2020-000253-3, 2021.
Rycroft, M. J., Harrison, R. J., Nicoll, K. A., and Mareev, E. A.: An overview of Earth's global electric circuit and atmospheric conductivity, Space Sci. Rev., 137, 83–105, https://doi.org/10.1007/s11214-008-9368-6, 2008.
Sapkota, S. N., Bollinger, L., Klinger, Y., Tapponnier, P., Gaudemer, D. Y., and Tiwari, D.: Primary surface ruptures of the great Himalayan earthquakes in 1934 and 1255, Nat. Geosci.,6, 71–76, https://doi.org/10.1038/NGEO1669, 2013.
Shah, M. and Jin, S. G.: Pre-seismic Thermal Anomalies of the 2015 Mw=7.8 Gorkha (Nepal) Earthquake from MODIS Surface Temperature, in: 2016 Progress in Electromagnetic Research Symposium, IEEE, Shanghai, China, August 2016, 4755–4758, https://doi.org/10.1109/PIERS.2016.7735743, 2016.
Shalimov, S. L. and Gokhberg, M. B.: Lithosphere–ionosphere coupling mechanism and its application to the earthquake in Iran on June 20, 1990. A review of ionospheric measurements and basic assumptions, Phys. Earth Planet. Inter., 105, 211–218, https://doi.org/10.1016/S0031-9201(97)00092-7, 1998.
Shan, X., Zhang, G., Wang, C., Li, Y., Qu, C., Song, X., Yu, L., and Liu, Y.: Joint inversion for the spatial fault slip distribution of the 2015 Nepal MW 7.9 earthquake based on InSAR and GPS observations, Chinese J. Geophys., 58, 4266–4276, 2015.
Shen, X. H., Wu, Y., and Shan, X. J.: Remote sensing application in earthquake science and general proposal for earthquake satellite project in China, Recent Dev. World Seismol., 8, 38–45, https://doi.org/10.3969/j.issn.0253-4975.2007.08.011, 2007.
Shen, X. H.: Preface to the special issue on satellite application to earthquake science, Acta Seismol. Sin., 38, 329–332, 2016.
Sorokin, V. M.: Modification of the ionosphere by seismic related electric field. Atmospheric and ionospheric electromagnetic phenomena associated with earthquakes, 805–818, 1998.
Sreejith, K. M., Sunil, P. S., Agrawal, R., Saji, A. P., and Rajawat, A. S.: Coseismic and early postseismic deformation due to the 25 April 2015, Mw 7.8 Gorkha, Nepal, earthquake from InSAR and GPS measurements, Geophys. Res. Lett., 43, 3160–3168, https://doi.org/10.1002/2016GL067907, 2016.
St-Laurent, F., Derr, J. S., and Freund, F. T.: Earthquake lights and the stress-activation of positive hole charge carriers in rocks, Phys. Chem. Earth, 31, 305–312, https://doi.org/10.1016/j.pce.2006.02.003, 2006.
Su, X., Wang, Z., Meng, G., Xu, W., and Ren, J.: Pre-seismic strain accumulation and co-seismic deformation of the 2015 Nepal MS 8.1 earthquake observed by GPS, Chin. Sci. Bull., 60, 2115–2123, https://doi.org/10.1360/N972015-00534, 2015.
Sun, K., Shan, X., Ouzounov, D, Shen, X., and Jing, F.: Analysing long wave radiation data associated with the 2015 Nepal earthquakes based on Multi-orbit satellite observations, Chinese J. Geophys., 60, 3457–3465, https://doi.org/10.6038/cjg20170915, 2017.
Tang, J. and Yuan, Y. B.: Multi-dimensional distribution of near-field ionospheric disturbances produced by the 2015 Mw 7.8 Nepal earthquake, J. Asian. Earth., 147, 28–36, https://doi.org/10.1016/j.jseaes.2017.07.039, 2017.
Tater, J. M., Shrestha, S. B., Shrestha, J. N., and Sharma, S. R.: Geological map ofWestern Central Nepal. Scale: 1:250,000, Dept. Mines Geol., Kathmandu, Nepal, Tech. Rep., ISBN: 978-3-319-02496-7, 1983.
Teng, J. W.: The exchange of substance and energy, different sphere coupling and deep dynamical process within the earth, Earth Sci. Front., 8, 1–8, https://doi.org/10.3321/j.issn:1005-2321.2001.03.001, 2001.
Tian, Z., Freymueller, J. T., and Yang, Z.: Spatio-temporal variations of afterslip and viscoelastic relaxation following the M-w 7.8 Gorkha (Nepal) earthquake, Earth Planet. Sci. Lett., 531, 116031, https://doi.org/10.1016/j.epsl.2019.116031, 2020.
Tronin, A. A.: Thermal IR satellite sensor data application for earthquake research in China, Int. J. Remote Sens., 21, 3169–3177, https://doi.org/10.1080/01431160050145054, 2000.
Ulukavak, M. and Inyurt, S.: Seismo-ionospheric precursors of strong sequential earthquakes in Nepal region, Acta. Astronaut., 166, 123–130, https://doi.org/10.1016/j.actaastro.2019.09.033, 2020.
Wang, K. and Fialko, Y.: Observations and Modeling of Coseismic and Postseismic Deformation Due To the 2015 M-w 7.8 Gorkha (Nepal) Earthquake, J. Geophys. Res.-Sol. Ea., 123, 761–779, https://doi.org/10.1002/2017JB014620, 2018.
Wu, H., Tikhonov, I., and Cesped, A.: Multi-parametric analysis of earthquake precursors, Russ. J. Earth. Sci., 15, 1–6, https://doi.org/10.2205/2015ES000553, 2015.
Wu, L. X., Cui, C. Y., Geng, N. G., and Wang, J. H.: Remote sensing rock mechanics (RSRM) and associated experimental studies, Inter. J. Rock Mech. Mining Sci., 37, 879–888, https://doi.org/10.1016/S1365-1609(99)00066-0, 2000.
Wu, L. X., Liu, S. J., Wu, Y. H., and Wang, C. Y.: Precursors for rock fracturing and failure – Part I: IRR image abnormalities, Int. J. Rock Mech. Mining Sci., 43, 473–482, https://doi.org/10.1016/j.ijrmms.2005.09.002, 2006a.
Wu, L. X., Liu, S. J., Wu, Y. H., and Wang, C. Y.: Precursors for rock fracturing and failure – Part II: IRR T-curve abnormalities, Int. J. Rock Mech. Mining Sci., 43, 483–493, https://doi.org/10.1016/j.ijrmms.2005.09.001, 2006b.
Wu, L. X., Qin, K., and Liu, S. J.: GEOSS-based thermal parameters analysis for earthquake anomaly recognition, Proc. IEEE, 100, 2891–2907, https://doi.org/10.1109/JPROC.2012.2184789, 2012a.
Wu, L., Qin, K., Liu, S., De Santis, A., and Cianchini, G.: Importance of lithosphere-coversphere-atmosphere coupling to earthquake anomaly recognition, in: IEEE International Geoscience and Remote Sensing Symposium, Munich, Germany, July 2012, https://doi.org/10.1109/IGARSS.2012.6350657, 2012b.
Wu, L. X., Zheng, S., De Santis, A., Qin, K., Di Mauro, R., Liu, S. J., and Rainone, M. L.: Geosphere coupling and hydrothermal anomalies before the 2009 Mw 6.3 L'Aquila earthquake in Italy, Nat. Hazards Earth Syst. Sci., 16, 1859–1880, https://doi.org/10.5194/nhess-16-1859-2016, 2016.
Xi, J. L., Guan, H. P., Liu, C., Zhuang, N., Guan, X. Y., Yang, X. M., Zhang, Z. G., Ci, Z. G., Drolma, K., and Ma, A. M.: Analysis and study on the change of the observed geoelectric field data at Lhasa geomagnetic station before and after the Nepal MS8. 1 earthquake, Earthq. Res. China, 36, 1–13, 2016.
Xiong, P., Tong, L., Zhang, K., Shen, X., Battiston, R., Ouzounov, D., Iuppa, R., Crookes, D., Long, C., and Zhou, H.: Towards advancing the earthquake forecasting by machine learning of satellite data, Sci. Total Environ., 771, 145256, https://doi.org/10.1016/j.scitotenv.2021.145256, 2021.
Yang, X., Sun, L., Sun, C., and Li, L.: Relation between the water temperature anomaly of Yushu well and Nepal Ms8.1 earthquake, Plateau Earthq. Res., 28, 12–15, 2016.
Yukutake, Y., Iio, Y., and Horiuchi, S.: Detailed spatial changes in the stress field of the 1984 western Nagano earthquake region, J. Geophys. Res.-Sol. Ea., 115, B06305, https://doi.org/10.1029/2008JB006111, 2010.
Zhan, W., Wu, Y., Liang, H., Zhu, S., Zhang, F., and Liu, J.: Characteristics of the seismogenic model for the 2015 Nepal M_w 7.8 earthquake derived from GPS data, Chinese J. Geophys., 58, 1818–1826, 2015.
Zhang, X., Zhang, Y., Guo, X., Wei, C., and Zhang, L.: Analysis of thermal infrared anomaly in the Nepal Ms 8.1 earthquake, Earth Sci. Frontiers, 24, 227–233, 2017.
Zhao, B., Buergmann, R., Wang, D., Tan, K., Du, R., and Zhang, R.: Dominant Controls of Downdip Afterslip and Viscous Relaxation on the Postseismic Displacements Following the M(w) 7.9 Gorkha, Nepal, Earthquake, J. Geophys. Res.-Sol. Ea., 122, 8376–8401, https://doi.org/10.1002/2017JB014366, 2017.
Zheng, G., Wang, H., Wright, T. J., Lou, Y. D., Zhang, R., Zhang, W. X., Shi, C., Huang, J. F., and Wei, N.: Crustal deformation in the India-Eurasia collision zone from 25 years of GPS measurements, J. Geophys. Res.-Sol. Ea., 122, 9290–9312, https://doi.org/10.1002/2017JB014465, 2017.
Zheng, S., Wu, L. X., and Qin, K.: Multiple parameters anomalies for verifying the geosystem spheres coupling effect: a case study of the 2010 Ms 7.1 Yushu earthquake in China, Ann. Geophy., 57, S0434, https://doi.org/10.4401/ag-6508, 2014.
Zhou, Z. L., Chang, Y., and Cai, X.: Experimental study of infrared radiation effects of rock with different loading rates, J. Cent. South Univ., 50, 1127–1134, 2019.
- Abstract
- Introduction
- Case and methodology
- Spatiotemporal features of reported seismic anomalies
- CSFA in the Nepal Himalayas
- CSFA-based rooting and LCAI coupling analysis
- Conclusions
- Data availability
- Author contributions
- Competing interests
- Disclaimer
- Acknowledgements
- Financial support
- Review statement
- References